the effect of porosity and saturation on electrical
TRANSCRIPT
i
The Effect of Porosity and Saturation on Electrical Resistivity and Strength of Soil
for Clay Size Particle
by
Nur Hernah Syahila Binti Mahamad Rizal
Dissertation submitted in partial fulfillment of
The requirement for the
Bachelor of Engineering (Hons)
(Civil Engineering)
SEPTEMBER 2013
Universiti Teknologi PETRONAS
Bandar Seri Iskandar
31750 Tronoh
Perak Darul Ridzuan
ii
CERTIFICATION OF APPROVAL
The Effect of Porosity and Saturation on Electrical Resistivity and Strength of
Soil for Clay Size Particle
by
Nur Hernah Syahila Binti Mahamad Rizal
A project dissertation submitted to the
Civil Engineering Programme
Universiti Teknologi PETRONAS
in partial fulfillment of the requirement for the
BACHELOR OF ENGINEERING (Hons)
(CIVIL ENGINEERING)
Approved by,
_________________
(Dr. Syed Baharom Azahar B. Syed Osman)
UNIVERSITI TEKNOLOGI PETRONAS
TRONOH, PERAK
September 2013
iii
CERTIFICATION OF ORIGINALITY
This is to certify that I am responsible for the work submitted in this project, that the
original work is my own except as specified in the references and
acknowledgements, and that the original work contained herein have not been
undertaken or done by unspecified sources or persons.
___________________________________
NUR HERNAH SYAHILA BINTI M.RIZAL
iv
ACKNOWLEDGMENT
First and foremost, I would like express my sincere gratitude to my project
supervisor Dr Syed Baharom Azahar bin Syed Osman for the accomplishment of this
work. It was always motivating for me to work under his sincere guidance. The
completion of this work would not have been possible without his constant
inspiration and feedback. He has provided me precious time for series of discussion,
valuable guideline, comment and idea as well as his kind assistant.
I wish to acknowledge Mr. Redzuan, the laboratory technologist of
Geotechnical Laboratory for his kindness assistance and willingness to help me in
gaining the information about my project and executing the laboratory experiments.
Not to forget to Kaolin (Malaysia) Sdn. Bhd. company that supplied me the soil
samples with useful information provided and also spend their time for me to do the
interview.
Special thanks goes to all lecturers of Civil Engineering Department that
impart their wisdom and knowledge and the supporting staffs and all of my friends
for their cooperation and assistance throughout my degree’s study in UTP and
accomplishment of this final year project. Last but not least, thanks to all individual
that impair apart either directly or indirectly of which contributed in the completing
of this project and finishing the task given to me.
v
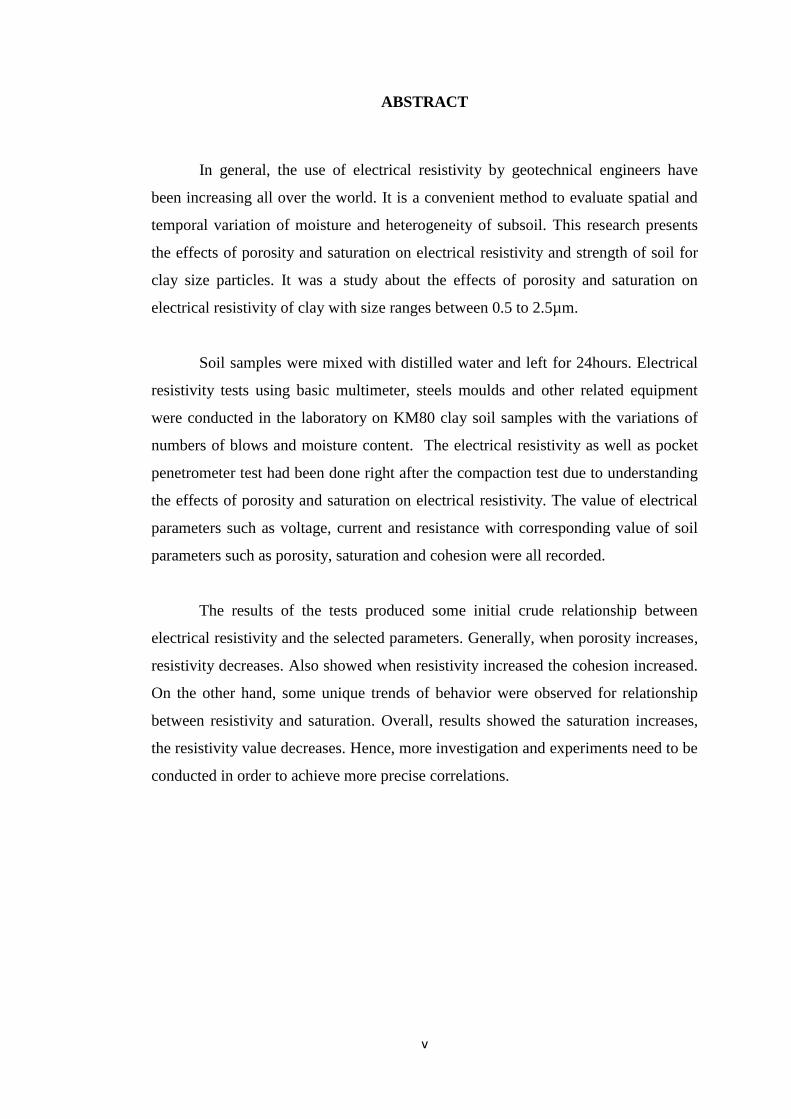
ABSTRACT
In general, the use of electrical resistivity by geotechnical engineers have
been increasing all over the world. It is a convenient method to evaluate spatial and
temporal variation of moisture and heterogeneity of subsoil. This research presents
the effects of porosity and saturation on electrical resistivity and strength of soil for
clay size particles. It was a study about the effects of porosity and saturation on
electrical resistivity of clay with size ranges between 0.5 to 2.5µm.
Soil samples were mixed with distilled water and left for 24hours. Electrical
resistivity tests using basic multimeter, steels moulds and other related equipment
were conducted in the laboratory on KM80 clay soil samples with the variations of
numbers of blows and moisture content. The electrical resistivity as well as pocket
penetrometer test had been done right after the compaction test due to understanding
the effects of porosity and saturation on electrical resistivity. The value of electrical
parameters such as voltage, current and resistance with corresponding value of soil
parameters such as porosity, saturation and cohesion were all recorded.
The results of the tests produced some initial crude relationship between
electrical resistivity and the selected parameters. Generally, when porosity increases,
resistivity decreases. Also showed when resistivity increased the cohesion increased.
On the other hand, some unique trends of behavior were observed for relationship
between resistivity and saturation. Overall, results showed the saturation increases,
the resistivity value decreases. Hence, more investigation and experiments need to be
conducted in order to achieve more precise correlations.
vi
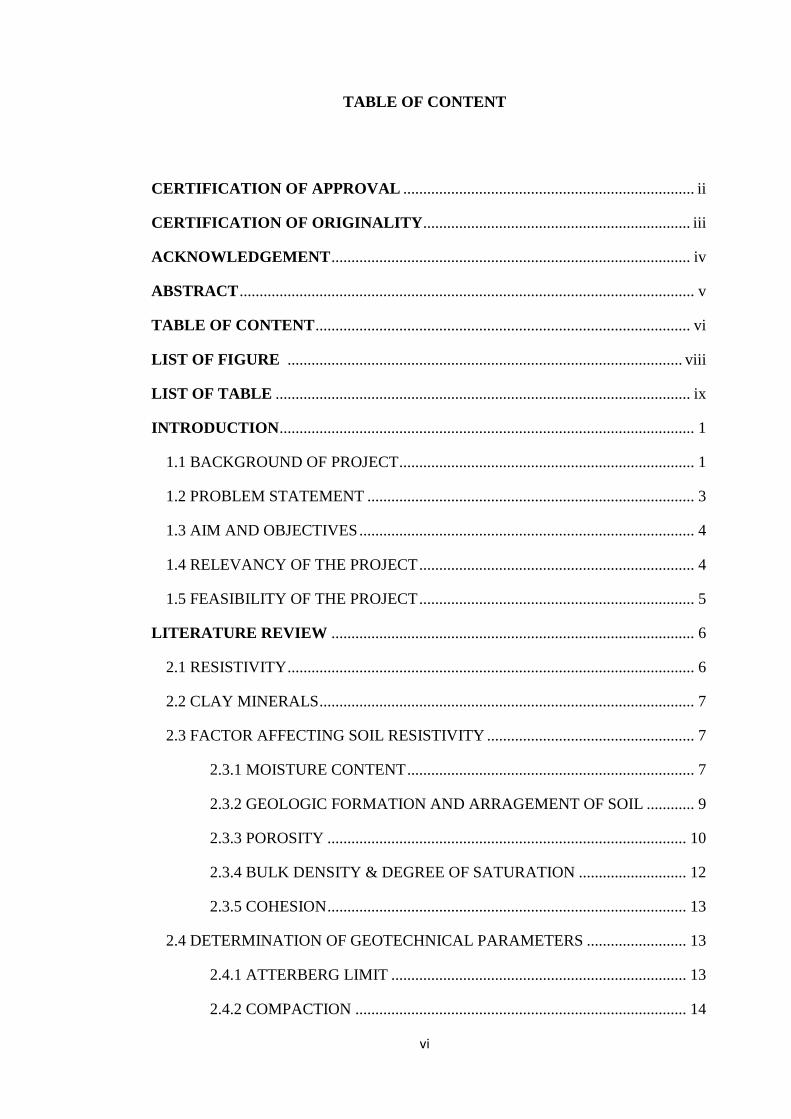
TABLE OF CONTENT
CERTIFICATION OF APPROVAL ......................................................................... ii
CERTIFICATION OF ORIGINALITY ................................................................... iii
ACKNOWLEDGEMENT .......................................................................................... iv
ABSTRACT .................................................................................................................. v
TABLE OF CONTENT .............................................................................................. vi
LIST OF FIGURE ................................................................................................... viii
LIST OF TABLE ........................................................................................................ ix
INTRODUCTION ........................................................................................................ 1
1.1 BACKGROUND OF PROJECT .......................................................................... 1
1.2 PROBLEM STATEMENT .................................................................................. 3
1.3 AIM AND OBJECTIVES .................................................................................... 4
1.4 RELEVANCY OF THE PROJECT ..................................................................... 4
1.5 FEASIBILITY OF THE PROJECT ..................................................................... 5
LITERATURE REVIEW ........................................................................................... 6
2.1 RESISTIVITY ...................................................................................................... 6
2.2 CLAY MINERALS .............................................................................................. 7
2.3 FACTOR AFFECTING SOIL RESISTIVITY .................................................... 7
2.3.1 MOISTURE CONTENT ........................................................................ 7
2.3.2 GEOLOGIC FORMATION AND ARRAGEMENT OF SOIL ............ 9
2.3.3 POROSITY .......................................................................................... 10
2.3.4 BULK DENSITY & DEGREE OF SATURATION ........................... 12
2.3.5 COHESION .......................................................................................... 13
2.4 DETERMINATION OF GEOTECHNICAL PARAMETERS ......................... 13
2.4.1 ATTERBERG LIMIT .......................................................................... 13
2.4.2 COMPACTION ................................................................................... 14
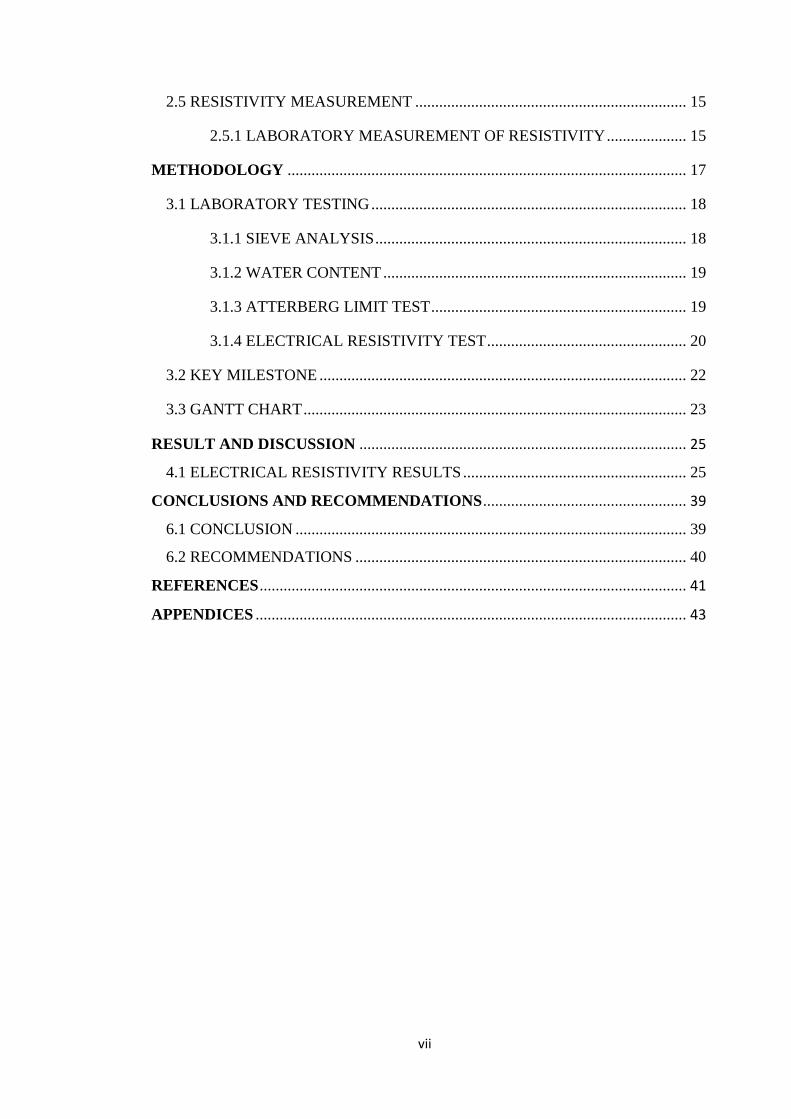
vii
2.5 RESISTIVITY MEASUREMENT .................................................................... 15
2.5.1 LABORATORY MEASUREMENT OF RESISTIVITY .................... 15
METHODOLOGY .................................................................................................... 17
3.1 LABORATORY TESTING ............................................................................... 18
3.1.1 SIEVE ANALYSIS .............................................................................. 18
3.1.2 WATER CONTENT ............................................................................ 19
3.1.3 ATTERBERG LIMIT TEST ................................................................ 19
3.1.4 ELECTRICAL RESISTIVITY TEST .................................................. 20
3.2 KEY MILESTONE ............................................................................................ 22
3.3 GANTT CHART ................................................................................................ 23
RESULT AND DISCUSSION .................................................................................. 25
4.1 ELECTRICAL RESISTIVITY RESULTS ........................................................ 25
CONCLUSIONS AND RECOMMENDATIONS ................................................... 39
6.1 CONCLUSION .................................................................................................. 39
6.2 RECOMMENDATIONS ................................................................................... 40
REFERENCES ........................................................................................................... 41
APPENDICES ............................................................................................................ 43
viii
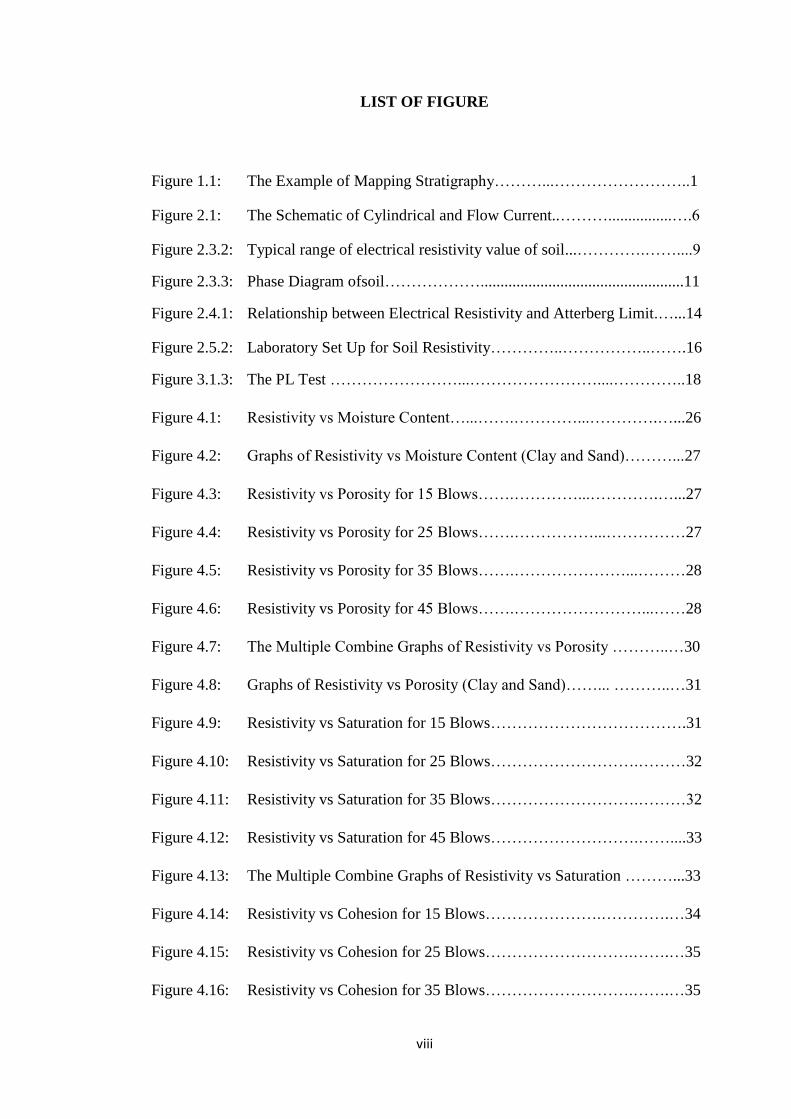
LIST OF FIGURE
Figure 1.1: The Example of Mapping Stratigraphy………...……………………..1
Figure 2.1: The Schematic of Cylindrical and Flow Current..………................….6
Figure 2.3.2: Typical range of electrical resistivity value of soil...………….……....9
Figure 2.3.3: Phase Diagram ofsoil………………...................................................11
Figure 2.4.1: Relationship between Electrical Resistivity and Atterberg Limit.…...14
Figure 2.5.2: Laboratory Set Up for Soil Resistivity…………..……………..…….16
Figure 3.1.3: The PL Test ……………………...……………………....…………..18
Figure 4.1: Resistivity vs Moisture Content…...…….…………...………….…...26
Figure 4.2: Graphs of Resistivity vs Moisture Content (Clay and Sand)………...27
Figure 4.3: Resistivity vs Porosity for 15 Blows…….…………...………….…...27
Figure 4.4: Resistivity vs Porosity for 25 Blows…….……………...……………27
Figure 4.5: Resistivity vs Porosity for 35 Blows…….…………………...………28
Figure 4.6: Resistivity vs Porosity for 45 Blows…….……………………...……28
Figure 4.7: The Multiple Combine Graphs of Resistivity vs Porosity ………..…30
Figure 4.8: Graphs of Resistivity vs Porosity (Clay and Sand)……... ………..…31
Figure 4.9: Resistivity vs Saturation for 15 Blows……………………………….31
Figure 4.10: Resistivity vs Saturation for 25 Blows……………………….………32
Figure 4.11: Resistivity vs Saturation for 35 Blows……………………….………32
Figure 4.12: Resistivity vs Saturation for 45 Blows……………………….……....33
Figure 4.13: The Multiple Combine Graphs of Resistivity vs Saturation ………...33
Figure 4.14: Resistivity vs Cohesion for 15 Blows………………….………….…34
Figure 4.15: Resistivity vs Cohesion for 25 Blows……………………….…….…35
Figure 4.16: Resistivity vs Cohesion for 35 Blows……………………….…….…35
ix
Figure 4.17: Resistivity vs Cohesion for 45 Blows……………………….…….…36
Figure 4.18: The Multiple Combine Graphs of Resistivity vs Cohesion ………....37
Figure 4.19: Graphs of Resistivity vs Cohesion (Clay and Sand)…….. ………....38
LIST OF TABLE
Table 3.3: The timeline for FYP1………………………….…………………23
Table 3.4: The timeline for FYP2………………………….…………………24
Table 4.1: The results obtained from laboratory experiment…………………25
1
CHAPTER 1
INTRODUCTION
1.1 Background
Geophysical methods provide information about the physical properties of
earth’s subsurface. These methods include measuring the response of the subsurface
to electromagnetic, electric and seismic energy. Geophysical methods are classified
into surface or borehole methods. The surface methods are non-intrusive and is used
for obtaining the subsurface data quickly. The borehole measurements require the
drilling of a borehole to lower the geophysical measuring device. Hence the borehole
measurements are used for obtaining the in situ properties of the subsurface.
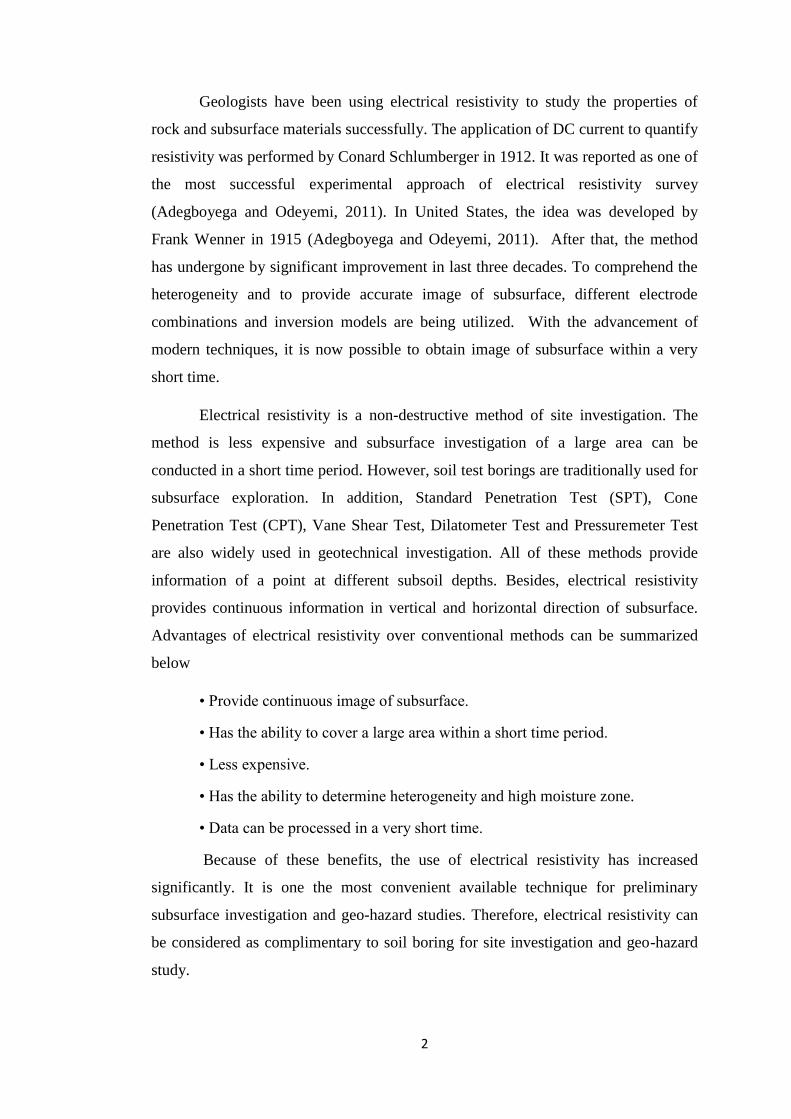
The use of geophysical methods in site investigation is gaining notable
recognition from the global engineering and construction community. During site
investigation, several parameters are investigated by geologist and geotechnical
engineers. However, they can only obtain information at certain key locations and
interpolate soil conditions area wide. Geophysical methods have the possibility to
give an image of the subsurface, as shown in Figure 1.1. Also, with the development
of new software for the interpretation of resistivity measurements, 2D and 3D
electrical resistivity is extensively used today in shallow geophysical investigation.
Figure 1.1: The Example of Mapping Stratigraphy, Sand and Gravel Lenses in
Clay and Shale Environment
2
Geologists have been using electrical resistivity to study the properties of
rock and subsurface materials successfully. The application of DC current to quantify
resistivity was performed by Conard Schlumberger in 1912. It was reported as one of
the most successful experimental approach of electrical resistivity survey
(Adegboyega and Odeyemi, 2011). In United States, the idea was developed by
Frank Wenner in 1915 (Adegboyega and Odeyemi, 2011). After that, the method
has undergone by significant improvement in last three decades. To comprehend the
heterogeneity and to provide accurate image of subsurface, different electrode
combinations and inversion models are being utilized. With the advancement of
modern techniques, it is now possible to obtain image of subsurface within a very
short time.
Electrical resistivity is a non-destructive method of site investigation. The
method is less expensive and subsurface investigation of a large area can be
conducted in a short time period. However, soil test borings are traditionally used for
subsurface exploration. In addition, Standard Penetration Test (SPT), Cone
Penetration Test (CPT), Vane Shear Test, Dilatometer Test and Pressuremeter Test
are also widely used in geotechnical investigation. All of these methods provide
information of a point at different subsoil depths. Besides, electrical resistivity
provides continuous information in vertical and horizontal direction of subsurface.
Advantages of electrical resistivity over conventional methods can be summarized
below
• Provide continuous image of subsurface.
• Has the ability to cover a large area within a short time period.
• Less expensive.
• Has the ability to determine heterogeneity and high moisture zone.
• Data can be processed in a very short time.
Because of these benefits, the use of electrical resistivity has increased
significantly. It is one the most convenient available technique for preliminary
subsurface investigation and geo-hazard studies. Therefore, electrical resistivity can
be considered as complimentary to soil boring for site investigation and geo-hazard
study.
3
Resistivity is a property possessed by all materials. The electrical resistivity
method for determining subsurface conditions utilizes the knowledge that in soil
materials, the resistivity values differ sufficiently to permit that property to be used
for identification purpose. Because the method is non-destructive and very sensitive,
it offers a very attractive tool for describing the subsurface properties without
digging (Samouelian, et al., 2005; Kibria and Hossain, 2012; and Samsudin 2002). It
has be already applied in various context like landfill, groundwater exploration,
agronomical management by identifying areas of excessive compaction or soil
horizontal thickness and bedrock depth, and at least assessing the soil hydrological
properties.
Turesson, 2006, has mentioned, in earth material, resistivity decrease with
increasing water content make it easier for an electrical current to flow through the
material. Consequently, nonporous materials (holding little water) will have high
resistivity values. Such materials include clean gravel and sand have a relatively high
resistivity value. Silts, clays, and coarse grained and also fine grained soil mixtures
have comparatively low resistivity values. Soil formation is non-glaciated areas
typically have lower resistivity values than soils in glacial areas. Dense rock with
few voids, little moisture and negligible amounts of salt with have high resistance
(Matsui, et al.,1997). Soft saturated clay will have a low resistance, particularly if
any decomposed organic matter or soluble salts are present.
1.2 Problem Statement
The use of electrical resistivity by geotechnical engineers have been
increasing all over the world. It is a convenient method to evaluate spatial and
temporal variation of moisture and heterogeneity of subsoil. The working principle
of this method is based on the conduction phenomenon of soil. However, electrical
resistivity provides qualitative information of subsurface. Limited studies have been
conducted to obtain geotechnical parameters using resistivity. Quantification of
geotechnical properties has become an important issue for rigorous use of resistivity
in engineering applications.
The correlation of different geotechnical properties with electrical resistivity
will close the gap that currently exists between geophysical engineering and
4
geotechnical engineering. The geotechnical engineers will be able to interpret the
geophysical data and utilize the information for their design. Therefore, the
development of geotechnical parameters from the electrical resistivity will make this
method more effective for subsurface investigation. The presence of moisture
changes consistency and strength of soil. Moisture is also important for conduction
phenomenon of soil. Conductivity and resistivity also depend on the mineralogy of
soil, particle size distribution, Index properties, unit weight, porosity, degree of
saturation and other parameters. Proper understanding of the causes of variation of
these parameters with resistivity can be helpful for development of correlations.
1.3 Objective of the Current Study
The study was conducted to determine the relationship of geotechnical
properties of clay soil with the electrical resistivity. Soil samples were bought and
collected from a company called Kaolin Malaysia Sdn Bhd in Kuala Lumpur. It is
important to determine the variation of resistivity with different geotechnical
parameter’s correlation. The specific objectives of the study is presented here:
To determine the effects of porosity on electrical resistivity and strength of
soil for clay size particle.
To determine the effects of saturation on electrical resistivity and strength of
soil for clay size particle.
1.4 The Relevancy of the Project
The electrical resistivity method plays a significant role in the exploration of
natural resources like groundwater and mineral deposits. In designing and checking
the geotechnical structure, the strength parameter such as cohesive (c) is the
important parameter that required beside other parameters like porosity (n) and
saturation (S). These soil properties are essential to identify risk in slopes by
calculate the factor of safety (FOS) which will indicate the stability of a certain
slope. Therefore, rather than conventional method, electrical resistivity is a
geophysical method which allow measurement of soil from soil surface to any depth
without disturbance with less time consuming.
5
Feasibility of the Project
Electrical resistivity surveys have been used for many decades in
geotechnical investigation, mining and hydro geological. More recently, it has been
used for environmental surveys. The results of this study can be used for to
geological and hydro-geological assessment such as wells location and agricultural
activity. The electrical resistivity method plays a significant role in the exploration of
natural resources like groundwater and mineral deposits.
Although there are several researchers in the past and recent years has
included correlation of electrical resistivity with various parameters. The general
approach behind this quick assessment system is to eliminate the usage of physical
soil parameters such cohesion, porosity, and saturation as is currently being practice
for the calculation of bearing capacity and replace these physical parameters with
their correlated electrical parameters such resistivity, voltage etc.
6
CHAPTER 2
LITERATURE REVIEW
2.1 Resistivity
Electrical resistivity measurements are useful for assessing many physical
properties of the porous soils including porosity and density of soils. Typically, an
electrical current is applied to the ground through a pair of electrodes. A second pair
of electrodes is then used to measure the resulting voltage. Because various
subsurface materials have different resistivity values, measurements at the surface
can be used to determine the vertical and lateral variation of underlying materials.
Resistivity relates electrical potential and current to the geometrical
dimension of the specified region. It is the reciprocal of conductivity. Electrical
conduction takes place due to the movement of charges. Charges are displaced from
the original equilibrium condition under the application of electric potential.
However, charge density depends on the applied electric field and resistivity of the
material. Resistivity can be defined by considering current flow through a
cylindrical section. To define resistivity, assuming a cylindrical section with cross
sectional area and length of A and L, if current flow is I through section resistance R
and potential drop across the section is V, then resistivity can be expressed by the
following equation
where, ρ = Electrical Resistivity R= Resistance of the material
V= Potential I = Current
A= Cross sectional Area L= Length
= R. (A/L)
7
Figure 2.1: The schematics of cylindrical section and flow of current
2.2 Clay Minerals
Clay minerals are formed by chemical weathering of rock forming minerals.
They are small colloidal size crystal and chemically known as hydrous
aluminosilicates. Clay mineral consists of crystal sheet with repeated atomic
structure. There are two fundamental crystal sheets such as tetrahedral or silica and
octahedral or alumina. The tetrahedral sheet consists of four oxygen atoms at the
corners surrounding a silicon atom. In an octahedral sheet, six oxygen atoms enclose
aluminum, magnesium, iron or other atom.
2.3 Factor Affecting Soil Resistivity
2.3.1 Moisture Content
The amount of water present in the soil is one of the most important
parameters geotechnical engineer needs to know. It can be defined either weight
basis or volume basis. Measurement of moisture content in the weight basis is
known as gravimetric moisture content. In the weight basis, the ratio of amount
of water present in the void to the amount of solids is known as moisture content.
The equation to calculate gravimetric moisture content is expressed as
where, Ww = Weight of water
Ws = Weight of solid soil
Several studies showed that moisture content is the most dominating factor
which influences electrical resistivity of soil. Electrical conductivity occurs
mainly due to the displacement of ions in the pore water. When moisture content
increases from air dry to full saturation, adsorbed ions in the solid particles are
8
released. Thus, mobility of electrical charge increases with the increase of
moisture.
Free electrical charges cause decrease in electrical resistivity under the
application of electric field. It is seen electrical resistivity of soil decreases
rapidly with the increase of moisture content more than 15% (Samouelian et al.,
2007).
Moisture content and electrical resistivity curve was divided in to various
zones based on the different moisture condition in soil. The segments of the
curve correspond to the specific water content are adsorbed water, film water,
film capillary water, capillary water and gravitational water.
According to the author, electrical resistivity decreases rapidly in the
adsorption water zone with the increase of moisture content. Ions of water
molecules are immobile in the adsorbed water zone. However, the dipolar water
ions create a conductive path for electrical current. Thus electrical resistivity
decreases sharply with the increase of moisture in the adsorption zone. In the film
water zone Van der Waals’ force increases.
As a result electrical resistivity decreases less sharply in the film water zone.
When maximum possible thickness of water film is achieved, water goes from
film to fissure. In the film capillary water zone relative portion of film water
decreases and capillary water increases. Molecular attraction force is higher than
the capillary force in this zone. Therefore, electrical resistivity decreases less
dramatically in the film capillary and capillary water zone. In the gravitational
water zone mobility of electrical charges become independent of movement of
water molecule ions. Thus, electrical resistivity is almost independent of water
content in this zone.
9
2.3.2 Geologic Formation and Arrangement of Soil Solids
Generally, soil electrical resistivity exhibits a wide range of value. Soil
resistivity is low for coastal soil and high for rocks. Study also demonstrated that
soil resistivity is also affected by geological formation. Research conducted by
Giao et al., (2002) showed that presence of diatom micro fossils substantially
alter the geotechnical properties of clay. This kind of change in structure also
affects electrical properties of clay. Robain et al., (1996) presented resistivity
variation with the structure of the pedological materials. According to the
authors, low and high resistivity values are related to the macro and meso
porosity of soil.
Geometry of the pores determines the proportion of the water and air in the
soil. Air is considered as dielectric material. If the pores of soil are filled with
water then electrical conductivity may change. Usually clay soil is more
conductive than sandy soil. However, saturated sandy soil may demonstrate low
resistivity than dry compacted clay. Because of these factors, overlapping of
resistivity values is observed for different type of soils.
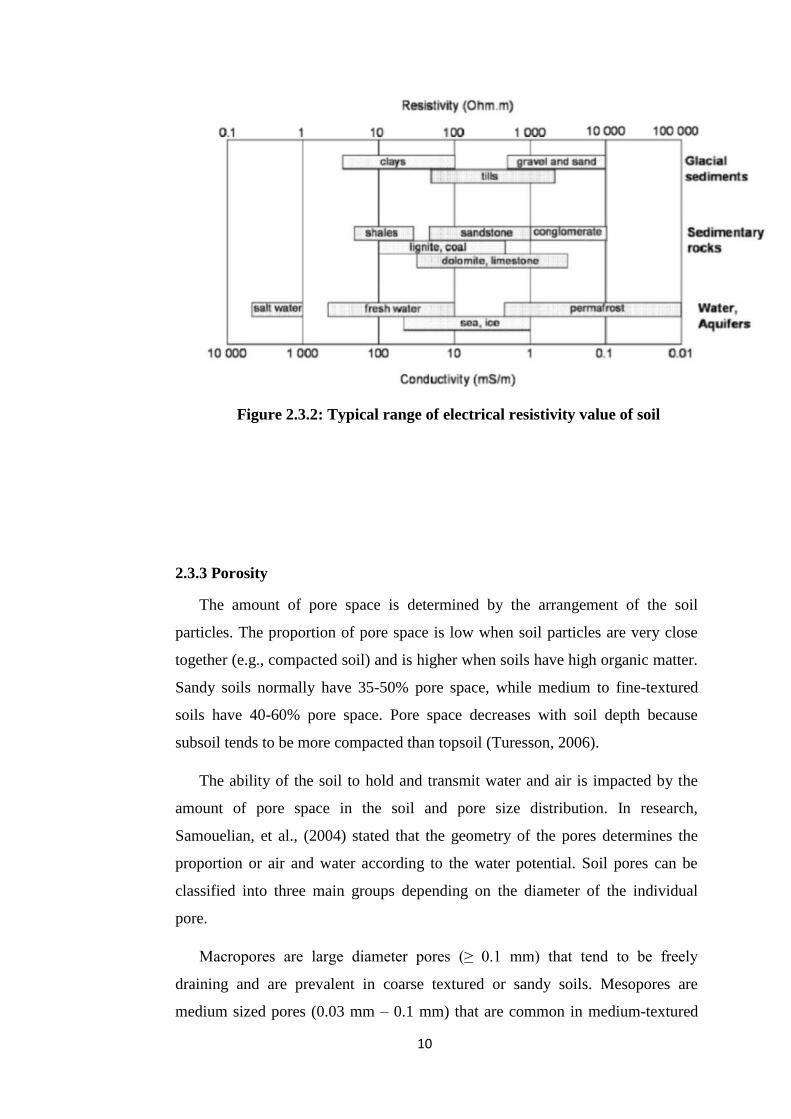
10
Figure 2.3.2: Typical range of electrical resistivity value of soil
2.3.3 Porosity
The amount of pore space is determined by the arrangement of the soil
particles. The proportion of pore space is low when soil particles are very close
together (e.g., compacted soil) and is higher when soils have high organic matter.
Sandy soils normally have 35-50% pore space, while medium to fine-textured
soils have 40-60% pore space. Pore space decreases with soil depth because
subsoil tends to be more compacted than topsoil (Turesson, 2006).
The ability of the soil to hold and transmit water and air is impacted by the
amount of pore space in the soil and pore size distribution. In research,
Samouelian, et al., (2004) stated that the geometry of the pores determines the
proportion or air and water according to the water potential. Soil pores can be
classified into three main groups depending on the diameter of the individual
pore.
Macropores are large diameter pores (≥ 0.1 mm) that tend to be freely
draining and are prevalent in coarse textured or sandy soils. Mesopores are
medium sized pores (0.03 mm – 0.1 mm) that are common in medium-textured
11
soils or loamy soils. Micropores are small diameter pores (<0.03 mm) that are
important for water storage and are abundant in clay soils. It is sometimes helpful
to envision soil pore space as a network of tiny tubes of varying diameter.
Imagine how the diameters of those tubes would impact the movement of gasses
and liquids relative to aeration, drainage, and infiltration (Samouelian, et al.,
2004).
Moreover, in the study, Turesson (2005) claimed that the effects of resistivity
distortion are seen to considerably greater depth. In saturated zone the water
content, which is the porosity when the pores are saturated, varies in certain
percentage. Porosity is governed by many factors such as the uniformity of soil,
packing and compaction during and after deposition. Packing alone can
contribute significantly to the differences in porosity. However, the gradual
change from high to low resistivities which inherent to this method makes it
difficult to determine an intrinsic value of porosity.
For porosity, which is the amount of void space between soil particles.
Infiltration (groundwater movement) and water storage occur in these void
spaces. The porosity of soil is the ratio of the volume of pore space to the total
volume of material. Porosity also provides some estimate of compaction and the
maximum space available for water (at saturation) or air. of soil can be defined as
the ratio of weight of soil to the total volume. Porosity can be defined by the
phase diagram (Figure 2.3.1) of soil. The expression is
n=
where, Vv = Volume of voids and Vt = Total volume.
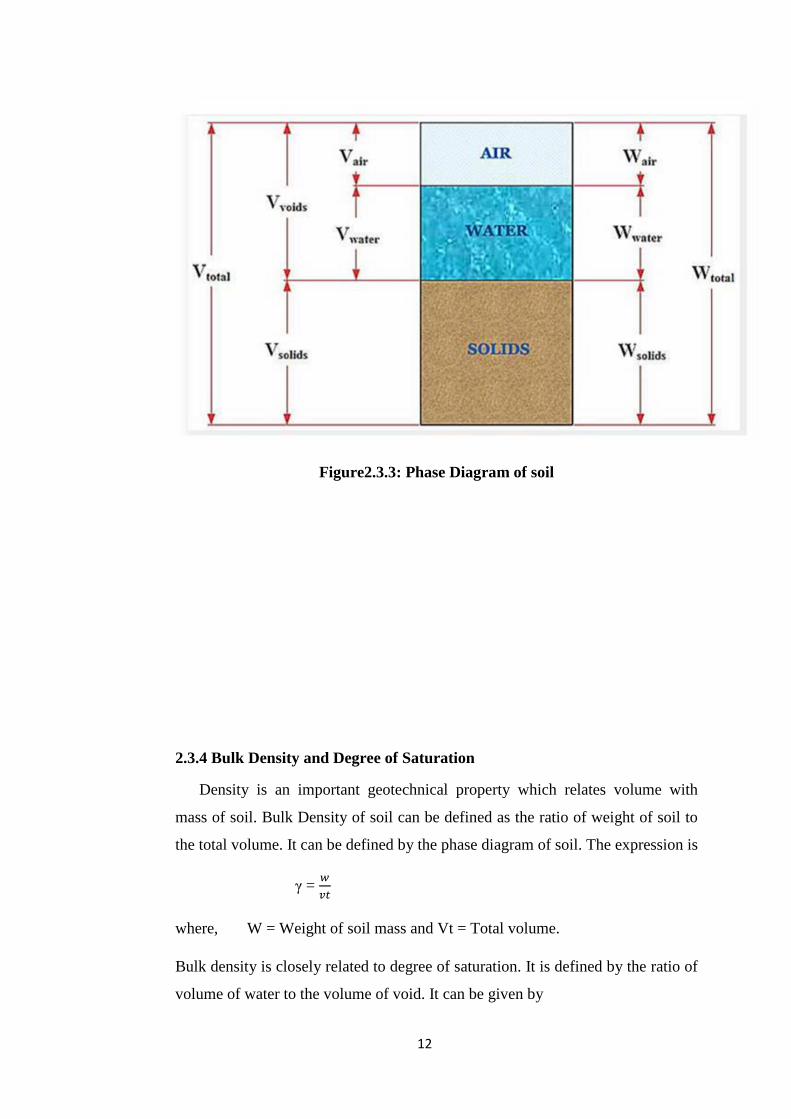
12
Figure2.3.3: Phase Diagram of soil
2.3.4 Bulk Density and Degree of Saturation
Density is an important geotechnical property which relates volume with
mass of soil. Bulk Density of soil can be defined as the ratio of weight of soil to
the total volume. It can be defined by the phase diagram of soil. The expression is
γ =
where, W = Weight of soil mass and Vt = Total volume.
Bulk density is closely related to degree of saturation. It is defined by the ratio of
volume of water to the volume of void. It can be given by
13
Sr =
where, Vw = Volume of water and Vv = Volume of void
Research showed that soil resistivity is affected by the change in bulk density
and degree of saturation. Increase of bulk density is associated with reduction of
pore air in soil. Therefore, the degree of saturation increases. Dissolved ions from
the pore water adsorb on the solid surface and affects the formation of double
layer in fine grained soil. Therefore, increase of degree of saturation cause
proportional decrease of soil resistivity.
However, this relationship is valid above a critical value of degree of
saturation. Critical degree of saturation is corresponds to minimum amount of
water required to maintain a continuous film of water in soil. An abrupt increase
of soil resistivity occurs below critical degree of saturation (Khalil and Monterio
Santos, n.d). Moreover, bulk density increases contact between individual
particles. Reduction in pore space and closer contacts between the particles allow
easy conduction of current. According to the study of Kibria and Hossain (2012),
relationship curve of conductivity and degree of saturation was concave upward.
Abu Hassanein et al., (1996) conducted resistivity measurements of four
different soils at different initial degree of saturation. It was observed that the
electrical resistivity was inversely correlated with initial degree of saturation. It
was also noted that initial degree of saturation and electrical resistivity was
independent of compactive effort.
2.3.5 Cohesion
The cohesion is a term used in describing the shear strength soils. Its
definition is mainly derived from the Mohr-Coulomb failure criterion and it is
used to describe the non-frictional part of the shear resistance which is
independent of the normal stress. In the stress plane of Shear stress-effective
normal stress, the soil cohesion is the intercept on the shear axis of the Mohr-
Coulomb shear resistance line .
2.4 Determination of Geotechnical Parameters
14
2.4.1 Atterberg Limits
Atterberg Limits are moisture content where the soil changes its states and
behaviors. With the increase of water content, soil state changes from brittle solid
to plastic solid and then to a viscous fluid. The Index properties are widely used
by geotechnical engineers to identify the soil behavior in response to moisture.
Research has been conducted to identify the relationship between Atterberg
Limits and resistivity. Abu Hassanein et al., (1996) evaluated variation of
electrical resistivity with Atterberg limits.
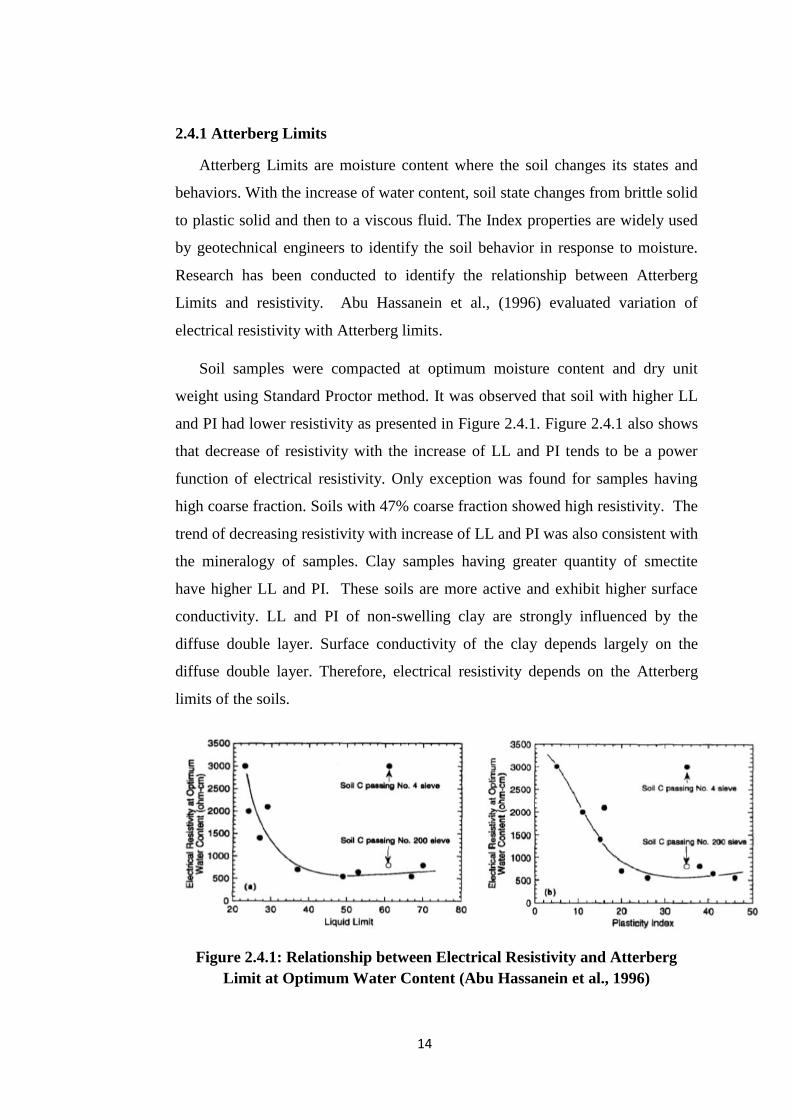
Soil samples were compacted at optimum moisture content and dry unit
weight using Standard Proctor method. It was observed that soil with higher LL
and PI had lower resistivity as presented in Figure 2.4.1. Figure 2.4.1 also shows
that decrease of resistivity with the increase of LL and PI tends to be a power
function of electrical resistivity. Only exception was found for samples having
high coarse fraction. Soils with 47% coarse fraction showed high resistivity. The
trend of decreasing resistivity with increase of LL and PI was also consistent with
the mineralogy of samples. Clay samples having greater quantity of smectite
have higher LL and PI. These soils are more active and exhibit higher surface
conductivity. LL and PI of non-swelling clay are strongly influenced by the
diffuse double layer. Surface conductivity of the clay depends largely on the
diffuse double layer. Therefore, electrical resistivity depends on the Atterberg
limits of the soils.
Figure 2.4.1: Relationship between Electrical Resistivity and Atterberg
Limit at Optimum Water Content (Abu Hassanein et al., 1996)
15
2.4.2 Compaction
Compaction is the process of densification of soil by the application of
mechanical energy. Generally, compaction is done at specific moisture content to
achieve maximum densification of soil. Compaction condition can be determined
by Standard Proctor Test. However, different indirect approaches were initiated
to observe compaction condition. Several researchers utilized electrical resistivity
to evaluate compaction condition. Compaction is associated with the decrease of
void ratio and increase of degree of saturation. Good correlations between
electrical resistivity and compaction condition were observed in several studies.
Observed resistivity was high when soil was compacted at dry optimum and
low when compacted at wet optimum. Resistivity was sensitive of molding water
content when water content was below optimum. At wet optimum, resistivity had
become almost independent of molding water content. Authors indicated that this
relation could be used to evaluate compaction condition of soil. Relationship
between resistivity and compaction was discussed in the light of structural
change of soil during compaction. At low compactive effort and dry of optimum
water content, clay clods are difficult to remold. Interclod pores are also
relatively large in this condition. Many pores are filled with dielectric air and
inter particle contacts are poor.
Furthermore diffuse double layers are not fully developed. Therefore, soil
shows high resistivity. In contrast, when soil is compacted at wet optimum and
high compactive effort, clods of clay are easily remolded. At this condition, pores
are nearly saturated and smaller in size compare to previous case. Better particle-
to-particle contact and formation of bridge between particles improve
conductivity. Thus, lower resistivity is attained when compacted at wet optimum
water content and high compactive effort (Abu Hassanein et al., 1996).
Moreover, study showed that change in compactive effort did not affect
resistivity significantly when compacted at wet optimum.
2.5 Resistivity Measurement
16
Soil resistivity tests can be conducted either in the field or on the collected
samples in laboratory. The resistivity test in laboratory is widely used in to identify
corrosion potential and contamination of soil. However, field tests are conducted to
investigate subsurface, environmental and hydrological condition. Resistivity has the
ability to provide a continuous image of subsurface.
2.5.1 Laboratory Measurement of Resistivity
In the laboratory, soil resistivity is conducted by measuring voltage drop across a
known resistance which is in series connection with sample. The relationship
between the resistance of conductor having regular geometric shape and its
resistivity is the basis of laboratory measurement. In general case, two electrode
are placed in the end of cylinder and current (I) is measured under applied
voltage (V). Sample resistance (R) is obtained from Ohm’s Law. Resistivity is
determined incorporating the geometric factor such as length (L) and cross
sectional area (A) by the following expression
ρ =
Here, current is carried predominantly by movement of electrons in electrode and
ions in pore fluid in the sample. Therefore, charge is carried across interface by
electrochemical reaction. If the contact resistance is higher than the resistance of
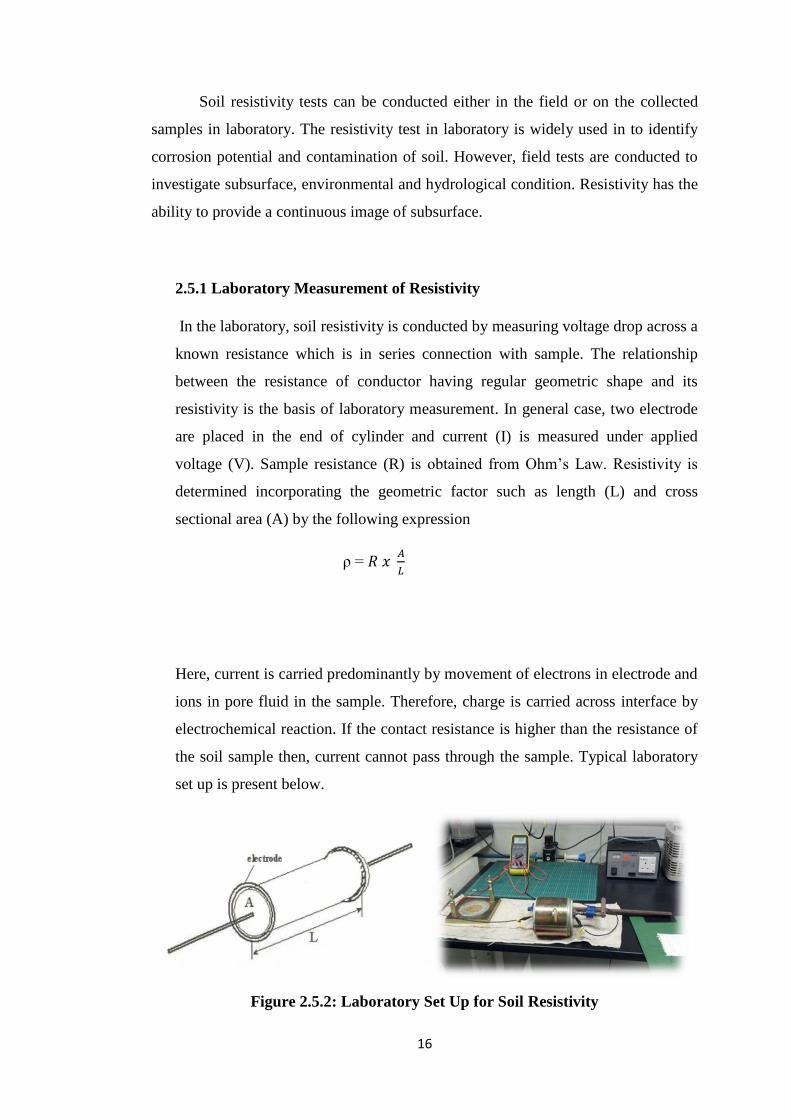
the soil sample then, current cannot pass through the sample. Typical laboratory
set up is present below.
Figure 2.5.2: Laboratory Set Up for Soil Resistivity
17
CHAPTER 3
METHODOLOGY
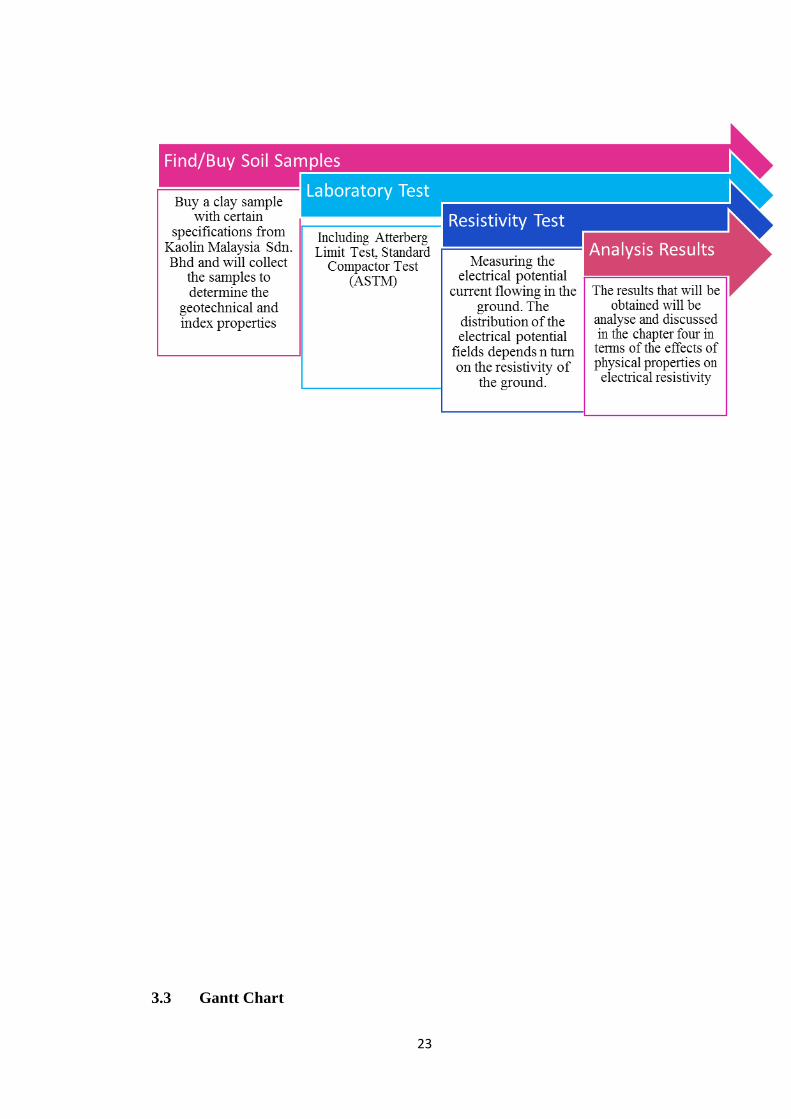
The objective of this study is to determine the relationship between geotechnical
properties of clayey soil with electrical resistivity. Soil samples were bought from the
specific supplier. Laboratory testing on the collected samples were conducted to
determine soil type, index properties, optimum dry unit weight and moisture content
and shear strength. Electrical resistivity was also measured in the laboratory to
determine the correlation of geotechnical properties with the soil resistivity. In
general, the research methodology are shown as below.
18
3.1 Laboratory Testing
3.1.1 Sieve Analysis
Particle size distribution is one of the most important characteristics
of soil in engineering implications. This property indicates how the soil
would interact with water. Moreover, plasticity, permeability and electric
conductivity, consolidation, shear strength and chemical diffusion are
dependent on particle size distribution. In this study, sieve analyses were
conducted on the collected samples in the laboratory according to ASTM
standard D422.Sieve analysis was carried out using 65 gm of air dried
samples to determine the particle size distribution Aggregation of the
particles was broken by mortar and rubber covered pestle.
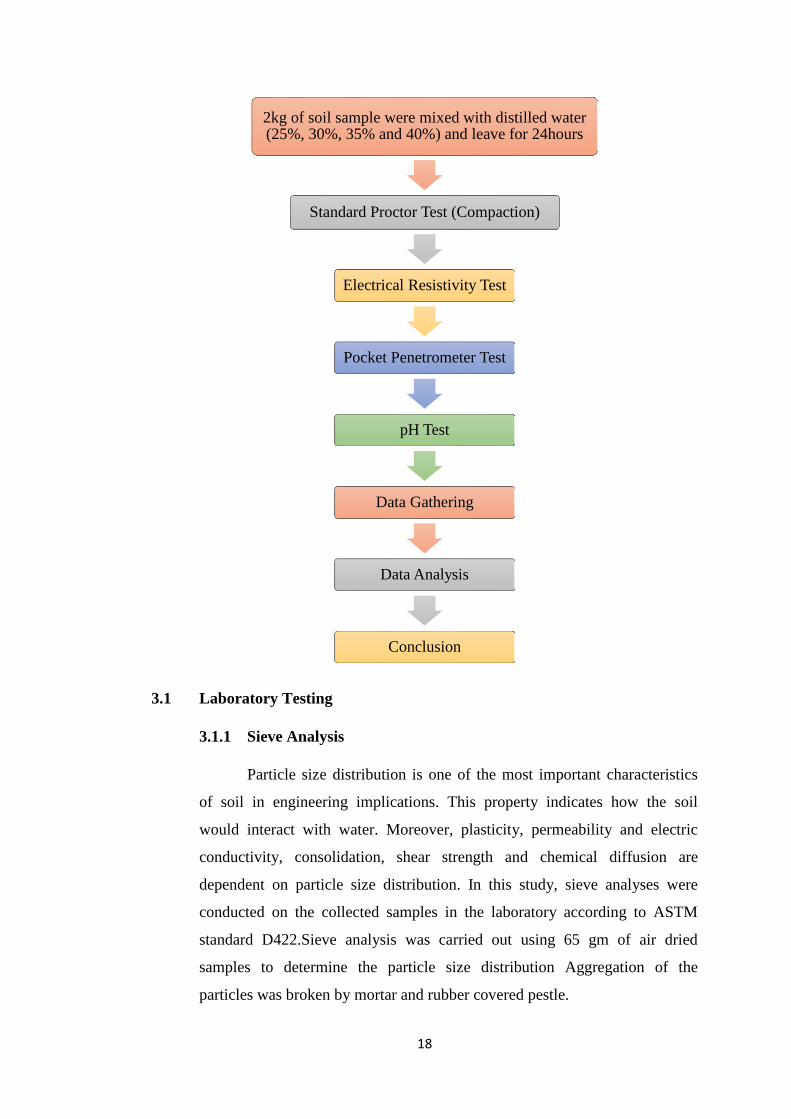
2kg of soil sample were mixed with distilled water (25%, 30%, 35% and 40%) and leave for 24hours
Standard Proctor Test (Compaction)
Electrical Resistivity Test
Pocket Penetrometer Test
pH Test
Data Gathering
Data Analysis
Conclusion
19
The grain size distribution was conducted using a set of US standard
sieves (No. 4, 10, 20, 40, 60, 100, 200 and pan). A lid was also placed at the
top to provide cover of the sample. Weight of each sieve was determined
before staking. Stack of sieves were shaken by mechanical sieve shaker. After
5 min the stack of sieves were removed. Combined weight of each sieve and
sample was measured. Wet washing was conducted to prevent aggregation of
large clumps of fine particles in soil samples retained on sieve No. 200. A
bowl was placed under the sieve. Washing of sample was continued until
clean water was coming out. Remaining sample was dried in the oven and
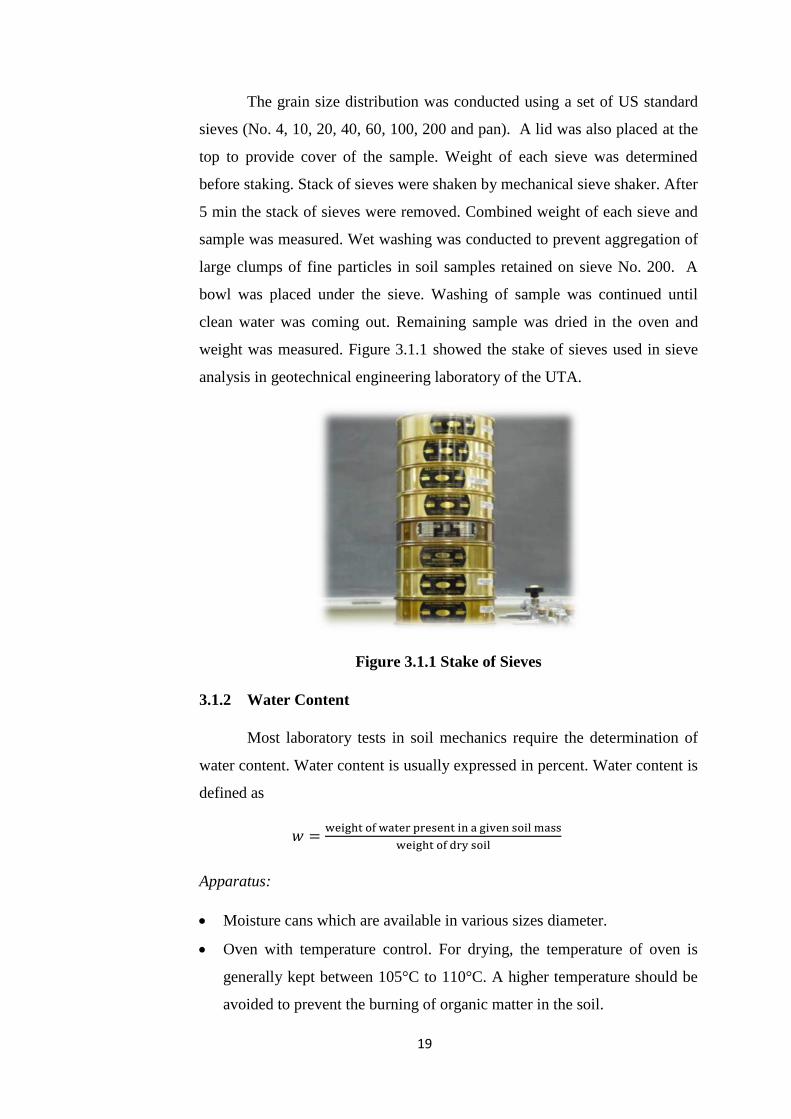
weight was measured. Figure 3.1.1 showed the stake of sieves used in sieve
analysis in geotechnical engineering laboratory of the UTA.
Figure 3.1.1 Stake of Sieves
3.1.2 Water Content
Most laboratory tests in soil mechanics require the determination of
water content. Water content is usually expressed in percent. Water content is
defined as
Apparatus:
Moisture cans which are available in various sizes diameter.
Oven with temperature control. For drying, the temperature of oven is
generally kept between 105°C to 110°C. A higher temperature should be
avoided to prevent the burning of organic matter in the soil.
20
Scientific balance. The balance should have a readability of 0.01g for
specimens having mass of 200g or less. If the specimen has a mass over
200g, the readability should be 0.1g.
3.1.3 Atterberg Limit Test
To obtain Liquid limit and Plastic limit of the soil samples, ASTM
standard D4318 method was adopted. Soil Samples passing through No. 40
sieve were used in the test. Moisture cans were labeled and their individual
mass was recorded. When a cohesive soil is mixed with an excessive amount
of water, it will be in a somewhat liquid state and flow like viscous liquid.
However, when this viscous liquid is gradually dried, with the loss of
moisture it will pass into a plastic state. With further reduction of moisture,
the soil will pass into semisolid and then into a solid state.
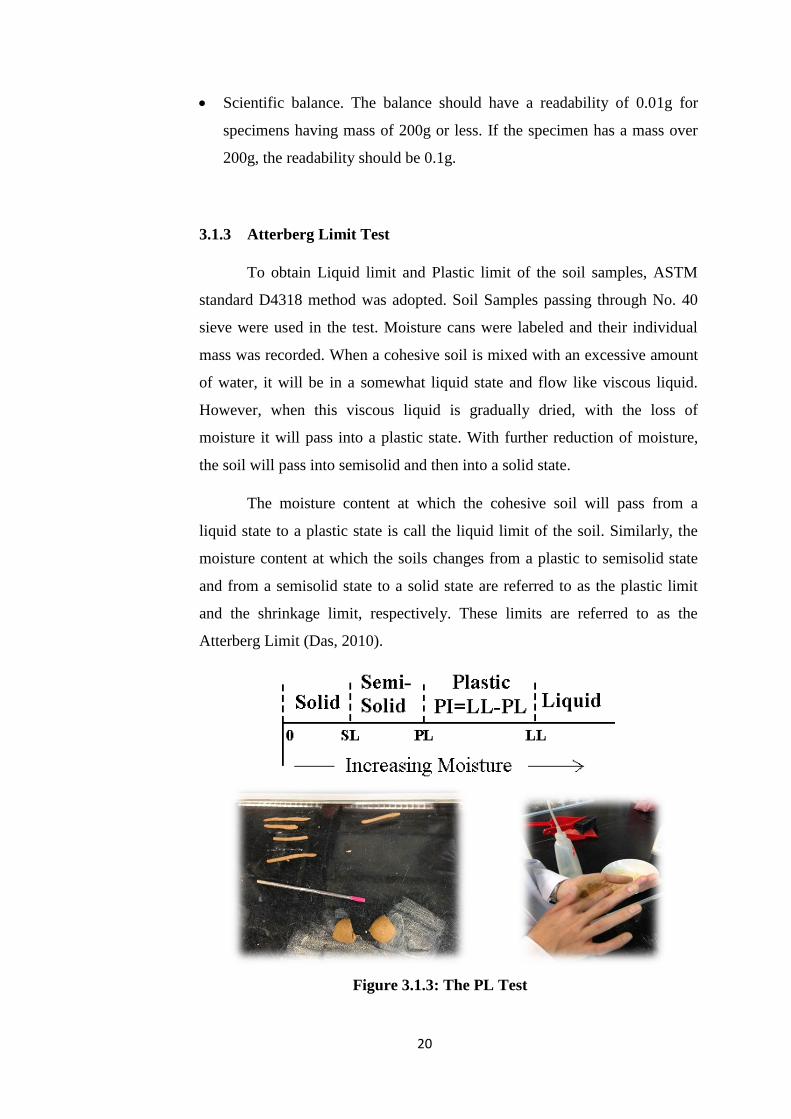
The moisture content at which the cohesive soil will pass from a
liquid state to a plastic state is call the liquid limit of the soil. Similarly, the
moisture content at which the soils changes from a plastic to semisolid state
and from a semisolid state to a solid state are referred to as the plastic limit
and the shrinkage limit, respectively. These limits are referred to as the
Atterberg Limit (Das, 2010).
Figure 3.1.3: The PL Test
21
Apparatus:
Porcelain evaporating dish
Grooving tool and spatula
Distilled Water
Ground Glass Plate
Penetration Machine
Scientific Balance
3.1.4 Electrical Resistivity Test
All samples were stored in airtight containers so as to reduce the
absorption of moisture. After basic test such above mentioned were
conducted to ascertain some basic properties of the soil samples. Following
this, samples were then prepared for the second phase tests which were
consisted of the electrical resistivity test.
Apparatus:
Soil mixer
Standard Proctor Hammer
Two 100mm aluminium electrodes
200 volts DC power supply & hand held multimeter
For every specimen, certain weight of soil such 2kg and 4 kg were
mixed with a certain amount of distilled water according to the percentage of
moisture content required which ranges between 25% to 40%. Mixing was
done by means of a soil mixer and the samples were then left aside for at least
24hour in the mixing bowl wrapped with plastic.
Prior to the compaction process, the internal perimeter of the mould
was lined with a thick plastic material for easy removal of the specimen once
the mould was disassembled and also during the electrical resistivity test so
that the mould which made by steel does not affect the reading. The
specimens were then compacted in three equal layers using standard proctor
hammer that delivers blows ranging from 15 to 45 blows per layer. The
procedure for compaction is the same as prescribed in BS 1377.
22
Moreover, the mould was disassembled upon completion of
compaction and the specimen were placed between two circular aluminium
electrodes for the purpose of determination of electrical resistivity using disc
electrode method according to BS 1377. The specimens then along with
aluminium disc were connected to both positive and negative terminals of a
DC power supply and also connected to a multimeter where an initial
potential with varying voltage from 30V, 60V and 90V were applied. The
resulting values of current in ampere were the recorded. The electrical
resistant and resistivity of the samples were calculated using formula shown
above.
3.2 Key Milestone
23
3.3 Gantt Chart

24
For the time being, the project is running smoothly and following what the
author have planned in the Gantt chart schedule and everything is within the time
frame. The author have completed all specimens for basic laboratory test and the
electrical resistivity test. The author get help each from supervisor and lab
technician when facing a problem. For now, frequent meeting with supervisor have
enabled the author to track the progress and discuss about the data anlysis and
findings about the project.
Final Year Project (FYP) Planning 1
Week Number
Activities 1 2 3 4 5 6
7
8 9
10
11 12 13 14
Selection of Project Topic
Briefing
brainstorming
Preliminary Research Work
Research on required tools and
equipments
and materials
Implement the process of the
project
Searching for the soil samples
Lab Safety Briefing
Implement the Preliminary
Laboratory Test
Submission of Extended
Proposal Defence
Implement Laboratory Test
Proposal Defence
Continue Lab Work and
Research
Submission of Interim Draft
Report
Submission of Interim Report
Table 3.3: Timeline for FYP1
Final Year Project (FYP) Planning 2
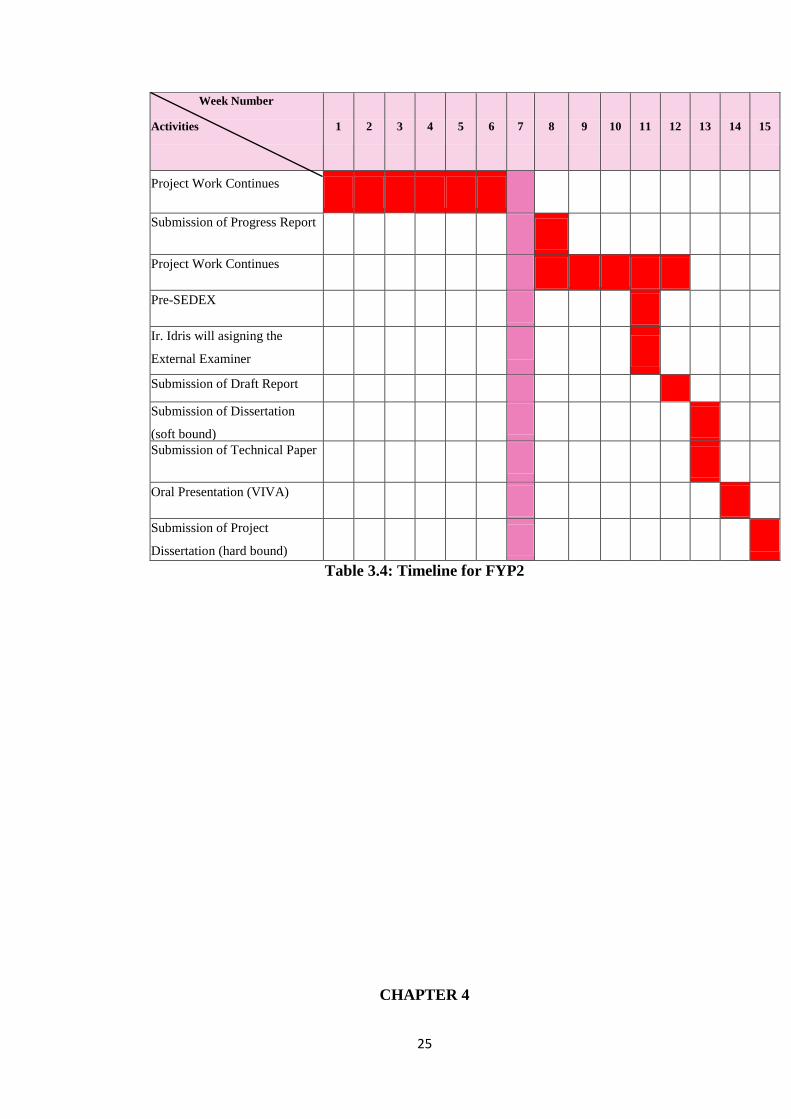
25
Week Number
Activities 1 2 3 4 5 6
7
8 9
10
11 12 13 14 15
Project Work Continues
Submission of Progress Report
brainstorming
Project Work Continues
Pre-SEDEX
Ir. Idris will asigning the
External Examiner
Submission of Draft Report
Submission of Dissertation
(soft bound)
Submission of Technical Paper
Oral Presentation (VIVA)
Submission of Project
Dissertation (hard bound)
Table 3.4: Timeline for FYP2
CHAPTER 4
26
RESULTS AND DISCUSSION
4.1 Electrical Resistivity Results
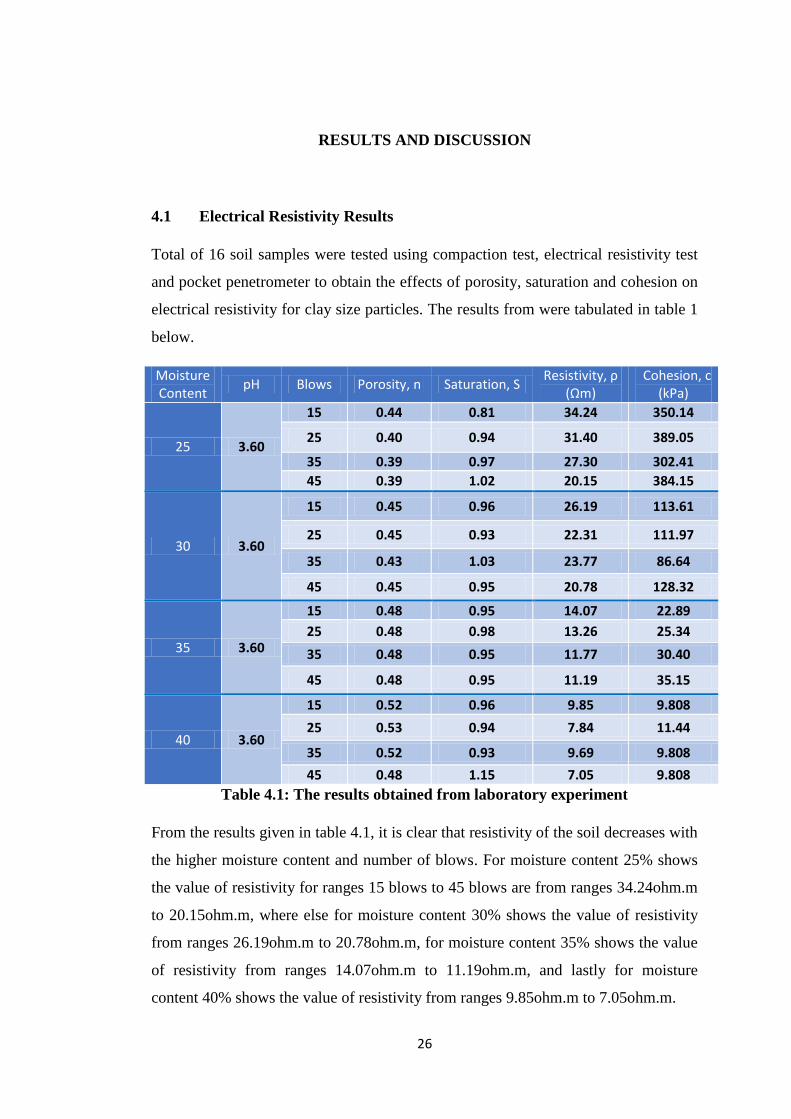
Total of 16 soil samples were tested using compaction test, electrical resistivity test
and pocket penetrometer to obtain the effects of porosity, saturation and cohesion on
electrical resistivity for clay size particles. The results from were tabulated in table 1
below.
Moisture Content
pH Blows Porosity, n Saturation, S Resistivity, ρ
(Ωm) Cohesion, c
(kPa)
25 3.60
15 0.44 0.81 34.24 350.14
25 0.40 0.94 31.40 389.05
35 0.39 0.97 27.30 302.41
45 0.39 1.02 20.15 384.15
30 3.60
15 0.45 0.96 26.19 113.61
25 0.45 0.93 22.31 111.97
35 0.43 1.03 23.77 86.64
45 0.45 0.95 20.78 128.32
35 3.60
15 0.48 0.95 14.07 22.89
25 0.48 0.98 13.26 25.34
35 0.48 0.95 11.77 30.40
45 0.48 0.95 11.19 35.15
40 3.60
15 0.52 0.96 9.85 9.808
25 0.53 0.94 7.84 11.44
35 0.52 0.93 9.69 9.808
45 0.48 1.15 7.05 9.808
Table 4.1: The results obtained from laboratory experiment
From the results given in table 4.1, it is clear that resistivity of the soil decreases with
the higher moisture content and number of blows. For moisture content 25% shows
the value of resistivity for ranges 15 blows to 45 blows are from ranges 34.24ohm.m
to 20.15ohm.m, where else for moisture content 30% shows the value of resistivity
from ranges 26.19ohm.m to 20.78ohm.m, for moisture content 35% shows the value
of resistivity from ranges 14.07ohm.m to 11.19ohm.m, and lastly for moisture
content 40% shows the value of resistivity from ranges 9.85ohm.m to 7.05ohm.m.
27
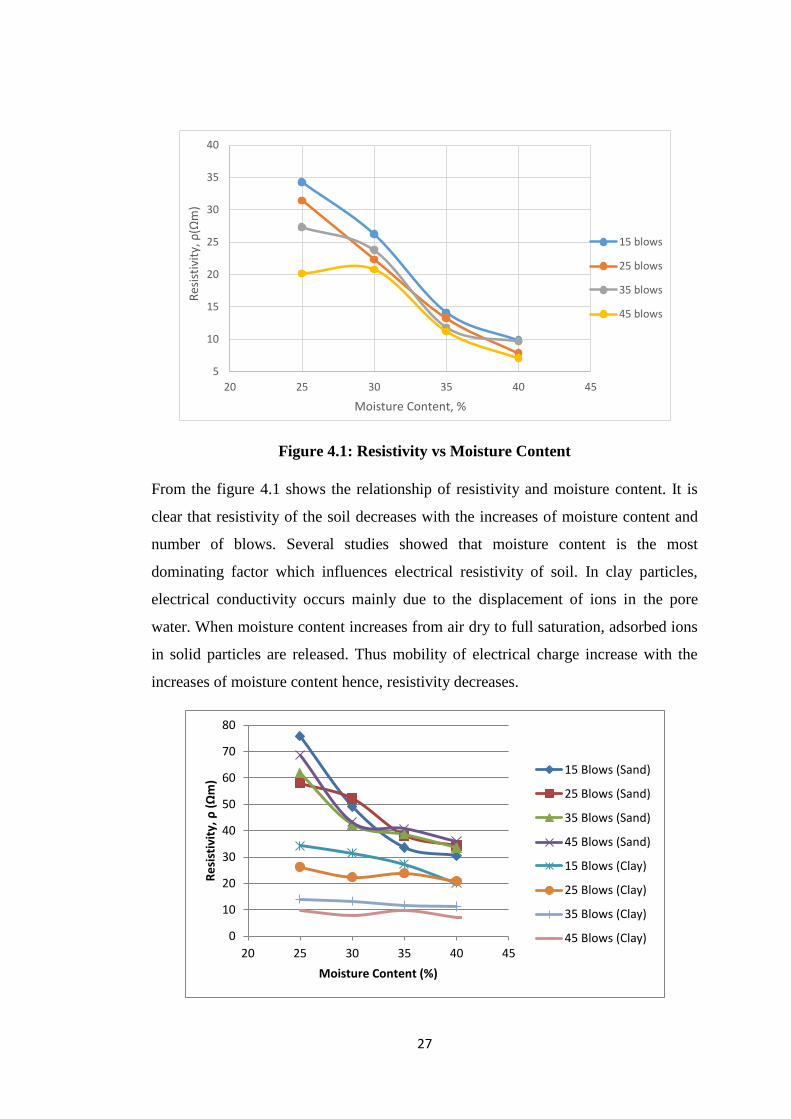
Figure 4.1: Resistivity vs Moisture Content
From the figure 4.1 shows the relationship of resistivity and moisture content. It is
clear that resistivity of the soil decreases with the increases of moisture content and
number of blows. Several studies showed that moisture content is the most
dominating factor which influences electrical resistivity of soil. In clay particles,
electrical conductivity occurs mainly due to the displacement of ions in the pore
water. When moisture content increases from air dry to full saturation, adsorbed ions
in solid particles are released. Thus mobility of electrical charge increase with the
increases of moisture content hence, resistivity decreases.
5
10
15
20
25
30
35
40
20 25 30 35 40 45
Res
isti
vity
, ρ(Ω
m)
Moisture Content, %
15 blows
25 blows
35 blows
45 blows
0
10
20
30
40
50
60
70
80
20 25 30 35 40 45
Re
sist
ivit
y, ρ
(Ω
m)
Moisture Content (%)
15 Blows (Sand)
25 Blows (Sand)
35 Blows (Sand)
45 Blows (Sand)
15 Blows (Clay)
25 Blows (Clay)
35 Blows (Clay)
45 Blows (Clay)
28
Figure 4.2: Multiple Combined Graphs of Resistivity vs Moisture Content
(Clay and Sand)
Graphs shows the combined of clay and sand types of soil. Overall shows that clay
soil have low resistivity values. This is due to the arrangement of soil particles for
clay which is close together compare to sand. Hence, mobility of electrical charge in
clay particles increase with the increases of moisture content, influence the resistivity
decreases less that sand.
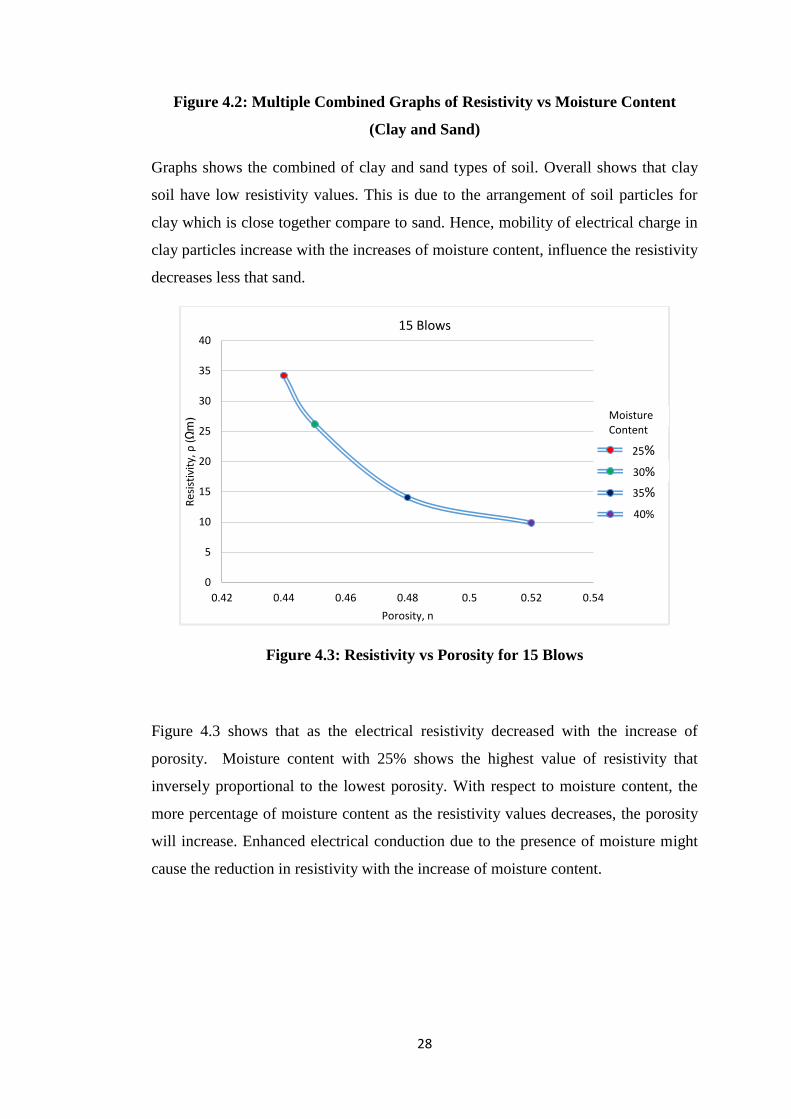
Figure 4.3: Resistivity vs Porosity for 15 Blows
Figure 4.3 shows that as the electrical resistivity decreased with the increase of
porosity. Moisture content with 25% shows the highest value of resistivity that
inversely proportional to the lowest porosity. With respect to moisture content, the
more percentage of moisture content as the resistivity values decreases, the porosity
will increase. Enhanced electrical conduction due to the presence of moisture might
cause the reduction in resistivity with the increase of moisture content.
0
5
10
15
20
25
30
35
40
0.42 0.44 0.46 0.48 0.5 0.52 0.54
Res
isti
vity
, ρ (Ωm)
Porosity, n
15 Blows
0.44
0.45
0.48
0.5240%
35%
30%
25%
Moisture Content
29
0
5
10
15
20
25
30
35
0.4 0.42 0.44 0.46 0.48 0.5 0.52 0.54
Res
isti
vity
, ρ IΩ
m)
Porosity, n
25 Blows
0.44
0.45
0.48
0.53
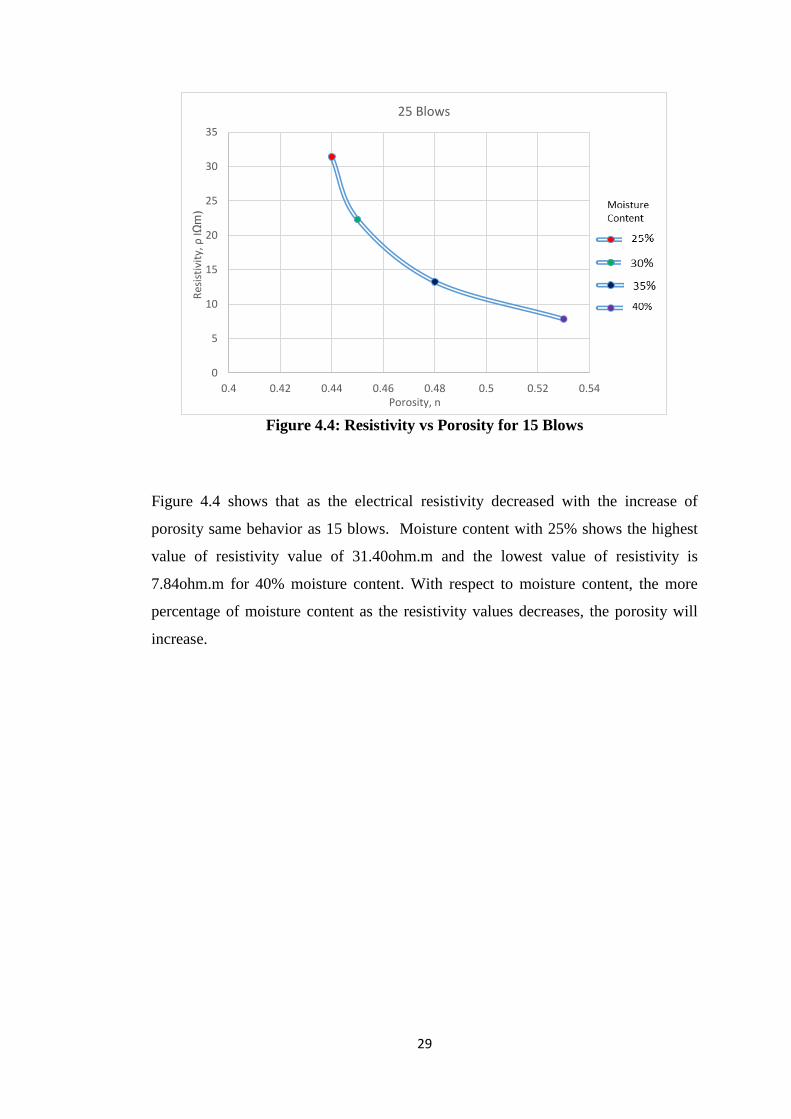
Figure 4.4: Resistivity vs Porosity for 15 Blows
Figure 4.4 shows that as the electrical resistivity decreased with the increase of
porosity same behavior as 15 blows. Moisture content with 25% shows the highest
value of resistivity value of 31.40ohm.m and the lowest value of resistivity is
7.84ohm.m for 40% moisture content. With respect to moisture content, the more
percentage of moisture content as the resistivity values decreases, the porosity will
increase.
30
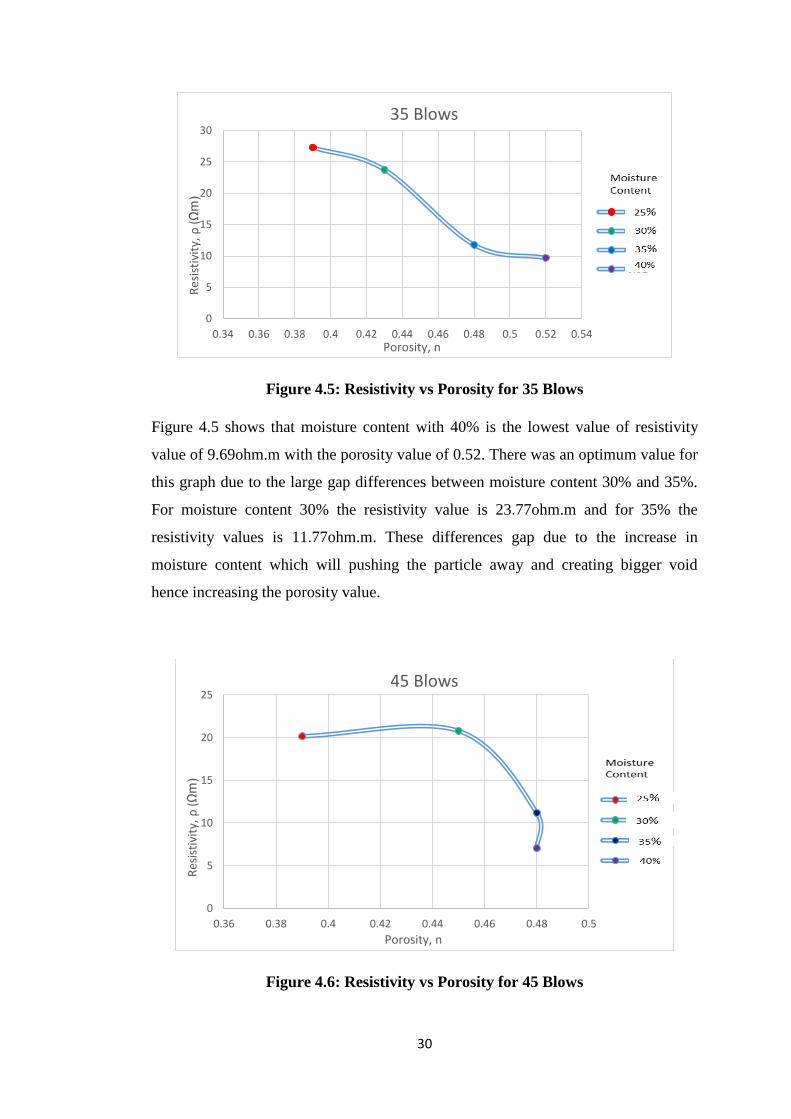
Figure 4.5: Resistivity vs Porosity for 35 Blows
Figure 4.5 shows that moisture content with 40% is the lowest value of resistivity
value of 9.69ohm.m with the porosity value of 0.52. There was an optimum value for
this graph due to the large gap differences between moisture content 30% and 35%.
For moisture content 30% the resistivity value is 23.77ohm.m and for 35% the
resistivity values is 11.77ohm.m. These differences gap due to the increase in
moisture content which will pushing the particle away and creating bigger void
hence increasing the porosity value.
Figure 4.6: Resistivity vs Porosity for 45 Blows
0
5
10
15
20
25
30
0.34 0.36 0.38 0.4 0.42 0.44 0.46 0.48 0.5 0.52 0.54
Res
isti
vity
, ρ
(Ωm)
Porosity, n
35 Blows
0.39
0.43
0.48
0.52
0
5
10
15
20
25
0.36 0.38 0.4 0.42 0.44 0.46 0.48 0.5
Res
isti
vity
, ρ
(Ωm)
Porosity, n
45 Blows
0.39
0.45
0.48
0.48
31
Figure 4.6 shows that highest resistivity value is 20.78ohm.m which for moisture
content 30%. This shows that the resistivity value initially increase than will
decreases. For 45 blows graph’s behavior is dissimilar with others due to its own
phenomena for this type of soil. Therefore, more experiments and tests should be
done to obtain the exact behavior of this 45blows of resistivity’s value. But
generally electrical resistivity decreased with the increase of porosity.
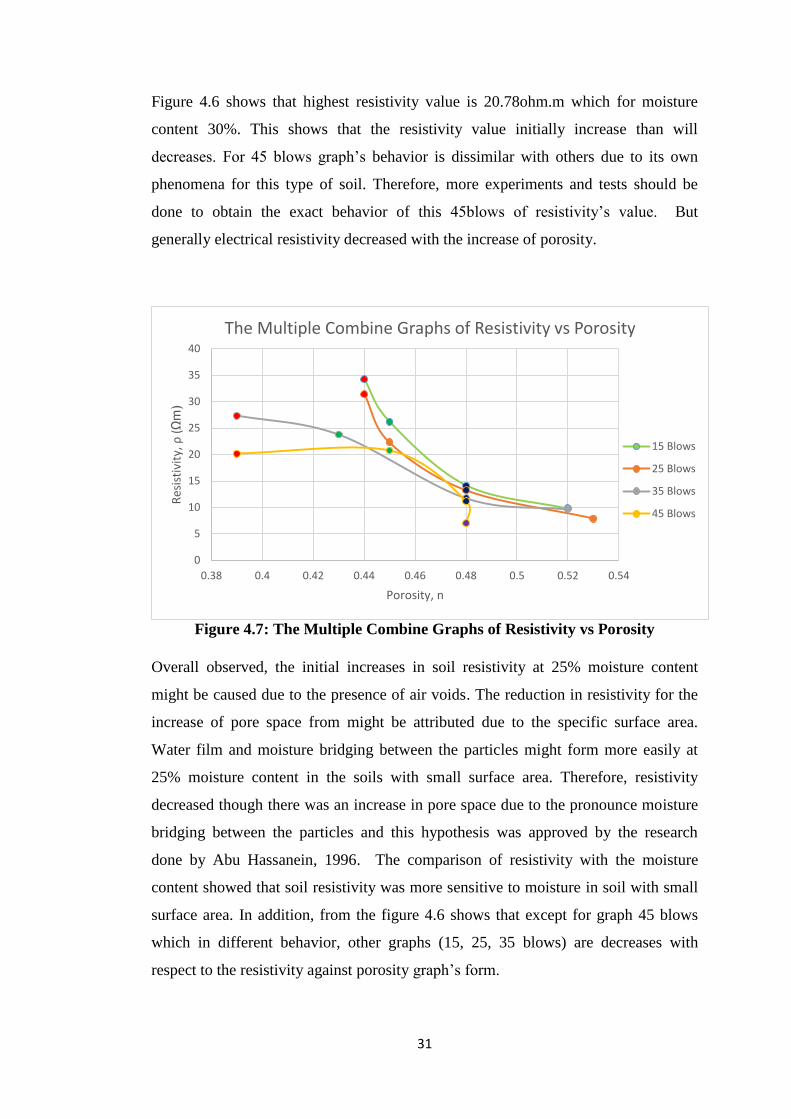
Figure 4.7: The Multiple Combine Graphs of Resistivity vs Porosity
Overall observed, the initial increases in soil resistivity at 25% moisture content
might be caused due to the presence of air voids. The reduction in resistivity for the
increase of pore space from might be attributed due to the specific surface area.
Water film and moisture bridging between the particles might form more easily at
25% moisture content in the soils with small surface area. Therefore, resistivity
decreased though there was an increase in pore space due to the pronounce moisture
bridging between the particles and this hypothesis was approved by the research
done by Abu Hassanein, 1996. The comparison of resistivity with the moisture
content showed that soil resistivity was more sensitive to moisture in soil with small
surface area. In addition, from the figure 4.6 shows that except for graph 45 blows
which in different behavior, other graphs (15, 25, 35 blows) are decreases with
respect to the resistivity against porosity graph’s form.
0
5
10
15
20
25
30
35
40
0.38 0.4 0.42 0.44 0.46 0.48 0.5 0.52 0.54
Res
isti
vity
, ρ
(Ωm)
Porosity, n
The Multiple Combine Graphs of Resistivity vs Porosity
15 Blows
25 Blows
35 Blows
45 Blows
32
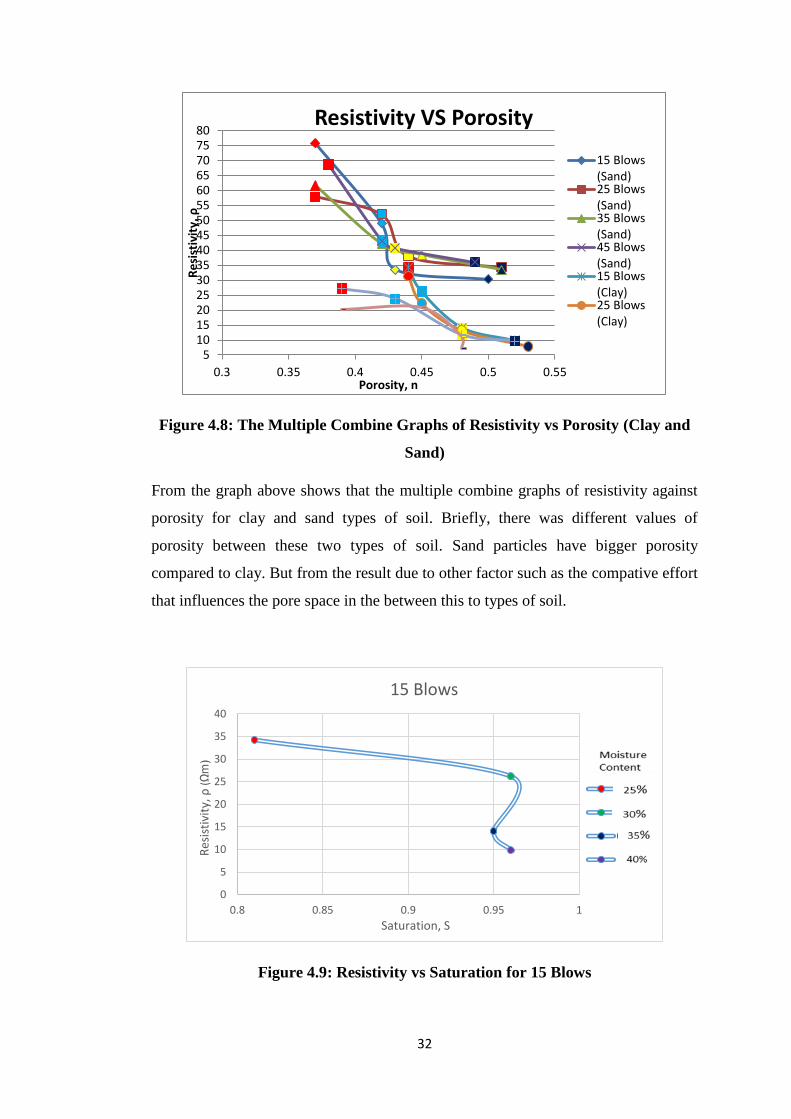
Figure 4.8: The Multiple Combine Graphs of Resistivity vs Porosity (Clay and
Sand)
From the graph above shows that the multiple combine graphs of resistivity against
porosity for clay and sand types of soil. Briefly, there was different values of
porosity between these two types of soil. Sand particles have bigger porosity
compared to clay. But from the result due to other factor such as the compative effort
that influences the pore space in the between this to types of soil.
Figure 4.9: Resistivity vs Saturation for 15 Blows
5101520253035404550556065707580
0.3 0.35 0.4 0.45 0.5 0.55
Re
sist
ivit
y, ρ
Porosity, n
Resistivity VS Porosity
15 Blows(Sand)25 Blows(Sand)35 Blows(Sand)45 Blows(Sand)15 Blows(Clay)25 Blows(Clay)
0
5
10
15
20
25
30
35
40
0.8 0.85 0.9 0.95 1
Res
isti
vity
, ρ
(Ωm)
Saturation, S
15 Blows
0.81
0.96
0.95
0.96
33
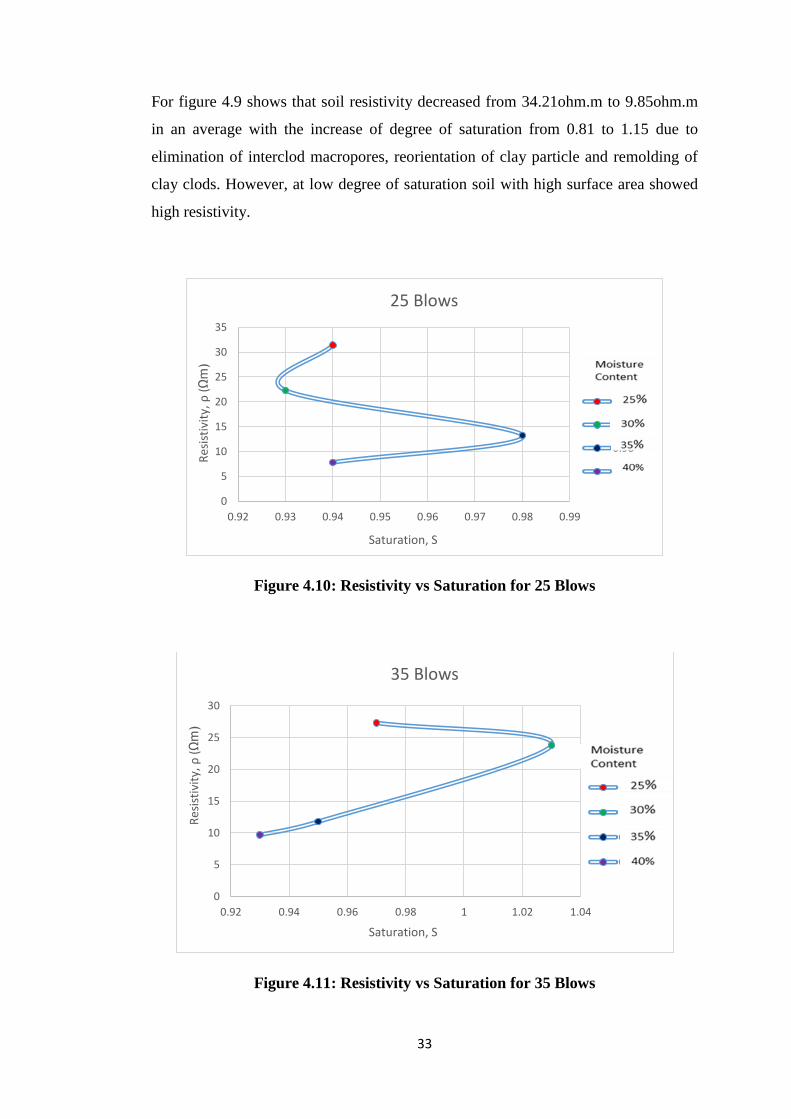
For figure 4.9 shows that soil resistivity decreased from 34.21ohm.m to 9.85ohm.m
in an average with the increase of degree of saturation from 0.81 to 1.15 due to
elimination of interclod macropores, reorientation of clay particle and remolding of
clay clods. However, at low degree of saturation soil with high surface area showed
high resistivity.
Figure 4.10: Resistivity vs Saturation for 25 Blows
Figure 4.11: Resistivity vs Saturation for 35 Blows
0
5
10
15
20
25
30
35
0.92 0.93 0.94 0.95 0.96 0.97 0.98 0.99
Res
isti
vity
, ρ
(Ωm)
Saturation, S
25 Blows
0.94
0.93
0.98
0.94
0
5
10
15
20
25
30
0.92 0.94 0.96 0.98 1 1.02 1.04
Res
isti
vity
, ρ
(Ωm)
Saturation, S
35 Blows
0.97
1.03
0.95
0.93
34
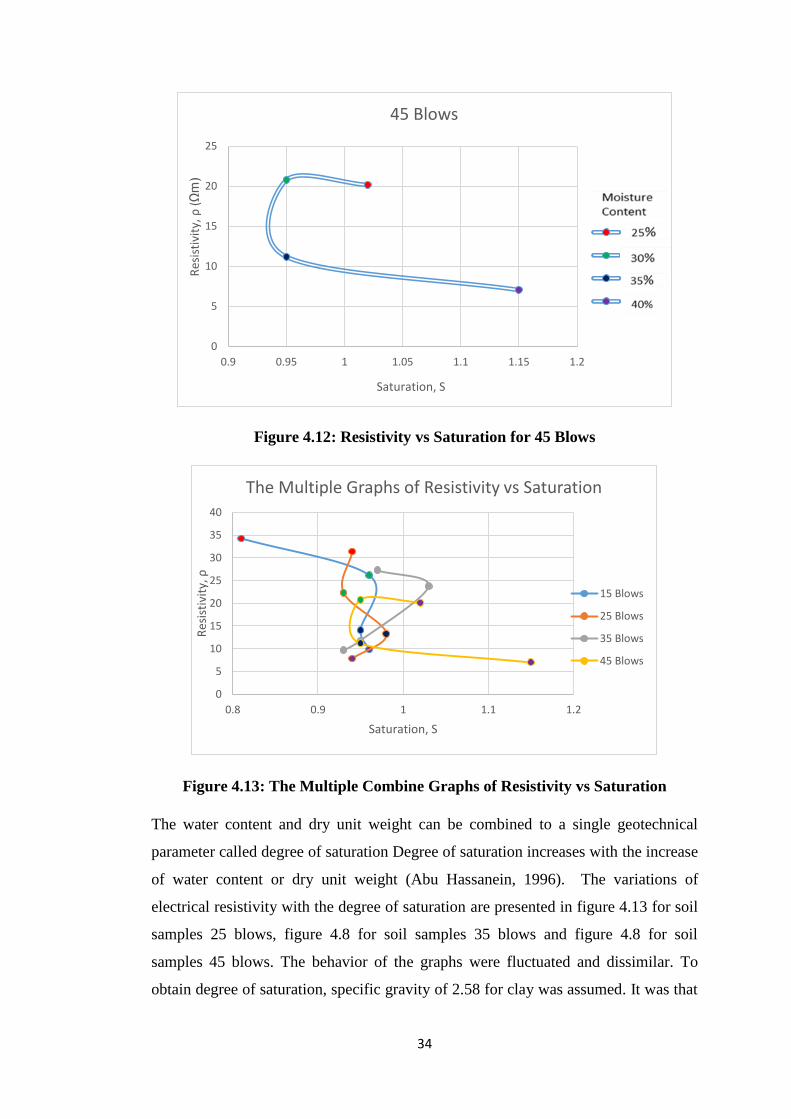
Figure 4.12: Resistivity vs Saturation for 45 Blows
Figure 4.13: The Multiple Combine Graphs of Resistivity vs Saturation
The water content and dry unit weight can be combined to a single geotechnical
parameter called degree of saturation Degree of saturation increases with the increase
of water content or dry unit weight (Abu Hassanein, 1996). The variations of
electrical resistivity with the degree of saturation are presented in figure 4.13 for soil
samples 25 blows, figure 4.8 for soil samples 35 blows and figure 4.8 for soil
samples 45 blows. The behavior of the graphs were fluctuated and dissimilar. To
obtain degree of saturation, specific gravity of 2.58 for clay was assumed. It was that
0
5
10
15
20
25
0.9 0.95 1 1.05 1.1 1.15 1.2
Res
isti
vity
, ρ
(Ωm)
Saturation, S
45 Blows
1.02
0.95
0.95
1.15
0
5
10
15
20
25
30
35
40
0.8 0.9 1 1.1 1.2
Res
isti
vity
, ρ
Saturation, S
The Multiple Graphs of Resistivity vs Saturation
15 Blows
25 Blows
35 Blows
45 Blows
35
soil resistivity decreased with the increase of degree of saturation. Increase in degree
of saturation yields changes in clay clods, reduction in interclod macro voids and
orientation of clay particles (Khalil and Santos, n.d). Therefore, briefly observed
from the graphs, soil resistivity decreased with the increase in degree of saturation.
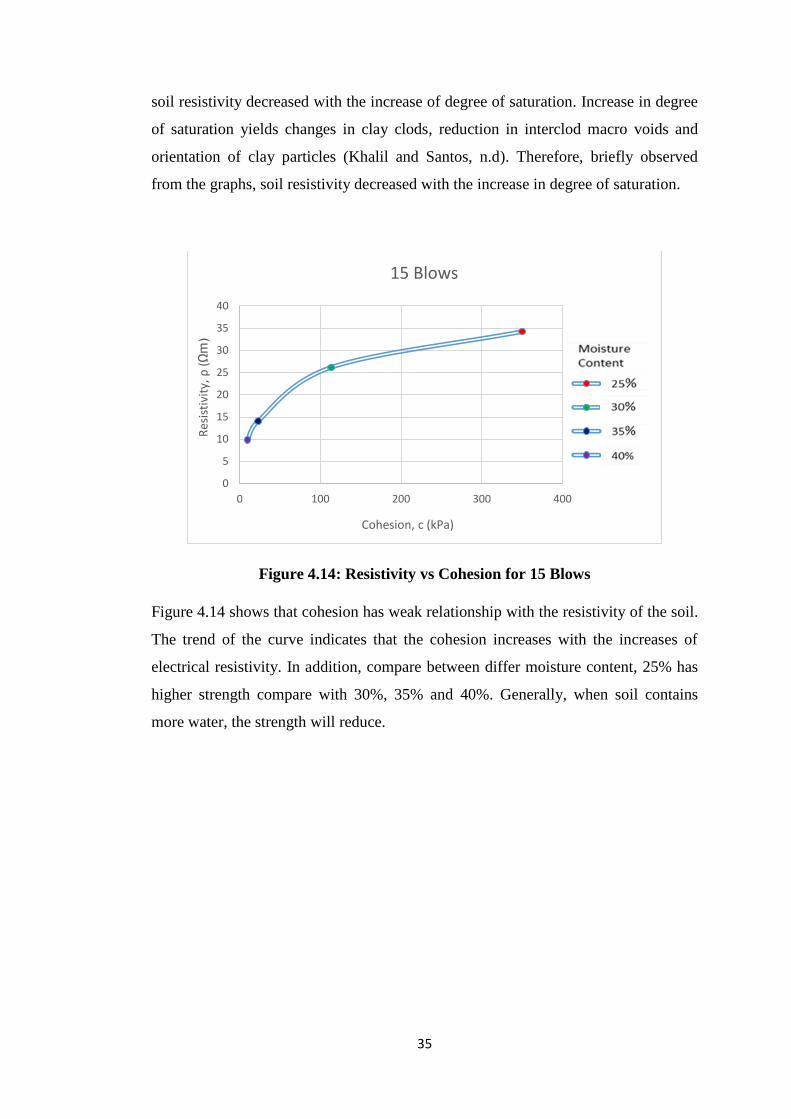
Figure 4.14: Resistivity vs Cohesion for 15 Blows
Figure 4.14 shows that cohesion has weak relationship with the resistivity of the soil.
The trend of the curve indicates that the cohesion increases with the increases of
electrical resistivity. In addition, compare between differ moisture content, 25% has
higher strength compare with 30%, 35% and 40%. Generally, when soil contains
more water, the strength will reduce.
0
5
10
15
20
25
30
35
40
0 100 200 300 400
Res
isti
vity
, ρ
(Ωm)
Cohesion, c (kPa)
15 Blows
350.14
113.61
22.89
9.808
36
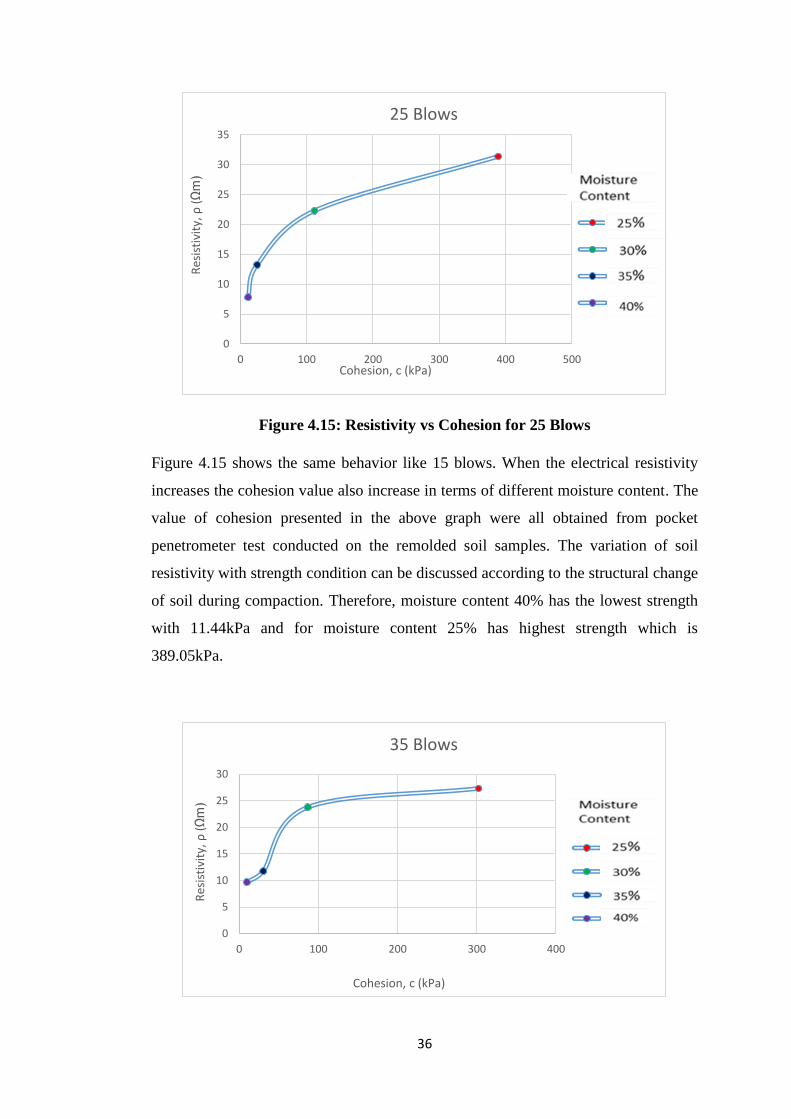
Figure 4.15: Resistivity vs Cohesion for 25 Blows
Figure 4.15 shows the same behavior like 15 blows. When the electrical resistivity
increases the cohesion value also increase in terms of different moisture content. The
value of cohesion presented in the above graph were all obtained from pocket
penetrometer test conducted on the remolded soil samples. The variation of soil
resistivity with strength condition can be discussed according to the structural change
of soil during compaction. Therefore, moisture content 40% has the lowest strength
with 11.44kPa and for moisture content 25% has highest strength which is
389.05kPa.
0
5
10
15
20
25
30
35
0 100 200 300 400 500
Res
isti
vity
, ρ
(Ωm)
Cohesion, c (kPa)
25 Blows
389.05
111.97
25.34
11.44
0
5
10
15
20
25
30
0 100 200 300 400
Res
isti
vity
, ρ
(Ωm)
Cohesion, c (kPa)
35 Blows
302.41
86.64
30.4
9.808
37
Figure 4.16: Resistivity vs Cohesion for 35 Blows
It is interesting to find out the correlation between cohesion and electrical resistivity
for clay soil as shown in Figure 4.11 are also same with other behavior of the graphs.
The clay clods are difficult to remold and interclod pores are large when compacted
at higher moisture content. The pores are filled with dielectric air at this condition.
The contact between the particles is poor because of the presence of distinct clods at
low strength. Therefore, resistivity was decreases at higher cohesive soils due to the
presence of air filled voids and poor particle-to-particle contact.
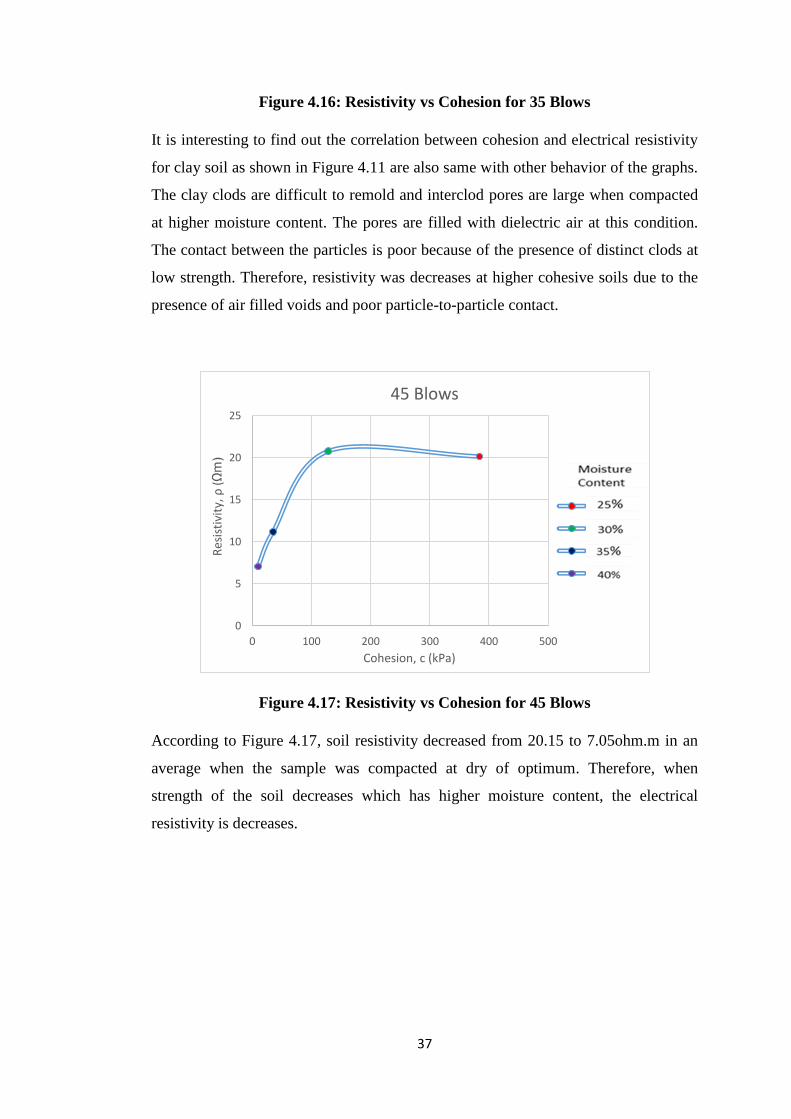
Figure 4.17: Resistivity vs Cohesion for 45 Blows
According to Figure 4.17, soil resistivity decreased from 20.15 to 7.05ohm.m in an
average when the sample was compacted at dry of optimum. Therefore, when
strength of the soil decreases which has higher moisture content, the electrical
resistivity is decreases.
0
5
10
15
20
25
0 100 200 300 400 500
Res
isti
vity
, ρ
(Ωm)
Cohesion, c (kPa)
45 Blows
384.15
128.32
35.15
9.808
38
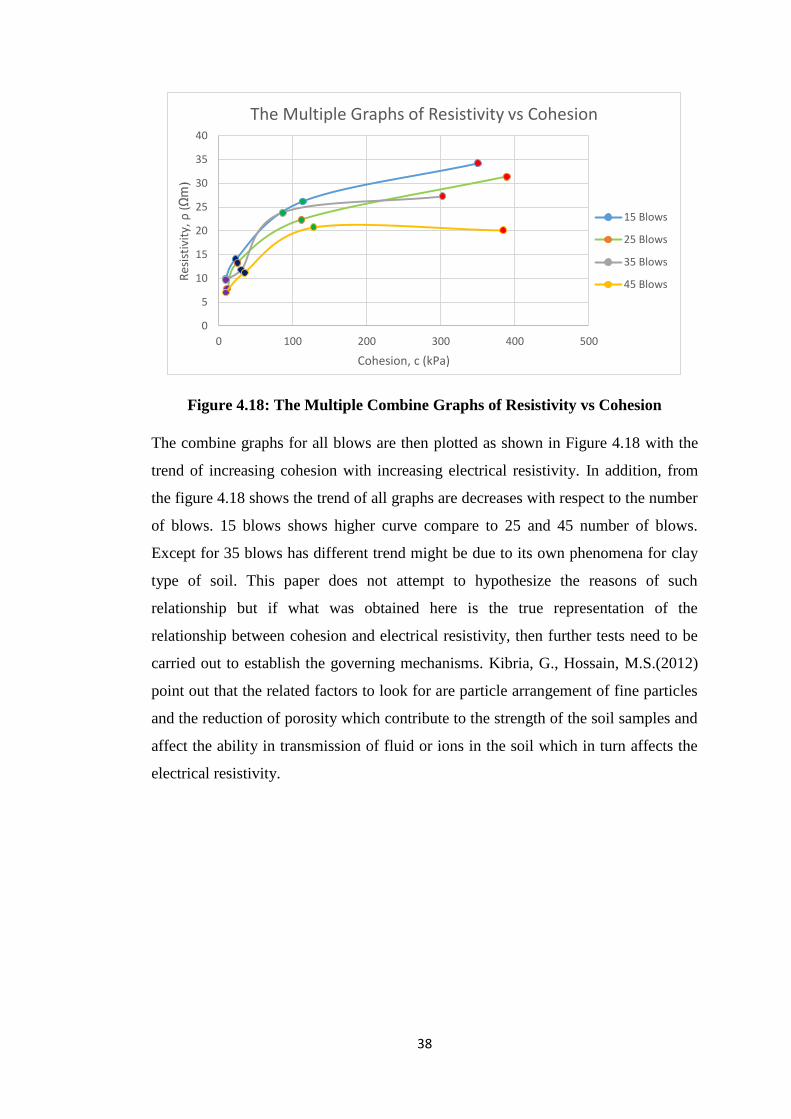
Figure 4.18: The Multiple Combine Graphs of Resistivity vs Cohesion
The combine graphs for all blows are then plotted as shown in Figure 4.18 with the
trend of increasing cohesion with increasing electrical resistivity. In addition, from
the figure 4.18 shows the trend of all graphs are decreases with respect to the number
of blows. 15 blows shows higher curve compare to 25 and 45 number of blows.
Except for 35 blows has different trend might be due to its own phenomena for clay
type of soil. This paper does not attempt to hypothesize the reasons of such
relationship but if what was obtained here is the true representation of the
relationship between cohesion and electrical resistivity, then further tests need to be
carried out to establish the governing mechanisms. Kibria, G., Hossain, M.S.(2012)
point out that the related factors to look for are particle arrangement of fine particles
and the reduction of porosity which contribute to the strength of the soil samples and
affect the ability in transmission of fluid or ions in the soil which in turn affects the
electrical resistivity.
0
5
10
15
20
25
30
35
40
0 100 200 300 400 500
Res
isti
vity
, ρ
(Ωm)
Cohesion, c (kPa)
The Multiple Graphs of Resistivity vs Cohesion
15 Blows
25 Blows
35 Blows
45 Blows
39
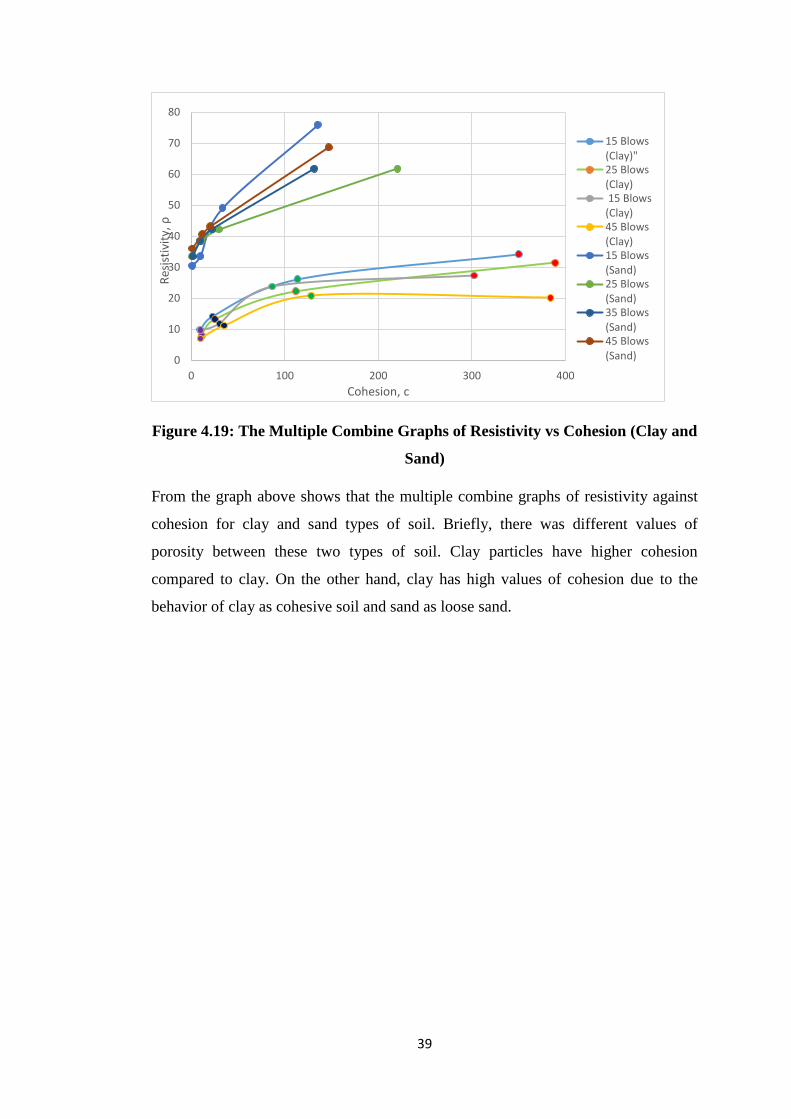
Figure 4.19: The Multiple Combine Graphs of Resistivity vs Cohesion (Clay and
Sand)
From the graph above shows that the multiple combine graphs of resistivity against
cohesion for clay and sand types of soil. Briefly, there was different values of
porosity between these two types of soil. Clay particles have higher cohesion
compared to clay. On the other hand, clay has high values of cohesion due to the
behavior of clay as cohesive soil and sand as loose sand.
0
10
20
30
40
50
60
70
80
0 100 200 300 400
Res
isti
vity
, ρ
Cohesion, c
15 Blows(Clay)"25 Blows(Clay) 15 Blows(Clay)45 Blows(Clay)15 Blows(Sand)25 Blows(Sand)35 Blows(Sand)45 Blows(Sand)
40
CHAPTER 5
CONCLUSION AND RECEMMENDATION
5.1 Conclusion
The purpose of the study was to determine the effects of porosity and
saturation on electrical resistivity and strength of soil for clay particle. Soil samples
with particular specification were bought from supplier. Soil resistivity tests were
conducted at different condition to identify the relationship with liquid limit, plastic
limit, compaction, pH value and moisture content.
Basic laboratory tests and simple electrical resistivity test using basic
multimeter were conducted to obtain the correlations between electrical resistivity
and some soil parameters. The results showed that when porosity increases,
resistivity decreases. Also showed when resistivity increased the cohesion increased.
The relationship between resistivity and porosity and resistivity and cohesion showed
similarities and behaves which supported the early study done by Abu-Hassanaein, et
all. (1996) and Turesson (2005).
On the other hand, for saturation indicated behavior which when the
saturation increases, the resistivity value decreases. From the results and graphs
analyzed, some unique trends of behavior were observed for relationship between
resistivity and saturation. Hence, more investigation and experiments need to be
conducted in order to achieve more precise correlations.
Within the limitation of this research at this point of time, it is sufficient to
say that crude correlations were established between resistivity and some selected
soil parameters given in the results. The relationship between soil resistivity and
different geotechnical parameters has the potential to fill the gap between
geotechnical and geophysical engineering site investigations. By developing the
correlations of electrical resistivity of soil with geotechnical parameters, electrical
resistivity can be used extensively for geotechnical site investigation.
41
5.2 Recommendation for Future Study
The developed relationship between soil resistivity and geotechnical
parameters of soil are site specific. More research is required to develop
relationship between soil resistivity with geotechnical properties that can
be applicable for different place and type of soils.
Correlation of soil moisture, strength and electrical resistivity can be
determined by in-situ testing and laboratory investigation on undisturbed
sample.
More research can be conducted to identify the relationship between
saturation and electrical resistivity of soil.
Statistical analysis can be done to introduce a model. The model of soil
resistivity should incorporate all the factors affecting soil resistivity.
Moreover, the model should be validated by electrical resistivity results,
in-situ test results and laboratory test results
42
REFERENCES
Abu-Hassanein, Z.S., Benson, C.H., and Blotz, L.R.(1996). Electrical Resistivity of
Compacted Clays. Journal Geotech Engineering. Vol.122:397-406.
Adegboyega G, A.G., and Odeyemi, K.O. (2011). “Assessment of Soil Resistivity on
Grounding of Electrical Systems: A Case Study of North-East Zone, Nigeria.
Journal of Academic and AppliedStudies. Vol. 1(3), pp28-38.
Das, M.B (2010). Principal of Geotechnical Engineering. 7th
Edition SI Edition
Das, M.B (2002). Soil Mechanics Laboratory Manual. College of Engineering and
Computer Science. California State University, Sacramento.6th
Edition
F. Ozcep., O. Tezel, and M. Asci, (2009). Correlation between electrical resistivity
and soil-water content: Istanbul and Golcuk, International Journal of Physical
Sciences, Vol 4(6), pg 362-365.
Giao, P., Chung, S., Kim, D., and Tanaka, H. (2003). "Electric imaging and
laboratory resistivity testing for geotechnical investigation of Pusan clay
deposits." J.Appl.Geophys., 52(4), 157-175.
Hallenburg, J.K (1997). Non-Hydrocarbon Methods of Geophysical Formation
Evaluation. Resistivity Method. Pg1-Pg22
Kibria, G., Hossain, M.S.(2012). Investigation of Geotechnical Parameters Affecting
Electrical Resistivity of Compacted Clays. Journal of Geotechnical and
Geoevironmental Engineering.138:1520-1529
Khalil, M.A and Santos, A.M.(n.d). Influence of Degree of Saturation in the Electric
Resistivity-Hydraulic Conductivity Relationship. Retrieved by
www.intechopen.com
P.H. Gio, S.G. Chung, D.Y. Kim, and H. Tanaka (2003). “Electric imaging and
laboratory resistivity testing for geotechnical investigation of Pusan clay
deposit,” Journal of Applied Geophysics. Vol 52, pg 157-175.
R.J. Kalinski and W.E. Kelly (1994) “Electrical-resistivity measurement for
evaluating compacted soil liners.” Journal of Geotechnical Engineering- ASCE,
Vol 120,pg 451-457.
43
Samouëlian, A., Cousin, I., Tabbagh, A., Bruand, A., and Richard, G. (2004).
Electrical Resistivity Survey in Soil Science: A review. Journal of Soil & Tillage
Research 83 173-193. Retrieved by www.sciencedirect.com
Seladji, S., Cosenza, P.,Tabbagh, A., Ranger, J and Richard, G. (2012) The Effects of
Compaction on Soil Electrical Resistivity: Laboratory Investigation. European
Journal of Soil Science.
Siddiqui, F.I, Syed-Osman, S.B.A (2012). Integrating Geo-Electrical and
Geotechnical Data for Soil Characterization. International Journal of Applied
Physics and Mathematics. Vol 2 (2).
Siddiqui, F.I, Syed-Osman, S.B.A (n.d) Comparing Electrical Resisitivity Values of
Subsurface Soil Obtained from Field and Laboratory Investigation.
Sudha, K., Israil, M., Mittal, S., and Rai, J. (2009). "Soil characterization using
electrical resistivity tomography and geotechnical investigations." J. Appl.
Geophys., 67(1), 74-79.
Syed Osman, S.B.A, Tuan Harith, Z.Z (n.d) Correlation of Electrical Resistivity with
Some Soil Properties For Predicting Safety Factor of Slopes UsingMultimeter.
Turesson, A. (2005). Water Content and Porosity Estimated from Ground-
penetrating Radar and Resistivity. Journal of Applied Geophysics 58:99-111.
Retrieved by www.sciencedirect.com
APPENDICES
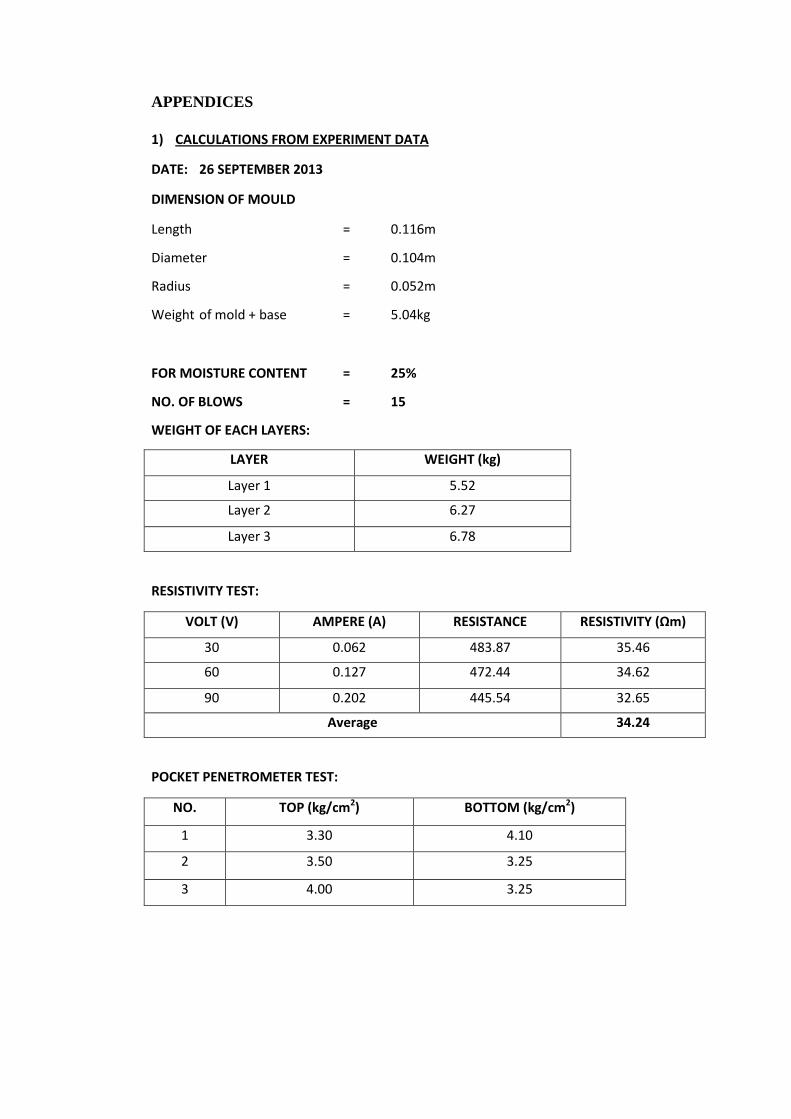
1) CALCULATIONS FROM EXPERIMENT DATA
DATE: 26 SEPTEMBER 2013
DIMENSION OF MOULD
Length = 0.116m
Diameter = 0.104m
Radius = 0.052m
Weight of mold + base = 5.04kg
FOR MOISTURE CONTENT = 25%
NO. OF BLOWS = 15
WEIGHT OF EACH LAYERS:
LAYER WEIGHT (kg)
Layer 1 5.52
Layer 2 6.27
Layer 3 6.78
RESISTIVITY TEST:
VOLT (V) AMPERE (A) RESISTANCE RESISTIVITY (Ωm)
30 0.062 483.87 35.46
60 0.127 472.44 34.62
90 0.202 445.54 32.65
Average 34.24
POCKET PENETROMETER TEST:
NO. TOP (kg/cm2) BOTTOM (kg/cm2)
1 3.30 4.10
2 3.50 3.25
3 4.00 3.25
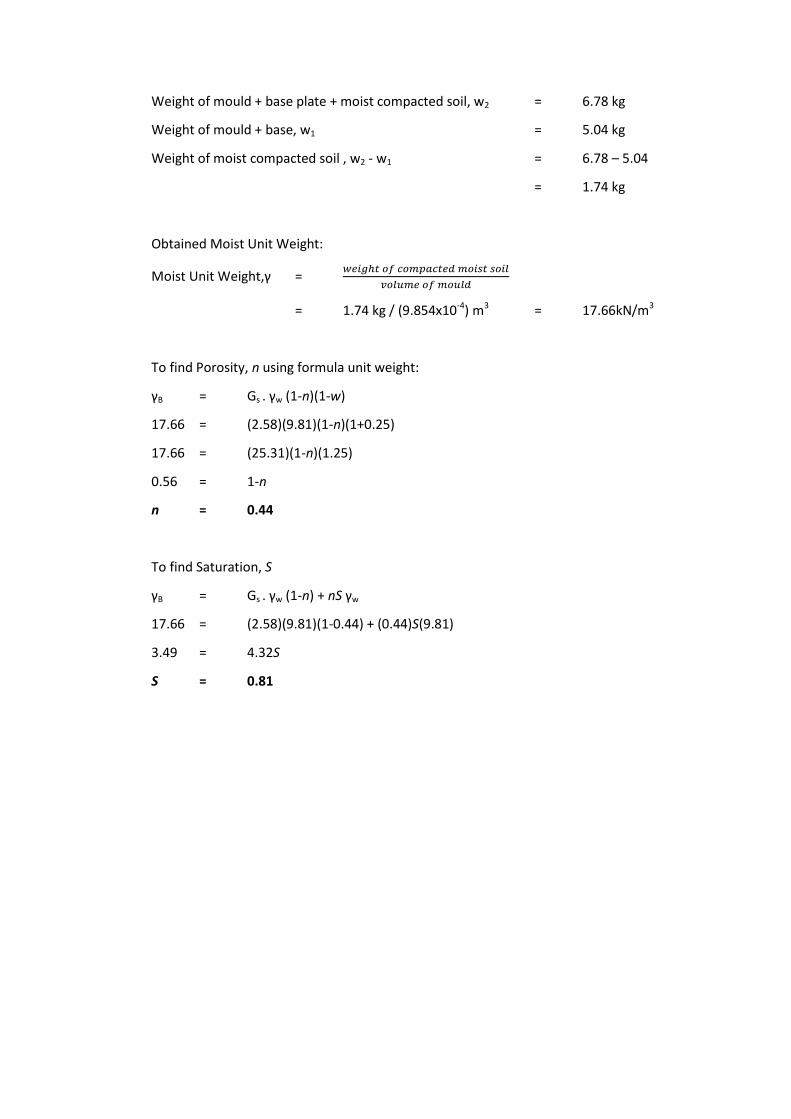
Weight of mould + base plate + moist compacted soil, w2 = 6.78 kg
Weight of mould + base, w1 = 5.04 kg
Weight of moist compacted soil , w2 - w1 = 6.78 – 5.04
= 1.74 kg
Obtained Moist Unit Weight:
Moist Unit Weight,γ =
= 1.74 kg / (9.854x10⁻⁴) m3 = 17.66kN/m3
To find Porosity, n using formula unit weight:
γB = Gs . γw (1-n)(1-w)
17.66 = (2.58)(9.81)(1-n)(1+0.25)
17.66 = (25.31)(1-n)(1.25)
0.56 = 1-n
n = 0.44
To find Saturation, S
γB = Gs . γw (1-n) + nS γw
17.66 = (2.58)(9.81)(1-0.44) + (0.44)S(9.81)
3.49 = 4.32S
S = 0.81
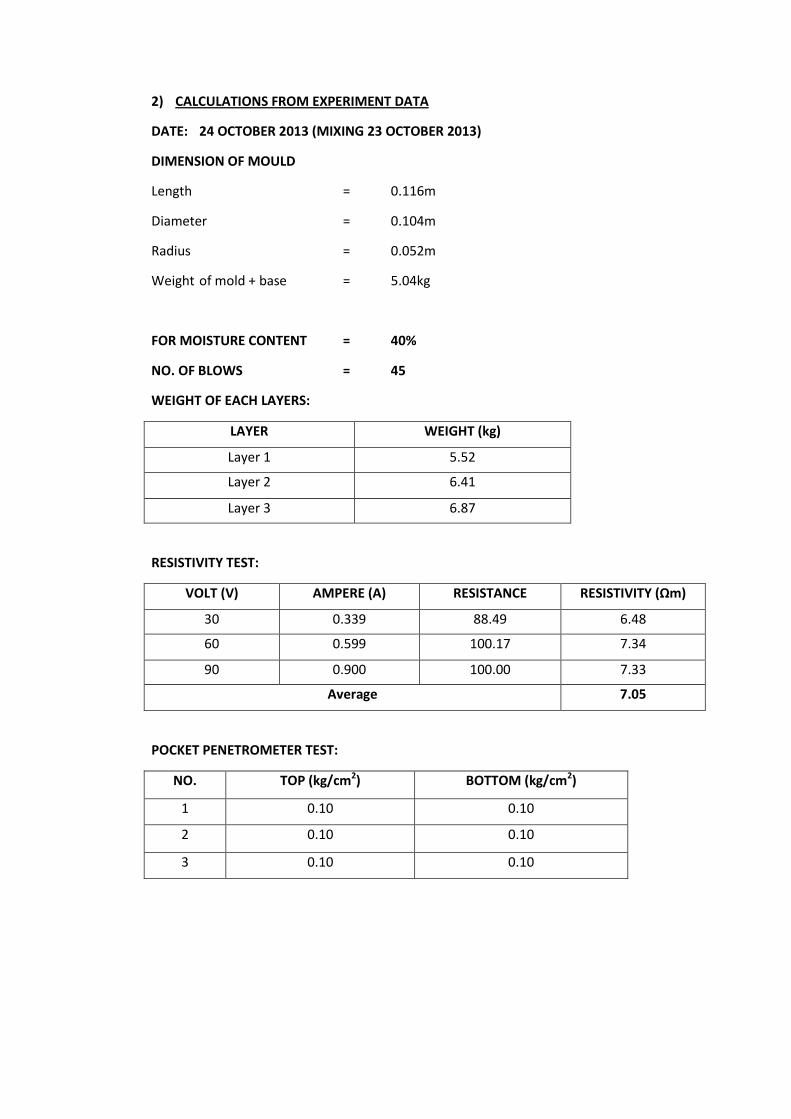
2) CALCULATIONS FROM EXPERIMENT DATA
DATE: 24 OCTOBER 2013 (MIXING 23 OCTOBER 2013)
DIMENSION OF MOULD
Length = 0.116m
Diameter = 0.104m
Radius = 0.052m
Weight of mold + base = 5.04kg
FOR MOISTURE CONTENT = 40%
NO. OF BLOWS = 45
WEIGHT OF EACH LAYERS:
LAYER WEIGHT (kg)
Layer 1 5.52
Layer 2 6.41
Layer 3 6.87
RESISTIVITY TEST:
VOLT (V) AMPERE (A) RESISTANCE RESISTIVITY (Ωm)
30 0.339 88.49 6.48
60 0.599 100.17 7.34
90 0.900 100.00 7.33
Average 7.05
POCKET PENETROMETER TEST:
NO. TOP (kg/cm2) BOTTOM (kg/cm2)
1 0.10 0.10
2 0.10 0.10
3 0.10 0.10
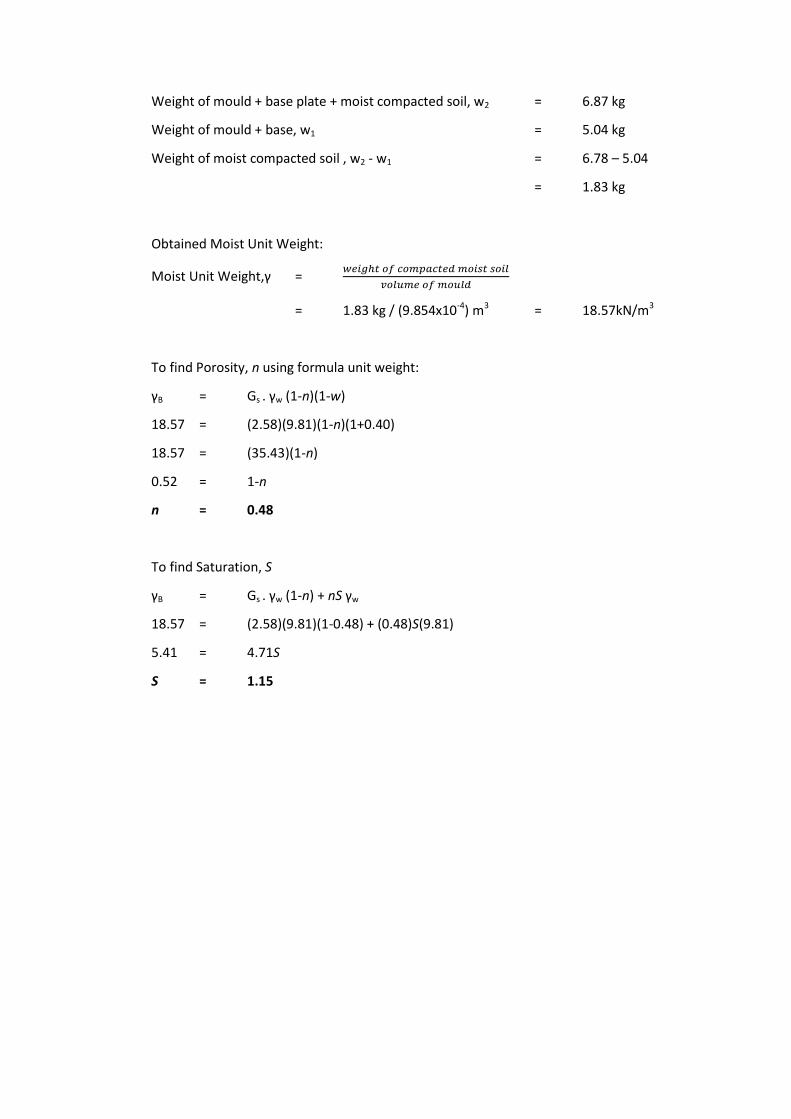
Weight of mould + base plate + moist compacted soil, w2 = 6.87 kg
Weight of mould + base, w1 = 5.04 kg
Weight of moist compacted soil , w2 - w1 = 6.78 – 5.04
= 1.83 kg
Obtained Moist Unit Weight:
Moist Unit Weight,γ =
= 1.83 kg / (9.854x10⁻⁴) m3 = 18.57kN/m3
To find Porosity, n using formula unit weight:
γB = Gs . γw (1-n)(1-w)
18.57 = (2.58)(9.81)(1-n)(1+0.40)
18.57 = (35.43)(1-n)
0.52 = 1-n
n = 0.48
To find Saturation, S
γB = Gs . γw (1-n) + nS γw
18.57 = (2.58)(9.81)(1-0.48) + (0.48)S(9.81)
5.41 = 4.71S
S = 1.15
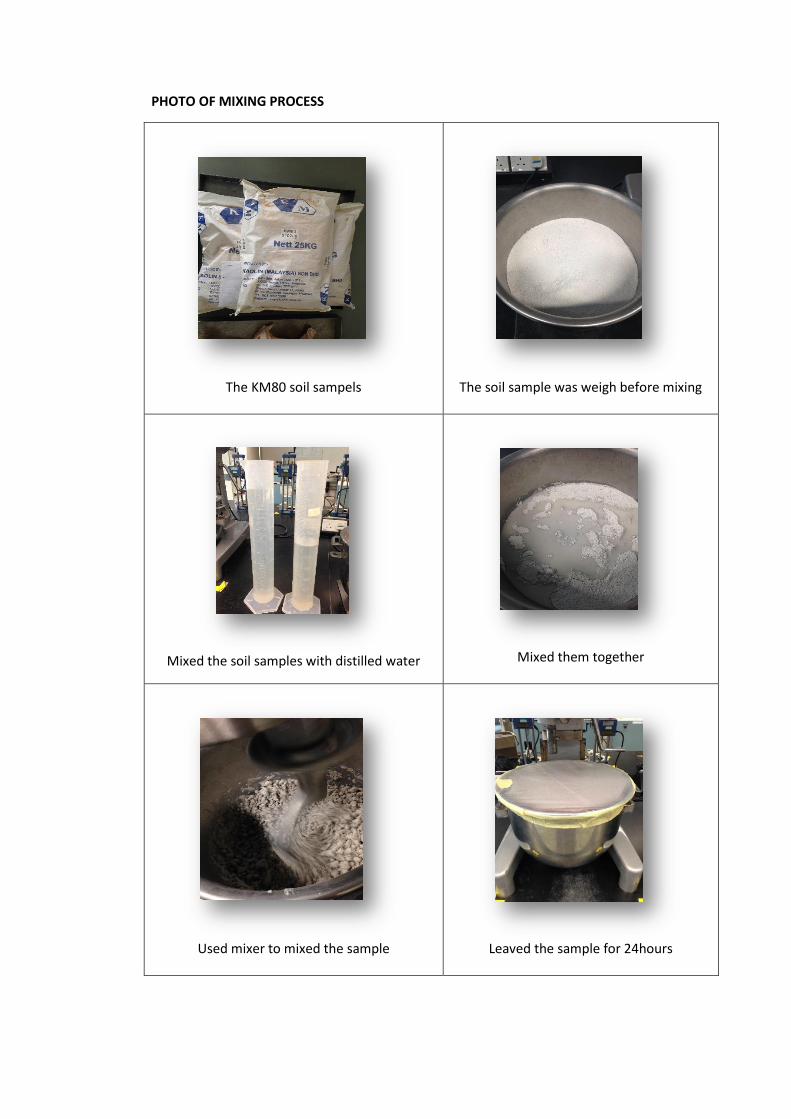
PHOTO OF MIXING PROCESS
The KM80 soil sampels
The soil sample was weigh before mixing
Mixed the soil samples with distilled water
Mixed them together
Used mixer to mixed the sample
Leaved the sample for 24hours

PHOTO OF COMPACTION TEST
Sample was compacted layer by layer
Using a Standard Proctor Hammer
The 3rd layer was weight
The apparatus that been used for
compaction test
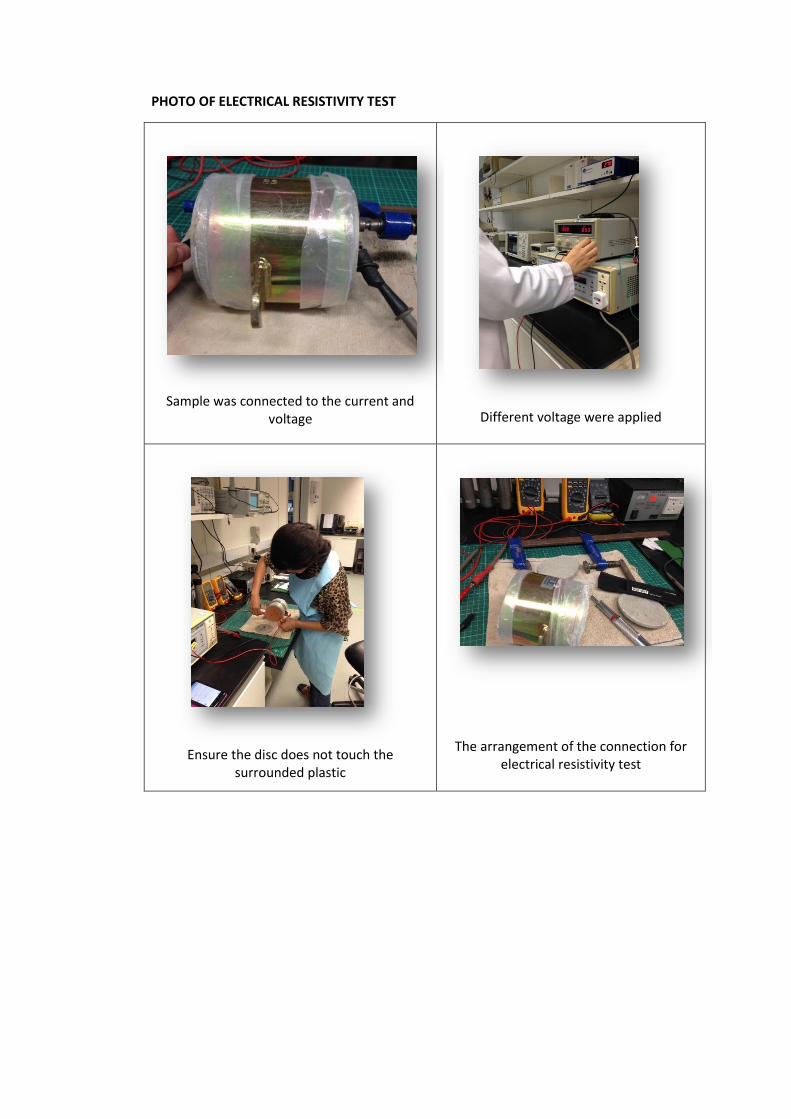
PHOTO OF ELECTRICAL RESISTIVITY TEST
Sample was connected to the current and
voltage
Different voltage were applied
Ensure the disc does not touch the
surrounded plastic
The arrangement of the connection for electrical resistivity test
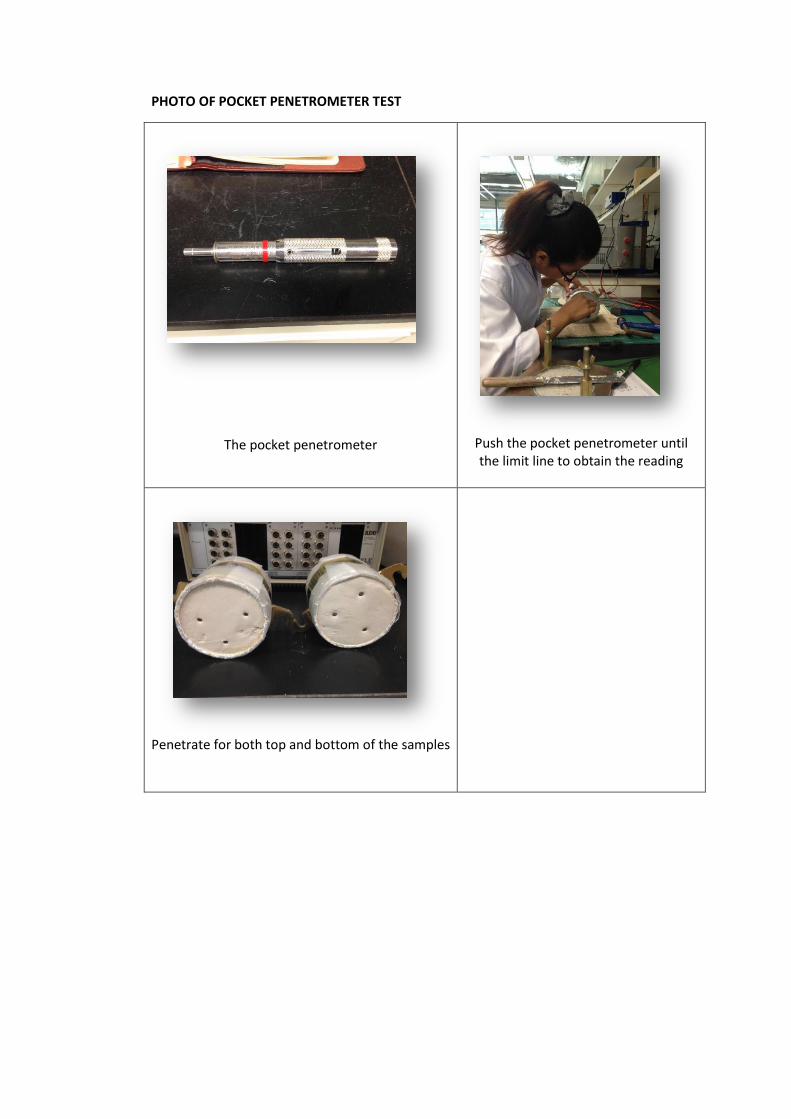
PHOTO OF POCKET PENETROMETER TEST
The pocket penetrometer
Push the pocket penetrometer until the limit line to obtain the reading
Penetrate for both top and bottom of the samples
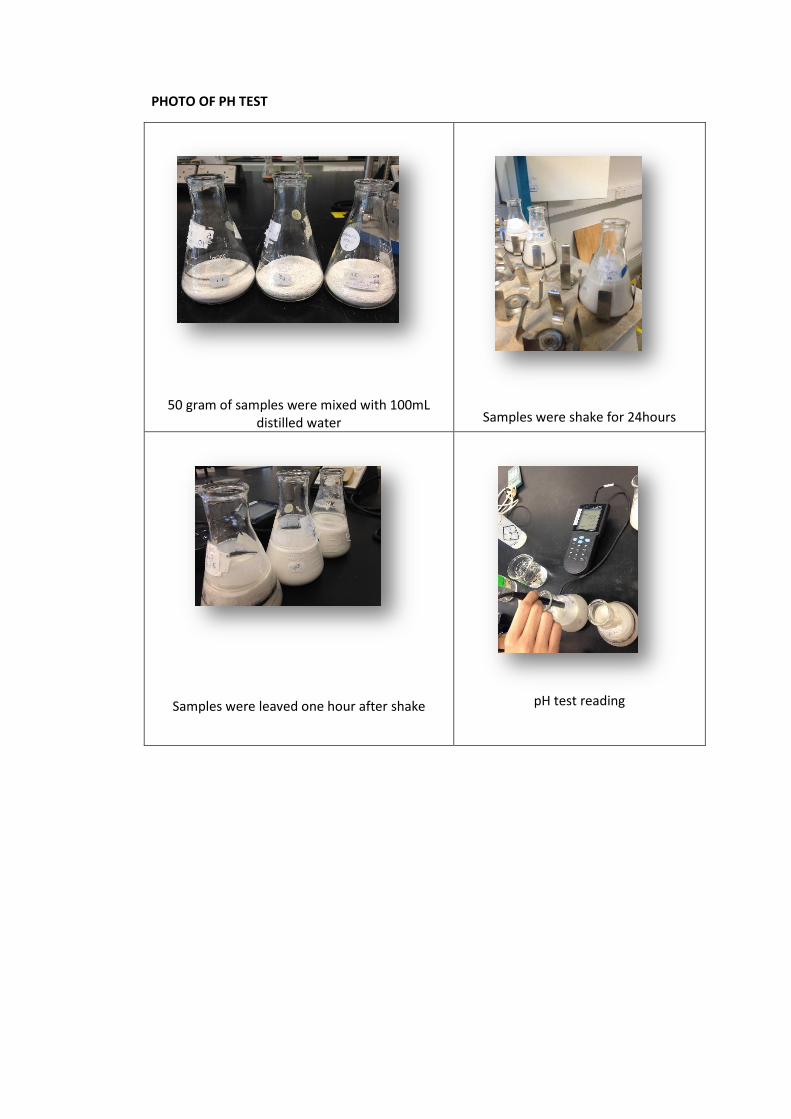
PHOTO OF PH TEST
50 gram of samples were mixed with 100mL distilled water
Samples were shake for 24hours
Samples were leaved one hour after shake
pH test reading
EXPERIMENT FINDINGS
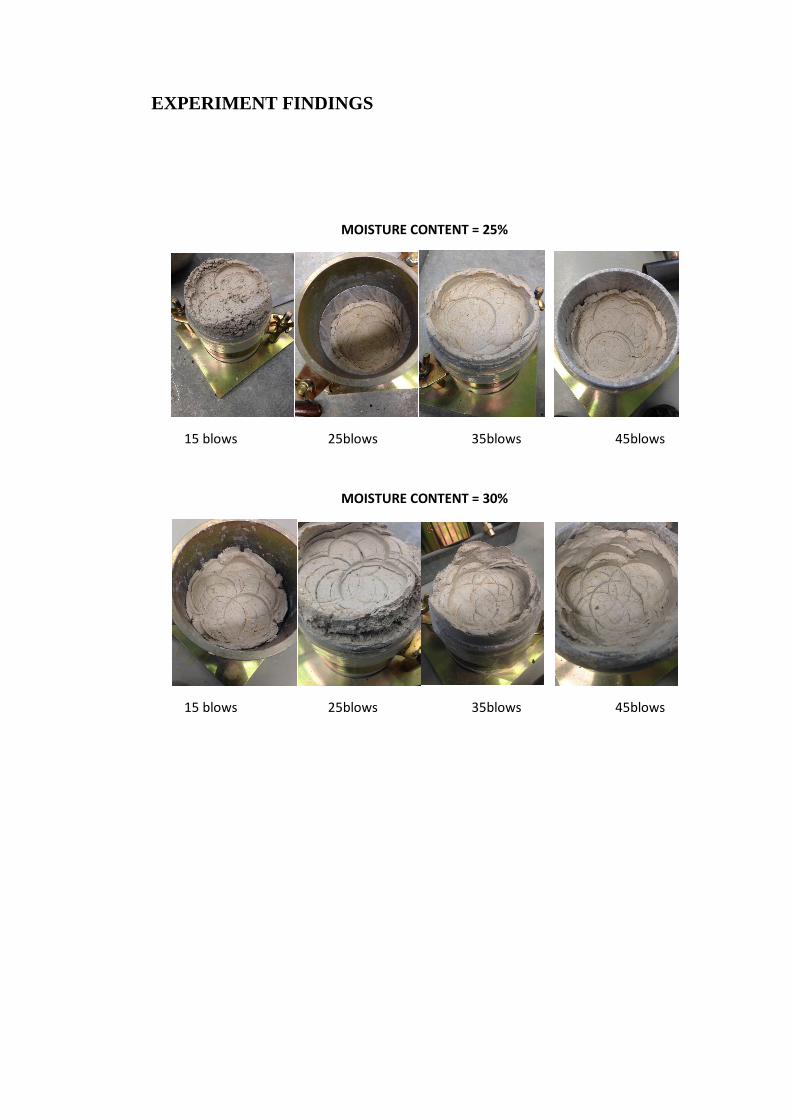
MOISTURE CONTENT = 25%
15 blows 25blows 35blows 45blows
MOISTURE CONTENT = 30%
15 blows 25blows 35blows 45blows
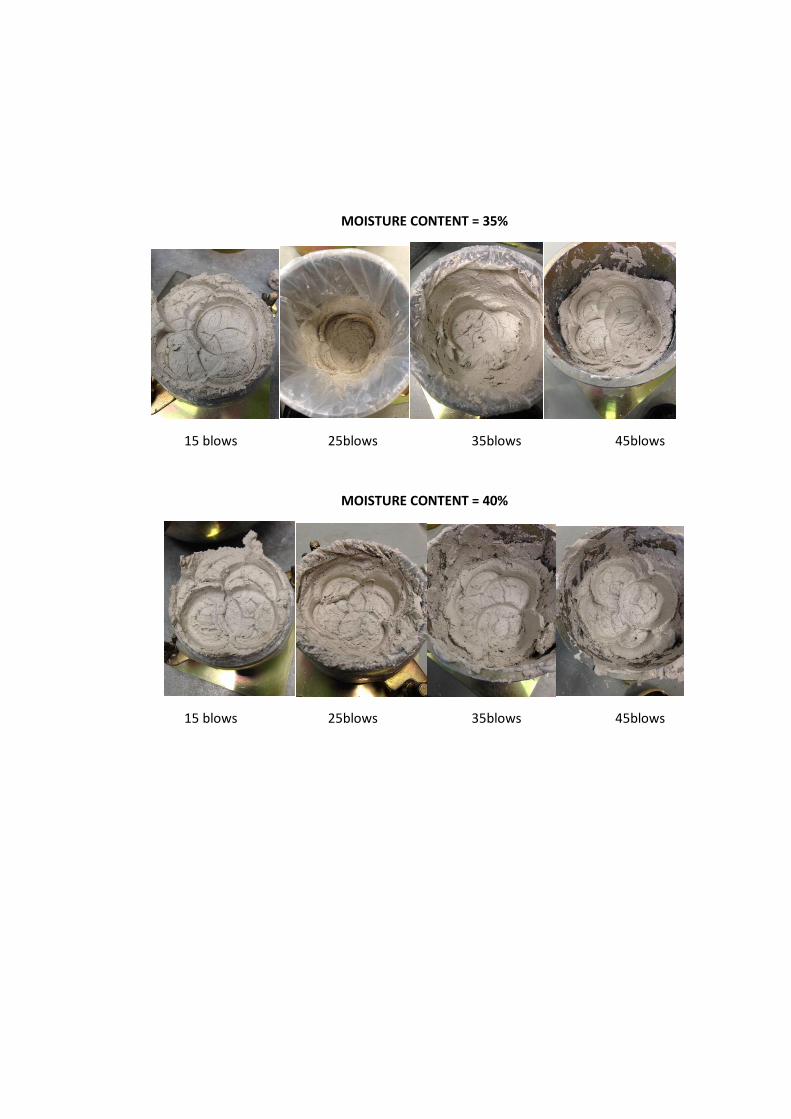
MOISTURE CONTENT = 35%
15 blows 25blows 35blows 45blows
MOISTURE CONTENT = 40%
15 blows 25blows 35blows 45blows