the effect of flares on total solar irradiance - arxiv · 4 fig. 1: detection of flares in the...
TRANSCRIPT
1
The effect of flares on total solar irradiance
Matthieu Kretzschmar1*, Thierry Dudok de Wit1, Werner Schmutz2, Sabri Mekaoui3,
Jean-François Hochedez4, Steven Dewitte3
1LPC2E - Laboratoire de Physique et Chimie de l’Environnement et de l’Espace, UMR 6115
CNRS et Université d’Orléans, 3A Av. de la Recherche Scientifique, Orléans Cedex 2, France.
2 Physikalisch-Meteorologisches Observatorium Davos and World Radiation Center
(PMOD/WRC), Dorfstrasse 33, 7260 Davos Dorf, Switzerland.
3 Royal Meteorological Institute of Belgium, Ringlaan 3, 1180 Brussels, Belgium.
4 Solar Influences Data Analysis Centre / Royal Observatory of Belgium, Circular Avenue 3, B-
1180 Brussels, Belgium.
* Corresponding author
Flares are powerful energy releases occurring in stellar atmospheres [1]. Solar flares,
the most intense energy bursts in the solar system, are however hardly noticeable in the
total solar luminosity [2,3]. Consequently, the total amount of energy they radiate 1)
remains largely unknown and 2) has been overlooked as a potential contributor to
variations in the Total Solar Irradiance (TSI)[4], i.e. the total solar flux received at
Earth. Here, we report on the detection of the flare signal in the TSI even for moderate
flares. We find that the total energy radiated by flares exceeds the soft X-ray emission
by two orders of magnitude, with an important contribution in the visible domain. These
results have implications for the physics of flares and the variability of our star.
Flares are sudden bursts of electromagnetic radiation occurring in stellar
atmospheres. They are preferentially observed in cool dMe stars where contrast is
higher. However, flares have also been observed in other types of stars[1]. In the case of
2
the Sun, imaging capabilities have made it possible to observe flares in the visible
domain[5,6] and at short wavelengths, in the X-ray or Extreme UltraViolet (EUV)
domains, where the contrast is highest and high quality space instrumentation has been
purpose built. However the total energy radiated by flares and its spectral distribution
remains largely unknown. In fact, the flare signal in the visible domain or in spectrally
integrated observations is hindered by the background fluctuations that are caused both
by internal acoustic waves and by solar granulation (see fig.1). This explains why
among the more than 20,000 flares that occurred in the last solar cycle, only four
exceptionally large ones have been identified up to now[7] in the TSI, i.e. the flux of
solar light received at all wavelengths at the top of the Earth’s atmosphere. The TSI is
the primary energy input to Earth, so identifying the impact of flares on TSI is of
fundamental importance in several aspects: it provides an important constraint for the
physics of flares, it makes it possible to compare flares on other stars and it offers an
estimate of flare contribution to solar luminosity.
To identify the effect of flares on the TSI, the aforementioned fluctuations must
be somehow cancelled out; to do so, we performed a conditional average analysis[8],
which is also known as superposed epoch analysis. The procedure involves 1) selecting
a set of flares, 2) extracting an excerpt of the irradiance time series around the flare peak
time for these events and 3) averaging (or superposing) these smaller time series in such
a way that flares occur at the same time in all time series.
We applied this procedure to measurements of the TSI recorded by the PMO and
DIARAD radiometers of the VIRGO[9] experiment onboard the SOHO mission between
1996 and 2007, i.e. during the whole 23rd solar cycle. We used the Soft X-Ray (SXR)
flux observed by the GOES satellites in the spectral range 0.1-0.8 nm to retrieve the
flare information and in particular the peak time. The flare amplitude is given by its X-
ray class: the letter indicates a power of ten (‘X’ is -4, ‘M’ is -5, ‘C’ is -6, etc.). A flare
3
of class M4.5 thus corresponds to a SXR peak flux of ISXR=4.5 10-5 W/m2. We
considered only flares occurring at heliocentric angle less than 60° (to limit line-of-sight
effects) and of class greater than M3 in order to stay sufficiently above the instrumental
background. To maximize the flare signal, we ranked the flares from the largest to the
smallest using the SXR flux peak
€
FSXR measured by the GOES satellites:
€
F1SXR > F2
SXR > ...> FiSXR > ...> FN
SXR, and we applied the analysis to several sets of flares
that are characterized by two values: the largest flare of the set (noted by its rank
€
k ) and
the total number
€
n of flares inside the set (the smallest flare of the set then being of
rank
€
k + n −1). For each flare, we selected a TSI interval of
€
τ =7 hours in such a way
that the flare peak time is situated 180 minutes after the interval begins. These short
intervals were divided by their time average before being superposed, so that the
average relative TSI variations resulting from the analysis can be expressed as
€
I(k,n,t) =106 ⋅ 1n
Ii(t)Ii(t) τ
−1
i= k
k+n−1
∑ , where
€
Ii(t) is the measured TSI time series during
the flare of rank i and
€
I(k,n,t) is expressed in parts per million (ppm). The analysis is
based on the fact that although the TSI value at peak time
€
Ii(tpeak ) cannot be
distinguished from the value at other times, it includes a small contribution
€
Iif due to
the flare. At times where no flare emission occurs (far from tpeak), the incoherent fluctuations are averaged out and the value
€
I(t) goes to zero as
€
σn
, where
€
σ is the
standard deviation of the original time series. At the peak of the flare, the coherent
contribution of the flares causes the average value to differ from zero and to tend
towards the average relative TSI increase
€
I(k,n,tpeak ) = I f (k,n) =1n
Iif
i= k
k+n−1
∑ . This
supposes that other phenomena such as acoustic waves and active region evolution are
not in phase with the flares and therefore do not contribute to the flare signature.
4
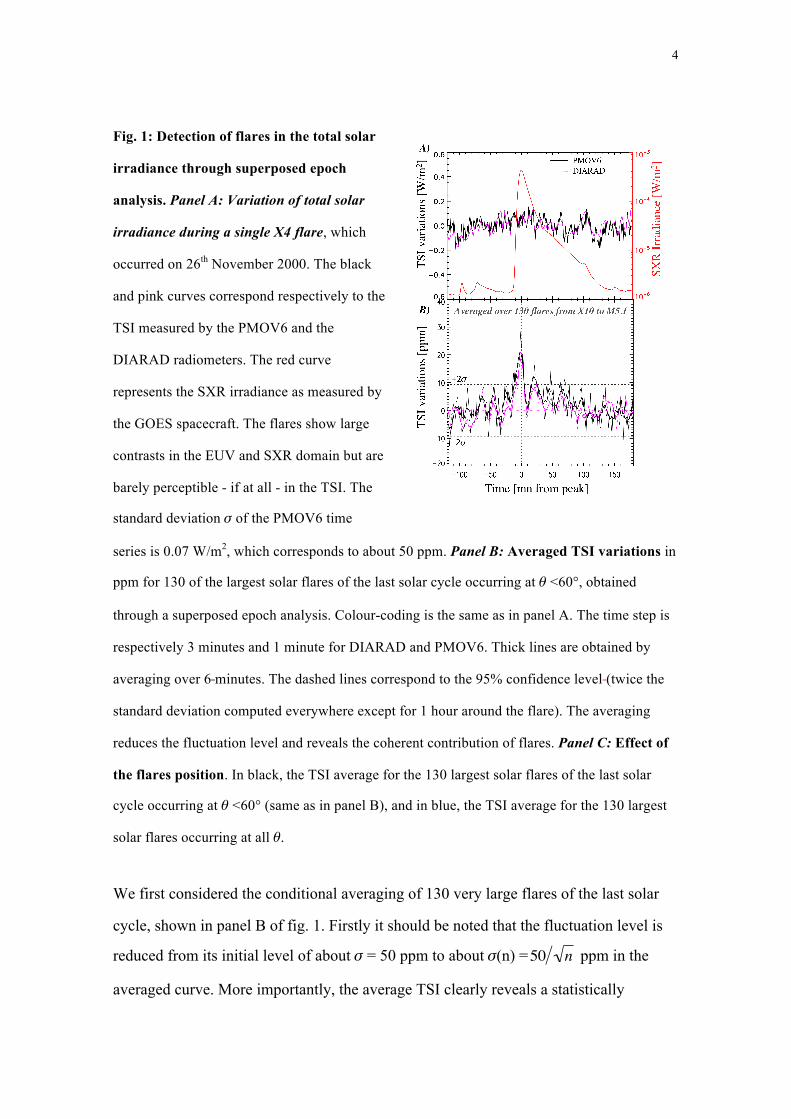
Fig. 1: Detection of flares in the total solar
irradiance through superposed epoch
analysis. Panel A: Variation of total solar
irradiance during a single X4 flare, which
occurred on 26th November 2000. The black
and pink curves correspond respectively to the
TSI measured by the PMOV6 and the
DIARAD radiometers. The red curve
represents the SXR irradiance as measured by
the GOES spacecraft. The flares show large
contrasts in the EUV and SXR domain but are
barely perceptible - if at all - in the TSI. The
standard deviation of the PMOV6 time
series is 0.07 W/m2, which corresponds to about 50 ppm. Panel B: Averaged TSI variations in
ppm for 130 of the largest solar flares of the last solar cycle occurring at <60°, obtained
through a superposed epoch analysis. Colour-coding is the same as in panel A. The time step is
respectively 3 minutes and 1 minute for DIARAD and PMOV6. Thick lines are obtained by
averaging over 6 minutes. The dashed lines correspond to the 95% confidence level (twice the
standard deviation computed everywhere except for 1 hour around the flare). The averaging
reduces the fluctuation level and reveals the coherent contribution of flares. Panel C: Effect of
the flares position. In black, the TSI average for the 130 largest solar flares of the last solar
cycle occurring at <60° (same as in panel B), and in blue, the TSI average for the 130 largest
solar flares occurring at all .
We first considered the conditional averaging of 130 very large flares of the last solar
cycle, shown in panel B of fig. 1. Firstly it should be noted that the fluctuation level is
reduced from its initial level of about = 50 ppm to about (n) =
€
50 n ppm in the
averaged curve. More importantly, the average TSI clearly reveals a statistically
5
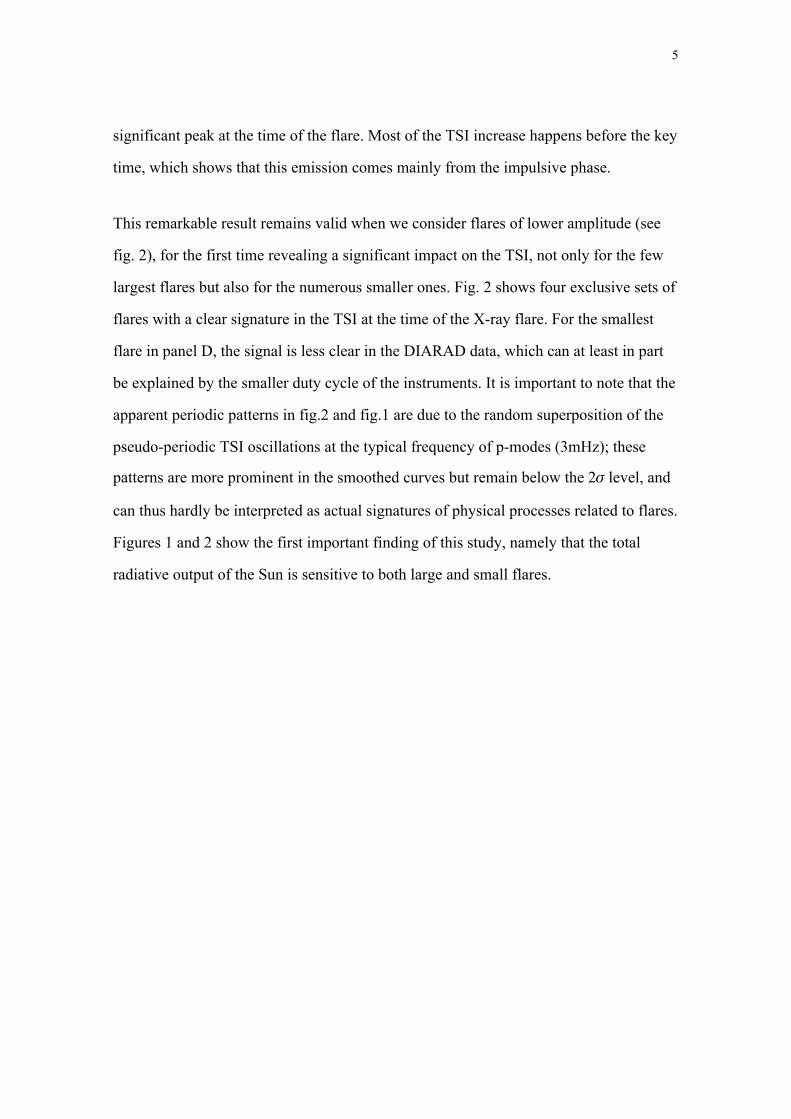
significant peak at the time of the flare. Most of the TSI increase happens before the key
time, which shows that this emission comes mainly from the impulsive phase.
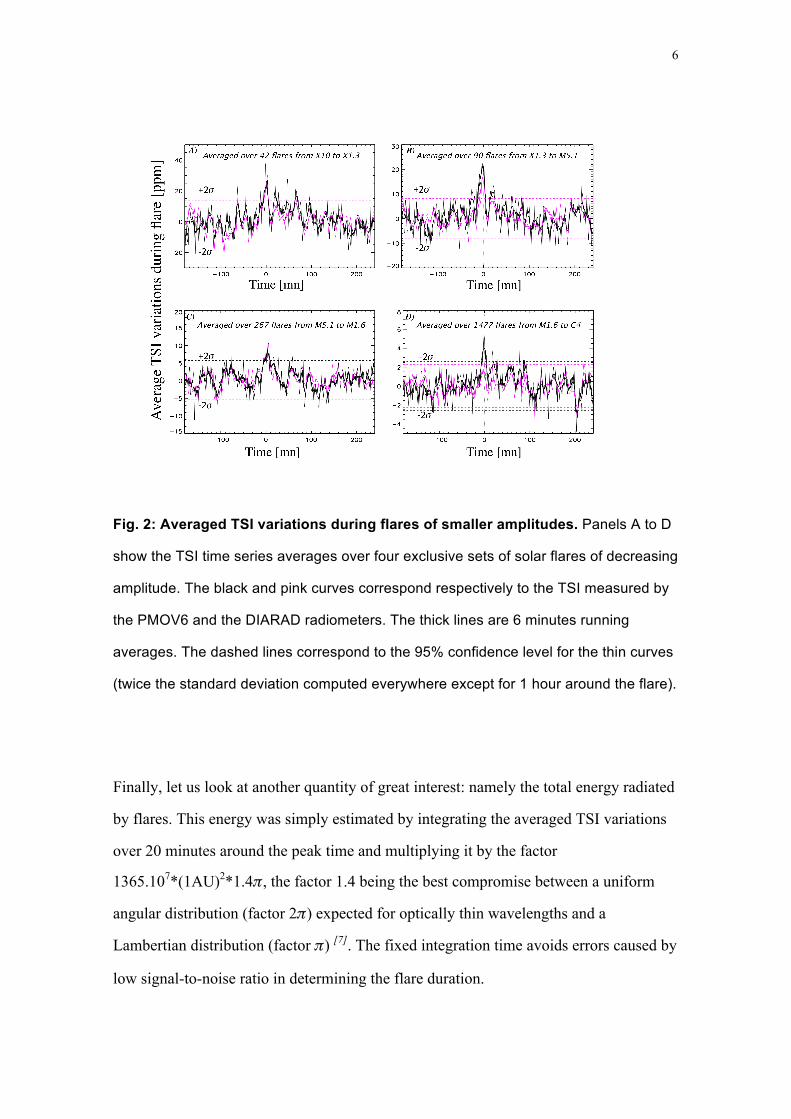
This remarkable result remains valid when we consider flares of lower amplitude (see
fig. 2), for the first time revealing a significant impact on the TSI, not only for the few
largest flares but also for the numerous smaller ones. Fig. 2 shows four exclusive sets of
flares with a clear signature in the TSI at the time of the X-ray flare. For the smallest
flare in panel D, the signal is less clear in the DIARAD data, which can at least in part
be explained by the smaller duty cycle of the instruments. It is important to note that the
apparent periodic patterns in fig.2 and fig.1 are due to the random superposition of the
pseudo-periodic TSI oscillations at the typical frequency of p-modes (3mHz); these
patterns are more prominent in the smoothed curves but remain below the 2 level, and
can thus hardly be interpreted as actual signatures of physical processes related to flares.
Figures 1 and 2 show the first important finding of this study, namely that the total
radiative output of the Sun is sensitive to both large and small flares.
6
Fig. 2: Averaged TSI variations during flares of smaller amplitudes. Panels A to D
show the TSI time series averages over four exclusive sets of solar flares of decreasing
amplitude. The black and pink curves correspond respectively to the TSI measured by
the PMOV6 and the DIARAD radiometers. The thick lines are 6 minutes running
averages. The dashed lines correspond to the 95% confidence level for the thin curves
(twice the standard deviation computed everywhere except for 1 hour around the flare).
Finally, let us look at another quantity of great interest: namely the total energy radiated
by flares. This energy was simply estimated by integrating the averaged TSI variations
over 20 minutes around the peak time and multiplying it by the factor
1365.107*(1AU)2*1.4, the factor 1.4 being the best compromise between a uniform
angular distribution (factor 2) expected for optically thin wavelengths and a
Lambertian distribution (factor ) [7]. The fixed integration time avoids errors caused by
low signal-to-noise ratio in determining the flare duration.
7
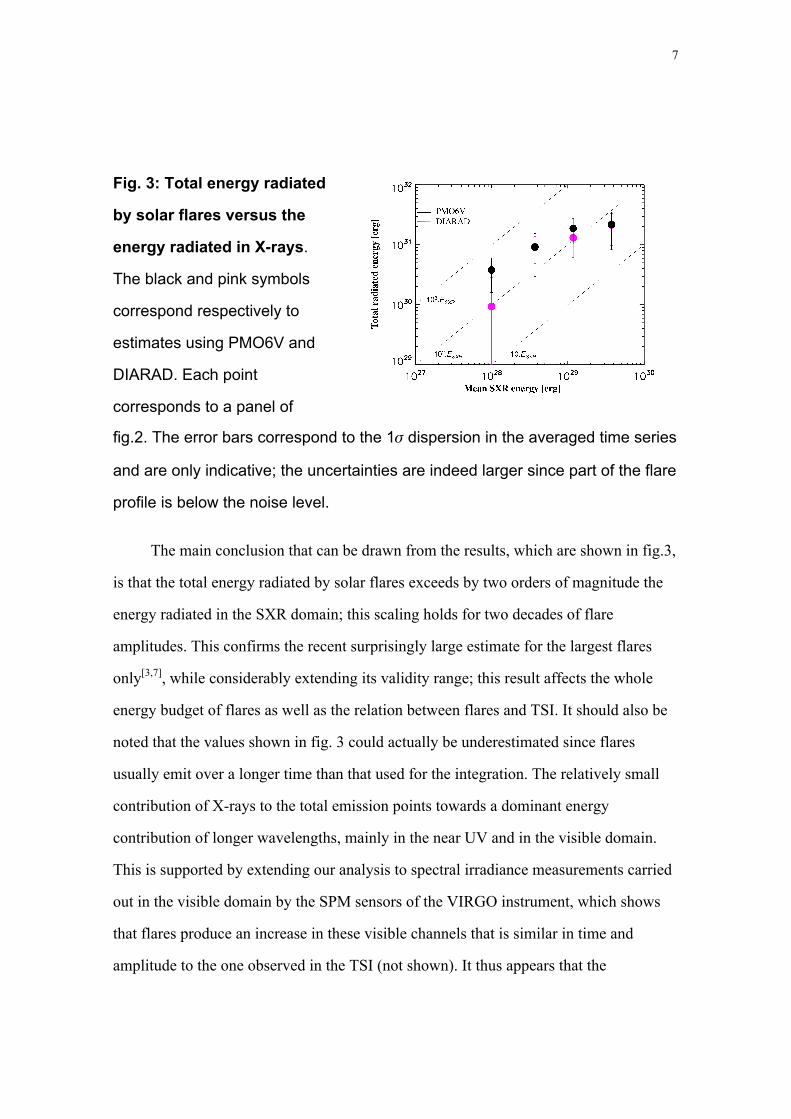
Fig. 3: Total energy radiated
by solar flares versus the
energy radiated in X-rays.
The black and pink symbols
correspond respectively to
estimates using PMO6V and
DIARAD. Each point
corresponds to a panel of
fig.2. The error bars correspond to the 1 dispersion in the averaged time series
and are only indicative; the uncertainties are indeed larger since part of the flare
profile is below the noise level.
The main conclusion that can be drawn from the results, which are shown in fig.3,
is that the total energy radiated by solar flares exceeds by two orders of magnitude the
energy radiated in the SXR domain; this scaling holds for two decades of flare
amplitudes. This confirms the recent surprisingly large estimate for the largest flares
only[3,7], while considerably extending its validity range; this result affects the whole
energy budget of flares as well as the relation between flares and TSI. It should also be
noted that the values shown in fig. 3 could actually be underestimated since flares
usually emit over a longer time than that used for the integration. The relatively small
contribution of X-rays to the total emission points towards a dominant energy
contribution of longer wavelengths, mainly in the near UV and in the visible domain.
This is supported by extending our analysis to spectral irradiance measurements carried
out in the visible domain by the SPM sensors of the VIRGO instrument, which shows
that flares produce an increase in these visible channels that is similar in time and
amplitude to the one observed in the TSI (not shown). It thus appears that the
8
contribution of the visible and near UV emission to the total flare emission are large
enough to make the signature of flares detectable in the total radiative output of our star.
1. Haisch, B., Strong, K.T. & Rodono, M. Flares on the sun and other stars. Annual
Review of Astronomy and Astrophysics 29, 257-324 (1991)
2. Hudson, H. S. & Willson, R. C. Upper limits on the total radiant energy of solar
flares. Solar Physics 86, 123-130 (1983)
3. Woods, T. N., Eparvier, F.G., Fontenla, J., et al. Solar irradiance variability during
the October 2003 solar storm period. Geophysical Research Letter 31, 10802 (2004)
4. Fröhlich, C. & Lean, J. Solar radiative output and its variability: evidence and
mechanisms. The Astronomy and Astrophysics Review. 12, 273-320 (2004)
5. Carrington, R.C. Description of a Singular Appearance seen in the Sun on
September 1. Monthly Notices of the Royal Astronomical Society 20, 13-15 (1859).
6. Neidig, D. F. The importance of solar white-light flares Solar Physics 121, 261-269
(1989),
7. Woods, T. N., Kopp, G., & Chamberlin, P. C. Contributions of the solar ultraviolet
irradiance to the total solar irradiance during large flares. J. Geophys. Res. 111,
A10S14 (2006)
8. Johnsen, H., Pécseli, H. L. & Trulsen, J. Conditional eddies in plasma turbulence.
Physics of Fluids 30 (7), 2239-2254 (1987).
9. Frohlich, C., Andersen, B. N., Appourchaux, T. et al., First Results from VIRGO,
the Experiment for Helioseismology and Solar Irradiance Monitoring on SOHO.
Solar Physics 170, 1-25 (1997)
9
Acknowledgments This work has received funding from the European Community's Seventh Framework
Programme (FP7/2007-2013) under the grant agreement n° 218816 (SOTERIA project, www.soteria-
space.eu). J.F.H., T. DdW. and M. K. also acknowledge financial support from the French-Belgium
partnership program “Tournesol”.
Author Contribution S. D., S. M., W. S. and J.F.H. were involved in the design of the study. T. DdW.
was involved in the analysis of the data. M. K. analysed the data and drafted the manuscript. All authors
discussed the results and commented on the manuscript.