the effect of celebrity endorsement and brand image on
TRANSCRIPT
Journal of Research in Business, Economics, and Education Volume 2 E-ISSN 2686-6056 Issue 5 October Edition 2020
© Authors. Terms and conditions of this work is licensed under a Creative Commons Attribution-NonCommercial-NoDerivatives 4.0 International License apply. Correspondence: Siti Nuryati, BRI Institute Jakarta. Email: snuryati@bri_institute.ac.id
The Effect of Celebrity Endorsement and Brand Image on Purchase
Decisions on Elzatta Hijab for Students in Jakarta
Siti Nuryati1* & Sri Arfani2
1BRI Institute Jakarta
2Universitas Bina Sarana Informatika Jakarta
*e-mail: snuryati@bri_institute.ac.id
Abstract
The purpose of this study was to determine the influence of celebrity endorsement and brand image
on purchasing decisions for Hijab Elzatta among students in Jakarta. The data were obtained from
distributing questionnaires to 34 respondents as a sample using the Likert scale. The data were
processed and analyzed using multiple linear regression. The results of the R2 test are 0.459 or 46%,
meaning that the purchasing decision variable is explained by the trust and quality variables by 46%.
The results of the F test show that f count 13,127> f tabel 3,30, thus simultaneously the celebrity
endorsement variable and brand image have a positive and significant influence on the purchasing
decision of Elzatta Hijab in students in Jakarta. While the t test results show a significant effect of
price on purchasing decisions as evidenced by t count 2.445> ttable 1.690, a significant effect of
brand image on purchasing decisions on Elzatta Hijab buyers is evidenced from tcount4.037> t table
1.690. Then the regression equation is obtained Y = 5.742 + 0.236 + 0.422. This means a constant
value of 5.742, this shows that if celebrity endorsement and brand image are ignored, then the
purchase decision of Elzatta Hijab buyers is 5.742. The regression coefficient of the price variable is
0.236, meaning that each increase in celebrity endorsement is 1 unit, it will be followed by an increase
in purchasing decisions for Hijab Elzatta buyers by 0.236. The regression coefficient for brand image
variables is 0.422, meaning that each increase in brand image is 1 unit, it will be followed by an
increase in purchasing decisions for buyers. Elzatta's Hijab is 0.422. The results of this study are that
celebrity endorsement and brand image have a significant effect on the purchasing decisions of Hijab
Ellzata buyers among students in Jakarta.
Keywords: Celebrity Endorsement, Brand Image, Hijab Elzatta.
1. Introduction
Companies in the present era are required to be able to compete fairly and competently to
continue to exist and develop and not be left behind by other companies. Companies are required to
always think positive and forward and must take the initiative to make self-improvement and carry out
company development. That way the company will develop into a thriving, growing, and successful
company. As a successful company, the company has been recognized by all levels of society. It is not
only known by the public, but the public can give positive opinions about the company for the sake of
the existence of a company to survive amid increasingly fierce competition today. One of the functions
of a growing company that can be used as the spearhead of the success of achieving profit is the
marketing function.
Journal of Research in Business, Economics, and Education
1287 Volume 2, Issue 5 available at http://e-journal.stie-kusumanegara.ac.id
Currently, consumers are faced with various types of product choices offered by each company
to meet the needs and desires of consumers. The purchase decision is an important thing to pay
attention to because this will certainly be a consideration of how a marketing strategy will be carried
out by the company in the next period. One of the ways companies improve purchasing decisions is
through advertising. The existence of advertising has become a demand that cannot be avoided from a
product being offered to get attention from the public One of the efforts made by the company is
through advertising. Advertising as a form of mass communication that functions to inform messages
to the public and influence it to take certain actions requires special handling in its creation. Celebrity
endorsement can generate more attention to advertising, better recognition of a brand name, and the
ability to create an image for the product.
Celebrity endorsements can increase sales of advertised products and increase sales of
advertised products and increase company profits. Meanwhile, advertisements using noncelebrity
endorsers are used to gain the trust of the audience. This type of endorser can be more familiar to
consumers because they feel they have the same actual self-concept, values, personality, lifestyle,
demographic characteristics, and so on. Celebrities become a huge consideration to become
communicators in an advertisement, which is commonly referred to as a celebrity endorser. Celebrities
who are on the rise or popularity are believed to be able to more influence someone to take certain
actions by the original goal Advertising is also a part of the promotion carried out by the company.
Attractive ads are ads that can attract market attention. The Luwak White Koffie product is booming
because it uses advertising, where the advertisement used by the company is an advertisement that
uses a Celebrity Endorsement to communicate the product to create an image of the product. The
company uses celebrities originating from Korea with high popularity in the world. By using Celebrity
Endorsement, the company aims to encourage consumers to buy these products.
2. Literature Review
Celebrity Endorser
The use of commercials in an advertisement on television is an appropriate alternative strategy
for introducing products to consumers. Celebrities are individuals (movie stars, entertainers, or
athletes) who are known by the public for their abilities in certain fields that can support the products
being advertised. Celebrities have stopping power. Endorsers can also be defined as people who are
chosen to represent the image of a product (product image). Usually, community leaders have
prominent characters and strong appeal (Hardiman, 2006). So the expertise possessed by celebrities
with the advertised product brand must be relevant
The advertising strategy with the use of celebrity endorsers must go through several stages of
consideration, including the level of celebrity popularity itself with the problem of whether the chosen
celebrity can represent the character of the product being advertised. The use of endorsers is expected
to provide a positive association between the product and the endorser. These associations can simply
appear in the form of certain thoughts or images associated with a brand (Ristiarini, 2012). Celebrities
are expected to represent an ideal lifestyle where some people or at least their fans and followers want
to emulate that lifestyle. Seeing the market behavior that wants to imitate the lifestyle of celebrities,
marketers are willing to spend a large amount of money to use celebrities to promote their products or
brands. Marketers hope that the target market will see, hear, or read and then react positively by
associating the product or brand with celebrities who promote it (Mahestu, 2006).
To rejuvenate a weary product or brand, companies are often lured into wearing celebrities.
This strategy is used considering that celebrity prestige has the potential to elevate brand and product
image. According to Hardiman in (Nurmala, 2008) the advertising model is a figure chosen to represent
the image of a product (image product), from community leaders who have prominent characters and
strong appeal. According to Royan in Nurmala (2008) celebrities can be used as a fast tool to represent
Journal of Research in Business, Economics, and Education
1288 Volume 2, Issue 5 available at http://e-journal.stie-kusumanegara.ac.id
the targeted market segments. The use of celebrities in advertisements can help achieve company goals
by boosting sales because celebrities are believed to be more attractive and inspire interest and interest
than the use of ordinary people in influencing potential customers. Thus celebrities can help companies
to increase the effectiveness of their advertisements since they can create consumer awareness which
in turn increases consumer buying interest.
Many factors should be considered by companies that will use celebrity services in their
product advertisements. The use of these celebrities is sometimes able to increase sales, but there are
times when it fails to promote the product The main task of these endorsers is to create a good
association between the endorser and the advertised product so that a positive attitude arises in
consumers so that advertisements can also create a good image in the eyes of consumers. Advertising
is an important and mutually influential element in instilling a brand image to consumers, along with
the physical characteristics and product quality that follow a particular brand (Temporal & Lee, 2001)..
Brand Image
Before explaining the meaning of the brand image, we will first explain the meaning of the
brand (brand). Every product sold in the market certainly has a brand, where the brand differentiates
one product from another. According to Aaker and Biel (2009) brand image is the consumer's
assessment of the brand in a market. This creation can be created based on personal experience or
hearing about its reputation from other people or the media. According to Schiffman and Kanuk (2007)
"A brand image is a set of associations about a brand that is stored in the mind or memory of
consumers". Several factors influence brand image Schiffman and Kanuk (2007) mention the factors
forming a brand image, namely:
1. Quality or quality, related to the quality of the goods offered by manufacturers with certain
brands.
2. trustworthy or dependable. related to the opinion or agreement formed by the community about
a product that is consumed.
3. Uses or benefits associated with the function of a product that can be utilized by consumers.
4. Price, which in this case is related to the high and low or the amount of money spent by
consumers to influence a product, can also affect the long-term image.
5. The image that is owned by the brand itself, namely in the form of views, agreements and
information relating to a particular brand of a product
According to Keller (2016), brand image is the consumer's perception of the brand image of the
product to be consumed or used. According to Keller (2000), measuring brand image can be done
based on the aspects of a brand, namely:
1. Brand is easy to remember: This means that the elements of the brand chosen should be easy
to remember and say or say. Symbols, logos, names used should be attractive, unique so that
they attract people's attention to be remembered and consumed.
2. The brand is easily recognized: Apart from the logo, a brand is known through the message
and how the product is packaged and presented to consumers which is called a trade dress.
Through intensive communication, a particular form of product can attract attention and be
easily recognized by consumers. So that the trade dress is often the same as a trademark, namely
the differentiation of products and services in the market that can be requested for legal
protection, and
3. Good brand reputation: For the company, image means the public's perception of the company's
identity. This perception is based on what the public knows or thinks about the company in
Journal of Research in Business, Economics, and Education
1289 Volume 2, Issue 5 available at http://e-journal.stie-kusumanegara.ac.id
question. The same company does not necessarily have the same image in front of people. The
company image becomes one of the guidelines for consumers to take
According to Keller (2016) brand image consists of two main factors, namely:
1. Physical factors, which are the physical characteristics of a brand, namely: design, packaging,
logo, brand name, function and use of products from that brand, and
2. Psychological factors, formed by emotions, beliefs, values and personality that are considered
by consumers can describe the products of the brand. Brand image is closely related to what
people think, feel about a particular brand. So that the brand image psychological factors have
more role than the physical factors of a particular brand.
Image according to Kotler and Keller (2016) is several beliefs, ideas, and impressions that a
person holds about an object. Meanwhile, brand image is the perception and belief held by consumers,
as reflected in the associations embedded in consumers' memories (Kotler and Keller, 2016).
Surachman (2008) defines brand image as part of a brand that can be recognized but cannot be
pronounced, such as a symbol, design letters or special colors, or customer perceptions of a product or
service represented by the brand. It can also be said that brand image is a concept created by consumers
for subjective reasons and personal emotions (Ferrinadewei, 2008).
In conclusion, the brand image is an image or impression that is generated by a brand in the minds of
customers. Placement of the brand image in the minds of consumers must be done continuously so that
the created brand image remains strong and can be received positively. When a brand has a strong and
positive image in the minds of consumers, the brand will always be remembered and the possibility of
consumers buying the brand in question is very large
The Brand Image that will be created by the selected Celebrity Endorser will certainly affect the
Purchase Intention of hijab products, so the selection of Celebrity Endorser must be exactly by the
Brand Image you want to create.
Purchase Decision
Purchase Decision can be viewed as problem-solving activities, and there are three kinds of
situations. These types of situations are: Routine responsive behavior, Limited problem solving and
Extensive problem solving The consumer's process for making purchasing decisions must be
understood by corporate marketers to make the right strategy. (Revita,Frimayasa,kurniawan:2018)
Before explaining the meaning of the brand image, we will first explain the meaning of the brand
(brand). Every product sold in the market certainly has a brand, where the brand differentiates one
product from another. Purchasing decisions are thoughts where individuals evaluate various options
and make choices on a product from the many choices. According to Kotler & Armstrong (2012),
purchasing decisions are the stage in the buyer's decision-making process where consumers buy.
According to Schiffman and Kanuk (2007), a purchasing decision is defined as a choice of two
more alternative choices. According to Tjiptono (2012) purchasing decision is a process in which
consumers recognize the problem, seek information about a particular product or brand, and evaluate
properly each of these alternatives can solve the problem, which then leads to a purchase decision.
According to Tjiptono (2012), the factors that influence customer purchasing decisions are the
emotional bonds that exist between customers and producers after customers use products and services
from the company and find that these products or services provide added value. The value dimensions
consist of 4, namely:
1. Emotional value, the utility that comes from feelings or affective or positive emotions arising
from consuming a product. If consumers experience positive feelings when buying or using a
Journal of Research in Business, Economics, and Education
1290 Volume 2, Issue 5 available at http://e-journal.stie-kusumanegara.ac.id
brand, then the brand provides emotional value. In essence, emotional value is related to
feelings, namely what positive feelings consumers will experience when buying a product.
2. Social value, the utility obtained from the product's ability to improve the consumer's social
self-concept. Social values are values held by a consumer, regarding what is considered good
and what is considered bad by consumers.
3. Value quality, utility obtained from the product due to the reduction of short-term costs and
long-term costs
4. Functional value is the value obtained from product attributes that provide functional utilities
to consumers. This value is directly related to the functions provided by the product or service
to consumers.
(Kotler 2016) , “ A brand is name, term, sign, symbol, or design, or a combination of them,
intended to identify the goods or service of one seller or groupof sellers and to differentiate them from
those of competitor.” The purchasing decision is an integration process that combines knowledge to
evaluate two or more alternative behaviors and choose one of them (Peter and Olson, 2014). In general,
consumer purchasing decisions are buying the most preferred brand (Kotler and Amstrsong, 2012).
Actual consumer purchasing decisions is a collection of many decisions purchase. Any such
purchasing decisions have a different component structure, including (Oentoro, 2012: 107):
a. Decisions about the type of product. Consumers can decide to buy certain types of products
such as food products or electronic products.
b. Decisions about product form. This purchasing decision is in the form of choosing the
product's shape, size, quality, product design, and so on.
c. Decisions about brands. Each brand has its differences and advantages. Consumers will
decide which brand to buy best suits their wants and needs.
d. Decisions about sellers. In making purchasing decisions, consumers will determine where
or from whom they will buy the product.
e. Decisions about the number of products. Consumers can make decisions about how many
products to buy.
f. Decisions about the time of purchase. Consumers can make decisions about when they will
buy a product.
g. Decisions about the method of payment. When deciding to buy a product, consumers will
determine how to pay for the purchased product, whether in cash or installments
3. Methods The research variable is a thing whatever form the researcher determines to be studied so
information is obtained about it, then draw conclusions (Sugiono, 2017).
Population and Sample Research
The population is all data that concerns researchers in the scope and time specified. So, the
population is related to data, not the human factor. If every human being provides some data, then the
number or size of the population will be the same as the number of humans While the sample is part
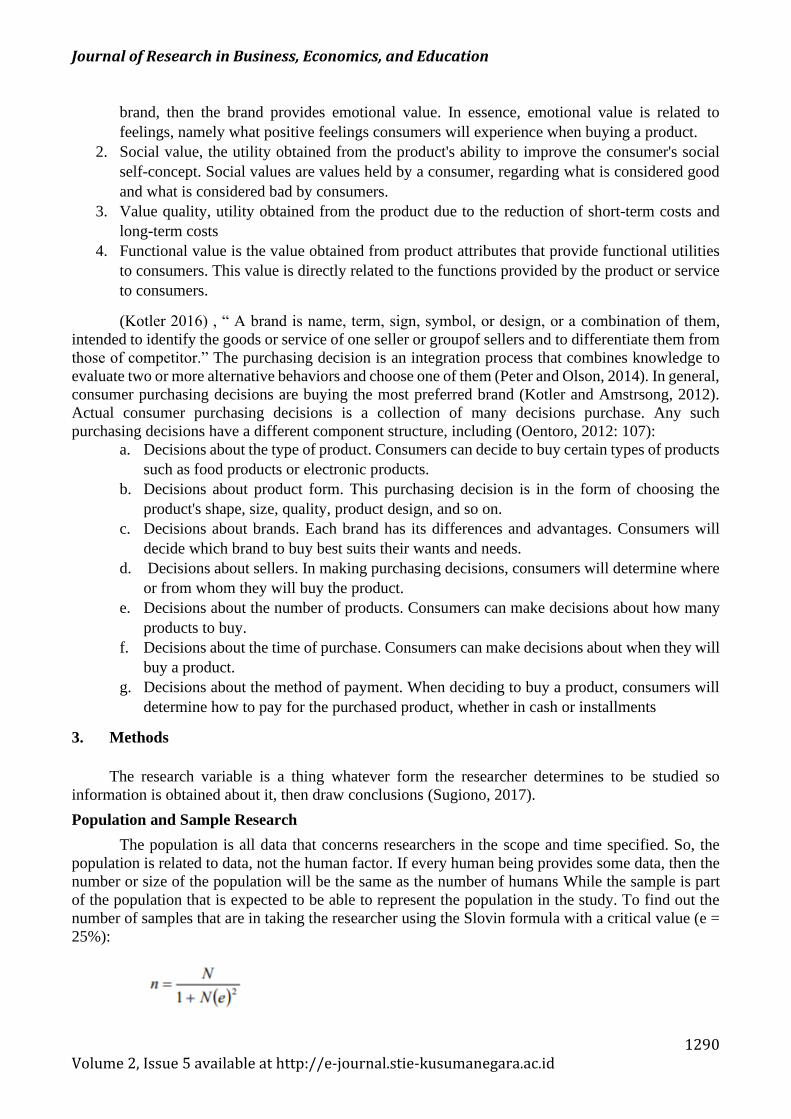
of the population that is expected to be able to represent the population in the study. To find out the
number of samples that are in taking the researcher using the Slovin formula with a critical value (e =
25%):
Journal of Research in Business, Economics, and Education
1291 Volume 2, Issue 5 available at http://e-journal.stie-kusumanegara.ac.id
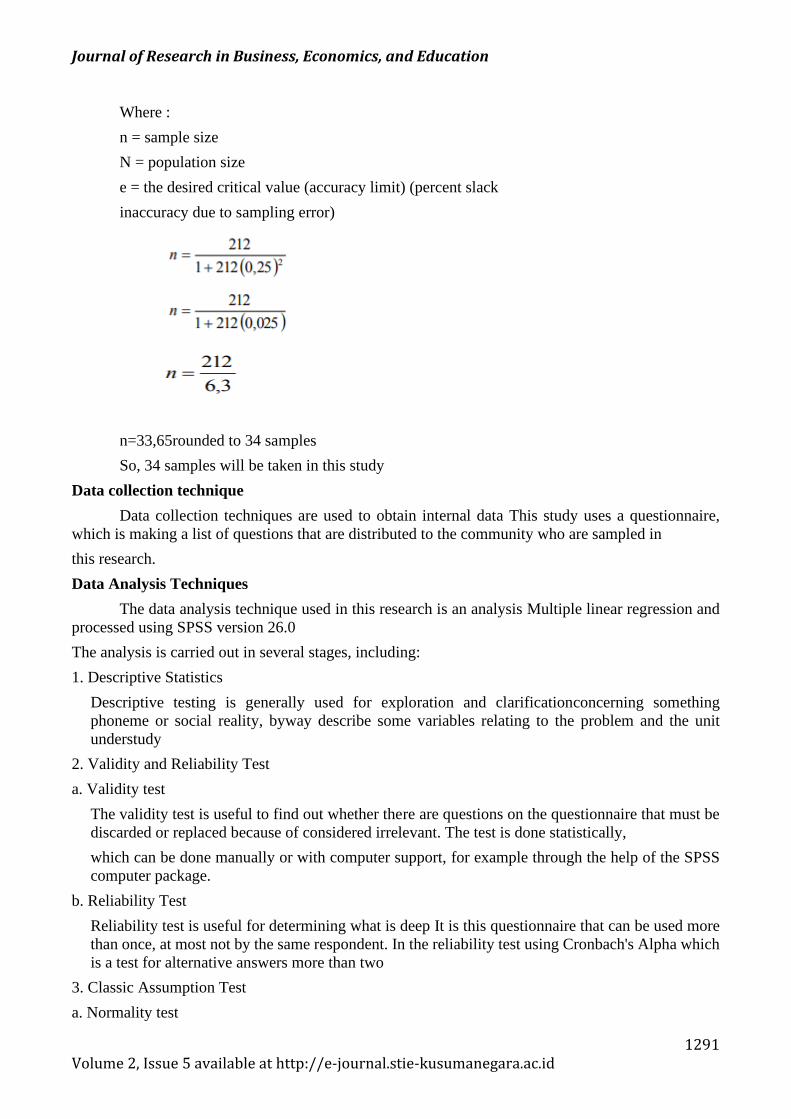
Where :
n = sample size
N = population size
e = the desired critical value (accuracy limit) (percent slack
inaccuracy due to sampling error)
n=33,65rounded to 34 samples
So, 34 samples will be taken in this study
Data collection technique
Data collection techniques are used to obtain internal data This study uses a questionnaire,
which is making a list of questions that are distributed to the community who are sampled in
this research.
Data Analysis Techniques
The data analysis technique used in this research is an analysis Multiple linear regression and
processed using SPSS version 26.0
The analysis is carried out in several stages, including:
1. Descriptive Statistics
Descriptive testing is generally used for exploration and clarificationconcerning something
phoneme or social reality, byway describe some variables relating to the problem and the unit
understudy
2. Validity and Reliability Test
a. Validity test
The validity test is useful to find out whether there are questions on the questionnaire that must be
discarded or replaced because of considered irrelevant. The test is done statistically,
which can be done manually or with computer support, for example through the help of the SPSS
computer package.
b. Reliability Test
Reliability test is useful for determining what is deep It is this questionnaire that can be used more
than once, at most not by the same respondent. In the reliability test using Cronbach's Alpha which
is a test for alternative answers more than two
3. Classic Assumption Test
a. Normality test
Journal of Research in Business, Economics, and Education
1292 Volume 2, Issue 5 available at http://e-journal.stie-kusumanegara.ac.id
Normality test is used to determine whether the variable dependent, independent, or both normally
distributed, close to normal or not. Data normality testing in This research was conducted by looking
at the graph of the data histogram declared normal, if the shape of the curve has a slope tend to be
balanced, both from the right side and the left side, and curve almost an almost perfect bell shape.
Whereas in the normal P-Plot image, the data is normal if a distributed image with data points in
the direction of the line diagonal. 8
b. Multicolonierity Test
Multicollinearity test aims to test whether it is deep the regression model found a correlation
between the independent variables. A good regression model should not correlate with the
independent variable. Multicollinearity can be measured from a tolerance value and variant inflation
(VIF). If the tolerance value> 0.1 and VIF <10, it can be concluded that there is no multicollinearity
between independent variables in the regression model. However, if the tolerance value is <0.1 and
VIF> 10, it can be concluded that there is multicollinearity between independent variables in the
regression model
c. Heteroscedasticity Test
The heteroscedasticity test aims to test whether it is deepregression models occur inequality of
variance from one observation to another observation. How to predict whether there is or not
heteroscedasticity in a model can be seen from the image pattern scatterplot, namely:
a. If there is a certain pattern, such as existing dots forming a pattern certain regular (wavy, melts
then narrows), it indicates heteroscedasticity has occurred.
b. If there is no clear pattern, the dots spread over and below the 0 on the Y axis, there is no
hetero spasticity.
4. Results and Discussion
Validity and Reliability Test
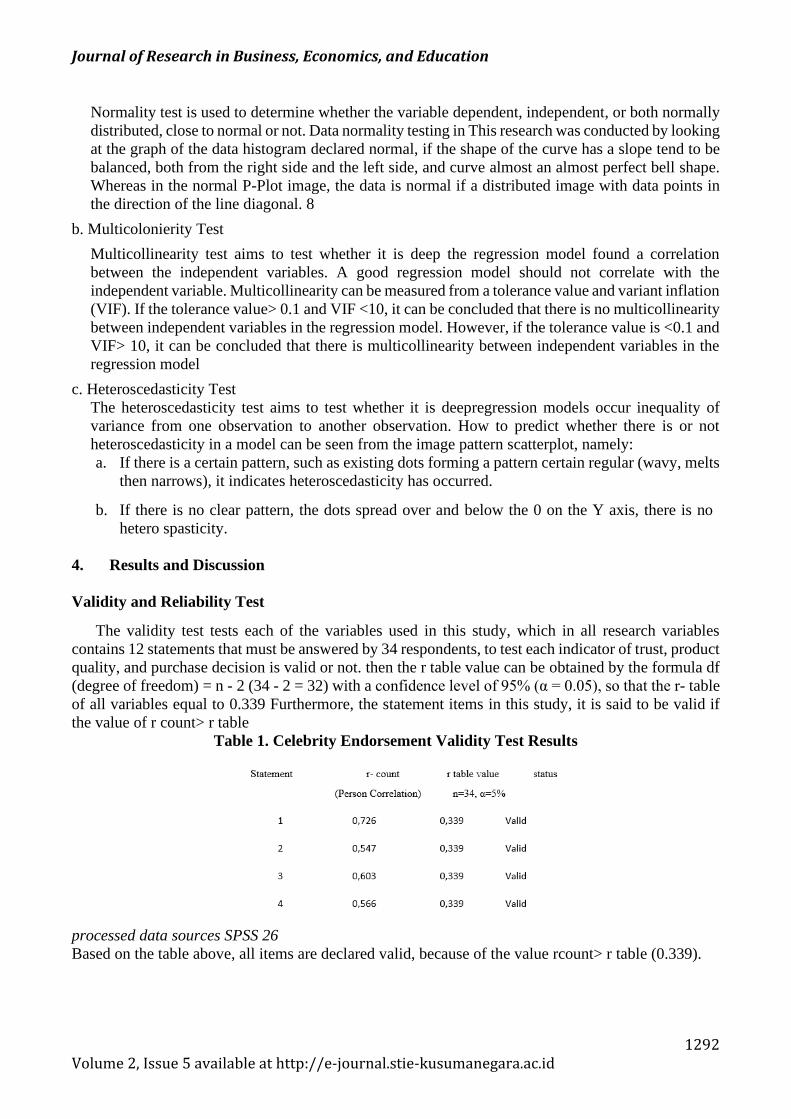
The validity test tests each of the variables used in this study, which in all research variables
contains 12 statements that must be answered by 34 respondents, to test each indicator of trust, product
quality, and purchase decision is valid or not. then the r table value can be obtained by the formula df
(degree of freedom) = n - 2 (34 - 2 = 32) with a confidence level of 95% (α = 0.05), so that the r- table
of all variables equal to 0.339 Furthermore, the statement items in this study, it is said to be valid if
the value of r count> r table
Table 1. Celebrity Endorsement Validity Test Results
processed data sources SPSS 26
Based on the table above, all items are declared valid, because of the value rcount> r table (0.339).
Journal of Research in Business, Economics, and Education
1293 Volume 2, Issue 5 available at http://e-journal.stie-kusumanegara.ac.id
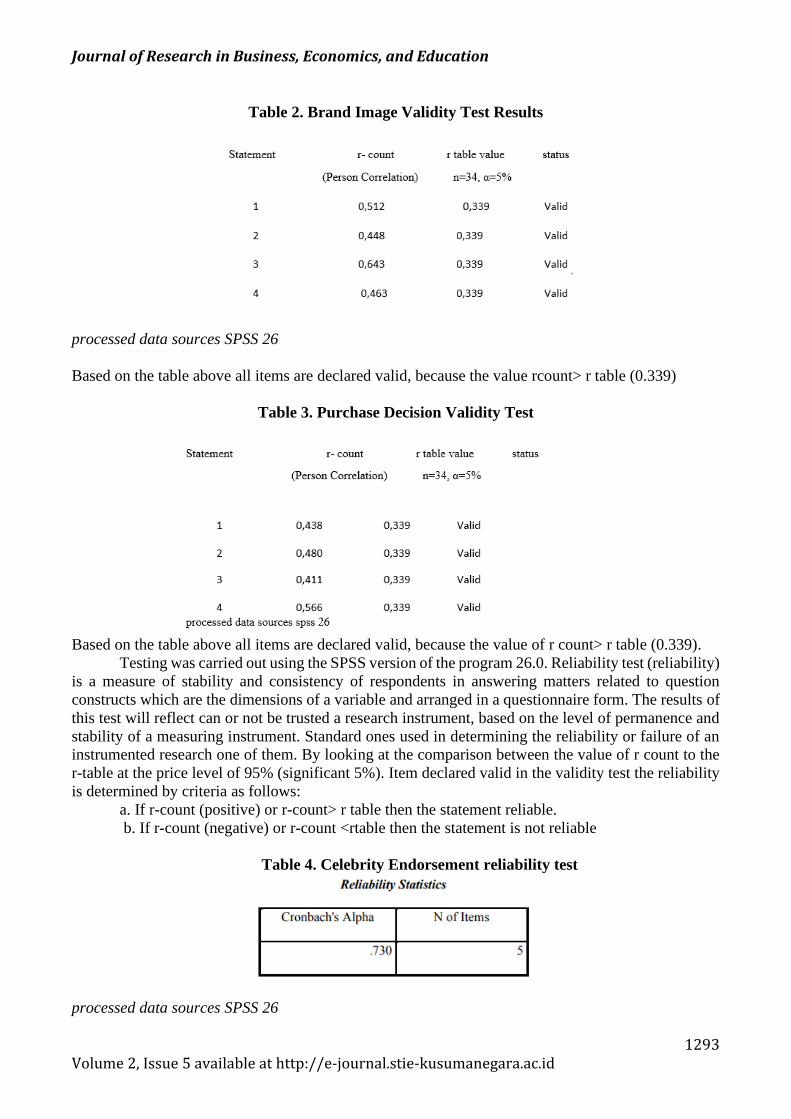
Table 2. Brand Image Validity Test Results
processed data sources SPSS 26
Based on the table above all items are declared valid, because the value rcount> r table (0.339)
Table 3. Purchase Decision Validity Test
Based on the table above all items are declared valid, because the value of r count> r table (0.339).
Testing was carried out using the SPSS version of the program 26.0. Reliability test (reliability)
is a measure of stability and consistency of respondents in answering matters related to question
constructs which are the dimensions of a variable and arranged in a questionnaire form. The results of
this test will reflect can or not be trusted a research instrument, based on the level of permanence and
stability of a measuring instrument. Standard ones used in determining the reliability or failure of an
instrumented research one of them. By looking at the comparison between the value of r count to the
r-table at the price level of 95% (significant 5%). Item declared valid in the validity test the reliability
is determined by criteria as follows:
a. If r-count (positive) or r-count> r table then the statement reliable.
b. If r-count (negative) or r-count <rtable then the statement is not reliable
Table 4. Celebrity Endorsement reliability test
processed data sources SPSS 26
Journal of Research in Business, Economics, and Education
1294 Volume 2, Issue 5 available at http://e-journal.stie-kusumanegara.ac.id
In the table above the reliability statistics above are obtained values Cronbach alpha equal to the
number of statements of 4 items. r table value at a significant level of 95% with the number of
respondents n = 34, and df = n - 2 (34– 2 = 32) is 0.339, thus the Cronbach alpha value 0.730> 0.339
table. So that from these results it can be concluded that the questionnaire tested for variable X1 proved
reliable because the Cronbach Alpha value = 0.730 is between 0.60-0.80.
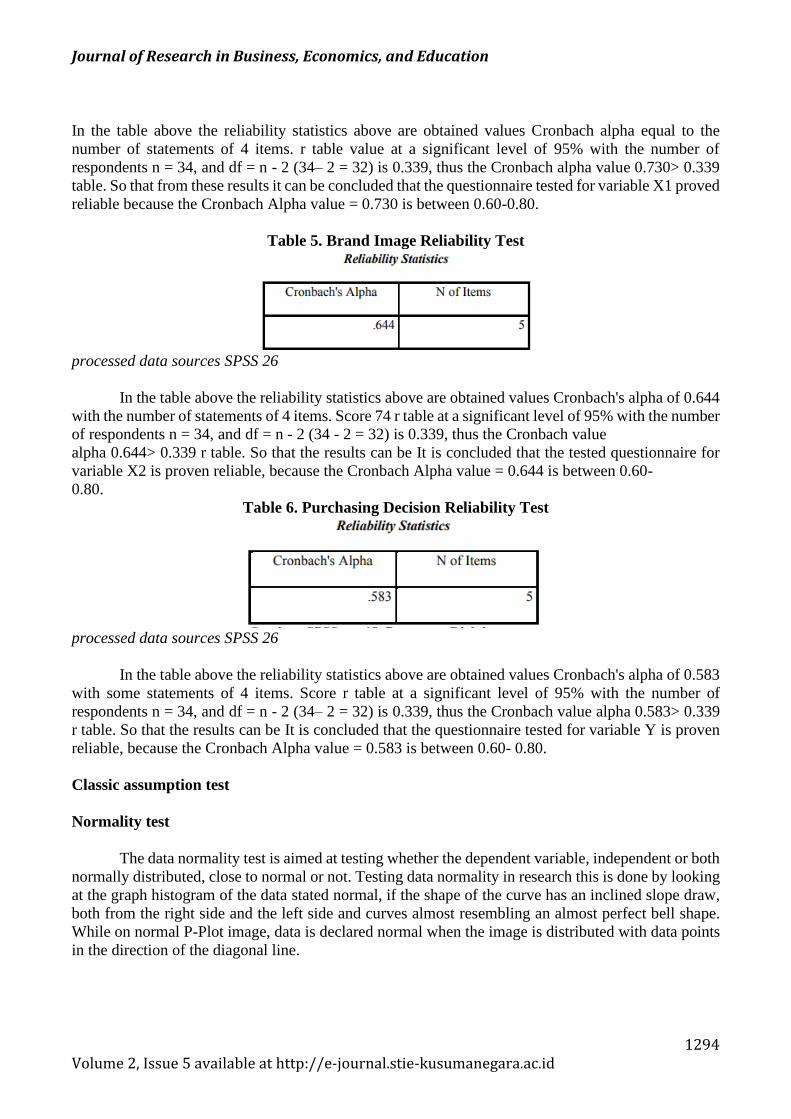
Table 5. Brand Image Reliability Test
processed data sources SPSS 26
In the table above the reliability statistics above are obtained values Cronbach's alpha of 0.644
with the number of statements of 4 items. Score 74 r table at a significant level of 95% with the number
of respondents n = 34, and df = n - 2 (34 - 2 = 32) is 0.339, thus the Cronbach value
alpha 0.644> 0.339 r table. So that the results can be It is concluded that the tested questionnaire for
variable X2 is proven reliable, because the Cronbach Alpha value = 0.644 is between 0.60-
0.80.
Table 6. Purchasing Decision Reliability Test
processed data sources SPSS 26
In the table above the reliability statistics above are obtained values Cronbach's alpha of 0.583
with some statements of 4 items. Score r table at a significant level of 95% with the number of
respondents n = 34, and df = n - 2 (34– 2 = 32) is 0.339, thus the Cronbach value alpha 0.583> 0.339
r table. So that the results can be It is concluded that the questionnaire tested for variable Y is proven
reliable, because the Cronbach Alpha value = 0.583 is between 0.60- 0.80.
Classic assumption test
Normality test
The data normality test is aimed at testing whether the dependent variable, independent or both
normally distributed, close to normal or not. Testing data normality in research this is done by looking
at the graph histogram of the data stated normal, if the shape of the curve has an inclined slope draw,
both from the right side and the left side and curves almost resembling an almost perfect bell shape.
While on normal P-Plot image, data is declared normal when the image is distributed with data points
in the direction of the diagonal line.
Journal of Research in Business, Economics, and Education
1295 Volume 2, Issue 5 available at http://e-journal.stie-kusumanegara.ac.id
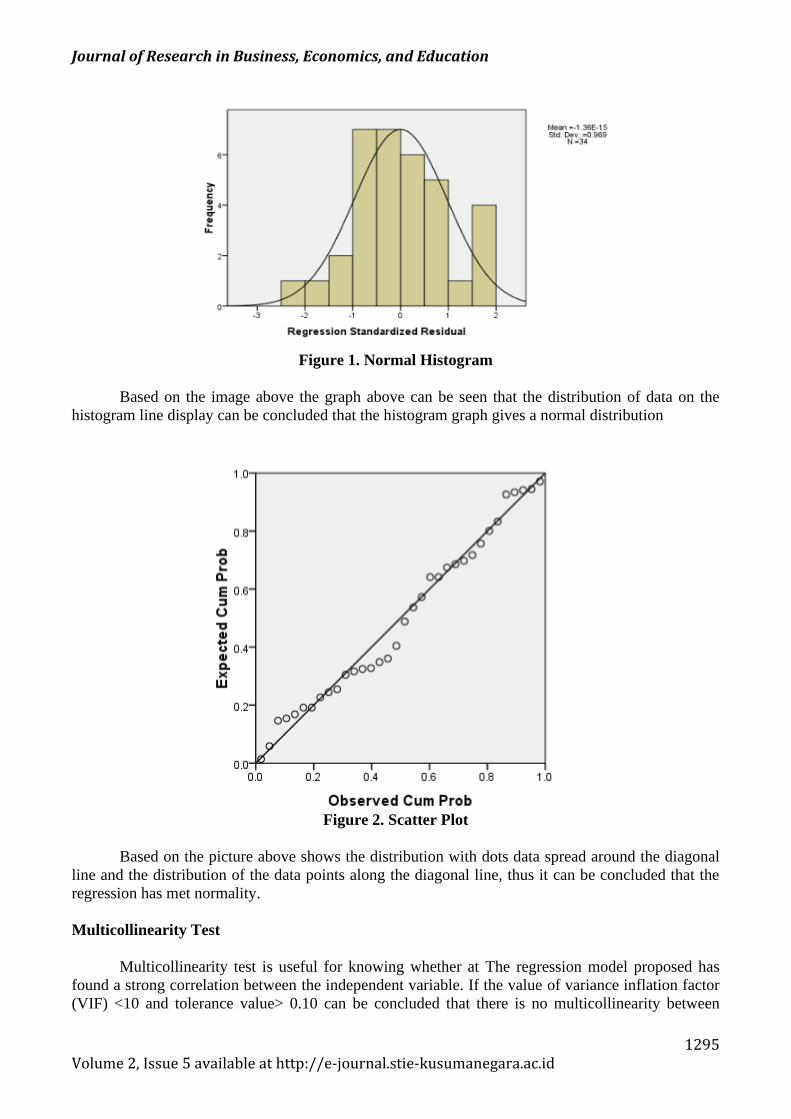
Figure 1. Normal Histogram
Based on the image above the graph above can be seen that the distribution of data on the
histogram line display can be concluded that the histogram graph gives a normal distribution
Figure 2. Scatter Plot
Based on the picture above shows the distribution with dots data spread around the diagonal
line and the distribution of the data points along the diagonal line, thus it can be concluded that the
regression has met normality.
Multicollinearity Test
Multicollinearity test is useful for knowing whether at The regression model proposed has
found a strong correlation between the independent variable. If the value of variance inflation factor
(VIF) <10 and tolerance value> 0.10 can be concluded that there is no multicollinearity between
Journal of Research in Business, Economics, and Education
1296 Volume 2, Issue 5 available at http://e-journal.stie-kusumanegara.ac.id
independent variables in the regression model tolerance value> 0.10 can be concluded that there is no
multicollinearity between independent variables in the regression model.
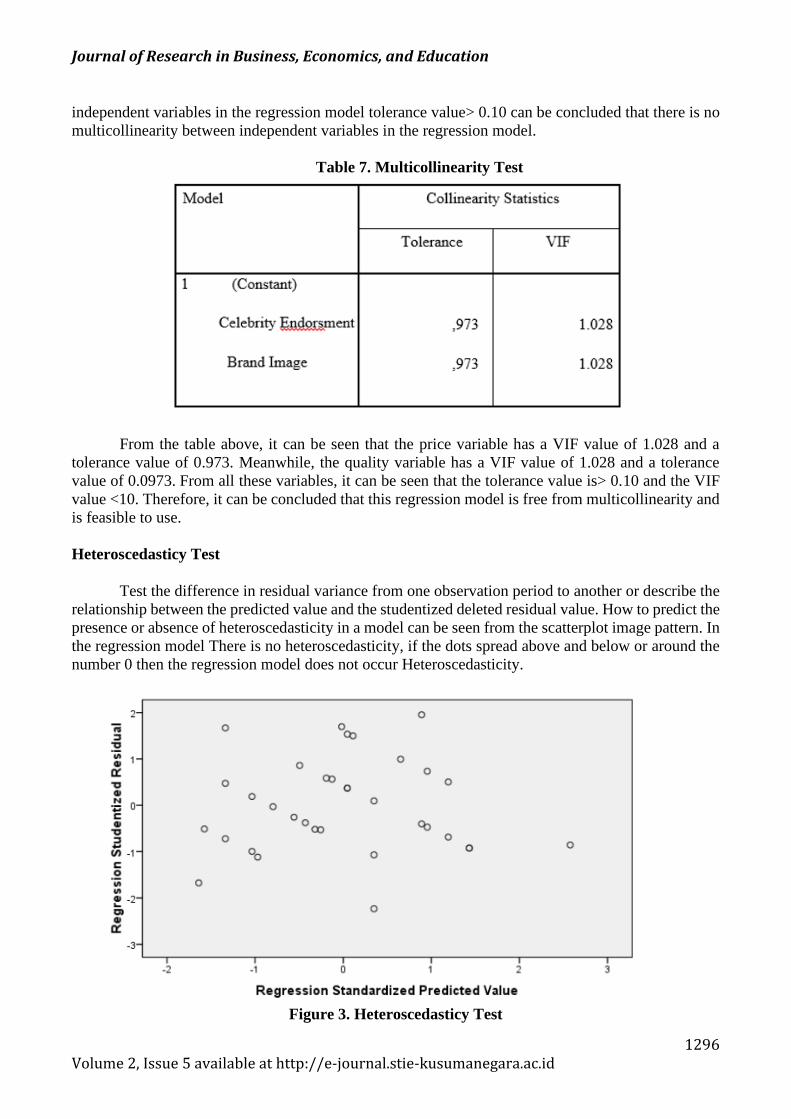
Table 7. Multicollinearity Test
From the table above, it can be seen that the price variable has a VIF value of 1.028 and a
tolerance value of 0.973. Meanwhile, the quality variable has a VIF value of 1.028 and a tolerance
value of 0.0973. From all these variables, it can be seen that the tolerance value is> 0.10 and the VIF
value <10. Therefore, it can be concluded that this regression model is free from multicollinearity and
is feasible to use.
Heteroscedasticy Test
Test the difference in residual variance from one observation period to another or describe the
relationship between the predicted value and the studentized deleted residual value. How to predict the
presence or absence of heteroscedasticity in a model can be seen from the scatterplot image pattern. In
the regression model There is no heteroscedasticity, if the dots spread above and below or around the
number 0 then the regression model does not occur Heteroscedasticity.
Figure 3. Heteroscedasticy Test
Journal of Research in Business, Economics, and Education
1297 Volume 2, Issue 5 available at http://e-journal.stie-kusumanegara.ac.id
From the picture above, it can be seen that the dots on the scatterplot are spread randomly and
are spread above or below the number 0. So it can be concluded that there is no heteroscedasticity in
the regression model, so the questionnaire model is suitable to be used to improve Elzatta Hijab
purchasing decisions for students in Jakarta. based on the independent variable (celebrity endorsement
and brand image).
Hypothesis Test
T-test (partial)
The t-test is used to test the effect partially, how is the effect of each independent variable (X1
and X2) on the dependent variable (Y). This test uses the criteria if tcount> t-table, then Ha is accepted,
and H0 is rejected or the independent variable has a significant effect on the dependent variable. And
if <ttable, then Ha is rejected, and H0 is accepted, or the independent variable does not have a
significant effect on the dependent variable. The price level used is 95%, then the value of α = 0.05,
and the amount of t table, is sought based on the formula df = n-k, where n = number of respondents
while = a number of variables (free + bound). So, df = 34 -2 = 32, t table is 1.690
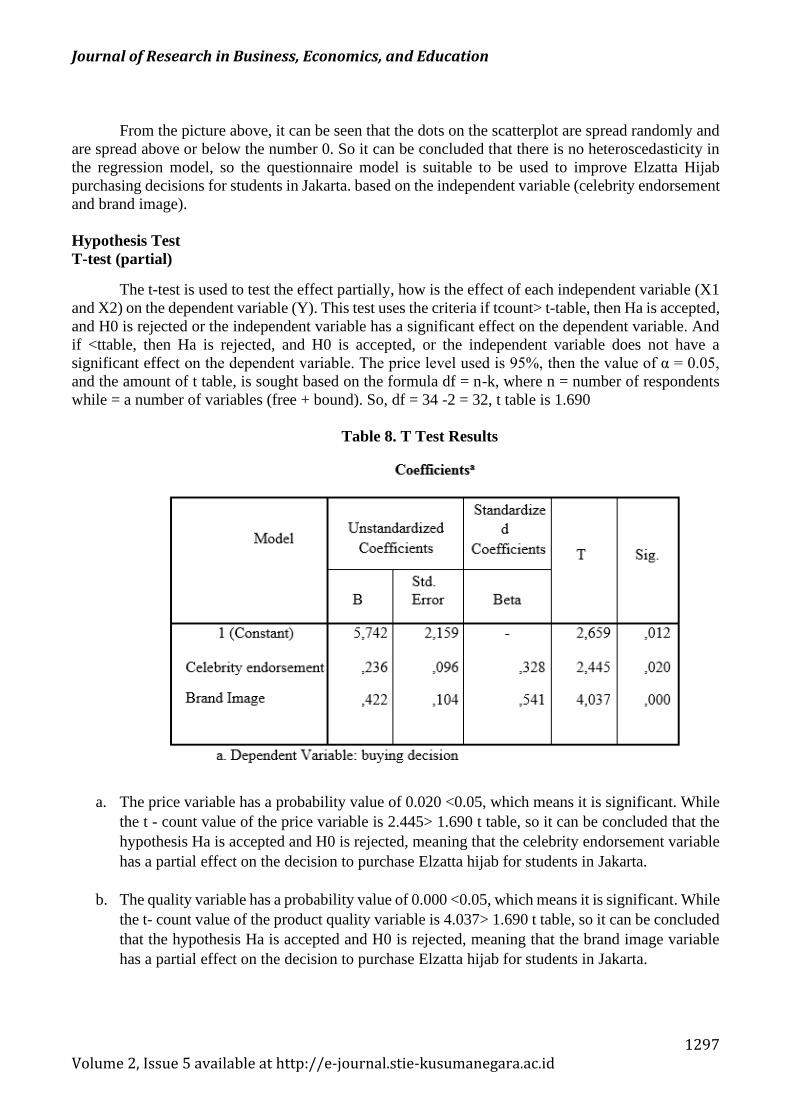
Table 8. T Test Results
a. The price variable has a probability value of 0.020 <0.05, which means it is significant. While
the t - count value of the price variable is 2.445> 1.690 t table, so it can be concluded that the
hypothesis Ha is accepted and H0 is rejected, meaning that the celebrity endorsement variable
has a partial effect on the decision to purchase Elzatta hijab for students in Jakarta.
b. The quality variable has a probability value of 0.000 <0.05, which means it is significant. While
the t- count value of the product quality variable is 4.037> 1.690 t table, so it can be concluded
that the hypothesis Ha is accepted and H0 is rejected, meaning that the brand image variable
has a partial effect on the decision to purchase Elzatta hijab for students in Jakarta.
Journal of Research in Business, Economics, and Education
1298 Volume 2, Issue 5 available at http://e-journal.stie-kusumanegara.ac.id
F test (Simultaneous)
The simultaneous test aims to determine whether the independent variables (price and quality)
have a joint influence on the dependent variable (purchase decision). This test uses the criteria if the
p-value <of the determined level of significance is determined, then the independent variables
simultaneously affect the dependent variable or can see the value of F. If the value of Fcount> Ftable
then simultaneously the independent variable affects the dependent variable. F- Table can be calculated
by means of df1 = k-1 and df2 = n-k, where k is the number of dependent and independent variables.
Then df1 = 3-1 = 2 and df2 = 34-3 = 31, so we get F-table is 3.30.
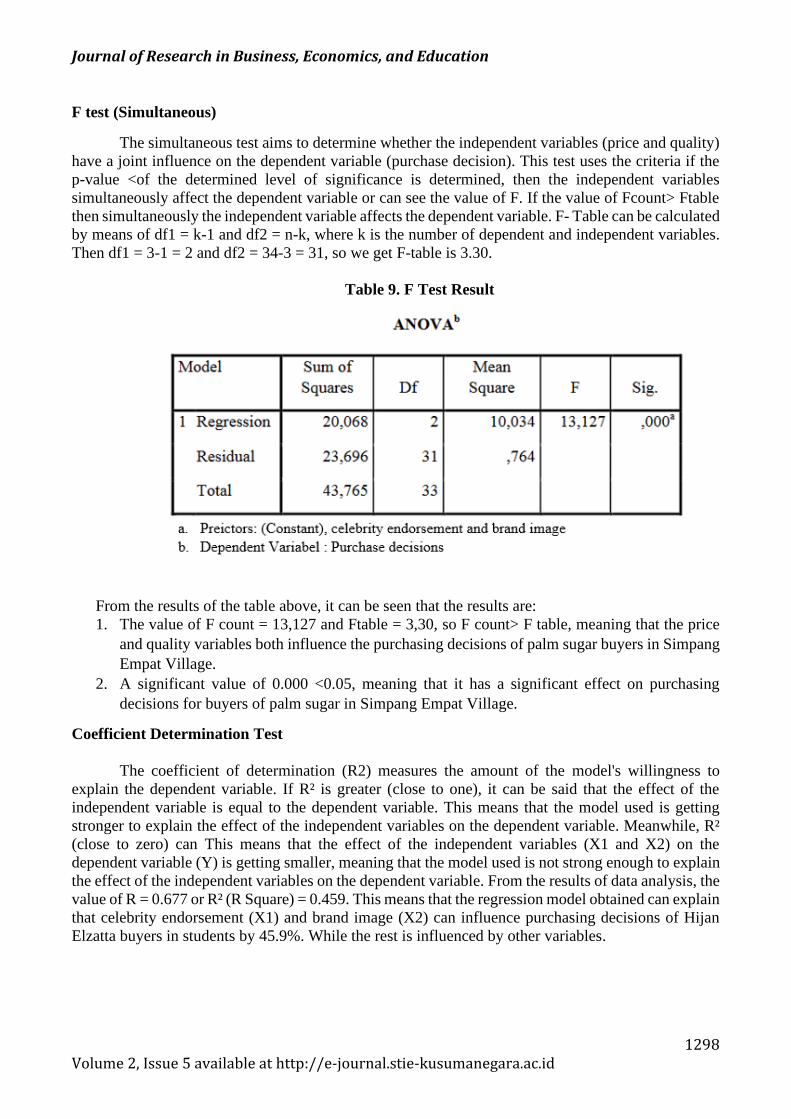
Table 9. F Test Result
From the results of the table above, it can be seen that the results are:
1. The value of F count = 13,127 and Ftable = 3,30, so F count> F table, meaning that the price
and quality variables both influence the purchasing decisions of palm sugar buyers in Simpang
Empat Village.
2. A significant value of 0.000 <0.05, meaning that it has a significant effect on purchasing
decisions for buyers of palm sugar in Simpang Empat Village.
Coefficient Determination Test
The coefficient of determination (R2) measures the amount of the model's willingness to
explain the dependent variable. If R² is greater (close to one), it can be said that the effect of the
independent variable is equal to the dependent variable. This means that the model used is getting
stronger to explain the effect of the independent variables on the dependent variable. Meanwhile, R²
(close to zero) can This means that the effect of the independent variables (X1 and X2) on the
dependent variable (Y) is getting smaller, meaning that the model used is not strong enough to explain
the effect of the independent variables on the dependent variable. From the results of data analysis, the
value of R = 0.677 or R² (R Square) = 0.459. This means that the regression model obtained can explain
that celebrity endorsement (X1) and brand image (X2) can influence purchasing decisions of Hijan
Elzatta buyers in students by 45.9%. While the rest is influenced by other variables.
Journal of Research in Business, Economics, and Education
1299 Volume 2, Issue 5 available at http://e-journal.stie-kusumanegara.ac.id
Model Test
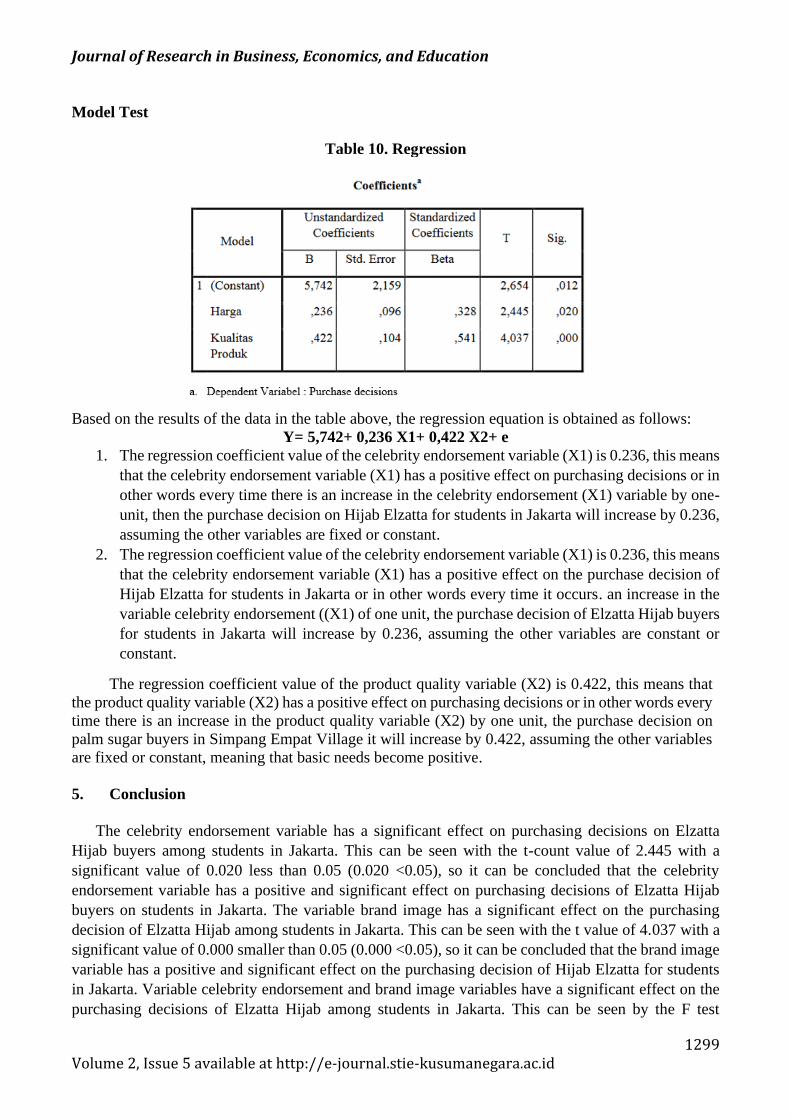
Table 10. Regression
Based on the results of the data in the table above, the regression equation is obtained as follows:
Y= 5,742+ 0,236 X1+ 0,422 X2+ e
1. The regression coefficient value of the celebrity endorsement variable (X1) is 0.236, this means
that the celebrity endorsement variable (X1) has a positive effect on purchasing decisions or in
other words every time there is an increase in the celebrity endorsement (X1) variable by one-
unit, then the purchase decision on Hijab Elzatta for students in Jakarta will increase by 0.236,
assuming the other variables are fixed or constant.
2. The regression coefficient value of the celebrity endorsement variable (X1) is 0.236, this means
that the celebrity endorsement variable (X1) has a positive effect on the purchase decision of
Hijab Elzatta for students in Jakarta or in other words every time it occurs. an increase in the
variable celebrity endorsement ((X1) of one unit, the purchase decision of Elzatta Hijab buyers
for students in Jakarta will increase by 0.236, assuming the other variables are constant or
constant.
The regression coefficient value of the product quality variable (X2) is 0.422, this means that
the product quality variable (X2) has a positive effect on purchasing decisions or in other words every
time there is an increase in the product quality variable (X2) by one unit, the purchase decision on
palm sugar buyers in Simpang Empat Village it will increase by 0.422, assuming the other variables
are fixed or constant, meaning that basic needs become positive.
5. Conclusion
The celebrity endorsement variable has a significant effect on purchasing decisions on Elzatta
Hijab buyers among students in Jakarta. This can be seen with the t-count value of 2.445 with a
significant value of 0.020 less than 0.05 (0.020 <0.05), so it can be concluded that the celebrity
endorsement variable has a positive and significant effect on purchasing decisions of Elzatta Hijab
buyers on students in Jakarta. The variable brand image has a significant effect on the purchasing
decision of Elzatta Hijab among students in Jakarta. This can be seen with the t value of 4.037 with a
significant value of 0.000 smaller than 0.05 (0.000 <0.05), so it can be concluded that the brand image
variable has a positive and significant effect on the purchasing decision of Hijab Elzatta for students
in Jakarta. Variable celebrity endorsement and brand image variables have a significant effect on the
purchasing decisions of Elzatta Hijab among students in Jakarta. This can be seen by the F test
Journal of Research in Business, Economics, and Education
1300 Volume 2, Issue 5 available at http://e-journal.stie-kusumanegara.ac.id
(simultaneous) with a value of 13.127 and F table of 3.30 so that fcount> f table with a significant
value of 0.000. Therefore, the significant value is smaller than 0.05 (0.000 <0.05), so it can be
concluded that the celebrity endorsement variable and brand image variable together have a positive
and significant effect on the purchasing decision of Elzatta Hijab for students in Jakarta.
References
Aaker, David A. dan Alexander L. Biel. 2009. Brand Equity and Advertising: Advertising Role in
Building Strong Brand. Lawrence Erlbaum Associates. Inc., Hillsdale.
Deliyanti Oentoro, Manajemen Pemasaran Modern. Yogyakarta: LaksBang PRESSindo, Juli 2012.
Fandy Tjiptono. 2012. Strategi Pemasaran, ed. 3, Yogyakarta, Andi
Ferrinadewi, Erna, 2008. Merek dan Psikologi Konsumen, Graha Ilmu, Yogyakarta.
Kotler, Philip dan Armstrong, Gary. 2012. Principles of Marketing. New Jersey: Prentice Hall.
Kotler, Philip and Kevin Lane Keller, (2016): Marketing Management, 15th Edition New Jersey:
Pearson Pretice Hall, Inc
Peter, J Paul dan Olson, J.C. (2014). Perilaku Konsumen dan Strategi Pemasaran. Salemba Empat.
Revita, Frimayasa, Kurniawan (2018). Pengaruh kualitas produk terhadapp keputusan pembelian
smartphone merek Samsung. Managerial – Jurnal Penelitian Ilmu Manajemen Vol. 1 No. 1 2018
Schiffman dan Kanuk. 2007. Perilaku Konsumen. Edisi Kedua, Jakarta: PT. Indeks Gramedia
Sugiyono. (2017). Metode Penelitian Kuantitatif, Kualitatif, dan R&D. Bandung : Alfabeta, CV.