the economic impact of virginia s agriculture and forest ... · the economic impact of virginia’s...
TRANSCRIPT

The economic impacT
of Virginia’s agriculTure
and foresT indusTries
WELDON COOPERCENTER FOR PUBLIC SERVICE
University of Virginia
Terance J. Rephann, Ph.D.May 2017

2

The Economic Impact of Virginia’s Agriculture and Forest Industries
Terance J. Rephann, Ph.D.
Weldon Cooper Center for Public ServiceUniversity of Virginia
May 2017

ii
Copyright © 2017 by the Rector and Visitors of the University of Virginia
P.O. Box 400206Charlottesville, VA 22904(434) 982-5522 • FAX: (434) 982-5524 • TDD: (434) 982-HEARWebsite: www.coopercenter.org/ Richmond11 South 12th Street, Suite 225Richmond, VA 23219-4035(804) 371-0202 • FAX: (804) 371-0234 • TDD: (804) 982-HEAR
SouthwestOne College AvenueWise, VA 24293(276) 328-0133 • FAX: (276) 328-0233 • TDD (540) 328-0191
iii
TABLE OF CONTENTS
List of Tables ............................................................................................................................................ ivList of Figures ........................................................................................................................................... vPreface ....................................................................................................................................................viiStudy Highlights ....................................................................................................................................... 1Executive Summary .................................................................................................................................. 3Introduction ............................................................................................................................................... 7Section 1 Virginia’s Agriculture and Forestry Industries .......................................................................... 9 Agriculture........................................................................................................................................... 9 Forestry .............................................................................................................................................. 18 Governor’s Agriculture and Forestry Industries Development Program .......................................... 24Section 2 Methodology .......................................................................................................................... 27 AgricultureandForestry-RelatedIndustryIdentification ................................................................. 27 Economic Impact Modeling .............................................................................................................. 28 Data ................................................................................................................................................... 29Section 3 Results .................................................................................................................................... 31 Statewide Economic Impacts ............................................................................................................ 31 Leading Agriculture Commodity Economic Impacts ........................................................................ 34 International Export Economic Impacts ............................................................................................ 35 Locality Economic Impacts ............................................................................................................... 35Section4OtherAgricultureandForestryImpactsandBenefits ............................................................ 39 Other Farm-Related Income .............................................................................................................. 39 Agriculture and Forest-Related Tourism and Recreation .................................................................. 39 Other Economic Impacts ................................................................................................................... 40 Environment and Quality of Life ...................................................................................................... 41Section 5 Summary and Conclusion ...................................................................................................... 43References ............................................................................................................................................... 45Appendices .............................................................................................................................................. 49
iv
LIST OF TABLES
Table 1.1 Virginia Biomass Power Generation Plants .............................................................................22Table 1.2 Virginia Wood Pellet Plants .....................................................................................................22Table 3.1 Virginia Agriculture and Forestry-Related Industries Direct Output, Employment, and Value-added, 2015 ......................................................................................................................31Table 3.2 Virginia Total, Direct, Indirect, and Induced Impacts of Agriculture and Forestry-Related Industries, 2015 .................................................................................................................................32Table 3.3 Total Impact of Virginia’s Agriculture and Forestry-Related Industries by Major Industry, 2015 ...................................................................................................................................32Table 3.4 Total Impact of Virginia’s Agriculture and Forestry-Related Industries by Component: Output, Employment and Value-Added in Millions of Dollars, 2015 ..............................................34Table 3.5 Virginia Total, Direct, Indirect, and Induced Impacts of Leading Agricultural Commodities, 2015 ...........................................................................................................................35Table 3.6 Virginia Total, Direct, Indirect, and Induced Impacts of Agriculture and Forestry-Related Industry Exports, 2015 ......................................................................................................................35Table 4.1 Top Rural, Agriculture and Forest Activities and Attractions for Virginia Leisure Visitors, 2015 ....................................................................................................................................40Table 4.2 Wildlife Recreation Economic Impacts in Virginia, 2011........................................................40Table 4.3 Ecological Values of Virginia Farm and Forest Land ..............................................................41Table A.1 Virginia Agriculture and Forestry-Related Industries by Component .....................................49Table B.1 Virginia Agricultural Cash Receipts by IMPLAN Sector, 2008-2015 ...................................51Table C.1 Direct and Total Economic Impacts of Virginia Agriculture and Forestry-Related Industries by Locality, Output 2015 .................................................................................................53Table C.2 Direct and Total Economic Impacts of Virginia Agriculture and Forestry-Related Industries by Locality, Employment 2015 ........................................................................................56Table C.3 Direct and Total Economic Impacts of Virginia Agriculture and Forestry-Related Industries by Locality, Value-added 2015 .........................................................................................59
v
LIST OF FIGURES
Figure 1.1 Cash Receipts by Commodity, Virginia, 2015..........................................................................9Figure 1.2 Virginia Agricultural Nominal and Real Cash Receipts, 1990-2015 ......................................10Figure 1.3 Virginia Farm Employment and Land Area, 1990-2015 ........................................................10Figure 1.4 Change in Virginia Farm Commodity Sales by Size and State Specialization, 2011-2015 ... 11Figure 1.5 Government Payments as a Percentage of Virginia Farm Gross Cash Income, 1990-2015...12Figure 1.6 Farm Employment as Percentage of Total Employment by Locality, 2015 ...........................12Figure 1.7 Food Consumption Per Capita in U.S., 1970-2014 ................................................................13Figure 1.8 Direct Sales of Agricultural Products, Virginia, 1997-2012 ...................................................14Figure 1.9 Virginia Agriculture-Related Product Exports by Industry, 2002-2016 .................................15Figure 1.10 Virginia Agriculture-Related Manufacturing Employment, 2000-2015 ...............................16Figure 1.11 Brewery, Winery, and Distillery Employment in Virginia, 1990-2015 ................................16Figure 1.12 Virginia Stumpage Values, FY 1978-2016 ...........................................................................19Figure 1.13 Value of Virginia Stumpage by Locality, FY 2016 ...............................................................19Figure 1.14 Virginia Forest Product Manufacturing Employment, 2000-2015 .......................................20Figure 1.15 Virginia Forestry-Related Product Exports by Industry, 2002-2016 ....................................21Figure 1.16 AFID Grant Recipients and Number of Jobs Expected, FY2013-FY2016 ..........................25Figure 3.1 Virginia Direct Effects by Agriculture and Forestry Component, 2015 .................................31Figure 3.2 Distribution of Virginia’s Direct, Indirect, and Induced Employment Impacts by Industry, 2015 ..................................................................................................................................33Figure 3.3 Virginia Total Impacts by Agriculture and Forestry Component, 2015 .................................33Figure 3.4 Agriculture and Forestry-Related Industry Employment Impact by Locality, 2015 ..............36Figure 3.5 Agriculture-Related Industry Employment Impact by Locality, 2015 ...................................37Figure 3.6 Forestry-Related Industry Employment Impact by Locality, 2015 ........................................37

vi
vii
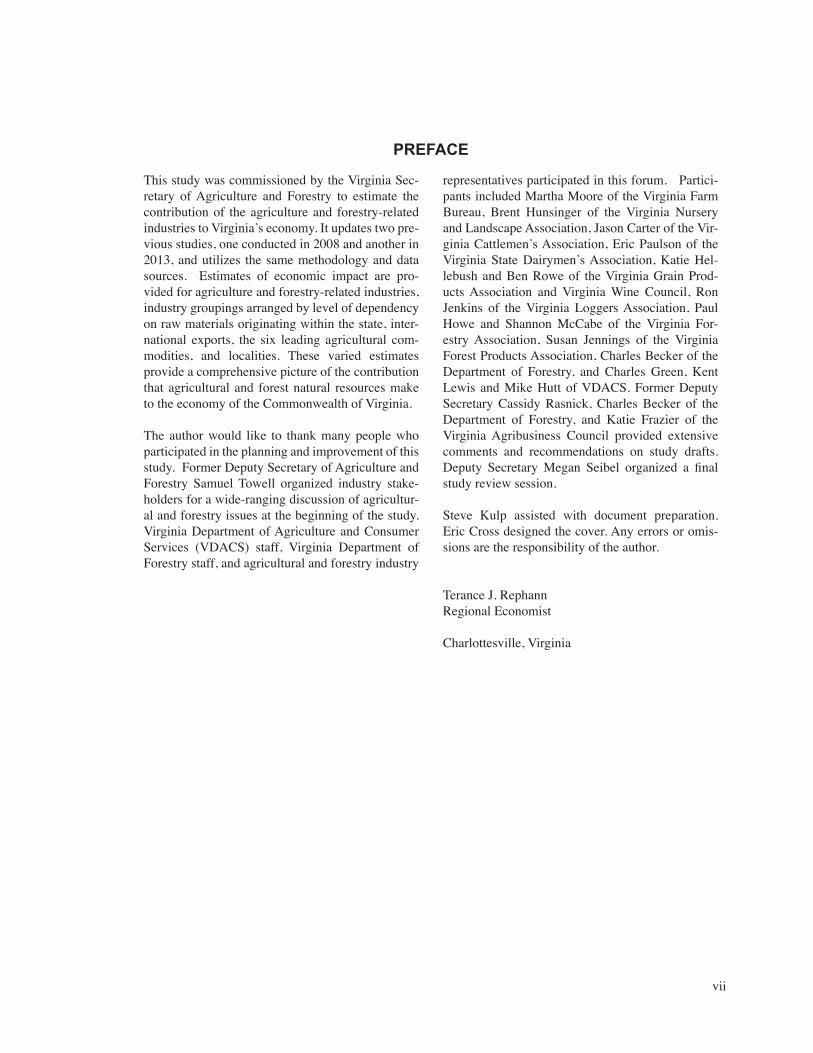
This study was commissioned by the Virginia Sec-retary of Agriculture and Forestry to estimate the contribution of the agriculture and forestry-related industries to Virginia’s economy. It updates two pre-vious studies, one conducted in 2008 and another in 2013, and utilizes the same methodology and data sources. Estimates of economic impact are pro-vided for agriculture and forestry-related industries, industry groupings arranged by level of dependency on raw materials originating within the state, inter-national exports, the six leading agricultural com-modities, and localities. These varied estimates provide a comprehensive picture of the contribution that agricultural and forest natural resources make to the economy of the Commonwealth of Virginia.
The author would like to thank many people who participated in the planning and improvement of this study. Former Deputy Secretary of Agriculture and Forestry Samuel Towell organized industry stake-holders for a wide-ranging discussion of agricultur-al and forestry issues at the beginning of the study. Virginia Department of Agriculture and Consumer Services (VDACS) staff, Virginia Department of Forestry staff, and agricultural and forestry industry
representatives participated in this forum. Partici-pants included Martha Moore of the Virginia Farm Bureau, Brent Hunsinger of the Virginia Nursery and Landscape Association, Jason Carter of the Vir-ginia Cattlemen’s Association, Eric Paulson of the Virginia State Dairymen’s Association, Katie Hel-lebush and Ben Rowe of the Virginia Grain Prod-ucts Association and Virginia Wine Council, Ron Jenkins of the Virginia Loggers Association, Paul Howe and Shannon McCabe of the Virginia For-estry Association, Susan Jennings of the Virginia Forest Products Association, Charles Becker of the Department of Forestry, and Charles Green, Kent Lewis and Mike Hutt of VDACS. Former Deputy Secretary Cassidy Rasnick, Charles Becker of the Department of Forestry, and Katie Frazier of the Virginia Agribusiness Council provided extensive comments and recommendations on study drafts. Deputy Secretary Megan Seibel organized a final study review session.
Steve Kulp assisted with document preparation. Eric Cross designed the cover. Any errors or omis-sions are the responsibility of the author.
Terance J. RephannRegional Economist
Charlottesville, Virginia
PREFACE

viii

1
STUDY HIGHLIGHTS
Agriculture and Forestry• The total economic impact of agricul-
ture and forestry-related industries in Virginia was over $91 billion in total industry output in 2015, the base year used for this study. The total employment impact was 442,260 employees, representing 8.7 percent of total state employment. The total value-added impact was $45.5 billion, which made up 9.5 percent of state gross domestic product.
• Every job created in agriculture and for-estry-related industries results in another 1.7 jobs in the Virginia economy. Every dollar generated in value-added results in another $1.15 value-added in the Virginia economy.
• The impacts of agriculture and forestry-related industries are felt throughout Vir-ginia’s economy. The largest effects are in the directly affected agriculture, forestry, and manufacturing industries. However, agricul-ture and forestry stimulate activity elsewhere in the economy through the effects of industry purchases and subsequent rounds of indirect and induced spending. Through these cumu-lative effects, agriculture and forestry-related industries affect every sector.
• Every Virginia locality is touched by agriculture and forestry industries. Total employment impacts exceeded 1,000 jobs for sixty-two localities. Agricultural economic impacts were geographically diffuse. The largest clusters of agricultural-related indus-try employment impact were located in the Shenandoah Valley, Northern Virginia, and Central Virginia. The largest forestry-related economic impacts tended to be somewhat more geographically concentrated in the Southside region and communities with pulp
and paper mills such as Alleghany County and Covington City.
• The total economic impact of agricul-ture and forestry-related industry exports is approximately 47,000 jobs, $4.6 billion in value-added, and nearly $9 billion in total output. One in nine Virginia farm jobs can be attributed to these international exports.
• Results drawn from other recent studies indicate that Virginia agritourism and for-est recreation are important components of the state’s tourism spending and economic impact, accounting for millions of visitors and billions of dollars of tourism-related spending and economic impact each year.
• Agriculture and forestry landscapes pro-vide substantial environmental and other soci-etal benefits. Forests improve air and waterquality, mitigate flood vulnerability, providewildlife habitat, and aid biodiversity. Rural landscapes provide scenic amenities that con-tribute to the quality of life. The value of air and water environmental services provided by farmland and forestland likely amounts to at least several billion dollars each year.
Agriculture • The total impact of agriculture-related
industries was approximately $70 billion in total industry output, 334,300 jobs, and $36.2 billion in value-added.
Forestry• The forestry sector had a total impact
of over $21 billion in total industry output, approximately 107,900 jobs, and $9.3 billion in value-added.

2
3
EXECUTIVE SUMMARY
Virginia’s agriculture and forestry industries have played a significant role in the growth and devel-opment of Virginia’s economy. They are still major contributors and their economic impacts can be felt far and wide, encompassing much more than the farms and forests with which they are most closely identified. The sectors affected include process-ing and manufacturing industries such as food and beverage processing, textile manufacturing, wood products manufacturing, pulp and paper mills, and furniture manufacturing, which often utilize Virgin-ia farm commodities and timber. Distribution firms such as grain elevators and raw commodity ware-houses rely on supplies of Virginia farm and forest products as well. These production, manufacturing, and distribution sectors purchase material and ser-vice inputs, labor, and value-added services from Virginia-based businesses and households. These purchases generate a multiplier effect that ripples through the Virginia economy. In this way, Virginia agriculture and forestry activity affects every indus-try and region of the state to varying degrees.
Virginia’s agriculture and forestry sectors have emerged from the recent recession and significant restructuring induced by international competition and are growing once again. The agricultural sector is benefitting from increased international exports, rapid growth of traditional poultry and beef product markets, the expansion of specialty industries that range from craft beverage producers to shellfish aquaculture, and reduced drag from tobacco and textile industry decline. A slow but steady recov-ery in the housing market, increasing international exports of lumber and other wood products, and new markets for wood-based fuels such as biomass and wood pellets are contributing to a revival in the forestry sector. The Commonwealth of Virginia has also taken an active role in promoting industry expansion through a new economic incentive pro-gram called the Governor’s Agriculture and Forest-ry Industries Development (AFID) program, ensur-ing that agriculture and forestry continue to play an important role in the Virginia economy in the future.
Virginia’s farm cash receipts grew rapidly over the period 2009 to 2015 in tandem with a general boom in commodity prices. Real cash receipts increased 40 percent from 2009 to the peak year of 2014 before decreasing 10 percent in 2015. This growth corre-sponded with a rebound in state farm employment from 50,570 in 2009 to 54,842 in 2014 before easing to 52,406 in 2015. Farmland area was unchanged from 2009 to 2015 at an estimated 8.1 million acres.
Virginia’s agricultural commodity mix has also changed in recent years. Recent farm sales growth has been driven largely by the cattle and poultry (broilers and turkey) sectors. Among crops, corn and soybeans have also enjoyed significant growth. The largest absolute decline occurred in dairy pro-duction. Dairy prices peaked in 2014 and experi-enced a substantial decline in 2015. Greenhouse and nursery product sales experienced only marginal growth despite a pickup in housing construction and slow improvement in median household incomes over the period. Although much smaller than the other sectors, the aquaculture industry is also rap-idly growing.
Virginia’s food, beverage, and fiber processors and manufacturers are the largest purchasers of Virgin-ia agricultural commodities. The growth of these industries has been steady but slow since the end of the recent recession. Continual investment in man-ufacturing automation is one factor constraining employment growth. Another factor is the continued erosion in some historically significant industries such as tobacco products and textiles and apparel industries. However, the rate of decline for these now smaller industries has slowed significantly and now exert less overall effect on the headline num-bers. One area that has experienced dramatic growth is the specialty beverage industry. Craft beverage firms have continued to expand their presence in the state, including wineries, breweries, and distilleries.
Virginia’s forestry-related employment has bounced back since 2011. The sector is much more sensitive
4
to the business cycle and housing market activity; thus the gradual improvement in economic and housing construction activity has boosted produc-tion and employment. Increasing international exports of roundwood and wood products have pro-vided additional stimulus. Timber harvesting shows significant improvement, reaching an all-time high of $388 million in FY2015 before dropping back to $336 million in FY2016. Forest products employ-ment has modestly recovered to 31,323 jobs from a low point of 29,877 jobs in 2011. However, this total is still a far cry from the pre-recessionary level of 51,597 jobs in 2006 when national housing con-struction activity was at its peak. The vast majority of growth since 2011 has occurred in wood products manufacturing, reflecting improvement in the hous-ing market since that time. Furniture manufacturing and pulp and paper manufacturing, in contrast, have experienced little change. This new equilibrium is a significant improvement over the steady atrophy of jobs that characterized the last decade, and reflects growth in consumer demand in the current recovery as well as industry restructuring that has restored global competitiveness.
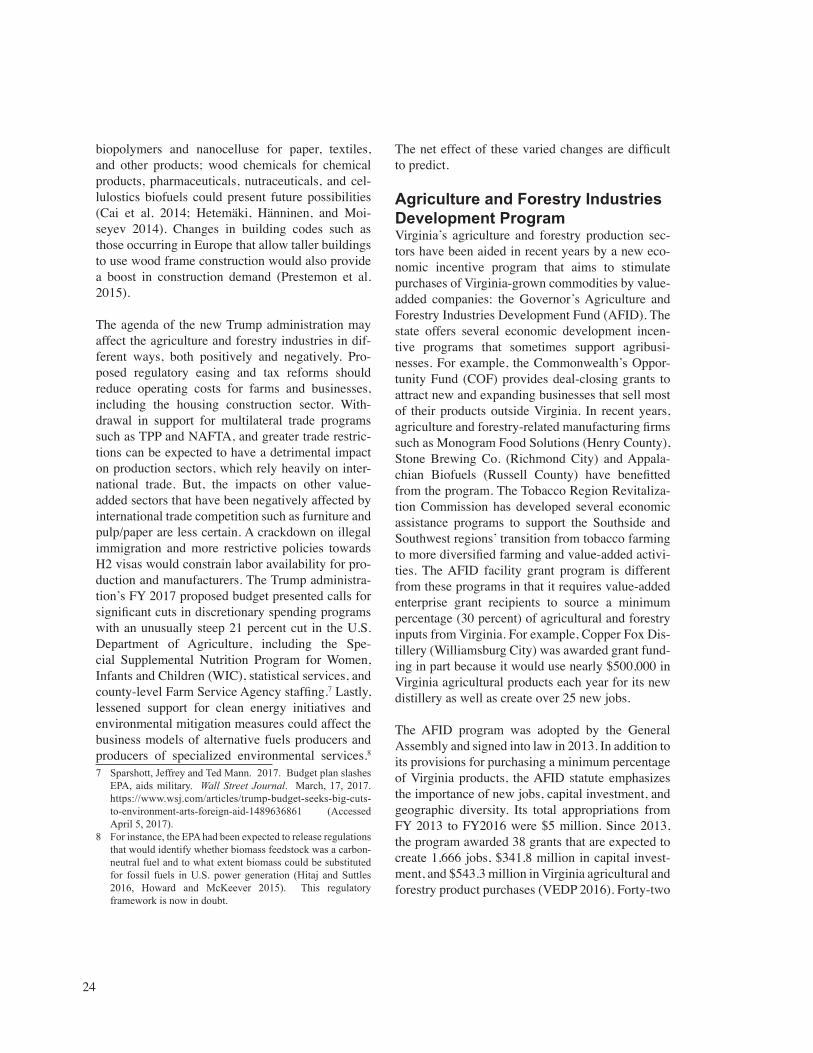
Virginia’s agriculture and forestry production sec-tors have been assisted in recent years by the intro-duction of a new economic incentive program that aims to stimulate purchases of Virginia-grown com-modities by value-added companies: the Governor’s Agriculture and Forestry Industries Development Fund (AFID). The AFID program was adopted by the General Assembly and signed into law by the Governor in 2013. The AFID facility grant requires value-added enterprise grant recipients to source a minimum percentage (30 percent) of raw agricultur-al and forestry inputs from Virginia while promot-ing employment creation and geographic diversity. Total appropriations for the program from FY 2013 to FY2016 were $5 million with a project-level cap of $250,000. Since 2013, the program has awarded 38 grants that are expected to create 1,666 jobs, $341.8 million in capital investment, and $543.3 million in purchases of Virginia agricultural and forestry products.
Virginia’s agriculture and forestry sectors continue to play an important role in the commonwealth
economy. Using the same methodology adopted in two previous studies (The Economic Impact of Agriculture and Forestry on the Commonwealth of Virginia in 2008 and The Economic Impacts of Agriculture and Forest Industries in Virginia in 2013), we gauge the magnitude of that economic contribution or “economic impact.” Agriculture and forestry-related industries are disaggregated into four components: production, “core” processing, “extended” processing, and distribution, reflecting different positions in the value chain and degree of dependency on Virginia’s agriculture and forestry natural resources. “Production” activities are those industries associated with growing and harvesting basic farm, commodities timber, and non-timber commodities. “Core” industries are manufactur-ing industries that are heavily dependent on state commodity inputs for production and are unlikely to exist within the state if the state did not produce the commodity. “Extended” processing industries are those agriculture and forestry industries that rely heavily on other inputs or imported inputs. In many instances, these industries’ location choices are influenced by consumer market proximity, labor availability, or other factors rather than distance to agricultural commodity or timber inputs.
This study uses input-output analysis to perform the economic impact analysis. Input-output analy-sis produces industry-specific multipliers that show how economic activity in one sector of the economy affects the overall state economy.
For this study, we are interested in how changes in agricultural and forestry-related activity affect the state economy. The total impact of agricultural and forest-related activity consists of three parts, a “direct effect,” “an indirect effect,” and an “induced effect.” The direct effect consists of the injection of economic activity or expenditure into the region, namely the sales of agricultural and forestry-related industries located in Virginia. This direct expendi-ture then causes a “ripple effect” on the state econ-omy when money is re-spent. For instance, Virginia businesses provide supplies and services to farms such as seeds, fertilizer, veterinarian services, utili-ties and insurance. These businesses spend a portion of their sales revenues on purchases of supplies and
5
services from other state firms who, in turn, purchase a portion of their supplies and services from other resident firms. This cascading sequence of spending continues until the subsequent rounds of spending dissipate due to leakages in the form of spending outside the state. The cumulative effect of these cas-cading rounds of inter-industry purchases is referred to as the indirect effect. The final component of total impact (the induced effect) is attributable to the spending of households and other economic agents. For instance, businesses pay households for their labor services. These households then purchase goods and services from Virginia firms who in turn receive a portion of their labor, material and public service inputs from within the state. Again leakages occur at each round due to purchases of goods and services outside the state. The induced effect is the sum of the impacts associated with these household purchases
This study makes statewide economic impact esti-mates for agriculture and forestry- related industries. Economic impacts are evaluated using three differ-ent measures: total industrial output, employment, and value-added. The study also disaggregates the economic impacts in various ways including the four different industry components described earlier: production, core processing, extended processing, and distribution. The study estimates the statewide economic impact of Virginia’s agricultural and for-estry-related international exports. It also provides economic impact estimates for each of Virginia’s six leading agricultural commodities (i.e., poultry, beef, dairy, grains, greenhouse and nurseries, and soy-beans). These six industries account for nearly 84 percent of Virginia’s total farm cash receipts. Lastly, it furnishes economic impact estimates for each of Virginia’s localities.
In 2015, the direct effect of Virginia agriculture and forestry-related industries accounted for $52 billion in total output, approximately 164,700 employees, and over $21 billion in value-added. Agriculture pro-duction is the largest component in terms of employ-ment at nearly 33 percent. However, the category of agriculture extended processing accounts for nearly 45 percent of output and 60 percent of value-added.
The total economic impact (including direct, indi-rect, and induced effects) of agriculture and forest-ry-related industries was over $91 billion in total industry output or sales. The value-added impact was approximately $45 billion dollars, which con-stitutes approximately 9.5 percent of Virginia gross domestic product (GDP). The total employment impact is approximately 442,000 employees or 8.7 percent of total state employment.
The impacts of agriculture and forestry were felt in every sector of the economy. The largest effects were in the manufacturing and agriculture and for-estry industries where direct effects were domi-nant. However, agriculture and forestry stimulated trade, services, government and other sectors as well through the effects of industry, household, and government purchases and subsequent rounds of spending.
The economic impacts were distributed unevenly among agriculture and forestry sectors and among production, core processing, extended processing, distribution, and government payments compo-nents. Agriculture-related activities account for over 75 percent of total agriculture and forestry-related output, employment and value-added impacts with forestry-related activities making up the remainder. Relative to the state economy, agriculture-related industry impacts represent approximately 7.5 per-cent of Virginia’s GDP. Forestry-related industry represents 2 percent.
Among the industry components, production industry impacts make up 19 percent of the total employment impact but a considerably small-er share, 7 percent, of value-added. This partly reflects the presence of many part-time farmers and seasonal employees in the sector. Core pro-cessing makes up 25 percent of employment and 24 percent of value-added. Extended processing is the largest economic impact category, representing 44 percent of employment and 61 percent of value-added. Distribution and power generation activi-ties account for 12 percent of employment and 8 percent of value-added.
6
Results for Virginia’s localities show that every single Virginia locality is touched by agriculture and forestry. Employment impacts exceeded 1,000 jobs in 62 separate localities. Agricultural eco-nomic impacts were geographically diffuse. The largest clusters of agricultural-related industry employment impact were located in the Shenan-doah Valley, Northern Virginia, and the Richmond City area. The largest forestry-related impacts tend to be somewhat more geographically concentrated in the Southside region and communities with pulp and paper mills such as Alleghany County and Covington City.
International exports are a significant source of agriculture and forestry-related industry economic impacts. The total impacts of agriculture and for-estry-related industry exports are approximately $9 billion in total output, 46,600 jobs, and nearly $4.6 billion in value-added. Therefore, about 10 percent of the total output, employment, and value-added impacts can be attributed to international exports. Forestry-related industries account for 32 percent of the export output impact, 34 percent of the export employment impact and 29 percent of the export value-added impact. The total employment impact of international exports on the farming sector is 5,693 jobs out of a total 52,406 farm jobs in 2015. Therefore, one in nine Virginia farm jobs is depen-dent on international exports.
Among Virginia’s agriculture-related industries, the largest economic impact in terms of total out-put ($6.8 billion) and value-added ($2.3 billion) is the poultry industry. The largest industry in terms of employment impact (37,450) is the beef cattle industry, which reflects partly the role of nearly 15,000 cattle farmers and farm employees. The dairy industry also has a sizeable economic impact, including over 16,000 jobs, approximately $4.3 bil-lion in total output, and $2.2 billion in value-added. The economic impacts in these sectors are amplified because of the importance of local supply chains in production and the presence of sizeable value-add-ed manufacturing activities connected to the sector. Smaller in size, but still economically significant, are the grains, greenhouse, and soybeans industries.
Virginia’s agriculture and forestry industries gener-ate economic impacts and other social benefits that are not represented in the economic impacts present-ed here. For example, the study does not capture the economic activity linked to corporate and regional offices, research and development, and other opera-tions of agribusiness manufacturing firms. Virginia hosts agribusiness-related headquarters for Fortune 500 companies such as Altria and WestRock and other notable companies such as Smithfield Foods, Universal Corporation, Mars, Inc., American Wood-mark, and Southern States Cooperative. The study also does not measure the economic impacts of on-farm recreational service or value-added product sales and off-farm agritourism and forest recreation, such as spending on hotels, restaurants, and retail establishments. These activities include freshwater fishing, hunting, hiking and backpacking, camping, wildlife watching, equine events and horseback rid-ing, winery, brewery, and distillery visitation, and other agritourism. Studies of these activities con-ducted in recent years suggest that visitors can be counted in the millions and that economic impacts sum to several billion dollars. Thus, the common-wealth’s agricultural and forest resources are also vital assets for Virginia’s tourism industry.
Virginia’s farm and forest landscapes provide impor-tant environmental benefits to the commonwealth. These benefits include improved water and air qual-ity, flood risk mitigation, and wildlife habitat conser-vation. Open space preservation can also limit urban sprawl and lower the public costs of development such as the provision of public infrastructure, pol-lution and traffic congestion. Farm and forest open space preserves scenic beauty and helps maintain a sense of place. Quantifying the value of water and air quality improvements using environmental ben-efit parameters from scientific studies allows us to estimate conservatively that that the commonwealth receives approximately $184 million in value each year from agriculture and $6.7 billion in value from forestry in these areas alone.
7
INTRODUCTION
Virginia’s agriculture and forestry industries have played a significant role in the growth and develop-ment of Virginia’s economy. They are still major contributors and their economic impacts can be felt far and wide, encompassing more than the farms and forests with which they are most closely identi-fied. The sectors affected include processing and manufacturing industries such as food and beverage processing, textiles manufacturing, wood products manufacturing, pulp and paper mills, and the fur-niture manufacturing industry which often utilize Virginia farm and timber products supplies. Distri-bution firms such as grain elevators and raw com-modity warehouses rely on supplies of Virginia farm and forest products as well. These produc-tion, manufacturing, and distribution sectors pur-chase material and service inputs, labor, and value-added services from Virginia-based businesses and households. These purchases generate a multiplier effect that ripples through the Virginia economy. In this way, Virginia agriculture and forestry activ-ity affects every industry and region of the state to varying degrees.
This study updates two earlier studies on the eco-nomic impact of Virginia’s agriculture and forest industries (Rephann 2008, 2013) and preserves many features of those studies. It uses the same input-output methodology as the studies, and defines and disaggregates the industry in a similar manner. Agriculture and forestry-related industries are disaggregated into four components: production, “core” processing, “extended” processing, and dis-tribution, reflecting different positions in the value
chain and degree of dependency on Virginia’s agri-culture and forestry natural resources.
This study also expands on the presentation of the previous studies. Those studies provided statewide economic impact estimates, county-specific eco-nomic impact estimates, and international exports economic impact estimates. This study provides economic impact estimates of each of Virginia’s six leading agricultural commodities (i.e., poultry, beef, dairy, grains, greenhouse and nurseries, and soybeans). These six industries account for nearly 84 percent of Virginia’s total farm cash receipts. As in the previous studies, this study describes and quantifies other social and economic contributions of agriculture and forestry to Virginia, such as ben-eficial environmental effects, agritourism and forest recreation impacts, and other economic effects.
The study consists of five sections. The first sec-tion examines characteristics of the agriculture and forestry production, manufacturing, and distribu-tion sectors in Virginia. It also examines recent industry fluctuations and trends. The second sec-tion describes the data and methodology used in the study. It describes input-output analysis and the computer model (IMPLAN) used, the method of delineating the industry, and the date sources used in estimation. The third section presents the results. The fourth section describes other economic impacts and social benefits of agriculture and forest-ry in Virginia that are not captured in the economic impact analysis. The final section is a summary and conclusion.

8
9
SECTION 1VIRGINIA’S AGRICULTURE AND FORESTRY INDUSTRIES
Virginia’s agriculture and forestry sectors have emerged from the recent recession and significant restructuring brought on by international competi-tion and are growing once again. A slow but steady recovery in the housing market, increasing interna-tional exports of roundwood and other wood prod-ucts, and new markets for wood-based fuels such as biomass and wood pellets are contributing to a revival in the forestry sector. The agricultural sec-tor is also benefitting from increased international exports, rapid growth of traditional poultry and beef product markets, the expansion of specialty indus-tries that range from craft beverage producers to shellfish aquaculture, and reduced drag from tobac-co and textile industry decline. The Commonwealth of Virginia has taken an active role in promoting industry expansion through economic incentive pro-grams such as the recently established Governor’s Agriculture and Forestry Industries Development (AFID) program, ensuring that it continues to play an important role in the Virginia economy. This sec-tion examines in greater detail the characteristics of Virginia agricultural and forestry production and related value-added industries, describes changes that have occurred in recent years, and outlines developments that may influence the trajectory of future growth.
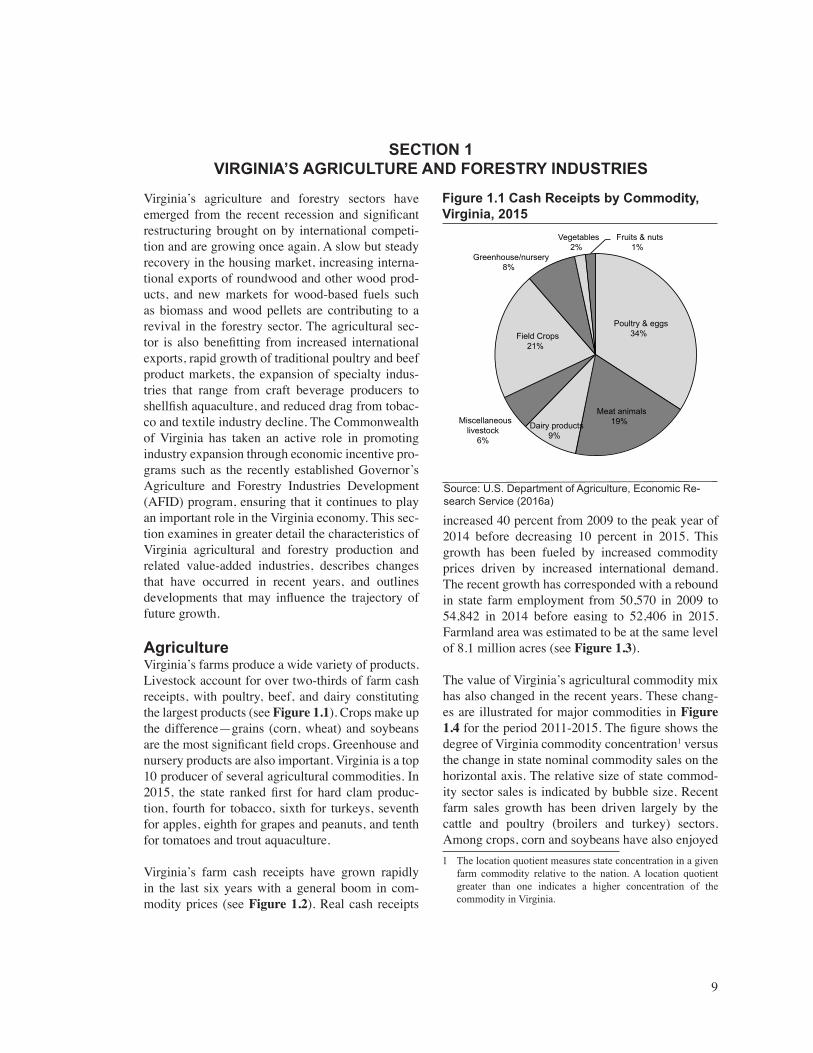
AgricultureVirginia’s farms produce a wide variety of products. Livestock account for over two-thirds of farm cash receipts, with poultry, beef, and dairy constituting the largest products (see Figure 1.1). Crops make up the difference—grains (corn, wheat) and soybeans are the most significant field crops. Greenhouse and nursery products are also important. Virginia is a top 10 producer of several agricultural commodities. In 2015, the state ranked first for hard clam produc-tion, fourth for tobacco, sixth for turkeys, seventh for apples, eighth for grapes and peanuts, and tenth for tomatoes and trout aquaculture.
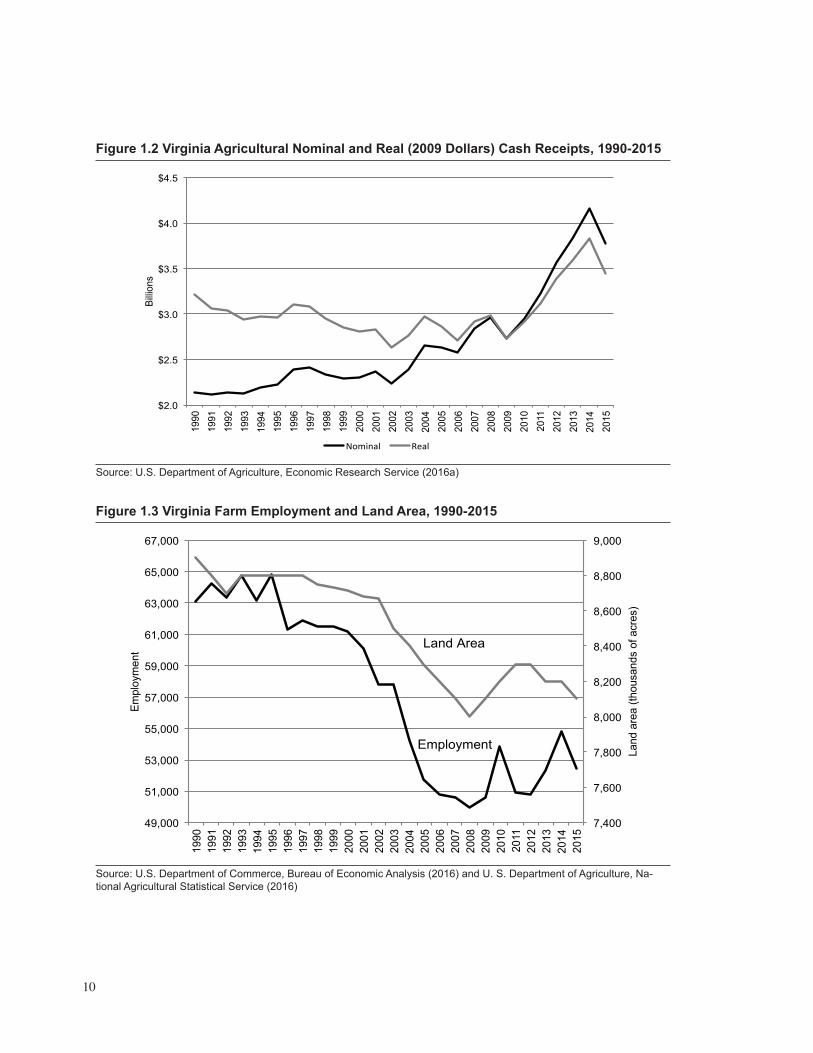
Virginia’s farm cash receipts have grown rapidly in the last six years with a general boom in com-modity prices (see Figure 1.2). Real cash receipts
increased 40 percent from 2009 to the peak year of 2014 before decreasing 10 percent in 2015. This growth has been fueled by increased commodity prices driven by increased international demand. The recent growth has corresponded with a rebound in state farm employment from 50,570 in 2009 to 54,842 in 2014 before easing to 52,406 in 2015. Farmland area was estimated to be at the same level of 8.1 million acres (see Figure 1.3).
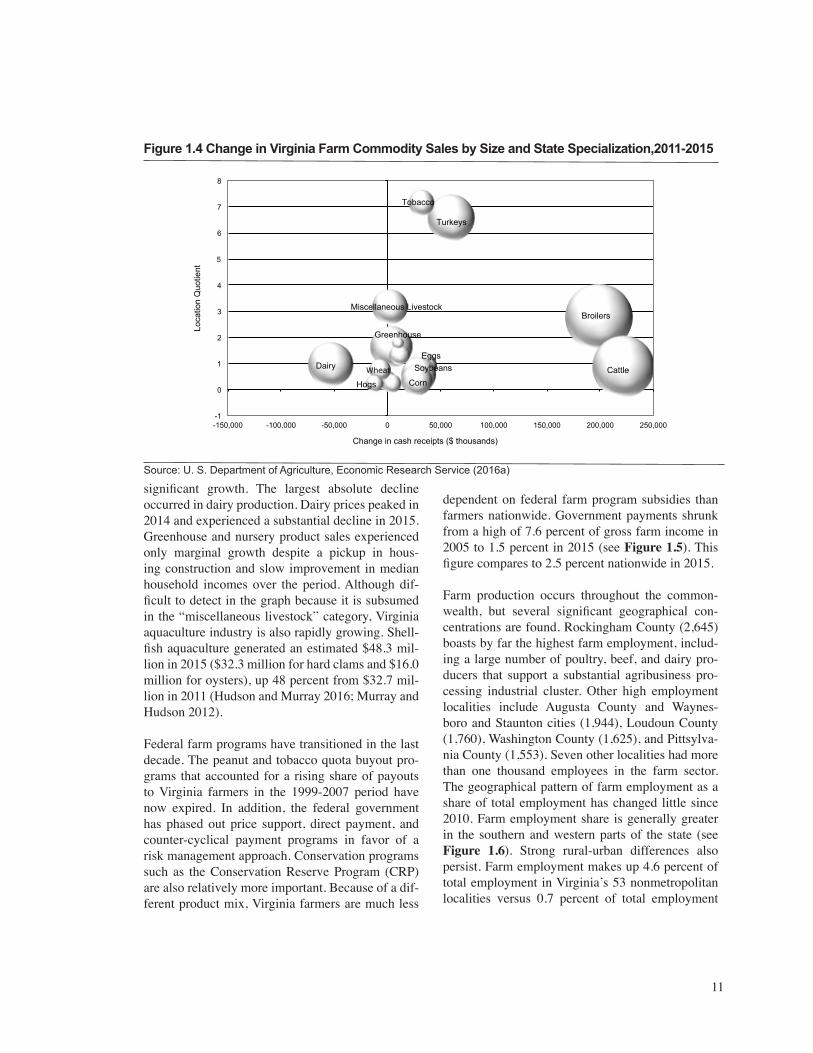
The value of Virginia’s agricultural commodity mix has also changed in the recent years. These chang-es are illustrated for major commodities in Figure 1.4 for the period 2011-2015. The figure shows the degree of Virginia commodity concentration1 versus the change in state nominal commodity sales on the horizontal axis. The relative size of state commod-ity sector sales is indicated by bubble size. Recent farm sales growth has been driven largely by the cattle and poultry (broilers and turkey) sectors. Among crops, corn and soybeans have also enjoyed
Poultry & eggs 34%
Meat animals 19% Dairy products
9%
Miscellaneous livestock
6%
Field Crops 21%
Greenhouse/nursery 8%
Vegetables 2%
Fruits & nuts 1%
Figure 1.1 Cash Receipts by Commodity, Virginia, 2015
Source: U.S. Department of Agriculture, Economic Re-search Service (2016a)
1 The location quotient measures state concentration in a given farm commodity relative to the nation. A location quotient greater than one indicates a higher concentration of the commodity in Virginia.
10
Figure 1.2 Virginia Agricultural Nominal and Real (2009 Dollars) Cash Receipts, 1990-2015
Source: U.S. Department of Agriculture, Economic Research Service (2016a)
$2.0
$2.5
$3.0
$3.5
$4.0
$4.5
1990
19
91
1992
19
93
1994
19
95
1996
19
97
1998
19
99
2000
20
01
2002
20
03
2004
20
05
2006
20
07
2008
20
09
2010
20
11
2012
20
13
2014
20
15
Billio
ns
Nominal Real
Figure 1.3 Virginia Farm Employment and Land Area, 1990-2015
Source: U.S. Department of Commerce, Bureau of Economic Analysis (2016) and U. S. Department of Agriculture, Na-tional Agricultural Statistical Service (2016)
7,400
7,600
7,800
8,000
8,200
8,400
8,600
8,800
9,000
49,000
51,000
53,000
55,000
57,000
59,000
61,000
63,000
65,000
67,000
1990
19
91
1992
19
93
1994
19
95
1996
19
97
1998
19
99
2000
20
01
2002
20
03
2004
20
05
2006
20
07
2008
20
09
2010
20
11
2012
20
13
2014
20
15
Land
are
a (th
ousa
nds
of a
cres
)
Empl
oym
ent Land Area
Employment
11
significant growth. The largest absolute decline occurred in dairy production. Dairy prices peaked in 2014 and experienced a substantial decline in 2015. Greenhouse and nursery product sales experienced only marginal growth despite a pickup in hous-ing construction and slow improvement in median household incomes over the period. Although dif-ficult to detect in the graph because it is subsumed in the “miscellaneous livestock” category, Virginia aquaculture industry is also rapidly growing. Shell-fish aquaculture generated an estimated $48.3 mil-lion in 2015 ($32.3 million for hard clams and $16.0 million for oysters), up 48 percent from $32.7 mil-lion in 2011 (Hudson and Murray 2016; Murray and Hudson 2012).
Federal farm programs have transitioned in the last decade. The peanut and tobacco quota buyout pro-grams that accounted for a rising share of payouts to Virginia farmers in the 1999-2007 period have now expired. In addition, the federal government has phased out price support, direct payment, and counter-cyclical payment programs in favor of a risk management approach. Conservation programs such as the Conservation Reserve Program (CRP) are also relatively more important. Because of a dif-ferent product mix, Virginia farmers are much less
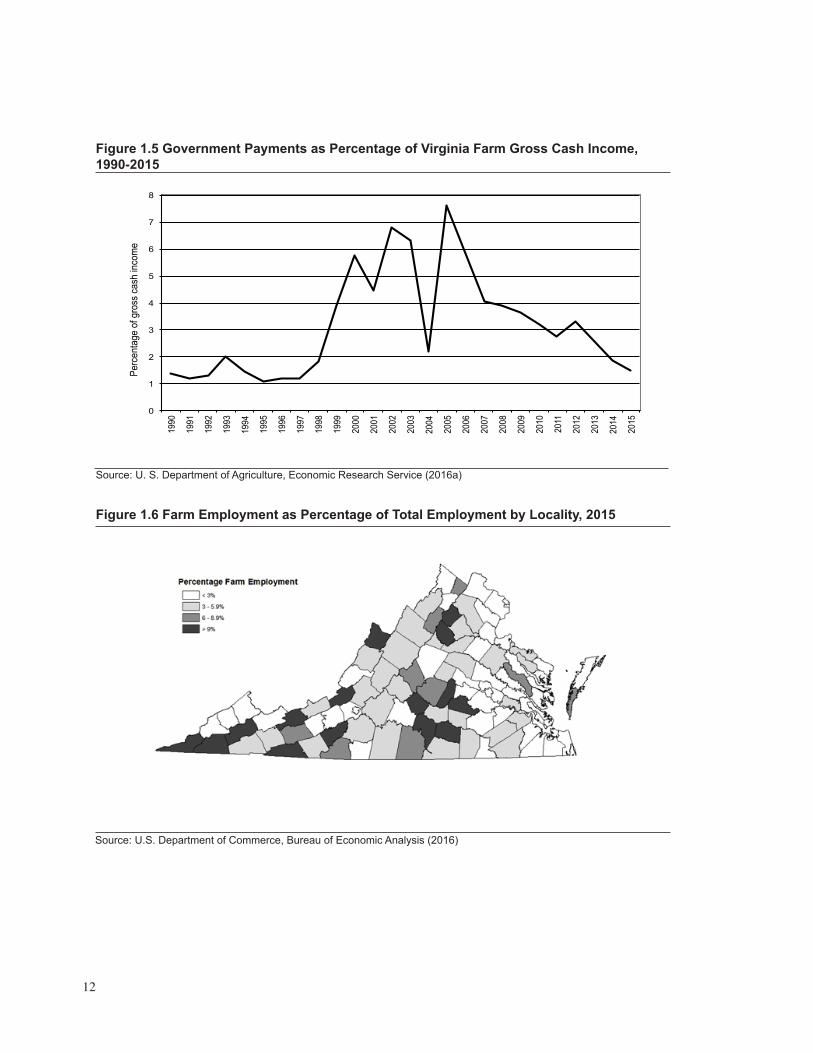
dependent on federal farm program subsidies than farmers nationwide. Government payments shrunk from a high of 7.6 percent of gross farm income in 2005 to 1.5 percent in 2015 (see Figure 1.5). This figure compares to 2.5 percent nationwide in 2015.
Farm production occurs throughout the common-wealth, but several significant geographical con-centrations are found. Rockingham County (2,645) boasts by far the highest farm employment, includ-ing a large number of poultry, beef, and dairy pro-ducers that support a substantial agribusiness pro-cessing industrial cluster. Other high employment localities include Augusta County and Waynes-boro and Staunton cities (1,944), Loudoun County (1,760), Washington County (1,625), and Pittsylva-nia County (1,553). Seven other localities had more than one thousand employees in the farm sector. The geographical pattern of farm employment as a share of total employment has changed little since 2010. Farm employment share is generally greater in the southern and western parts of the state (see Figure 1.6). Strong rural-urban differences also persist. Farm employment makes up 4.6 percent of total employment in Virginia’s 53 nonmetropolitan localities versus 0.7 percent of total employment
-1
0
1
2
3
4
5
6
7
8
-150,000 -100,000 -50,000 0 50,000 100,000 150,000 200,000 250,000
Loca
tion
Quo
tient
Change in cash receipts ($ thousands)
Tobacco
Miscellaneous Livestock
Wheat Dairy
Broilers
Corn
Greenhouse
Cattle
Hogs
Soybeans Eggs
Turkeys
Figure 1.4 Change in Virginia Farm Commodity Sales by Size and State Specialization,2011-2015
Source: U. S. Department of Agriculture, Economic Research Service (2016a)
12
Source: U. S. Department of Agriculture, Economic Research Service (2016a)
Figure 1.5 Government Payments as Percentage of Virginia Farm Gross Cash Income, 1990-2015
0
1
2
3
4
5
6
7
8
1990
1991
1992
1993
1994
1995
1996
1997
1998
1999
2000
2001
2002
2003
2004
2005
2006
2007
2008
2009
2010
2011
2012
2013
2014
2015
Perc
enta
ge o
f gro
ss c
ash
inco
me
Source: U.S. Department of Commerce, Bureau of Economic Analysis (2016)
Figure 1.6 Farm Employment as Percentage of Total Employment by Locality, 2015
13
in metropolitan areas. As illustrated in Rephann (2013), the Commonwealth also exhibits some-times pronounced regional specializations. Poultry production is important in the Shenandoah Valley and the Eastern Shore. Crop farming forms a bigger proportion of farming activities in the eastern half of the state where terrain is flatter while livestock farming is more common in the more mountainous west.
Virginia’s farm economy continues to survive and often thrive because of a number of factors. The state provides a favorable climate for growing a variety of crops and sheltering livestock. It has an ample supply of fertile farmland. It is ideally located in close proximity to major growing northeastern urban markets. It has ready access to quality mul-timodal transportation, including the east coast’s deepest-water seaport, inland intermodal container transfer facilities in Richmond and Front Royal, and excellent highway and rail infrastructure. The state is also rated highly on many business climate met-rics that evaluate the cost of doing business in the state such as tax levels, regulatory burdens, labor costs, and energy costs. The state’s land-grant uni-
versities at Virginia Tech and Virginia State Univer-sity and Virginia Cooperative Extension provide a wide range of educational, farm assistance, research and development, and technology commercializa-tion services for the farm and forestry sectors. State public policy has also been very supportive. These policies include a Secretariat of Agriculture and Forestry that oversees progress in the state agribusi-ness sector, marketing and export assistance, land preservation policies that protect valuable open spaces and farmland, land use value taxation and agricultural and forestry districts that decrease the costs of farm operation, and a newly created indus-trial incentive program (Governor’s Agriculture and Forestry Industries Development) that supports the attraction and expansion of agribusiness enterpris-es that purchase Virginia grown farm and forestry commodities.
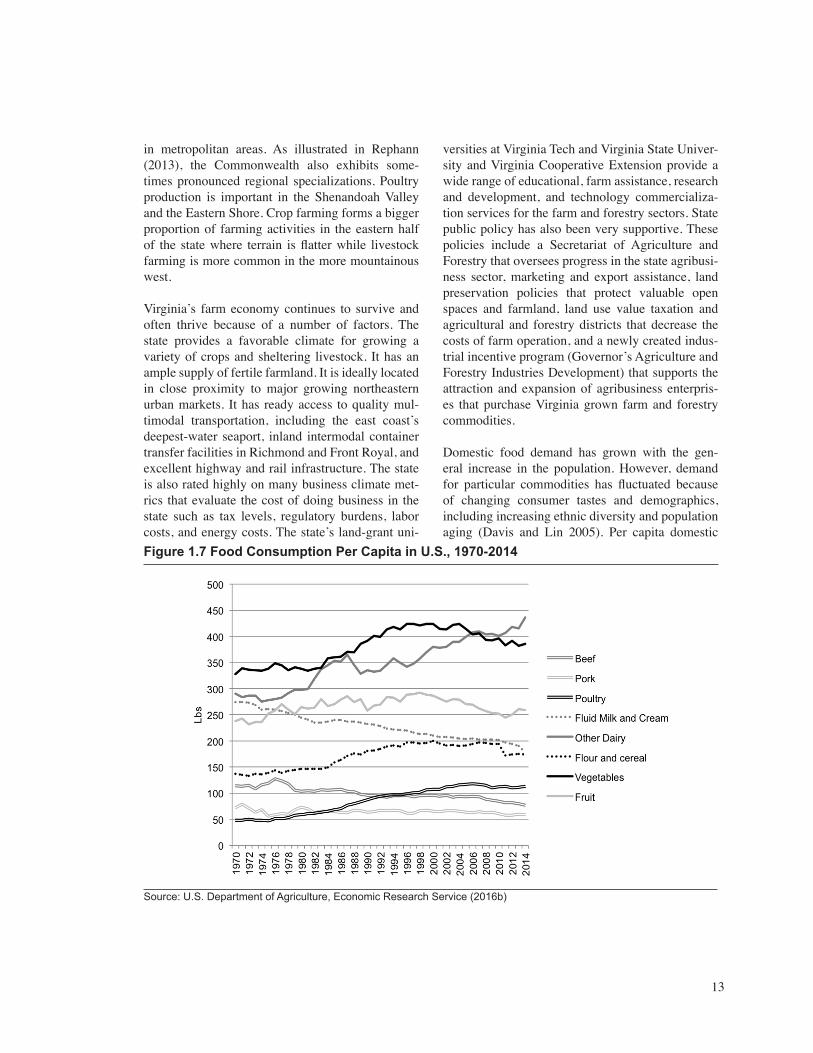
Domestic food demand has grown with the gen-eral increase in the population. However, demand for particular commodities has fluctuated because of changing consumer tastes and demographics, including increasing ethnic diversity and population aging (Davis and Lin 2005). Per capita domestic
Source: U.S. Department of Agriculture, Economic Research Service (2016b)
Figure 1.7 Food Consumption Per Capita in U.S., 1970-2014
14
demand for red meat such as beef and pork prod-ucts has been trending downward while poultry consumption has increased (see Figure 1.7) due to dietary changes and price factors.2 Demand for fluid milk products has been in long-term decline, while demand for other solid dairy products such as cheese and yogurt has increased. Public health advocates and U.S. dietary guidelines are prodding consumers to reduce their consumption of meat and add more fish and vegetables to their diets. Although increased consumption is not yet evident in overall fruit and vegetable consumption figures, growth in the consumption of fresh fruits and vegetables has occurred.
Another consumer trend is the growing popularity of local, organic, and natural (non GMO and anti-biotic free) products. The growth of these products reflects increasing consumer concern about the quality, nutrition, and medicinal properties of foods
and the social, environmental, and animal welfare impacts of their production processes. Italsoreflectsthe success of local food marketing efforts such as the Buy Fresh Buy Local campaign and Virginia Grown in the Commonwealth.
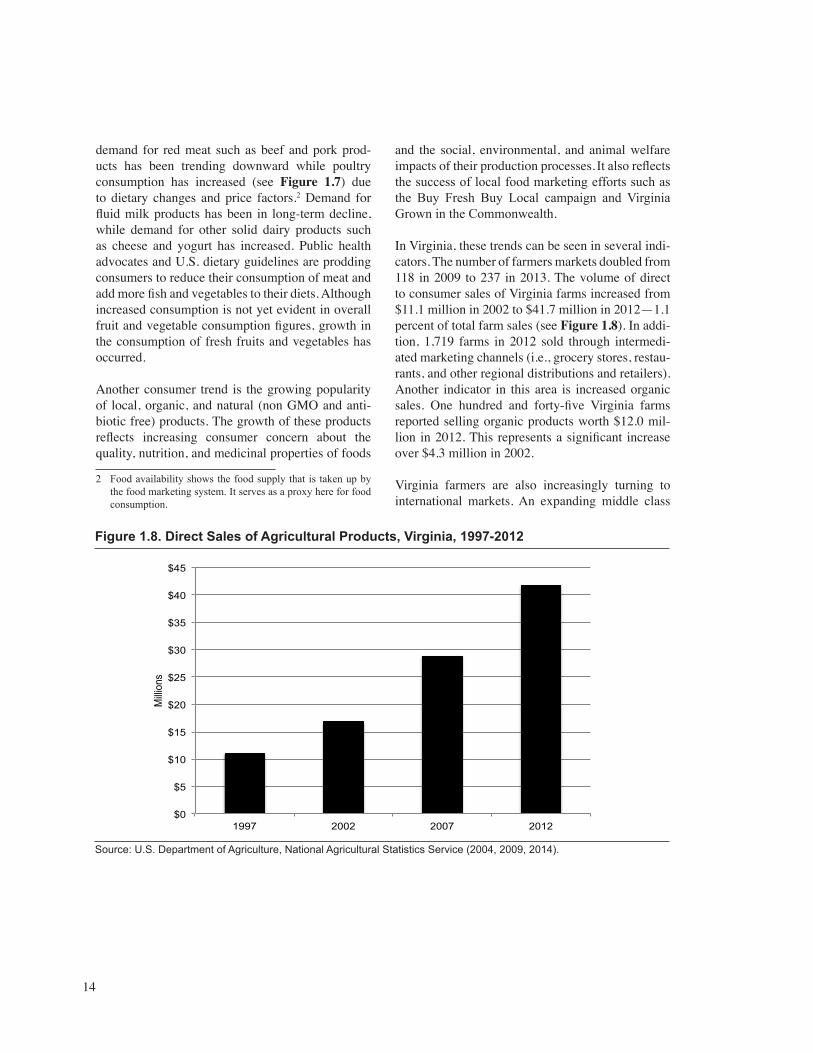
In Virginia, these trends can be seen in several indi-cators. The number of farmers markets doubled from 118 in 2009 to 237 in 2013. The volume of direct to consumer sales of Virginia farms increased from $11.1 million in 2002 to $41.7 million in 2012—1.1 percent of total farm sales (see Figure 1.8). In addi-tion, 1,719 farms in 2012 sold through intermedi-ated marketing channels (i.e., grocery stores, restau-rants, and other regional distributions and retailers). Another indicator in this area is increased organic sales. One hundred and forty-five Virginia farms reported selling organic products worth $12.0 mil-lion in 2012. This represents a significant increase over $4.3 million in 2002.
Virginia farmers are also increasingly turning to international markets. An expanding middle class
2 Food availability shows the food supply that is taken up by the food marketing system. It serves as a proxy here for food consumption.
Source: U.S. Department of Agriculture, National Agricultural Statistics Service (2004, 2009, 2014).
Figure 1.8. Direct Sales of Agricultural Products, Virginia, 1997-2012
$0
$5
$10
$15
$20
$25
$30
$35
$40
$45
1997 2002 2007 2012
Milli
ons
15
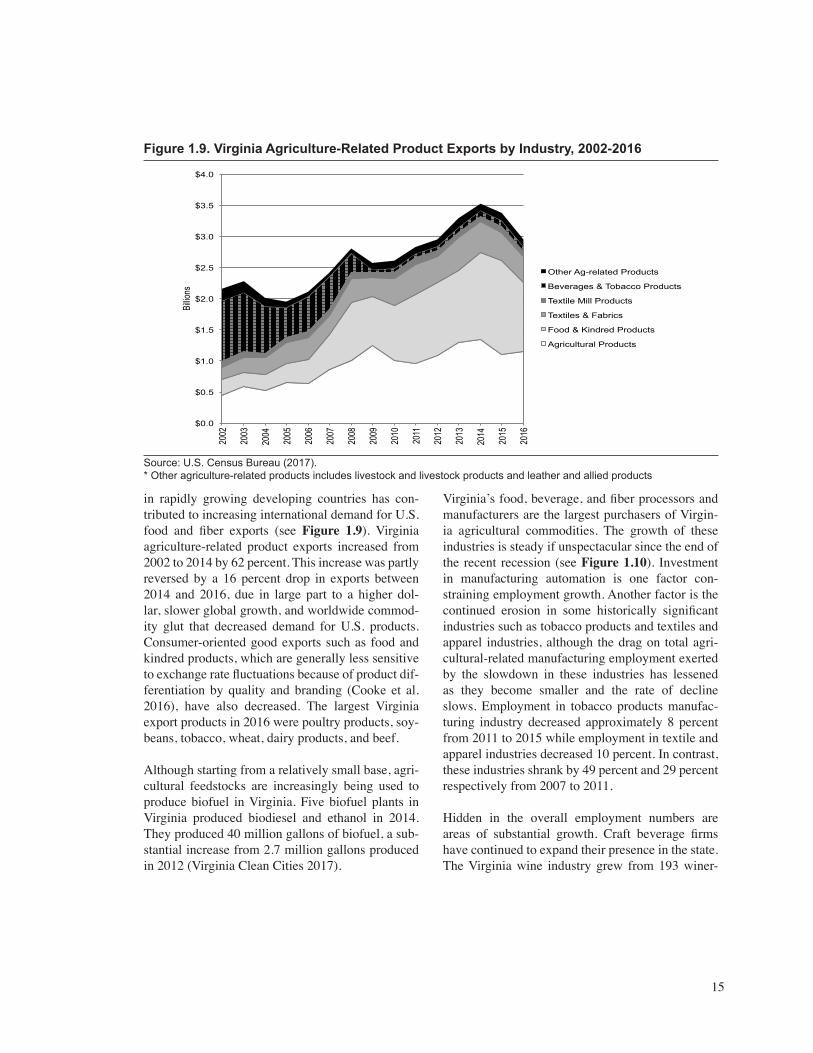
in rapidly growing developing countries has con-tributed to increasing international demand for U.S. food and fiber exports (see Figure 1.9). Virginia agriculture-related product exports increased from 2002 to 2014 by 62 percent. This increase was partly reversed by a 16 percent drop in exports between 2014 and 2016, due in large part to a higher dol-lar, slower global growth, and worldwide commod-ity glut that decreased demand for U.S. products. Consumer-oriented good exports such as food and kindred products, which are generally less sensitive to exchange rate fluctuations because of product dif-ferentiation by quality and branding (Cooke et al. 2016), have also decreased. The largest Virginia export products in 2016 were poultry products, soy-beans, tobacco, wheat, dairy products, and beef.
Although starting from a relatively small base, agri-cultural feedstocks are increasingly being used to produce biofuel in Virginia. Five biofuel plants in Virginia produced biodiesel and ethanol in 2014. They produced 40 million gallons of biofuel, a sub-stantial increase from 2.7 million gallons produced in 2012 (Virginia Clean Cities 2017).
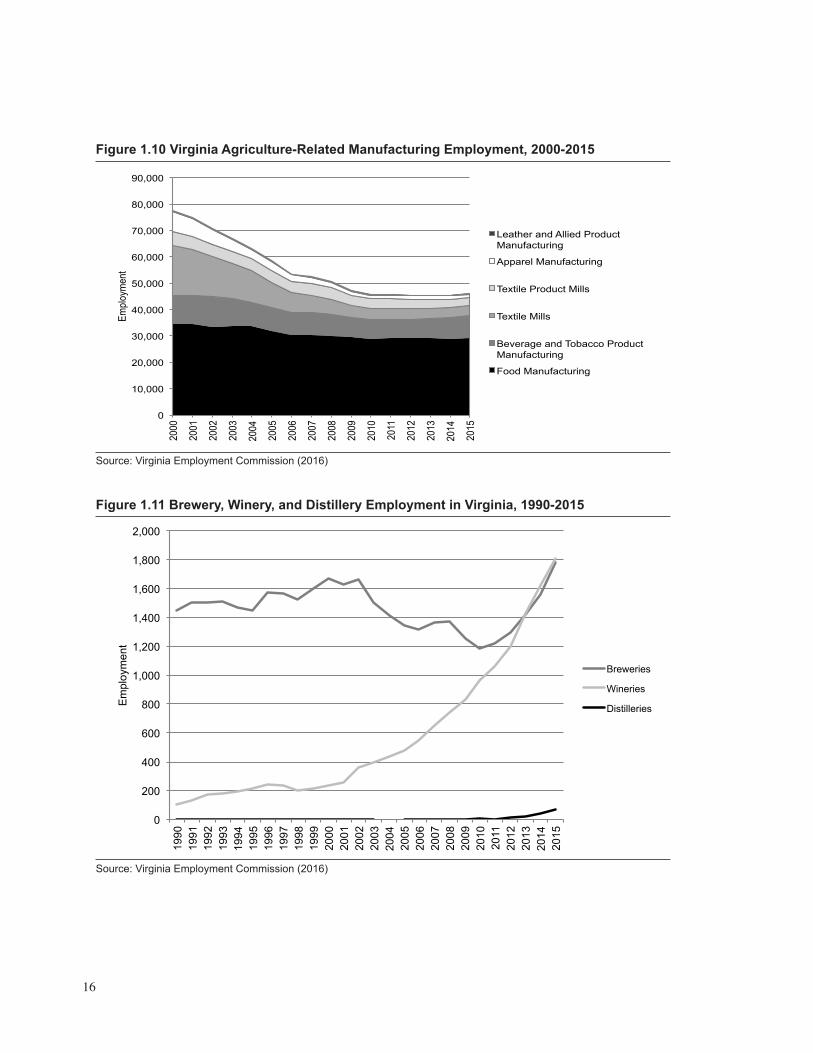
Virginia’s food, beverage, and fiber processors and manufacturers are the largest purchasers of Virgin-ia agricultural commodities. The growth of these industries is steady if unspectacular since the end of the recent recession (see Figure 1.10). Investment in manufacturing automation is one factor con-straining employment growth. Another factor is the continued erosion in some historically significant industries such as tobacco products and textiles and apparel industries, although the drag on total agri-cultural-related manufacturing employment exerted by the slowdown in these industries has lessened as they become smaller and the rate of decline slows. Employment in tobacco products manufac-turing industry decreased approximately 8 percent from 2011 to 2015 while employment in textile and apparel industries decreased 10 percent. In contrast, these industries shrank by 49 percent and 29 percent respectively from 2007 to 2011.
Hidden in the overall employment numbers are areas of substantial growth. Craft beverage firms have continued to expand their presence in the state. The Virginia wine industry grew from 193 winer-
Figure 1.9. Virginia Agriculture-Related Product Exports by Industry, 2002-2016
Source: U.S. Census Bureau (2017).* Other agriculture-related products includes livestock and livestock products and leather and allied products
$0.0
$0.5
$1.0
$1.5
$2.0
$2.5
$3.0
$3.5
$4.0
2002
2003
2004
2005
2006
2007
2008
2009
2010
2011
2012
2013
2014
2015
2016
Billio
ns
Other Ag-related Products
Beverages & Tobacco Products
Textile Mill Products
Textiles & Fabrics
Food & Kindred Products
Agricultural Products
16
Figure 1.11 Brewery, Winery, and Distillery Employment in Virginia, 1990-2015
Source: Virginia Employment Commission (2016)
0
200
400
600
800
1,000
1,200
1,400
1,600
1,800
2,000
1990
19
91
1992
19
93
1994
19
95
1996
19
97
1998
19
99
2000
20
01
2002
20
03
2004
20
05
2006
20
07
2008
20
09
2010
20
11
2012
20
13
2014
20
15
Em
ploy
men
t
Breweries
Wineries
Distilleries
Figure 1.10 Virginia Agriculture-Related Manufacturing Employment, 2000-2015
Source: Virginia Employment Commission (2016)
0
10,000
20,000
30,000
40,000
50,000
60,000
70,000
80,000
90,000 20
00
2001
2002
2003
2004
2005
2006
2007
2008
2009
2010
2011
2012
2013
2014
2015
Empl
oym
ent
Leather and Allied Product Manufacturing
Apparel Manufacturing
Textile Product Mills
Textile Mills
Beverage and Tobacco Product Manufacturing
Food Manufacturing
17
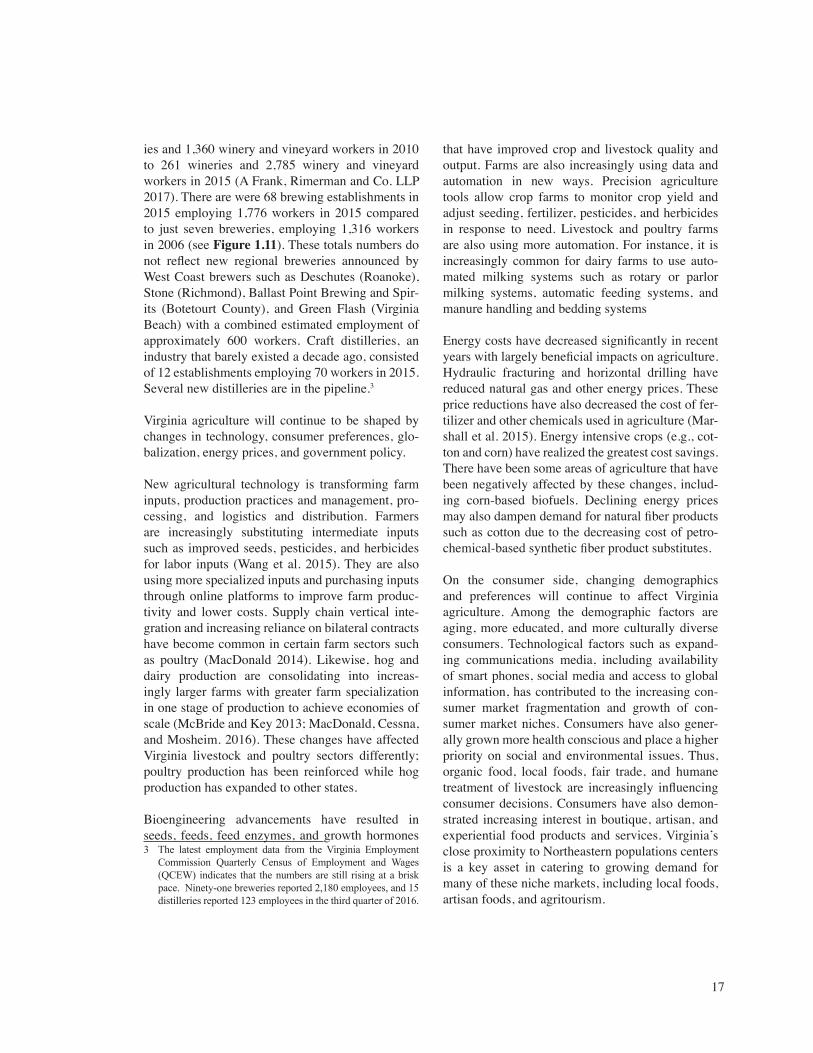
ies and 1,360 winery and vineyard workers in 2010 to 261 wineries and 2,785 winery and vineyard workers in 2015 (A Frank, Rimerman and Co. LLP 2017). There are were 68 brewing establishments in 2015 employing 1,776 workers in 2015 compared to just seven breweries, employing 1,316 workers in 2006 (see Figure 1.11). These totals numbers do not reflect new regional breweries announced by West Coast brewers such as Deschutes (Roanoke), Stone (Richmond), Ballast Point Brewing and Spir-its (Botetourt County), and Green Flash (Virginia Beach) with a combined estimated employment of approximately 600 workers. Craft distilleries, an industry that barely existed a decade ago, consisted of 12 establishments employing 70 workers in 2015. Several new distilleries are in the pipeline.3
Virginia agriculture will continue to be shaped by changes in technology, consumer preferences, glo-balization, energy prices, and government policy.
New agricultural technology is transforming farm inputs, production practices and management, pro-cessing, and logistics and distribution. Farmers are increasingly substituting intermediate inputs such as improved seeds, pesticides, and herbicides for labor inputs (Wang et al. 2015). They are also using more specialized inputs and purchasing inputs through online platforms to improve farm produc-tivity and lower costs. Supply chain vertical inte-gration and increasing reliance on bilateral contracts have become common in certain farm sectors such as poultry (MacDonald 2014). Likewise, hog and dairy production are consolidating into increas-ingly larger farms with greater farm specialization in one stage of production to achieve economies of scale (McBride and Key 2013; MacDonald, Cessna, and Mosheim. 2016). These changes have affected Virginia livestock and poultry sectors differently; poultry production has been reinforced while hog production has expanded to other states.
Bioengineering advancements have resulted in seeds, feeds, feed enzymes, and growth hormones
that have improved crop and livestock quality and output. Farms are also increasingly using data and automation in new ways. Precision agriculture tools allow crop farms to monitor crop yield and adjust seeding, fertilizer, pesticides, and herbicides in response to need. Livestock and poultry farms are also using more automation. For instance, it is increasingly common for dairy farms to use auto-mated milking systems such as rotary or parlor milking systems, automatic feeding systems, and manure handling and bedding systems
Energy costs have decreased significantly in recent years with largely beneficial impacts on agriculture. Hydraulic fracturing and horizontal drilling have reduced natural gas and other energy prices. These price reductions have also decreased the cost of fer-tilizer and other chemicals used in agriculture (Mar-shall et al. 2015). Energy intensive crops (e.g., cot-ton and corn) have realized the greatest cost savings. There have been some areas of agriculture that have been negatively affected by these changes, includ-ing corn-based biofuels. Declining energy prices may also dampen demand for natural fiber products such as cotton due to the decreasing cost of petro-chemical-based synthetic fiber product substitutes.
On the consumer side, changing demographics and preferences will continue to affect Virginia agriculture. Among the demographic factors are aging, more educated, and more culturally diverse consumers. Technological factors such as expand-ing communications media, including availability of smart phones, social media and access to global information, has contributed to the increasing con-sumer market fragmentation and growth of con-sumer market niches. Consumers have also gener-ally grown more health conscious and place a higher priority on social and environmental issues. Thus, organic food, local foods, fair trade, and humane treatment of livestock are increasingly influencing consumer decisions. Consumers have also demon-strated increasing interest in boutique, artisan, and experiential food products and services. Virginia’s close proximity to Northeastern populations centers is a key asset in catering to growing demand for many of these niche markets, including local foods, artisan foods, and agritourism.
3 The latest employment data from the Virginia Employment Commission Quarterly Census of Employment and Wages (QCEW) indicates that the numbers are still rising at a brisk pace. Ninety-one breweries reported 2,180 employees, and 15 distilleries reported 123 employees in the third quarter of 2016.
18
The agriculture sector remains vulnerable to the vicissitudes of government policy. Federal farm programs are a key element of government policy. But, Virginia is less reliant on farm programs pay-ments than other states because of its agricultural commodity mix and the relatively small size of its farms. Tax, regulatory, trade, immigration, and monetary policy are also important.
Federal and state tax and regulatory policy affects Vir-ginia farmers in several major ways. Virginia farmers have assumed a significant cost and regulatory bur-den for improving water quality such as the Chesa-peake Bay Watershed region. Federal, state, and local regulations and taxes affecting food, beverage, and other products can also affect domestic demand with the most visible example being taxes and regulations used to discourage tobacco product use. Tax rates, depreciation rules, and other tax program parameters can affect farm profitability. Estate taxes have a dis-proportionate impact on farm estates and family farm succession. Policies to reduce air emissions such as carbon affect the farm sector as both producers of emissions and producers of biofuels and renewable energy. The rapid conversion of rural land to urban and non-agricultural uses has prompted a variety of land conservation tools to be used to preserve agricul-tural natural resources and protect the environment. They include land use regulations and incentive tools such as use value taxation, purchase of development rights (PDR), and tax credits.
Trade and immigration policies are also important. The recently abandoned Trans-Pacific Partnership (TPP) deal involving 11 other nations that decreases tariff and non-tariff trade barriers for goods and ser-vices was seen by farm groups as an important tool for expanding agricultural markets. The American Farm Bureau estimated that enactment of the TPP would have resulted in an estimated increase of $46.9 million in net agricultural exports from Vir-ginia and 350 farm jobs.4 Renewed efforts to stem the arrival of immigrant workers in the U.S. will have a disproportionate impact on the farm sector. According to one estimate, illegal immigrants make up over half of the hired workforce for crop agri-
culture (Calvin and Martin 2010). While existing legal immigration programs such as the H-2A visa program could potentially be used to help alleviate any labor shortage, farm groups argue that the visa program is unwieldy because of administrative and compliance costs.
Federal Reserve interest rate policy also can have a significant impact on farming. After several years of extraordinary monetary policy (including various stages of quantitative easing) to address the 2008-09 financial crisis and recessionary aftermath, the Fed-eral Reserve Board has begun to normalize interest rates. Rising interest rates can be expected to have a significant impact on farm capital equipment pur-chasing and debt serviceability.
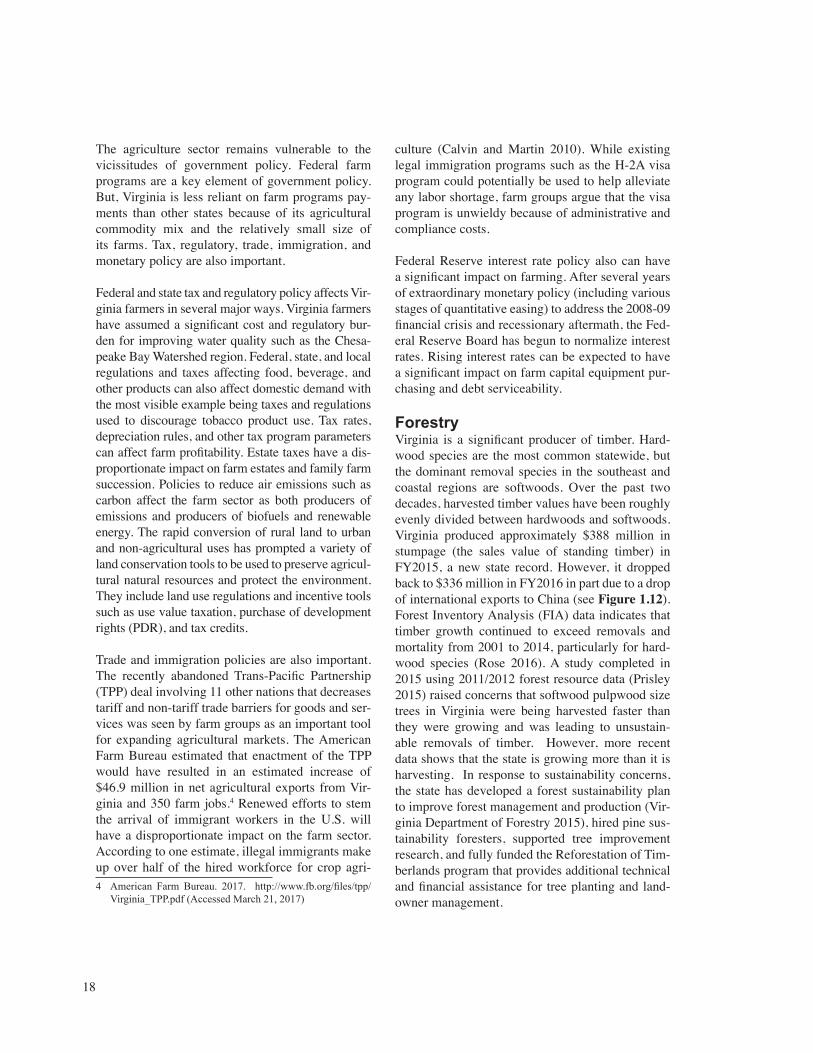
ForestryVirginia is a significant producer of timber. Hard-wood species are the most common statewide, but the dominant removal species in the southeast and coastal regions are softwoods. Over the past two decades, harvested timber values have been roughly evenly divided between hardwoods and softwoods. Virginia produced approximately $388 million in stumpage (the sales value of standing timber) in FY2015, a new state record. However, it dropped back to $336 million in FY2016 in part due to a drop of international exports to China (see Figure 1.12). Forest Inventory Analysis (FIA) data indicates that timber growth continued to exceed removals and mortality from 2001 to 2014, particularly for hard-wood species (Rose 2016). A study completed in 2015 using 2011/2012 forest resource data (Prisley 2015) raised concerns that softwood pulpwood size trees in Virginia were being harvested faster than they were growing and was leading to unsustain-able removals of timber. However, more recent data shows that the state is growing more than it is harvesting. In response to sustainability concerns, the state has developed a forest sustainability plan to improve forest management and production (Vir-ginia Department of Forestry 2015), hired pine sus-tainability foresters, supported tree improvement research, and fully funded the Reforestation of Tim-berlands program that provides additional technical and financial assistance for tree planting and land-owner management.
4 American Farm Bureau. 2017. http://www.fb.org/files/tpp/Virginia_TPP.pdf (Accessed March 21, 2017)
19
Source: Virginia Department of Forestry
Figure 1.13 Value of Virginia Stumpage by Locality, FY 2016
Figure 1.12 Virginia Stumpage Values, FY 1978-2016
Source: Virginia Department of Forestry
$0
$50
$100
$150
$200
$250
$300
$350
$400
1978
1980
1982
1984
1986
1988
1990
1992
1994
1996
1998
2000
2002
2004
2006
2008
2010
2012
2014
2016
Milli
ons
Mixed Chip
Hardwood
Softwood
20
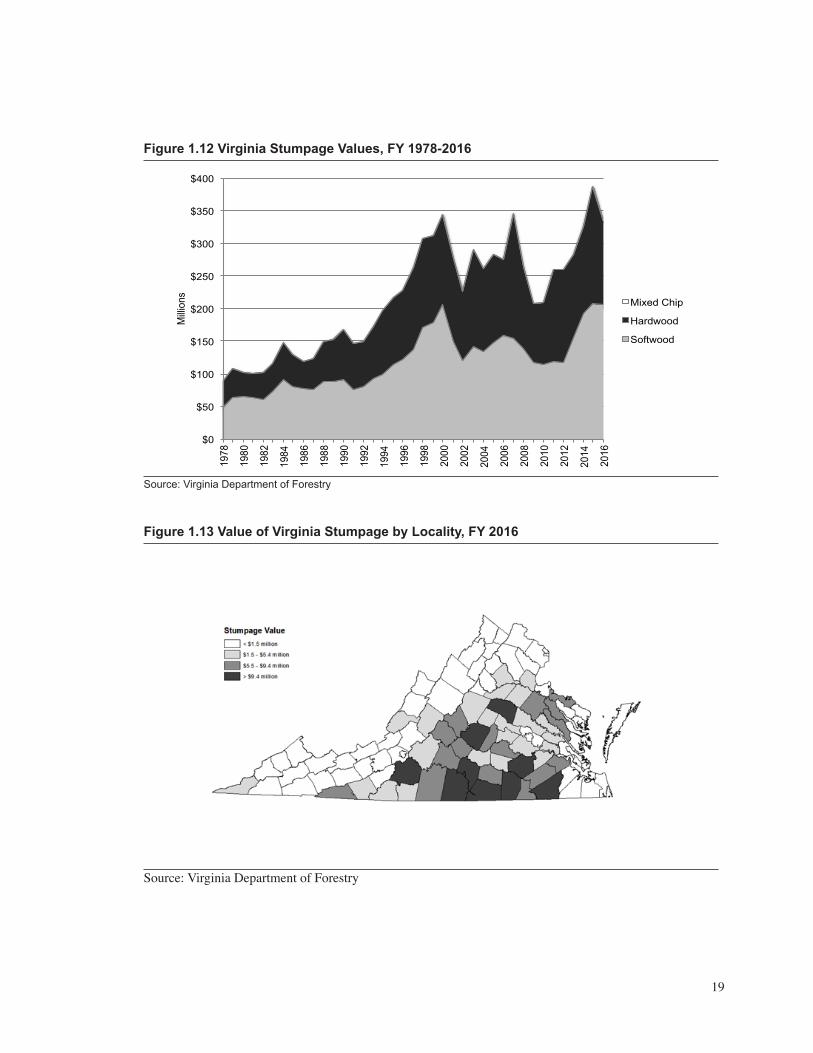
Virginia’s forest resources are fairly evenly distribut-ed throughout the state. However, urban commercial and residential development has reduced forestland, particularly in the Northern region. Timber removal value remains highest in the southern part of the state, reflecting the location of Virginia’s softwoods, the presence of highly productive pine plantations, less costly logging conditions, and a greater concen-tration of wood products manufacturing industry in the region (see Figure 1.13). Timber harvests in this region have outpaced other areas of the state.
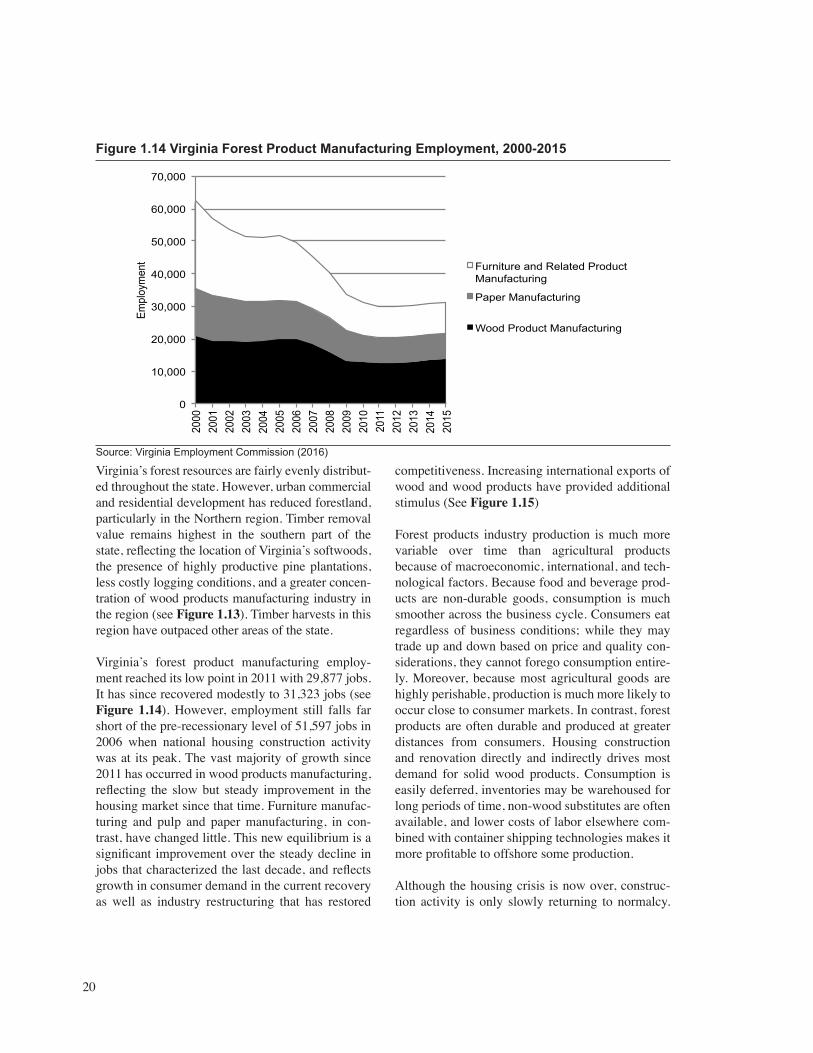
Virginia’s forest product manufacturing employ-ment reached its low point in 2011 with 29,877 jobs. It has since recovered modestly to 31,323 jobs (see Figure 1.14). However, employment still falls far short of the pre-recessionary level of 51,597 jobs in 2006 when national housing construction activity was at its peak. The vast majority of growth since 2011 has occurred in wood products manufacturing, reflecting the slow but steady improvement in the housing market since that time. Furniture manufac-turing and pulp and paper manufacturing, in con-trast, have changed little. This new equilibrium is a significant improvement over the steady decline in jobs that characterized the last decade, and reflects growth in consumer demand in the current recovery as well as industry restructuring that has restored
competitiveness. Increasing international exports of wood and wood products have provided additional stimulus (See Figure 1.15)
Forest products industry production is much more variable over time than agricultural products because of macroeconomic, international, and tech-nological factors. Because food and beverage prod-ucts are non-durable goods, consumption is much smoother across the business cycle. Consumers eat regardless of business conditions; while they may trade up and down based on price and quality con-siderations, they cannot forego consumption entire-ly. Moreover, because most agricultural goods are highly perishable, production is much more likely to occur close to consumer markets. In contrast, forest products are often durable and produced at greater distances from consumers. Housing construction and renovation directly and indirectly drives most demand for solid wood products. Consumption is easily deferred, inventories may be warehoused for long periods of time, non-wood substitutes are often available, and lower costs of labor elsewhere com-bined with container shipping technologies makes it more profitable to offshore some production.
Although the housing crisis is now over, construc-tion activity is only slowly returning to normalcy.
Figure 1.14 Virginia Forest Product Manufacturing Employment, 2000-2015
Source: Virginia Employment Commission (2016)
0
10,000
20,000
30,000
40,000
50,000
60,000
70,000
2000
20
01
2002
20
03
2004
20
05
2006
20
07
2008
20
09
2010
20
11
2012
20
13
2014
20
15
Empl
oym
ent Furniture and Related Product
Manufacturing
Paper Manufacturing
Wood Product Manufacturing
21
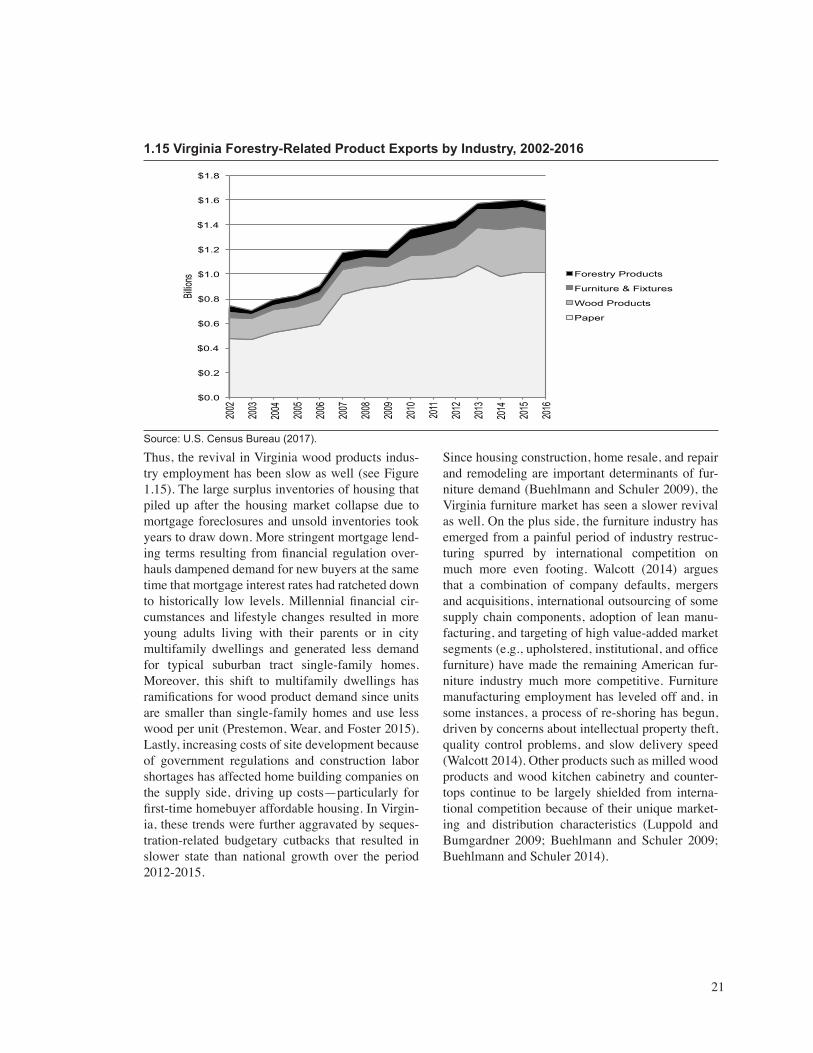
Thus, the revival in Virginia wood products indus-try employment has been slow as well (see Figure 1.15). The large surplus inventories of housing that piled up after the housing market collapse due to mortgage foreclosures and unsold inventories took years to draw down. More stringent mortgage lend-ing terms resulting from financial regulation over-hauls dampened demand for new buyers at the same time that mortgage interest rates had ratcheted down to historically low levels. Millennial financial cir-cumstances and lifestyle changes resulted in more young adults living with their parents or in city multifamily dwellings and generated less demand for typical suburban tract single-family homes. Moreover, this shift to multifamily dwellings has ramifications for wood product demand since units are smaller than single-family homes and use less wood per unit (Prestemon, Wear, and Foster 2015). Lastly, increasing costs of site development because of government regulations and construction labor shortages has affected home building companies on the supply side, driving up costs—particularly for first-time homebuyer affordable housing. In Virgin-ia, these trends were further aggravated by seques-tration-related budgetary cutbacks that resulted in slower state than national growth over the period 2012-2015.
Since housing construction, home resale, and repair and remodeling are important determinants of fur-niture demand (Buehlmann and Schuler 2009), the Virginia furniture market has seen a slower revival as well. On the plus side, the furniture industry has emerged from a painful period of industry restruc-turing spurred by international competition on much more even footing. Walcott (2014) argues that a combination of company defaults, mergers and acquisitions, international outsourcing of some supply chain components, adoption of lean manu-facturing, and targeting of high value-added market segments (e.g., upholstered, institutional, and office furniture) have made the remaining American fur-niture industry much more competitive. Furniture manufacturing employment has leveled off and, in some instances, a process of re-shoring has begun, driven by concerns about intellectual property theft, quality control problems, and slow delivery speed (Walcott 2014). Other products such as milled wood products and wood kitchen cabinetry and counter-tops continue to be largely shielded from interna-tional competition because of their unique market-ing and distribution characteristics (Luppold and Bumgardner 2009; Buehlmann and Schuler 2009; Buehlmann and Schuler 2014).
1.15 Virginia Forestry-Related Product Exports by Industry, 2002-2016
Source: U.S. Census Bureau (2017).
$0.0
$0.2
$0.4
$0.6
$0.8
$1.0
$1.2
$1.4
$1.6
$1.8
2002
2003
2004
2005
2006
2007
2008
2009
2010
2011
2012
2013
2014
2015
2016
Billio
ns Forestry Products
Furniture & Fixtures
Wood Products
Paper
22
Virginia pulp and paper industry employment has also leveled off after years of decline. This downturn was partly the result of decreased consumer demand, including competition from digital media. However, many of the same forces affecting the U.S. furniture industry were also at play. International competition led to the loss of U.S. market share in products such as newsprint and coated paper. But, mill closures and mergers and acquisitions have resulted in a pulp and paper industry that is leaner and more efficient. In addition, slowly improving manufacturing activ-ity and burgeoning consumer Internet trade pur-chases increase demand for paper and paperboard packaging (Hetemäki, Hänninen, and Moiseyev 2014). Remaining mills are more likely to manufac-ture linerboard and paperboard packaging materials or tissue paper, which are less vulnerable to inter-national competition because of their bulkiness and higher shipping costs (Li and Luo 2008; Hetemäki; Hänninen, and Moiseyev 2014).
Biomass energy production has emerged in recent years as a significant new market for surplus wood
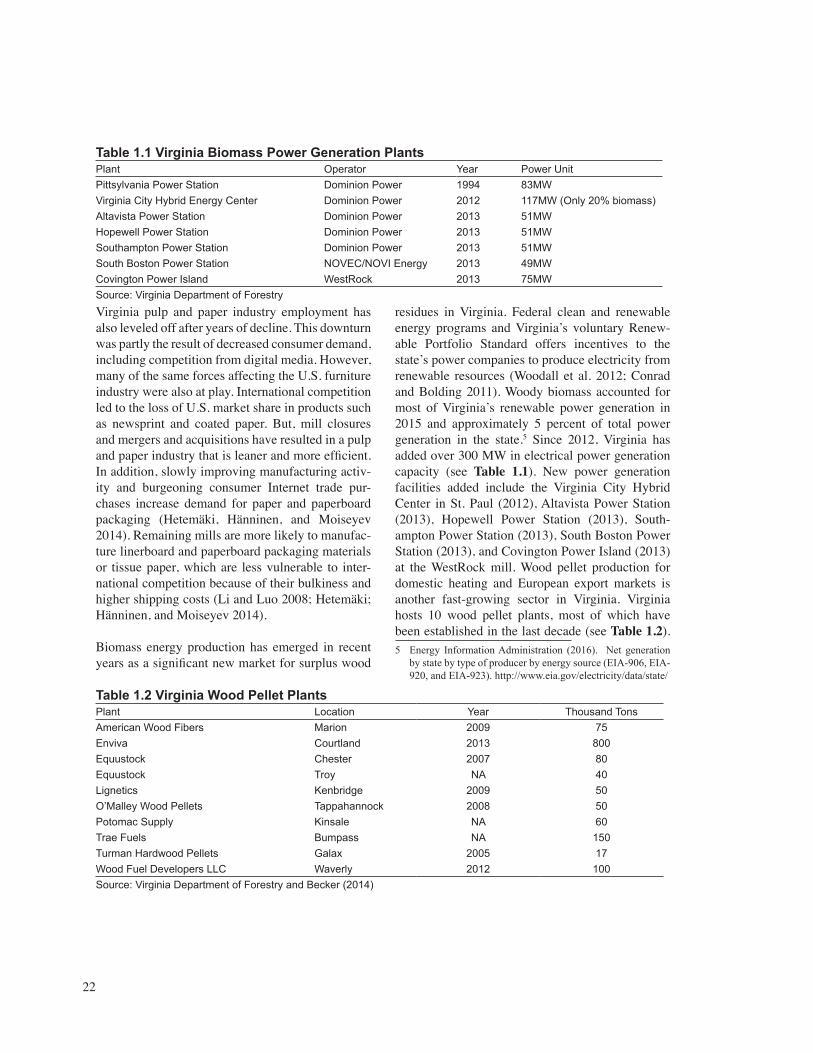
residues in Virginia. Federal clean and renewable energy programs and Virginia’s voluntary Renew-able Portfolio Standard offers incentives to the state’s power companies to produce electricity from renewable resources (Woodall et al. 2012; Conrad and Bolding 2011). Woody biomass accounted for most of Virginia’s renewable power generation in 2015 and approximately 5 percent of total power generation in the state.5 Since 2012, Virginia has added over 300 MW in electrical power generation capacity (see Table 1.1). New power generation facilities added include the Virginia City Hybrid Center in St. Paul (2012), Altavista Power Station (2013), Hopewell Power Station (2013), South-ampton Power Station (2013), South Boston Power Station (2013), and Covington Power Island (2013) at the WestRock mill. Wood pellet production for domestic heating and European export markets is another fast-growing sector in Virginia. Virginia hosts 10 wood pellet plants, most of which have been established in the last decade (see Table 1.2).
Table 1.1 Virginia Biomass Power Generation PlantsPlant Operator Year Power UnitPittsylvania Power Station Dominion Power 1994 83MWVirginia City Hybrid Energy Center Dominion Power 2012 117MW (Only 20% biomass)Altavista Power Station Dominion Power 2013 51MWHopewell Power Station Dominion Power 2013 51MWSouthampton Power Station Dominion Power 2013 51MWSouth Boston Power Station NOVEC/NOVI Energy 2013 49MWCovington Power Island WestRock 2013 75MWSource: Virginia Department of Forestry
Table 1.2 Virginia Wood Pellet PlantsPlant Location Year Thousand TonsAmerican Wood Fibers Marion 2009 75Enviva Courtland 2013 800Equustock Chester 2007 80Equustock Troy NA 40Lignetics Kenbridge 2009 50O’Malley Wood Pellets Tappahannock 2008 50Potomac Supply Kinsale NA 60Trae Fuels Bumpass NA 150Turman Hardwood Pellets Galax 2005 17Wood Fuel Developers LLC Waverly 2012 100Source: Virginia Department of Forestry and Becker (2014)
5 Energy Information Administration (2016). Net generation by state by type of producer by energy source (EIA-906, EIA-920, and EIA-923). http://www.eia.gov/electricity/data/state/
23
Collectively, they processed over 1.4 million tons of wood, mill, and forest residues.
The housing market is forecasted to continue to gradually improve, providing additional tailwinds to the wood products industry. Although the Federal Reserve has begun to normalize the federal funds rate, historically low mortgage and consumer inter-est rates will persist a bit longer. Moreover, a modest uptick in economic growth and growing household incomes, increased young adult household forma-tions, and an aging housing stock will help stimulate new housing demand. Single-family homes continue to grow larger too, though this reflects partly the dif-ficulties of first-time homebuyers in securing loans for smaller, starter housing. The same forces that spur home sales and remodeling should improve the furniture industry’s prospects as well.
Virginia’s forestry and forest products industry fac-es some long-term resources challenges. Growing urban sprawl and fragmentation and non-industrial ownership hinder access and increase harvesting costs. Also, pests and disease, invasive species, air pollution, and changes in forest ecology from fire suppression are taking an increasing toll on Virginia forests.
Many of Virginia’s challenges are national and inter-national in scope. Demand for some forest products such as paper and paperboard products is decreasing because of electronic and plastic packaging mate-rial substitutes. Recovered paper, which constituted 37 percent of the fiber used in for papermaking in 2009, is expected to make further inroads, affecting the demand for pulpwood (Prestemon, Wear, and Foster 2015; Hetemäki, Hänninen, and Moiseyev 2014). Moreover, engineered wood (e.g., laminated veneer lumber, I-joists) and wood composite prod-ucts are displacing solid-wood products due to their improved construction properties and lower costs, resulting in lower wood volume (Prestemon, Wear, and Foster 2015; Buehlman and Schuler 2014). At the same time, hardwood producers face increas-ing competition from lower cost and faster growing Asian and South American tropical nonconiferous hardwood materials (Prestemon, Wear, and Foster 2015; Hetemäki, Hänninen, and Moiseyev 2014).
Developing countries are becoming more agile pro-ducers of a wider range of forest products and are tapping global markets (Hetemäki, Hänninen, and Moiseyev 2014). As the forestry and forest products sectors increase productivity through increased use of capital and technology, lower levels of employ-ment are necessary (Prestemon, Wear, and Foster 2015).
Virginia continues to have significant advantages in forestry-products production over many other states. The state hosts relatively large forestry and wood products industry clusters.6 Industry clusters are groups of interconnected businesses that become more productive by locating close to one another. It has a large and growing forest inventory, including large inventory of plantation grown trees. The avail-ability of this fast-growing smaller tree resource is a significant advantage for attracting engineered wood and composite wood products industry production (Prestemon, Wear, and Foster 2015). Virginia’s for-estry products workforce is smaller and older than before the last recession but still remains significant in size. It can also access regional distribution and marketing assets, such as a major eastern seaport and the world’s premiere furniture showroom locat-ed in nearby High Point, North Carolina. Higher education provides numerous educational and train-ing programs and the state’s land-grant university (Virginia Tech and Virginia State University) sup-port industry-relevant research and development.
Virginia may also benefit from new products and services. New opportunities may exist for profes-sional forestry-related services that cater to urban and suburban customers in such areas as harvest-ing and thinning, marketing, and other areas (Hull 2011). New products based on wood-plastic com-posites for construction (such as those produced by Winchester-based composite producer Trex); cross laminated timber (CLT) for heavy construction; 6 IndustrialclusterswereidentifiedusingtheHarvardBusiness
School’s U.S. Cluster Mapping Project industry cluster framework. The forestry and wood products industry clusters had location quotients (a measure of economic concentration relative to the U.S.) greater than 1.3 in 2014 based on U.S. Census Bureau County Business Patterns employment data, indicating thatVirginiawassignificantlymoreconcentratedin these industry clusters than the United States as a whole.
24
biopolymers and nanocelluse for paper, textiles, and other products; wood chemicals for chemical products, pharmaceuticals, nutraceuticals, and cel-lulostics biofuels could present future possibilities (Cai et al. 2014; Hetemäki, Hänninen, and Moi-seyev 2014). Changes in building codes such as those occurring in Europe that allow taller buildings to use wood frame construction would also provide a boost in construction demand (Prestemon et al. 2015).
The agenda of the new Trump administration may affect the agriculture and forestry industries in dif-ferent ways, both positively and negatively. Pro-posed regulatory easing and tax reforms should reduce operating costs for farms and businesses, including the housing construction sector. With-drawal in support for multilateral trade programs such as TPP and NAFTA, and greater trade restric-tions can be expected to have a detrimental impact on production sectors, which rely heavily on inter-national trade. But, the impacts on other value-added sectors that have been negatively affected by international trade competition such as furniture and pulp/paper are less certain. A crackdown on illegal immigration and more restrictive policies towards H2 visas would constrain labor availability for pro-duction and manufacturers. The Trump administra-tion’s FY 2017 proposed budget presented calls for significant cuts in discretionary spending programs with an unusually steep 21 percent cut in the U.S. Department of Agriculture, including the Spe-cial Supplemental Nutrition Program for Women, Infants and Children (WIC), statistical services, and county-level Farm Service Agency staffing.7 Lastly, lessened support for clean energy initiatives and environmental mitigation measures could affect the business models of alternative fuels producers and producers of specialized environmental services.8
The net effect of these varied changes are difficult to predict.
Agriculture and Forestry Industries Development ProgramVirginia’s agriculture and forestry production sec-tors have been aided in recent years by a new eco-nomic incentive program that aims to stimulate purchases of Virginia-grown commodities by value-added companies: the Governor’s Agriculture and Forestry Industries Development Fund (AFID). The state offers several economic development incen-tive programs that sometimes support agribusi-nesses. For example, the Commonwealth’s Oppor-tunity Fund (COF) provides deal-closing grants to attract new and expanding businesses that sell most of their products outside Virginia. In recent years, agriculture and forestry-related manufacturing firms such as Monogram Food Solutions (Henry County), Stone Brewing Co. (Richmond City) and Appala-chian Biofuels (Russell County) have benefitted from the program. The Tobacco Region Revitaliza-tion Commission has developed several economic assistance programs to support the Southside and Southwest regions’ transition from tobacco farming to more diversified farming and value-added activi-ties. The AFID facility grant program is different from these programs in that it requires value-added enterprise grant recipients to source a minimum percentage (30 percent) of agricultural and forestry inputs from Virginia. For example, Copper Fox Dis-tillery (Williamsburg City) was awarded grant fund-ing in part because it would use nearly $500,000 in Virginia agricultural products each year for its new distillery as well as create over 25 new jobs.
The AFID program was adopted by the General Assembly and signed into law in 2013. In addition to its provisions for purchasing a minimum percentage of Virginia products, the AFID statute emphasizes the importance of new jobs, capital investment, and geographic diversity. Its total appropriations from FY 2013 to FY2016 were $5 million. Since 2013, the program awarded 38 grants that are expected to create 1,666 jobs, $341.8 million in capital invest-ment, and $543.3 million in Virginia agricultural and forestry product purchases (VEDP 2016). Forty-two
7 Sparshott, Jeffrey and Ted Mann. 2017. Budget plan slashes EPA, aids military. Wall Street Journal. March, 17, 2017. https://www.wsj.com/articles/trump-budget-seeks-big-cuts-to-environment-arts-foreign-aid-1489636861 (Accessed April 5, 2017).
8 For instance, the EPA had been expected to release regulations that would identify whether biomass feedstock was a carbon-neutral fuel and to what extent biomass could be substituted for fossil fuels in U.S. power generation (Hitaj and Suttles 2016, Howard and McKeever 2015). This regulatory framework is now in doubt.
25
Source: Virginia Department of Agriculture and Consumer Services
Figure 1.16 AFID Grant Recipients and Number of Jobs Expected, FY2013-FY2016
percent of the awardees were food manufacturing enterprises, 19 percent were beverage manufactur-ing, 16 percent were wood product manufacturing businesses, and the residual 13 percent were assort-ed agriculture and forestry production and distribu-tion enterprises. Program participants can be found throughout the Commonwealth (see Figure 1.16).
The AFID program also funds a smaller planning grant program. The grants are awarded to local governments for agricultural strategic planning, feasibility studies, and other local capacity building initiatives. The program has been a catalyst for many localities to develop agricultural development strate-gic plans as well as business plans for new agricul-tural centers, cooperatives and business startups.

26
27
SECTION 2METHODOLOGY
This section describes the methodology used to estimate agriculture and forestry economic impacts. The first part describes how economic activities directly linked to agriculture and forestry resources were defined for use in economic impact analysis. The second part describes the input-output analy-sis economic impact methodology and software (IMPLAN) used to measure state and local econom-ic impacts. The third section describes the data used.
Agriculture and Forestry-Related Industry IdentificationThis study identifies the same sectors as the last study (Rephann 2013) as being directly related to agricul-ture and forestry.9 These industries were identified using data from IMPLAN on forward linkages with agricultural and forestry commodities in combination with information from the U.S. Department of Agri-culture’s Economic Research Service (2005) and U.S. Department of Agriculture, Forest Service (2004) on industry scope.10 A fuller discussion of the methodol-ogy is provided in the last study (Rephann 2013). The underlying theoretical and practical issues underpin-ning the selection of those industries are provided in the original study (Rephann 2008). These industries and their associated IMPLAN sectors and definitions are listed in Appendix Table A.1.
Forestry and agriculture-related industries were cat-egorized into what are called “production,” “core processing,” “extended processing,” and “distribu-tion” activities based on their supply chain proxim-ity to Virginia agricultural and forest commodities. Production activities consist of those industries involving the growing and harvesting of agricultur-al, timber, and non-timber forest product commodi-ties. Core processing industries are manufacturing industries that rely on state commodity inputs for production and likely locate in close proximity to these raw materials to minimize production costs. These industries tend to be involved in primary pro-cessing industries that generally involve the first stage of converting a commodity input into a fin-ished consumer product. Commodity inputs tend to be bulky or highly perishable. Examples of these industries include animal slaughtering and saw-mills. Extended processing industries are second-ary processing industries that are somewhat less dependent on Virginia farm and forest commodity inputs. They tend to involve cooking, blending, and packaging products from primary processing indus-tries such as milled grains, dairy, and meat. Due to the high perishability or bulkiness of the finished products, these industries are more likely to require close access to consumer markets or transportation infrastructure such as ports and freeways. For exam-ple, beverage production often involves combining locally available water supplies with fruit, corn and sugar extracts and is produced close to final con-sumers. In much the same way, custom cabinetry firms locate close to customers in order to rapidly respond to consumer demand. Distribution indus-tries are warehousing, wholesaling, and service industries with a close nexus to agricultural and for-est products such as grain elevators and landscap-ing. Also included in this category is the biomass power generation industry, a growing power source in Virginia and elsewhere in the country, which was recently added to government economic accounting as a distinct industry (NAICS sector 221117).
9 Since there was a change in the number of IMPLAN sectors (moving from a 440-sector scheme to a 536-sector scheme), older agriculture and forestry-related sectors were aligned with the newer sectors.
10The directly linked industries identified here are in someways broader and in other ways narrower than those used in other state agriculture and forestry economic contribution studies. For instance, one forestry study includes “forest-based recreation, forestry-related service providers, mattress production, blinds and shades production, wood casket and wood musical instrument manufacturing, wood-based wholesale activity, and forest-related contributions from federal/state governments and universities” (Henderson et al. 2017). Some studies include farm, forest, food product, and lawn and garden machinery and equipment manufacturing, fertilizer and pesticide manufacturing, veterinary services, and food and drinking places (English, Popp, and Miller 2016; Lopez, Plesha and Campbell 2014). On the other hand, most agriculture economic contribution studies exclude textile and apparelindustriesreliantonnaturalfibers.
28
Economic Impact ModelingThis study uses input-output analysis to perform the economic impact analysis. Input-output analy-sis produces industry-specific multipliers that show how economic activity in one sector of the economy affects the overall state economy. For this study, we are interested in how agricultural and forestry-relat-ed activity affect the state economy.
The total impact of agricultural and forestry-related activity consists of three parts: a “direct effect,” “an indirect effect,” and an “induced effect.” The direct effect consists of the injection of economic activity or expenditure into the region, namely the sales of agricultural and forestry-related industries located in Virginia. This direct expenditure then causes a “ripple effect” on the state economy when money is re-spent. For instance, state businesses provide supplies and services to farms such as seeds, fertil-izer, veterinarian services, utilities, and insurance.11 These businesses spend a portion of their sales rev-enues on purchases of supplies and services from other state firms who, in turn, purchase a portion of their supplies and services from other state firms. This cascading sequence of spending continues until the subsequent rounds of spending dissipate due to leakages in the form of spending outside the state. The cumulative effect of these cascading rounds of inter-industry purchases is referred to as the indi-rect effect. The final component of total impact (the induced effect) is attributable to the spending of households and other economic agents. For instance, businesses pay households for their labor services. These households then purchase goods and services from state firms who in turn receive a portion of their labor, material and public service inputs from within the state. Again leakages occur at each round
due to purchases of goods and services outside the state. The induced effect is the sum of the impacts associated with these household purchases.12
The economic impact analysis uses IMPLAN (Impact analysis for PLANning) software. IMPLAN has been used in many economic impact studies, including the most recent economic impact studies of Virginia agriculture and forestry (Rephann 2008, 2013). It is perhaps the most common tool used in state agriculture and forestry industry impact anal-ysis (Henderson et al. 2017; English, Popp, and Miller 2016). Models here are built using 2015 data released in December 2016 that utilize a 536-sector IMPLAN sector scheme. Since both statewide and local analyses are performed, tables were custom-ized for Virginia and each of its localities.
Impacts are evaluated within IMPLAN using three different measures: (a) total sales or total industrial output (TIO), (b) value-added, and (c) employment. Total sales or industry output is the total value of industry production during a period. It measures sales of intermediate inputs for use in production as well as sales of products to final consumers. Value-added is a subset of total industrial output. It reflects only sales to final consumers and therefore avoids the double counting that occurs when intermedi-ate inputs are included. It is the most commonly used measure of economic activity. Value-added is the concept behind gross domestic product (GDP) and can be compared to the GDP numbers provid-ed by the Bureau of Economic Analysis for states and metropolitan areas. It can also be represented as total factor income plus indirect business taxes. Employment is measured in terms of person-years of employment. A person-year of employment is a job of one year in duration. Employment includes
11 Two adjustments were made to avoid double counting of direct and indirect effects. First, agricultural byproducts of agricultural and forest commodity industriesweremodifiedso that each industry produces its primary commodity. Second, purchased inputs from each agriculture and forestry-related industry were disallowed by setting regional purchase coefficients (RPCs), which represent the portion of statedemand purchased from state producers, to zero in each of the agriculture and forestry-related sectors included in the model. These procedures are recommended in recent peer studies of agriculture and forestry contribution analyses (Henderson et al. 2017; English, Popp, and Miller 2016).
12 A social accounting Matrix (“SAM”) forms the underlying accounting system for the analysis. It show transfers between all economic agents that add value to products and services, including industries, labor/households, government, and capital. Social Accounting Matrix (SAM) type multipliers can include the effects from employee household spending as well as the induced effects of spending of firm profits,transfer payments, and other institutional transactions. For the statewide model, this study uses SAM multipliers that are closed in IMPLAN with respect to households, state and local government, federal non-defense government, capital, and enterprises.

29
full-time and part-time employment as well as the self-employed and is measured by place of work.
DataThis study uses data from the same four sources as previous studies. Farm and forestry-related employ-ment data for core-processing, extended-processing, and distribution industries were obtained from the Virginia Employment Commission (VEC) Quarter-ly Census of Employment and Wages (QCEW) for the second quarter of 2015, which is representative of annual employment. Industry employment totals are aggregated into IMPLAN categories using North American Industrial Classification System (NAICS) codes. The employment numbers are then converted to sales/output equivalent figures by the model for use in generating economic impact estimates. Most production sectors were treated differently because proprietors and self-employed constitute most of the employment but are not generally included in the QCEW data. For farming sectors (IMPLAN sectors 1-14), U.S. Department of Agriculture commod-ity cash receipts data from 2015 were used (U.S. Department of Agriculture, Economic Research Service 2016a).13 For forest nurseries, forest prod-ucts, and timber tracts sector (IMPLAN sector 15), data from Virginia Department of Forestry timber product average tax receipts for fiscal years 2015 and 2016 (to estimate calendar year values) were substituted. For logging (IMPLAN sector 16) and hunting and trapping (IMPLAN sector 18), out-put and employment estimates from the Virginia IMPLAN database are used.14
In order to make estimates for localities, additional data imputations were needed because 2015 local agricultural cash receipt data were not available. Therefore, statewide 2015 values for cash receipts for each sector were scaled down to the local level using IMPLAN total industrial output estimates for 2015 by sector for localities.15
Estimates of agriculture and forestry-related indus-try exports are made using statewide employment and output totals by sector for industries included in Table A.1 and estimates by sector from IMPLAN. Foreign export shares of total output by sector for 2015 from IMPLAN are multiplied by 2015 state agricultural and forestry-related industry output described previously to obtain estimates of state-wide agriculture and forestry-related industry. This procedure is the same as that used in the 2013 study.16
13 Appendix A.1 shows agricultural commodity sales trend data including the 2015 values used in the IMPLAN analysis for IMPLAN sectors 1-14.
14 IMPLAN employment data are generated from a variety of different sources including employment data from the U.S. Census Bureau (County Business Patterns), Bureau of Labor Statistics (Covered Employment and Wages), and Bureau of Economic Analysis (Regional Economic Information System).Theimputedemploymentdatareflectadjustmentsfor proprietors by industry.
15 IMPLAN estimates the farm output numbers using U.S. Department of Agriculture data as described in Lindall (1998).
16 IMPLAN distributes national exports by industry to states based on the state’s share of total national output in that industry. This method may tend to underestimate state exports from states having ports of exit such as Virginia because international shipping costs for many products will be lower for products produced in closer proximity to the port. On the other hand, export measures that rely on origin of movement data such as the U.S. Census Bureau’s state export series produce the opposite problem. Export products are often consolidated at a transit point by shipping companies and wholesale and retail brokers. Thus, the origin of movement willreflectthesetransitpointlocationsratherthanwheretheproduct was produced. For agricultural products, the transit point is often the state containing the port of exit. Since Virginia contains a major seaport in Hampton Roads, exports based on origin of movement will tend to overestimate foreign exports.

30
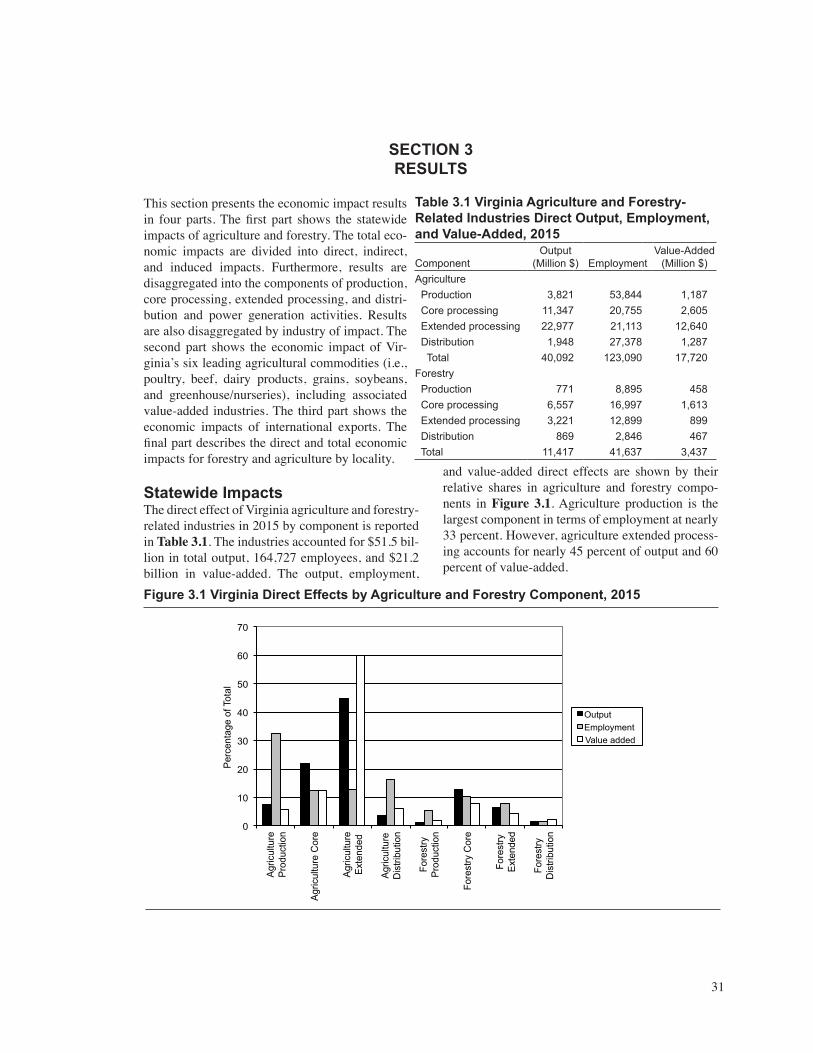
31
SECTION 3RESULTS
This section presents the economic impact results in four parts. The first part shows the statewide impacts of agriculture and forestry. The total eco-nomic impacts are divided into direct, indirect, and induced impacts. Furthermore, results are disaggregated into the components of production, core processing, extended processing, and distri-bution and power generation activities. Results are also disaggregated by industry of impact. The second part shows the economic impact of Vir-ginia’s six leading agricultural commodities (i.e., poultry, beef, dairy products, grains, soybeans, and greenhouse/nurseries), including associated value-added industries. The third part shows the economic impacts of international exports. The final part describes the direct and total economic impacts for forestry and agriculture by locality.
Statewide ImpactsThe direct effect of Virginia agriculture and forestry-related industries in 2015 by component is reported in Table 3.1. The industries accounted for $51.5 bil-lion in total output, 164,727 employees, and $21.2 billion in value-added. The output, employment,
and value-added direct effects are shown by their relative shares in agriculture and forestry compo-nents in Figure 3.1. Agriculture production is the largest component in terms of employment at nearly 33 percent. However, agriculture extended process-ing accounts for nearly 45 percent of output and 60 percent of value-added.
Table 3.1 Virginia Agriculture and Forestry-Related Industries Direct Output, Employment, and Value-Added, 2015
ComponentOutput
(Million $) EmploymentValue-Added
(Million $)Agriculture Production 3,821 53,844 1,187 Core processing 11,347 20,755 2,605 Extended processing 22,977 21,113 12,640 Distribution 1,948 27,378 1,287 Total 40,092 123,090 17,720Forestry Production 771 8,895 458 Core processing 6,557 16,997 1,613 Extended processing 3,221 12,899 899 Distribution 869 2,846 467 Total 11,417 41,637 3,437
Figure 3.1 Virginia Direct Effects by Agriculture and Forestry Component, 2015
0
10
20
30
40
50
60
70
Agric
ultu
re
Prod
uctio
n
Agric
ultu
re C
ore
Agric
ultu
re
Exte
nded
Agric
ultu
re
Dis
tribu
tion
Fore
stry
Pr
oduc
tion
Fore
stry
Cor
e
Fore
stry
Ex
tend
ed
Fore
stry
D
istri
butio
n
Perc
enta
ge o
f Tot
al
Output Employment Value added
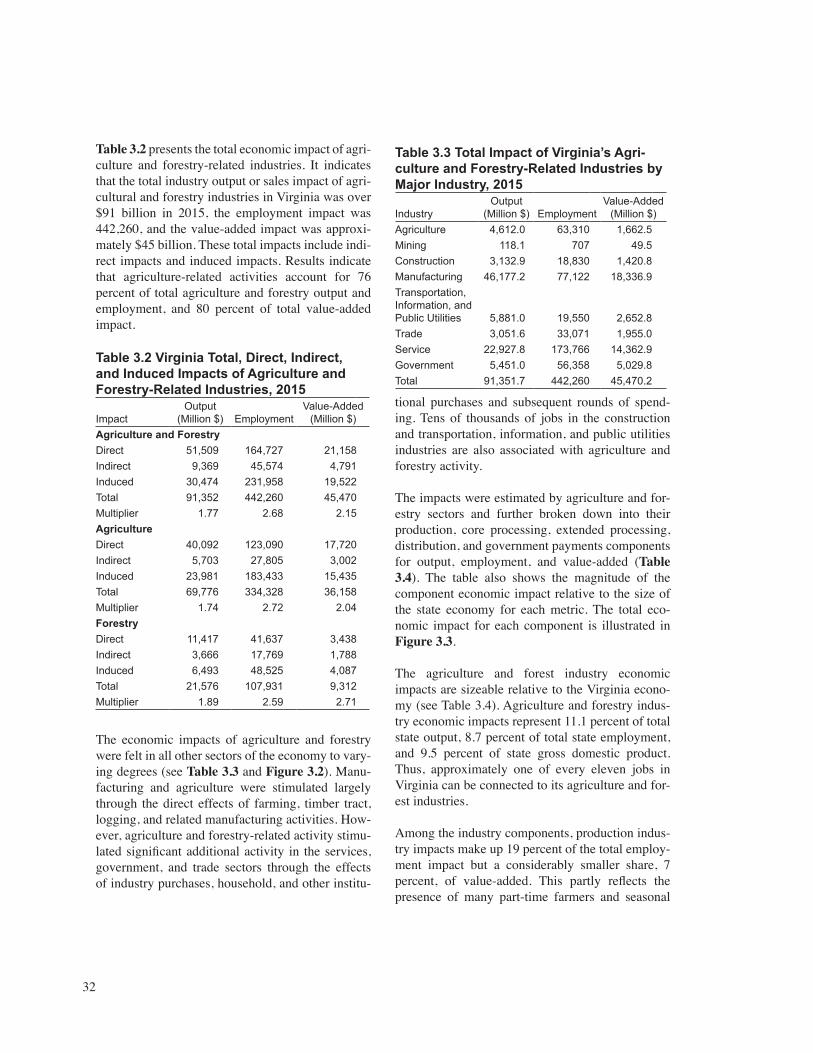
32
Table 3.2 presents the total economic impact of agri-culture and forestry-related industries. It indicates that the total industry output or sales impact of agri-cultural and forestry industries in Virginia was over $91 billion in 2015, the employment impact was 442,260, and the value-added impact was approxi-mately $45 billion. These total impacts include indi-rect impacts and induced impacts. Results indicate that agriculture-related activities account for 76 percent of total agriculture and forestry output and employment, and 80 percent of total value-added impact.
The economic impacts of agriculture and forestry were felt in all other sectors of the economy to vary-ing degrees (see Table 3.3 and Figure 3.2). Manu-facturing and agriculture were stimulated largely through the direct effects of farming, timber tract, logging, and related manufacturing activities. How-ever, agriculture and forestry-related activity stimu-lated significant additional activity in the services, government, and trade sectors through the effects of industry purchases, household, and other institu-
tional purchases and subsequent rounds of spend-ing. Tens of thousands of jobs in the construction and transportation, information, and public utilities industries are also associated with agriculture and forestry activity.
The impacts were estimated by agriculture and for-estry sectors and further broken down into their production, core processing, extended processing, distribution, and government payments components for output, employment, and value-added (Table 3.4). The table also shows the magnitude of the component economic impact relative to the size of the state economy for each metric. The total eco-nomic impact for each component is illustrated in Figure 3.3.
The agriculture and forest industry economic impacts are sizeable relative to the Virginia econo-my (see Table 3.4). Agriculture and forestry indus-try economic impacts represent 11.1 percent of total state output, 8.7 percent of total state employment, and 9.5 percent of state gross domestic product. Thus, approximately one of every eleven jobs in Virginia can be connected to its agriculture and for-est industries.
Among the industry components, production indus-try impacts make up 19 percent of the total employ-ment impact but a considerably smaller share, 7 percent, of value-added. This partly reflects the presence of many part-time farmers and seasonal
Table 3.2 Virginia Total, Direct, Indirect, and Induced Impacts of Agriculture and Forestry-Related Industries, 2015
ImpactOutput
(Million $) EmploymentValue-Added
(Million $)Agriculture and ForestryDirect 51,509 164,727 21,158Indirect 9,369 45,574 4,791Induced 30,474 231,958 19,522Total 91,352 442,260 45,470Multiplier 1.77 2.68 2.15AgricultureDirect 40,092 123,090 17,720Indirect 5,703 27,805 3,002Induced 23,981 183,433 15,435Total 69,776 334,328 36,158Multiplier 1.74 2.72 2.04ForestryDirect 11,417 41,637 3,438Indirect 3,666 17,769 1,788Induced 6,493 48,525 4,087Total 21,576 107,931 9,312Multiplier 1.89 2.59 2.71
Table 3.3 Total Impact of Virginia’s Agri-culture and Forestry-Related Industries by Major Industry, 2015
IndustryOutput
(Million $) EmploymentValue-Added
(Million $)Agriculture 4,612.0 63,310 1,662.5Mining 118.1 707 49.5Construction 3,132.9 18,830 1,420.8Manufacturing 46,177.2 77,122 18,336.9Transportation, Information, and Public Utilities 5,881.0 19,550 2,652.8Trade 3,051.6 33,071 1,955.0Service 22,927.8 173,766 14,362.9Government 5,451.0 56,358 5,029.8Total 91,351.7 442,260 45,470.2
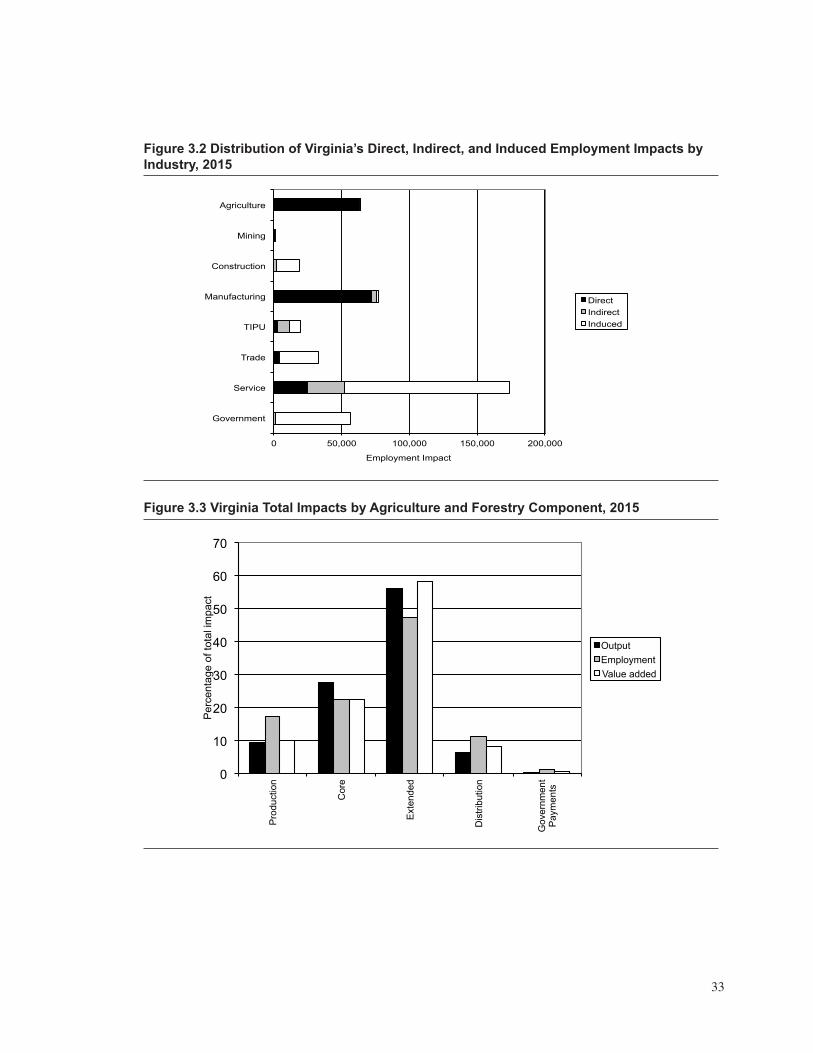
33
Figure 3.3 Virginia Total Impacts by Agriculture and Forestry Component, 2015
0
10
20
30
40
50
60
70
Pro
duct
ion
Cor
e
Ext
ende
d
Dis
tribu
tion
Gov
ernm
ent
Pay
men
ts
Per
cent
age
of to
tal i
mpa
ct
Output Employment Value added
Figure 3.2 Distribution of Virginia’s Direct, Indirect, and Induced Employment Impacts by Industry, 2015
0 50,000 100,000 150,000 200,000
Agriculture
Mining
Construction
Manufacturing
TIPU
Trade
Service
Government
Employment Impact
Direct Indirect Induced
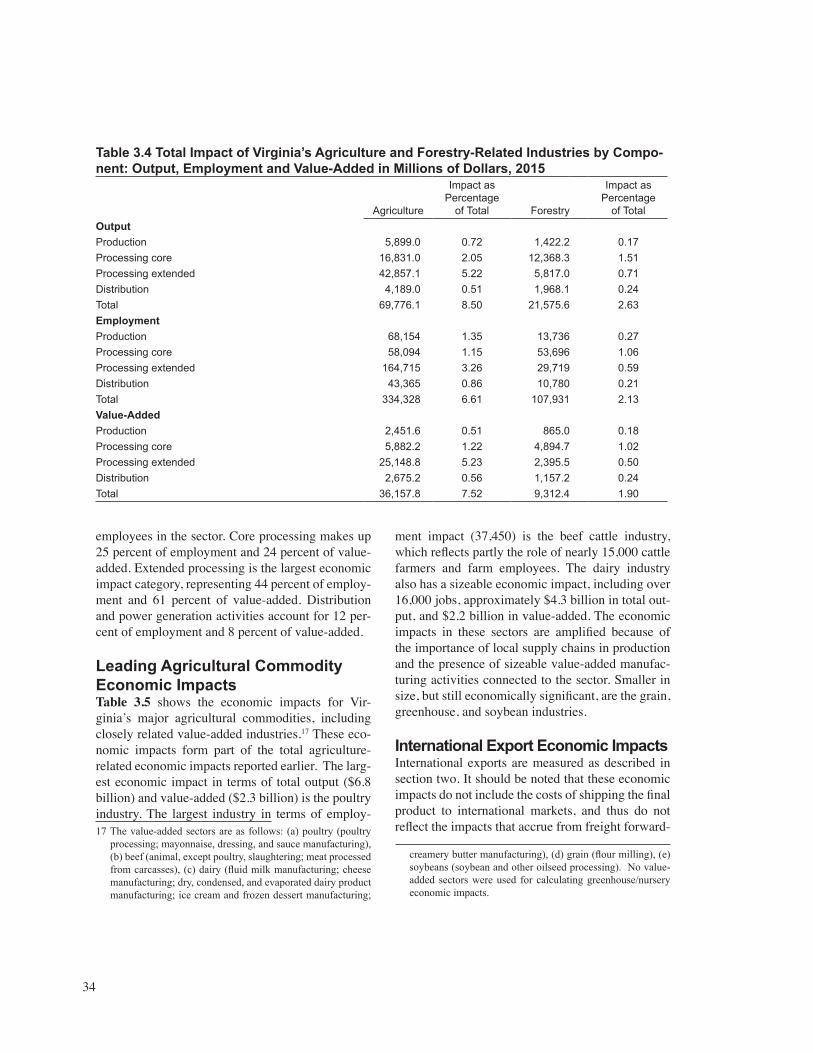
34
employees in the sector. Core processing makes up 25 percent of employment and 24 percent of value-added. Extended processing is the largest economic impact category, representing 44 percent of employ-ment and 61 percent of value-added. Distribution and power generation activities account for 12 per-cent of employment and 8 percent of value-added.
Leading Agricultural Commodity Economic ImpactsTable 3.5 shows the economic impacts for Vir-ginia’s major agricultural commodities, including closely related value-added industries.17 These eco-nomic impacts form part of the total agriculture-related economic impacts reported earlier. The larg-est economic impact in terms of total output ($6.8 billion) and value-added ($2.3 billion) is the poultry industry. The largest industry in terms of employ-
ment impact (37,450) is the beef cattle industry, which reflects partly the role of nearly 15,000 cattle farmers and farm employees. The dairy industry also has a sizeable economic impact, including over 16,000 jobs, approximately $4.3 billion in total out-put, and $2.2 billion in value-added. The economic impacts in these sectors are amplified because of the importance of local supply chains in production and the presence of sizeable value-added manufac-turing activities connected to the sector. Smaller in size, but still economically significant, are the grain, greenhouse, and soybean industries.
International Export Economic ImpactsInternational exports are measured as described in section two. It should be noted that these economic impacts do not include the costs of shipping the final product to international markets, and thus do not reflect the impacts that accrue from freight forward-
Table 3.4 Total Impact of Virginia’s Agriculture and Forestry-Related Industries by Compo-nent: Output, Employment and Value-Added in Millions of Dollars, 2015
Agriculture
Impact as Percentage
of Total Forestry
Impact as Percentage
of TotalOutputProduction 5,899.0 0.72 1,422.2 0.17Processing core 16,831.0 2.05 12,368.3 1.51Processing extended 42,857.1 5.22 5,817.0 0.71Distribution 4,189.0 0.51 1,968.1 0.24Total 69,776.1 8.50 21,575.6 2.63EmploymentProduction 68,154 1.35 13,736 0.27Processing core 58,094 1.15 53,696 1.06Processing extended 164,715 3.26 29,719 0.59Distribution 43,365 0.86 10,780 0.21Total 334,328 6.61 107,931 2.13Value-AddedProduction 2,451.6 0.51 865.0 0.18Processing core 5,882.2 1.22 4,894.7 1.02Processing extended 25,148.8 5.23 2,395.5 0.50Distribution 2,675.2 0.56 1,157.2 0.24Total 36,157.8 7.52 9,312.4 1.90
17 The value-added sectors are as follows: (a) poultry (poultry processing; mayonnaise, dressing, and sauce manufacturing), (b) beef (animal, except poultry, slaughtering; meat processed fromcarcasses),(c)dairy(fluidmilkmanufacturing;cheesemanufacturing; dry, condensed, and evaporated dairy product manufacturing; ice cream and frozen dessert manufacturing;
creamerybuttermanufacturing),(d)grain(flourmilling),(e)soybeans (soybean and other oilseed processing). No value-added sectors were used for calculating greenhouse/nursery economic impacts.
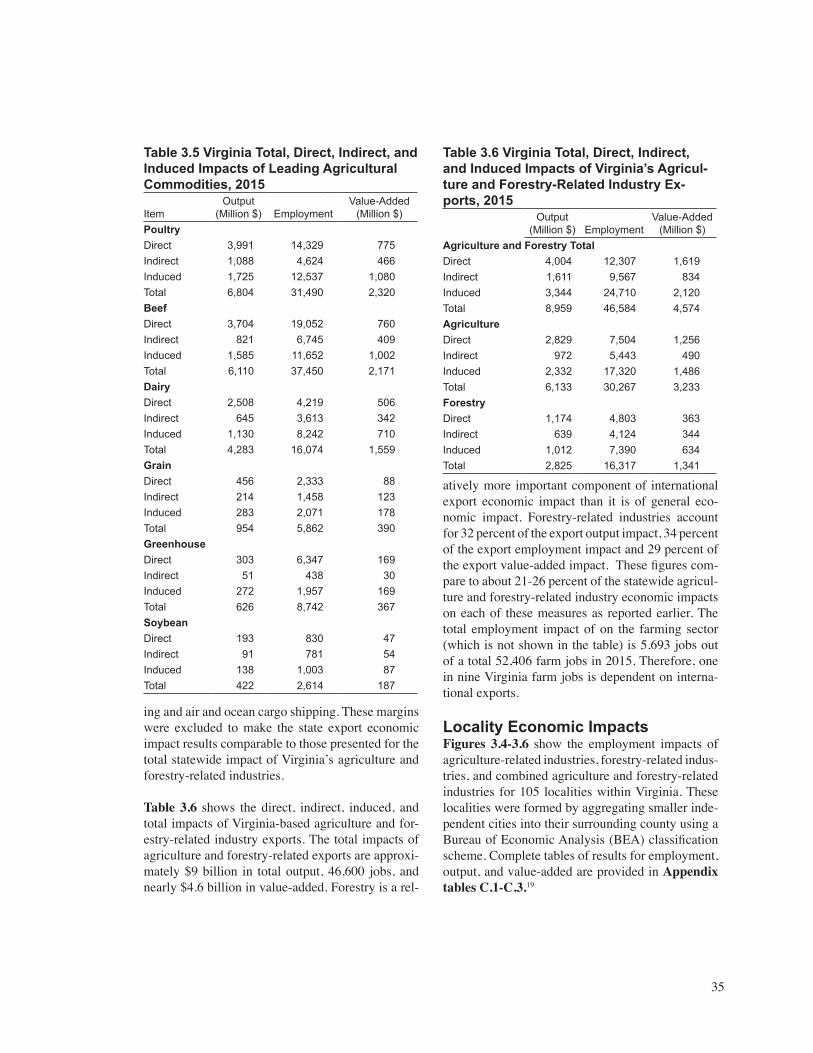
35
ing and air and ocean cargo shipping. These margins were excluded to make the state export economic impact results comparable to those presented for the total statewide impact of Virginia’s agriculture and forestry-related industries.
Table 3.6 shows the direct, indirect, induced, and total impacts of Virginia-based agriculture and for-estry-related industry exports. The total impacts of agriculture and forestry-related exports are approxi-mately $9 billion in total output, 46,600 jobs, and nearly $4.6 billion in value-added. Forestry is a rel-
Table 3.5 Virginia Total, Direct, Indirect, and Induced Impacts of Leading Agricultural Commodities, 2015
ItemOutput
(Million $) EmploymentValue-Added
(Million $)PoultryDirect 3,991 14,329 775Indirect 1,088 4,624 466Induced 1,725 12,537 1,080Total 6,804 31,490 2,320Beef Direct 3,704 19,052 760Indirect 821 6,745 409Induced 1,585 11,652 1,002Total 6,110 37,450 2,171Dairy Direct 2,508 4,219 506Indirect 645 3,613 342Induced 1,130 8,242 710Total 4,283 16,074 1,559Grain Direct 456 2,333 88Indirect 214 1,458 123Induced 283 2,071 178Total 954 5,862 390Greenhouse Direct 303 6,347 169Indirect 51 438 30Induced 272 1,957 169Total 626 8,742 367Soybean Direct 193 830 47Indirect 91 781 54Induced 138 1,003 87Total 422 2,614 187
atively more important component of international export economic impact than it is of general eco-nomic impact. Forestry-related industries account for 32 percent of the export output impact, 34 percent of the export employment impact and 29 percent of the export value-added impact. These figures com-pare to about 21-26 percent of the statewide agricul-ture and forestry-related industry economic impacts on each of these measures as reported earlier. The total employment impact of on the farming sector (which is not shown in the table) is 5,693 jobs out of a total 52,406 farm jobs in 2015. Therefore, one in nine Virginia farm jobs is dependent on interna-tional exports.
Locality Economic ImpactsFigures 3.4-3.6 show the employment impacts of agriculture-related industries, forestry-related indus-tries, and combined agriculture and forestry-related industries for 105 localities within Virginia. These localities were formed by aggregating smaller inde-pendent cities into their surrounding county using a Bureau of Economic Analysis (BEA) classification scheme. Complete tables of results for employment, output, and value-added are provided in Appendix tables C.1-C.3.19
Table 3.6 Virginia Total, Direct, Indirect, and Induced Impacts of Virginia’s Agricul-ture and Forestry-Related Industry Ex-ports, 2015
Output (Million $) Employment
Value-Added (Million $)
Agriculture and Forestry TotalDirect 4,004 12,307 1,619Indirect 1,611 9,567 834Induced 3,344 24,710 2,120Total 8,959 46,584 4,574Agriculture Direct 2,829 7,504 1,256Indirect 972 5,443 490Induced 2,332 17,320 1,486Total 6,133 30,267 3,233Forestry Direct 1,174 4,803 363Indirect 639 4,124 344Induced 1,012 7,390 634Total 2,825 16,317 1,341
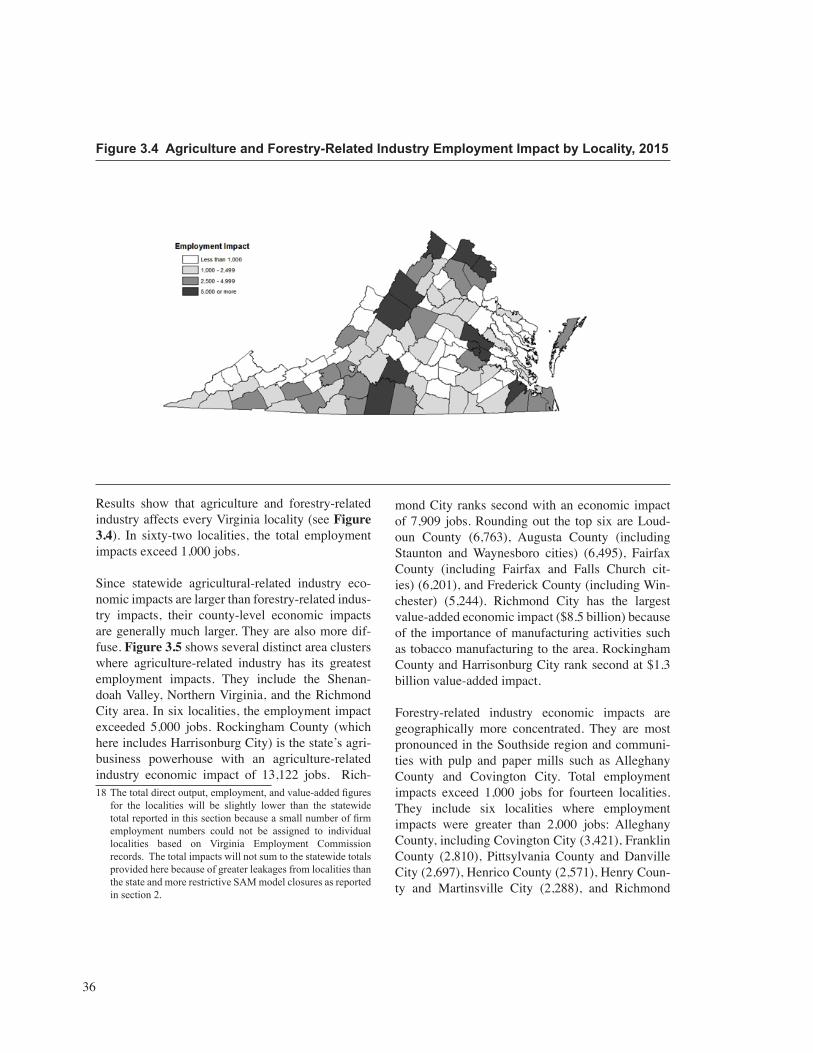
36
Results show that agriculture and forestry-related industry affects every Virginia locality (see Figure 3.4). In sixty-two localities, the total employment impacts exceed 1,000 jobs.
Since statewide agricultural-related industry eco-nomic impacts are larger than forestry-related indus-try impacts, their county-level economic impacts are generally much larger. They are also more dif-fuse. Figure 3.5 shows several distinct area clusters where agriculture-related industry has its greatest employment impacts. They include the Shenan-doah Valley, Northern Virginia, and the Richmond City area. In six localities, the employment impact exceeded 5,000 jobs. Rockingham County (which here includes Harrisonburg City) is the state’s agri-business powerhouse with an agriculture-related industry economic impact of 13,122 jobs. Rich-
mond City ranks second with an economic impact of 7,909 jobs. Rounding out the top six are Loud-oun County (6,763), Augusta County (including Staunton and Waynesboro cities) (6,495), Fairfax County (including Fairfax and Falls Church cit-ies) (6,201), and Frederick County (including Win-chester) (5,244). Richmond City has the largest value-added economic impact ($8.5 billion) because of the importance of manufacturing activities such as tobacco manufacturing to the area. Rockingham County and Harrisonburg City rank second at $1.3 billion value-added impact.
Forestry-related industry economic impacts are geographically more concentrated. They are most pronounced in the Southside region and communi-ties with pulp and paper mills such as Alleghany County and Covington City. Total employment impacts exceed 1,000 jobs for fourteen localities. They include six localities where employment impacts were greater than 2,000 jobs: Alleghany County, including Covington City (3,421), Franklin County (2,810), Pittsylvania County and Danville City (2,697), Henrico County (2,571), Henry Coun-ty and Martinsville City (2,288), and Richmond
Figure 3.4 Agriculture and Forestry-Related Industry Employment Impact by Locality, 2015
18Thetotaldirectoutput,employment,andvalue-addedfiguresfor the localities will be slightly lower than the statewide totalreportedinthissectionbecauseasmallnumberoffirmemployment numbers could not be assigned to individual localities based on Virginia Employment Commission records. The total impacts will not sum to the statewide totals provided here because of greater leakages from localities than the state and more restrictive SAM model closures as reported in section 2.
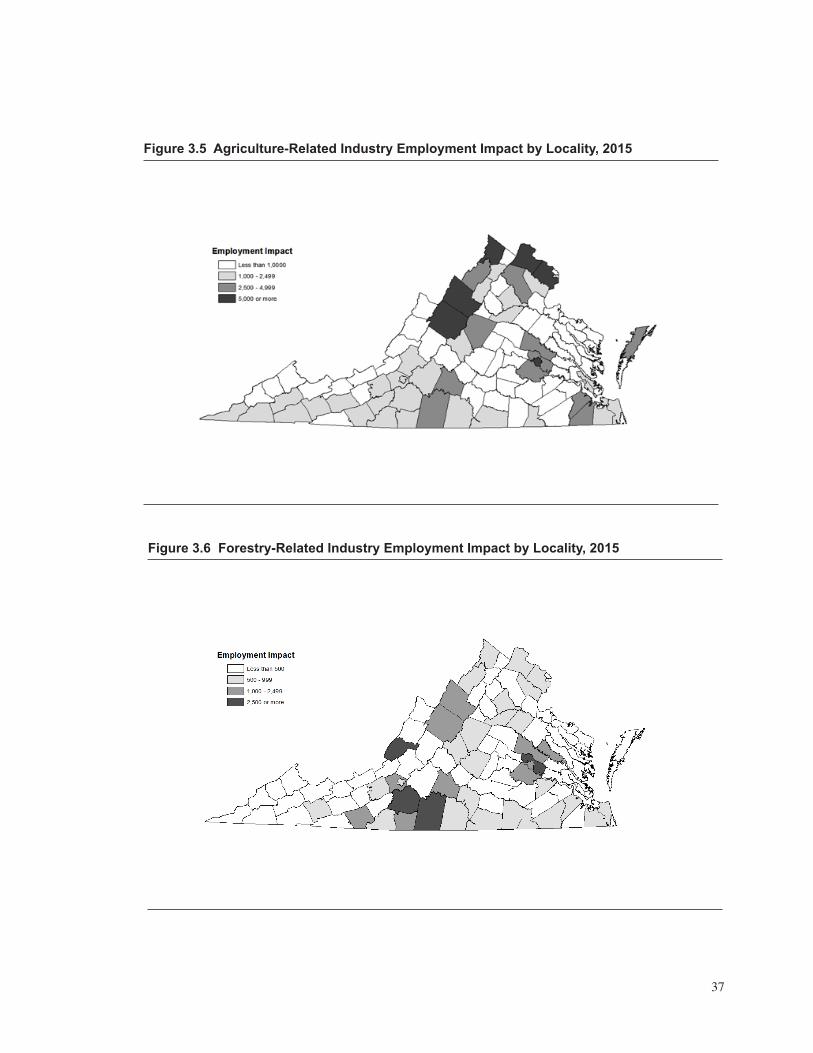
37
Figure 3.5 Agriculture-Related Industry Employment Impact by Locality, 2015
Figure 3.6 Forestry-Related Industry Employment Impact by Locality, 2015

38
City (2,044). The largest value-added impacts were found in Alleghany County and Covington City
($388 million), Henrico County ($230 million), and Richmond City ($208 million).
39
SECTION 4OTHER AGRICULTURE AND FORESTRY ECONOMIC IMPACTS AND BENEFITS
The main focus of this study is to gauge the eco-nomic impact of agriculture and forestry in the Commonwealth. However, it is much more difficult to measure every economic impact, including the economic impacts of other farm-related revenue-generating activities such as agritourism, energy production, and farm-based value-added activities. Only direct farm sales of agricultural commodities to agritourists were captured in the previous results.Moreover, agriculture and forestry landscapes pro-duce other social benefits that are not captured by an economic impact study such as improved water and air quality, flood mitigation, wildlife habitat, scenic amenities, etc. This section reviews some of these other economic contributions, organized into the categories of other farm-related income, agriculture and forest-related tourism and recreation, miscel-laneous other economic impacts, and environment and quality of life. Quantitative and qualitative evi-dence are presented to support the important role that agriculture and forestry provide in these areas.
Other Farm-Related IncomeFarm-related activities such as value-added prod-ucts, energy production, recreational services, cus-tom work and agricultural services, and land leas-ing are increasingly important sources of income for many Virginia farmers. Some of these activities would be reflected in the economic impact results presented in the previous section. For example, agri-cultural products sold to agritourists would already be counted as part of sales that form part of the direct impact. Several farm income sources were not included. According to the 2012 Agricultural Cen-sus, 2,267 Virginia farms produced and sold value-added commodities such as jams, cheese, processed meat, and floral arrangements. This number repre-sents a 10 percent increase from the 2,058 farms reported in the 2007 Agricultural Census. Virginia farmers are also increasingly generating renewable energy and harvesting biomass for use in renew-able energy. Three hundred and ninety two Virginia farms generated energy or electricity on their farms in 2007 from sources such as wind turbines, meth-
ane digesters, and solar panels. Three hundred and eighty-seven farms reported growing biomass in 2012. The number of farms obtaining income from recreational services (e.g., pumpkin patches, corn mazes, petting zoos, farm festivals, hayrides, hunt-ing, trail riding) has continued to increase, from 476 farms and $12.9 million in income for 2007 to 814 farms and $15.2 million of income for 2012.
Agriculture and Forest-Related Tourism and RecreationVirginia generated approximately $23 billion in travel expenditures from visitors in 2015, up from $20 billion in 2011 (Virginia Tourism Corpora-tion 2016). Survey results suggest that a significant number of leisure visitors are attracted by the state’s rural amenities and participate in rural outdoors rec-reation and leisure activities (see Table 4.1). Four-teen percent of leisure visitors cited rural sightsee-ing among their reasons for visiting. Other popular agritourism and forest recreation venues include national parks (8 percent), state parks (7 percent), wildlife viewing (5 percent), gardens (4 percent) and wine tasting/winery tour (3 percent). Visitors may conduct multi-purpose and multi-venue visits. So, the participation rates are not additive.
Agritourists deliver a significant boost to the state’s tourism industry. A new study (Magnini 2017) esti-mates that Virginia agritourists accounted for over $1.3 billion on off-farm tourism-related expendi-tures such as hotels, restaurants, entertainment, fuel, and other incidentals. Virginia’s 261 wineries alone generated $188 million in associated tourism expenditures (Frank, Rimerman + Co. LLP 2017). They also attracted an estimated 2.25 million wine-related tourists in 2015, a 43 percent increase from 2010. Virginia hosted almost 1,200 horse shows and competitions in 2010 that drew approximately 940 thousand people who spent more than $220 million on travel and associated expenses (Rephann 2011).
Wildlife recreation is also supported by the avail-ability of rural and forested landscapes. The U.S.
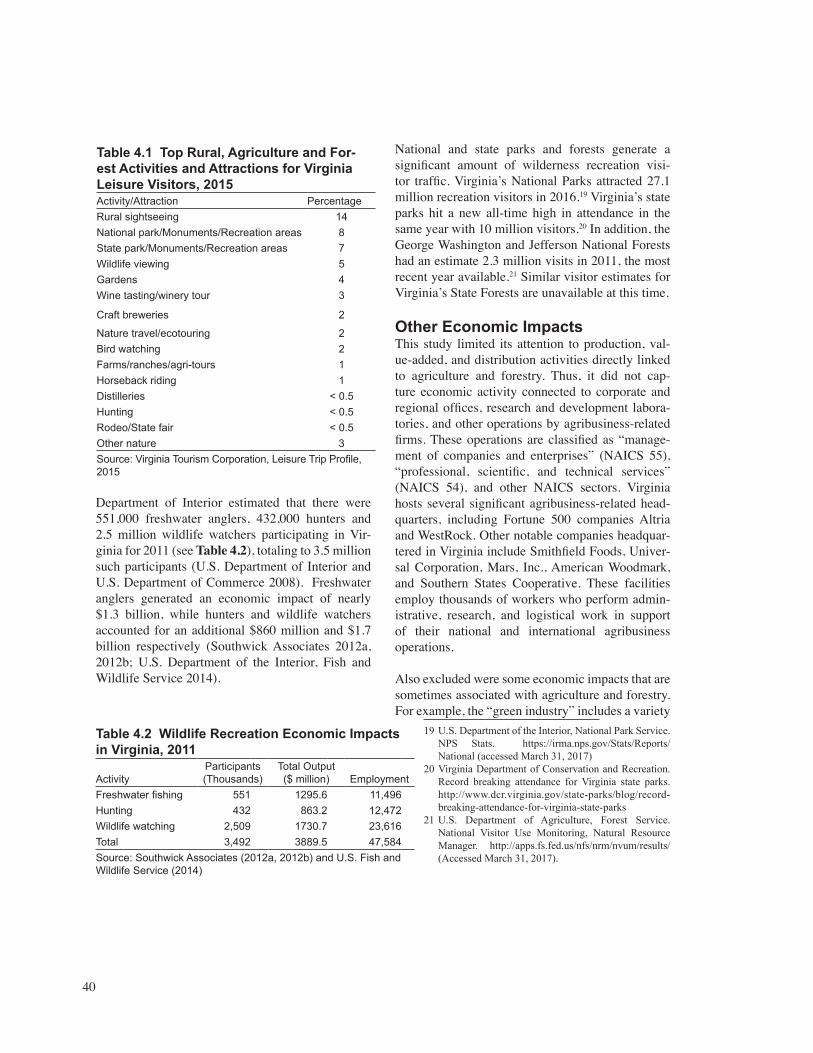
40
Department of Interior estimated that there were 551,000 freshwater anglers, 432,000 hunters and 2.5 million wildlife watchers participating in Vir-ginia for 2011 (see Table 4.2), totaling to 3.5 million such participants (U.S. Department of Interior and U.S. Department of Commerce 2008). Freshwater anglers generated an economic impact of nearly $1.3 billion, while hunters and wildlife watchers accounted for an additional $860 million and $1.7 billion respectively (Southwick Associates 2012a, 2012b; U.S. Department of the Interior, Fish and Wildlife Service 2014).
National and state parks and forests generate a significant amount of wilderness recreation visi-tor traffic. Virginia’s National Parks attracted 27.1 million recreation visitors in 2016.19 Virginia’s state parks hit a new all-time high in attendance in the same year with 10 million visitors.20 In addition, the George Washington and Jefferson National Forests had an estimate 2.3 million visits in 2011, the most recent year available.21 Similar visitor estimates for Virginia’s State Forests are unavailable at this time.
Other Economic Impacts This study limited its attention to production, val-ue-added, and distribution activities directly linked to agriculture and forestry. Thus, it did not cap-ture economic activity connected to corporate and regional offices, research and development labora-tories, and other operations by agribusiness-related firms. These operations are classified as “manage-ment of companies and enterprises” (NAICS 55), “professional, scientific, and technical services” (NAICS 54), and other NAICS sectors. Virginia hosts several significant agribusiness-related head-quarters, including Fortune 500 companies Altria and WestRock. Other notable companies headquar-tered in Virginia include Smithfield Foods, Univer-sal Corporation, Mars, Inc., American Woodmark, and Southern States Cooperative. These facilities employ thousands of workers who perform admin-istrative, research, and logistical work in support of their national and international agribusiness operations.
Also excluded were some economic impacts that are sometimes associated with agriculture and forestry. For example, the “green industry” includes a variety
Table 4.1 Top Rural, Agriculture and For-est Activities and Attractions for Virginia Leisure Visitors, 2015 Activity/Attraction PercentageRural sightseeing 14National park/Monuments/Recreation areas 8State park/Monuments/Recreation areas 7Wildlife viewing 5Gardens 4Wine tasting/winery tour 3
Craft breweries 2
Nature travel/ecotouring 2Bird watching 2Farms/ranches/agri-tours 1Horseback riding 1Distilleries < 0.5Hunting < 0.5Rodeo/State fair < 0.5Other nature 3Source: Virginia Tourism Corporation, Leisure Trip Profile, 2015
Table 4.2 Wildlife Recreation Economic Impacts in Virginia, 2011
ActivityParticipants (Thousands)
Total Output ($ million) Employment
Freshwater fishing 551 1295.6 11,496Hunting 432 863.2 12,472Wildlife watching 2,509 1730.7 23,616Total 3,492 3889.5 47,584Source: Southwick Associates (2012a, 2012b) and U.S. Fish and Wildlife Service (2014)
19 U.S. Department of the Interior, National Park Service. NPS Stats. https://irma.nps.gov/Stats/Reports/National (accessed March 31, 2017)
20 Virginia Department of Conservation and Recreation. Record breaking attendance for Virginia state parks. http://www.dcr.virginia.gov/state-parks/blog/record-breaking-attendance-for-virginia-state-parks
21 U.S. Department of Agriculture, Forest Service. National Visitor Use Monitoring, Natural Resource Manager. http://apps.fs.fed.us/nfs/nrm/nvum/results/ (Accessed March 31, 2017).
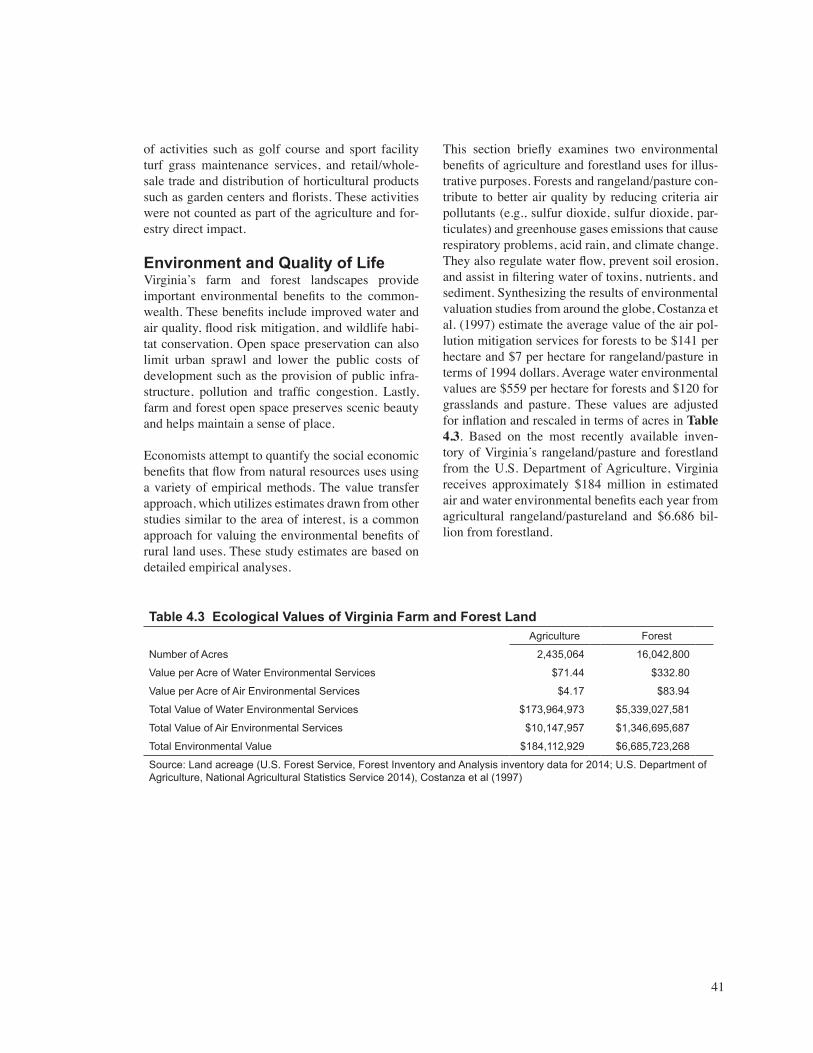
41
of activities such as golf course and sport facility turf grass maintenance services, and retail/whole-sale trade and distribution of horticultural products such as garden centers and florists. These activities were not counted as part of the agriculture and for-estry direct impact.
Environment and Quality of LifeVirginia’s farm and forest landscapes provide important environmental benefits to the common-wealth. These benefits include improved water and air quality, flood risk mitigation, and wildlife habi-tat conservation. Open space preservation can also limit urban sprawl and lower the public costs of development such as the provision of public infra-structure, pollution and traffic congestion. Lastly, farm and forest open space preserves scenic beauty and helps maintain a sense of place.
Economists attempt to quantify the social economic benefits that flow from natural resources uses using a variety of empirical methods. The value transfer approach, which utilizes estimates drawn from other studies similar to the area of interest, is a common approach for valuing the environmental benefits of rural land uses. These study estimates are based on detailed empirical analyses.
This section briefly examines two environmental benefits of agriculture and forestland uses for illus-trative purposes. Forests and rangeland/pasture con-tribute to better air quality by reducing criteria air pollutants (e.g., sulfur dioxide, sulfur dioxide, par-ticulates) and greenhouse gases emissions that cause respiratory problems, acid rain, and climate change. They also regulate water flow, prevent soil erosion, and assist in filtering water of toxins, nutrients, and sediment. Synthesizing the results of environmental valuation studies from around the globe, Costanza et al. (1997) estimate the average value of the air pol-lution mitigation services for forests to be $141 per hectare and $7 per hectare for rangeland/pasture in terms of 1994 dollars. Average water environmental values are $559 per hectare for forests and $120 for grasslands and pasture. These values are adjusted for inflation and rescaled in terms of acres in Table 4.3. Based on the most recently available inven-tory of Virginia’s rangeland/pasture and forestland from the U.S. Department of Agriculture, Virginia receives approximately $184 million in estimated air and water environmental benefits each year from agricultural rangeland/pastureland and $6.686 bil-lion from forestland.
Table 4.3 Ecological Values of Virginia Farm and Forest Land Agriculture Forest
Number of Acres 2,435,064 16,042,800
Value per Acre of Water Environmental Services $71.44 $332.80
Value per Acre of Air Environmental Services $4.17 $83.94
Total Value of Water Environmental Services $173,964,973 $5,339,027,581
Total Value of Air Environmental Services $10,147,957 $1,346,695,687
Total Environmental Value $184,112,929 $6,685,723,268
Source: Land acreage (U.S. Forest Service, Forest Inventory and Analysis inventory data for 2014; U.S. Department of Agriculture, National Agricultural Statistics Service 2014), Costanza et al (1997)

42
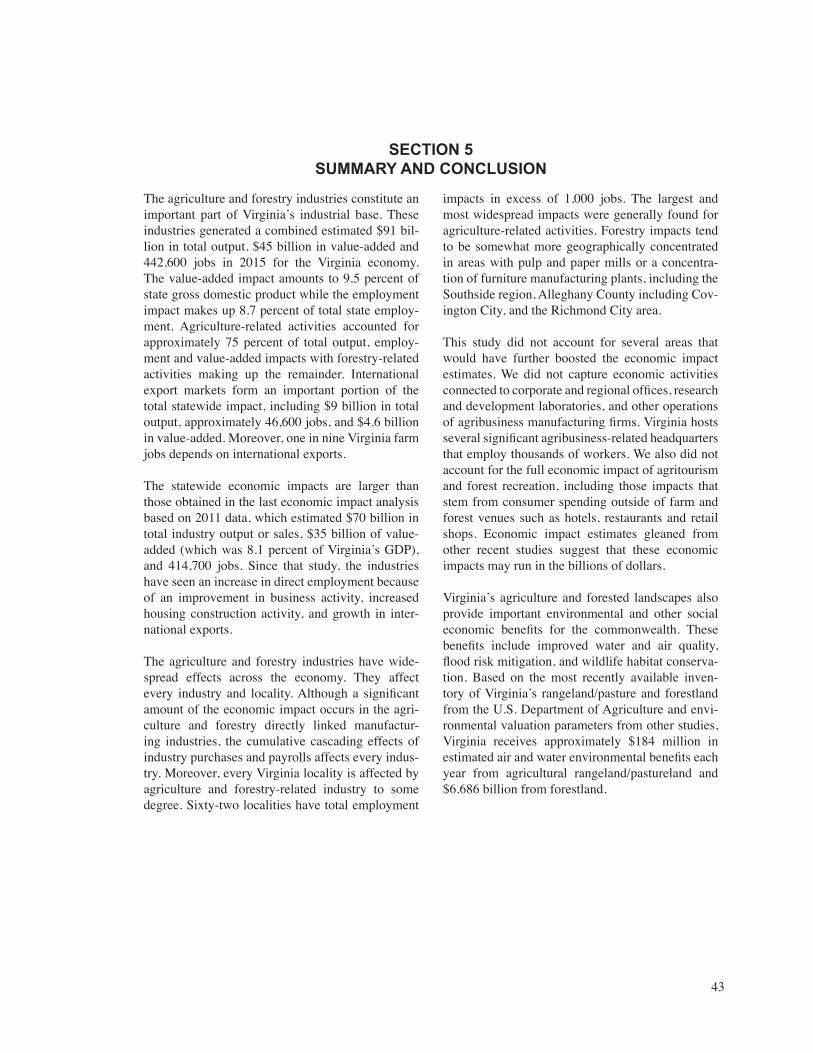
43
SECTION 5SUMMARY AND CONCLUSION
The agriculture and forestry industries constitute an important part of Virginia’s industrial base. These industries generated a combined estimated $91 bil-lion in total output, $45 billion in value-added and 442,600 jobs in 2015 for the Virginia economy. The value-added impact amounts to 9.5 percent of state gross domestic product while the employment impact makes up 8.7 percent of total state employ-ment. Agriculture-related activities accounted for approximately 75 percent of total output, employ-ment and value-added impacts with forestry-related activities making up the remainder. International export markets form an important portion of the total statewide impact, including $9 billion in total output, approximately 46,600 jobs, and $4.6 billion in value-added. Moreover, one in nine Virginia farm jobs depends on international exports.
The statewide economic impacts are larger than those obtained in the last economic impact analysis based on 2011 data, which estimated $70 billion in total industry output or sales, $35 billion of value-added (which was 8.1 percent of Virginia’s GDP), and 414,700 jobs. Since that study, the industries have seen an increase in direct employment because of an improvement in business activity, increased housing construction activity, and growth in inter-national exports.
The agriculture and forestry industries have wide-spread effects across the economy. They affect every industry and locality. Although a significant amount of the economic impact occurs in the agri-culture and forestry directly linked manufactur-ing industries, the cumulative cascading effects of industry purchases and payrolls affects every indus-try. Moreover, every Virginia locality is affected by agriculture and forestry-related industry to some degree. Sixty-two localities have total employment
impacts in excess of 1,000 jobs. The largest and most widespread impacts were generally found for agriculture-related activities. Forestry impacts tend to be somewhat more geographically concentrated in areas with pulp and paper mills or a concentra-tion of furniture manufacturing plants, including the Southside region, Alleghany County including Cov-ington City, and the Richmond City area.
This study did not account for several areas that would have further boosted the economic impact estimates. We did not capture economic activities connected to corporate and regional offices, research and development laboratories, and other operations of agribusiness manufacturing firms. Virginia hosts several significant agribusiness-related headquarters that employ thousands of workers. We also did not account for the full economic impact of agritourism and forest recreation, including those impacts that stem from consumer spending outside of farm and forest venues such as hotels, restaurants and retail shops. Economic impact estimates gleaned from other recent studies suggest that these economic impacts may run in the billions of dollars.
Virginia’s agriculture and forested landscapes also provide important environmental and other social economic benefits for the commonwealth. These benefits include improved water and air quality, flood risk mitigation, and wildlife habitat conserva-tion. Based on the most recently available inven-tory of Virginia’s rangeland/pasture and forestland from the U.S. Department of Agriculture and envi-ronmental valuation parameters from other studies, Virginia receives approximately $184 million in estimated air and water environmental benefits each year from agricultural rangeland/pastureland and $6.686 billion from forestland.

44
45
REFERENCES
A Frank, Rimerman and Co., LLP. 2017. The economic impact of wine and wine grapes on the state of Virginia: 2015. Study for the Virginia Wine Board.
Becker, Brian. 2014. Biomass and bioenergy in Virginia: State of the Commonwealth 2014. Orange, VA: The Center for Natural Capital.
Buehlmann, Urs and Al Schuler. 2009. The U.S. household furniture industry: Status and opportunities. Forest Products Journal 59, 9: 20-28.
Buehlmann, Uhrs and Al Schuler. 2014. Markets and market forces for secondary wood products. In The global forest sector: Changes, practices, and prospects. Eds., Eric Hansen, Rajat Panwar, and Richard Vlosky. Boca Raton, FL: CRC Press. pp. 77-98.
Cai, Chiyong, Alan W. Rudie, Nicole M. Stark, Ronald C. Sabo, and Sally A. Ralph. 2014. New products and product categories in the global forest sector. In The global forest sector: Changes, practices, and prospects. Eds., Eric Hansen, Rajat Panwar, and Richard Vlosky. Boca Raton, FL: CRC Press. pp. 129-149.
Calvin, Linda and Philip Martin. 2010. The U.S. produce industry and labor: Facing the future in a global economy. U.S. Department of Agriculture, Economic Research Service. Economic Research Report Number 106.
Conrad, Joseph L. IV and M. Chad Bolding. 2011. Virginia’s woody biomass market: Opportunities and implications. Southern Journal of Applied Forestry 35, 2: 67-72.
Cooke, Bryce, Getachew Nigatu, Kari Heerman, Maurice Landes, and Ralph Seeley. 2016. Global macroeconomic developments drive downturn in U.S. agricultural exports. U.S.D.A., Economic Research Service, AES-94.
Costanza, Robert, Ralph d’Arge, Rudolf de Groot, Stephen Farber, et al. 1997. The value of the world’s ecosystem services and natural capital. Nature 367: 253-260.
Davis, Christopher G. and Biing-Hwan Lin. 2005. Factors affecting U.S. beef consumption. U.S. Department of Agriculture, Economic Research Service, LDP-M-135-02. October 2005.
English, Leah, Jennie Popp, and Wayne Miller. 2016. Do contribution of agriculture procedures differ across states? A survey of methodological approaches used by economists. Proceedings of the 47th Annual Mid-Continent Regional Science Association Conference, Charlotte, NC, June 9-June 11, 2016.
Henderson, James E., Omkar Joshi, Shaun Tanger, Leslie Boby, et al. 2017. Standard procedures and methods for economic impact and contribution analysis in the forest products sector. Journal of Forestry. (Forthcoming)
Hetemäki, Lauri, Riitta Hänninen, And Alexander Moiseyev. 2014. Markets and market forces for pulp and paper products. In The global forest sector: Changes, practices, and prospects. Eds., Eric Hansen, Rajat Panwar, and Richard Vlosky. Boca Raton, FL: CRC Press. pp. 99-128.
46
Hitaj, Claudia and Shellye Suttles. 2016. Trends in U.S. agriculture’s consumption and production of energy: Renewable power, shale energy, and cellulosic biomass. U.S.D.A., Economic Research Service, Economic Information Bulletin Number 159.
Howard, James L. and David B. McKeever. 2015. U.S. forest products annual market review and prospects, 2011-2015. USDA, Forest Service, Forest Products Laboratory, Research Note FPL-RN-0336, June 2015.
Hudson, Karen and Thomas J. Murray. 2016. Virginia shellfish aquaculture situation and outlook report: Results of the 2015 Virginia shellfish aquaculture crop reporting survey. Virginia Institute of Marine Science.
Hull, R. Bruce. 2011. Forestry’s conundrum: High value, low relevance. Journal of Forestry 109, 1: 50-57.
Li, Haizheng and Jifeng Luo. 2008. Industry consolidation and price in the US linerboard industry. Journal of Forest Economics 14, 2: 93-115.
Lindall, Scott. 1998. How does MIG estimate that pesky agricultural data anyway? Stillwater, MN: Minnesota IMPLAN Group, Inc.
Lopez, Rigoberto A, Nataliya Plesha and Benjamin Campbell. 2014. Economic impacts of agriculture in eight northeastern states. Storrs, CT: Department of Agricultural and Research Economics, University of Connecticut.
Luppold, William G. and Matthew S. Bumgardner. 2009. The wood household furniture and kitchen cabinet industries: A contrast in fortune. Forest Products Journal 59, 11/12: 93-99.
MacDonald, James M. 2008. The economic organization of U.S. broiler production. U.S. Department of Agriculture, Economic Research Service, Economic Information Bulletin Number 38.
MacDonald,JamesM.2014.Technology,organization,andfinancialperformanceinU.S.broilerproduction.U.S.D.A., Economic Research Service, Economic Information Bulletin Number 126.
MacDonald, James M., Jerry Cessna, and Roberto Mosheim. 2016. Changing structure, financial risks, and government policy for the U.S. dairy industry. U.S.D.A., Economic Research Service, Economic Research Report, Number 205.
Magnini, Vincent P. 2017. The economic and fiscal impacts of agritourism in Virginia. Virginia Tech, Pamplin College of Business
Marshall, Kandice K., Stephanie M. Riche, Ralph M. Seeley, and Paul C. Westcott. 2015. Effects of recent energy price reductions on U.S. agriculture. U.S. Department of Agriculture, Economic Research Service. BIO—04.
McBride, William and Nigel Key. 2013. U.S. hog production from 1992 to 2009: Technology, Restructuring and Productivity Growth. U.S. Department of Agriculture, Economic Research Service. Economic Research Report Number 158.
47
Murray, Thomas J. and Karen Hudson. 2012. Virginia shellfish aquaculture situation and outlook report: Results of 2011 Virginia shellfish aquaculture crop reporting survey. Virginia Sea Grant Marine Extension Program, Virginia Institute of Marine Science.
Prestemon, Jeffrey P., David N. Wear, and Michaela O. Foster. 2015. The global position of the U.S. forest products industry. U.S. Department of Agriculture, U.S. Forest Service, Southern Research Station, e-General Technical Report SRS-204, March 2015.
Prisley, Stephen P. 2015. Baseline analysis of Virginia’s commercial wood supply. Virginia Tech Center for Natural Resources.
Rephann, Terance J. 2008. The economic impact of agriculture and forestry on the Commonwealth of Virginia. Charlottesville, VA: Weldon Cooper Center for Public Service, University of Virginia.
Rephann, Terance J. 2011. The economic impact of the horse industry in Virginia. Charlottesville, VA: Weldon Cooper Center for Public Service, University of Virginia.
Rephann, Terance J. 2013. The economic impacts of agriculture and forest industries in Virginia. Charlottesville, VA: Weldon Cooper Center for Public Service, University of Virginia.
Rose, Anita. 2016. Forests of Virginia, 2014. Resource Update FS-94. Asheville, NC: U.S. Department of Agriculture Forest Service, Southern Research Station.
Southwick Associates. 2012a. Sportfishing in America: An economic force for conservation. Produced for theAmericanSportfishingAssociation(ASA)underaU.S.FishandWildlifeService(USFWS)SportFishRestoration grant (F12AP00137, VA M-26-R) awarded by the Association of Fish and Wildlife Agencies (AFWA), 2012.
Southwick Associates. 2012b. Hunting in America: An economic force for conservation. Produced for the National Shooting Sports Foundation in partnership with the Association of Fish and Wildlife Agencies.
U.S. Census Bureau. 2017. U.S.A. trade online. https://usatrade.census.gov (Accessed March 29, 2017).
U.S. Department of Agriculture (USDA), Economic Research Service. 2005. Farm and farm-related employment: NAICS industry groups and components.
U.S.Department ofAgriculture (USDA),EconomicResearchService. 2016a. Farm income:Datafiles.http://www.ers.usda.gov/data-products/farm-income-and-wealth-statistics.aspx (Accessed October 6, 2016).
U.S. Department of Agriculture (USDA), Economic Research Service. 2016b. Food availability system. https://www.ers.usda.gov/data-products/food-availability-per-capita-data-system/ (Accessed April 17, 2017).
U.S. Department of Agriculture (USDA), Forest Service. 2004. National report on sustainable forests-2003. Asheville, NC: Southern Research Station.
U.S. Department of Agriculture (USDA), National Agricultural Statistics Service. 2016 Quick Stats. https://quickstats.nass.usda.gov (Accessed October 6, 2016)
48
U.S. Department of Agriculture (USDA), National Agricultural Statistics Service. 2004. 2002 census of agriculture. United States summary and state data. Volume 1, Geographic Area Series, Part 51. AC-02-A-51.
U.S. Department of Agriculture (USDA), National Agricultural Statistics Service. 2009. 2007 census of agriculture. United States summary and state data. Volume 1, Geographic Area Series, Part 51. AC-07-A-51.
U.S. Department of Agriculture (USDA), National Agricultural Statistics Service. 2014. 2012 census of agriculture. United States summary and state data. Volume 1, Geographic Area Series, Part 51. AC-12-A-51
U.S. Department of Commerce, Bureau of Economic Analysis. 2016. Local area personal income. https://www.bea.gov/regional/index.htm (Accessed January 7, 2017).
U.S. Department of the Interior, U.S. Fish and Wildlife Service. 2014. Wildlife watching in the U.S.: The economic impacts on national and state economies in 2011. Report 2001-2.
Virginia Clean Cities. 2017. 2016 alternative transportation fuels report. Prepared for the Virginia Department of Mines, Minerals and Energy.
Virginia Department of Forestry. 2015. Pine forest resource sustainability strategy. September 2015.
Virginia Economic Development Partnership (VEDP). 2016. Effectiveness of economic development incentive grant programs administered by the Commonwealth of Virginia. November 9, 2016.
Virginia Employment Commission. 2016. Quarterly Census of Employment and Wages (QCEW), Annual.
VirginiaTourismCorporation.2016. FY2015profileof leisure travel inVirginia. https://www.vatc.org/research/travel-data/ (Accessed March 29, 2017).
Walcott, Susan. 2014. A profile of the furniture manufacturing industry. New York: Business Expert Press, LLC.
Wang, Sun Ling, Paul Heisey, David Schimmelpfenning, and Eldon Ball. 2015. Agricultural productivity growth in the United States: Measurement, trends, and drivers. U.S.D.A., Economic Research Service, Economic Research Report 189.
Woodall, C. W., P. J. Ince, K. E. Skog, F. X. Aguilar, et al. 2012. An overview of the forest products sector downturn in the United States. Forest Products Journal 61, 8: 595-603.
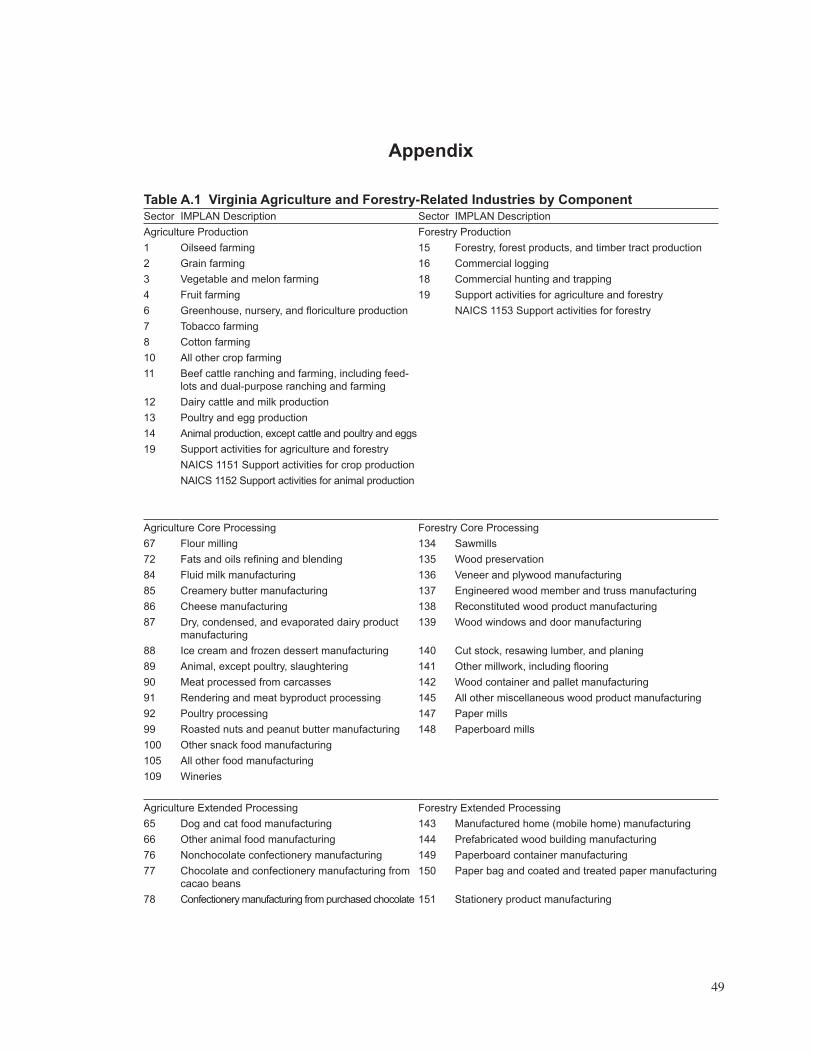
49
Appendix
Table A.1 Virginia Agriculture and Forestry-Related Industries by ComponentSector IMPLAN Description Sector IMPLAN DescriptionAgriculture Production Forestry Production1 Oilseed farming 15 Forestry, forest products, and timber tract production 2 Grain farming 16 Commercial logging 3 Vegetable and melon farming 18 Commercial hunting and trapping 4 Fruit farming 19 Support activities for agriculture and forestry6 Greenhouse, nursery, and floriculture production NAICS 1153 Support activities for forestry7 Tobacco farming 8 Cotton farming10 All other crop farming11 Beef cattle ranching and farming, including feed-
lots and dual-purpose ranching and farming12 Dairy cattle and milk production13 Poultry and egg production14 Animal production, except cattle and poultry and eggs19 Support activities for agriculture and forestry
NAICS 1151 Support activities for crop productionNAICS 1152 Support activities for animal production
Agriculture Core Processing Forestry Core Processing67 Flour milling 134 Sawmills72 Fats and oils refining and blending 135 Wood preservation84 Fluid milk manufacturing 136 Veneer and plywood manufacturing85 Creamery butter manufacturing 137 Engineered wood member and truss manufacturing86 Cheese manufacturing 138 Reconstituted wood product manufacturing87 Dry, condensed, and evaporated dairy product
manufacturing139 Wood windows and door manufacturing
88 Ice cream and frozen dessert manufacturing 140 Cut stock, resawing lumber, and planing89 Animal, except poultry, slaughtering 141 Other millwork, including flooring90 Meat processed from carcasses 142 Wood container and pallet manufacturing 91 Rendering and meat byproduct processing 145 All other miscellaneous wood product manufacturing92 Poultry processing 147 Paper mills99 Roasted nuts and peanut butter manufacturing 148 Paperboard mills100 Other snack food manufacturing105 All other food manufacturing109 Wineries
Agriculture Extended Processing Forestry Extended Processing65 Dog and cat food manufacturing 143 Manufactured home (mobile home) manufacturing66 Other animal food manufacturing 144 Prefabricated wood building manufacturing 76 Nonchocolate confectionery manufacturing 149 Paperboard container manufacturing77 Chocolate and confectionery manufacturing from
cacao beans150 Paper bag and coated and treated paper manufacturing
78 Confectionery manufacturing from purchased chocolate 151 Stationery product manufacturing
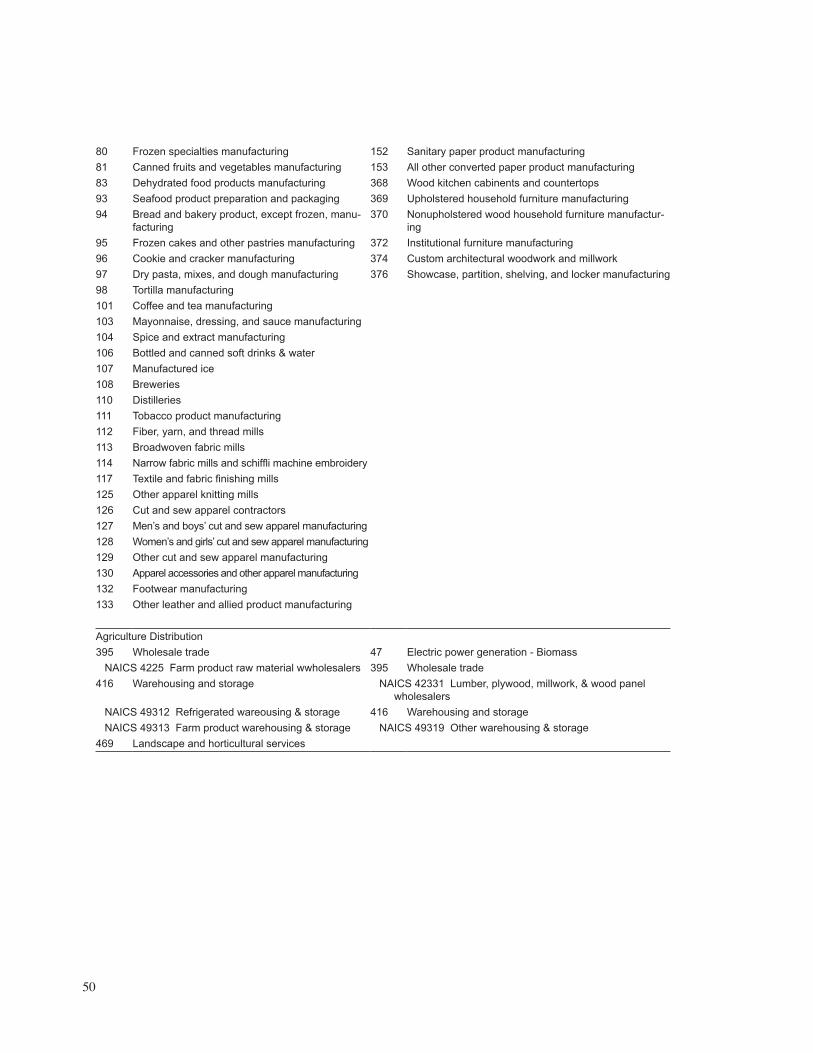
50
80 Frozen specialties manufacturing 152 Sanitary paper product manufacturing81 Canned fruits and vegetables manufacturing 153 All other converted paper product manufacturing83 Dehydrated food products manufacturing 368 Wood kitchen cabinents and countertops93 Seafood product preparation and packaging 369 Upholstered household furniture manufacturing94 Bread and bakery product, except frozen, manu-
facturing370 Nonupholstered wood household furniture manufactur-
ing95 Frozen cakes and other pastries manufacturing 372 Institutional furniture manufacturing96 Cookie and cracker manufacturing 374 Custom architectural woodwork and millwork97 Dry pasta, mixes, and dough manufacturing 376 Showcase, partition, shelving, and locker manufacturing98 Tortilla manufacturing101 Coffee and tea manufacturing103 Mayonnaise, dressing, and sauce manufacturing104 Spice and extract manufacturing106 Bottled and canned soft drinks & water107 Manufactured ice108 Breweries110 Distilleries111 Tobacco product manufacturing112 Fiber, yarn, and thread mills113 Broadwoven fabric mills114 Narrow fabric mills and schiffli machine embroidery117 Textile and fabric finishing mills125 Other apparel knitting mills126 Cut and sew apparel contractors 127 Men’s and boys’ cut and sew apparel manufacturing 128 Women’s and girls’ cut and sew apparel manufacturing129 Other cut and sew apparel manufacturing 130 Apparel accessories and other apparel manufacturing132 Footwear manufacturing 133 Other leather and allied product manufacturing
Agriculture Distribution395 Wholesale trade 47 Electric power generation - Biomass NAICS 4225 Farm product raw material wwholesalers 395 Wholesale trade416 Warehousing and storage NAICS 42331 Lumber, plywood, millwork, & wood panel
wholesalers NAICS 49312 Refrigerated wareousing & storage 416 Warehousing and storage NAICS 49313 Farm product warehousing & storage NAICS 49319 Other warehousing & storage469 Landscape and horticultural services
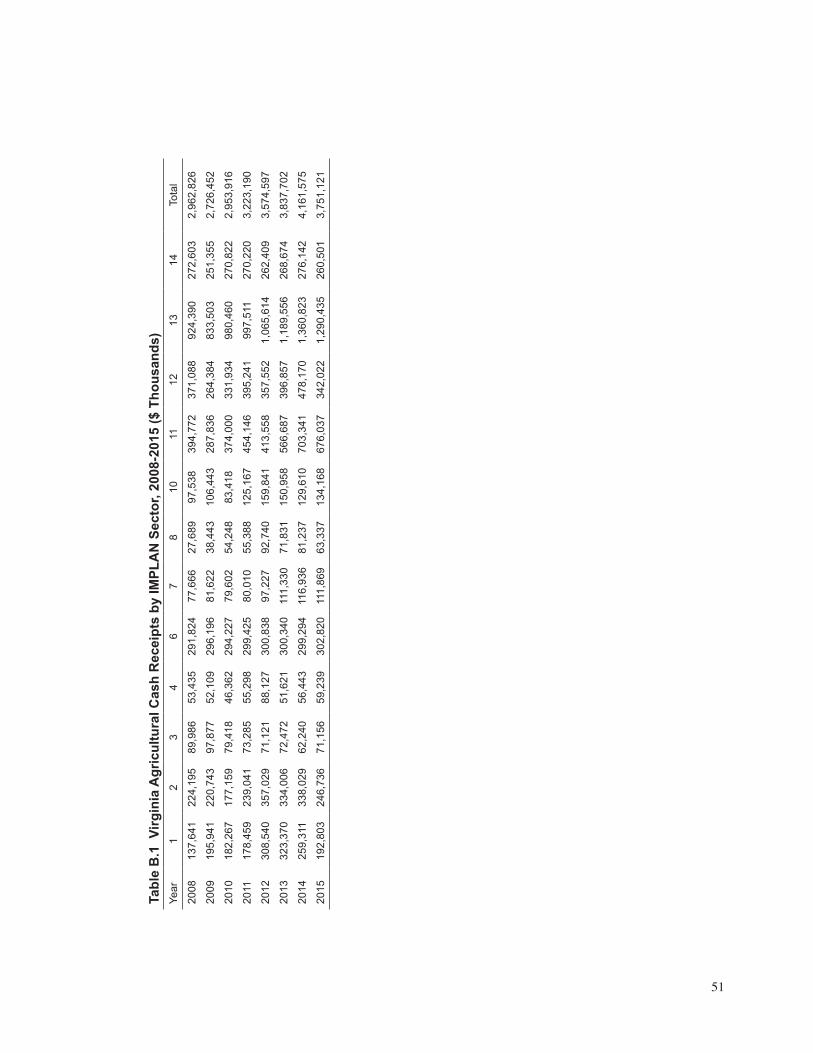
51
Tabl
e B
.1 V
irgin
ia A
gric
ultu
ral C
ash
Rec
eipt
s by
IMPL
AN
Sec
tor,
2008
-201
5 ($
Tho
usan
ds)
Year
12
34
67
810
1112
1314
Tota
l
2008
137,
641
224,
195
89,9
8653
,435
291,
824
77,6
6627
,689
97,5
3839
4,77
237
1,08
892
4,39
027
2,60
32,
962,
826
2009
195,
941
220,
743
97,8
7752
,109
296,
196
81,6
2238
,443
106,
443
287,
836
264,
384
833,
503
251,
355
2,72
6,45
2
2010
182,
267
177,
159
79,4
1846
,362
294,
227
79,6
0254
,248
83,4
1837
4,00
033
1,93
498
0,46
027
0,82
22,
953,
916
2011
178,
459
239,
041
73,2
8555
,298
299,
425
80,0
1055
,388
125,
167
454,
146
395,
241
997,
511
270,
220
3,22
3,19
0
2012
308,
540
357,
029
71,1
2188
,127
300,
838
97,2
2792
,740
159,
841
413,
558
357,
552
1,06
5,61
426
2,40
93,
574,
597
2013
323,
370
334,
006
72,4
7251
,621
300,
340
111,
330
71,8
3115
0,95
856
6,68
739
6,85
71,
189,
556
268,
674
3,83
7,70
2
2014
259,
311
338,
029
62,2
4056
,443
299,
294
116,
936
81,2
3712
9,61
070
3,34
147
8,17
01,
360,
823
276,
142
4,16
1,57
5
2015
192,
803
246,
736
71,1
5659
,239
302,
820
111,
869
63,3
3713
4,16
867
6,03
734
2,02
21,
290,
435
260,
501
3,75
1,12
1
52
Notes to Tables C.1-C.3. Locality Economic ImpactsTables C.1-C.3 show the output, employment, and value-added impacts of agriculture-related industries, forestry-related industries, and combined agriculture and forestry-related industries for 105 localities within Virginia. These localities were formed by aggregating smaller independent cities into their surrounding coun-ty using a Bureau of Economic Analysis (BEA) classification scheme.
The locality analyses uses data from the same four sources as the statewide analysis to compute direct impacts. Farm and forestry-related employment for manufacturing and distribution industries for each locality was obtained from the Virginia Employment Commission (VEC) Quarterly Census of Employment and Wages (QCEW) for the second quarter of 2015. The employment numbers are then converted to sales/output equiv-alent figures by the model for use in generating economic impacts. For a few sectors where self-employment is important, alternative data sources were used. For forest nurseries, forest products, and timber tracts sector (IMPLAN sector 15), data from Virginia Department of Forestry timber product average tax receipts for fis-cal years 2015 and 2016 by locality were used. For logging (IMPLAN sector 16) and hunting and trapping (IMPLAN sector 18), output and employment estimates were obtained from the Virginia IMPLAN database for each locality. For farming sectors (IMPLAN sectors 1-14), U.S. Department of Agriculture commodity cash receipts data from 2015 were used. In order to make estimates for localities, additional data imputations were needed because 2015 local agricultural cash receipt and government payments data were not available. Therefore, statewide 2015 values for cash receipts for each sector were scaled down to the local level using IMPLAN total industrial output estimates for 2015 by sector for localities.
Economic impacts for each locality were generated using IMPLAN models created for each county. The total economic impact reported sums the direct, indirect, and induced impacts.
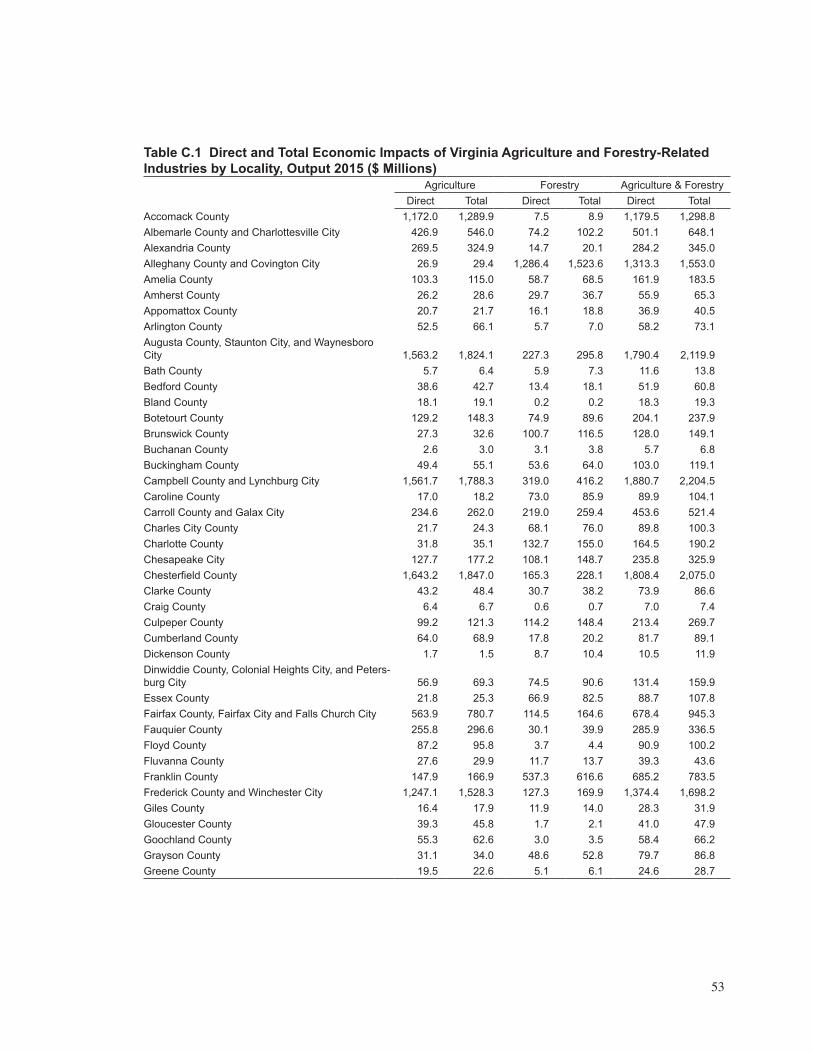
53
Table C.1 Direct and Total Economic Impacts of Virginia Agriculture and Forestry-Related Industries by Locality, Output 2015 ($ Millions)
Agriculture Forestry Agriculture & ForestryDirect Total Direct Total Direct Total
Accomack County 1,172.0 1,289.9 7.5 8.9 1,179.5 1,298.8Albemarle County and Charlottesville City 426.9 546.0 74.2 102.2 501.1 648.1Alexandria County 269.5 324.9 14.7 20.1 284.2 345.0Alleghany County and Covington City 26.9 29.4 1,286.4 1,523.6 1,313.3 1,553.0Amelia County 103.3 115.0 58.7 68.5 161.9 183.5Amherst County 26.2 28.6 29.7 36.7 55.9 65.3Appomattox County 20.7 21.7 16.1 18.8 36.9 40.5Arlington County 52.5 66.1 5.7 7.0 58.2 73.1Augusta County, Staunton City, and Waynesboro City 1,563.2 1,824.1 227.3 295.8 1,790.4 2,119.9Bath County 5.7 6.4 5.9 7.3 11.6 13.8Bedford County 38.6 42.7 13.4 18.1 51.9 60.8Bland County 18.1 19.1 0.2 0.2 18.3 19.3Botetourt County 129.2 148.3 74.9 89.6 204.1 237.9Brunswick County 27.3 32.6 100.7 116.5 128.0 149.1Buchanan County 2.6 3.0 3.1 3.8 5.7 6.8Buckingham County 49.4 55.1 53.6 64.0 103.0 119.1Campbell County and Lynchburg City 1,561.7 1,788.3 319.0 416.2 1,880.7 2,204.5Caroline County 17.0 18.2 73.0 85.9 89.9 104.1Carroll County and Galax City 234.6 262.0 219.0 259.4 453.6 521.4Charles City County 21.7 24.3 68.1 76.0 89.8 100.3Charlotte County 31.8 35.1 132.7 155.0 164.5 190.2Chesapeake City 127.7 177.2 108.1 148.7 235.8 325.9Chesterfield County 1,643.2 1,847.0 165.3 228.1 1,808.4 2,075.0Clarke County 43.2 48.4 30.7 38.2 73.9 86.6Craig County 6.4 6.7 0.6 0.7 7.0 7.4Culpeper County 99.2 121.3 114.2 148.4 213.4 269.7Cumberland County 64.0 68.9 17.8 20.2 81.7 89.1Dickenson County 1.7 1.5 8.7 10.4 10.5 11.9Dinwiddie County, Colonial Heights City, and Peters-burg City 56.9 69.3 74.5 90.6 131.4 159.9Essex County 21.8 25.3 66.9 82.5 88.7 107.8Fairfax County, Fairfax City and Falls Church City 563.9 780.7 114.5 164.6 678.4 945.3Fauquier County 255.8 296.6 30.1 39.9 285.9 336.5Floyd County 87.2 95.8 3.7 4.4 90.9 100.2Fluvanna County 27.6 29.9 11.7 13.7 39.3 43.6Franklin County 147.9 166.9 537.3 616.6 685.2 783.5Frederick County and Winchester City 1,247.1 1,528.3 127.3 169.9 1,374.4 1,698.2Giles County 16.4 17.9 11.9 14.0 28.3 31.9Gloucester County 39.3 45.8 1.7 2.1 41.0 47.9Goochland County 55.3 62.6 3.0 3.5 58.4 66.2Grayson County 31.1 34.0 48.6 52.8 79.7 86.8Greene County 19.5 22.6 5.1 6.1 24.6 28.7
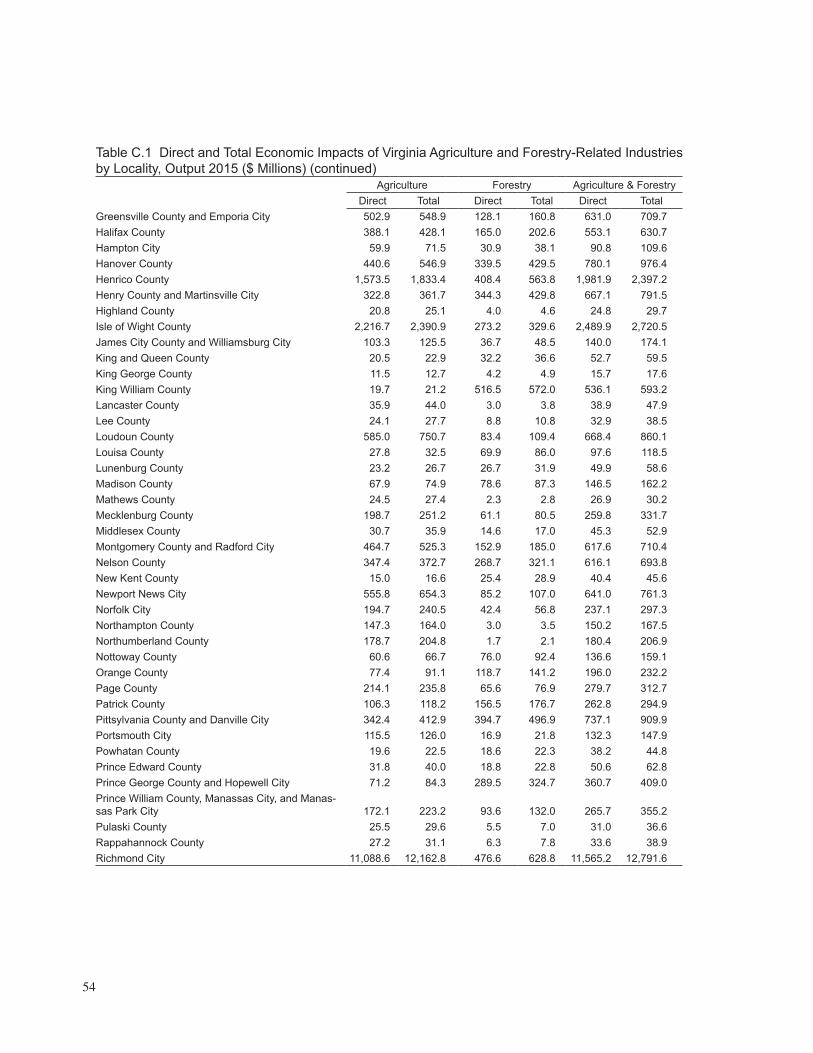
54
Table C.1 Direct and Total Economic Impacts of Virginia Agriculture and Forestry-Related Industries by Locality, Output 2015 ($ Millions) (continued)
Agriculture Forestry Agriculture & ForestryDirect Total Direct Total Direct Total
Greensville County and Emporia City 502.9 548.9 128.1 160.8 631.0 709.7Halifax County 388.1 428.1 165.0 202.6 553.1 630.7Hampton City 59.9 71.5 30.9 38.1 90.8 109.6Hanover County 440.6 546.9 339.5 429.5 780.1 976.4Henrico County 1,573.5 1,833.4 408.4 563.8 1,981.9 2,397.2Henry County and Martinsville City 322.8 361.7 344.3 429.8 667.1 791.5Highland County 20.8 25.1 4.0 4.6 24.8 29.7Isle of Wight County 2,216.7 2,390.9 273.2 329.6 2,489.9 2,720.5James City County and Williamsburg City 103.3 125.5 36.7 48.5 140.0 174.1King and Queen County 20.5 22.9 32.2 36.6 52.7 59.5King George County 11.5 12.7 4.2 4.9 15.7 17.6King William County 19.7 21.2 516.5 572.0 536.1 593.2Lancaster County 35.9 44.0 3.0 3.8 38.9 47.9Lee County 24.1 27.7 8.8 10.8 32.9 38.5Loudoun County 585.0 750.7 83.4 109.4 668.4 860.1Louisa County 27.8 32.5 69.9 86.0 97.6 118.5Lunenburg County 23.2 26.7 26.7 31.9 49.9 58.6Madison County 67.9 74.9 78.6 87.3 146.5 162.2Mathews County 24.5 27.4 2.3 2.8 26.9 30.2Mecklenburg County 198.7 251.2 61.1 80.5 259.8 331.7Middlesex County 30.7 35.9 14.6 17.0 45.3 52.9Montgomery County and Radford City 464.7 525.3 152.9 185.0 617.6 710.4Nelson County 347.4 372.7 268.7 321.1 616.1 693.8New Kent County 15.0 16.6 25.4 28.9 40.4 45.6Newport News City 555.8 654.3 85.2 107.0 641.0 761.3Norfolk City 194.7 240.5 42.4 56.8 237.1 297.3Northampton County 147.3 164.0 3.0 3.5 150.2 167.5Northumberland County 178.7 204.8 1.7 2.1 180.4 206.9Nottoway County 60.6 66.7 76.0 92.4 136.6 159.1Orange County 77.4 91.1 118.7 141.2 196.0 232.2Page County 214.1 235.8 65.6 76.9 279.7 312.7Patrick County 106.3 118.2 156.5 176.7 262.8 294.9Pittsylvania County and Danville City 342.4 412.9 394.7 496.9 737.1 909.9Portsmouth City 115.5 126.0 16.9 21.8 132.3 147.9Powhatan County 19.6 22.5 18.6 22.3 38.2 44.8Prince Edward County 31.8 40.0 18.8 22.8 50.6 62.8Prince George County and Hopewell City 71.2 84.3 289.5 324.7 360.7 409.0Prince William County, Manassas City, and Manas-sas Park City 172.1 223.2 93.6 132.0 265.7 355.2Pulaski County 25.5 29.6 5.5 7.0 31.0 36.6Rappahannock County 27.2 31.1 6.3 7.8 33.6 38.9Richmond City 11,088.6 12,162.8 476.6 628.8 11,565.2 12,791.6
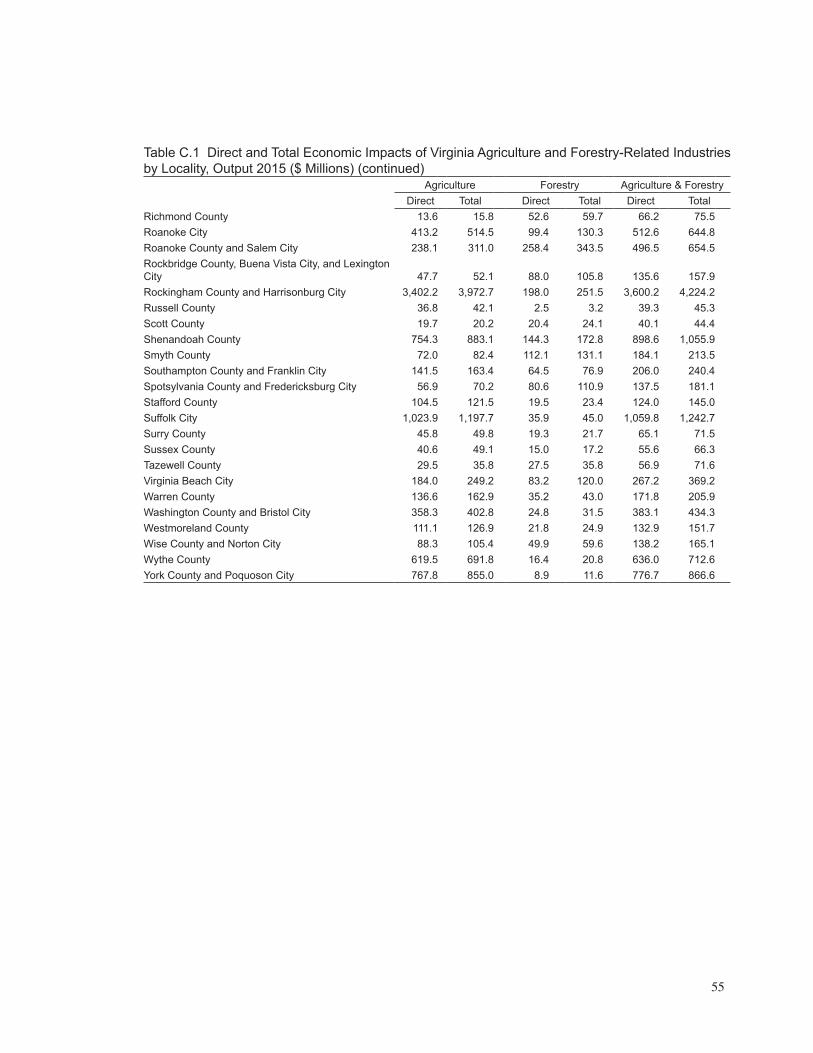
55
Table C.1 Direct and Total Economic Impacts of Virginia Agriculture and Forestry-Related Industries by Locality, Output 2015 ($ Millions) (continued)
Agriculture Forestry Agriculture & ForestryDirect Total Direct Total Direct Total
Richmond County 13.6 15.8 52.6 59.7 66.2 75.5Roanoke City 413.2 514.5 99.4 130.3 512.6 644.8Roanoke County and Salem City 238.1 311.0 258.4 343.5 496.5 654.5Rockbridge County, Buena Vista City, and Lexington City 47.7 52.1 88.0 105.8 135.6 157.9Rockingham County and Harrisonburg City 3,402.2 3,972.7 198.0 251.5 3,600.2 4,224.2Russell County 36.8 42.1 2.5 3.2 39.3 45.3Scott County 19.7 20.2 20.4 24.1 40.1 44.4Shenandoah County 754.3 883.1 144.3 172.8 898.6 1,055.9Smyth County 72.0 82.4 112.1 131.1 184.1 213.5Southampton County and Franklin City 141.5 163.4 64.5 76.9 206.0 240.4Spotsylvania County and Fredericksburg City 56.9 70.2 80.6 110.9 137.5 181.1Stafford County 104.5 121.5 19.5 23.4 124.0 145.0Suffolk City 1,023.9 1,197.7 35.9 45.0 1,059.8 1,242.7Surry County 45.8 49.8 19.3 21.7 65.1 71.5Sussex County 40.6 49.1 15.0 17.2 55.6 66.3Tazewell County 29.5 35.8 27.5 35.8 56.9 71.6Virginia Beach City 184.0 249.2 83.2 120.0 267.2 369.2Warren County 136.6 162.9 35.2 43.0 171.8 205.9Washington County and Bristol City 358.3 402.8 24.8 31.5 383.1 434.3Westmoreland County 111.1 126.9 21.8 24.9 132.9 151.7Wise County and Norton City 88.3 105.4 49.9 59.6 138.2 165.1Wythe County 619.5 691.8 16.4 20.8 636.0 712.6York County and Poquoson City 767.8 855.0 8.9 11.6 776.7 866.6
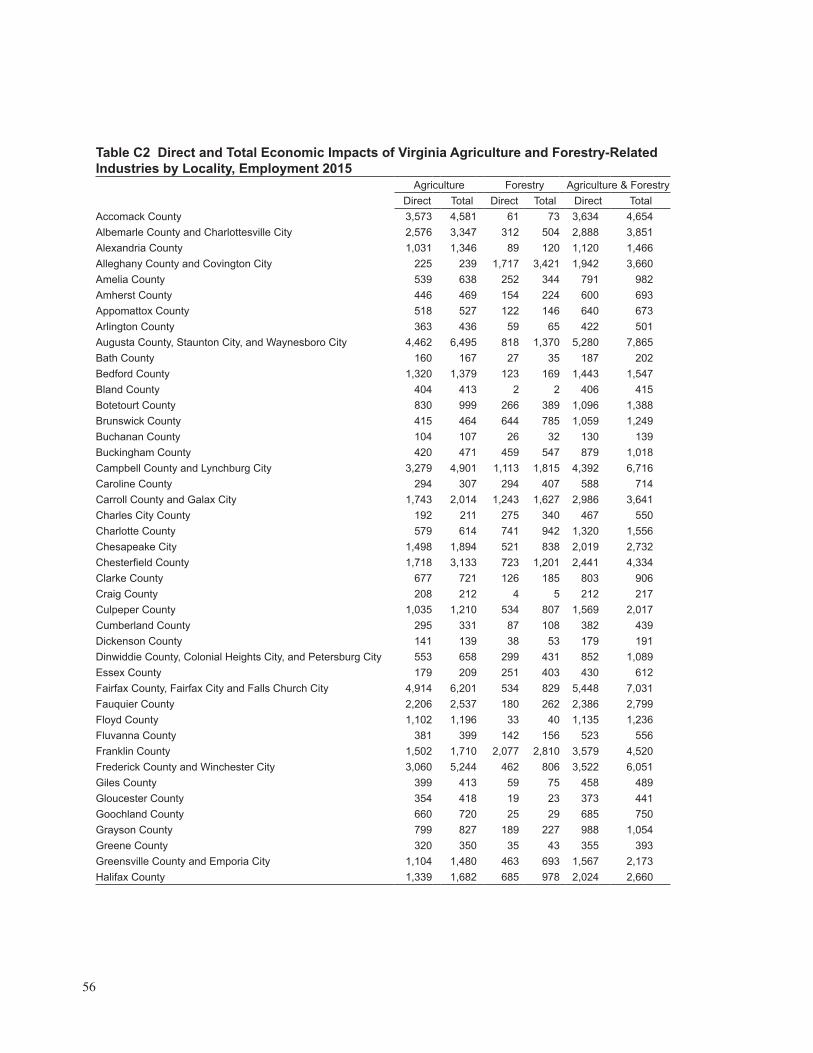
56
Table C2 Direct and Total Economic Impacts of Virginia Agriculture and Forestry-Related Industries by Locality, Employment 2015
Agriculture Forestry Agriculture & ForestryDirect Total Direct Total Direct Total
Accomack County 3,573 4,581 61 73 3,634 4,654Albemarle County and Charlottesville City 2,576 3,347 312 504 2,888 3,851Alexandria County 1,031 1,346 89 120 1,120 1,466Alleghany County and Covington City 225 239 1,717 3,421 1,942 3,660Amelia County 539 638 252 344 791 982Amherst County 446 469 154 224 600 693Appomattox County 518 527 122 146 640 673Arlington County 363 436 59 65 422 501Augusta County, Staunton City, and Waynesboro City 4,462 6,495 818 1,370 5,280 7,865Bath County 160 167 27 35 187 202Bedford County 1,320 1,379 123 169 1,443 1,547Bland County 404 413 2 2 406 415Botetourt County 830 999 266 389 1,096 1,388Brunswick County 415 464 644 785 1,059 1,249Buchanan County 104 107 26 32 130 139Buckingham County 420 471 459 547 879 1,018Campbell County and Lynchburg City 3,279 4,901 1,113 1,815 4,392 6,716Caroline County 294 307 294 407 588 714Carroll County and Galax City 1,743 2,014 1,243 1,627 2,986 3,641Charles City County 192 211 275 340 467 550Charlotte County 579 614 741 942 1,320 1,556Chesapeake City 1,498 1,894 521 838 2,019 2,732Chesterfield County 1,718 3,133 723 1,201 2,441 4,334Clarke County 677 721 126 185 803 906Craig County 208 212 4 5 212 217Culpeper County 1,035 1,210 534 807 1,569 2,017Cumberland County 295 331 87 108 382 439Dickenson County 141 139 38 53 179 191Dinwiddie County, Colonial Heights City, and Petersburg City 553 658 299 431 852 1,089Essex County 179 209 251 403 430 612Fairfax County, Fairfax City and Falls Church City 4,914 6,201 534 829 5,448 7,031Fauquier County 2,206 2,537 180 262 2,386 2,799Floyd County 1,102 1,196 33 40 1,135 1,236Fluvanna County 381 399 142 156 523 556Franklin County 1,502 1,710 2,077 2,810 3,579 4,520Frederick County and Winchester City 3,060 5,244 462 806 3,522 6,051Giles County 399 413 59 75 458 489Gloucester County 354 418 19 23 373 441Goochland County 660 720 25 29 685 750Grayson County 799 827 189 227 988 1,054Greene County 320 350 35 43 355 393Greensville County and Emporia City 1,104 1,480 463 693 1,567 2,173Halifax County 1,339 1,682 685 978 2,024 2,660
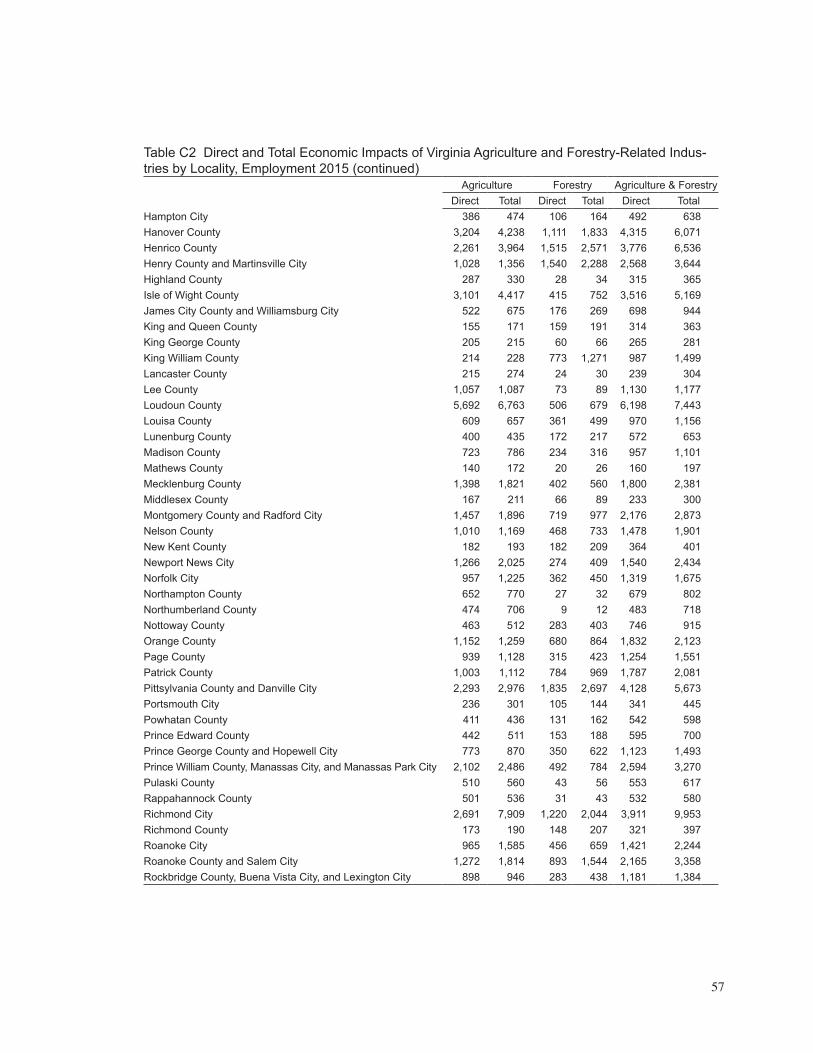
57
Table C2 Direct and Total Economic Impacts of Virginia Agriculture and Forestry-Related Indus-tries by Locality, Employment 2015 (continued)
Agriculture Forestry Agriculture & ForestryDirect Total Direct Total Direct Total
Hampton City 386 474 106 164 492 638Hanover County 3,204 4,238 1,111 1,833 4,315 6,071Henrico County 2,261 3,964 1,515 2,571 3,776 6,536Henry County and Martinsville City 1,028 1,356 1,540 2,288 2,568 3,644Highland County 287 330 28 34 315 365Isle of Wight County 3,101 4,417 415 752 3,516 5,169James City County and Williamsburg City 522 675 176 269 698 944King and Queen County 155 171 159 191 314 363King George County 205 215 60 66 265 281King William County 214 228 773 1,271 987 1,499Lancaster County 215 274 24 30 239 304Lee County 1,057 1,087 73 89 1,130 1,177Loudoun County 5,692 6,763 506 679 6,198 7,443Louisa County 609 657 361 499 970 1,156Lunenburg County 400 435 172 217 572 653Madison County 723 786 234 316 957 1,101Mathews County 140 172 20 26 160 197Mecklenburg County 1,398 1,821 402 560 1,800 2,381Middlesex County 167 211 66 89 233 300Montgomery County and Radford City 1,457 1,896 719 977 2,176 2,873Nelson County 1,010 1,169 468 733 1,478 1,901New Kent County 182 193 182 209 364 401Newport News City 1,266 2,025 274 409 1,540 2,434Norfolk City 957 1,225 362 450 1,319 1,675Northampton County 652 770 27 32 679 802Northumberland County 474 706 9 12 483 718Nottoway County 463 512 283 403 746 915Orange County 1,152 1,259 680 864 1,832 2,123Page County 939 1,128 315 423 1,254 1,551Patrick County 1,003 1,112 784 969 1,787 2,081Pittsylvania County and Danville City 2,293 2,976 1,835 2,697 4,128 5,673Portsmouth City 236 301 105 144 341 445Powhatan County 411 436 131 162 542 598Prince Edward County 442 511 153 188 595 700Prince George County and Hopewell City 773 870 350 622 1,123 1,493Prince William County, Manassas City, and Manassas Park City 2,102 2,486 492 784 2,594 3,270Pulaski County 510 560 43 56 553 617Rappahannock County 501 536 31 43 532 580Richmond City 2,691 7,909 1,220 2,044 3,911 9,953Richmond County 173 190 148 207 321 397Roanoke City 965 1,585 456 659 1,421 2,244Roanoke County and Salem City 1,272 1,814 893 1,544 2,165 3,358Rockbridge County, Buena Vista City, and Lexington City 898 946 283 438 1,181 1,384
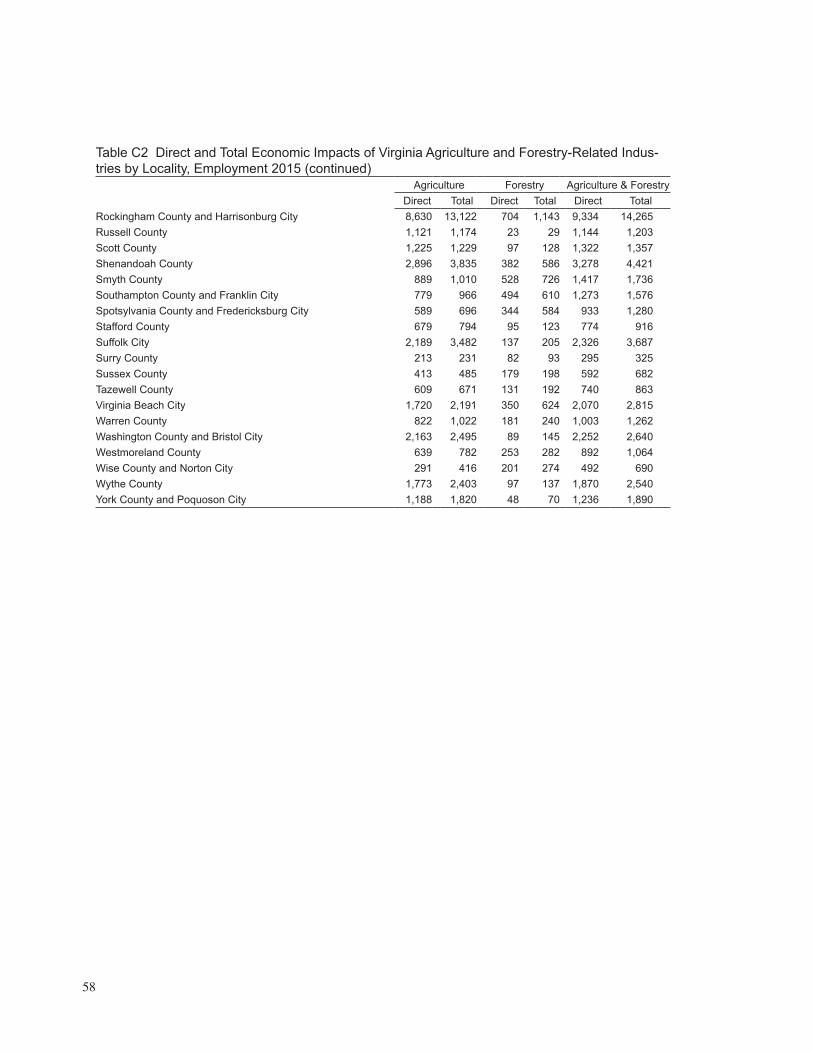
58
Table C2 Direct and Total Economic Impacts of Virginia Agriculture and Forestry-Related Indus-tries by Locality, Employment 2015 (continued)
Agriculture Forestry Agriculture & ForestryDirect Total Direct Total Direct Total
Rockingham County and Harrisonburg City 8,630 13,122 704 1,143 9,334 14,265Russell County 1,121 1,174 23 29 1,144 1,203Scott County 1,225 1,229 97 128 1,322 1,357Shenandoah County 2,896 3,835 382 586 3,278 4,421Smyth County 889 1,010 528 726 1,417 1,736Southampton County and Franklin City 779 966 494 610 1,273 1,576Spotsylvania County and Fredericksburg City 589 696 344 584 933 1,280Stafford County 679 794 95 123 774 916Suffolk City 2,189 3,482 137 205 2,326 3,687Surry County 213 231 82 93 295 325Sussex County 413 485 179 198 592 682Tazewell County 609 671 131 192 740 863Virginia Beach City 1,720 2,191 350 624 2,070 2,815Warren County 822 1,022 181 240 1,003 1,262Washington County and Bristol City 2,163 2,495 89 145 2,252 2,640Westmoreland County 639 782 253 282 892 1,064Wise County and Norton City 291 416 201 274 492 690Wythe County 1,773 2,403 97 137 1,870 2,540York County and Poquoson City 1,188 1,820 48 70 1,236 1,890
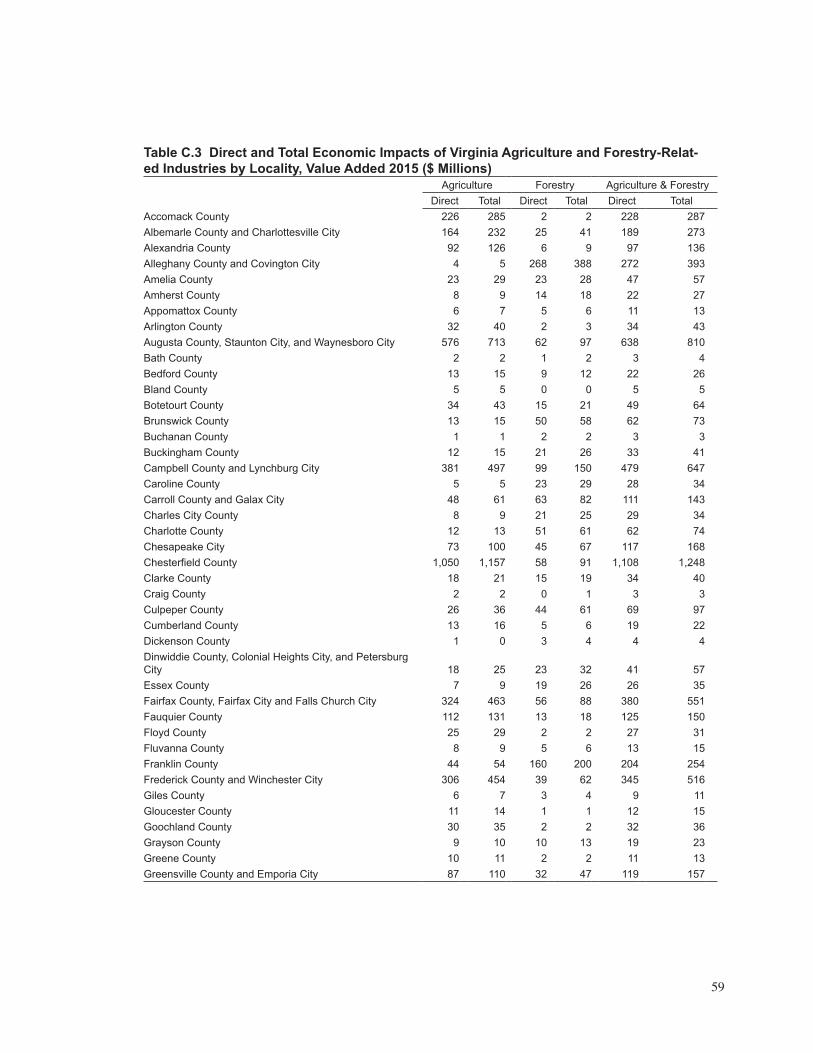
59
Table C.3 Direct and Total Economic Impacts of Virginia Agriculture and Forestry-Relat-ed Industries by Locality, Value Added 2015 ($ Millions)
Agriculture Forestry Agriculture & ForestryDirect Total Direct Total Direct Total
Accomack County 226 285 2 2 228 287Albemarle County and Charlottesville City 164 232 25 41 189 273Alexandria County 92 126 6 9 97 136Alleghany County and Covington City 4 5 268 388 272 393Amelia County 23 29 23 28 47 57Amherst County 8 9 14 18 22 27Appomattox County 6 7 5 6 11 13Arlington County 32 40 2 3 34 43Augusta County, Staunton City, and Waynesboro City 576 713 62 97 638 810Bath County 2 2 1 2 3 4Bedford County 13 15 9 12 22 26Bland County 5 5 0 0 5 5Botetourt County 34 43 15 21 49 64Brunswick County 13 15 50 58 62 73Buchanan County 1 1 2 2 3 3Buckingham County 12 15 21 26 33 41Campbell County and Lynchburg City 381 497 99 150 479 647Caroline County 5 5 23 29 28 34Carroll County and Galax City 48 61 63 82 111 143Charles City County 8 9 21 25 29 34Charlotte County 12 13 51 61 62 74Chesapeake City 73 100 45 67 117 168Chesterfield County 1,050 1,157 58 91 1,108 1,248Clarke County 18 21 15 19 34 40Craig County 2 2 0 1 3 3Culpeper County 26 36 44 61 69 97Cumberland County 13 16 5 6 19 22Dickenson County 1 0 3 4 4 4Dinwiddie County, Colonial Heights City, and Petersburg City 18 25 23 32 41 57Essex County 7 9 19 26 26 35Fairfax County, Fairfax City and Falls Church City 324 463 56 88 380 551Fauquier County 112 131 13 18 125 150Floyd County 25 29 2 2 27 31Fluvanna County 8 9 5 6 13 15Franklin County 44 54 160 200 204 254Frederick County and Winchester City 306 454 39 62 345 516Giles County 6 7 3 4 9 11Gloucester County 11 14 1 1 12 15Goochland County 30 35 2 2 32 36Grayson County 9 10 10 13 19 23Greene County 10 11 2 2 11 13Greensville County and Emporia City 87 110 32 47 119 157
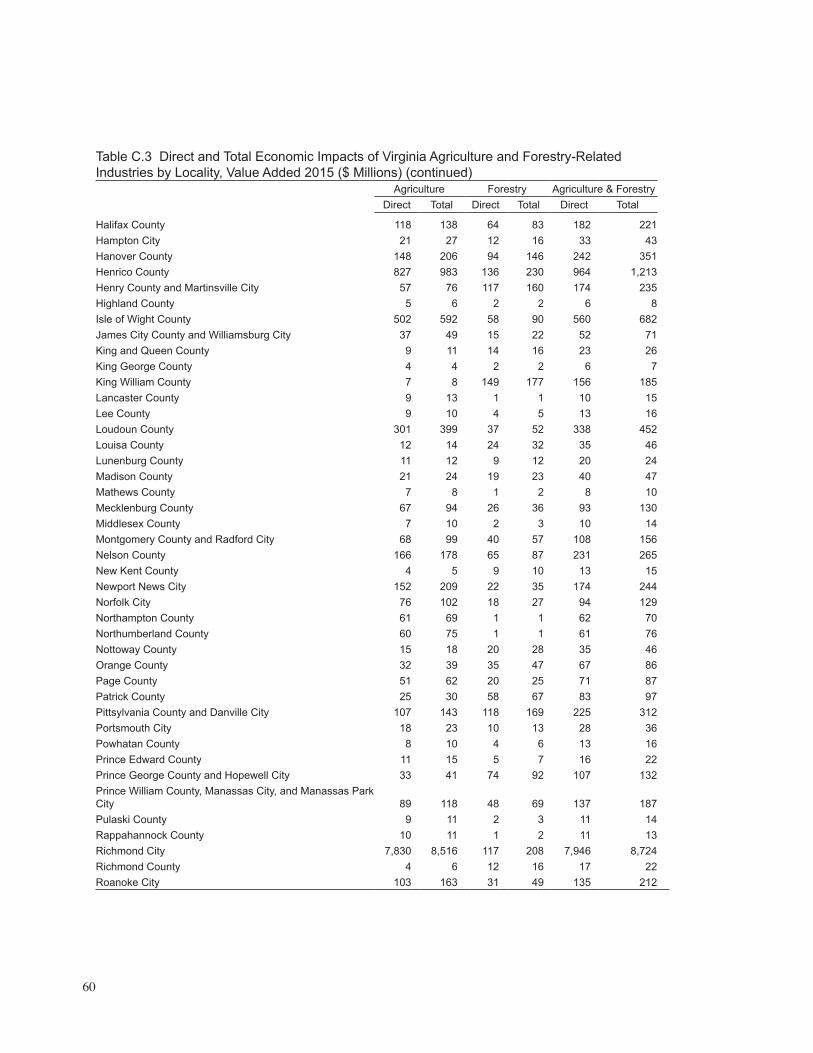
60
Table C.3 Direct and Total Economic Impacts of Virginia Agriculture and Forestry-Related Industries by Locality, Value Added 2015 ($ Millions) (continued)
Agriculture Forestry Agriculture & ForestryDirect Total Direct Total Direct Total
Halifax County 118 138 64 83 182 221Hampton City 21 27 12 16 33 43Hanover County 148 206 94 146 242 351Henrico County 827 983 136 230 964 1,213Henry County and Martinsville City 57 76 117 160 174 235Highland County 5 6 2 2 6 8Isle of Wight County 502 592 58 90 560 682James City County and Williamsburg City 37 49 15 22 52 71King and Queen County 9 11 14 16 23 26King George County 4 4 2 2 6 7King William County 7 8 149 177 156 185Lancaster County 9 13 1 1 10 15Lee County 9 10 4 5 13 16Loudoun County 301 399 37 52 338 452Louisa County 12 14 24 32 35 46Lunenburg County 11 12 9 12 20 24Madison County 21 24 19 23 40 47Mathews County 7 8 1 2 8 10Mecklenburg County 67 94 26 36 93 130Middlesex County 7 10 2 3 10 14Montgomery County and Radford City 68 99 40 57 108 156Nelson County 166 178 65 87 231 265New Kent County 4 5 9 10 13 15Newport News City 152 209 22 35 174 244Norfolk City 76 102 18 27 94 129Northampton County 61 69 1 1 62 70Northumberland County 60 75 1 1 61 76Nottoway County 15 18 20 28 35 46Orange County 32 39 35 47 67 86Page County 51 62 20 25 71 87Patrick County 25 30 58 67 83 97Pittsylvania County and Danville City 107 143 118 169 225 312Portsmouth City 18 23 10 13 28 36Powhatan County 8 10 4 6 13 16Prince Edward County 11 15 5 7 16 22Prince George County and Hopewell City 33 41 74 92 107 132Prince William County, Manassas City, and Manassas Park City 89 118 48 69 137 187Pulaski County 9 11 2 3 11 14Rappahannock County 10 11 1 2 11 13Richmond City 7,830 8,516 117 208 7,946 8,724Richmond County 4 6 12 16 17 22Roanoke City 103 163 31 49 135 212
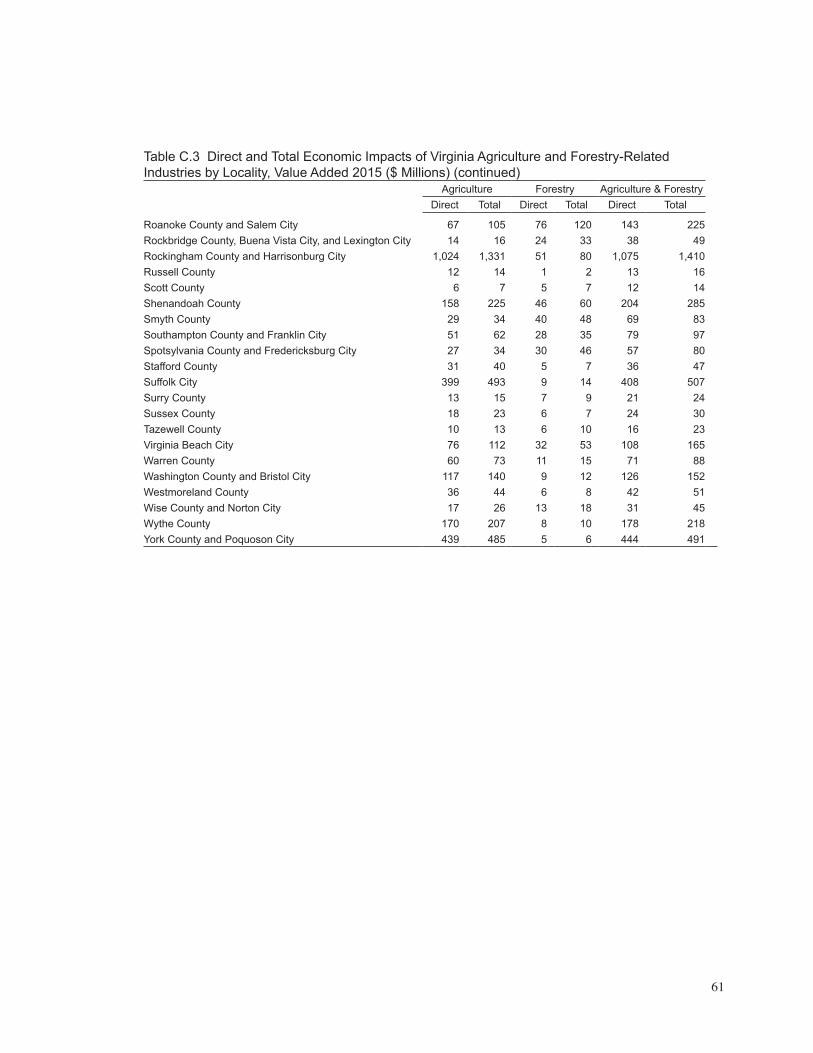
61
Table C.3 Direct and Total Economic Impacts of Virginia Agriculture and Forestry-Related Industries by Locality, Value Added 2015 ($ Millions) (continued)
Agriculture Forestry Agriculture & ForestryDirect Total Direct Total Direct Total
Roanoke County and Salem City 67 105 76 120 143 225Rockbridge County, Buena Vista City, and Lexington City 14 16 24 33 38 49Rockingham County and Harrisonburg City 1,024 1,331 51 80 1,075 1,410Russell County 12 14 1 2 13 16Scott County 6 7 5 7 12 14Shenandoah County 158 225 46 60 204 285Smyth County 29 34 40 48 69 83Southampton County and Franklin City 51 62 28 35 79 97Spotsylvania County and Fredericksburg City 27 34 30 46 57 80Stafford County 31 40 5 7 36 47Suffolk City 399 493 9 14 408 507Surry County 13 15 7 9 21 24Sussex County 18 23 6 7 24 30Tazewell County 10 13 6 10 16 23Virginia Beach City 76 112 32 53 108 165Warren County 60 73 11 15 71 88Washington County and Bristol City 117 140 9 12 126 152Westmoreland County 36 44 6 8 42 51Wise County and Norton City 17 26 13 18 31 45Wythe County 170 207 8 10 178 218York County and Poquoson City 439 485 5 6 444 491