the economic impact of the louis armstrong … · the economic impact of the louis armstrong new...
TRANSCRIPT
THE ECONOMIC IMPACT OF THE
LOUIS ARMSTRONG NEW ORLEANS
INTERNATIONAL AIRPORT
Timothy P. Ryan, Ph.D.
May 2014
Economic Impact of LANOIA May 2014 Timothy P. Ryan i
The Economic Impact
EXECUTIVE SUMMARY • The Louis Armstrong New Orleans International Airport is a very important part of the New Orleans
area economy; this is especially true for the City of Kenner where the Airport is located. The airport serves as the gateway to the New Orleans tourism industry, one of the mainstays of the local economy, and is entering an exciting new period in its history with the development of a new terminal building. The Airport also serves as a means for local and visiting business people to travel to and from the area to conduct business.
• Most importantly, however, the economic activities directly related to the Airport generate hundreds of millions of dollars of income for people in the area and thousands of jobs.
• With the development of a new terminal building, the Airport will enter the modern, post-911 world of
air travel. The new facility will provide several travel and economic benefits. Those benefits include:
1. With a smaller footprint, the new facility will cost significantly less to operate, thereby reducing costs to the airlines.
2. With passengers able to access the concessionaries for all concourses behind security, revenues generated at food and retail outlets will increase to match revenue levels observed at other similar airports, thereby reducing the costs to the airlines even further.
3. The lower costs to the airlines will attract additional flights into and out of the Airport, including more transfer flights.
4. The new terminal will free up land on the south side of the Airport property to attract additional air cargo and fixed base operators, which will positively impact the local economy.
• The spending impact of the Airport consists of the following components:
1. The spending of the New Orleans Aviation Board on Airport operations. 2. The spending of the airlines. 3. The spending of the airfreight companies. 4. The spending of the parking operations. 5. The spending of general aviation and fixed base operators (those services rendered to private
aircraft). 6. The spending of government services provided at the Airport (such as TSA and FAA). 7. The spending of the concessionaires and other businesses that rely directly on the operations of
the Airport. 8. The spending of taxi drivers and other transportation services. 9. The spending of "Airport" hotels and motels. 10. The spending generated by the construction firms that are engaged in various Airport
construction projects. 11. And finally, the spending of visitors to the New Orleans area who use air travel as their primary
means of transportation into the area. • In 2013, the activities of the Airport produced $473.10 million in direct spending in the New Orleans
area economy before considering the impact of the Airport on tourism. With the tourism impact
Economic Impact of LANOIA May 2014 Timothy P. Ryan ii
The Economic Impact
added, the Airport created $3,425.04 million (or $3.45 billion) in direct spending in the local economy.
• There is every reason to believe that this spending will increase substantially in the future because of the increased construction mentioned earlier, increased travel due to a rebounding of the national and local economy, growth of the local tourism industry, expanded business due to the expansion of the air cargo facilities, and increased air service and air cargo activities for New Orleans. But, even without all of this, the Armstrong International Airport contributes over $5,263.79 million (or $5.26 billion) annually to the New Orleans area economy, made up of $3.45 billion in direct spending and $2.02 billion in secondary spending. The Airport is truly a crucial part of the local economic structure.
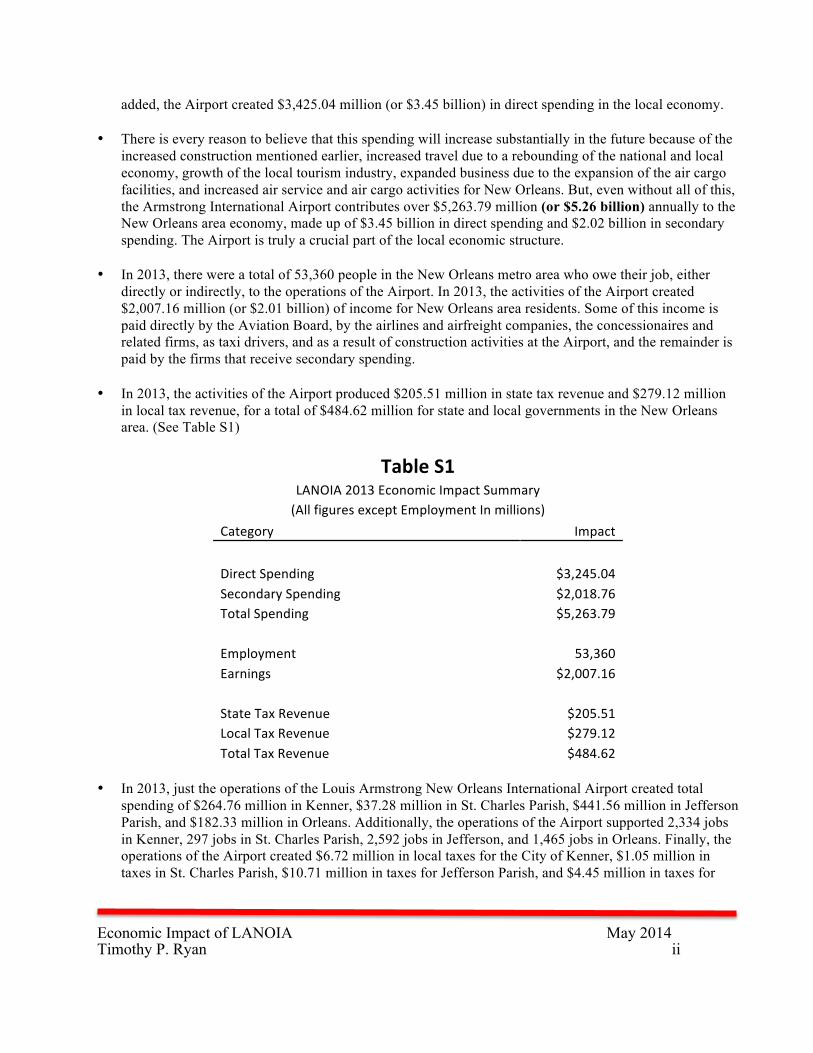
• In 2013, there were a total of 53,360 people in the New Orleans metro area who owe their job, either
directly or indirectly, to the operations of the Airport. In 2013, the activities of the Airport created $2,007.16 million (or $2.01 billion) of income for New Orleans area residents. Some of this income is paid directly by the Aviation Board, by the airlines and airfreight companies, the concessionaires and related firms, as taxi drivers, and as a result of construction activities at the Airport, and the remainder is paid by the firms that receive secondary spending.
• In 2013, the activities of the Airport produced $205.51 million in state tax revenue and $279.12 million
in local tax revenue, for a total of $484.62 million for state and local governments in the New Orleans area. (See Table S1)
Table S1 LANOIA 2013 Economic Impact Summary (All figures except Employment In millions)
Category Impact
Direct Spending $3,245.04 Secondary Spending $2,018.76 Total Spending $5,263.79
Employment 53,360 Earnings $2,007.16
State Tax Revenue $205.51 Local Tax Revenue $279.12 Total Tax Revenue $484.62
• In 2013, just the operations of the Louis Armstrong New Orleans International Airport created total
spending of $264.76 million in Kenner, $37.28 million in St. Charles Parish, $441.56 million in Jefferson Parish, and $182.33 million in Orleans. Additionally, the operations of the Airport supported 2,334 jobs in Kenner, 297 jobs in St. Charles Parish, 2,592 jobs in Jefferson, and 1,465 jobs in Orleans. Finally, the operations of the Airport created $6.72 million in local taxes for the City of Kenner, $1.05 million in taxes in St. Charles Parish, $10.71 million in taxes for Jefferson Parish, and $4.45 million in taxes for
Economic Impact of LANOIA May 2014 Timothy P. Ryan iii
The Economic Impact
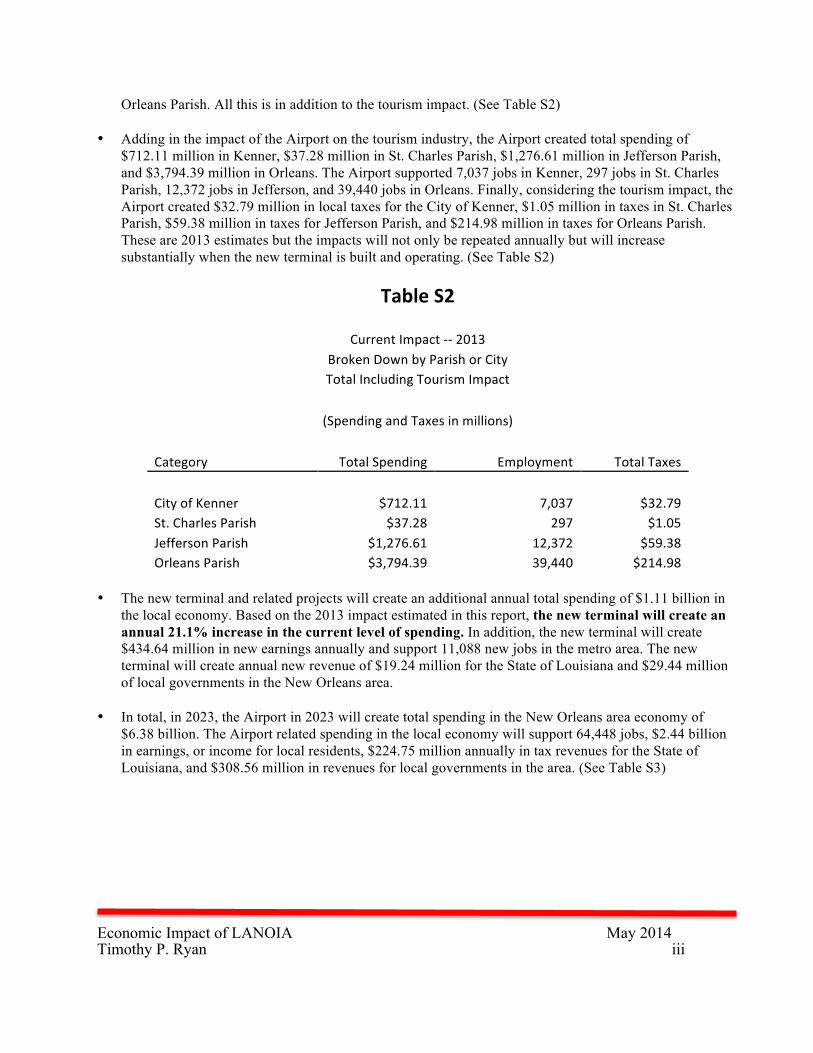
Orleans Parish. All this is in addition to the tourism impact. (See Table S2) • Adding in the impact of the Airport on the tourism industry, the Airport created total spending of
$712.11 million in Kenner, $37.28 million in St. Charles Parish, $1,276.61 million in Jefferson Parish, and $3,794.39 million in Orleans. The Airport supported 7,037 jobs in Kenner, 297 jobs in St. Charles Parish, 12,372 jobs in Jefferson, and 39,440 jobs in Orleans. Finally, considering the tourism impact, the Airport created $32.79 million in local taxes for the City of Kenner, $1.05 million in taxes in St. Charles Parish, $59.38 million in taxes for Jefferson Parish, and $214.98 million in taxes for Orleans Parish. These are 2013 estimates but the impacts will not only be repeated annually but will increase substantially when the new terminal is built and operating. (See Table S2)
Table S2
Current Impact -‐-‐ 2013 Broken Down by Parish or City Total Including Tourism Impact
(Spending and Taxes in millions)
Category Total Spending Employment Total Taxes
City of Kenner $712.11 7,037 $32.79 St. Charles Parish $37.28 297 $1.05 Jefferson Parish $1,276.61 12,372 $59.38 Orleans Parish $3,794.39 39,440 $214.98
• The new terminal and related projects will create an additional annual total spending of $1.11 billion in
the local economy. Based on the 2013 impact estimated in this report, the new terminal will create an annual 21.1% increase in the current level of spending. In addition, the new terminal will create $434.64 million in new earnings annually and support 11,088 new jobs in the metro area. The new terminal will create annual new revenue of $19.24 million for the State of Louisiana and $29.44 million of local governments in the New Orleans area.
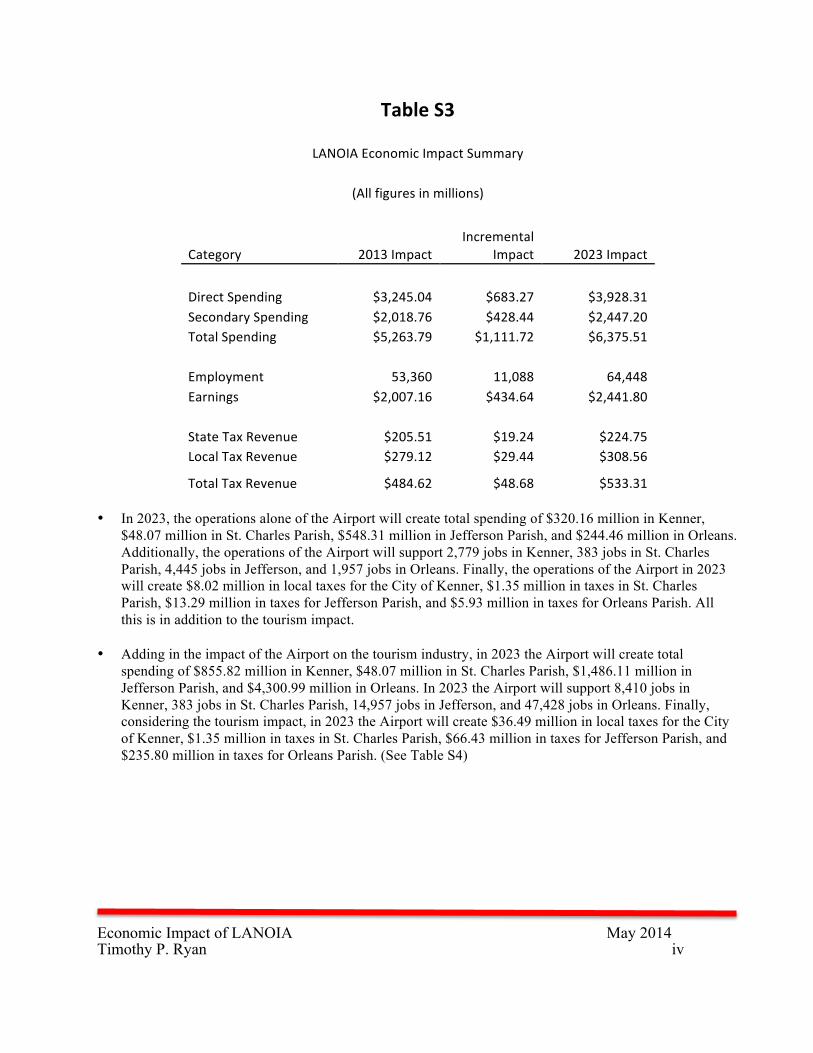
• In total, in 2023, the Airport in 2023 will create total spending in the New Orleans area economy of $6.38 billion. The Airport related spending in the local economy will support 64,448 jobs, $2.44 billion in earnings, or income for local residents, $224.75 million annually in tax revenues for the State of Louisiana, and $308.56 million in revenues for local governments in the area. (See Table S3)
Economic Impact of LANOIA May 2014 Timothy P. Ryan iv
The Economic Impact
Table S3
LANOIA Economic Impact Summary
(All figures in millions)
Category 2013 Impact Incremental
Impact 2023 Impact
Direct Spending $3,245.04 $683.27 $3,928.31 Secondary Spending $2,018.76 $428.44 $2,447.20 Total Spending $5,263.79 $1,111.72 $6,375.51
Employment 53,360 11,088 64,448 Earnings $2,007.16 $434.64 $2,441.80
State Tax Revenue $205.51 $19.24 $224.75 Local Tax Revenue $279.12 $29.44 $308.56
Total Tax Revenue $484.62 $48.68 $533.31 • In 2023, the operations alone of the Airport will create total spending of $320.16 million in Kenner,
$48.07 million in St. Charles Parish, $548.31 million in Jefferson Parish, and $244.46 million in Orleans. Additionally, the operations of the Airport will support 2,779 jobs in Kenner, 383 jobs in St. Charles Parish, 4,445 jobs in Jefferson, and 1,957 jobs in Orleans. Finally, the operations of the Airport in 2023 will create $8.02 million in local taxes for the City of Kenner, $1.35 million in taxes in St. Charles Parish, $13.29 million in taxes for Jefferson Parish, and $5.93 million in taxes for Orleans Parish. All this is in addition to the tourism impact.
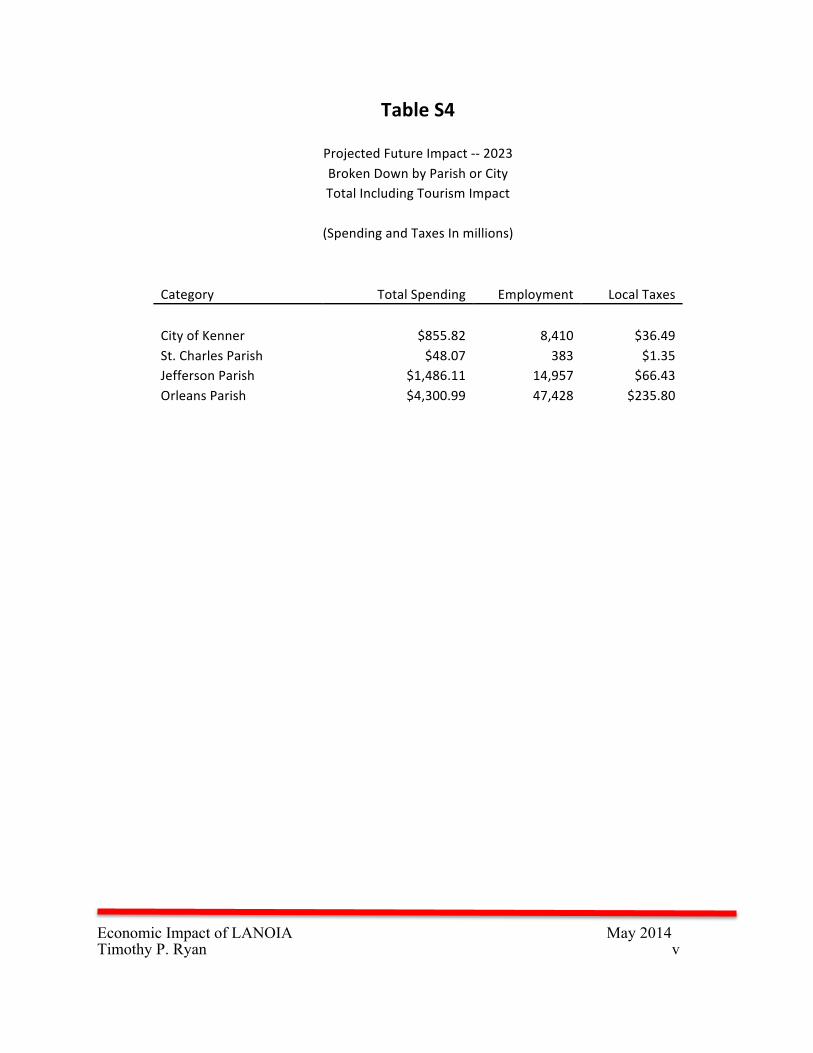
• Adding in the impact of the Airport on the tourism industry, in 2023 the Airport will create total
spending of $855.82 million in Kenner, $48.07 million in St. Charles Parish, $1,486.11 million in Jefferson Parish, and $4,300.99 million in Orleans. In 2023 the Airport will support 8,410 jobs in Kenner, 383 jobs in St. Charles Parish, 14,957 jobs in Jefferson, and 47,428 jobs in Orleans. Finally, considering the tourism impact, in 2023 the Airport will create $36.49 million in local taxes for the City of Kenner, $1.35 million in taxes in St. Charles Parish, $66.43 million in taxes for Jefferson Parish, and $235.80 million in taxes for Orleans Parish. (See Table S4)
Economic Impact of LANOIA May 2014 Timothy P. Ryan v
The Economic Impact
Table S4
Projected Future Impact -‐-‐ 2023 Broken Down by Parish or City Total Including Tourism Impact
(Spending and Taxes In millions)
Category Total Spending Employment Local Taxes
City of Kenner $855.82 8,410 $36.49 St. Charles Parish $48.07 383 $1.35 Jefferson Parish $1,486.11 14,957 $66.43 Orleans Parish $4,300.99 47,428 $235.80
Economic Impact of LANOIA May 2014 Timothy P. Ryan 1
The Economic Impact
INTRODUCTION The Louis Armstrong New Orleans International Airport is a very important part of the New Orleans area economy; this is especially true for the City of Kenner where the Airport is located. The airport serves as the gateway to the New Orleans tourism industry, one of the mainstays of the local economy, and is entering an exciting new period in its history with the development of a new terminal building. The Airport also serves as a means for local and visiting business people to travel to and from the area to conduct business. Most importantly, however, the economic activities directly related to the Airport generate hundreds of millions of dollars of income for people in the area and thousands of jobs. The Airport also provides crucial services to local business and industry. These activities are concentrated in close physical proximity to the Airport and generate income, jobs and tax revenue for the City of Kenner because of the Airport's location within City limits. With the development of a new terminal building the Airport will enter the modern, post-911 world of air travel. The new facility will provide several travel and economic benefits. Those benefits include:
1. With a smaller footprint, the new facility will cost significantly less to operate, thereby reducing costs to the airlines.
2. With passengers able to access the concessionaries for all concourses behind security, revenues generated at food and retail outlets will increase to match revenue levels observed at other similar airports, thereby reducing the costs to the airlines even further.
3. The lower costs to the airlines will attract additional flights into and out of the Airport, including more transfer flights.
4. The new terminal will free up land on the south side of the Airport property to attract additional air cargo and fixed base operators, which will positively impact the local economy.
The purpose of this report is to estimate the economic contribution of the Armstrong International Airport to the New Orleans metro areas as well as to the City of Kenner and to St. Charles Parish in 2013 and once the new terminal is developed and operating at full capacity, estimated to be 2023. The economic impact as estimated in this study is made up of four components: the direct, secondary and total spending (referred to as total economic impact) due to Airport operations; the income of area residents due to the Airport; the number of area residents who owe their employment, either directly or indirectly, to the Airport; and the tax revenue that is generated by the Airport and its operations to various levels of government.
Economic Impact of LANOIA May 2014 Timothy P. Ryan 2
The Economic Impact
THE SPENDING IMPACT -- 2013 The spending impact of the Airport consists of the following components:
1. The spending of the New Orleans Aviation Board on Airport operations. 2. The spending of the airlines. 3. The spending of the airfreight companies. 4. The spending of the parking operations. 5. The spending of fixed base operators (those services rendered to private aircraft). 6. The spending of government services provided at the Airport (such as TSA and FAA). 7. The spending of the concessionaires and other businesses that rely directly on the operations
of the Airport. 8. The spending of taxi drivers and other transportation services. 9. The spending of "Airport" hotels and motels. 10. The spending generated by the construction firms that are engaged in various Airport
construction projects. 11. And finally, the spending of visitors to the New Orleans area who use air travel as their
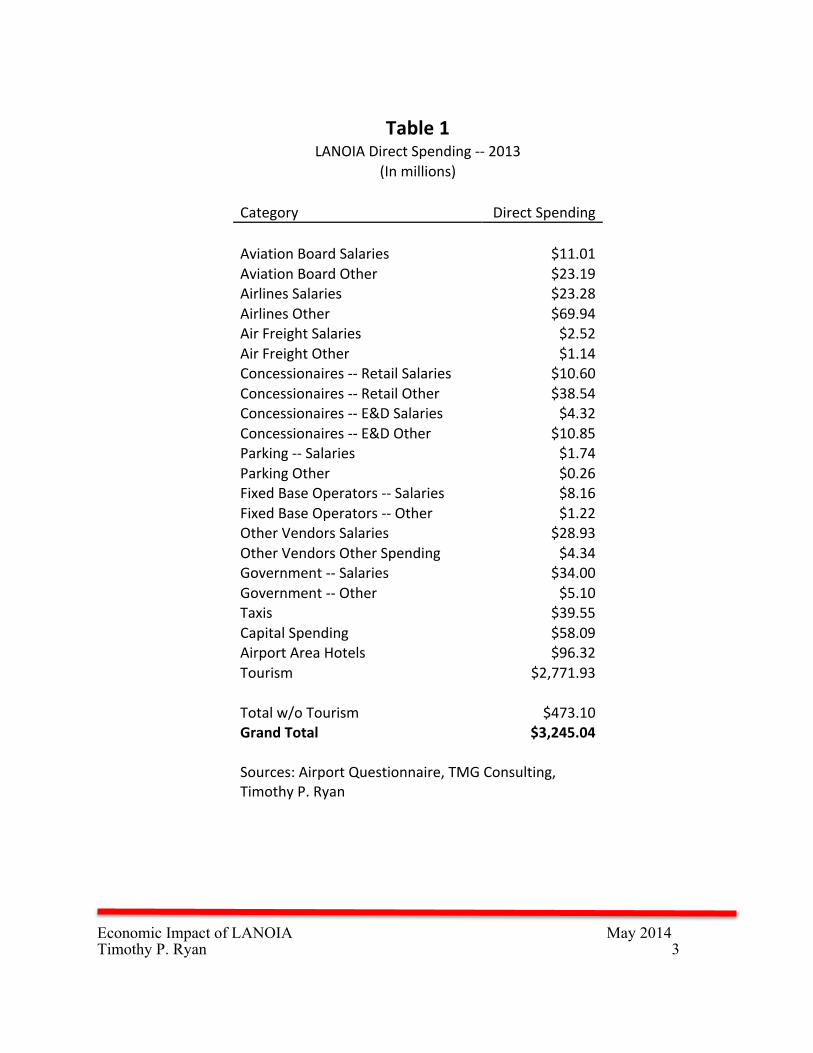
primary means of transportation into the area. The purpose of this section is to estimate the total dollar magnitude of the economic impact in each of these categories. In each of the categories identified above, local income is generated in two ways: directly and indirectly. The direct impact reflects the spending of businesses and employees who work at the Airport or for companies that are engaged in activities that depend on the Airport (such as employees of the airlines). In order to estimate the direct economic impact of the Airport, it was necessary to get primary information from the groups described above. That was done in several ways. First, detailed spending records of the Aviation Board were examined to identify their spending. To obtain information on the airlines, a survey of airlines was conducted to determine 2013 spending. To obtain information on other businesses at the Airport, TMG Consulting, an Airport consultant, reviewed the entire list of all personnel with Airport badges and matched the personnel with their business and an average salary. Economic Census information was used to estimate “other spending” by these firms. In 2013, the activities of the Airport produced $473.10 million in direct spending in the New Orleans area economy before considering the impact of the Airport on tourism. With the tourism impact added, the Airport created $3,425.04 million (or $3.45 billion) in direct spending in the local economy. The components of the two figures are summarized in Table 1.
Economic Impact of LANOIA May 2014 Timothy P. Ryan 3
The Economic Impact
Table 1
LANOIA Direct Spending -‐-‐ 2013 (In millions)
Category Direct Spending
Aviation Board Salaries $11.01 Aviation Board Other $23.19 Airlines Salaries $23.28 Airlines Other $69.94 Air Freight Salaries $2.52 Air Freight Other $1.14 Concessionaires -‐-‐ Retail Salaries $10.60 Concessionaires -‐-‐ Retail Other $38.54 Concessionaires -‐-‐ E&D Salaries $4.32 Concessionaires -‐-‐ E&D Other $10.85 Parking -‐-‐ Salaries $1.74 Parking Other $0.26 Fixed Base Operators -‐-‐ Salaries $8.16 Fixed Base Operators -‐-‐ Other $1.22 Other Vendors Salaries $28.93 Other Vendors Other Spending $4.34 Government -‐-‐ Salaries $34.00 Government -‐-‐ Other $5.10 Taxis $39.55 Capital Spending $58.09 Airport Area Hotels $96.32 Tourism $2,771.93
Total w/o Tourism $473.10 Grand Total $3,245.04
Sources: Airport Questionnaire, TMG Consulting, Timothy P. Ryan
Economic Impact of LANOIA May 2014 Timothy P. Ryan 4
The Economic Impact
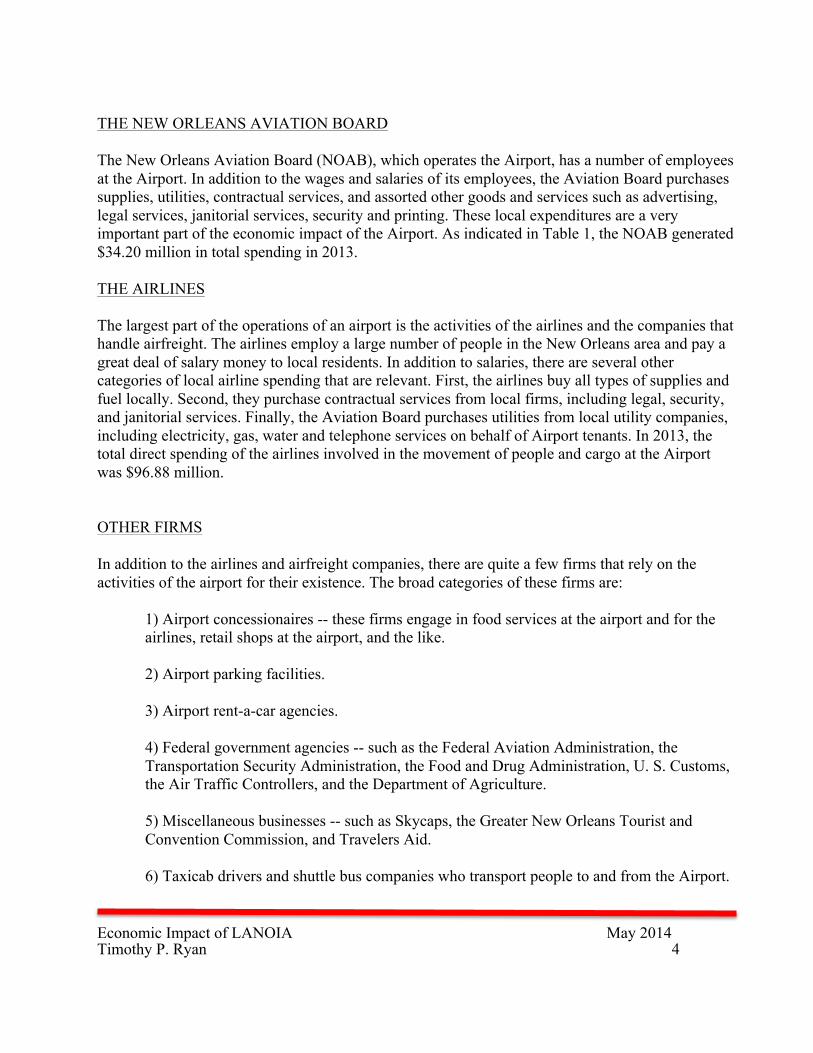
THE NEW ORLEANS AVIATION BOARD The New Orleans Aviation Board (NOAB), which operates the Airport, has a number of employees at the Airport. In addition to the wages and salaries of its employees, the Aviation Board purchases supplies, utilities, contractual services, and assorted other goods and services such as advertising, legal services, janitorial services, security and printing. These local expenditures are a very important part of the economic impact of the Airport. As indicated in Table 1, the NOAB generated $34.20 million in total spending in 2013. THE AIRLINES The largest part of the operations of an airport is the activities of the airlines and the companies that handle airfreight. The airlines employ a large number of people in the New Orleans area and pay a great deal of salary money to local residents. In addition to salaries, there are several other categories of local airline spending that are relevant. First, the airlines buy all types of supplies and fuel locally. Second, they purchase contractual services from local firms, including legal, security, and janitorial services. Finally, the Aviation Board purchases utilities from local utility companies, including electricity, gas, water and telephone services on behalf of Airport tenants. In 2013, the total direct spending of the airlines involved in the movement of people and cargo at the Airport was $96.88 million. OTHER FIRMS In addition to the airlines and airfreight companies, there are quite a few firms that rely on the activities of the airport for their existence. The broad categories of these firms are:
1) Airport concessionaires -- these firms engage in food services at the airport and for the airlines, retail shops at the airport, and the like.
2) Airport parking facilities.
3) Airport rent-a-car agencies.
4) Federal government agencies -- such as the Federal Aviation Administration, the Transportation Security Administration, the Food and Drug Administration, U. S. Customs, the Air Traffic Controllers, and the Department of Agriculture.
5) Miscellaneous businesses -- such as Skycaps, the Greater New Orleans Tourist and Convention Commission, and Travelers Aid.
6) Taxicab drivers and shuttle bus companies who transport people to and from the Airport.
Economic Impact of LANOIA May 2014 Timothy P. Ryan 5
The Economic Impact
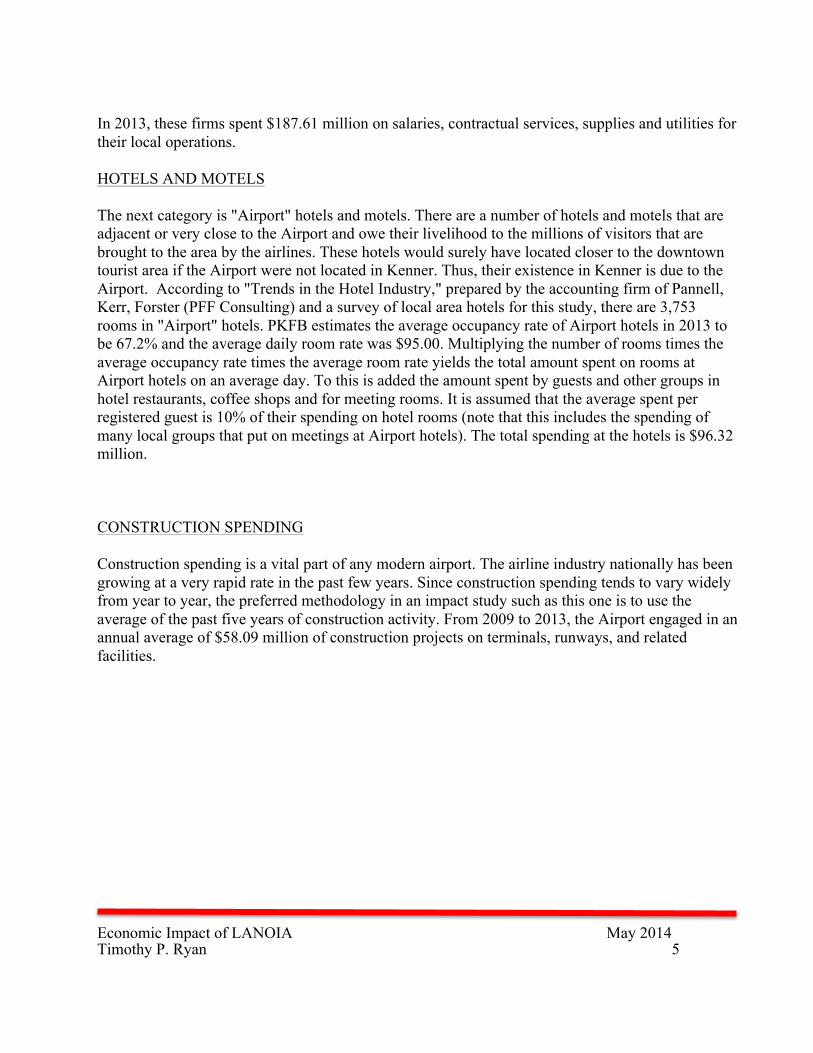
In 2013, these firms spent $187.61 million on salaries, contractual services, supplies and utilities for their local operations. HOTELS AND MOTELS The next category is "Airport" hotels and motels. There are a number of hotels and motels that are adjacent or very close to the Airport and owe their livelihood to the millions of visitors that are brought to the area by the airlines. These hotels would surely have located closer to the downtown tourist area if the Airport were not located in Kenner. Thus, their existence in Kenner is due to the Airport. According to "Trends in the Hotel Industry," prepared by the accounting firm of Pannell, Kerr, Forster (PFF Consulting) and a survey of local area hotels for this study, there are 3,753 rooms in "Airport" hotels. PKFB estimates the average occupancy rate of Airport hotels in 2013 to be 67.2% and the average daily room rate was $95.00. Multiplying the number of rooms times the average occupancy rate times the average room rate yields the total amount spent on rooms at Airport hotels on an average day. To this is added the amount spent by guests and other groups in hotel restaurants, coffee shops and for meeting rooms. It is assumed that the average spent per registered guest is 10% of their spending on hotel rooms (note that this includes the spending of many local groups that put on meetings at Airport hotels). The total spending at the hotels is $96.32 million. CONSTRUCTION SPENDING Construction spending is a vital part of any modern airport. The airline industry nationally has been growing at a very rapid rate in the past few years. Since construction spending tends to vary widely from year to year, the preferred methodology in an impact study such as this one is to use the average of the past five years of construction activity. From 2009 to 2013, the Airport engaged in an annual average of $58.09 million of construction projects on terminals, runways, and related facilities.
Economic Impact of LANOIA May 2014 Timothy P. Ryan 6
The Economic Impact
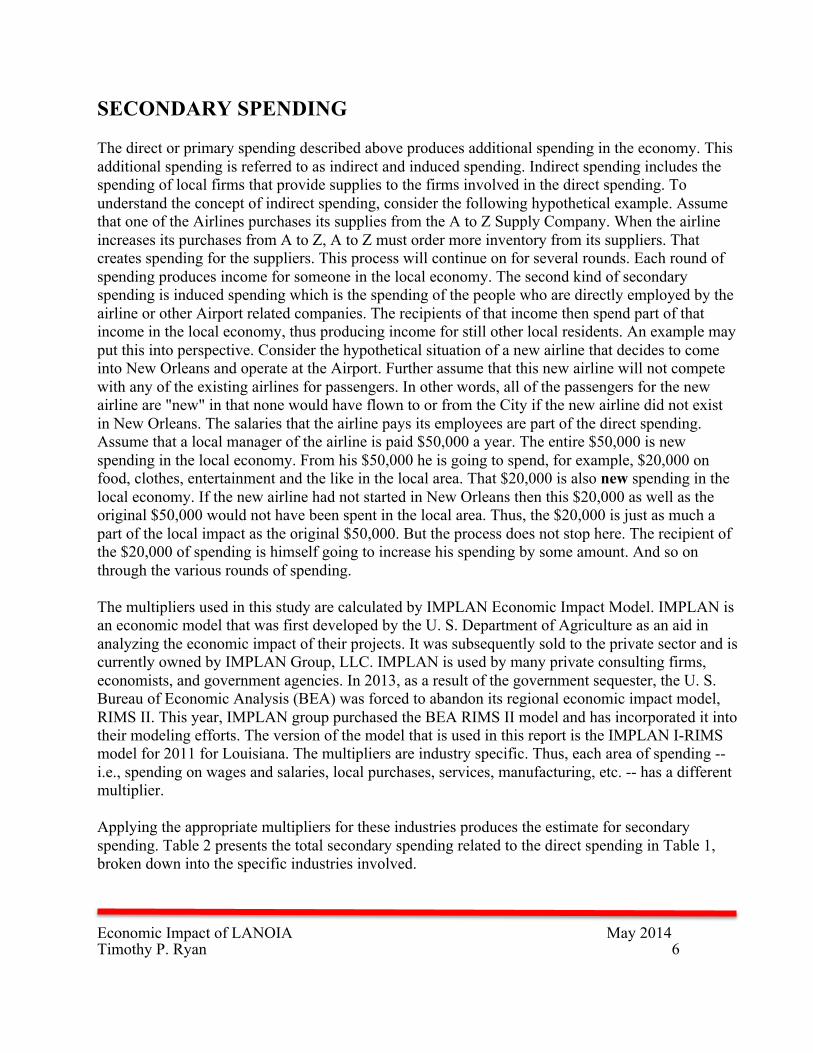
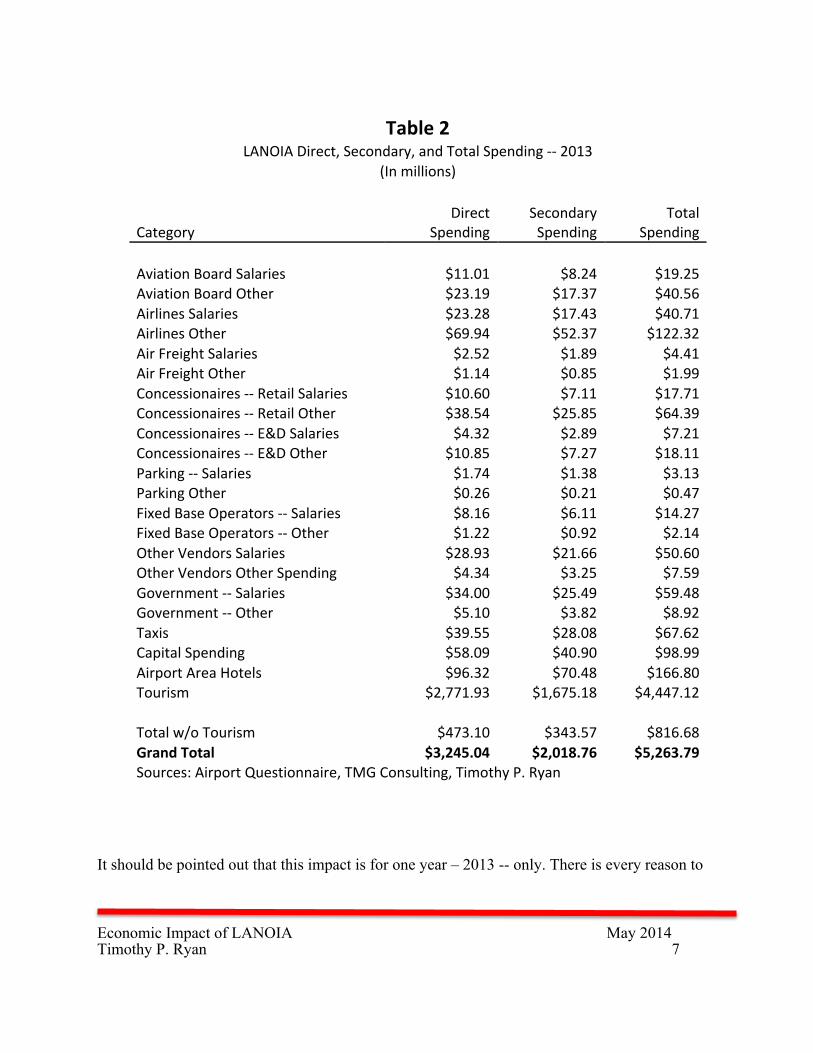
SECONDARY SPENDING The direct or primary spending described above produces additional spending in the economy. This additional spending is referred to as indirect and induced spending. Indirect spending includes the spending of local firms that provide supplies to the firms involved in the direct spending. To understand the concept of indirect spending, consider the following hypothetical example. Assume that one of the Airlines purchases its supplies from the A to Z Supply Company. When the airline increases its purchases from A to Z, A to Z must order more inventory from its suppliers. That creates spending for the suppliers. This process will continue on for several rounds. Each round of spending produces income for someone in the local economy. The second kind of secondary spending is induced spending which is the spending of the people who are directly employed by the airline or other Airport related companies. The recipients of that income then spend part of that income in the local economy, thus producing income for still other local residents. An example may put this into perspective. Consider the hypothetical situation of a new airline that decides to come into New Orleans and operate at the Airport. Further assume that this new airline will not compete with any of the existing airlines for passengers. In other words, all of the passengers for the new airline are "new" in that none would have flown to or from the City if the new airline did not exist in New Orleans. The salaries that the airline pays its employees are part of the direct spending. Assume that a local manager of the airline is paid $50,000 a year. The entire $50,000 is new spending in the local economy. From his $50,000 he is going to spend, for example, $20,000 on food, clothes, entertainment and the like in the local area. That $20,000 is also new spending in the local economy. If the new airline had not started in New Orleans then this $20,000 as well as the original $50,000 would not have been spent in the local area. Thus, the $20,000 is just as much a part of the local impact as the original $50,000. But the process does not stop here. The recipient of the $20,000 of spending is himself going to increase his spending by some amount. And so on through the various rounds of spending. The multipliers used in this study are calculated by IMPLAN Economic Impact Model. IMPLAN is an economic model that was first developed by the U. S. Department of Agriculture as an aid in analyzing the economic impact of their projects. It was subsequently sold to the private sector and is currently owned by IMPLAN Group, LLC. IMPLAN is used by many private consulting firms, economists, and government agencies. In 2013, as a result of the government sequester, the U. S. Bureau of Economic Analysis (BEA) was forced to abandon its regional economic impact model, RIMS II. This year, IMPLAN group purchased the BEA RIMS II model and has incorporated it into their modeling efforts. The version of the model that is used in this report is the IMPLAN I-RIMS model for 2011 for Louisiana. The multipliers are industry specific. Thus, each area of spending -- i.e., spending on wages and salaries, local purchases, services, manufacturing, etc. -- has a different multiplier. Applying the appropriate multipliers for these industries produces the estimate for secondary spending. Table 2 presents the total secondary spending related to the direct spending in Table 1, broken down into the specific industries involved.
Economic Impact of LANOIA May 2014 Timothy P. Ryan 7
The Economic Impact
Table 2
LANOIA Direct, Secondary, and Total Spending -‐-‐ 2013 (In millions)
Category
Direct Spending
Secondary Spending
Total Spending
Aviation Board Salaries $11.01 $8.24 $19.25 Aviation Board Other $23.19 $17.37 $40.56 Airlines Salaries $23.28 $17.43 $40.71 Airlines Other $69.94 $52.37 $122.32 Air Freight Salaries $2.52 $1.89 $4.41 Air Freight Other $1.14 $0.85 $1.99 Concessionaires -‐-‐ Retail Salaries $10.60 $7.11 $17.71 Concessionaires -‐-‐ Retail Other $38.54 $25.85 $64.39 Concessionaires -‐-‐ E&D Salaries $4.32 $2.89 $7.21 Concessionaires -‐-‐ E&D Other $10.85 $7.27 $18.11 Parking -‐-‐ Salaries $1.74 $1.38 $3.13 Parking Other $0.26 $0.21 $0.47 Fixed Base Operators -‐-‐ Salaries $8.16 $6.11 $14.27 Fixed Base Operators -‐-‐ Other $1.22 $0.92 $2.14 Other Vendors Salaries $28.93 $21.66 $50.60 Other Vendors Other Spending $4.34 $3.25 $7.59 Government -‐-‐ Salaries $34.00 $25.49 $59.48 Government -‐-‐ Other $5.10 $3.82 $8.92 Taxis $39.55 $28.08 $67.62 Capital Spending $58.09 $40.90 $98.99 Airport Area Hotels $96.32 $70.48 $166.80 Tourism $2,771.93 $1,675.18 $4,447.12
Total w/o Tourism $473.10 $343.57 $816.68 Grand Total $3,245.04 $2,018.76 $5,263.79 Sources: Airport Questionnaire, TMG Consulting, Timothy P. Ryan
It should be pointed out that this impact is for one year – 2013 -- only. There is every reason to
Economic Impact of LANOIA May 2014 Timothy P. Ryan 8
The Economic Impact
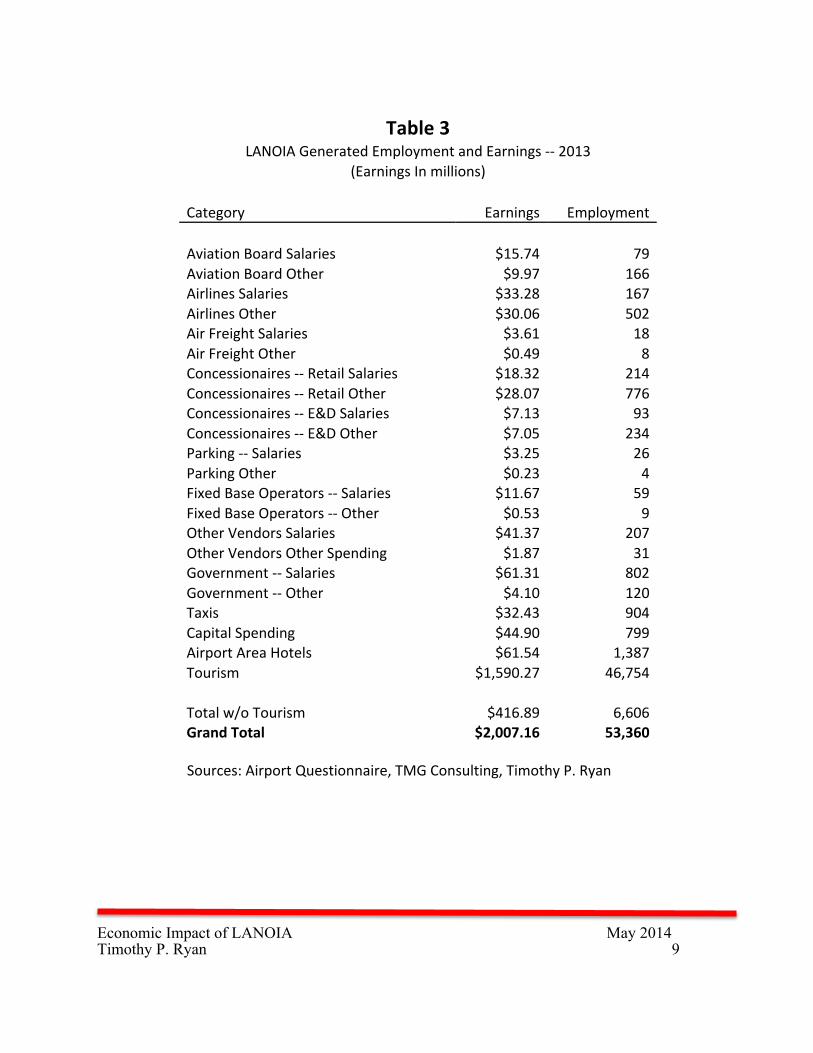
believe that this spending will increase substantially in the future because of the increased construction mentioned earlier, increased travel due to a rebounding of the national and local economy, growth of the local tourism industry, expanded business due to the expansion of the air cargo facilities, and increased air service and air cargo activities for New Orleans. But, even without all of this, the Armstrong International Airport contributes over $5,263.79 million (or $5.26 billion) annually to the New Orleans area economy, made up of $3.45 billion in direct spending and $2.02 billion in secondary spending. The Airport is truly a crucial part of the local economic structure. EMPLOYMENT AND EARNINGS The activities of the Armstrong International Airport generate a great deal of employment in the area and income for local residents. As with the spending, there are two types of employment effects that result from the operations of the Airport -- direct and secondary employment. The direct employment impact was calculated from the records of the Aviation Board and the questionnaire that was sent to all airlines, concessionaires, and airport-related firms. The direct and secondary spending described above produces income for local residents. The Bureau of Economic Analysis, in the same publication mentioned above, also provides earnings or income multipliers, and these earnings multipliers are also industry specific. An earnings multiplier indicates the total amount of income that results from a given increase in spending. Table 5 identifies the income generated for area residents by the various categories of Airport impact. In 2013, the activities of the Airport created $458.74 million of income for New Orleans area residents. Some of this income is paid directly by the Aviation Board, by the airlines and airfreight companies, the concessionaires and related firms, as taxi drivers, and as a result of construction activities at the Airport, and the remainder is paid by the firms that receive secondary spending. Table 3 presents the estimates for total employment and income create by the operations of the Louis Armstrong New Orleans International Airport in 2013.
Economic Impact of LANOIA May 2014 Timothy P. Ryan 9
The Economic Impact
Table 3
LANOIA Generated Employment and Earnings -‐-‐ 2013 (Earnings In millions)
Category Earnings Employment
Aviation Board Salaries $15.74 79 Aviation Board Other $9.97 166 Airlines Salaries $33.28 167 Airlines Other $30.06 502 Air Freight Salaries $3.61 18 Air Freight Other $0.49 8 Concessionaires -‐-‐ Retail Salaries $18.32 214 Concessionaires -‐-‐ Retail Other $28.07 776 Concessionaires -‐-‐ E&D Salaries $7.13 93 Concessionaires -‐-‐ E&D Other $7.05 234 Parking -‐-‐ Salaries $3.25 26 Parking Other $0.23 4 Fixed Base Operators -‐-‐ Salaries $11.67 59 Fixed Base Operators -‐-‐ Other $0.53 9 Other Vendors Salaries $41.37 207 Other Vendors Other Spending $1.87 31 Government -‐-‐ Salaries $61.31 802 Government -‐-‐ Other $4.10 120 Taxis $32.43 904 Capital Spending $44.90 799 Airport Area Hotels $61.54 1,387 Tourism $1,590.27 46,754
Total w/o Tourism $416.89 6,606 Grand Total $2,007.16 53,360
Sources: Airport Questionnaire, TMG Consulting, Timothy P. Ryan
Economic Impact of LANOIA May 2014 Timothy P. Ryan 10
The Economic Impact
In 2013, there were a total of 53,360 people in the New Orleans metro area who owe their job, either directly or indirectly, to the operations of the Airport. The direct employment consists of people who are employed by the Aviation Board, by professional services and consultants paid for by the Aviation Board, by the airlines and airfreight companies, the concessionaires and related firms, as taxi drivers, and as a result of construction activities at the Airport. The indirect, or secondary, employment consists of people whose jobs are supported, in whole or in part, by the spending of the Aviation Board, by the airlines and airfreight companies, the concessionaires and related firms, as taxi drivers, and as a result of construction activities at the Airport. The direct and secondary spending described above produces income for local residents. The IMPLAN Group, in the same publication mentioned above, also provides earnings or income multipliers, and these earnings multipliers are also industry specific. An earnings multiplier indicates the total amount of income that results from a given increase in spending. Table 3 also identifies the income generated for area residents by the various categories of Airport impact. In 2013, the activities of the Airport created $2,007.16 million (or $2.01 billion) of income for New Orleans area residents. Some of this income is paid directly by the Aviation Board, by the airlines and airfreight companies, the concessionaires and related firms, as taxi drivers, and as a result of construction activities at the Airport, and the remainder is paid by the firms that receive secondary spending. STATE AND LOCAL TAX REVENUE When money is spent in any local economy, some of that spending produces tax revenues to State and local governments in the area. At the State level, the direct spending at the Airport and the direct spending of visitors to Airport hotels pay state sales taxes and state hotel-motel taxes. In addition, the Airport related spending generates income in the area (See Table 3) and from that income recipients pay state income taxes, state sales taxes, and state excise taxes. At the local level, the direct spending at the Airport and the direct spending of visitors to Airport hotels pay local sales taxes and local hotel-motel taxes. Airport related income recipients pay local sales taxes from their income. The final variables to estimate are state and local tax revenues created by the hard construction activities. The businesses involved in the direct spending – the airlines, the construction companies, the concessionaires, and the like -- pay taxes directly to the state of Louisiana and to the local governments in the region. These direct taxes include corporate income, corporate franchise, sales, property, and various miscellaneous taxes. In addition, the economic activity created by the company creates additional state and local tax revenue. State taxes generated by economic activity are taxes paid on the income generated by those
Economic Impact of LANOIA May 2014 Timothy P. Ryan 11
The Economic Impact
operations and sales taxes paid directly on the sale of goods and services. Out of that income, the recipient pays his state income taxes; in addition, he buys goods and services and pays the taxes that apply to those goods and services. The retail sales tax applies to the purchase of some goods and services. The assumption used to estimate the revenue from all of these taxes is that the recipient of newly created income is no different from the average Louisiana consumer; thus, the proportion of income that is paid in these various taxes is equal to average values for the state as a whole. State income taxes paid out of the income generated by the company’s activities can be estimated by determining the proportion of income that the average person in the state pays in state income taxes. In 2012, the latest year for which data exists, that proportion for state income taxes is 1.50% (Source: United States Bureau of the Census, State Government Finances: 2012). To estimate the amount of sales tax revenue attributable to the income generated, the same methodology is employed. According to the Census Bureau residents pay 1.53% of their income in the form of state sales taxes. The next category of state tax revenue is specific excise taxes paid, sometimes referred to as selective sales taxes. In order to estimate the amount of these taxes paid as a result of the Airport activities, we employ a methodology similar to the one used for the personal income tax. The Census Bureau provides estimates of the revenue raised by the state by the various excise taxes enumerated above. Dividing the total of this revenue by income produces the estimate of the proportion of excise tax revenue 1.12%. The next category of taxes is business taxes. These include various license and state corporate income and franchise taxes. The sales and profits generated by the project will create significant business tax revenue for the two states. According to the Census Bureau, the proportion of income paid in the form of business taxes is 0.27%. The sale of hotel rooms is taxed by both the state and local governments. At the state level, hotel room sales are taxed at a rate of 6%. Part of that revenue is used to pay off the Superdome bonds and the remainder goes to the state general fund. Finally, there are local taxes. The main local taxes are the local sales and property taxes. The methodology used to estimate the local sales tax is to estimate, using the Consumer Expenditure Survey, the percentage of his/her income the average worker spends on goods taxable by local government in Louisiana. That percentage is then multiplied by the earnings created by the project to determine total taxable spending created by the project. Taxable spending is then multiplied by the tax rate to determine total local sales tax revenue created. Property taxes are estimated assuming that employees related to this project are similar to the average job in the State with respect to homeownership and value of property. Total local property taxes in the State of Louisiana [Source: Louisiana Tax Commission, Annual Report, 2012] are divided by total employment to estimate the local property taxes paid per job. There are a number of hotels in Kenner that are "Airport" hotels and owe their existence to the Airport. The local tax rate for hotel room nights in Jefferson Parish is
Economic Impact of LANOIA May 2014 Timothy P. Ryan 12
The Economic Impact
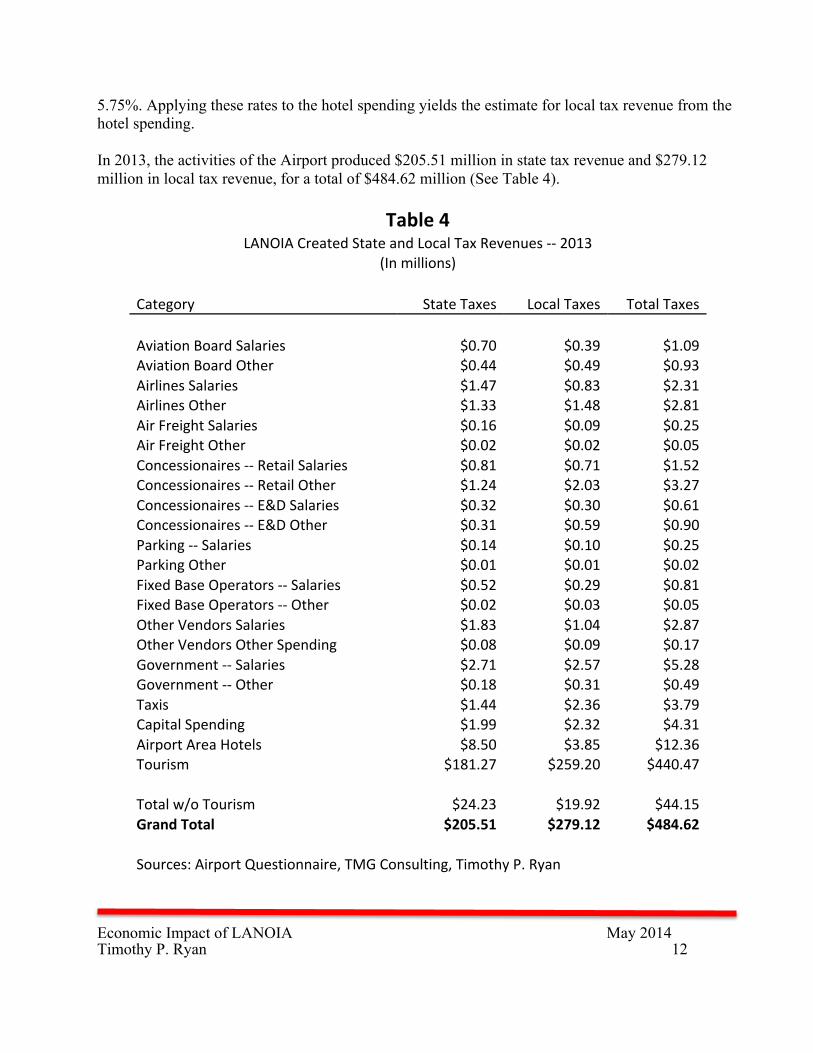
5.75%. Applying these rates to the hotel spending yields the estimate for local tax revenue from the hotel spending. In 2013, the activities of the Airport produced $205.51 million in state tax revenue and $279.12 million in local tax revenue, for a total of $484.62 million (See Table 4).
Table 4 LANOIA Created State and Local Tax Revenues -‐-‐ 2013
(In millions)
Category State Taxes Local Taxes Total Taxes
Aviation Board Salaries $0.70 $0.39 $1.09 Aviation Board Other $0.44 $0.49 $0.93 Airlines Salaries $1.47 $0.83 $2.31 Airlines Other $1.33 $1.48 $2.81 Air Freight Salaries $0.16 $0.09 $0.25 Air Freight Other $0.02 $0.02 $0.05 Concessionaires -‐-‐ Retail Salaries $0.81 $0.71 $1.52 Concessionaires -‐-‐ Retail Other $1.24 $2.03 $3.27 Concessionaires -‐-‐ E&D Salaries $0.32 $0.30 $0.61 Concessionaires -‐-‐ E&D Other $0.31 $0.59 $0.90 Parking -‐-‐ Salaries $0.14 $0.10 $0.25 Parking Other $0.01 $0.01 $0.02 Fixed Base Operators -‐-‐ Salaries $0.52 $0.29 $0.81 Fixed Base Operators -‐-‐ Other $0.02 $0.03 $0.05 Other Vendors Salaries $1.83 $1.04 $2.87 Other Vendors Other Spending $0.08 $0.09 $0.17 Government -‐-‐ Salaries $2.71 $2.57 $5.28 Government -‐-‐ Other $0.18 $0.31 $0.49 Taxis $1.44 $2.36 $3.79 Capital Spending $1.99 $2.32 $4.31 Airport Area Hotels $8.50 $3.85 $12.36 Tourism $181.27 $259.20 $440.47
Total w/o Tourism $24.23 $19.92 $44.15 Grand Total $205.51 $279.12 $484.62
Sources: Airport Questionnaire, TMG Consulting, Timothy P. Ryan
Economic Impact of LANOIA May 2014 Timothy P. Ryan 13
The Economic Impact
IMPACT OF THE AIRPORT BROKEN DOWN GEOGRAPHICALLY The purpose of this section of the report is to estimate the impact of Airport operations on the economies of the City of Kenner, St. Charles Parish, Jefferson Parish, and Orleans Parish. Theoretically, all of the economic impact of the Airport could be attributed to the City of Kenner since the Airport is located in Kenner and all spending occurs there. However, in an economy, the impact is spread around to the geographic areas in which businesses are located and in areas in which employees live. The economic impact was broken down into the four geographic regions based on the following methodology:
1. All income or salary related spending was broken down by the home parish or city of the employee. That information was obtained from the badge list as provided by the Airport and analyzed by TMG Consulting.
2. All business related spending was broken down by the parish or city that the business is located. That information was obtained from the vendor list as provided by the Airport and analyzed by TMG Consulting.
3. All Airport hotels were located in Kenner. 4. Tourism spending was broken down based on the distribution of hotel rooms in the New
Orleans area as reported by PKF Consulting for calendar year 2013. Tables 5 through 8 present the six categories of the Airport’s impact (direct spending, secondary spending, total spending, earnings, jobs, and local taxes) broken down by the totals for Kenner, St. Charles Parish, Jefferson Parish, and Orleans Parish.

Economic Impact of LANOIA May 2014 Timothy P. Ryan 14
The Economic Impact
Table 5
LANOIA Direct, Secondary, and Total Spending Broken Down by Parish or City 2013 Airport Operations Only
(In millions)
Category Direct Spending
Secondary Spending
Total Spending
City of Kenner $153.12 $111.64 $264.76 St. Charles Parish $21.49 $15.78 $37.28 Jefferson Parish $255.56 $186.00 $441.56 Orleans Parish $105.76 $76.56 $182.33
Sources: Airport Questionnaire, TMG Consulting, Timothy P. Ryan
Table 6
LANOIA Direct, Secondary, and Total Spending Broken Down by Parish or City
2013 Total Including Tourism Impact
(In millions)
Category Direct Spending
Secondary Spending
Total Spending
City of Kenner $431.95 $280.16 $712.11 St. Charles Parish $21.49 $15.78 $37.28 Jefferson Parish $776.06 $500.55 $1,276.61 Orleans Parish $2,357.20 $1,437.19 $3,794.39
Sources: Airport Questionnaire, TMG Consulting, Timothy P. Ryan
Economic Impact of LANOIA May 2014 Timothy P. Ryan 15
The Economic Impact
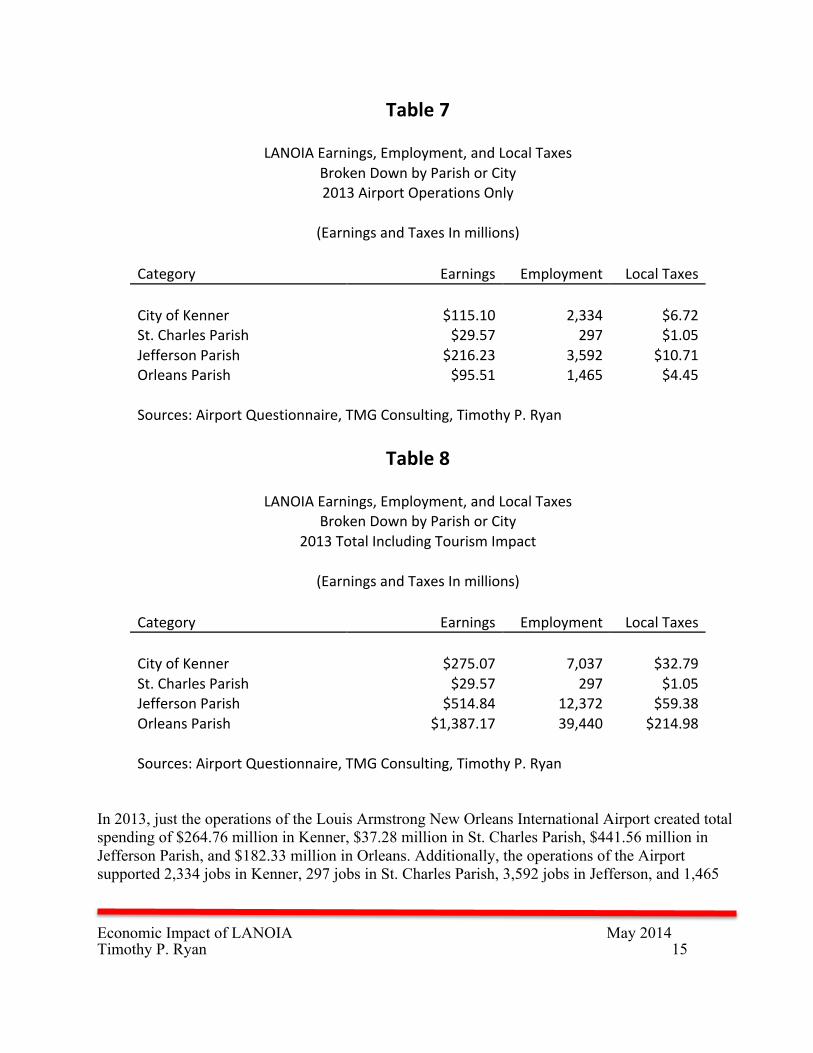
Table 7
LANOIA Earnings, Employment, and Local Taxes Broken Down by Parish or City 2013 Airport Operations Only
(Earnings and Taxes In millions)
Category Earnings Employment Local Taxes
City of Kenner $115.10 2,334 $6.72 St. Charles Parish $29.57 297 $1.05 Jefferson Parish $216.23 3,592 $10.71 Orleans Parish $95.51 1,465 $4.45
Sources: Airport Questionnaire, TMG Consulting, Timothy P. Ryan
Table 8
LANOIA Earnings, Employment, and Local Taxes Broken Down by Parish or City
2013 Total Including Tourism Impact
(Earnings and Taxes In millions)
Category Earnings Employment Local Taxes
City of Kenner $275.07 7,037 $32.79 St. Charles Parish $29.57 297 $1.05 Jefferson Parish $514.84 12,372 $59.38 Orleans Parish $1,387.17 39,440 $214.98
Sources: Airport Questionnaire, TMG Consulting, Timothy P. Ryan In 2013, just the operations of the Louis Armstrong New Orleans International Airport created total spending of $264.76 million in Kenner, $37.28 million in St. Charles Parish, $441.56 million in Jefferson Parish, and $182.33 million in Orleans. Additionally, the operations of the Airport supported 2,334 jobs in Kenner, 297 jobs in St. Charles Parish, 3,592 jobs in Jefferson, and 1,465

Economic Impact of LANOIA May 2014 Timothy P. Ryan 16
The Economic Impact
jobs in Orleans. Finally, the operations of the Airport created $6.72 million in local taxes for the City of Kenner, $1.05 million in taxes in St. Charles Parish, $10.71 million in taxes for Jefferson Parish, and $4.45 million in taxes for Orleans Parish. All this is in addition to the tourism impact. Adding in the impact of the Airport on the tourism industry, the Airport created total spending of $712.11 million in Kenner, $37.28 million in St. Charles Parish, $1,276.61 million in Jefferson Parish, and $3,794.39 million in Orleans. The Airport supported 7,037 jobs in Kenner, 297 jobs in St. Charles Parish, 12,372 jobs in Jefferson, and 39,440 jobs in Orleans. Finally, considering the tourism impact, the Airport created $32.79 million in local taxes for the City of Kenner, $1.05 million in taxes in St. Charles Parish, $59.38 million in taxes for Jefferson Parish, and $214.98 million in taxes for Orleans Parish. These are 2013 estimates; however, the impacts will not only be repeated annually, but will increase substantially when the new terminal is built and operating.
Economic Impact of LANOIA May 2014 Timothy P. Ryan 17
The Economic Impact
PROJECTD FUTURE IMPACT This section of the report identifies the projected future impact when the new terminal is in place. The terminal is expected to be completed by 2018; but from 2018 to 2023, the Airport will continue to pay for the existing debt service as well as the debt service on the new facility and other improvements. In 2023, the debt on the existing bonds will be completely paid off and the “costs per enplanement” for the airlines will drop. The new terminal and related improvements will create new economic activity in the New Orleans area economy for several reasons. Those include:
1. With a smaller footprint, the new facility will cost significantly less to operate, thereby reducing costs to the airlines.
2. With passengers able to access the concessionaries for all concourses behind security, revenues generated at food and retail outlets will increase to match revenue levels observed at other similar airports, thereby reducing the costs to the airlines even further.
3. The lower costs to the airlines will attract additional flights into and out of the Airport, including more transfer flights.
4. The new terminal will free up land on the south side of the Airport property to attract additional air cargo and fixed base operators, which will positively impact the local economy.
This section of the report quantifies these aspects of the projected future impact of the Airport once existing debt is retired and the new terminal and other improvements are fully operational. The increased impact will be driven by several factors:
1. Increased enplanements. 2. Increased air cargo operations resulting from larger air cargo facilities. 3. Increased fixed base operations resulting from larger air cargo facilities.
Increased Enplanements The most important driver of increased Airport impact is increased enplanements. Enplanements are expected to increase for two main reasons. First, the lower costs per enplanements (CPE) to the airlines will encourage the airlines to put more flights into and out of New Orleans. This phenomenon is referred to in economics as the “price effect” and is standard economic theory. This is especially true for the low cost airlines who charge low fares compared to the traditional airlines and are thus much more sensitive to lower costs per enplanement. In addition, the lower costs and
Economic Impact of LANOIA May 2014 Timothy P. Ryan 18
The Economic Impact
the more traveler-friendly configuration of the new terminal will encourage the traditional airlines to use New Orleans to a larger extent than currently for transfer passengers, or hub services. Finally, the tourism industry in New Orleans has engaged the Boston Consulting Group to develop a master plan for the tourism industry. That master plan develops a series of strategies to increase the number of visitors from the 2012 level of 9.01 million visitors to 13.70 million visitors by 2018. One of the strategies to implement the master plan is to increase the hotel/motel tax to create funds to increase the marketing of the area, provide critical services to the tourist areas (mostly the French Quarter), and create a “big-event fund” to attract mega conventions and sporting events. That tax is currently in place. In order to make the overall tourism strategy effective, the Airport has to be a major player. If the Airport does not make is cost effective for the airlines to schedule additional flights at reasonable rates, the plan will fall short of its goal. The Airport and the local tourist industry must work hand-in-hand to maximize effectiveness. In order to estimate the impact of lower CPE on the level of enplanements, a cross-section multiple regression analysis was used. The regression equation used took the following form:
Enplanementsi = β0 + β1 (CPE leveli)+ β2 (Hubi)+ β3 (TotRevi)+ β4 (MultAiri)+ ε
Where: Enplanementsi = Enplanements at the 81 airports nationally. β0, β1, β2, β3, β4 = Estimated regression coefficient for each variable. CPE leveli = The Cost per enplanement for each airport. Hubi = The status of the Airport with respect to the number of transfer
flights. This variable can take a 1,2, or 3 value with 3 being the largest number of transfer flights.
TotRevi = The total revenue of the 81 airports. MultAiri = Is a dummy variable that takes on the value of 1 if the city has more
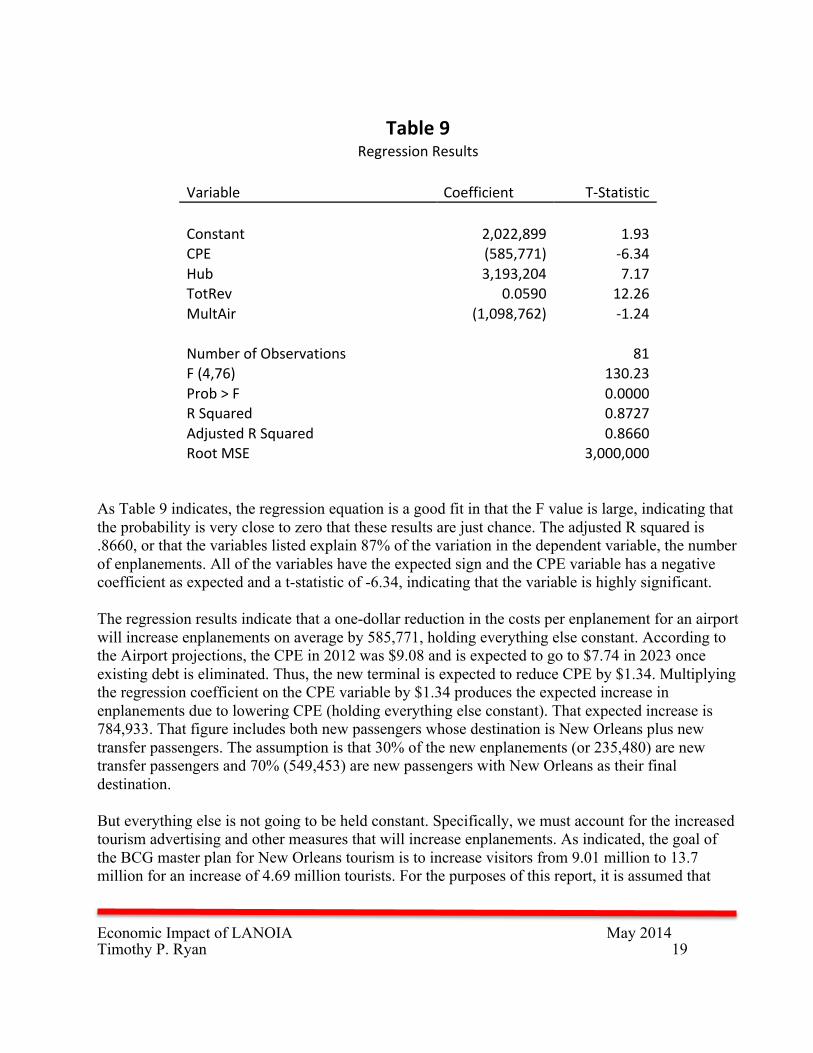
than one airport, zero otherwise. ε = The regression error term. The regression equation sets up the hypothesis that lower costs per enplanement would increase the number of enplanements, holding other factors constant. The other factors include the number of transfer flights that would increase enplanements; the total revenue of the airport, which is a proxy for the size of the population and the tourism area that the airport serves; and whether or not the airport has competition in its area, which would reduce enplanements. Table 9 presents the results of the regression analysis.
Economic Impact of LANOIA May 2014 Timothy P. Ryan 19
The Economic Impact
Table 9
Regression Results
Variable Coefficient T-‐Statistic
Constant 2,022,899 1.93 CPE (585,771) -‐6.34 Hub 3,193,204 7.17 TotRev 0.0590 12.26 MultAir (1,098,762) -‐1.24
Number of Observations
81 F (4,76)
130.23
Prob > F
0.0000 R Squared
0.8727
Adjusted R Squared
0.8660 Root MSE
3,000,000
As Table 9 indicates, the regression equation is a good fit in that the F value is large, indicating that the probability is very close to zero that these results are just chance. The adjusted R squared is .8660, or that the variables listed explain 87% of the variation in the dependent variable, the number of enplanements. All of the variables have the expected sign and the CPE variable has a negative coefficient as expected and a t-statistic of -6.34, indicating that the variable is highly significant. The regression results indicate that a one-dollar reduction in the costs per enplanement for an airport will increase enplanements on average by 585,771, holding everything else constant. According to the Airport projections, the CPE in 2012 was $9.08 and is expected to go to $7.74 in 2023 once existing debt is eliminated. Thus, the new terminal is expected to reduce CPE by $1.34. Multiplying the regression coefficient on the CPE variable by $1.34 produces the expected increase in enplanements due to lowering CPE (holding everything else constant). That expected increase is 784,933. That figure includes both new passengers whose destination is New Orleans plus new transfer passengers. The assumption is that 30% of the new enplanements (or 235,480) are new transfer passengers and 70% (549,453) are new passengers with New Orleans as their final destination. But everything else is not going to be held constant. Specifically, we must account for the increased tourism advertising and other measures that will increase enplanements. As indicated, the goal of the BCG master plan for New Orleans tourism is to increase visitors from 9.01 million to 13.7 million for an increase of 4.69 million tourists. For the purposes of this report, it is assumed that
Economic Impact of LANOIA May 2014 Timothy P. Ryan 20
The Economic Impact
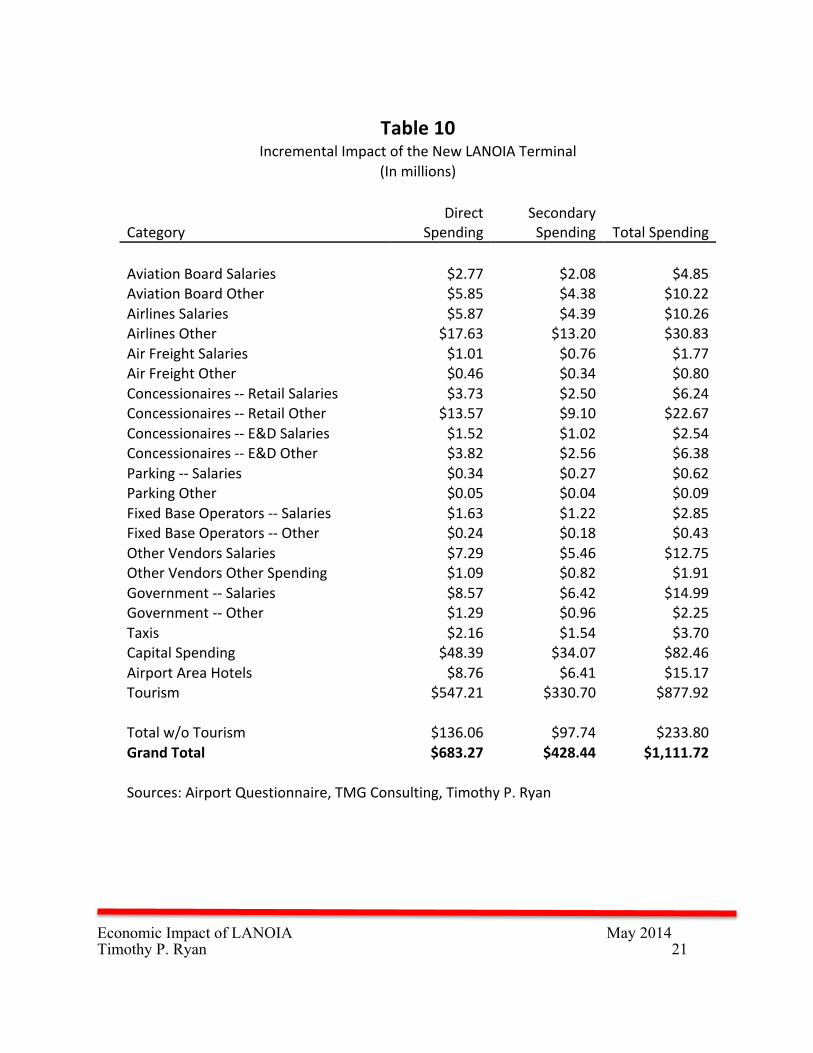
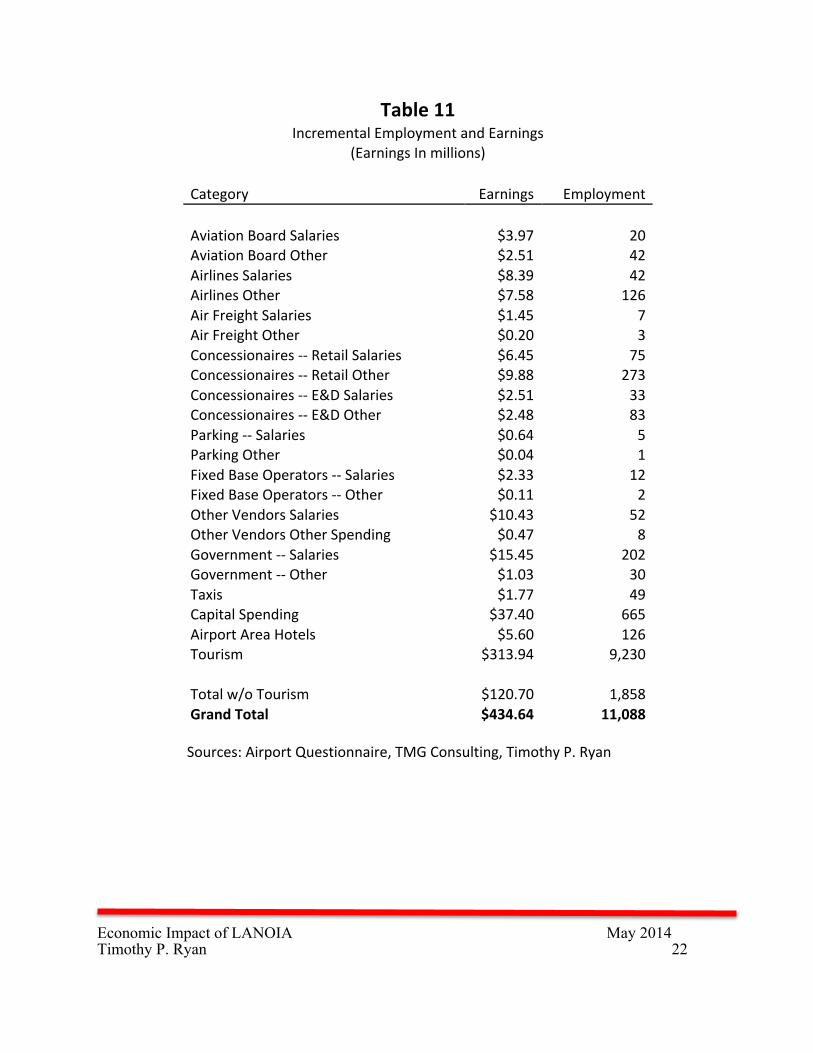
one-half of the goal will be achieved. That means that this study assumes the impact of the new promotion efforts will increase visitation by 2.345 million visitors. Using the 2012 data for the number of visitors who fly into New Orleans, the total number of new enplanements created by the new tourism initiatives is 1.086 million. Subtracting that from the 784,933 projected from lower CPE, the net addition in enplanements due to the increased tourism marketing is 300,802. Adding this to the projected number of new enplanements created by the lower CPE, the total expected increase in enplanements is 1.086 million – 235,480 of which are transfer passengers and 850,255 are new travelers to New Orleans. New On-Property Airport Hotel The new construction program envisioned by the Airport includes a new on-property airport hotel. The current proposal calls for a 250 hotel that can serve general travelers as well as host small conventions and corporate meeting that prefer an Airport site. It can also serve travelers who will increasingly use New Orleans as a transfer airport. With the increases in passengers envisioned in this report, the new on-property hotel will serve to increase the overall size of the market and not attract customers from existing hotels. The assumptions used in this report are 250 rooms, an average daily room rate of $120, and an average occupancy rate of 80%, which is consistent with the local market and with airport hotels. Increased Air Cargo The new facilities to be built under the new terminal project include additional facilities for air cargo. Air cargo is expected to increase as the number of commercial flights increases but new facilities should attract additional air cargo operations also. The assumption is that the new facilities will increase air cargo activities by an additional 15% on top of the impact of additional flights. Increased Fixed Base Operations As in the case of air cargo, the new facilities to be built under the new terminal project include additional facilities for fixed base operations. These new facilities will encourage more private aircraft operations. The assumption is that the new facilities will increase private aircraft activities by 20%. Tables 10, 11, and 12 provide estimates of the additional economic impact of the proposed new terminal and related facilities. Note that the figures estimated in these Tables are only incremental impact from 2013 to 2023, not the total 2023 impact. Tables 13 through 15 present the total impact in 2013.
Economic Impact of LANOIA May 2014 Timothy P. Ryan 21
The Economic Impact
Table 10
Incremental Impact of the New LANOIA Terminal (In millions)
Category
Direct Spending
Secondary Spending Total Spending
Aviation Board Salaries $2.77 $2.08 $4.85 Aviation Board Other $5.85 $4.38 $10.22 Airlines Salaries $5.87 $4.39 $10.26 Airlines Other $17.63 $13.20 $30.83 Air Freight Salaries $1.01 $0.76 $1.77 Air Freight Other $0.46 $0.34 $0.80 Concessionaires -‐-‐ Retail Salaries $3.73 $2.50 $6.24 Concessionaires -‐-‐ Retail Other $13.57 $9.10 $22.67 Concessionaires -‐-‐ E&D Salaries $1.52 $1.02 $2.54 Concessionaires -‐-‐ E&D Other $3.82 $2.56 $6.38 Parking -‐-‐ Salaries $0.34 $0.27 $0.62 Parking Other $0.05 $0.04 $0.09 Fixed Base Operators -‐-‐ Salaries $1.63 $1.22 $2.85 Fixed Base Operators -‐-‐ Other $0.24 $0.18 $0.43 Other Vendors Salaries $7.29 $5.46 $12.75 Other Vendors Other Spending $1.09 $0.82 $1.91 Government -‐-‐ Salaries $8.57 $6.42 $14.99 Government -‐-‐ Other $1.29 $0.96 $2.25 Taxis $2.16 $1.54 $3.70 Capital Spending $48.39 $34.07 $82.46 Airport Area Hotels $8.76 $6.41 $15.17 Tourism $547.21 $330.70 $877.92
Total w/o Tourism $136.06 $97.74 $233.80 Grand Total $683.27 $428.44 $1,111.72
Sources: Airport Questionnaire, TMG Consulting, Timothy P. Ryan
Economic Impact of LANOIA May 2014 Timothy P. Ryan 22
The Economic Impact
Table 11 Incremental Employment and Earnings
(Earnings In millions)
Category Earnings Employment
Aviation Board Salaries $3.97 20 Aviation Board Other $2.51 42 Airlines Salaries $8.39 42 Airlines Other $7.58 126 Air Freight Salaries $1.45 7 Air Freight Other $0.20 3 Concessionaires -‐-‐ Retail Salaries $6.45 75 Concessionaires -‐-‐ Retail Other $9.88 273 Concessionaires -‐-‐ E&D Salaries $2.51 33 Concessionaires -‐-‐ E&D Other $2.48 83 Parking -‐-‐ Salaries $0.64 5 Parking Other $0.04 1 Fixed Base Operators -‐-‐ Salaries $2.33 12 Fixed Base Operators -‐-‐ Other $0.11 2 Other Vendors Salaries $10.43 52 Other Vendors Other Spending $0.47 8 Government -‐-‐ Salaries $15.45 202 Government -‐-‐ Other $1.03 30 Taxis $1.77 49 Capital Spending $37.40 665 Airport Area Hotels $5.60 126 Tourism $313.94 9,230
Total w/o Tourism $120.70 1,858 Grand Total $434.64 11,088
Sources: Airport Questionnaire, TMG Consulting, Timothy P. Ryan
Economic Impact of LANOIA May 2014 Timothy P. Ryan 23
The Economic Impact
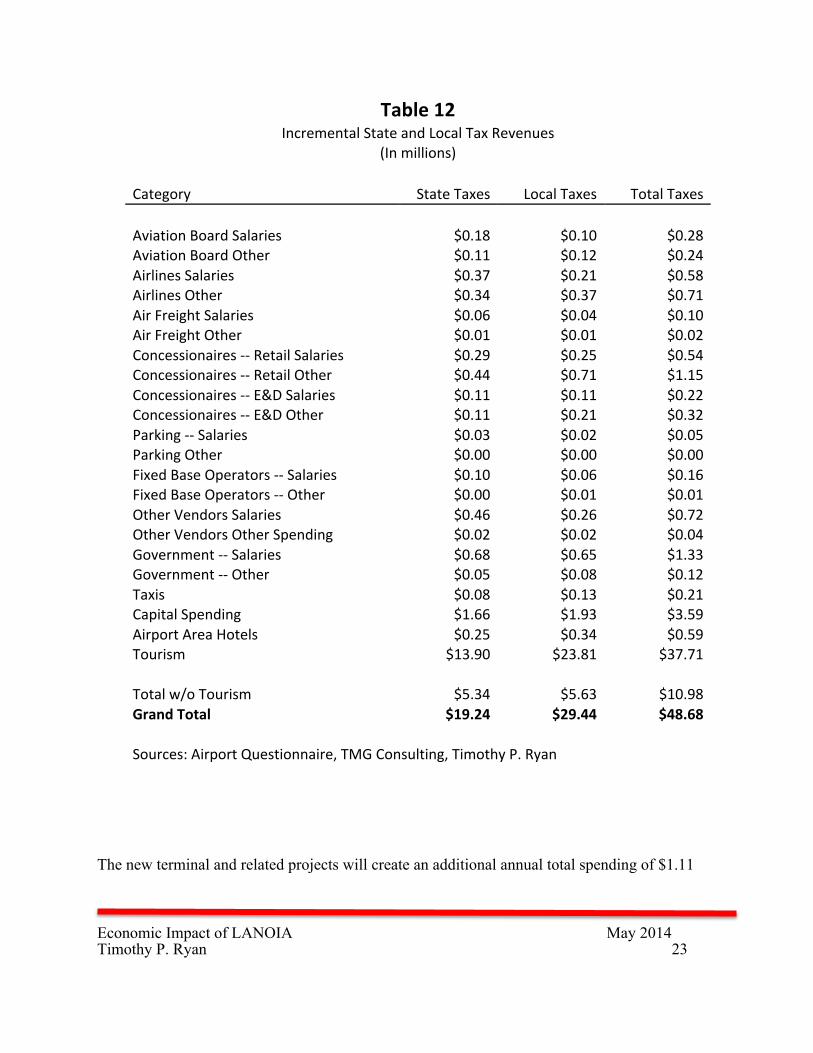
Table 12 Incremental State and Local Tax Revenues
(In millions)
Category State Taxes Local Taxes Total Taxes
Aviation Board Salaries $0.18 $0.10 $0.28 Aviation Board Other $0.11 $0.12 $0.24 Airlines Salaries $0.37 $0.21 $0.58 Airlines Other $0.34 $0.37 $0.71 Air Freight Salaries $0.06 $0.04 $0.10 Air Freight Other $0.01 $0.01 $0.02 Concessionaires -‐-‐ Retail Salaries $0.29 $0.25 $0.54 Concessionaires -‐-‐ Retail Other $0.44 $0.71 $1.15 Concessionaires -‐-‐ E&D Salaries $0.11 $0.11 $0.22 Concessionaires -‐-‐ E&D Other $0.11 $0.21 $0.32 Parking -‐-‐ Salaries $0.03 $0.02 $0.05 Parking Other $0.00 $0.00 $0.00 Fixed Base Operators -‐-‐ Salaries $0.10 $0.06 $0.16 Fixed Base Operators -‐-‐ Other $0.00 $0.01 $0.01 Other Vendors Salaries $0.46 $0.26 $0.72 Other Vendors Other Spending $0.02 $0.02 $0.04 Government -‐-‐ Salaries $0.68 $0.65 $1.33 Government -‐-‐ Other $0.05 $0.08 $0.12 Taxis $0.08 $0.13 $0.21 Capital Spending $1.66 $1.93 $3.59 Airport Area Hotels $0.25 $0.34 $0.59 Tourism $13.90 $23.81 $37.71
Total w/o Tourism $5.34 $5.63 $10.98 Grand Total $19.24 $29.44 $48.68
Sources: Airport Questionnaire, TMG Consulting, Timothy P. Ryan The new terminal and related projects will create an additional annual total spending of $1.11
Economic Impact of LANOIA May 2014 Timothy P. Ryan 24
The Economic Impact
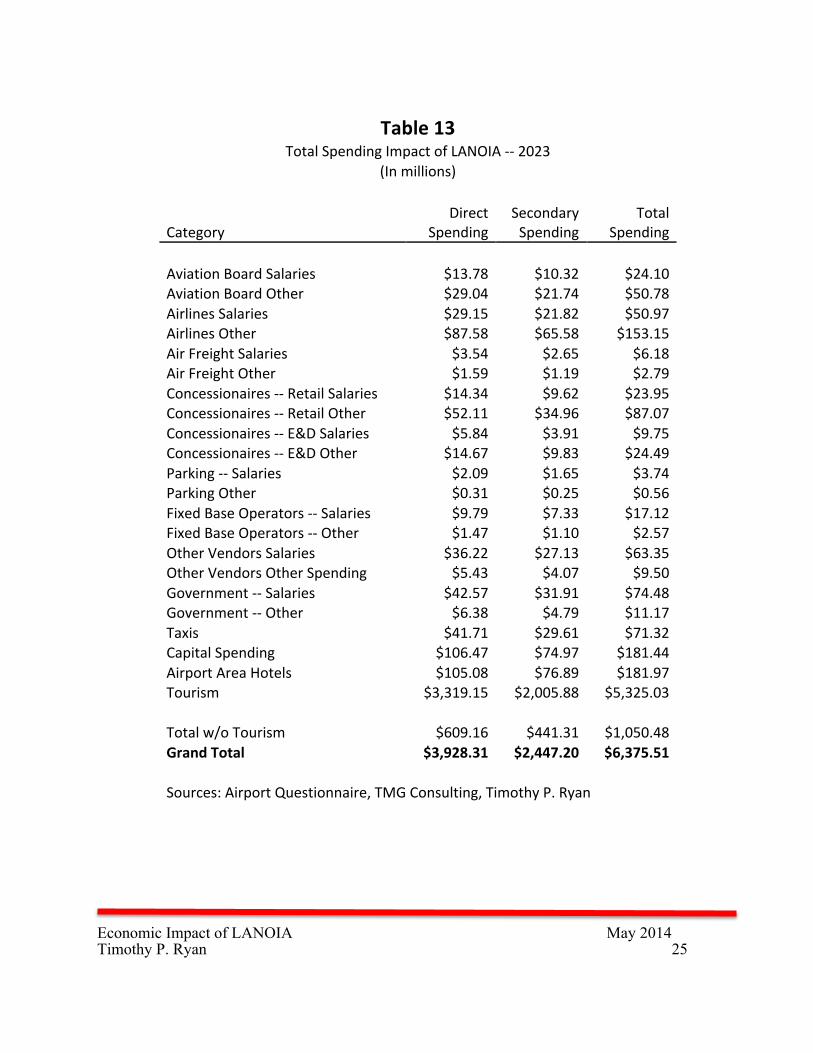
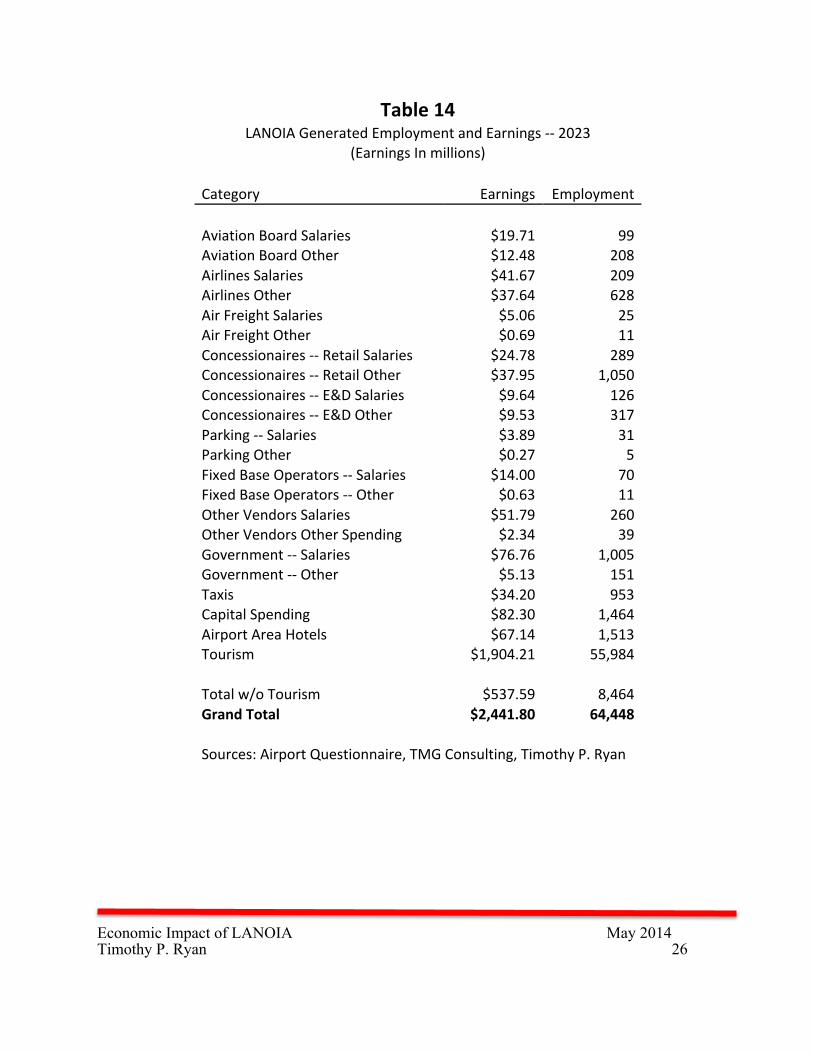
billion in the local economy. Based on the 2013 impact estimated in this report, the new terminal will create an annual 21.1% increase in the current level of spending. In addition, the new terminal will create $434.64 million in new earnings annually and support 11,088 new jobs in the metro area. The new terminal will create annual new revenue of $19.24 million for the State of Louisiana and $29.44 million of local governments in the New Orleans area. Tables 13 through 15 present the total project economic impact of Louis Armstrong New Orleans International Airport in 2023, after the new terminal is operating and the existing bond debt is retired.
Economic Impact of LANOIA May 2014 Timothy P. Ryan 25
The Economic Impact
Table 13
Total Spending Impact of LANOIA -‐-‐ 2023 (In millions)
Category
Direct Spending
Secondary Spending
Total Spending
Aviation Board Salaries $13.78 $10.32 $24.10 Aviation Board Other $29.04 $21.74 $50.78 Airlines Salaries $29.15 $21.82 $50.97 Airlines Other $87.58 $65.58 $153.15 Air Freight Salaries $3.54 $2.65 $6.18 Air Freight Other $1.59 $1.19 $2.79 Concessionaires -‐-‐ Retail Salaries $14.34 $9.62 $23.95 Concessionaires -‐-‐ Retail Other $52.11 $34.96 $87.07 Concessionaires -‐-‐ E&D Salaries $5.84 $3.91 $9.75 Concessionaires -‐-‐ E&D Other $14.67 $9.83 $24.49 Parking -‐-‐ Salaries $2.09 $1.65 $3.74 Parking Other $0.31 $0.25 $0.56 Fixed Base Operators -‐-‐ Salaries $9.79 $7.33 $17.12 Fixed Base Operators -‐-‐ Other $1.47 $1.10 $2.57 Other Vendors Salaries $36.22 $27.13 $63.35 Other Vendors Other Spending $5.43 $4.07 $9.50 Government -‐-‐ Salaries $42.57 $31.91 $74.48 Government -‐-‐ Other $6.38 $4.79 $11.17 Taxis $41.71 $29.61 $71.32 Capital Spending $106.47 $74.97 $181.44 Airport Area Hotels $105.08 $76.89 $181.97 Tourism $3,319.15 $2,005.88 $5,325.03
Total w/o Tourism $609.16 $441.31 $1,050.48 Grand Total $3,928.31 $2,447.20 $6,375.51
Sources: Airport Questionnaire, TMG Consulting, Timothy P. Ryan
Economic Impact of LANOIA May 2014 Timothy P. Ryan 26
The Economic Impact
Table 14 LANOIA Generated Employment and Earnings -‐-‐ 2023
(Earnings In millions)
Category Earnings Employment
Aviation Board Salaries $19.71 99 Aviation Board Other $12.48 208 Airlines Salaries $41.67 209 Airlines Other $37.64 628 Air Freight Salaries $5.06 25 Air Freight Other $0.69 11 Concessionaires -‐-‐ Retail Salaries $24.78 289 Concessionaires -‐-‐ Retail Other $37.95 1,050 Concessionaires -‐-‐ E&D Salaries $9.64 126 Concessionaires -‐-‐ E&D Other $9.53 317 Parking -‐-‐ Salaries $3.89 31 Parking Other $0.27 5 Fixed Base Operators -‐-‐ Salaries $14.00 70 Fixed Base Operators -‐-‐ Other $0.63 11 Other Vendors Salaries $51.79 260 Other Vendors Other Spending $2.34 39 Government -‐-‐ Salaries $76.76 1,005 Government -‐-‐ Other $5.13 151 Taxis $34.20 953 Capital Spending $82.30 1,464 Airport Area Hotels $67.14 1,513 Tourism $1,904.21 55,984
Total w/o Tourism $537.59 8,464 Grand Total $2,441.80 64,448
Sources: Airport Questionnaire, TMG Consulting, Timothy P. Ryan
Economic Impact of LANOIA May 2014 Timothy P. Ryan 27
The Economic Impact
Table 15 LANOIA Created State and Local Tax Revenues -‐-‐ 2023
(In millions)
Category
State Taxes
Local Taxes
Total Taxes
Aviation Board Salaries $0.87 $0.49 $1.37 Aviation Board Other $0.55 $0.62 $1.17 Airlines Salaries $1.84 $1.04 $2.89 Airlines Other $1.67 $1.86 $3.52 Air Freight Salaries $0.22 $0.13 $0.35 Air Freight Other $0.03 $0.03 $0.06 Concessionaires -‐-‐ Retail Salaries $1.10 $0.96 $2.06 Concessionaires -‐-‐ Retail Other $1.68 $2.74 $4.42 Concessionaires -‐-‐ E&D Salaries $0.43 $0.40 $0.83 Concessionaires -‐-‐ E&D Other $0.42 $0.80 $1.22 Parking -‐-‐ Salaries $0.17 $0.12 $0.29 Parking Other $0.01 $0.01 $0.03 Fixed Base Operators -‐-‐ Salaries $0.62 $0.35 $0.97 Fixed Base Operators -‐-‐ Other $0.03 $0.03 $0.06 Other Vendors Salaries $2.29 $1.30 $3.59 Other Vendors Other Spending $0.10 $0.12 $0.22 Government -‐-‐ Salaries $3.40 $3.21 $6.61 Government -‐-‐ Other $0.23 $0.39 $0.62 Taxis $1.51 $2.48 $4.00 Capital Spending $3.64 $4.25 $7.90 Airport Area Hotels $8.75 $4.20 $12.95 Tourism $195.17 $283.01 $478.18
Total w/o Tourism $29.58 $25.55 $55.13 Grand Total $224.75 $308.56 $533.31
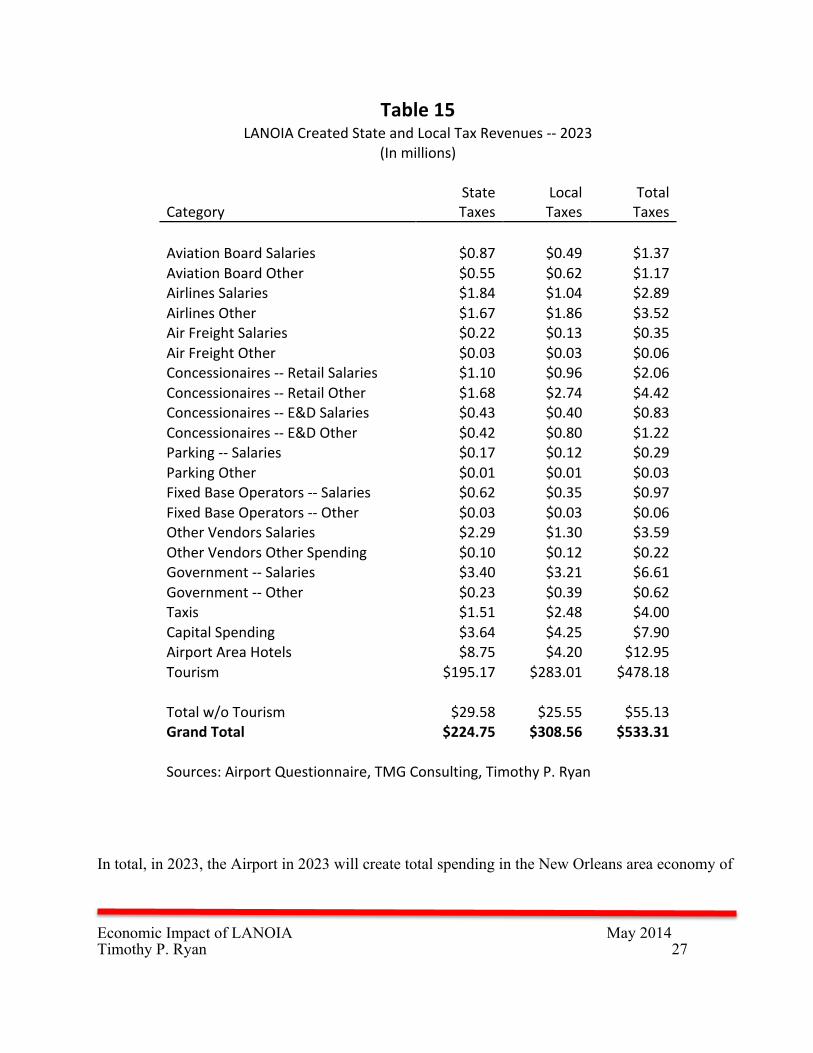
Sources: Airport Questionnaire, TMG Consulting, Timothy P. Ryan In total, in 2023, the Airport in 2023 will create total spending in the New Orleans area economy of
Economic Impact of LANOIA May 2014 Timothy P. Ryan 28
The Economic Impact
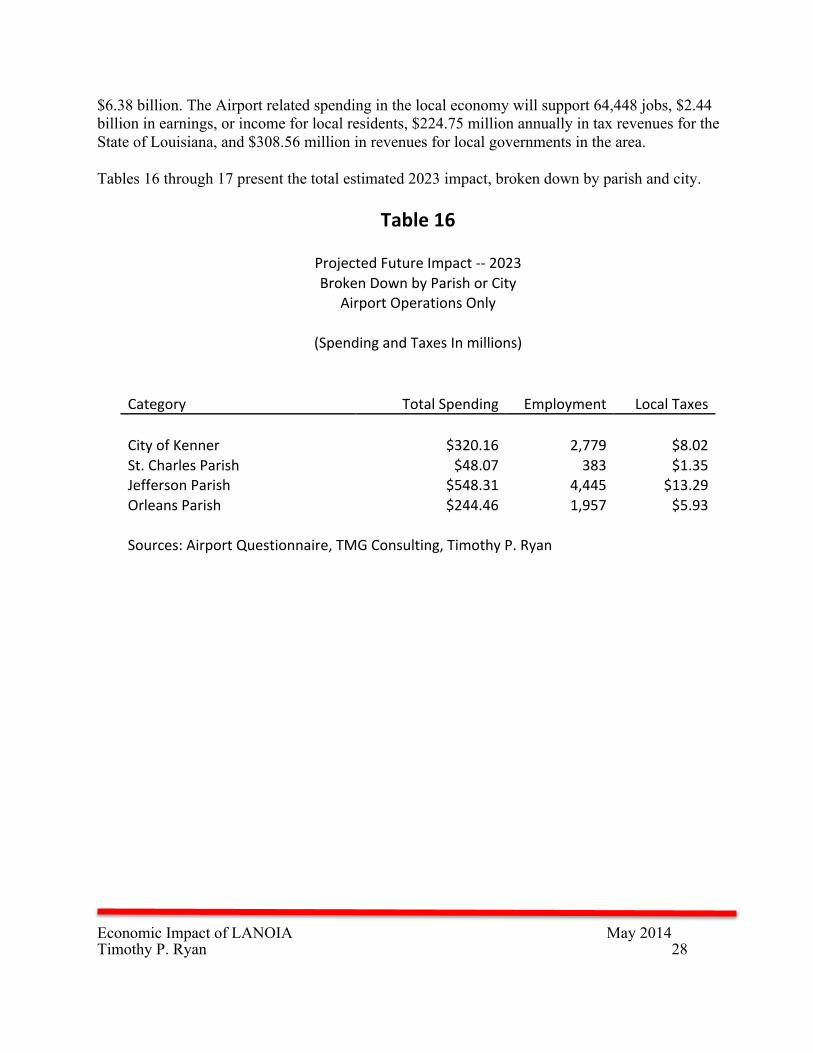
$6.38 billion. The Airport related spending in the local economy will support 64,448 jobs, $2.44 billion in earnings, or income for local residents, $224.75 million annually in tax revenues for the State of Louisiana, and $308.56 million in revenues for local governments in the area. Tables 16 through 17 present the total estimated 2023 impact, broken down by parish and city.
Table 16
Projected Future Impact -‐-‐ 2023 Broken Down by Parish or City
Airport Operations Only
(Spending and Taxes In millions)
Category Total Spending Employment Local Taxes
City of Kenner $320.16 2,779 $8.02 St. Charles Parish $48.07 383 $1.35 Jefferson Parish $548.31 4,445 $13.29 Orleans Parish $244.46 1,957 $5.93
Sources: Airport Questionnaire, TMG Consulting, Timothy P. Ryan
Economic Impact of LANOIA May 2014 Timothy P. Ryan 29
The Economic Impact
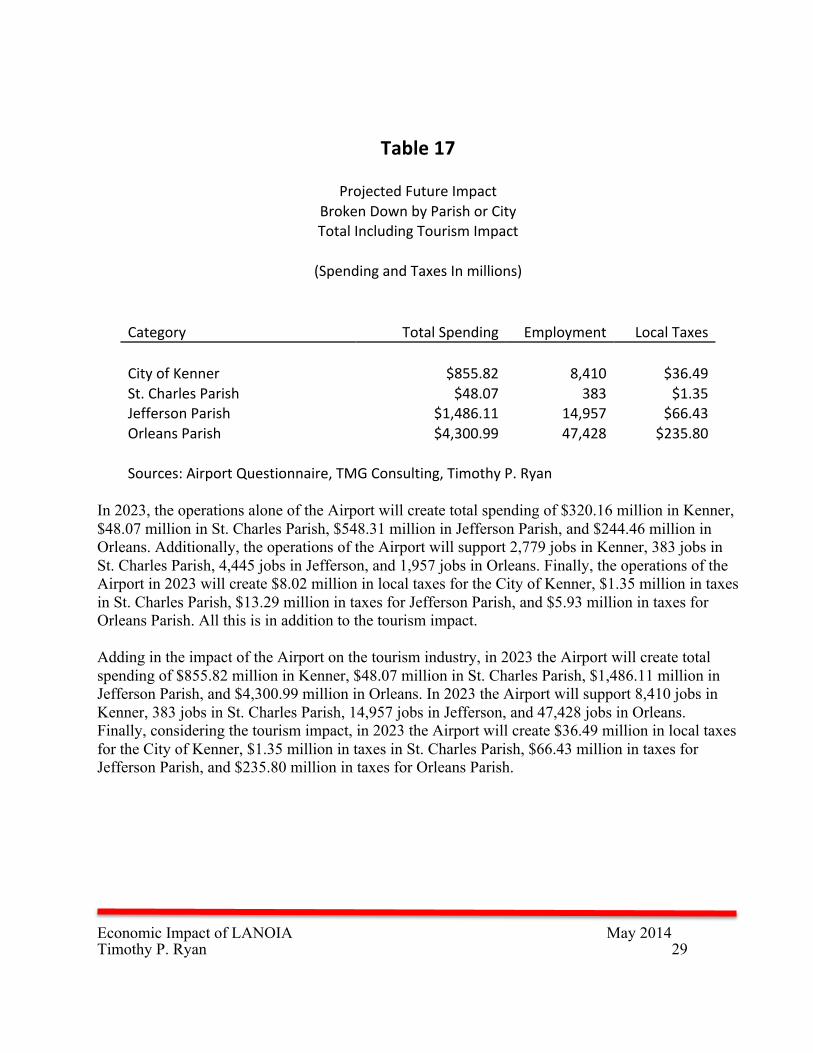
Table 17
Projected Future Impact Broken Down by Parish or City Total Including Tourism Impact
(Spending and Taxes In millions)
Category Total Spending Employment Local Taxes
City of Kenner $855.82 8,410 $36.49 St. Charles Parish $48.07 383 $1.35 Jefferson Parish $1,486.11 14,957 $66.43 Orleans Parish $4,300.99 47,428 $235.80
Sources: Airport Questionnaire, TMG Consulting, Timothy P. Ryan In 2023, the operations alone of the Airport will create total spending of $320.16 million in Kenner, $48.07 million in St. Charles Parish, $548.31 million in Jefferson Parish, and $244.46 million in Orleans. Additionally, the operations of the Airport will support 2,779 jobs in Kenner, 383 jobs in St. Charles Parish, 4,445 jobs in Jefferson, and 1,957 jobs in Orleans. Finally, the operations of the Airport in 2023 will create $8.02 million in local taxes for the City of Kenner, $1.35 million in taxes in St. Charles Parish, $13.29 million in taxes for Jefferson Parish, and $5.93 million in taxes for Orleans Parish. All this is in addition to the tourism impact. Adding in the impact of the Airport on the tourism industry, in 2023 the Airport will create total spending of $855.82 million in Kenner, $48.07 million in St. Charles Parish, $1,486.11 million in Jefferson Parish, and $4,300.99 million in Orleans. In 2023 the Airport will support 8,410 jobs in Kenner, 383 jobs in St. Charles Parish, 14,957 jobs in Jefferson, and 47,428 jobs in Orleans. Finally, considering the tourism impact, in 2023 the Airport will create $36.49 million in local taxes for the City of Kenner, $1.35 million in taxes in St. Charles Parish, $66.43 million in taxes for Jefferson Parish, and $235.80 million in taxes for Orleans Parish.
Economic Impact of LANOIA May 2014 Timothy P. Ryan 30
The Economic Impact
CONCLUSION The Louis Armstrong New Orleans International Airport is a very important part of the New Orleans area economy and is crucial to the economies of the City of Kenner and St. Charles Parish as well as Orleans and Jefferson. Not only does the Airport serve as the gateway to the City for the local tourism industry, but also it is important in its own right. It is a very significant part of the New Orleans area economy; generating a significant economic impact, supporting jobs, and creating income or earnings for local residents. There is every reason to believe that the overall spending related to the Airport will increase substantially in the future because of increased Airport construction of a new terminal and related improvements, the growth of the local tourism industry as supported for the master plan for tourism, and increased air service activities for New Orleans. As air cargo facilities are being expanded, many firms are seeking locations in Kenner and St. Charles Parish. All of which will make the Airport even more valuable to the New Orleans, Kenner and St. Charles economies.