the eastern washington intermodal transportation...
TRANSCRIPT

The Eastern Washington Intermodal Transportation Study
Final Report June 1999
by
Kenneth L. Casavant, EWITS Project Director Washington State University
Department of Agricultural Economics 101 Hulbert Hall
Pullman, WA 99164-6210

EWITS Research Reports: Background and Purpose
This report is a summary of a series of reports prepared from the Eastern Washington Intermodal Transportation Study (EWITS). The reports prepared as a part of this study provide information to help shape the multimodal network necessary for the efficient movement of both freight and people into the next century. EWITS is a six-year study funded jointly by the Federal government and the Washington State Department of Transportation as a part of the Intermodal Surface Transportation Efficiency Act of 1991. Dr. Ken Casavant of Washington State University is Director of the study. A state-level Steering Committee provides overall direction pertaining to the design and implementation of the project. The Steering Committee includes Jerry Lenzi, Regional Administrator (WSDOT, Eastern Region); Leonard Pittman (WSDOT, South Central Region); Don Senn (WSDOT, North Central Region); Charles Howard (WSDOT, Planning Manager); and Jay Weber (County Road Administration Board). Tom Green represents the Washington State Transportation Commission on the Steering Committee. An Advisory Committee with representation from a broad range of transportation interest groups also provides guidance to the study. The following are key goals and objectives for the Eastern Washington Intermodal Transportation Study: Facilitate existing regional and statewide transportation planning efforts.
Forecast future freight and passenger transportation service needs for eastern
Washington. Identify gaps in eastern Washington’s current transportation infrastructure.
Pinpoint transportation system improvement options critical to economic
competitiveness and mobility within eastern Washington. For additional information about the Eastern Washington Intermodal Transportation Study or this report, please contact Ken Casavant at the following address:
Ken Casavant, Project Director Department of Agricultural Economics
Washington State University Pullman, WA 99164-6210
(509) 335-1608

DISCLAIMER The contents of this report reflect the views of the authors who are responsible for the facts and accuracy of the data presented herein. The contents do not necessarily reflect the official views nor policies of the Washington State Department of Transportation or the Federal Highway Administration. This report does not constitute a standard, specification, or regulation.
EWITS REPORTS NOW AVAILABLE
1. Gillis, William R. and Kenneth L. Casavant. “Linking Transportation System Improvements to New Business Development in Eastern Washington.” EWITS Research Report Number 1. February 1994.
2. Gillis, William R. and Kenneth L. Casavant. “Lessons from Eastern
Washington: State Route Mainstreets, Bypass Routes, and Economic Development in Small Towns.” EWITS Research Report Number 2. February 1994.
3. Gillis, William R. and Kenneth L. Casavant. “Washington State Freight Truck
Origin and Destination Study: Methods, Procedures, and Data Dictionary.” EWITS Research Report Number 3. December 1994.
4. Gillis, William R. and Kenneth L. Casavant. “Major Generators of Traffic on
U.S. 395 North of Spokane: Including Freight Trucks and Passenger Vehicles Crossing the International Border.” EWITS Research Report Number 4. January 1995.
5. Newkirk, Jonathan, Ken Eriksen, and Kenneth L. Casavant. “Transportation
Characteristics of Wheat and Barley Shipments on Haul Roads To and From Elevators in Eastern Washington.” EWITS Research Report Number 5. March 1995.
6. Jessup, Eric and Kenneth L. Casavant. “A Quantitative Estimate of Eastern
Washington Annual Haul Road Needs for Wheat and Barley Movement.” EWITS Research Report Number 6. March 1995.
7. Gillis, William R., Emily Gruss Gillis, and Kenneth L. Casavant. “Transportation
Needs of Eastern Washington Fruit, Vegetable, and Hay Industries.” EWITS Research Report Number 7. March 1995.
8. Casavant, Kenneth L. and William R. Gillis. “Importance of U.S. 395 Corridor
for Local and Regional Commerce in South Central Washington.” EWITS Research Report Number 8. April 1995.

9. Gillis, William R., Eric L. Jessup, and Kenneth L. Casavant. “Movement of Freight on Washington’s Highways: A Statewide Origin and Destination Study.” EWITS Report Number 9, November 1995.
10. Chase, Robert A. and Kenneth L. Casavant. “Eastern Washington Transport-Oriented Input-Output Study: Technical Report.” EWITS Research Report Number 10. March 1996.
11. Chase, Robert A. and Kenneth L. Casavant. “The Economic Contribution of
Transport Industries to Eastern Washington.” EWITS Research Report Number 11. April 1996.
12. Lee, Nancy S. and Kenneth L. Casavant. “Waterborne Commerce on the
Columbia-Snake River System.” EWITS Research Report Number 12. October 1996.
13. Alderson, Lynn C., Kenneth L. Casavant, and Eric Jessup. “Transportation
Characteristics and Needs of Forest Products Industries Using Eastern Washington Highways: Part 1 Economic Structure of the Industry.” EWITS Research Report Number 13. January 1997.
14. Eriksen, Ken and Kenneth L. Casavant. “Impact of North American Free Trade
Agreement (NAFTA) on Washington Highways - Part 1: Commodity and Corridor Projections.” EWITS Research Report Number 14. January 1997.
15. Alderson, Lynn C. and Kenneth L. Casavant. “Transportation Characteristics
and Needs of Forest Products Industries Using Eastern Washington Highways: Part 2 Movement of Raw Logs.” EWITS Research Report Number 15. February 1997.
16. Alderson, Lynn C. and Kenneth L. Casavant. “Transportation Characteristics
and Needs of Forest Products Industries Using Eastern Washington Highways: Part 3 Shipment from Mills.” EWITS Research Report Number 16. May 1997.
17. Alderson, Lynn C. and Kenneth L. Casavant. “Transportation Characteristics
and Needs of Forest Products Industries Using Eastern Washington Highways: Part 4 Commercial Shipments.” EWITS Research Report Number 17. May 1997.
18. Jessup, Eric L., John Ellis, and Kenneth L. Casavant. “A GIS Commodity Flow
Model for Transportation Policy Analysis: A Case Study of the Impacts of a Snake River Drawdown.” EWITS Research Report Number 18. May 1997.
19. Lee, Nancy S. and Kenneth L. Casavant. “Rail Traffic in Washington: A
Commodity and Origin-Destination Analysis, 1990 to 1995." EWITS Research Report Number 19. December 1997.

20. Edwards, Richard, Eric L. Jessup, and Kenneth L. Casavant. “Eastern Washington On-Farm and Commercial Grain Storage.” EWITS Research Report Number 20. January 1998.
21. Painter, Kathleen M. and Kenneth L. Casavant. “Washington State Freight
Truck Origin and Destination Study: [County Series].” EWITS Research Report Number 21. January 1998.
22. Alderson, Lynn C. and R. Douglas Scott III. “Transportation Characteristics
and Needs of Forest Products Industries Using Eastern Washington Highways Part 5: Road Usage and Characteristics.” EWITS Research Report Number 22. April 1998.
23. Lee, Nancy S. and Ken Casavant. “Impacts of a Snake River Drawdown on
Energy Consumption and Environmental Emissions in Transporting Eastern Washington Wheat and Barley.” EWITS Research Report Number 23. March 1998.
24. Jessup, Eric L. and Kenneth L. Casavant. "Impact of Snake River Drawdown
on Transportation of Grains in Eastern Washington: Competitive and Rail Car Constraints." EWITS Research Report Number 24. March 1999.
25. Eriksen, Ken and Kenneth L. Casavant. "Impact of North American Free Trade
Agreement (NAFTA) on Washington Highways, Part II: Highway Damage by Corridor." EWITS Research Report Number 25. May 1998.

EWITS WORKING PAPER SERIES NOW AVAILABLE
1. Lee, Nancy and Ken Casavant. “Grain Receipts at Columbia River Grain Terminals.” EWITS Working Paper #1, March 1996.
2. Lenzi, Jerry, Eric Jessup, and Ken Casavant. “Prospective Estimates for Road
Impacts in Eastern Washington from a Drawdown of the Lower Snake River.” EWITS Working Paper #2, March 1996.
3. Ellis, John, Eric Jessup, and Ken Casavant. “Modeling Changes in Grain
Transportation Flows in Response to Proposed Snake River Drawdowns: A Case Study for Eastern Washington.” EWITS Working Paper #3, March 1996.
4. Painter, Kate and Ken Casavant. “A Comparison of Canadian Versus All Truck
Movements in Washington State with a Special Emphasis on Grain Truck Movements.” EWITS Working Paper #4, March 1996.
5. Jessup, Eric L. and John Ellis. “Estimating the Value of Rail Car Accessibility
for Grain Shipments: A GIS Approach.” EWITS Working Paper #5, April 1996. 6. Painter, Kathleen M. “Truck Movement Characteristics on Selected Truck
Routes in Washington State.” EWITS Working Paper #6, August 1996. 7. Lee, Nancy S. and Kenneth L. Casavant. “Grain Receipts at Columbia River
Grain Terminals, 1980-81 to 1995-96.” EWITS Working Paper #7. January 1997.
8. Jessup, Eric L. and Kenneth L. Casavant. “Economic Evaluation of Grain
Shipment Alternatives: A Case Study of the Coulee City and Palouse River Railroad.” EWITS Working Paper #8. March 1997.
9. Casavant, Ken and Nancy S. Lee. “Grain Receipts at Columbia River Grain
Terminals: 1980-81 to 1996-97." EWITS Working Paper #9. January 1998. 10. Lenzi, Jerry C. and Kenneth L. Casavant. “Preliminary Observations of
Mobility Issues, Concerns, and Efforts in Europe and the United States.” EWITS Working Paper #10. October 1998.
11. Casavant, Ken and Nancy S. Lee. “Grain Receipts at Columbia River Grain
Terminals, 1980-81 to 1997-98.” EWITS Working Paper #11. January 1999.

Table of Contents Introduction ................................................................................................................... 1 EWITS Research Reports and Working Papers Summaries ..................................... 5 Case Studies................................................................................................................ 42 Case Study #1: Commodity Freight Movements on Washington Highways...... 43 Case Study #2: The Link Between Transportation Systems and Regional Economic Development ...................................................................... 47 Case Study #3: Snake River Drawdowns: Implications for the Eastern Washington Transportation System ................................................................... 50 Annotated Summary of EWITS Forum Meeting ........................................................ 56 Appendix A: Acronyms.............................................................................................. 77 Appendix B: Overheads from EWITS Forum Presentations................................... 79 Appendix C: Complete Transcript from EWITS Forum Meeting........................... 121
List of Tables Table 1 Cargo Content for Truck Trips Originating in Eastern Washington ............... 44 Table 2 Cargo Content for Truck Trips Originating in Western Washington .............. 44 Table 3 Percent of Total Trucks Carrying Selected Commodities on Major Washington Freight Corridors............................................................. 44 Table 4 Truck Trips by Selected Commodity for Truck Traffic Originating or Ending in Each County ................................................................................. 46 Table 5 Summary of Total Transportation Costs for Wheat and Barley..................... 52 Table 6 Summary of Infrastructure Needs for Wheat and Barley .............................. 55

Introduction The geography of Washington State has provided it with unique economic advantages. It is, at the same time, a coastal state, an international border, and a source of abundant natural resources including timber, minerals, land for agricultural production, and water for hydroelectric power. The Columbia River March 22, 1999 contains one-third of the potential hydroelectric power generation in the U.S. Because of the ample supply of electricity, the state is a major producer of aluminum. Over 4,800,000 acres of field crops and 193,000 acres of vegetables were harvested in 1996, with production valued at over $2.3 billion. In 1996, the production value of fruits and nuts was over $1.2 billion. Forty percent of the total timberland area in the Pacific Northwest (almost 17 million acres) is located in the state. The success of all these enterprises is highly dependent upon an efficient transportation system that connects state produced commodities with their respective markets. The dependence on transportation is significant for the 20 counties that make up eastern Washington. A vital agricultural production area including grains, fruits, and vegetables; as well as livestock and forest products, these industries of the region must have access to markets outside of the state to survive. The current transportation system in eastern Washington is comprised of four primary modes: water, railroad, roadway, and air transport. The Columbia-Snake River system links ports all the way to Douglas County in the north, and the Port of Lewiston to the east, and provides access to the Pacific Ocean. Each of the above mentioned ports constitute 465 river miles from the mouth of the Columbia River. With regards to the rail freight system, the region contains over 2,300 miles of rail with service provided by 13 common carriers that includes three types of intermodal connections involving rail: ports, road terminals, and shipper connections (e.g. grain elevators). Also, there are 44,903 miles of roads in eastern Washington including interstate, U.S. highways, as well as state, county, city, and tribal roads. Airports in the region, particularly Yakima and Moses Lake, are expanding to accommodate foreign freight traffic. Each of the four modes are used in combinations that promote efficient transport of goods and services in and out of the region. The transportation system is inherently dynamic and constantly changing. However, several important trends are affecting the structure and the safe use of the transportation system in eastern Washington. First, the population of the region is steadily increasing. Population growth in eastern Washington has been gradually increasing since 1987 reaching a peak growth rate of 2.7 percent in 1993 and dropping to a 2.2 percent growth rate in 1995. This growth rate exceeds the population growth rate of western Washington, which was 1.7 percent in 1995. Approximately 22 percent of the state's population now resides in eastern Washington. Analysis of this trend has revealed population growth in less populated, rural areas on both sides of the Cascades. Population growth of this magnitude increases pressure on the transportation infrastructure as the level of passenger traffic increases. Population growth also increases the region’s demand for imports from other markets outside of the state.
1

Another important economic change comes from the North American Free Trade Agreement (NAFTA). With the implementation of NAFTA, the transportation of freight throughout Washington is changing and will continue to change. The volume of traffic on the major transportation corridors in the state are being affected with more routes becoming important links to goods and services that are imported or exported. Increasing concerns for environmental protection in the Pacific Northwest will also have profound effects on the transportation system. The listing of Chinook and sockeye salmon for protection under the federal Endangered Species Act and the policies to mitigate these declining populations will require changes in the management of the Columbia-Snake River transportation system and may impact the use of water transport. Areas of the Columbia River, such as the Hanford Reach, are also being considered for designation as a ‘wild and scenic river’ by the federal government. Local, state, and regional transportation planners must contend with these changes and formulate plans to meet these new dynamics. However, there has not been a comprehensive assessment of the transportation system in eastern Washington, the demands placed on it, and its role in contributing to the economic development of the region. To meet the information needs of area planners, the eastern Washington Intermodal Transportation Study (EWITS) was initiated in 1992. EWITS is a six-year planning study funded through the federal Intermodal Surface Transportation Efficiency Act (ISTEA) to define the multimodal network, including roads, rail, and water transport that is needed for the efficient movement of both freight and people throughout eastern Washington. All counties that lie to the east of the Cascade Mountains are included in the study. The implementation of the Washington State Freight Truck Origin and Destination Study also collected information on freight truck movements for all western Washington counties. The study has four broad objectives:
1) Forecast future freight and passenger transportation service needs for eastern Washington.
2) Identify gaps in eastern Washington’s current transportation infrastructure.
3) Pinpoint transportation system improvement options critical to economic
competitiveness and mobility within eastern Washington.
4) Facilitate existing regional and statewide transportation planning efforts. Objectives 1, 2, and 3 involve multifaceted tasks. For objective 1, major tasks to be accomplished include: (1) preparing base maps depicting primary freight and passenger generators for eastern Washington and individual counties, (2) documenting freight movements on eastern Washington highways, rails, and waterways, (3) forecasting transportation needs of key eastern Washington industries, and (4) forecasting the need for expanded community transit systems in eastern Washington.
2

Objective 2 involves evaluating the capacity of the current transportation system to meet projected service needs. Major tasks for this objective include: (1) determining current strengths and weaknesses of eastern Washington transportation infrastructure, (2) profiling competitive trade-offs among modes, (3) assessing the transportation use relationships between people and freight, and (4) identifying funding and management challenges. Finally, tasks under objective 3 include: (1) identifying eastern Washington transportation corridors that are of special policy interest, (2) identifying alternatives for intermodal corridor improvements, (3) assessing the impact of proposed system improvement alternatives on economic competitiveness and mobility within eastern Washington, (4) conducting sensitivity analysis for selected private and public transportation policies, and (5) recommending public policy alternatives for improving economic competitiveness and mobility within eastern Washington. Phase I of EWITS, funded under this ISTEA Grant, has done considerable work that lays the groundwork for conducting analysis of policy changes affecting the transportation system in eastern Washington. Basic information collected by origin and destination studies that illustrate freight movements by mode of transportation, through specific highway corridors, and by specific industries, have provided a picture of current system use. Economic modeling efforts include a regional input-output table of eastern Washington and a Geographic Systems Model (GIS)/GAMS transportation cost optimization model that illustrates how transportation flows through the geographic distribution of agricultural production areas, population centers, river ports, and transportation infrastructure in the region. As Phase I comes to a close, this report summarizes the work that has been completed to date. The first section of this report presents brief summaries of all the EWITS research reports and working papers and the project objective it accomplished. The variety and the volume of work performed under EWITS illustrates the “adaptive research” approach employed by the project. Any new or pressing transportation issues could be examined as the project progressed. The second section presents three case studies as demonstrations of the types of analysis that can be accomplished with the information collected under EWITS. Included in this section is: (1) a case study using information from the Washington Freight Truck Origin and Destination Study, (2) a discussion of the uses of the Eastern Washington Transport-Oriented Input-Output Study, and (3) a case study compiling results from various reports on the implications for the transportation system of a Snake River drawdown. The final section presents a summary of the proceedings from the Eastern Washington Intermodal Transportation Study Forum held on May 13, 1998 in Moses Lake, Washington. The purpose of the forum was to present to the public the various data and research reports compiled under EWITS and some of the pertinent results. The conference had over 100 attendees that included business leaders; trade and
3

commodity association members; local, county, state, and regional government officials; and interested citizens. Three appendices with supplemental information from the forum can be found at the end of the report. Appendix A contains a list of acronyms used during the EWITS forum. Appendix B contains the overheads presented at the forum. Finally, Appendix C contains the full forum transcript. Over the last six years, EWITS has produced a large body of data and analysis on the future needs of the eastern Washington transportation system. A number of comments about the project have come from forum presentations and from written correspondence to the administrators of the project. These comments illustrate the value of the information generated from EWITS. Examples of these comments include:
“. . . the studies on grain, row crops, and timber movements were helpful to counties because they showed, particularly the GIS grain model, logical frameworks, and networks of distribution within the county system itself.” - Jay Armstrong, Deputy Director, County Road Administration Board. “I see the EWITS study as a great example of, not only public participation, but also of regional thinking. Many local issues are tied into regional ones. EWITS has generated a lot of good discussion, debate, and energy.” - Don Barcham - Planning and Program Manager, Ministry of Transportation and Highways, Kootenays Region, British Columbia. “What were the EWITS results - what did we get out of this six-year effort? We got data collection, a statewide origin and destination study, knowledge on the transportation needs of the major industries in eastern Washington, business location factors, local economic development programs, international trade implications of NAFTA, and implications of drawdown.” - Charles E. Howard, Manager, Transportation Planning Office, Washington State Department of Transportation. “I feel it is critical to keep this study current, or continually updated, thereby protecting this investment of public funds. I feel it is essential (to the study) to include the connections to western Washington. Primarily to such locations as the Port of Seattle. Consequently, I feel that the EWITS study should be tied to western Washington concerns.” - Jerry P. Bryant, P.E., Stevens County Department of Public Works. “In my opinion, the benefits reaped from this cooperative process were significant and it should certainly continue, and I would support . . . seeking a decision package for continued funding.” - Leonard Pittman, Washington State Department of Transportation.
The contribution of EWITS to transportation policy in Washington State is reflected in the subtitle of the forum: “Research + Planning + Political Support = Success.” All of these ingredients were utilized to produce the types of information crucial for transportation policy planners making decisions about the future of eastern Washington’s transportation system.
4

EWITS Research Report and Working Paper Summaries
5
EWITS Research Report #1
Linking Transportation Improvements to New Business Development in Eastern Washington by William R. Gillis
February 1994 Purpose of Study This study provides an assessment of how specific transportation system improvements will impact location choices of owners of new manufacturing, retail, and services businesses. Results of this analysis provide information needed for EWITS research objective #2. Study Objectives
• Determine the transportation modes utilized by new businesses and industries. • Determine the transportation factors that are the most important to business and industry site
location decisions. • Assess the non-transportation needs of new businesses.
Study Methodology The analysis is based on a statewide telephone survey of nearly 650 new manufacturing and non-manufacturing businesses that began operations in Washington State between January 1990 and January 1993. Over 40 percent the businesses surveyed are from eastern Washington. Nearly half of the firms interviewed were manufacturing firms. Key Findings
• Truck motor freight is the dominant mode of transportation used by new eastern Washington manufacturing firms with over 75 percent of these firms relying on this mode of transport. Other types of firms rely on truck transport either for delivering or receiving supplies or to transport to another mode of shipment. Therefore, public highway investment facilitating the efficient operation of truck freight is most critical for new manufacturing, retail, and service business development in eastern Washington.
• Air freight is important to the development of nearly all of eastern Washington’s manufacturing, retail, and service growth industries, particularly food manufacturing, industrial machinery and transportation equipment, engineering/management consulting, and specialty retail. Maintaining and improving the region’s air freight system will be critical in attracting new businesses.
• Export-oriented manufacturing industries, food manufacturing, and the wood products industry are dependent on water transportation, particularly truck-to-port transportation.
• New manufacturing industries in eastern Washington are almost twice as likely as those in western Washington to use rail transport, particularly businesses in fabricated metals, transportation equipment, and logging and lumber industries.
• Other factors important to new businesses include public transportation improvements such as four-lane highways and diverting truck traffic from congested urban areas, restoring abandoned rail service, or upgrading port facilities. Also, two-thirds of new businesses indicated the need for adequate local telecommunication as important in their location choice.
Future Use of Results This study provides insights on how the region’s transportation system influences location decisions of new businesses. This information can be used by planners to identify those transportation investment strategies that can promote new business development.
6

EWITS Research Report #2
Lessons from Eastern Washington: State Route Main Streets, Bypass Routes, and Economic Development in Small Towns
by William R. Gillis February 1994
Purpose of Study This study identifies strategies to maximize the positive economic impacts of state route main streets and state route bypasses through small towns in eastern Washington while minimizing possible detrimental impacts. Results of this analysis provide information needed for EWITS research objective #2. Study Objectives This report summarizes results from selected case studies that document the importance of state route main streets for smaller communities, as well as the likely economic and environmental changes after a bypass is constructed. The case studies include seven eastern Washington communities: Colfax and Oroville which have state routes passing through their central business district; Rosalia, Okanogan, and Omak which are bypassed by a major state route; and Prosser and Sunnyside which are bypassed by a major interstate development. Comparing these communities provide insights into the implications of state route main streets and bypasses for local economies. Study Methodology Case studies are based on personal interviews of local business leaders conducted in each community. Each was asked about their perceptions of how state route main streets or bypasses impacted current economic conditions in the community. Also, data on local population and taxable retail sales over the last ten years were analyzed for each community. Key Findings
• State route main streets allow for the development of certain specialized businesses that would otherwise not be economically feasible in small towns.
• To maximize economic benefits from a state route main street, transportation plans should include actions to minimize problems such as accidental damage to parked vehicles, poor traffic flow during peak travel periods, and safety problems in crossing the street.
• Downtown business districts in communities with a well-developed local customer base are less adversely impacted by a state route bypass than communities highly dependent on drive-by traffic.
• Bypass routes that improve access to major trading centers can open up new opportunities for small towns.
• Systematic development of highway-related businesses and other retail businesses along bypass interchanges can help mitigate possible economic losses that occur from the diversion of traffic from the downtown business district.
• Annexing property associated with new interchanges is an important tool that can be used by cities to mitigate tax base losses associated with possible business closings and land use changes in the downtown business district.
• Land use plans should be flexible enough to accommodate new types of downtown uses in communities that are impacted by a state route bypass. Enticing travelers into the central business district of a bypassed community is essential.
Future Use of Results These results provide planners with information on how transportation investments may be made to maximize the economic benefits to small communities in the region.
7

EWITS Research Report #3
Washington State Freight Truck Origin and Destination Study: Methods, Procedures, and Data Dictionary
by William R. Gillis December 1994
Purpose of Study This study provides information on the source and characteristics of freight truck movements on state and regional highways in Washington State. Until this study, comprehensive information on the truck freight movements in Washington State was not available due to the large number of carriers and the numerous possible origins and destinations of cargo. This information provides the data needed to conduct EWITS research objective #1. Study Objectives The primary objective is to collect statewide freight truck origin and destination data using direct personal interviews of truck drivers in Washington State. This study is the first of its kind to be done in the U.S. This report documents the methods and procedures developed to conduct these roadside interviews and how the data can be used for future analysis. Study Methodology Direct personal interviews of 28,000 truck drivers were conducted by over 300 interviewers at 28 separate locations in Washington State. The questionnaire was designed to be completed in three minutes. Approximately one of the questions could be filled out by direct observation by the interviewer. Questions asked directly to truck drivers focused on cargo, weight, use of intermodal facilities, and route of travel including origin and destination. Scheduling of interviews was designed to develop data for each of the four seasons. Also, interviews were scheduled for a continuous 24-hour period to provide a comprehensive picture of statewide movements. Interviews were consistently scheduled for Wednesdays to obtain median traffic patterns rather than exceptionally heavy Monday or Friday traffic flows. Future Use of Survey Data The data collected under this study could be used in conjunction with data collected by WSDOT at automatic data collection sites to provide an estimate of cargo content, vehicle weights, origins, and destinations for a full seven- day period in specific corridors. This data can also be integrated with the WSU Geographic Information System to produce digitized maps that can illustrate findings and provide a graphical interface to work with other transportation databases. The information from this study forms the basis of analysis of the origins and destinations of truck freight movements in Washington State that is reported in EWITS Research Report #9.
8

EWITS Research Report #4
Major Generators of Traffic on U.S. 395 North of Spokane: Including Freight Trucks and Passenger Vehicles Crossing the International Border
by William R. Gillis January 1995
Purpose of Study This study assesses the freight vehicle utilization of U.S. 395 north of Spokane and the passenger car traffic passing through the Canadian/U.S. border stations north of Spokane. Results from this analysis provide information needed for EWITS research objectives #2 and #3. Study Objectives
• Determine daily truck volume, cargo content, and economic value of freight cargo flows. • Determine the primary origins and destinations for selected freight truck traffic. • Provide a truck profile including typical weight and vehicle configuration. • Determine the routes most frequently used by freight trucks traveling between major origins and
destinations. • Provide a profile of passenger cars passing through Canadian/U.S. border stations north of
Spokane. • Discuss implications for future corridor planning and development for U.S. 395 north of Spokane.
Study Methodology Personal interviews were conducted of truck drivers traveling U.S. 395 north of Spokane between July 1993 and May 1994. Interviews were conducted at the Washington State Patrol scale house near Deer Park on four separate dates, each date selected to be representative of each of the four seasons. Car drivers were interviewed at Boundary and Waneta Ports of Entry. Key Findings
• On average, 27 percent of the trucks traveling southbound on U.S. 395 have two trailers compared to an average of 16 percent of two trailer trucks on highways statewide. Slow moving multiple-trailer freight vehicles on a two-lane road have the potential to cause hazards for faster moving passenger vehicles on the same route. Highway capacity improvements (additional turnouts, passing lanes, or four laning) should be considered for future development of the U.S. 395 corridor north of Spokane.
• Relatively high median cargo weights combined with a climate subject to major freezes and thaws contribute to higher highway maintenance needs for this corridor.
• Maintaining a rail transportation option for regional lumber mills can be an important demand-side highway management tool for this corridor by decreasing the corridor use by this industry.
• Passenger car interviews show a substantial amount of retail shopping occurs between border communities in Canada and the U.S. Currently, a majority of the shopping trips were from Canadian residents traveling to the U.S., but this flow could reverse with changes in currency values. Either way, a safe and efficient highway link to the Canadian border is important to travelers.
Future Use of Results While the trends reported in this study could change due to macroeconomic factors outside of local and state control (such as a change in the U.S.-Canadian exchange rate), the results do show the current use patterns of freight and passenger traffic for the U.S. 395 corridor north of Spokane. Information provided here can help planners ascertain appropriate investments that can improve the efficient transfer of truck freight and improve traffic safety in this corridor.
9

EWITS Research Report #5
Transportation Characteristics of Wheat and Barley Shipments on Haul Roads To and From Elevators in Eastern Washington
by Jonathon R. Newkirk and Ken A. Eriksen March 1995
Purpose of Study This study reports the movements of wheat and barley to and from commercial elevators in 16 counties in eastern Washington. Results of this analysis represent the first industry study to be reported under EWITS research objective #1. Study Objectives
• Determine the seasonality of wheat and barley deliveries to elevators in eastern Washington. • Determine the seasonality of wheat and barley shipments from elevators in eastern
Washington. • Determine the destinations for wheat and barley shipments from elevators and the modes of
transportation used. • Determine the rates for elevator storage and handling; and for transportation costs.
Study Methodology A questionnaire was developed and administered by mail to licensed individual elevators operating in eastern Washington. Out of 470 elevators in the region, 410 elevators responded to the survey. Key Findings
• Elevators in the region vary in capacity from 11,000 bushels to over four million bushels; however, 87 percent of elevators in the region have less than 1 million bushels in capacity.
• The combination of truck and barge transport is responsible for 61 percent of the wheat and 45 percent of the barley shipped from elevators in the region.
• Wheat and barley are shipped from elevators throughout the year. Wheat shipments are more evenly distributed throughout the year with a high of 20 percent shipped between November-December and a low of 6.5 percent between May and June. Barley shipments occur more often in November through February than any other time period.
• Elevator operators report that over 89 percent of all farmers within a ten-mile radius of their elevator ship all or some of their grain to their elevator.
• The primary destination for wheat and barley shipped from elevators in eastern Washington is the Columbia River ocean elevators. Almost 80 percent and 61 percent of all barley is shipped to ocean elevators in the Portland, Oregon/Kalama, Washington area.
Future Use of Results Information from this study can be used to help evaluate the multimodal transportation system in eastern Washington, particularly with regards to serving the needs of grain elevators in the region.
10

EWITS Research Report #6
A Quantitative Estimate of Eastern Washington Annual Haul Road Needs for Wheat and Barley Movements
by Eric L. Jessup March 1995
Purpose of Study This study provides a detailed assessment of the transportation needs of the wheat industry in eastern Washington, especially for the road system. Results of this analysis provide information needed for EWITS research objective #1. Study Objectives
• The primary objective is to look at road deterioration from normal wear and tear associated with grain movement.
• Develop a methodology to determine the impacts on roads associated with normal, legal road movements.
• Identify road usage and support needed by county for wheat and barley movements in each county.
• Quantify the overall minimal road needs and accompanying investment required to support the wheat and barley industry.
Study Methodology This analysis uses information obtained through an in-depth survey of eastern Washington grain elevators that was reported in EWITS Research Report #5. The survey provided information concerning origin, destination, and value of wheat and barley shipped from farm to market and allowed investigation of the resultant road needs for each type of truck movement. Key Findings
• An annual road investment of $27.5 million will be needed in eastern Washington in order to replace normal wear and tear on the road system in the region. Almost 81 percent ($22.2 million) of the damage occurred on state highways while county roads receive 19 percent ($5.3 million) of the impact.
• Most of the road and state highway investment needs occur on the movements to river ports. Especially notable is that over 89 percent of the impact on state highways occurs from farm to river port movement. Farm to elevator movement generates 79 percent of the impacts to county roads.
• Those counties serving as passage routes for grain movements from other counties have a greater need for road investments above than caused by movements from their own county.
Future Use of Results Information from this study indicates the general level of road investment (based on current use at the time of the study) needed to maintain road service for the wheat and barley industry.
11

EWITS Research Report #7
Transportation Needs of Eastern Washington Fruit, Vegetable, and Hay Industries by William R. Gillis and Emily Gruss Gillis
March 1995
Purpose of Study
This report focuses on the transportation needs of eastern Washington’s fruit, vegetable, and hay industries. Results of this analysis provide information needed for EWITS research objective #1.
Study Objectives
• Determine the product and raw commodity flows including product sources and destinations. • Determine the modes of transport and the routes used by these modes. • Determine the barriers to efficient transport. • Identify the effects of seasonal road closures and weight restrictions on truck freight movements
for each of these industries.
Study Methodology
A mail/telephone follow-up survey of eastern Washington potato, hay, and apple processing and distribution firms was conducted in the fall of 1994. These commodities represent 80 percent of the volume of agricultural crops other than grain crops that are produced in eastern Washington. Focusing on warehouses, packers, processors, and brokers rather than growers enhanced the feasibility of the study and reduced the chance of double counting of local truck shipments. A total of 43 apple firms (out of 68), 27 potato firms (out of 38), and 26 hay firms (out of 43) responded to the survey. Overall, two-thirds of the firms contacted participated in the study.
Key Findings
• Truck transportation is the dominant mode of transport utilized by processors and packers, both to receive raw commodities from fields and warehouses and to ship products to final markets.
• Approximately 20 percent of the apples and 91 percent of hay products are shipped to final markets through western Washington ports. Efficient truck connections to western Washington ocean ports are necessary for these industries.
• The availability of both trucks and truck drivers, and road conditions in winter were cited as problems. The impact of the deregulation of intrastate trucking is unknown but needs careful study.
• Seattle and Tacoma are important shipping destinations for these industries as they are links to export markets. I-82 and I-92 are the key highways used to reach ocean ports. While 22 percent of eastern Washington potatoes and 8 percent of the region’s apples are shipped to final destinations by rail, respondents indicated that rail would be used more frequently if rail cars were readily available and rail service was timelier. Maintaining and developing the short-line rail system and reopening Stampede Pass could improve rail service for these industries.
• The heaviest transportation needs occur during the peak summer and fall harvest seasons. Shipments of potatoes between warehouses and processing plants are needed throughout the year.
• These industries have extensive markets outside the state that need both efficient state and national transportation systems, and efficient customs procedures at the Canadian and Mexican border.
Future Use of Results
Maintaining an efficient highway freight system and rail system is essential to the economic success of the fruit, hay, and vegetable industries. Planners are provided with investment suggestions to promote efficiency in the transport of these products from eastern Washington.
12
EWITS Research Report #8
Importance of U.S. 395 Corridor for Local and Regional Commerce in South Central Washington
by Kenneth L. Casavant April 1995
Purpose of Study
This study examines the importance of the U.S. 395 corridor area for local and regional commerce. This corridor includes portions of Walla Walla, Benton, and Franklin counties in eastern Washington; and portions of Umatilla and Murrow counties in eastern Oregon. This analysis provides information needed for EWITS research objectives #2 and #3.
Study Objectives
• Describe the economic importance of freight traffic passing through and within this corridor. • Describe the local economy and implications for regional highway transportation needs.
Study Methodology
The study used a combination of primary and secondary sources. These primary data sources included personal interviews with labor economists, local leaders, and key freight shippers in the corridor; and personal, roadside interviews of truck drivers passing through and within the study region. The truck driver interviews were conducted at eight roadside interview sites in the U.S. 395 corridor between May and June of 1994. The interviews conducted in May were also part of the Washington State Freight Truck Origin and Destination Study described in EWITS Research Report #3. The interviews conducted at the Washington State interview sites and at the Umatilla Port of Entry were conducted over a full 24-hour period on consecutive Wednesdays. The remaining interviews at sites in Oregon were conducted between 7 a.m. and 7 p.m. on consecutive days within a single week. Over 1,800 interviews were completed using a questionnaire that took two minutes to administer. Secondary economic and demographic sources were used to estimate the value of cargo transported through the corridor.
Key Findings
• The volume and economic value of cargo shipped within this corridor is substantial with 5,600 trucks carrying over 100,000 tons of cargo (valued at $139 million using 1994 prices) passing through the corridor over a 24-hour period. Two-thirds of the cargo movements and over 70 percent of the cargo value pass through traffic in the corridor area. Imports to the area comprise 22 percent of the trucks with cargo and almost 18 percent of the cargo value.
• Food and kindred products provided the largest cargo tonnage and value of commodities shipped. Wood products, agricultural commodities, general freight, machinery and equipment, metal products, paper products, and manufactured plastics also account for a significant share of daily cargo tonnage.
• The Pasco-Kennewick area is both the highest volume origin and destination among area communities.
• Agriculture is the economic base of the five-county study area with over one billion dollars in total regional agricultural sales in 1992. Agricultural sales for the area have increased almost 40 percent from 1987 to 1992. The diversified crop base (potatoes, wheat, hay, fruit, etc.) results in differing local commodity flows, particularly for wheat, hay, and potatoes.
Results/Implications
These results provide planners with a picture of the freight shipments in this corridor. The diversified crop base suggests that freight traffic in this corridor will be stable and fairly independent of changing economic conditions. However, the corridor is an essential transportation link for the economy of the five-county area.
13

EWITS Research Report #9
Movement of Freight on Washington’s Highways: A Statewide Origin and Destination Study by William R. Gillis
November 1995 Purpose of Study This study is a detailed summary and analysis of the truck movements in Washington State based on information collected from the Washington State Freight Truck Origin and Destination Study. Results of this analysis provide information needed for EWITS research objective #1. Study Objectives
• Provide a detailed profile of the freight trips that originate from both western and eastern Washington.
• Provide a detailed profile of trips originating outside the state of Washington. • Determine cargo content on major Washington freight corridors and compare them. • Discuss implications of the results for highway usage in the region.
Study Methodology A description of the Washington State Freight Truck Origin and Destination Study can be found in EWITS Research Report #3. Key Findings
• An estimated 8.1 million long-haul truck trips occur on Washington’s state highway system each year, carrying cargo valued at nearly $150 billion. Nearly 5 million trips originate from western Washington counties while 1.2 million truck trips originate from eastern Washington. Over two million truck trips originate from out-of-state. Nearly one-half of all trucks entering Washington originate from Oregon.
• Approximately two-thirds of the total truck trips originating from eastern Washington counties are carrying cargo. Agriculture and wood products are among the largest generators of freight traffic on eastern Washington highways. Western Washington freight trucks are more likely to be carrying retail merchandise and high valued manufactured goods.
• Regarding trip destinations, trips originating from eastern Washington are divided about equally between destinations in eastern Washington, western Washington, and out-of-state locations. Sixty-nine percent of the trips originating in western Washington remained in that region.
• Shipments originating from Yakima and Spokane counties account for the largest number of freight truck trips (averaging 600 trucks per day) from eastern Washington. King County is the most frequented in-state destination for shipments originating from eastern Washington.
• King County is the largest single generator of freight truck traffic within Washington State with over 6,000 truck trips each day. Over one-third of daily truck trips originate from Seattle or Tacoma.
Results/Implications The key implications of this analysis show that Washington State economic vitality is dependent on the efficient in-state movement of truck freight. Twenty-three percent of all truck trips originating in western Washington and 35 percent of trucks originating in eastern Washington are destined for out-of-state locations. Given this linkage, both national and international cooperation concerning inter- and intrastate transportation is needed. Important linkages between highway freight and other modes of transportation (water ports, air, and rail) also need to be considered. Analysis of the various regions of the state shows each with unique transportation needs so future state plans must be flexible.
14

EWITS Research Report #10
Eastern Washington Transport-Oriented Input-Output Study by Robert A. Chase
February 1996 Purpose of Study This study develops an input-output table of eastern Washington that can incorporate transportation services in the region. This table can be used to conduct economic impact analysis to determine how changes in the demand for transportation services impacts the regional economy. Results from this study provide information needed for EWITS research objective #3. Study Objectives
• Construct an input-output table for eastern Washington based for 1992. This table contains 58 inter-industry sectors, including eight transportation service sectors that correspond closely to the major transport modes.
• Develop estimates of gross output, operating revenues, and value added for the eight transportation service sectors in eastern Washington and incorporate them into the input-output table.
• Present applications of the input-output model. Study Methodology Input-output models are an economic accounting system that provides estimates of the composition of gross regional product, value-added by industry, and the destination of output among various intermediate and final markets. From these relationships, economic multipliers can be derived. Multipliers measure the direct effects upon an industry from changes in economic conditions. The framework can be used to determine the impacts on the regions economy resulting from changes in the demand for transportation services. Information used to construct the table came from surveying firms within selected industries in eastern Washington and other region specific secondary data sources to obtain industrial sector output and value added. Key Findings
• The gross output for the eastern Washington rail transportation sector in 1992 is $206 million. The value added component of operating revenues by the rail sector is $118 million. Gross output for eastern Washington motor freight transportation sector is $632 million while the value-added component is $352 million. For water transportation in the region, gross output is estimated at $9.6 million with the value-added component (the total value of output generated in all sectors of the economy per dollar of output in the water transportation sector) at $3.2 million. For air transportation, gross output is estimated at $84 million with a value added component estimated at $39 million.
• Direct transportation services sectors contributed $727 million or 3 percent of eastern Washington’s 1992 gross regional product. Total employment in these sectors in the region is 16,418 workers with $509 million in labor earnings. Two-thirds of the transportation services total of the 1992 operating revenues are associated with exports to both foreign markets and to the rest of the U.S. and western Washington.
• Applications of the input-output model include describing regional economic activity (gross output and value-added by sector) and economic impact analysis.
Future Use of Model EWITS Research Report #11 presents a policy-oriented discussion of the role transport industries play in eastern Washington using the input-output model developed here.
15
EWITS Research Report #11
The Economic Contribution of Transport Industries to Eastern Washington by Robert A. Chase
August 1996 Purpose of Study This study describes the recent economic contributions of transport industries to the economy of eastern Washington. Results of this analysis provide information needed for EWITS research objective #3. Study Objectives
• Describe the economic contributions of transport services to the region. • Describe the economic impacts associated with increased efficiency of the transport services and
improvements of the transportation infrastructure. Study Methodology This analysis uses the input-output model developed in EWITS Research Report #10. Key Findings
• Transport services are important export sectors in the regional economy. The export of eastern Washington transport services amounted to almost $642 million--over half of total sales. Nearly three out of every five-transport jobs in the region are tied directly to the regional export base. The majority of these exports were to serve markets located within the rest of the U.S., including western Washington.
• Various economic multipliers for the transport services sector were derived from the regional input-output model. In 1992, the total economic impact of transport services on eastern Washington’s economy was $1.11 billion in sales of transport services, 17,355 jobs, and $459 million in labor earnings. Highway construction activity related to state transportation outlays and exports generates another 834 total (direct and indirect) jobs with labor earnings of $23 million.
• The indirect economic effects of transport services are heavily concentrated in services and trade. Nearly 60 percent of the total indirect output effects of transport services are in these two sectors.
• Transport services in eastern Washington comprise 16,418 workers with labor earnings of $509 million. Average annual earnings per transport service worker were $30,990, which is above the eastern Washington average of $25,293 in 1992.
• Total operating revenues of eastern Washington transport services is approximately 4 percent ($1.2 billion) of the total eastern Washington regional output of $33.5 billion in 1992.
• Trucking is the dominant mode of transport in the region with $632 million in revenues, and is followed by railroad transport at $206 million.
• Three out of every ten dollars of transport services sales are made to other industries in the region. Regional manufacturers made the largest combined purchase of transport services totaling over $102 million. Wholesale and retail trade purchased $50 million in regional transport services. Trucking was the preferred mode of transport for the majority of manufacturers and wholesalers/retailers. The agricultural production sector purchased $27.5 million of transportation services from truck, rail, and waterborne transport services.
Implications This study shows the importance of the transportation services sector to the economy of eastern Washington and provides the quantitative economic relationships that can be used to evaluate future policy changes affecting transportation in the region.
16

EWITS Research Report #12
Waterborne Commerce on the Columbia-Snake River System by Nancy Lee and Ken Casavant
October 1996
Purpose of Study
This study identifies the volume, composition, and characteristics of waterborne commerce on the Columbia-Snake River system. Results of this analysis provide the information needed for EWITS research objective #1.
Study Objectives
• Consolidate data regarding barge transportation along the Columbia and Snake Rivers. • Analyze commodity movements. • Identify trends in waterborne commerce on the Columbia-Snake River. • Make inferences from the trend and other movement characteristics.
Study Methodology
The analysis uses monthly lock and tonnage reports collected by the U.S. Army Corps of Engineers from 1980 to 1995.
Key Findings
• Upriver movements in the system function to distribute commodities. Eighty-two percent of this traffic is fuel products, while another 12 percent is fertilizer. These products are traveling mainly to the Tri-Cities.
• Down-river movements are made up of forest and agricultural products collected from lower Snake River ports and moved to markets.
• From 1980 to 1995, total upriver movements of commodities ranged from a low of 1,232,201 tons in 1991 to a high of 2,542,616 tons in 1993. The average tonnage barged upriver in the past three years has been higher than most years in the decade, caused mainly by gasoline and fertilizer shipment increases.
• The down-river tonnage is about 8 million tons yearly, with little variations in annual tonnage shipped from 1980 to 1995. Grains, particularly wheat, accounted for 71 percent of the down-river movements from 1980 to 1995, while forest products accounted for 7 percent during that time period.
• For most years, it is evident that a more diverse set of commodities and significantly more physical tonnage moves downstream as export commodities while upstream tonnage tends to provide resources for local manufacturing and agricultural production. Movements of commodities, especially agricultural inputs, follow the cycles of planting while down-river grain shipments move throughout the year, with a peak in August; and then again in November to February.
Implications
This analysis identifies important trends in the flow of commodities on the Columbia-Snake River Transportation System. Waterborne transport provides a low cost alternative to either truck or rail transport. With no indication that the capacity of the river system to transport products has been reached, investment in access routes to upriver ports can promote greater efficiency and decrease the congestion on other modes of transport. Drawdowns of the Snake River would affect both rail and truck transport. If railroads cannot provide the needed capacity, the use of highways would increase resulting in greater road wear. The benefits of waterborne transport along the Columbia-Snake River system, and its complementary and competitive relationship with other modes, are felt not only in the region, but also nationally and internationally.
17

EWITS Research Report #13
Transportation Characteristics and Needs of Forest Products Industries Using Eastern Washington Highways.
Part 1: Economic Structure of the Industry by Lynn Alderson and Eric Jessup
January 1997 Purpose of Study This study provides a description of the various characteristics that link all forest product commodities to their respective markets that they serve. Results of this analysis provide information needed for EWITS research objective #1. Study Objectives
• Identify the areas and counties in eastern Washington where timber harvesting occurs. • Determine the quantities of timber from both privately owned and publicly held forests. • Determine the destinations of wood product shipments from Washington State. • Determine the modes of transportation that are used for the shipment of wood products.
Study Methodology The data presented in this report derive from secondary sources including industry sources (the American Plywood Association and the Western Wood Products Association) and federal and state government sources (the USDA, and the states of Washington, Idaho, and Montana). Key Findings
• Washington State is the second highest producer of wood products, after Oregon, in the Western United States region. Eastern Washington accounted for 20 percent of the total state timber harvest between 1985 and 1994.
• Ferry, Pend Oreille, and Stevens counties have the highest ratio of forestland to non-forest land in eastern Washington (82 percent, 76 percent, and 72 percent, respectively).
• Sawmills in Washington State received 81 percent of their raw products from private timber sources in 1994. Availability of public timber sources has diminished greatly due to environmental and endangered species concerns.
• The wood products leaving Washington sawmills remain in the west 63 percent of the time, with 11 percent being exported. The remaining 27 percent are transported to more eastern destinations. Modes of shipment include a combination of truck, rail, and water hauling (59 percent, 32 percent, and 9 percent of total wood products, respectively). Truck transport generally occurs for areas close to the mill while rail is used for longer distances (due to lower rates). Most waterborne transport is headed to ocean ports for export.
• Plywood mills in eastern Washington ship 45 percent of their products to western markets, with 55 percent going to more eastern destinations. Truck and rail are used exclusively hauling 35.7 percent and 64.3 percent of total plywood products, respectively.
Future Use of Information The analysis provides planners with the current marketing and transport use patterns for the wood products industry in Washington. The intermodal use of transport by this industry has implications for the types of transport investments needed for efficient shipment of wood products from eastern Washington.
18

EWITS Research Report #14
Impact of North American Free Trade Agreement (NAFTA) on Washington Highways. Part 1: Commodity and Corridor Projections
by Ken Eriksen January 1997
Purpose of Study
This report analyzes the NAFTA impacts on Washington transportation infrastructure and the need for sustaining investments to ensure the transportation infrastructure needed to achieve the goals of free trade. Results of this analysis provide information needed for EWITS research objectives #1 and #2.
Study Objectives
• Identify NAFTA trade corridors used in Washington with emphasis on U.S.-Canadian trade. • Identify commodity groups that were major generators of NAFTA trade in Washington. • Determine NAFTA’s impacts on future commodity movements in and through Washington. • Determine impacted corridors and assess needed transportation investment to support NAFTA
trade on Washington corridors. • Assess implications that arise from changes in NAFTA trade for Washington corridors.
Study Methodology
The study utilized information collected by the Washington State Freight Truck and Destination survey described in EWITS Research Report #3. This information was combined with information from the U.S. Census Bureau on cross-border trade in commodities being transported through ports of entry along the Washington-British Columbia border to make projections about future commodity flows resulting from NAFTA. Interviews were also conducted with industry sources to verify and modify these projections.
Key Findings
• Three highway movements make up NAFTA commodity movements in Washington: trips destined for Washington with Canadian origins (imports), trips destined for Canada with Washington origins (exports), or transit movements which only pass through Washington from some other origin outside the state. Transit movements occurred most frequently with 861,000 truck trips transporting 15.3 million tons, or 60 percent of the NAFTA commodities on Washington highways in 1994. Transit movements of that trade make up nearly 70 percent of the NAFTA ton-miles. Transit movements of vegetables, fruits, and lumber are major transit commodities hauled on Washington highways.
• Nine commodity groups made up 45.4 percent of commodity movements on Washington highway corridors: fresh vegetables; fruit; meat; canned and preserved fruits, vegetables, and seafood; miscellaneous for preparations; lumber; converted paper products; industrial inorganic chemicals; and agricultural chemicals.
• Estimates of NAFTA commodity ton-miles on Washington highways exceeded 10.3 billion in 1994, and are projected to exceed 13.4 billion by 2005 (an increase of over 30 percent).
• I-5 corridor received 75.3 percent of NAFTA commodity ton-miles in 1994 and is estimated to decrease to 74.7 percent by 2005, with U.S. 97 and U.S. 395 receiving a greater share of the ton-miles. Ton-mile changes in the I-5 corridor will increase in origin and destination movements. U.S. 395 corridor will see increased commodity ton-miles due to increased destination movements.
Future Use of Results
NAFTA trade will increase use of Washington highways. Eastern Washington corridors with low serviceable ratings, but increasing NAFTA commodity movements (SR 395 and SR 97), should be given investment priority to prevent deterioration.
19

EWITS Research Report #15
Transportation Characteristics and Needs of Forest Products Industries Using Eastern Washington Highways.
Part 2: Movements of Raw Logs by Lynn C. Alderson
February 1997 Purpose of Study This study investigates the importance and use of eastern Washington highway systems to raw log movements. Results of this analysis provide information needed for EWITS research objective #1. Study Objectives
• Determine highway use, seasonality, and problems encountered by the movement of raw logs utilizing truck transport.
• Develop a profile of eastern Washington raw log shipments by the counties in the study area. • Provide transportation characteristics and needs of raw log movements.
Study Methodology Two questionnaires were developed and administered by mail, one to raw log shippers in northeastern Washington and the other to raw log shippers in southeastern Washington. Overall, 73 surveys were completed (66 from northeast Washington raw log shippers and seven southeast Washington raw log shippers) for an overall cooperation rate of 76 percent. Key Findings
• The economy of the northeast section of Washington is dependent on the timber community. Revenue received from National Forest Receipts is distributed 50 percent for public schools and 50 percent for public roads and other public use.
• Transportation of raw logs on eastern Washington highways originates from four states: Washington, Idaho, Montana, and Oregon. The most prominent counties in northeast Washington for raw log origin are Stevens, Ferry, and Okanogan. In the southeast region, Walla Walla and Columbia counties are most prominent.
• The most common raw log destinations for use in lumber, plywood, and wood residuals are Stevens and Okanogan counties in the Northeast region. In the state of Oregon and Walla Walla County, raw log destinations are used for lumber.
• Highway use is heaviest in northeast Washington for raw log movements from May to February and May to December in the southeast region, due to road restrictions imposed during other months. Shipments from southeast Washington travel longer distances to market raw logs and operate fewer weeks per year than firms in the north, again due to road restrictions.
• Highways with the highest use in northeast Washington are US 395 in Stevens County and SR 155 in Okanogan County. US 12 in Walla Walla and Columbia counties are the most prominently used highways in the southeast region.
• The most important transportation problems in the northeast region were weight restriction, bridge laws, and road closures; while in the southeast, weight restrictions, available drivers, bridge laws, and short corners in cities, mills, and haul roads were common problems.
Future Use of the Results This report provides planners with information on current road use patterns of raw log shippers and identifies transportation problems affecting these shippers.
20

EWITS Research Report #16
Transportation Characteristics and Needs of Forest Products Industries Using Eastern Washington Highways.
Part 3: Shipments from Mills by Lynn C. Alderson
May 1997 Purpose of Study This study investigates the importance of eastern Washington highways to forest product shipments from mills in eastern Washington, Idaho, Montana, and Oregon. Results from this analysis provide information needed for EWITS research objective #1. Study Objectives
• Determine the seasonality, mode of transportation, and transportation problems encountered by truck shipments from mills.
• Develop a profile of the wood product shipments from mills, how many firms, and how much tonnage is produced.
• Provide transportation characteristics and needs of mills, including the different modes of transportation, the volume, the origin, and the destination of forest products shipped from mills.
Study Methodology A questionnaire was developed and administered by mail to mills in the study area. Forty firms (out of 84 mills in the study area) completed the survey resulting in a 48 percent cooperation rate. Key Findings
• Mills locate in rural areas close to their timber supply. Mills are often a large employer to the area and stimulate many indirect jobs.
• Washington’s lumber production is driven by the demand for new housing. Eastern Washington experienced a decline in lumber production from 1987 to 1992 but a modest increase has begun since that time.
• Mills vary greatly in tonnage produced, ranging from 75,000 to 400,000 tons per annum. Mills often locate close to each other.
• The proportion of total volume of product shipped in 1996 by type of product is 33 percent raw logs, 37 percent hogfuel, woodchips, and sawdust products, and 30 percent plywood, posts, poles, and other products.
• Truck movements from firms to final destination of all wood products ranged from 65 percent to 99 percent. Truck movements to river ports, ocean ports, and other destinations ranged from 0.3 percent to 29 percent, respectively.
• Truck shipments comprise 93 percent of all wood products from mills in states west of the Mississippi. Rail movements are split; 66 percent are west of the Mississippi; and 34 percent east of the Mississippi.
• Major transportation problems mentioned by mills included weight restrictions (65 percent of firms), rates (43 percent), temporary road closures during the year (41 percent), and available drivers (38 percent).
Results/Implications This report provides information on forest product shipments from mills. Mills are highly dependent on highway transportation for marketing their products and must have an efficient highway system for continued growth.
21

EWITS Research Report #17
Transportation Characteristics and Needs of Forest Products Industries Using Eastern Washington Highways.
Part 4: Commercial Shipments by Lynn C. Alderson
May 1997 Purpose of Study This study identifies the various transportation characteristics that affect the movement of forest products by commercial shippers in eastern Washington. Results of this analysis provide information needed for EWITS research objective #1. Study Objectives
• Determine the origin, destination, seasonality, and unusual transportation problems encountered by commercial shippers of forest products in the region.
• Profile the characteristics and needs of commercial shippers of forest products. Study Methodology A questionnaire was developed and administered by mail to commercial shippers of forest products in Washington and Idaho. Six firms (out of a total of 13) responded to the survey resulting in a cooperation rate of 46 percent. While the number of respondents is small, several of these firms are volume leaders in the industry and provided valuable data. The responding firms carry about 40 percent of total wood product movements on eastern Washington highways. Key Findings
• Hogfuels, woodchips, and sawdust (HWS) products comprised 99 percent (1,254,046 tons) of the movements reported.
• Major origins of HWS products moved on eastern Washington highways were from two sources outside of Washington: Idaho with 452,610 tons (36 percent) and Oregon with 366,225 tons (29 percent).
• Lewiston, Idaho/Clarkston, Washington, eastern Washington, and Canada were the three primary destinations for HWS products. Tonnage of 546,413 (44 percent), 450,083 (36 percent), and 133,322 (11 percent) per annum was reported, respectively.
• Most common routes used in eastern Washington are US 195, US 2, SR 20, US 395 and I-82. These movements are fewest from November to February and nearly double in the summer months.
• The most important transportation problems for the commercial firms were: available drivers; short corners in cities (turning radius corners); entrances and exits from mills and some mill yards; rates; weight restrictions; and lack of turnouts.
Future Use of Results This report identifies road usage and problems encountered by commercial shippers. The information can assist planners to make system improvements that promote efficient commercial transport of forest products.
22

EWITS Research Report #18
A GIS Commodity Flow Model for Transportation Policy: A Case Study of the Impacts of a Snake River Drawdown
by Eric L. Jessup and John Ellis Purpose of Study This report presents analysis of shipper and transportation infrastructure usage for current eastern Washington grain flows and then investigates usage in the presence of a Snake River drawdown. Results of this analysis provide information needed for EWITS research objectives #1 and #2. Study Objectives
• Determine changes in transportation flows and shipping cost in the 20-county grain production region in eastern Washington and graphically illustrate flows.
• Develop a transportation optimization model implemented through a Geographical Information System (GIS) incorporating grain movements originating from 695 township centers and passing through over 400 grain elevators en route to final destinations.
• Estimate impacts on the producer’s (private) cost of transport and transportation flow changes on roads and highways are also presented. Shifts in the modes of transportation are also provided.
Study Methodology This analysis uses a transportation optimization model for commodity flows and blends a GIS program with a Generalized Algebraic Modeling System (GAMS) optimization package. The transportation and marketing system being modeled involves grain movements from production areas in eastern Washington to feedlots and ocean ports for processing, consumption, and export. Intermediate destinations (grain elevators, river ports, etc.) serve as short- and long-term storage facilities, transfer stations, and points of consolidation. Information on each component is used in the analysis. The GIS program uses the geography of all these locations and the geographic distribution of transportation services in eastern Washington to model grain movements from production locations to final destinations and the modes utilized in the process. Key Findings
• Total transportation cost for transporting wheat from production areas to final markets increases $1.3 million without barge access above Pasco. Spreading the cost across the 132 million bushels produced in eastern Washington, this amounts to a one cent per bushel increase in cost. However, farmers which ship directly from farm to river ports will experience 6.2 cents per bushel increase in transportation cost.
• The transportation cost increase for barley is about $1.1 million without barge access above the Tri-Cities. This amounts to 6 cents per bushel increase. This is due to the smaller volume of barley produced in eastern Washington when compared to wheat. Barley shippers, which continue to ship from farm to river ports, will experience 12.9 cents per bushel increase in transportation cost.
• Truck traffic flows for both commodities no longer concentrate on several corridors to river ports as they do with the base (no drawdown) scenario, but instead become concentrated on a few routes to Pasco, Washington.
Future Use of GIS/GAMS Optimization Model Other policy issues can be readily addressed with this tool, including rail car shortages for grain shipments, road closures during selective time periods, rail line abandonment, and changes in truck (vehicle) size and weight configurations for commodity shipments.
23

EWITS Research Report #19
Rail Traffic in Washington: A Commodity and Origin Destination Analysis 1990 to 1995 by Nancy Lee and Ken L. Casavant
December 1997
Purpose of Study
This study presents an analysis of the movements of commodities on the freight rail transportation system in Washington State. Results of this analysis provide information needed for EWITS research objective #1.
Study Objectives
• Identify those commodities which contribute at least 2 percent of the total tonnage of commodities moving into and out of the state over the last six-year study period and to identify trends in movements of these commodities.
• Identify the commodities, which tend to terminate in and originate from Washington and eastern Washington.
• Identify any seasonal patterns in commodity movements. • Identify intrastate rail traffic patterns between western and eastern Washington in terms of
commodity groups, tonnage, and seasonality. • Present selected conclusions, based on findings, regarding inferences made on the role of rail
transportation in the state and the Pacific Northwest.
Study Methodology
This analysis uses Interstate Commerce Commission Waybill data from 1990 to 1995 to identify patterns and volumes of interstate, intrastate, Canadian, and international rail movements. International movements are those where rail is only one leg of an intermodal shipment for commodities coming and going overseas.
Key Findings
• Total rail movements of commodities terminated in Washington between 1990 and 1995 amounted to over 191 million tons. Commodities originating from Washington by rail amounted to 84 million tons. Approximately 2.3 times more tonnage is brought into Washington by rail than is transported out of the state by rail. Commodity tonnage-leaving Washington by rail held a steady annual average of 14 million tons between 1990-1995.
• Tonnage transported into and out of eastern Washington is quite even. Thirty million tons of commodities entered into the region by rail during 1990-1995. The notable commodity groups are lumber, hazardous materials, farm products, chemicals, and stone products. Similarly, 33 million tons left eastern Washington by rail during the same time period. Twenty-nine percent of the tonnage was grain and another 26 percent was lumber. The region exports more chemicals, petroleum or coal products, stone products, and hazardous wastes than it imports.
• For terminating tonnage in the region, 26.5 percent came from Canada, 15.5 percent from Oregon, 15.2 percent from Montana and 11 percent from Idaho. For commodities originating from eastern Washington, 35.7 percent move within Washington, 21.2 percent move to Oregon, and 6 percent move to Illinois and California.
• Seasonality of rail terminations into Washington State and eastern Washington are driven by agricultural cycles of planting and harvesting.
Future Use of Results
This analysis provides planners with current commodity flows on the rail system in Washington. Policy analysis can be conducted to see how changes in the transportation system can affect these flows in the future.
24

EWITS Research Report #20
Eastern Washington On-Farm and Commercial Storage by Richard Edwards and Eric Jessup
January 1998 Purpose of Study This report presents graphical representations of an EWITS database that contains information on the size and location of all commercial grain elevator storage facilities and private, on-farm storage sites in the 20 counties that comprise eastern Washington. Database from this report provides information needed for EWITS research objective #1. Study Objective Construct a database containing information on commercial grain elevator and private, on-farm grain storage facilities in the region. Study Methodology Sources of data include:
• Information collected by the eastern Washington Grain Elevator Survey. • Data on private facilities came from the Agricultural Soil and Conservation Service (ASCS)
office. • Other sources including county tax assessors’ offices and telephone interviews. • Information from combining the Topologically Integrated Geographic Encoding and
Referencing system (TIGER) files from the U.S. Census Bureau and WSDOT highway files. This information was linked to a Geographic Information System to present graphics showing the location of each grain storage facility within the counties and the relative size of each facility. Future Use of Information The report disseminates information via graphical representations of the data set. This information regarding grain and storage facilities, their locations, and capacities may be useful to producers, planners, policy makers, and other interested parties in making decisions concerning transportation or other infrastructure needs.
25

EWITS Research Report #21
Washington State Freight Truck Origin and Destination Study: County Level Analysis by Kathleen Painter
January 1998 Purpose of Study A series of reports, one for each of the 39 counties in Washington, presents truck traffic characteristics at the county level for trucks whose trips either originated or ended in a particular county. Results from this analysis provide information needed for EWITS research objective #1. Study Objectives
• Provide a profile of freight truck traffic in Washington counties, which include details on road usage, truck weight, truck configuration, commodities hauled, and seasonal traffic variation. A separate profile is available for each county.
Study Methodology The Washington State Freight Truck Origin and Destination Survey, described in EWITS Research Report #3, provided the information used for this analysis. It is important to note that the survey did not capture truck movement that did not pass through one of the 20 survey sites located on major routes throughout the state. For this reason, considerable intra- and inter-county traffic will not be included for some counties depending on proximity to a survey site. Key Findings Example of an eastern Washington county report: Whitman County
• Truck traffic heading for or leaving Whitman County ranges from an average of 36 trucks per day in summer to 91 trucks per day in winter.
• Truck configurations for trucks carrying loads into or out of Whitman County are most likely to be tractor-trailer configurations (56 percent of all trucks with loads). Twenty-six percent are tractors with two trailers, ten percent are truck and trailer configurations, and seven percent are straight trucks.
• Over a four-day period (one for each season, a total of 266 trucks, loaded and empty, were either heading for or leaving Whitman County. Of these trucks, 69 percent were Washington-based carriers.
Example of a western Washington county report: King County
• Truck traffic heading for or leaving King County ranges from 17,823 trucks per day in winter to 14,323 trucks per day in spring.
• Truck configurations for trucks carrying loads into or out of King County are the tractor-trailer configuration (50 percent of all trucks with loads). Straight trucks and tractors with two trailers account for 17 percent each. Another 16 percent are truck and tractor configurations.
• Over a four-day period (one for each season, a total of 50,799 trucks, loaded and empty, were either heading for or leaving King County. Of these trucks, 64 percent were Washington-based carriers.
Future Use of Results These reports provide planners and policy makers information on the truck traffic flows within each county in Washington. This information will be helpful in assessing transportation policy impacts across the state.
26

EWITS Research Report #22
Transportation Characteristics and Needs of Forest Products Industries Using Eastern Washington Highways.
Part 5: Road Usage and Characteristics by Lynn C. Alderson and R. Douglas Scott II
January 1998 Purpose of Study This report summarizes and compares information on the transportation of forest products in eastern Washington that was collected from three separate mail surveys of raw log transporters, lumber mills, and commercial shippers. The focus of this report will be to provide a broader overview of current transportation patterns based on questions that were common to each questionnaire. Results from this analysis provide information needed for EWITS research objective #1. Study Objectives
• Examine the seasonality of shipments for each type of forest product shipper and the industry as a whole.
• Determine unusual transportation problems by type of shipper and for the industry. • Compare the volume of truck shipments by type of shipper. • Compare the origin and destination of forest product shipments by type of shipper. • Road use by raw log and commercial truckers.
Study Methodology Mail surveys were administered to each of the three transportation sectors of the forest product industry. The methodology used to collect the data is more fully discussed in EWITS Research Reports #15, #16, and #17. Key Findings
• The shipment of raw logs exhibits the greatest amount of seasonality of shipments. Shipments are reduced during January through April due to road and weight restrictions resulting from the spring thaw.
• The unusual transportation problems noted by respondents were weight restrictions, available drivers, and lack of turnouts. Other problems were the varying weight restrictions and bridge laws across the Northwest states and Canada, and safety problems on SR 20.
• Truck movements to final destinations from mills and commercial shippers are predominant over truck shipments to river ports and ocean ports for the three categories of forest products: raw logs; hogfuel, woodchips, and sawdust; and plywood, post, poles, pilings, and other products.
• Stevens, Okanogan, and Ferry counties in the north have the highest volume of raw log truck shipments. Oregon is both the highest volume origin and destination for raw log shipments from shippers in southeast Washington.
• The main state roadways with the most volume of forest product shipments include SR 395 (908,824 tons), SR 195 (741,053 tons), SR 2 (428,857 tons), and SR 12 (233,765 tons). Other state routes with high volume include SR 20 (650,049 tons), the Okanogan stretch of SR 155 (336,441 tons), and SR 21 (93,340 tons). The counties with the highest volume of raw log shipments on county roadways are Stevens, Ferry, and Spokane.
Future Use of Results This analysis has identified the characteristics of road use and the particular roadways that are important links for the marketing of forest products in eastern Washington. This information can assist planners and policy makers with future decisions on transportation infrastructure needs.
27

EWITS Research Report #23
Impacts of a Snake River Drawdown on Energy Consumption and Environmental Emissions in Transporting Eastern Washington Wheat and Barley
by Nancy S. Lee and Ken Casavant March 1998
Purpose of Study
The purpose of this report is to update energy intensity coefficients and initiate transportation emission research for the eastern Washington agricultural transportation sector and to examine the effects of a Snake River drawdown on energy usage and emissions. Results of this analysis provide information needed for EWITS research objective #2.
Study Objectives
• Calculate current energy used and emissions created by each mode for wheat and barley transport based on a review of literature on energy consumption and emissions by each mode.
• Calculate the energy used and emissions created by each mode in the case of no barge availability above the Tri-Cities for wheat and barley due to a drawdown of the Snake River.
• Summarize the consequences of a modal shift due to a Snake River drawdown in terms of energy consumption, environmental impacts, transportation corridors, and impacts on producers, consumers, and policy makers.
Study Methodology
The data came from the information collected for GIS/GAMS optimization model discussed in EWITS Research Report #18. Minimum distance, least cost routes, and modes used to transport wheat and the GIS/GAMS model for two transportation scenarios finds barley in 1994. The first scenario reflects current market conditions where barge is available along the Snake River ports. The second scenario is one where barge above the Tri-Cities in Washington is not available due to a drawdown of the river to aid the migration of anadromous fish.
Key Findings
• Energy intensity (consumption) and emissions for truck, rail, and barge has decreased since the 1970's. Truck energy intensity declined the least (8.8 percent), rail energy usage improved the most (46.2 percent), and barge energy usage improved 31.3 percent since 1970. The level of hydrocarbons in truck emissions decreased 32 percent from trucks made pre-1963 to trucks produced in 1997 and later.
• The energy consumption for the movement of wheat increases by 1.5 percent in terms of Btu’s when barge is not available. Total emissions output for wheat movement increases by 4 percent, with a significant decrease in sulfur oxide components. As for the movement of barley, overall Btu usage (energy) increases by 41 percent and overall emission levels increase by 24 percent.
• Most of the movement of wheat and barley, which would have gone by barge, is transported by rail (due to lower costs by rail). Truck usage also increases to make up the difference in transportation needs when barging is not possible. Truck usage requires the most Btu’s per ton-mile and produces more hydrocarbons than rail or barge, but does not produce as many NOx compounds. Therefore, increased truck usage would increase fuel consumption, and counter balances the energy and emissions efficiency of rail and barge in terms of different emission components. Thus, while a river drawdown may increase shipper costs and change road damage impacts, it also appears to slightly increase energy consumption and emissions production.
Future Use of Results
This analysis provides planners and policy makers with estimates of the transportation and environmental impacts of a Snake River drawdown.
28

EWITS Research Report #24
Impact of a Snake River Drawdown on Transportation of Grains in Eastern Washington: Competitive and Rail Car Constraints
by Eric Jessup and Kenneth L. Casavant
Purpose of Study
This study develops and applies the empirical method and tool (the GIS/GAMS transportation model) for examining the consequences of different policies impacting the transportation infrastructure in eastern Washington. This study extends the analysis found in EWITS Research Report #18 to investigate the impacts that a Snake River drawdown would produce on the regional transportation system if rail and barge shipping rates were to increase and rail capacity was constrained to reflect possible rail car shortages. Results from this analysis provide information needed for EWITS research objectives #1 and #2.
Study Objectives
• Develop a transportation optimization model for accurately modeling commodity movements on eastern Washington highways, railroads, and river system.
• Link the transportation optimization model with pavement damage models to predict wear and tear, highway infrastructure impacts, and financial recovery needs.
• Estimate shipper transportation costs for different policy scenarios, incorporating pricing interactions from rail and barge companies competing in the region.
• Spatially identify the infrastructure network supporting grain truck shipments under different policy scenarios on eastern Washington roads and highways.
Methodology
This study uses the GIS/GAMS transportation cost optimization model that was described in EWITS Research Report #18. Nine different scenarios, ranging from modeling the current use of barging on the Snake River to considering both capacity constraints to the volume of grain that can be shipped by rail (110 percent of historical rail volume for each grain elevator) and increasing rail and barge shipping rates (by 10 percent and 20 percent), are analyzed.
Key Results
• Adding a constraint on the wheat volume rail companies could carry results in a large jump in both highway flows (105,542 tons) and ton-miles (615,678,253 ton miles). There is greater wear and tear on the region’s highways and thus greater infrastructure investments (an increase of $2.1 million above the current barge use case for a total $8.5 million). The increased truck hauls caused transportation costs to increase to $71,418,086 (53.76 cents/bushel as opposed to 49.61 cents/bushel for the current use case).
• Increasing rail rates cause wheat shippers to substitute away from rail and toward truck-barge. Wheat shippers close to the Tri-Cities are the first to switch to truck-barge. Both 10 percent and 20 percent rail rate increases cause greater highway investment needs. When barge rates are increased, wheat shippers alternatively substitute rail for truck-barge. Transportation costs increase by larger margins when rail rates increase due to the larger volume that will be shipped by barge.
• With both increases in rail and barge rates, barge becomes the relative least cost choice, causing wheat volume to shift from rail to barge. Truck traffic increases leading to the highest transportation cost ($77.1 million - 58.02 cents/bushel) and highway investment needs ($8,511,180).
• For the most part, barley shipments follow the same pattern. When rail, barge rates increase, and volume shipped by rail are constrained, transportation costs for barley ($6.14 million - 36.71 cents/bushel as opposed to 28.32 cents/bushel in current use case) and as will highway investment needs ($1.14 million) will be the highest under this scenario.
Results/Implications
These results indicate that the loss of barging due to a Snake River drawdown will not result in the catastrophic, but the transportation costs will be greatly affected depending upon rail car availability and increases in rail and barge shipping rates.
29

EWITS Research Report #25
Impact of North American Free Trade Agreement (NAFTA) on Washington Highways Part II: Highway Damage by Corridor
by Ken Eriksen and Kenneth L. Casavant November 1998
Purpose of Study
This study continues the analysis of the impacts of NAFTA (see Part I: EWITS Research Report #14) on the state’s transportation system by focusing on the highway infrastructure investment requirements needed to sustain the trade flows resulting from NAFTA. Results from this analysis provide information needed for EWITS research objectives #1 and #2.
Study Objectives
• Determine impacted highways and assess needed transportation investment to support NAFTA trade on Washington highway corridors.
• Assess implications that arise from changes in NAFTA trade for Washington highway corridors.
Methodology
Part II uses the projected major commodity flows on highway corridors (discussed in Part I) as the foundation to formulate highway investment requirements.
Key Results
• NAFTA truck ton-miles on Washington highways are expected to increase from 10.4 billion in 1994 to 13.4 billion by 2005 (a 29 percent increase).
• The three highways, I-5, U.S. 97, and U.S. 395, form the core infrastructure to examine the impacts of NAFTA trade. In 1994, the share of the NAFTA truck ton-miles on I-5, U.S. 97, and U.S. 395, were 75 percent, 15 percent, and 9 percent, respectively. By 2005, the share of ton-miles on I-5 is expected to decrease below 75 percent, while U.S. 97 increases to 16 percent, and U.S. 395 increases to 10 percent.
• Highway maintenance requirements on highways associated with the increase in NAFTA trade are expected to increase from 9.1 billion in 1994 to 22.6 billion by 2005 (a 148 percent increase). Northbound movements will cause 49 percent of the damage and southbound movements 51 percent.
• The truck ton-miles on I-5, U.S. 97, and U.S. 395 are expected to triple by 2005 to 8.9 billion ton-miles. Northbound movements will nearly triple to 6.2 billion ton miles while southbound movements will double to 2.7 billion ton miles. I-5 supports 88 percent of the NAFTA ton-miles among these three highways and will require 61 percent of the increased highway investment needs. U.S. 97 and U.S. 395 will require 22 percent and 17 percent of the highway investment needs, respectively, to sustain future NAFTA trade flows.
• The U.S. 97 highway pavement conditions, reflected by a higher highway damage coefficient, are worse than I-5 and U.S. 395. Its highway damage coefficient (both northbound and southbound movements) of $0.0121 per ton mile is about seven times greater than on I-5, and more than half as much greater than on U.S. 395, and is about 1.1 times greater than it’s southbound coefficient.
• Damage per ton-mile for southbound movements is expected to be $0.0042 per ton-mile, which is about 2.5 times greater than northbound movement estimates. The higher southbound damage coefficient is attributed to heavier trucks heading south from Canada, where the average truck weight (37.8 tons on I-5 and U.S. 97, but 39.6 tons on U.S. 395) is heavier than the northbound movement average weight (34.1 tons).
Future Use of Results
These findings help policy makers determine the extent that highway investments need to increase in order to sustain the new levels of trade resulting from NAFTA.
30

EWITS Working Paper #1
Grain Receipts at Columbia River Grain Terminals by Ken Casavant
This report has been revised and updated in EWITS Working Paper #9.
31

EWITS Working Paper #2
Prospective Estimates for Road Impacts in Eastern Washington From a Drawdown of the Lower Snake River
by Jerry C. Lenzi, Eric L. Jessup, and Ken Casavant
Purpose of Paper
This paper provides estimates of the accelerated wear on county roadways and the state highway infrastructure that could result from increased roadway usage resulting from a Lower Snake River drawdown. Results from this research provide information needed for EWITS research objective #3.
Objectives
This analysis will examine two drawdown scenarios:
1) a drawdown that is for two months in duration from approximately April 15 to June 15 and 2) a drawdown that is for four months in duration from approximately April 15 to August 15. 3) The drawdown scenarios will also be considered assuming one-half of the grain will be trucked to
Pasco due to rail car shortages.
Methodology
This analysis is based on the following estimates:
1) Damage to state highways = $0.071 per ton-mile. 2) Damage to county roads = $0.1065 per ton-mile. 3) 362,360 tons of agricultural commodities are shipped per mile by barge-truck during April 15-June 15. 4) 967,020 tons of agricultural commodities are shipped per mile by barge-truck during April 15-August
15.
Key Findings
Road wear for a two-month drawdown was $459,770 ($200,130 for county road damage plus $239,640 for state road damage) compared to $1,257,080 ($295,440 for county road damage plus $961,640 for state road damage) when there is no drawdown. Road wear for a four-month drawdown was $1,225,540 ($587,020 for county road damage plus $638,520 for state road damage) compared to $3,352,240 ($787,850 for county road damage plus $2,564,390 for state road damage) when there is no drawdown. Thus, a river drawdown could decrease the amount of road damage, particularly on state roads where a 63 percent decrease is possible. However, if one looks at the dollar impact per mile, one can find accelerated wear per mile on selected routes. The dollar impact per mile for a two-month drawdown was $30,630 ($14,670 for county roads and $15,960 for state roads) compared to $27,920 ($6,560 for county roads and $21,360 for state roads) when there is no drawdown. The dollar impact per mile for a four-month drawdown was $81,690 ($39,130 for county roads and $42,560 for state roads) compared to $74,480 ($17,500 for county roads and $56,980 for state roads) when there is no drawdown.
When considering both scenarios with trucking grain to Pasco, the county road system experienced a reduction in impacts after a drawdown, whereas the state system experienced a 50 percent increase in impacts. The aggregate impact for the entire roadway system was a net increase of 21 percent. Other external factors that should be considered are the costs of county road construction, the possible increases in rail rates, the rate of emissions produced by different modes, and the varying grain capacities of different modes. Regarding capacities, a drawdown coupled with a rail car shortage would result in an additional 60,000 plus one-way truck trips on the 100 miles of road between Pasco and the centers of grain production.
Future Use of Results
Based on these conservative estimates, there is a potential for general increased impacts and stress upon county and state roads resulting from a drawdown. This analysis demonstrates the need to invest in the infrastructure to ensure preservation of the surface transportation system to move grain.
32
EWITS Working Paper #3
A GIS and Transportation Optimization Model Approach to Determining Highway and Rural Road Commodity Flows
by John Ellis, Eric L. Jessup, and Ken Casavant Purpose of Paper This paper presents an application of the use of a Geographic Information System (GIS) and a classical least cost transportation optimization model by examining the impacts on the roads and highways of eastern Washington of a potential removal of barge traffic on the Snake River. As a preliminary study, this paper examines the impacts to Adams County only. Results from this analysis provide information needed for EWITS research objectives #2 and #3. Objectives
• Develop a framework using the GIS system that incorporates information on the roads and highways in eastern Washington.
• Incorporate this information into a least cost transportation optimization model that takes into account alternative transportation modes for the agricultural sector of eastern Washington.
• Model the impacts of removing barge traffic on grain movements from Adams County. Methodology This analysis uses a transportation optimization model for commodity flows and blends a GIS program with a Generalized Algebraic Modeling System (GAMS) optimization package. The data on the transportation and marketing system being modeled including highway information from DOT and grain shipment locations with other additional road data from the U.S. Census Bureau. Additional information came from a survey of grain elevators in the region (discussed in EWITS Research Report #12). Other sources were consulted for the extensive data needs concerning location and capacity of on-farm storage as well as more refined locations of exactly where grain shipments originate in each county. Key Findings
• For Adams County, there would be greater use of rail if no barging were allowed. Transshipment from one elevator to another, especially to those elevators with rail access, also increases. Barley shipments did not change if barging is not available. Eighty-one percent of total barley produced went to nearby feedlots at Warden in Grant County. Shipment costs and the imbedded constraint that limited direct shipments from township to port to a maximum of 60 miles resulted in flows going into rail access locations at Schrag and Ritzville. Flows of traffic on east-west routes in the county increase significantly if there is no barging.
• The integration of GIS and the transportation optimization model was successful. Future work will develop a multi-period optimization model. The model will also be expanded to include on-farm storage locations as production sites (increasing the size of the model ten-fold).
Future Use of Results This model provides a basis to model alternative traffic flows resulting from changes in transportation policy. For this case, the closing of barge traffic is an extreme option considered in salmon recovery plans. This preliminary analysis illustrates potential changes in grain transport costs under the extreme option of no barging.
33

EWITS Working Paper #4
A Comparison of Canadian versus All Truck Movements in Washington State With a Special Emphasis on Grain Truck Movements
by Kate Painter and Ken Casavant March, 1996
Purpose of Paper New transportation policies in Canada, coupled with the North American Free Trade Agreement (NAFTA) will increase both the grain and general freight shipments into Washington State. These movements will lead to deteriorating highway conditions in Washington due to increased truck movements. This preliminary study examines the profile of Canadian trucks in Washington State and compares it with the profile of all trucks operating in Washington State. Results from this analysis provide information needed for EWITS research objective #1. Objectives This study also focuses on the northeast counties of Washington where grain shipments from Canada are expected to enter. Specific objectives include:
• Describing the payload weight on the vehicles excluding all trucks that had no payload. Overall, trucks were empty about 30 percent of the time during the survey. Payloads were used as a proxy for vehicle weight (which depends on total vehicle weight, axle weight, tire pressure, tire type, etc.).
• Describing the carrier base, which indicates whether the transportation firm is located in Canada, Washington State, or some other state or country?
Methodology This analysis uses data collected from the Washington State Freight Truck Origin and Destination Survey that is described in EWITS Research Report #3. Key Findings
• Canadian trucks carry 4.4 percent heavier payloads when compared to all truck payloads in Washington State. For the five northeast counties, Canadian truck payloads are over 11 percent heavier (averaging 43,451 pounds per payload) compared to all truck payloads statewide (averaging 39,037 pounds per payload). Canadian payloads are 44 percent heavier during the spring season.
• Grain payloads were, on average, 44 percent heavier than payloads for all trucks, except during spring when road restrictions constrain payload. In the five northeast counties, average payloads for grain trucks averaged 26 percent greater than for all trucks for fall and winter. Grain payloads decreased by over 20 percent statewide during the spring.
• The northeast region has a higher percentage of loaded trucks (76 percent) than the state, overall (70 percent). Canadian trucks are more often loaded than all trucks in both the overall state at 89 percent and the northeast region at 83 percent.
Future Use of Results This analysis provides policy makers with information on the impacts to the highway infrastructure resulting from NAFTA.
34

EWITS Working Paper #5
Estimating the Value of Rail Car Accessibility for Grain Shipments: A GIS Approach by Eric L. Jessup, John Ellis, and Ken Casavant
Purpose of Paper The availability of rail cars can greatly affect the efficient movement of grain in eastern Washington. Rail car shortages during harvest can force grain producers and shippers to use more costly truck transport. Increased truck movements lead to more road damage, increased traffic safety concerns, and increased energy utilization. This analysis provides estimates of the value of rail car accessibility to producers of grain. Results from this analysis provide information needed for EWITS research objectives #2 and #3. Objectives
• Determine the changes in transportation flows for different levels of rail usage in the 20-county grain production region of eastern Washington.
• Estimate the impacts on the producer’s cost of transportation due to constrained rail car supply.
Methodology This analysis employs a transportation cost optimization model and the Geographical Information System (GIS) that incorporates grain originating from the 695 township centers and passing through 400-grain elevators in the region. Eleven different rail usage scenarios were used. The base scenario restricts car availability to historic levels. This base is then further restricted by increments of 10 percent, going up to a 50 percent decrease. Car availability in the base scenario is also increased by increments of 10 percent, up to a 50 percent increase. Key Findings
• Total transportation costs decline considerably with each allowable increase in rail transport; however, the decrease to transportation cost becomes smaller for each increase in rail car availability.
• Transportation cost, storage and handling cost, and interest cost increases substantially as rail car shortages become more severe.
• Value of rail car access varied from $128.90 per rail car, in the most restrictive rail car scenario, to $109.80 per rail car when rail constraints are increased to 50 percent above historical levels.
Future Use of Results The rail car values estimated by this model represent a market for additional rail cars above the current rail rate. Rail companies in the region may utilize these estimates to develop car allocation systems to serve the grain market more efficiently.
35

EWITS Working Paper #6
Truck Movement Characteristic on Selected Truck Routes in Washington State by Kathleen M. Painter and Kenneth L. Casavant
August 1996
Purpose of Paper
This paper examines the basic characteristics of truck traffic by season for selected major truck routes in Washington State. Results from this analysis provide information needed for EWITS research objective #1.
Objectives
• Describe average daily truck traffic volume and average payload weight both by season and by sections for I-90, SR 2, SR 20, and SR 395.
• Describe the distribution of trucks with payloads and types of commodities hauled by season and by sections of I-90, SR 2, SR 20, and SR 395.
• Describe the tons of freight hauled for I-90, SR 2, SR 20, and SR 395. • Describe the distribution of trucks with payloads and types of commodities hauled by season for SR
17, SR 21, SR 25, SR 31, and SR 97. • Describe the average daily truck volume and payload by season; and average annual truck volume
and payload by season for SR 17, SR 21, SR 25, SR 31, and SR 97. • Describe the tons of freight hauled per day by section and season for SR 17, SR 21, SR 25, SR 31,
and SR 97.
Methodology
This analysis uses data collected from the Washington State Freight Truck Origin and Destination Survey that is described in EWITS Research Report #3.
Key Findings
• For I-90, the highest average daily flow of 3,025 trucks was between Cle Elum and Tokio. These trucks also carried the lightest average load. The highest volume of seasonal traffic was spring for the western section and fall for the eastern and central sections. Food products comprised the highest volume of traffic for each of the three sections (farm products tied food product volume on the western section). Average daily tonnage of freight was 17,473 tons for the Seattle-Cle Elum section, 24,355 tons for the Cle Elum-Tokio section, and 20,199 tons for the Tokio-Spokane section.
• For SR 2, average daily flow of truck traffic was double for the Everett-Wenatchee (western) section over the Wenatchee-Spokane (eastern) section. Wood and lumber products comprised 45 percent of trucks with freight for the western section. Average payload was one-third lighter for the eastern section. Average daily freight for the western section was 4,746 tons and 3,929 tons for the eastern section.
• For SR 20, the Burlington-Tonasket (western) section is more heavily used by truck traffic. Trucks in the eastern and central sections carried a higher percentage of forest products. Average daily freight was 573 tons for the eastern section, 505 tons for the central section, and 1,317 tons for the western section.
• For SR 395, truck traffic is heaviest on the Ritzville-Pasco (southern) section with an average daily flow of 6,960 trucks and an average payload of 15.54 tons. The Spokane-Canada section averaged 465 trucks daily with an average payload of 23.55 tons.
• For the remaining routes, SR 17 and SR 97 are used most frequently with average daily flows of 1,566 and 1,234 trucks, respectively.
Future Use of Results
This report provides information on freight truck traffic on major routes in Washington, which can be used by policy makers when planning future highway investments.
36

EWITS Working Paper #7
Grain Receipts at Columbia River Grain Terminals by Nancy S. Lee and Ken Casavant
January 1997
Purpose of Paper
This paper evaluates the volume of grain into and through the terminals and export facilities used to move grain from barge, rail, and truck onto the ocean segment for transportation overseas. Results from this analysis provide information needed for EWITS research objectives #1 and #2.
Objectives
1) Evaluate the volume of wheat and barley shipments moving through the Tidewater Elevators from the 1980-81-crop year to the 1995-96-crop year.
2) Determine the modal split in the arrivals of these movements. 3) Determine any discernable changes over time and draw implications on the relationships
between volume and modal splits.
Methodology
The analysis is based on unpublished data on volume and arrivals by mode of transport. The data was developed by a comprehensive survey of all exporting firms merchandising grain through these terminal elevators for the crop years 1980-81 to 1995-96. The survey was done in the fall of 1996 by examination of actual firm records by R. C. Grumary and Associates.
Key Results
• The grain volume received by terminals and export facilities over the 17-year study period average 435 million bushels over the first five years, 413 million over the next five years, and 483 million for the most recent six years.
• An average of 220 million bushels were moved by rail in the first seven years and nearly 278 bushels in the last nine.
• Barge shipments exhibited more steadiness in volume over the study period from 218 million bushels shipped in 1980-81, to a low of 177 million in 1994-1995, but climbing to 227 million in 1995-96--a 29 percent increase in one year.
• Receipts by truck steadily declined over the 16-year period decreasing from 28 million bushels in 1980-81 to 8 million in 1995-96. Even in the record harvest of 1995-96, truck shipments declined in volume.
• Regarding proportion of shipments by mode, the use of rail is clearly dominant increasing from a low of 49 percent in 1981-82 to a high of 63 percent in 1994-95. Currently, the percent of grain transport by mode stands at 60 percent rail, 39 percent barge, and 1 percent truck in 1995-96.
• Barge share of grain shipments have experienced a fairly steady decline in modal share, decreasing from 44 percent in 1980-81 to a record low of 35 percent in 1994-95.
Future Use of Results
This analysis provides information on the grain shipments by mode of transport to terminal facilities, thus providing a picture of overall shipping pattern. Trucks are used mostly for gathering near export facilities. The advent of multiple car rates for rail has resulted in increased use of rail for grain shipments and decreased use of barge shipping. Rail car shortages can affect grain movements to terminal facilities. As the number of cars in the region increases, the barge share of total receipts will continue to decrease relative to rail. However, the modal share of receipts at export elevators does not indicate the relative modal importance to each production area. These issues were not addressed in this analysis.
37
EWITS Working Paper #8
Economic Evaluation of Grain Shipment Alternatives: A Case Study of the Coulee City and Palouse River Railroad
by Eric Jessup and Ken Casavant March 1997
Purpose of Paper This paper investigates the characteristics of grain shipments for elevators located on the recently sold Coulee City to Cheney and Marshall to Pullman rail lines and calculate changes in shipping patterns and routes if rail service is eliminated to improve on these lines. Results from this analysis provide information needed for EWITS research objective #1. Objectives
• Compile, review, and analyze previously existing data and information on grain movements and operating characteristics of elevators served by the Coulee City to Cheney line and the Marshall to Moscow line.
• Survey all elevators on these lines to determine current volumes, port facilities used (river and ocean), transportation mode choice, reasons for that choice, destinations, and total cost from the elevator (rates plus ancillary costs such as grading, inspections, elevations, etc.) by rail and by a truck/barge combination.
• Determine likely transportation routing (specific highway segments) and costs if rail service is lost at each elevator and determine the transportation routing during inadequate or adequate car supply.
• Identify the net impact to shippers (marginal cost increases including shipping and handling costs) if rail service is discontinued.
Methodology This study used information from the 1993 Eastern Washington Road Needs survey of over 400 grain elevators in eastern Washington. The survey provided detailed information concerning grain movements, by mode, in addition to shipping rates and handling charges. Updated information on the specific elevators located on the rail lines proposed for sale was obtained from detailed phone surveys in September 1996, to each grain company owning each facility. This analysis involves only the grain which moves through those elevators located on the two branch lines and offers three scenarios including: (1) the present grain flow situation, (2) grain flows if the elevators had unlimited access to grain cars, and (3) grain flows if rail service on the tow branch lines ceased. Key Results
• The current difference between rail and truck-barge is 2.61 cents/bushel, weighted by volume. • The optimal scenario for grain shippers is scenario II, where unlimited access to railcars exists
and the two branch lines remain in full operation. Transportation costs to shippers is considerably lower ($162,371) than with the other two scenarios and the infrastructure impacts negligible in comparison.
• Abandonment of these two branch lines will force shippers to use truck-barge and transshipment alternatives, which significantly increase shipment costs ($913,966) and greater costs to highway infrastructure.
Future Use of Results This paper provides a case study of the economic impacts of rail line abandonment on the grain industry, the highway infrastructure, and other safety and environmental concerns. Identifying these trade-offs can assist policy makers working to resolve problems resulting from rail line abandonment.
38

EWITS Working Paper #9
Grain Receipts at Columbia River Grain Terminals by Ken Casavant and Nancy S. Lee
January 1998
Purpose of Paper This paper evaluates the volume of grain into and through the terminals and export facilities used to move grain from barge, rail, and truck onto the ocean segment for transportation overseas. This paper is an update of EWITS Working Paper #7. Results from this analysis provide information needed for EWITS research objectives 1 and 2. Objectives
• Evaluate the volume of wheat and barley shipments moving through the Tidewater Elevators from the 1980-81-crop year to the 1996-97-crop year.
• Determine the modal split in the arrivals of these movements. • Determine any discernable changes over time and to draw implications on the relationships
between volume and modal splits. Methodology The analysis is based on unpublished data on volume and arrivals by mode of transport. The data was developed by a comprehensive survey of all exporting firms merchandising grain through these terminal elevators for the crop years 1980-81 to 1996-97. The survey was done in the fall of 1997 by examination of actual firm records by R. C. Grumary and Associates. Key Results
• The grain volume received by terminals and export facilities over the 17-year study period average 435 million bushels over the first five years, 413 million over the next five years, and 480 million for the most recent seven years.
• An average of 220 million bushels were moved by rail in the first seven years and nearly 270 bushels in the last ten years.
• Barge shipments exhibited more steadiness in volume over the study period from 218 million bushels shipped in 1980-81 to a low of 177 million in 1994-1995 but climbing to an average of 215 million for 1995-96 and 1996-97.
• Receipts by truck steadily declined over the 17-year period decreasing from 28 million bushels in 1980-81 to 8 million in 1995-96, with a small increase in 1996-97.
• Regarding proportion of shipments by mode, the use of rail is clearly dominant increasing from a low of 49 percent in 1981-82 to a high of 63 percent in 1994-95. Currently, the percent of grain transport by mode stands at 55 percent rail, 43 percent barge, and 2 percent truck in 1996-97.
• Barge share of grain shipments have experienced a fairly steady decline in modal share. Barge share decrease from 44 percent in 1980-81 to a record low of 35 percent in 1994-95. However, the percent of grain shipped by barge increase to 43 percent in 1996-97.
Future Use of Results This analysis provides information on the grain shipments by mode of transport to terminal facilities, thus providing a picture of overall shipping pattern. Trucks are used mostly for gathering near export facilities. The advent of multiple car rates for rail has resulted in increased use of rail for grain shipments and decreased use of barge shipping. Rail car shortages can affect grain movements to terminal facilities. As the number of cars in the region increase, barge share of total receipts will continue to decrease relative to rail. Once again, the modal share of receipts at export elevators does not indicate the relative modal importance to each production area. These issues were not addressed in this analysis.
39

EWITS Working Paper #10
Preliminary Observations of Mobility Issues, Concerns, and Efforts in Europe and the United States by Jerry C. Lenzi and Kenneth L. Casavant
October 1998
Purpose of Paper
Nations in Europe are facing many of the same transportation issues regarding freight, passenger mobility, and the environment as those facing Washington State, particularly as the region begins to merge into the European Union (EU). Here, as in Europe, there is the recognition that freight and passenger mobility is needed to ensure a sustainable economic vitality for a region, state, or nation in a global economy. This paper discusses the changing dynamics of the transportation system in Europe and how they relate to developments in transportation policy in the U.S. as both areas struggle to develop an appropriate transportation infrastructure that is competitive in a global economy.
Observations and Recommendations
These observations and recommendations discussed here are based on a number of different sources. In September of 1993, a team of four government state transportation association representatives from the U.S. spent two weeks in Europe to observe and report on European experiences with intermodal freight transportation policies and systems. Meetings were held with senior officials of the Commission of European Communities-Transport and private industry leaders. The conclusions of the team include: (1) the U.S. could benefit by identifying transportation infrastructure networks which are of national interest, (2) the U.S. should consider more innovative and focused funding for intermodal freight transportation that improve our efficiency and competitiveness internationally, and (3) U.S. transportation officials should visit other counties, particularly important trading partners, to learn about their intermodal transportation policies and programs.
In October 1997, a transportation policy forum was sponsored by the ENO Transportation Foundation, the U.S. Department of Transportation, and the European Union. Two important points from this forum include:
1) the EU is trying to implement consistent regulatory policy across its member states, much like what the U.S. is attempting with Mexico and Canada due to NAFTA. It is unclear how the U.S. and Europe can act together to improve intermodal transport without clear consistent policies and implementation within the EU and North America and (2) policy makers, operators, and shippers in both the EU and the U.S. need to better understand how the other system works.
Other important policy developments include the government white paper from the United Kingdom titled A New Deal for Transport, Better for Everyone (1998). Important issues for the entire EU include truck and rail changes, intelligent transportation systems, channel tunnel, intermodal terminals, freight flows and markets, congestion, environment, and passenger issues; and must be addressed if the region is to compete in the global market. In the U.S., both the United States Intermodal Transportation Efficiency Act of 1991 (ISTEA) and the Equity Act for the 21st Century of 1998 (TEA-21) provide a future vision, policy direction, and funding for two six-year increments. Other EU work and research provides insight into infrastructure and policy needs, estimates, and corresponding investments, but is silent on revenue sources. TEA-21 assures that a guaranteed level of federal funds through 2003 is available for transportation investments. TEA-21 also provides funds for different environmental programs such as congestion mitigation, air quality improvement, transportation enhancement, bicycle transportation and pedestrian walkways, recreational trails, national scenic byways, and other pilot preservation projects. The European issues that were raised in the white paper include congestion, carbon dioxide releases, and global warming, but no structured programs that are financed exist.
The EU and North America must cooperate to allow the seamless flow of freight and people, even though the regions compete against each other in the global marketplace. The analysis of the information presented lends itself to continued cooperative discussions, meetings, and exchanges between the continents to foster the exchange of commodities and the efficient movement of people.
40

EWITS Working Paper #11
Grain Receipts at Columbia River Grain Terminals. 1980-81 to 1997-98 by Ken Casavant and Nancy S. Lee
March 1999
Purpose of Paper
This paper evaluates the volume of grain into and through the terminals and export facilities used to move grain from barge, rail, and truck onto the ocean segment for transportation overseas. This paper is an update of EWITS Working Papers #7 and #9. Results from this analysis provide information needed for EWITS research objectives 2 and 3.
Objectives
The objectives of this paper include: (1) evaluating the volume of wheat and barley shipments moving through the tidewater elevators from the 1980-81 crop year to the 1997-98 crop year, (2) determining the modal split in the arrivals of these movements, and (3) determining any discernable changes over time and to draw implications on the relationships between volume and modal splits.
Methodology
The analysis is based on unpublished data on volume and arrivals by mode of transport. The data was developed by a comprehensive survey of all exporting firms merchandising grain through these terminal elevators for the crop years 1980-81 to 1996-98. Additional survey work was done in the Fall of 1998 by examination of actual firm records by R. C. Grumary and Associates. All exporters were initially sent a letter of inquiry. A follow-up personal contact was made as needed. Individual and aggregate data were reviewed and compared to prior years and respective totals.
Key Results
• The grain volume received by terminals and export facilities over the 18-year study period averaged 415 million bushels over the first six years, 435 million over the next six years, and 490 million for the most recent six years.
• An average of 226 million bushels were moved by rail in the first eight years and nearly 281 bushels in the last eight years. Barge shipments exhibited more steadinesses in volume over the study period from 218 million bushels shipped in 1980-81 to a low of 177 million in 1994-1995. The number of bushels barged in 1995-96, 1996-97, and 1997-98 averaged 209 million representing a 20 percent increase in the past three years. Receipts by truck steadily declined over the 18-year period decreasing from 28 million bushels in 1980-81 to a record low of 6 million in 1997-98.
• Regarding proportion of shipments by mode, the use of rail is evident, increasing from a low of 54 percent in 1988-89 to a high of 63 percent in 1994-95; however, the last three years has seen a decrease in rail share falling to 55.7 percent in 1997-98. Currently, the percent of grain transport by mode stands at 55 percent rail, 44 percent barge, and 1 percent truck in 1997-98.
• Barge share of grain shipments have experienced a fairly steady decline in modal share but has seen resurgence since 1995-1996. Barge share decreased from 44 percent in 1980-81 to a record low of 35 percent in 1994-95. However, the percent of grain shipped by barge has increased to 44 percent in 1997-98.
Future Use of Results
This analysis provides information on the grain shipments by mode of transport to terminal facilities, thus providing a picture of overall shipping pattern. Trucks are used mostly for gathering near export facilities. The advent of multiple car rates for rail has resulted in increased use of rail for grain shipments and decreased use of barge shipping (however, in 1997-98, while grain volume decreased 5.2 percent, the volume shipped by rail decreased 5.9 percent while barge share decreased 3.5 percent). The trend suggests that rail volume is more stable while truck-barge is the mover of the residual after rail capacity is utilized. Rail car shortages can affect grain movements to terminal facilities. However, as the number of cars in the region increase, barge share of total receipts will continue to decrease relative to rail. Once again, the modal share of receipts at export elevators does not indicate the relative modal importance to each production area.
41

Case Studies
42

EWITS has produced a large body of research on the dynamics of the transportation system in eastern Washington. The levels of analysis have ranged from examining the impacts of highway passbys on small communities to measuring the changes to truck freight flows resulting from NAFTA. The information collected and reported in the various EWITS publications can be compiled and synthesized to answer specific questions about the transportation system and its links to consumers, producers, industries, cities and counties, and the overall regional economy. To illustrate how information can be used, three case studies are presented below. Case Study #1: Commodity Freight Movements on Washington Highways EWITS research objective #3 calls for documenting freight movements on eastern Washington highways, rails, waterways, and air corridors. As part of this research effort, a statewide survey of truck drivers, administered at 20 different locations along major traffic routes, was conducted between 1993 and 1995. Focusing on truck freight traffic origination, destination, and freight characteristics, this study was the first in the United States to collect statewide truck freight data through direct personal interviews with truck drivers (a complete description of survey development and procedures is provided in EWITS Research Report #3). A total of 30,000 interviews were conducted by over 300 interviewers during the study period. As an example of the kinds of information available from this database, this case study will present information on the types of commodities that are the most frequently hauled on the roadway system in Washington State. Regional Analysis of Commodity Movements EWITS Research Report #9 provides an analysis of the information collected during the Washington State freight truck origin and destination survey. It is estimated that 8.1 million long haul truck trips, carrying cargo weighing over 90 million tons, occur on the state’s highways each year. The value of the cargo carried by this truck traffic is estimated to be $150 billion annually. Regional differences in freight origins exist between the 19 western Washington counties (west of the Cascades) and the 20 eastern Washington counties (east of the Cascades). Of the total truck trips originating statewide, 4.8 million trips originate from western Washington counties compared to 1.2 million trips originating from eastern Washington and 2.1 million trips originating from out-of-state locations. The commodities with the greatest daily average of tons shipped can be found in Table 1. Agricultural, food, and wood related products are among the largest generators of freight traffic originating from eastern Washington. Since these commodities require trucks capable of carrying heavy loads, it is not surprising to see that the average cargo weight for trucks originating in eastern Washington is heavier (19.4 tons per truck load) compared to trucks originating from western Washington (14.5 tons per truck) and trucks originating from out-of-state (17.7 tons per truck).
43

Table 1--Cargo Content for Truck Trips Originating in Eastern Washington Cargo Content Aver. Daily
Tons Shipped % of Total
Tons Shipped % of Total
Value Shipped Crops 18,808 37.7 7.1 Food and Kindred Prods. 10,582 21.2 21.4 Lumber and Wood Prods. 6,326 12.7 3.5 Chemical and Allied Prods. 2,046 4.1 1.3 Cargo originating from western Washington reflects a broader diversity of economic activity compared to eastern Washington. However, Table 2 shows that food and wood related products are also some of the highest average daily truck shipments in this region as well. The cargo exhibiting the greatest proportion of total value is general freight. Table 2--Cargo Content for Truck Trips Originating in Western Washington
Cargo Content Aver. Daily Tons Shipped
% of Total Tons Shipped
% of Total Value Shipped
Lumber and Wood Prods. 34,802 25.8 3.8 Food and Kindred Prods. 23,122 17.1 8.0 General Freight 11,161 8.3 18.9 Petroleum Refining Prods. 9,049 6.7 0.7 Commodity Movements on Major Traffic Corridors Analysis of commodity movements on major traffic corridors could also be done using the survey data. Table 3 presents the percentage of total trucks carrying commodities on several major traffic corridors. The four commodities listed are those which had the highest percentage based on an average for all statewide movements. The table illustrates the variability of truck movements of these commodities along these corridors. Table 3:--Percent of Total Trucks Carrying Selected Commodities on Major Washington Freight Corridors
Cargo State Aver. I-5 I-90 I-82 SR 97 SR 395
North of Spokane Food Related Products 18.77 17.94 21.05 23.22 15.37 5.69 Wood Related Products 14.18 15.47 9.98 9.21 13.01 50.47 Crops 9.61 6.65 15.28 21.11 28.04 2.13 General Freight 9.29 9.05 9.20 8.12 4.74 1.10
44

Additional analysis of the truck traffic on the U.S. Highway 395 was conducted in both EWITS Research Report #4 and EWITS Research Report #8. Supplementing the data from the Washington State Freight Truck Origin and Destination survey with both primary data collection and secondary data sources, a comprehensive picture of freight movements on this corridor has been developed. Focusing on truck freight movements on the south central portion of U.S. 395 (EWITS Research Report #8) extending from Kennewick, Washington to Pendleton, Oregon, and over to Walla Walla, Washington, over 1,170 trucks with cargo carry food and kindred products on a 24-hour basis--the highest volume of all the commodities. The value of this daily cargo is estimated at $21.6 million. The second largest volumes are crop and livestock products with over 800 trucks daily, at a value of $3.2 million. The third largest volume is lumber and wood products, with over 770 daily truck trips valued at $5.3 million. EWITS Research Report #4 provides more analysis of truck freight on U.S. 395 north of Spokane, particularly focusing on freight movements with Canadian origins. Wood and chemical products are the primary Canadian commodities shipped to the U.S. Sixty-two percent of all southbound cargo from Canada (passing through the Deer Park southbound weigh station) is a primarily processed lumber and wood chip while 16 percent is chemical products mostly originating from Trail, British Columbia. Laurier and Frontier are the primary crossing points for Canadian trucks using U.S. 395. Commodity Freight Movements at the County Level EWITS Research Report #21 is a series of reports on the truck traffic characteristics within each of the 39 Washington counties. Table 4 presents a summary table identifying the commodity that had the largest percent of truck trips per year that either originated or ended in each county. The information from this table shows that in 12 counties, lumber and wood products rank highest in the percentage of truck trips per each in these counties. Agricultural products ranked the highest in another 12 counties while food and kindred products ranked highest in 12 other counties. While the link between the highway transportation and the marketing of many diverse products is important for the state economy as a whole, this case study, compiled from five different reports, illustrates just how important an efficient transportation system is for the agriculture, wood products, and food processing industries.
45

Table 4--Truck Trips by Commodity for Truck Traffic Originating or Ending in Each County
County Commodity Truck Trips
Per Year (%)
Total Tons
Weight Percent
Average Payload (Tons)
Adams Food 36 2,406 44 24 Asotin Lumber/Wood 20 493 23 20 Benton Agricultural 33 12,543 44 23 Chelan Agricultural 22 14,848 26 20 Clallam Lumber/Wood 17 9,223 26 24 Clark Agricultural 18 41,155 27 21 Columbia Agricultural 38 378 54 30 Cowlitz Lumber/Wood 34 81,839 47 29 Douglas Agricultural 20 561 35 22 Ferry Lumber/Wood 35 1,244 58 27 Franklin Agricultural 18 24,258 38 25 Garfield Machinery 41 14 8 8 Grant Agricultural 31 43,247 35 24 Grays Harbor Lumber/Wood 26 38,470 55 27 Island General Freight 12 306 6 8 Jefferson Lumber/Wood 17 1,695 42 28 King Food 21 123,083 22 17 Kitsap Food 12 4,352 20 18 Kittitas Agricultural 16 7,488 33 20 Klickitat Lumber/Wood 14 9,243 61 24 Lewis Lumber/Wood 37 41,832 60 28 Lincoln Agricultural 30 1,188 55 27 Mason Lumber/Wood 64 9,208 57 28 Okanogan Agricultural 32 4,759 45 19 Pacific Lumber/Wood 23 3,891 41 28 Pend Oreille Lumber/Wood 25 2,741 44 32 Pierce Food 18 43,612 16 15 San Juan Food 49 73 35 4 Skagit Food 24 10,790 28 16 Skamania Machinery 85 371 90 23 Snohomish Food 15 20,569 14 12 Spokane Food 22 33,123 22 18 Stevens Lumber/Wood 55 10,979 64 27 Thurston Food 21 10,909 23 17 Wahkiakum Food 36 192 24 16 Walla Walla Food 20 12,099 21 19 Whatcom Food 18 12,591 18 15 Whitman Agricultural 21 210 25 26 Yakima Agricultural 26 7,354 28 21
46

Case Study #2:The Link Between Transportation Systems and Regional Economic Development Examination of commodity flows demonstrates the dependence that many prominent industries have on the transportation system. It can be inferred from this evidence that investments in the transportation system that promote economic efficiency (reduce transportation costs) can produce tremendous benefits for both producers and consumers that can be felt throughout the regional economy. EWITS has developed an accounting framework, a regional transport oriented input-output table, that can provide estimates of the contribution the transportation systems makes to the economy of eastern Washington. Traditional regional economic theory holds that the economic growth of a region is highly dependent on the sale of locally produced goods to markets outside the local region. The income generated from the sale of these “exported” goods supports the development of the local economy. Increasing the sale of exported goods leads to an expanding local economy. A key link in this process is the access that transportation systems provide to export markets. EWITS has conducted research on the economic impacts that the transportation industry has on the eastern Washington economy. This research has examined these impacts on several levels; from the broader regional economy, the localized economies of cities and town, and the location decisions of individual firms in the region. This discussion will present results from various EWITS research reports that considered the transportation industry and how it affects the economic development of eastern Washington. This allows policy questions faced by the state of Washington to be addressed with a solid database. Regional Economic Development In order to understand the economic contribution of the transport industry to the eastern Washington economy, a regional input-output model was developed in EWITS Research Report #10 and applied in EWITS Research Report #11. An input-output model is an analytical tool that can trace the economic impacts resulting from the expansion (increase in sales or output) of an export industry. The model acts like an accounting system where various firms in the region are grouped into sectors that produce a similar product. This accounting framework serves three purposes. First, the model provides a comprehensive and detailed set of accounts on all economic activities within the region using known and observable market prices. This information provides a picture of the exchange of commodities among eastern Washington industries, identifies the value of output produced by different industries and the markets where they are sold, and identifies the purchases of inputs made by each industry. Second, the model can be used in calculating multipliers that are used in economic impact analysis. An input-output multiplier is a summary measure of an industry’s impact on the regional
47

economy. Separate multipliers can be calculated to estimate the amount of output, employment, and/or income in the regional economy that is generated by a particular industry. Finally, the information provided in the input-output model can be used for forecasting economic and demographic trends in the regional economy. To this end, the input-output model can be combined with econometric models to measure changes in the region’s exports due to changing national and international market conditions. The EWITS input-output model produced the following information concerning the transportation industry in eastern Washington. In 1992, all transport services combined employed 16,418 workers (2.8 percent of total regional employment) with labor earnings equaling $508.8 million (3.4 percent of total regional labor earnings). Transport services comprised 3.6 percent of the total eastern Washington regional output of $33.5 billion. Trucking is the dominant transport mode with $631.6 million in total operating revenues (includes both inter-industry sales and final sales); followed by railroads at $205.6 million, the U.S. Postal Service at $136.4 million, and air transport at $84.1 million. Approximately 60 percent of transport industry final sales are for exporting goods and services to outside markets. Practically every industrial sector in the region relies on the transport industry. Regarding the value of exported services to out-of-region customers, the transport industry in eastern Washington had sales of $641.7 million (over half of total transportation industry sales). To conduct economic impact analysis of the transport industry, multipliers were derived from the input-output model. As an example, the following multipliers for the transportation services sector were calculated: an output multiplier of 1.777 (the total output or sales generated in all sectors of the economy per dollar of output in the industry); total employment multiplier of 1.69 (the total employment generated in all sectors of the economy per job in the industry); and a labor income multiplier of 0.725 (the total labor income generated in all sectors of the economy per dollar of output in the industry). Therefore, the total direct and indirect impact of transport services in eastern Washington in 1992 was $1.11 billion in output, 17,355 in jobs, and $458.6 million in labor earnings. EWITS Research Report #11 illustrates an example of economic impact analysis using the input-output model. If a new food processing plant locates in the region with an annual production value of $75 million (ignoring the construction of the facility), this would result in the transport services sector expanding by $2.1 million and employment increasing by 30 additional workers earning an additional $0.8 million. The economic relationships quantified by the input-output model can be used with other studies to determine the regional impacts due to changes in economic conditions or public policy. For example, EWITS Research Report #14 provides estimates of the changes in U.S.-Canada trade flows on major Washington highway corridors resulting from the North American Free Trade Agreement (NAFTA). This study found that NAFTA trade on Washington highways would increase almost 31 percent by 2005. It was also found that the share of this trade would increase on both U.S. 97 and U.S. 395 over this same time period. Increases are expected in the movements of canned and
48

preserved fruits, vegetables and seafood, miscellaneous foods, and chemicals. Lumber exports to Canada are expected to decrease. With more specific information on how much of this trade will be provided (or lost) to firms in the region, the economic impacts on the region’s economy can be predicted using the input-output model. Impacts on Local Development While an input-output model provides analysis on a regional level, the economic consequences felt at the local level tend to be ignored in such a model. EWITS has also conducted research on how the placement of state routes has affected economic development in small towns. EWITS Research Report #2 provides case studies of seven eastern Washington cities that either has a route bypass or has a state route as part of their main street. Findings from this study provide policy makers with possible strategies to minimize the potential economic losses or maximize the benefits to a community that has been bypassed. The study found that communities with state route bypasses were less adversely affected by the bypass if their downtown business districts had a well-developed local customer base. Also, these bypassed communities were less impacted if there was systematic development of highway-related businesses and other retail businesses along bypass interchanges (e.g., locating rest stops near interchanges). Adverse impacts can also be mitigated through annexation of areas developed by new businesses along these interchanges. Other innovative strategies to deal with a state route bypass include: (1) flexible land use planning that allows the shifting of downtown building use from businesses dependent on highway traffic to other uses like residential development, service businesses, or light manufacturing and (2) promotion campaigns to entice highway travelers to stop. The main benefit of having a state route main street is that it provides for the local development of specialized businesses that can rely on a mix of both local customers and highway travelers. However, the tradeoffs with having a state route main street are more congestion and the higher incidence of accidental damage to parked vehicles. Impacts on Location Decisions of Individual Firms EWITS Research Report #1 focuses on the individual location decisions of new firms (both manufacturing and non-manufacturing) locating in Washington State between 1990 and 1993. The results from the survey demonstrate the high dependence that new firms in eastern Washington have on the transportation system. Over 75 percent of manufacturing firms in the region rely on motor freight to deliver or receive products. For firms in eastern Washington, 43 percent of manufacturing firms (particularly food manufacturing firms) and 54 percent of the retail/service firms indicated that locating near an interstate highway was an important factor in their location decision. When considering locating near a high traffic route location, 31 percent of manufacturing firms and 61 percent of the retail/service firms indicated it was an important factor in their location decision.
49

With regard to other modes of transportation, 23 percent of manufacturing firms (particularly industrial machinery manufacturing firms) and 20 percent of the retail/service firms indicated that having convenient air freight service was an important factor in their location decision. Export oriented firms rely more on marine and inland barge transportation. Given the linkage of the transportation system and regional economic growth, the bulk of research conducted under EWITS is ultimately concerned with the economic growth of the region. The research mentioned in this case study provides a comprehensive view of the contributions that the transportation industry makes to both the local and regional economic development. Specific policy questions of investment, regulation, revenue distribution, etc., can be examined in this context using these study results. Case Study #3: Snake River Drawdowns: Implications for the Eastern Washington Transportation System Of the many policy issues that confront transportation planners, one of the more pressing issues involves the Columbia-Snake River fishery. The listing of four Snake River Chinook and sockeye salmon species under the Endangered Species Act could force considerable changes in the management of the dams along the Columbia-Snake River system. One possible strategy to increase the survival rates of salmon smolts migrating through the system is a river drawdown. This strategy involves increasing river flows along the Snake River during smolt migration. Such a drawdown may assist migration by “flushing” the juvenile salmon downstream, through the Snake River dam system, into the Columbia River, and out to the Pacific. One tradeoff resulting from this strategy is reduced water levels which impedes barge transportation along the lower Snake River. The loss of barge transportation on the Snake River could have implications not only for the management of the river system, but also for the management and planning regarding the region’s transportation system. First, the loss of barge transportation could have adverse impacts on shippers of grain, which rely on this mode of transport. Second, switching to the use of truck transport as an alternative to barge transport may result in greater deterioration of eastern Washington highways. Also, the switching to alternative modes of transport to haul grain will affect the level of energy consumption and pollutant emissions associated with the three modes of transport in the region. To examine these impacts, EWITS has conducted several studies to determine how the transportation system in eastern Washington will be affected if barging is no longer available. The blending of these studies reveals the “adaptive research” approach of EWITS. The implications from these studies show how rail car availability and rate increases are important factors in salmon recovery.
50

Impacts on Transport Mode Usage and Transportation Infrastructure EWITS Research Report #18 presents a preliminary analysis to predict the change in rail and highway transport shipment of grain if barging is not available. A transportation optimization model was developed to predict the alternative use of rail transport and truck transport while still minimizing transport costs to shippers of grain. The marketing of grain in the region is complex and must incorporate information on the source areas of grain production; the intermediate destinations of grain including grain elevators and rivers; and final market destinations including feedlots and ocean ports. The resulting model encompasses a marketing system that involves, at most, 695 township centers (local production areas) shipping grain to over 400 grain elevators (intermediate destinations) and then on to the port facilities in Portland, Oregon and Vancouver, Washington. The grain production year analyzed is 1994. If grain shippers were to minimize transportation costs when no barge transport is available, the model produces the following results (assuming no changes in shipping rates by rail or barge):
1) Total transportation costs for all wheat shipments increase to $67.2 million from the $65.9 million in transportation costs if barging was still available. This represents a $1.3 million difference. When spread across the 132 million bushels produced in eastern Washington in 1994, transportation costs increase about one cent per bushel, on average. There will be higher costs for grain producers who ship directly from the farm to river ports (a 6.2 cent per bushel increase in transportation costs). Shipments between elevators would increase 2 cents per bushel for these intermediate shipments due to the longer distances that must be traveled to reach elevators with rail access. Transport costs for elevators shipping to river ports decreases 2.7 cents a bushel since these firms will continue to ship to river ports below the Tri-Cities.
2) Approximately 28 million bushels of wheat would now be switched from barge to rail if
there were a river drawdown (assuming that rail firms have the capacity to handle this additional volume). The largest change in modal transport usage would be the elevator to river port shipments, which would now be shipped by rail instead of by barge.
3) Total transportation costs for all barley shipments increases to $5.9 million from the $4.7
million in transport costs if barging was still available. This is a difference of $1.1 million. Based on 16.7 million bushels of barley produced in 1994, this increases averages 6.8 cents per bushel. Barley shippers, which continue to ship from farm to river ports, will see an increase in transport costs of 12.9 cents per bushel due to the longer distances to the available river ports (i.e., Tri-Cities) that must be traveled.
4) Approximately 5,000 bushels formerly shipped from townships to river ports by truck and
then from river ports to Portland by barge would now be shipped from elevators to Portland by rail. Truck to barge transport remains the largest modal share of barley shipments even with a drawdown.
5) The 395 corridor with access to the Tri-Cities river ports would see an increase in truck
traffic carrying shipments of both wheat and barley if there were no barging on the Snake River.
51

EWITS Research Report #24 presents additional analysis of the impacts on the transportation system by considering both capacity constraints to the volume of grain that can be shipped by rail, and increases to rail and barge shipping rates. Table 5 presents the results of the nine transportation scenarios that were examined in the reports. By incorporating a rail capacity constraint of 110 percent of historical rail volume for each grain elevator, and increasing rail and barge shipping rates by 10 and 20 percent, the cost of shipping wheat ranges from 49 cents per bushel (scenario 1) up to 58 cents (scenario 9); while the cost of shipping barley ranges from 28 cents per bushel (scenario 1) up to 37 cents a bushel (scenario 9). The greatest transportation cost increase occurs when rail capacity is constrained, both rail, and barge rates increase by 20 percent. This results in a total transportation cost of $83.2 million for grain ($77.1 million for wheat plus $6.1 million for barley) as compared to a total transportation cost of $70.6 million for grain ($65.9 million for wheat and $4.7 million for barley ) when there is no drawdown. Table 5: Summary of Total Transportation Costs for Wheat and Barley
Scenario Total Transportation Costs for Wheat in $
(cents/bushel)
Total Transportation Costs for Barley in $
(cents/bushel) 1 - Initial Case (no drawdown) 65,901,175
(49.61) 4,733,498
(28.32) 2- Drawdown Unconstrained No Change in Shipping Rates
67,205,833 (50.59)
5,874,046 (35.14)
3 - Drawdown, Constrained to 110% of Historical Volume
71,418,086 (53.76)
5,874,351 (35.14)
4 - Drawdown, Constrained to 110% of Historical Volume, 10% Rail Rate Increase
72,331,887 (54.45)
5,874,787 (35.14)
5 - Drawdown, Constrained to 110% of Historical Volume, 20% Rail Rate Increase
73,244,613 (55.14)
5,874,952 (35.14)
6 - Drawdown, Constrained to 110% of Historical Volume, 10% Barge Rate Increase
73,330,501 (55.20)
5,999,689 (35.89)
7 - Drawdown, Constrained to 110% of Historical Volume, 20% Rail Rate Increase
75,242,956 (56.64)
6,129,967 (36.67)
8 - Drawdown, Constrained to 110% of Historical Volume, 10% Barge and Rail Rate Increase
74,246,808 (55.89)
6,001,603 (35.90)
9 - Drawdown, Constrained to 110% of Historical Volume, 20% Barge and Rail Rate Increase
77,075,055 (58.02)
6,137,264 (36.71)
52

Impacts on Energy Consumption and Environmental Emissions The shifting of transportation modes for grain shipments will have other impacts affecting the environment. To broaden the region’s understanding of these impacts, additional analysis of the energy consumption and level of emissions that would transpire if a drawdown was implemented, was examined in EWITS Research Report #23. Using updated results from the optimization model found in Jessup (1998) and current information on energy usage and emissions by mode of transport, a Snake River drawdown would produce the following effects:1
1) Energy consumption for all shipments of wheat (measured by Btu’s) would increase slightly (1.5 percent). On average, barge is more fuel-efficient than rail. The increased combination of rail and truck usage results in this slight increase. There is a 4 percent increase in overall emissions output. Particulate matter (PM) increases by 12 percent while sulfur oxide (SOx) emissions decrease by 19 percent. Nitrous oxides (NOx), hydrocarbons (HC), and carbon monoxide (CO) emissions increased 6 percent, 5 percent , and 4 percent, respectively.
2) The volume of barley shipped by rail would increase by 150 percent while the
volume of barley shipped by truck would increase 107 percent. The volume of barley shipped by barge would decrease by 27 percent.
3) Energy consumption for all shipments of barley would increase by 41 percent
when barging on the Snake River is not available. Overall emissions output would increase by 24 percent over current levels. The emission components showing an increase include PM (73 percent), CO (57 percent), HC (47 percent), and NOx (19 percent). SOx emissions decrease by 16 percent.
For both wheat and barley, the use of rail becomes more prominent when barging on the Snake River is not available. This would produce a slight increase in both energy consumption and emissions output (the one exception being a decrease in SOx). One potential shortcoming with relying on rail is the possible shortage of rail cars. Such shortages would result in a greater reliance on truck transport (and thus, greater fuel consumption and emissions output) if a drawdown were implemented. Road Damage Estimates for a Lower Snake River Drawdown A preliminary analysis of road damage impacts resulting from possible Snake River drawdown scenarios were presented in EWITS Working Paper #2. Two different drawdown scenarios were used for this analysis: a two-month drawdown period (April 15 to June 15) and a four-month drawdown period (April 15 to August 15). For this analysis, farmers are expected to switch to rail if barging is not available during the
1 See unpublished dissertation: Jessup, Eric L. Transportation Optimization Marketing for Commodity Flow, Private Shipper Costs, and Highway Infrastructure Impact Analysis. Ph.D. Dissertation, Washington State University; Pullman, WA. May, 1998.
53

drawdown periods (rail being the next cheapest alternative mode of transport). Average distance from elevator without rail to an elevator with rail is 15 miles as opposed to the average truck-barge haul distance of 45 miles. Using separate damage estimates for state roads (7.1 cents per ton-mile) and county roads (10.65 cents per ton-mile); and estimates of grain volume shipped during these time periods; the analysis produces the following damage estimates:
1) Total road damage for a two-month drawdown would decrease to $459,000 while total road damage with no drawdown during this time period is $1.26 million. The greatest reduction in damage would occur on state roads (a 75 percent decrease). Total road damage for a four-month drawdown would decrease to $1.23 million while total damage with no drawdown during this time period is $3.35 million. Again, the greatest reduction in damage would occur on state roads (a 63 percent decrease). While total road damage decreases, the flow of grain shipments would result in greater wear on selected routes.
2) Rail car shortages, coupled with a drawdown, would greatly increase road
damage. If one-half of the grain produced must be shipped to Pasco by truck, total road damage for a two-month drawdown would be $1.51 million (as opposed to the $1.26 with no two-month drawdown). Total road damage for a four-month drawdown would be $4.05 million (as opposed to the $3.35 million with no four-month drawdown). The county road system overall would experience a reduction in damage under both drawdown scenarios, but the state road system would experience a 50 percent aggregate increase in damage. Under this scenario, another 60,000 one-way truck trips would be made on the 100 miles of road between Pasco and grain production areas.
EWITS Research Report #24 also provided estimates the highway infrastructure needs based on the estimated movements of grain that would occur under the nine scenarios examined by the transportation cost optimization model. Using revised road damage estimates for state roads (1 cent per ton-mile), county roads (4 cents per ton-mile), and a new estimate for road damage on interstate roads (0.2 cents per ton-mile), Table 6 presents the estimates of highway infrastructure needs based on the volume of grain shipments made under each scenario. Total highway infrastructure investment needs increase in all scenarios when a drawdown is considered (except for wheat shipments in scenario 2). When rail capacity becomes constrained, infrastructure investment needs are $8,505,204 for wheat shipments and $1,143,855 for barley shipments (scenario 3), an increase of $2,124,162 and $409,957. This illustrates the value of a rail system with the capacity to handle grain shipments in the face of a Snake River drawdown.
54

Table 6--Summary of Infrastructure Needs for Wheat and Barley Scenario Infrastructure
Needs for Wheat ($) Infrastructure
Needs for Barley ($) 1 - Initial Case (no drawdown) 6,381,042 652,898 2- Drawdown Unconstrained No Change in Shipping Rates
6,379,499 1,143,954
3 - Drawdown, Constrained to 110% of Historical Volume
8,505,204 1,143,855
4 - Drawdown, Constrained to 110% of Historical Volume, 10% Rail Rate Increase
8,510,970 1,144,328
5 - Drawdown, Constrained to 110% of Historical Volume, 20% Rail Rate Increase
8,512,506 1,144,328
6 - Drawdown, Constrained to 110% of Historical Volume, 10% Barge Rate Increase
8,499,946 1,131,311
7 - Drawdown, Constrained to 110% of Historical Volume, 20% Rail Rate Increase
8,498,435 1,121,279
8 - Drawdown, Constrained to 110% of Historical Volume, 10% Barge and Rail Rate Increase
8,510,869 1,139,884
9 - Drawdown, Constrained to 110% of Historical Volume, 20% Barge and Rail Rate Increase
8,511,180 1,139,884
The evidence produced by EWITS shows that if the transportation system is to respond efficiently to the loss or the reduction of barging on the Snake River, the problems of rail car availability must be addressed. The regional economic impact of drawdown strategies for salmon recovery will depend on how well the rail system can adapt to handle a greater volume of grain commodity shipments. Using EWITS for Future Analysis The case studies illustrate how results from the various EWITS studies can be blended and adapted to answer questions concerning the multimodal transportation system in eastern Washington. EWITS has collected extensive primary data on transportation flows in the region by commodity, transport mode, and transport corridor. The data, along with the analytical models that have currently been developed, lend themselves to examining broader questions about the interactions between the transportation system and both the regional and state economy. The employment impacts associated with a drawdown, or any other environmental policy question that affects the transportation system may be estimated. Results from the emission studies might also be combined with known epidemiological risk factors to determine any impacts on public health resulting from changes in the mode or the flow of commodity shipments. EWITS has provided important data and analysis on the impacts resulting from NAFTA trade. Information on changes in transportation costs may be used in future commodity price studies to determine if these changes affect the competitiveness of regionally produced commodities. All the above illustrate the possible uses and the power of EWITS research to date.
55

Eastern Washington Intermodal Transportation Study Summary of Forum Proceedings
May 13, 1998 9:00 a.m. Introduction Jerry Lenzi (moderator), Eastern Region Administrator, Washington State Department of Transportation. Salient Points: Welcome to the Eastern Washington Intermodal Transportation Study Forum. The national Transportation Research Board has produced numerous studies and analyses regarding various commodity movements. The state of Washington has participated in TRB projects in addition to the state’s own studies on freight mobility. These studies include the Freight Action Study Task Force in 1995, which looked at freight movements from Everett, Washington to the Port of Tacoma. Another study, the Eastern Washington Freight Mobility Advisory Study in 1997 led to the recently approved Freight Mobility Study Committee II, which is examining the ramifications of a potential Snake River drawdown. Results from that study will provide input information into the Environmental Impact Statement on the drawdown, conducted by the U.S. Army Corp of Engineers and the National Marine Fisheries Service, and draw heavily from the base data developed in EWITS. Let’s talk about acronyms. (Many acronyms were used in Forum presentations. A list of acronyms may be found in Appendix A.)
EWITS--What Is It? What Did We Learn? How Can It Be Used?
Jerry Lenzi, Chair, EWITS Steering Committee. Eastern Region Administrator, Washington State Department of Transportation. Salient Points: EWITS was a precursor to many of the more recent transportation studies. EWITS was part of the ISTEA of 1991 with Congress providing $800,000 and requiring a $200,000 match from the state of Washington to conduct this eastern Washington study. Why did EWITS occur? We recognize that Washington is a bridge state. Washington roads provide access to the hinterlands of the U.S., the Southwest, Canada, and a gateway to international markets. Eastern Washington agricultural and timber shippers and producers want adequate mobility in terms of port of entry, customs, hours of operations, and the capacity and condition of the transportation infrastructure. Infrastructure becomes an issue when Canadian trucks are, on average, heavier than U.S. trucks, running up to 105,000 pounds. They are not illegally loaded, just loaded fuller than U.S. trucks and thus, wear the highways more rapidly. Freeze-thaw cycles and seasonal weight restrictions on some eastern Washington roads affect
56

infrastructure conditions too. Two hundred and fifty miles are identified as being weight restricted and it is estimated to cost over $180,000,000 to bring the roads up to correct capacity and condition. Other surface transportation concerns deal with railroads and barges. Between 1970 and 1998, 1,918 miles of Washington rail lines were abandoned, 66 percent of which were in eastern Washington. A second rail concern is branch lines, especially for use in transporting wheat. Branch line industry standards use 100-ton grain hopper cars, but the main line railroads are looking at using 125-ton cars which branch lines may not be able to support, thus causing future rail line abandonment. Barge is a critical mode for grain transportation from Washington, Idaho, Montana, Wyoming, North Dakota, and South Dakota because it is very cost efficient. One barge carries many train and truckloads of grain, thus relieving the road and rail infrastructure of wear. However, the potential of a Columbia-Snake River drawdown threatens the availability of the river system. How did EWITS come about? Early in 1991, the office of U.S. House of Representatives Speaker of the House, Tom Foley stated it wanted to study transportation in eastern Washington by identifying needs and providing more visibility. Speaker Foley’s office hoped this could be followed by policy changes and additional funding at the federal, state, and local levels, if the study was done correctly. A Scope of Work was drafted by Lenzi and Casavant, and inserted into the 1991 ISTEA. Congress provided $800,000, the Washington State Legislature matched $200,000 and EWITS commenced. EWITS was conducted through the Transportation Research Center, an interagency agreement between Washington State University, the University of Washington, and the Washington State Department of Transportation. A Steering Committee and an Advisory Committee were established to provide guidance, a reality check, and an overview of EWITS. Former House Speaker Tom Foley and the Washington State Legislature went the extra mile to ensure that eastern Washington was provided the chance to investigate and analyze the transportation system we share with western Washington. But as time goes on, we must realize that EWITS was a snapshot in time and that data will age and need to be refreshed. We hope that the work we have conducted so far will be a foundation for additional funding in the future to keep the data fresh. Ken Casavant, Project Director, EWITS. Professor, Washington State University. Salient Points: A characteristic of EWITS is that we used “adaptive research” which allowed us to respond to issues as they arose during this six-year process. We did this through the guidance of the Steering Committee, the Advisory Committee, and through our research reports and working papers. Research reports are comprehensive and data intensive, while working papers are more short-term and address issues as they arise. We also
57

published four newsletters designed to tell people what we’re doing, had planned for the future, and how they might get involved in the process. The research plan, theme, and scope of EWITS center around the production of data to be used by many different people to make decisions. The data are oriented towards commodities, modes, community development, and international trade. Research results have been shared in over 75 presentations in Washington, the Pacific Northwest, the nation, and internationally. We developed many data series and technical analyses, such as the statewide origin and destination trucking study, the first of its kind in the nation that identified the connectivity of transportation between eastern and western Washington. The partnership between EWITS and the Washington State Department of Transportation is well established. In 1993, we had the Transportation Policy Plan, the Systems Plan, and the MPO and RTPO plans that were operating under legislative directive. We combined the issues that arose and the data needs into most of the preliminary work of EWITS from 1993 to 1995. That data were available to help in the 1995 series of plans. EWITS’s adaptive research allows us to continue providing information to systems plans, WPO, RTPO, and MPO series. Turning to the research of EWITS, let’s talk about some effects of a drawdown of the Snake River. One of the first impacts to the grain industry is a potential increase of shipper costs of $0.09 per bushel for wheat and $0.26 per bushel for barley. A drawdown would likely increase road deterioration over $2 million annually, felt heavily on State Routes 12, 17, 26, 260, and 395. The cost changes are due to the complexities of the marketing system, including availability of rail cars, possible rail and truck rate increases due to loss of competition from barge companies, or a combination of these factors. NAFTA reinforces the fact that Washington is a bridge state of highways. Seventy percent of the ton-miles coming from or going to Canada pass through Washington, without an origin or destination in the state. Truck weights vary between Canada and the U.S., as well as the number of empty trucks. Eighty-one percent of Canadian trucks are full, while 70 percent of U.S. trucks are full. Canadian trucks are 4 percent heavier on all Washington roads and 11 percent heavier on eastern Washington roads. We haven’t identified it as such yet, but I think it is something to look at if we want support for the system that may not provide Washington benefits, but provides service in the national category. Corridor movements from the statewide origin and destination study indicate the importance of connectivity between eastern and western Washington. Traffic congestion information shows that there are pockets of concern where freight traffic from eastern Washington and passenger traffic from western Washington compete for highway space, an example of what makes us one state in transportation efforts. Expected population growth along the I-5 Corridor and in the Spokane and Tri-Cities areas will increase destination and transit traffic, most notably, on I-5 and SR 395.
58

EWITS research addressed requests for information concerning business locations in two ways: bypass versus main street and transportation wants and needs of new businesses. The results of the bypass study indicate it is necessary to develop specialized businesses to match and take advantage of main street local traffic and transit traffic. Colfax and Oroville have developed such balances. Meanwhile, downtown businesses need a well-developed customer base to avoid negative impacts of a bypass, as is evident in Omak and Okanogan. Access to a major trading center is important too, as in the case of Rosalia and Spokane. Rosalia is a bedroom community of sorts to Spokane and has gained some of the benefits of such a role. Increased highway related and retail businesses along bypasses may help mitigate financial losses in downtown. Annexing property may also ease any losses in the downtown tax base, as is the case in Prosser, Omak, and Sunnyside. Land use plans must remain flexible, while still responding to the directives of the GMA, and local planners must be concerned with safety for pedestrians and parked cars. The new business study involved interviewing 650 firms in Washington to determine how they use the different modes to deliver or receive products. Eastern Washington had significantly more retail and service industries and less manufacturing than western Washington. There is little difference between eastern and western Washington in terms of motor freight usage to deliver or receive products. Eastern Washington uses rail and water to receive and deliver more than western Washington, which tends to use these two modes to access international ports. Most new industries are not bulk industries, but are value-added, processing, electronics, manufacturing, and service firms. A final area that EWITS worked heavily on was commodity marketing and transport. We conducted research on the I-5, I-90, SR 395, and SR 397 corridors; truck, rail, and barge commodity movements; and specific commodities such as general freight, fruit, hay, grain, vegetables, and forest products. EWITS was instrumental in developing a “GAMS-GIS” model, or Generalized Algebraic Modeling System - Geographical Information System, which focused on wheat and barley movements. The GAMS model identifies least cost routes for moving wheat and barley, while the GIS model arranges and displays the data in terms of the elevator, highway, rail, and barge systems. A continuing relationship exists between the state legislature, WSDOT, EWITS, and our RTPOs and MPOs. EWITS’s initial preliminary work on the potential Snake River drawdown helped provide information useful in framing and actually implementing some of the Legislative Transportation Committee Study. Rural development data were useful to the Governor’s rural development summits. Transportation is a dynamic system that is always changing. EWITS has provided information on such evolving issues as drawdown, NAFTA, and commodity marketing and transportation. This EWITS Forum is designed to show you the road ahead for transportation. We must keep heading in the same direction together, rather than trying to pass each other.
59

9:50 a.m. County Perspectives Jay Armstrong, Deputy Director, County Road Administration Board. Salient Points: The County Road Administration Board, CRAB, is a board in Olympia that works with all the county road departments by providing support and statutory oversight. The main scope of EWITS is looking at moving freight and goods across the state; and if we think of the state system as a body with arteries and veins, the capillary system (or county roads) is what actually gets the products onto or off farms and factories. Today’s county road system has the same basic structure as it did 100 or 120 years ago, yet the state has changed. The eastern Washington counties have 60 percent of the road miles within the entire state and 93 percent of the state’s gravel roads. It is these roads that support agriculture and rural development. From a county perspective, EWITS provides two levels of information. First, information on truck volume is made available for main arteries; and from this information, counties and local producers may infer the volume of trucks using particular county roads. For instance, if there are 400 trucks in Odessa in a day, then we know 400 trucks are dispersing throughout Grant County. Second, the studies on grain, row crops, and timber movements were helpful to counties because they showed, particularly the GIS grain model, logical frameworks and networks of distribution within the county system itself. Wheat is generally stored after harvest and distributed throughout the winter, which is the worst time of year for county roads because of freeze and thaw conditions. Also, if a water drawdown on the Snake River occurs, the impact on state highways and county roads is very alarming. We would encourage the further development of the GAMS-GIS system and make it a tool available for counties to work with. The ongoing work on road damage cost factors from truck traffic is important to counties too, since county roads vary so much that it is difficult to take a cost factor and apply it across the board. In the late 1980's, the legislature established a program in CRAB called the Rural Arterial Program, or RAP, to help eastern Washington upgrade roads as a result of rail line abandonment. Today, it is just about the only funding source for counties to upgrade roads. The basic revenue sources that county road departments have are property taxes and gas taxes. However, the amount of property taxes collected in eastern Washington, based on a lower agricultural tax rate, and the number of gas stations in the region are sparse compared to the number of road miles these taxes must support. We need to strengthen the critical points in the total transportation system. Many counties in eastern Washington have formed local groups with the farmers trying to prioritize the roads in the county to upgrade from gravel to asphalt, widen, or make all weather. We need to continue working with the GIS model to provide a better framework for planning the work and give better tools to the farmers.
60

Combined Question and Answer Questions were asked regarding:
• Snake River drawdown and rail line restoration • Clarification of a presented slide • The process of setting up the LTC and how one would participate in the process • The adaptability of railroads to new investments in the event of a potential
drawdown • An economist’s point of view regarding resources allocation between barge,
railroads, and roads and the most prudent place to spend taxpayer dollars • Updated studies and consideration to the effects of dam removal
Comments were made regarding:
• The potential of railroads to relieve transportation problems
61

10:30 a.m. Location, Transportation, and Economic Development Priscilla Salant (moderator), Washington State University. These panelists are going to discuss when a seamless freight system works, and when it doesn’t work, in their local communities. They will also offer you ways to integrate and coordinate transportation planning. Finally, they will be looking ahead to the kinds of transportation policy issues on the horizon for eastern Washington. Our first panelist is Jim Kuntz. Jim received his education in Washington State colleges, worked at the Port of Benton, managed the Walla Walla Regional Airport, and since 1990 is the director of the Port of Walla Walla. He is involved in the Board of Eastern Washington Job Training Partnership and is on the EWITS Advisory Committee. Jim Kuntz, Executive Director, Port of Walla Walla. Salient Points: I have three points to cover. One, I’ll talk about the Port of Walla Walla. Two, I want to talk about transportation policies to ponder from an economic developer’s perspective. The third point regards some critical tools and regulatory relief that local governments must have in order to be part of the transportation infrastructure solution. The Port of Walla Walla was founded in 1952 and is a countywide port district as well as the Economic Development Corporation (EDC) for the county. Our port is measured by two goals. The first and foremost is creation and retention of family wage jobs. Our second goal is helping to maintain a multimodal transportation system for our county and region. We have a budget of $4 million, own and manage the Walla Walla Regional Airport, and own ten miles of roads within the county. River transportation is big for our port with multiple sites on the Columbia and Snake Rivers. I think our grain exports are 95 percent throughout eastern Washington. We own multiple rail sidings and have been strong advocates for preserving light density rail lines in the state. We also manage the state’s Grain Car Program. Let’s talk about a few economic development successes we’ve had as directly related to transportation infrastructure. First is the multimodal transportation infrastructure in western Walla Walla County that attracted Ponderosa Fibers of Washington to build a $150 million paper recycling facility next to Boise Cascade. They have two rail lines that come into the plant, a barge slip close by, and Highway 12 right next to the plant. The state deserves some credit because it and Ponderosa pooled their money and developed some turn lanes and acceleration lanes off Highway 12 to serve the plant’s needs. Another economic success was helped along by the airport and its importance. We recently got a company called Regents Washington Health to locate a Claims Processing Center in downtown Walla Walla. The airport makes it easy for company employees to get to Walla Walla from their downtown Seattle office.
62

The roadway system is important from an economic developer’s perspective. We need to maintain what we do have because business prospects visit our area and see what we have. A second aspect of roadways is that the state needs to focus on developing divided, four-lane highways from the Tri-Cities to Walla Walla and from Spokane north to the Canadian border on SR-395. The last thing that is critical to economic development is flexibility. From the roadway perspective, we need an investment pot that we can use strategically when we have economic development opportunities. I think some criteria is needed on how the money is used, preferably for family wage jobs that support the community. Regarding railroads, the businesses that we are recruiting indicate the most important thing they want is dual service. They want a rail line that both BN or UP can use. As it relates to rural eastern Washington, we want rail service, but it has to be maintained; and investment in rail cars has to be maintained. I think there are some things the state of Washington can do to help us make rail infrastructure investments, including smarter negotiations with BN and UP when the opportunity arises. As for the supply of rail cars, negotiations with railroads may not be successful because they like long hauls, not the short hauls demanded by our local producers. WSDOT has done a great job in their rail branch by buying some cars, which the Port of Walla Walla manages. Another negotiation point with railroads regards the state putting fiber optics, gas lines, and community infrastructure along railroad right-of-ways. Let me switch now to river barging and transportation, especially as it relates to the upper Columbia and Snake Rivers. Breaching of the dams and tearing out the dams is on the table for the first time and I think is hurting investments in eastern Washington because of the uncertainty of the situation and the potential of losing barge transportation. I’d like to see our Washington State Transportation Commission take a stand at one of their meetings and pass a resolution that breeching or taking out dams is not the way to go. Airports make our state of Washington a lot smaller. We are not going to be building any new airports in the state. Therefore, we need to protect airports from incompatible land uses and to maintain the airports we have. Small regional airports do not have commercial air service so they do not qualify for FAA money. Most of them are of World War II vintage and their entire infrastructure is going down at the same time. The Washington State Transportation Commission recently passed an aviation policy, which is just outstanding, but we need to find a source of money, possibly a ticket tax on passengers to help maintain the smaller airports. My last comments relate to critical tools in state regulatory relief that local governments must have to be part of the transportation solution. These include removing certain sales taxes, relaxing the Prevailing Wage Law, and allowing a local sales tax. We need incentives for local governments to invest in transportation infrastructure projects. Currently, the state has built-in disincentives, such as the state sales tax on public infrastructure projects. Another incentive would be a $250,000 threshold on public projects before the Prevailing Wage Law comes into effect. Allowing a local option gas tax would help cities and counties fund their local infrastructure road projects.
63

Priscilla Salant, moderator. The next panelist is Bob Mathison, who is Vice President of Stemilt Growers in Wenatchee. Stemilt Growers provides cold storage, packaging, shipping, and sales services for the tree fruit industry in north central Washington. Bob is going to give us an insider’s look at some of the transportation issues that a large agricultural firm like Stemilt faces on a day-to-day basis. Bob Mathison, Vice President, Stemilt Growers. Salient Points: I’m not an expert on transportation, but transportation is extremely important to Stemilt Growers. Our orchards are scattered throughout the state. Highways mean a lot to us. Our fruit industry in north central Washington ships about 80,000 truckloads of fruit in a two-month period during apple harvest. It’s very crowded on the highways at that time. Each year we ship out about 65,000 truckloads of packed fruit worldwide. Add to that another 20,000 trucks to haul in the boxes, trays, and pallets to the packing shed. We figure that’s about 165,000 truckloads on the highways in north central Washington. This is just half, or less than half, of the trucks in eastern Washington and just in the apple industry. We don’t have a lot of complaints about the highways, although we do have a bottleneck in Wenatchee. On Sunset Highway, there are only two lanes and the trucks have to make their turns across both lanes and hope that the passenger traffic stops for them. Trucks must also drive through or around town to get to the loading facilities. If traffic is heavy, drivers have to get on 97A with no controlled intersection and they are risking their lives and those on the road. However, stoplights won’t get put in until there are a certain number of fatalities in an area. Apples add over a billion dollars to the economy of eastern Washington and cherries add about $125 million. For the people in eastern Washington fruit growing areas, our livelihood depends on the roads. I’m glad everyone is talking about barge traffic. Even though apples don’t go on barges on the Snake River, we’re thinking about trucks and the availability of trucks. There are not enough trucks to carry both apples and wheat at the same time. We all affect each other. In conclusion, highways mean a lot to us at Stemilt, as they do to all apple shippers and cherry shippers in eastern Washington. The thing we need to keep in mind is that the highways are okay now, but they may not be in the future. If you look across the state, the amount of fruit being produced is being increased from 5 to 10 percent a year, for the next five to ten years at least. We are going to have a huge increase in the number of trucks on the roads. We are asking ourselves: “Are our highways up to the challenge?” Speaking for Stemilt, we certainly hope so.
64

Priscilla Salant, moderator. Our last panelist is Joe Tortorelli, who is economic director of Washington Water Power. Joe works directly with communities in the region on strategic economic development planning and specializes not only in transportation, but also in telecommunications and energy. He is a past board member of both Washington and Idaho Rural Development Councils. Joe Tortorelli, Economic Development Director, Washington Water Power. Salient Points: Washington Water Power’s economic development interests include not only where we serve, but throughout the Inland Northwest, which is all of eastern Washington, northern Idaho, and western Montana. We feel it is a regional economy, and what benefits one, benefits all, but some more than others. We have primarily focused on community development during the last ten years. More recently, we have focused our emphasis on business recruitment, retention, and expansion. Whenever you ask anybody what was the most critical factor in a company locating in a town or doing an expansion, they can’t pinpoint it to one or two primary factors, it’s usually a combination of a number of things. In all cases, transportation has been one of the top four or five major factors. Recently, it has become one of the very top. The reason for this is getting finished products to market has become a critical element in all-manufacturing processes. Cost reduction and the logistics of getting materials in and out of sites is high on the list of operational improvements. Drivers behind this new focus are the new emerging global markets. An efficient transportation system is absolutely critical for their growth. All large companies, or their consultants, who look at relocation are doing transportation studies. They find that sites need to be within six miles or less of a major four-lane highway, but there are tradeoffs for trading congestion in metro areas for poor two-lane access roads that have direct access to freeways and don’t go through a bunch of little towns. With airport access, the limit is 60 minutes to a commercial airport and sightings outside that zone usually involve smaller low cost manufacturers, or distribution with limited executive and vendor travel. Railroad service is increasingly important due to the short-haul rates that railroads are offering. Inland waterways are mostly for bulk commodities with lower time costs. Washington is blessed with an excellent Columbia and Snake River system. Intermodal is probably the new hot button for freight reaching global markets quickly. A number of companies that have recently located in our area have touted the excellent intermodal facilities in the Spokane area. They wouldn’t even have considered the Northwest if it hadn’t been for those. Our experience working with companies and site consultants tells us that communities, which plan for industrial development, have a better chance of receiving some of the 700 to 1,000 major sightings that occur in the United States every year. Oftentimes,
65

transportation planners think only of the vehicles per day and the growth that subsequent demand on the transportation system produces. They should also consider what drives population growth, which is the creation of new jobs. I believe that with a little public investment in strategic areas to prepare for the right type of targeted industry development, we will produce private investment that will increase our tax base.
Question and Answer Questions were asked regarding:
• Labor availability and recruiting new business • Surprise over EWITS and ISTEA going behind the scenes and what can be done
to get eastern Washington transportation issues out, besides working with the Legislative Transportation Committee and legislators
• Educating the general public on the interests that we have in transportation and engaging them in the solutions and support for those solutions
• Safety aspects of highways should dams be breached; four laning in Walla Walla; recreation and the quality of life
• Safety regarding apple and wheat truck traffic if Snake River dams were taken out
• Drawdown and proactively working with railroads and the grain car program Comments were made regarding:
• Activities of local RTPOs and MPOs and inviting public involvement in such activities
66

1:30 p.m. Transportation and Trade Bob Hannus (moderator), Senior Market Research Analyst, Port of Seattle. I wanted to say something on behalf of the Port of Seattle; in particular, that our interests are very much in line with the interests of eastern Washington exporters and people involved in growing and distributing products. The estimated 50,000 to 75,000 containers full of cargo that come through our port each year are very important to our long-term success. We are the only port in the Northwest to have an eastern Washington representative, Howard Granger. I’m going to give a five-minute introduction on the future growth of international trade, particularly waterborne trade. Work by Wharton Econometrics Forecasting Consultants shows that after a two- to four-year hiatus, Asia will be back in force in terms of economic growth. The long-term prospects are quite good. In a previous forecast done in 1995, the results were that container trade growth would average 4 percent per year for the next 20 years, implying a more than doubling of the container trade. Furthermore, that growth rate is about double the growth rate of most world economies. Wharton is saying that around the year 2000, GDP growth in Asia will probably average about 6 percent per year. They are looking at the GNP of Europe and the USA averaging about 2.5 percent per year after 2000. They are very bullish about Central and South America, saying those economies will grow at about 5 percent per year after 2000. We see that ourselves with the volume of container trade to Central and South America growing rapidly at present. Now let me begin by introducing our speakers. Our first speaker is Roger Dormaier, a family wheat farmer from Hartline. He is the co-chair of transportation for the Washington Association of Wheat Growers. Roger Dormaier, Transportation Co-Chair, Washington Association of Wheat Growers. Salient Points: Wheat contributes approximately $1.2 billion toward the state’s economy. Last year’s production was 168.1 million bushels and we grew it on 2.65 million acres. As farmers, we spent an estimated $70 million to move the crop to points of export or for use. One hundred percent of our crop moves by truck at some time in the post-harvest period. After we harvest our grain, it will either go to home storage on the farm, to an interior elevator, or possibly to the elevators on the river system. Sixty-two percent of the wheat in the state moves through the truck-barge system. Then 35 percent of our grain tends to move to market by truck to a close elevator, and then is sent to market by rail. That is approximately 104 million bushels by truck-barge and 58.8 million bushels by rail. Transportation is a three-legged stool with rail, truck, and barge as the legs. But all the legs are necessary for the equilibrium we have now. When we get a disruption in the system, it usually leads to lost marketing opportunities for our growers. Because most of Washington’s wheat is stored at interior elevators, the roads are very important to us
67

throughout the year. Freight mobility studies have dealt with the roads issue at the state level. However, farmers and counties have some problems that aren’t addressed in the studies and it is very important that the counties have funds to look after these problems to keep our rural economies going. Since the 1970's, 2,000 miles of rail lines have been abandoned. Many of those were used to haul wheat. The industry has adapted. We have several branch lines being used by short-line railroads; but the maintenance on the lines, while adequate for short-term operations, is on such a tight margin that it is often hard to think in terms of long-term maintenance and upgrades. One has to look at what the returns will be on those short-line rails. However, the legislature worries about helping to replace and rebuild those lines, since it is a private industry and not publicly owned. Another problem the branch lines face is the shortage of rail cars, particularly at harvest. Part of the problem is that railroads make their money on long-distance hauls and the short turn around in Washington is not conducive to a great rate of return for UP or BN. The last leg of my stool is the river barge system. Today it is in fair condition, but salmon and drawdown issues remain a big question. As you heard this morning, 1999 is not too far away. Bob Hannus, moderator: Our next speaker is Don Barcham. Don is Manager of Planning and Programming for the British Columbia Ministry of Transportation and Highways for the Kootenays Region. Today he is going to talk to us about a very interesting subject: a highway system study at three border crossings between eastern Washington and eastern British Columbia. Don Barcham, Planning and Program Manager, Ministry of Transportation and Highways, Kootenays Region, British Columbia. Salient Points: The province of British Columbia is divided into six highway regions, most of which are about the size of Washington. Within those regions, there are 27 highway districts. I represent region 3, which is in the southeast corner. In this area, we have a border crossing on Highway 395, the Patterson crossing on Highway 25, Waneta on County Road 251, Highway 31, and the Nelway crossing. The Rossland-Trail area is basically the industrial heart of Kootenays. The main industries are the Cominco Smelter, a major pulp mill and saw mill in Castlegar, and many supporting industries. The population is somewhere around 60,000. We discovered that we have a micro economy here. The people that live in this area, on both sides of the border, are really dependent on this little economy. It’s based primarily on forest fiber, wood chips that go north, hog fuel, which goes south to Washington Water Power in Colville, minerals, and chemicals. Recently, we did open the Patterson crossing to northbound traffic 24-hours a day. We are really concerned that this little economy keeps going. We have an unemployment rate of 14 percent in the Kootenays. The values of imports and exports in British Columbia and the Kootenay region by 1996 indicates that provincial totals are really quite substantial, about $1.2 billion.
68

In the region I have described, we have 13 border crossings and only Kings Gate is a 24-hour full service crossing. Patterson and Nelway are primary crossings, but we would like to see export/import business come over to Waneta for a couple of reasons. First, there are severe sustained grades at Patterson and one study shows that a million dollars in trucking costs could be saved annually if we focused on the border crossing at Waneta. Second, the crossing at Waneta would be safer for drivers. We are going to be undertaking studies of the highway system from Castlegar to Trail, and from Trail to Waneta in support of the recommendation that Waneta be the main 24-hour border crossing in the future. We have basically the same problems that you have. We would love to get this traffic off the highways and onto rail, but we have very limited options because the rail systems have largely been abandoned. Burlington Northern accesses our region at several reload centers: Salmo, Waneta, Cascade, and Lauriea. Reload centers are fine from our perspective because they get traffic off of the highways and they help sustain rail development. You mentioned public participation. I’ve done a lot of public participation over many years, in many different forums, and I see the EWITS study as a great example of not only public participation, but also regional thinking. Many local issues are tied into regional ones. EWITS has generated a lot of good discussion, debate, and energy. I hope you manage to keep it up and I hope you can keep us involved in it. Bob Hannus, moderator. Our next speaker is a friend and colleague of mine at the Port of Seattle, Craig Hatamaki. He’s been with the Port of Seattle for eight years and most recently was appointed the Director of Intermodal. He’s going to speak to you about the subject as it involves some of your own needs. Craig Hatamaki, Intermodal Manager, Port of Seattle. Salient Points: Transportation planners across our state, even the country, are looking at a bill that will run into the billions of dollars to rebuild the states and nations aging intermodal infrastructure. The projects that are needed include deeper harbors; bigger cranes; larger marine terminals; more on-dock, near-dock, rail transfer yards; hundreds of grade separations throughout the country within congested urban areas; and better rail and highway access in and out of ports. In our state, I understand that our population growth is looking to increase by 25 percent over the next 25 years. We see new companies continuing to open their doors. Road and rail traffic are both on the rise. U.S. container cargo is projected to more than double in the next 12 years. I’m told the prediction is they’re going to increase sevenfold over the next 50 years.
69

I’d like to get into the questions and answers as soon as we can to get into the areas you have a real interest in. However, I’d like to touch upon a few critical points that I have not heard today. Our Washington State planners have a good idea what projects are needed to accommodate the growth volume that we see projected here in this state. But it’s going to take a grass roots effort, and understanding by the citizens of this state, to help our legislators secure partnerships and financial leveraging to accomplish these critical infrastructure projects. Some port issues include water depth, landside access, relieving road congestion on major truck routes, and addressing numerous ungraded rail crossings. A critical issue with international trade is the ability to quickly transport the arriving containers to inland warehousing and distribution centers and also to quickly move empty containers back to Washington so that our farmers and exporters can fill them with local products to return to Asia. That is why I think efforts like today’s Forum, where we can bring transportation folks together to talk abut problems, issues, and solutions are constructive and will help us to solve and meet our critical challenges.
Question and Answer Questions were asked regarding:
• Purchasing grain cars and how that affects local shippers; other alternatives such as the tariff car
• Grain car sufficiency if there is no river transportation • Financing for a replacement rail line from the Ports of Seattle and Tacoma and
traveling east • A 24-hour advantage to Southeast Asia from Northwest ports; adequate port funding
in California versus funding in the Northwest • Seattle-Tacoma overcoming Long Beach and Los Angeles as the prime port on the
West Coast • Extending Seattle-Tacoma port hours • Capacity of rail lines themselves and their adequacy in case of a drawdown • Time frame before double-stack trains can go through Stampede Pass • Origin and destination of increased NAFTA traffic through Washington • Unanticipated issues in southeast British Columbia that have arisen because of
NAFTA • Moving Port of Seattle from the most heavily populated district to Bellingham • Benefit cost study on improving the border crossing at Waneta and SR25; projected
traffic volume that would originate in British Columbia; RTPOs moderating between British Columbia and Washington agencies; thoughts on the state taking back Route 251
• Privatizing maintenance work in the Kootenays region • Access and egress at the ports of Seattle and Tacoma, by rail and road
Comments were made regarding:
• Upgrading the Cascade tunnel at Stevens Pass to allow a higher volume of trains to pass and the tunnel at Stampede Pass to allow double stacked trains; capacity constraint of certain routes
70

3:15 p.m. Policy and Politics: Transportation and Freight Mobility Ken Casavant (moderator), Project Director, EWITS. Professor, Washington State University. I mentioned earlier the idea that “research” plus “planning” plus “political support” could bring about success. We are fortunate today to have two folks who are willing to discuss how their vision of what political support, political direction there is for transportation and, specifically, how we can work together. Our first speaker this afternoon will be Karen Schmidt who is Chair of the House Transportation Policy and Budget Committee as well as Chair of the Legislative Transportation Committee. Representative Karen Schmidt, Chair, Legislative Transportation Committee. Salient Points: I’m going to start with the transportation revenue package that passed, the options, and what we felt went on during this last session. We came up with a package that supports a comprehensive transportation-financing package for a short term of $2.4 billion. It provides additional funding for local government, particularly in the area of criminal justice. It reduces the motor vehicle excise tax by $30 and established a joint blue ribbon committee to study the long- term financing needs for the state and local transportation, as well as looking at some other ways of doing business and how we can change the way transportation is delivered in this state. In the new revenue package, the legislative plan is funded with a mix of bonds and cash. It is funded without raising taxes. It provides motor vehicle excise taxes for transportation purposes, where most people believe it goes now. Highways, bridges, and ferries will be used while they’re being paid for. They will be paid over time and the transportation facilities will provide benefits long after the bond retirements. There are a couple of big lies we are dealing with associated with the transportation revenue package. The first big lie is that it would hurt education. This is absolutely not true. This money is above the 601 limit; education would continue to be funded. The second big lie is about bonding. We cannot build the kind of projects we need without bonding. No matter what the revenue source is, we will have to bond. Once we decided how to raise the money, our goal was to determine how to spend it. We found that people wanted accountability. They want to know what they are getting and they want some coordination between jurisdictions on how this planning is taking place. Unless we start working more cooperatively in targeting our money so that we all come up with a plan for the region, this isn’t going to work. We need a realistic inventory of needs, not just one of wants. It doesn’t do us any good to say we have $30 billion of infrastructure if we can never get to that. So let’s find out what we can realistically approach in the next 20 years, identify it regionally so we have a balance all over the state, and go ahead and attack that problem.
71

The blue ribbon committee will be looking at a number of things, including financing. One of which is how we can change the way we do business. We would like to find other areas where cost savings and time savings can be achieved by having communities working more cooperatively together through the permitting process and doing a lot of the advance work on these projects. A bipartisan approach on priorities was the other thing we tried to establish. Our first priority was obviously congestion. Congestion means different things around the state, but it was the same message, so over half the money is going for congestion relief, particularly in large project areas. We found that we have companies coming in and making decisions on whether they are going to relocate here or expand their business. We need to be able to respond quickly to those opportunities and keep those jobs here. We wanted to have some money in an economic development pool available so we could step in right away. We wanted to continue to work aggressively on the highway safety and bridge projects, and put more money into flood mitigation and fish passage barriers. The ferries are the interstate for the western side of the state. We cannot only expand the capacity, but also get rid of some of the older vessels that are in jeopardy of being red-tagged by the Coast Guard and put out of service. We began a program this year where we will have a permanent funding program for freight mobility. It will bring all of the partners together with their checkbooks around the table, scoring projects and deciding how they’re going to spend money to start relieving the choke points for our freight delivery. We are going to have to continue to fight long term for our freight corridors. The drawdown issue obviously is a concern to us. That’s why we have an LTC study that will be taking place to look at that issue. We have identified some rather large programs. For instance, the snow shed project at Snoqualmie Pass. Another project is ASR 519. A lot of you have talked about the access to the Port of Seattle and this is the most treacherous, worst part of how to do everything wrong on a highway. We know we have huge projects up in the 395 area and we are going to have to incrementally start nipping away at opening that up. I asked local government the question, if we have a dollar left, when we go through our needs here, how would we spend it? They requested $230 million for CRAB, TIB, and other programs. We also added an additional $140 million because we took a look at the freight mobility costs for local governments. They weren’t going to be able to come up with the money and we didn’t want to see the projects delayed, so we added more funding. This package passed the House of Representatives with a very strong bipartisan vote. It was 81 votes strong. The last day of the session we were finally able to pass a local option package which passed the House with over 80 votes. It ran out of time in the Senate. Partnerships became extremely important; if we don’t work with our money together, we’re not going to get to those big projects. We need to look at what our needs are statewide. You have to look on a statewide basis because everything does flow. It doesn’t stop at a legislative district, it doesn’t stop at a city limit, and it doesn’t stop at a county line. I hope with new partnerships we can get away from worrying about whether we have this and that, and whether we can get together and say we are going to make a real impact.
72

Ken Casavant, moderator. Our second speaker is Eugene Prince. Gene is the Chair of the Senate Transportation Committee and Vice Chair of the legislative Transportation Committee. Senator Eugene Prince, Vice Chair, Legislative Transportation Committee. Salient Points: I’ve particularly enjoyed this session today. And it really pleases me to find you coming together to talk about the issues that are confronting us. But realize that we are the choir. Transportation today is potentially facing possibly the biggest crisis that it’s known for a long time. A lot of people haven’t thought a lot about this. Karen has explained the referendum that’s on the ballot quite well. But we may have an initiative or two on the ballot at the same time. And if those initiatives, doing away with the MVET should pass, if they get on the ballot, and if people really don’t understand the impact they will have, you stand a chance to see them pass. And if they pass, this funding package that has been explained to you, disappears. The money is gone, because it’s the same MVET money; in fact, it’s more money than what this fund takes. It puts transportation in real stress, and it puts the general fund in some stress. What’s the first subject that we need to get public understanding on? I’m one who believes that it’s the funding source, where transportation receives the bulk of its money. We have a general fund that even under the 601 limitations went in one biennium from $17.6 billion to $19.2 billion with an extra $800 million. That’s impressive. There’s inflation in sales tax, B&O tax, and property tax. But then you turn around and look at transportation. Gas tax has no inflation connected with it. We’ve always had to come back every five or six years for an increase in the gas tax. But people don’t understand why. This is one perception that we need to try and get people to understand. I don’t know of another source of funding. If the MVET goes to transportation, it has some inflation with it, but it will still require transportation to come back rather frequently for support. Groups like this, getting the education you’ve had today, can be a help. But it was asked this morning, “How do we get this word out to the public?” The answer is each of us has to step up to the responsibility. It’s our responsibility to try and educate the public. It’s the only way that we’ll get enough education and enough background that we can prevent the two initiatives from passing; that we can get the referendum that’s been placed, and it is the only game in town. If we go down this fall in the election and the two initiatives pass, I’m not sure when you’ll get funding for transportation. We all know that if we don’t maintain our transportation infrastructure, and all the modal parts of it, our economy is in serious trouble. I don’t care if you’re eastern Washington, western Washington, or where you’re at, we have to have a statewide infrastructure that is kept in good shape. We’re getting a long way behind. The state’s $20 and $30 billion behind, I’m told. So we’ve got a challenge facing us. I hope with meetings like this, that we find we have people willing to step up and shoulder the burden, and ensure that the state of Washington does not face a crisis, but has the funding it needs for it’s infrastructure.
73

Question and Answer Questions were asked regarding:
• Bond appropriation and referendum 49 • Specific criteria for counties attached to local FMAC monies; criteria to meet to
qualify • Time frame to get a passenger train from southeastern Washington to Seattle • TIB, TransAid, and CRAB need to have their own identification • Funding for ancillary issues on transportation, such as handling hazardous
material accidents • Local jurisdictions appear to be left out of funding • Funding for alternate forms of transportation in the fall referendum • Details on the flood mitigation and fish passage fund; contact person
Question posed by Karen Schmidt to the Forum participants:
• Many issues on freight and passenger mobility in eastern Washington have been raised today. However, eastern Washington needs to figure out what makes sense for all eastern Washington, and that’s where we should place our money as an investment. You need to talk about what makes sense. I think that eastern Washington needs to make the recommendation and we need to try to work with them on funding.
Comments were made regarding:
• Thanking Representative Schmidt and Senator Prince for looking at the problem of the Hanford railroad system and working with the state in transportation in general.
74

4:15 p.m. Wrap Up Ken Casavant Now it is my pleasure to invite Charlie Howard to give a summation of what we have heard today and a bit of the future. Charlie’s been with EWITS, on the Steering Committee since its inception, and is here to give a sense of his thoughts. Charles E. Howard, Manager, Transportation Planning Office, Washington State Department of Transportation. Salient Points: What were the EWITS results, what did we get out of this six years of effort? We got data collection, a statewide origin and destination study, knowledge on the transportation needs of the major industries in eastern Washington, business location factors, local economic development programs, international trade implications of NAFTA, and implications of drawdown. EWITS was both a research program and a demonstration program. It was funded with one-time funding through the federal Intermodal Surface Transportation Efficiency Act. We would not have been able to do this if it had not been for the ISTEA funding. I want to talk a little bit about the research angle. I think what we got from this research program are answers to pressing policy questions. We got data to help answer those questions, we got analysis capability, and the ability to respond quickly to emerging needs. The purpose of this data and research was to shape public policy and to help us target investment, so they had very practical purposes in mind. And I want to make a strong support of the idea of research in general, such as EWITS. It produces far more than the initial investment because it attracts more federal dollars and provides student education in the universities where the next generation of transportation professionals are being trained. EWITS was a demonstration project; so what did we demonstrate? We demonstrated that cooperative research works, proved and showed that adaptive research works to focus on emerging and relevant issues, and showed that freight and intermodal transportation is an area that needs more research. My proposal for the future has four parts. This is a proposal that the Steering Committee talked about when we last met, recognizing that on June 30 of this year the EWITS funding from the federal government will be over and EWITS as an entity or as a research effort will go away. First, our proposal is to create an ongoing cooperative freight research program; basically, let’s not let EWITS die. Second, we must carry out research, through universities, to track freight mobility research. Third, we must continue the adaptive research approach, which will allow us to respond to real problems as they emerge, and
75

not get mired in some esoteric research that nobody cares about. Finally, a question arises as to whether we should extend this statewide or should we keep the focus on eastern Washington. What I’d like you to do, and on behalf of the Steering Committee, is to think about the proposal. If we want to see EWITS continue, it’s going to take some support. Just jot a couple of notes down on whether you support this proposal, whether you think it needs to be eastern Washington or include western Washington, and whether you think the universities are the right place to carry this out. We really need to hear from people, so that we can make a proposal on whether we’re going to continue this or not. That’s it for the homework assignment. I’ll turn it back to Ken. Ken Casavant I want to thank Charlie, obviously. But more importantly, I want to thank you folks, and why don’t you just give yourself a hand. Let’s bring this thing to an end. Nice job for all of you. Thanks a lot.
76

Appendix A
77

Acronyms CRAB - County Road Administration Board EWITS - Eastern Washington Intermodal Transportation Study EWFMAC - Eastern Washington Freight Mobility Advisory Committee FAST - Freight Action Strategy Task Force FMAC - Freight Mobility Advisory Committee GAMS - Generalized Algebraic Modeling System GIS - Geographical Information System GMA - Growth Management Act of Washington State ISTEA - Intermodal Surface Transportation Efficiency Act NAFTA - North American Free Trade Agreement RAP - Rural Arterial Program TRB - Transportation Research Board
78

Appendix B
Overheads from EWITS Forum Presentations
79

9:00 pm: INTRODUCTION Jerry Lenzi (moderator)
80

81

82

83

9:00 pm: EWITS—What is it? What did we learn? How can it be used? Jerry Lenzi (speaker)
84

85

86

87

88

89

90

91

92

93

94

95

9:00 pm: EWITS—What is it? What did we learn? How can it be used? Ken Casavant (speaker)
96

97

98

99

100

101

102

103

104
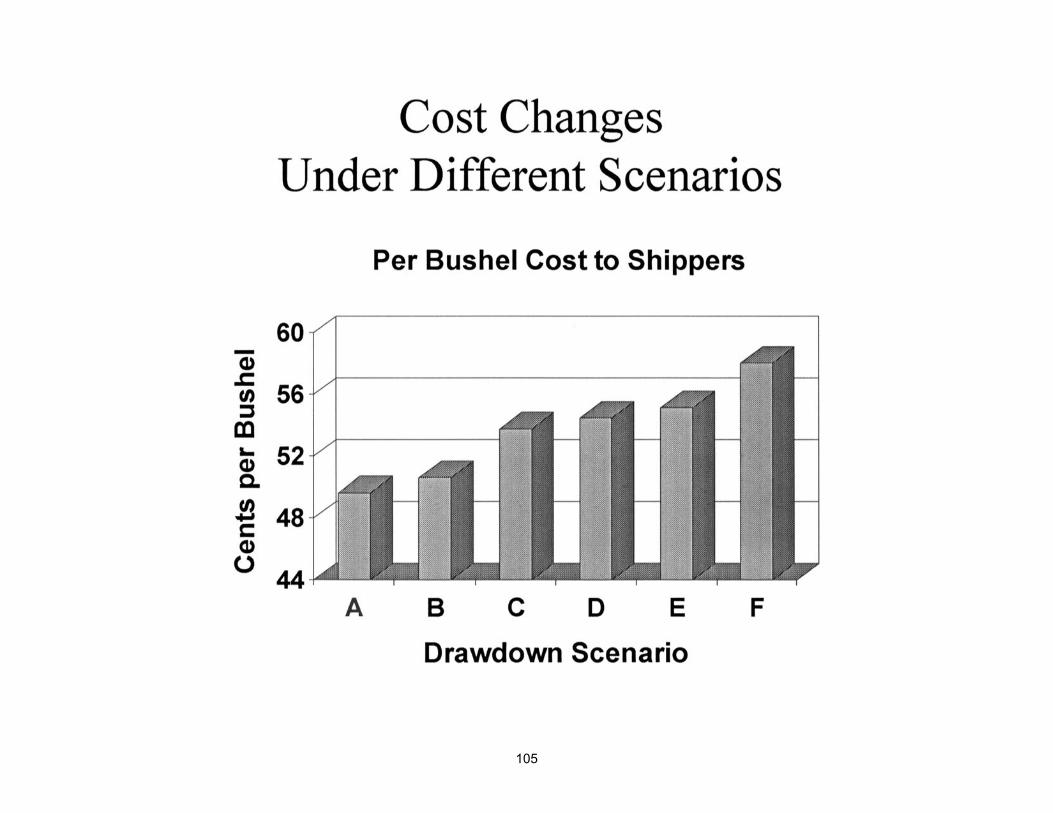
105

106

107

108

109

110

111

112

113

114

115

116

117

9:50 am: County Perspectives Eric Berger (speaker)
118

Analysis of Basic Revenues County Fuel Tax ($1,000) Property Tax ($1,000) % Prop. Tax/Fuel Tax
Adams 2,959 998 0.3Asotin 1,096 363 0.3Benton 2,404 2,636 1.1Chelan 1,744 3,762 2.2Clallam 1,480 3,000 2.0Clark 5,323 16,334 3.1Columbia 1,050 230 0.2Cowlitz 1,654 5,989 3.6Douglas 2,625 1,775 0.7Ferry 1,284 195 0.2Franklin 2,179 1,878 0.9Garfield 984 196 0.2Grant 4,300 3,400 0.8Grays Harbor 1,840 1,801 1.0Island 1,719 3,993 2.3Jefferson 1,043 1,480 1.4King 14,595 44,188 3.0Kitsap 4,197 10,175 2.4Kittitas 1,422 1,440 1.0Klickitat 1,963 1,163 0.6Lewis 2,624 3,439 1.3Lincoln 3,202 806 0.3Mason 1,690 3,978 2.4Okanogan 2,574 1,696 0.7Pacific 1,050 1,190 1.1Pend Oreille 1,097 1,200 1.1Pierce 9,649 27,458 2.8San Juan 761 1,519 2.0Skagit 2,400 4,562 1.9Skamania 652 663 1.0Snohomish 7,498 20,515 2.7Spokane 8,356 14,265 1.7Stevens 2,728 1,865 0.7Thurston 3,613 9,247 2.6Wahkiakum 545 200 0.4Walla Walla 2,230 2,300 1.0Whatcom 2,914 9,447 3.2Whitman 3,173 1,250 0.4Yakima 4,600 6,050 1.3Totals $117,217 $216,646 Average = 1.4
119

Analysis of Road Mileage per Resident of Unincorporated County County Population Unincorp.
Population Miles of
Road Unincorp. Res./Mile
Miles of Unpaved
Road
Unincorp. Res./Mi. Unpaved
Road Adams 15,200 7,364 1,762 4.2 1,084 6.8Asotin 19,100 11,210 394 28.0 249 45.0Benton 131,000 33,280 877 37.9 305 109.1Chelan 60,000 27,300 658 41.5 137 199.3Clallam 63,600 37,491 488 76.8 43 871.9Clark 291,000 203,536 1,287 158.1 58 3509.2Columbia 4,200 1,490 504 3.0 370 11.4Cowlitz 89,400 37,755 537 70.3 22 1716.1Douglas 29,600 20,746 1,635 12.7 1,197 17.3Ferry 7,100 6,000 726 8.3 517 11.6Franklin 44,000 18,270 1,020 17.9 460 95.7Garfield 2,350 885 457 1.9 330 2.7Grant 64,500 32,405 2,500 13.0 1,251 26.0Grays Harbor 67,700 26,930 561 48.0 73 369.0Island 68,900 47,145 592 80.0 20 51.8Jefferson 25,100 16,935 390 43.4 89 190.3King 1,613,600 497,403 2,207 225.4 87 5717.3Kitsap 220,600 151,075 973 155.3 57 2604.7Kittitas 30,100 12,841 565 22.7 81 158.5Klickitat 18,100 12,000 1,080 11.1 674 17.8Lewis 65,500 40,177 1,056 38.0 70 574.0Lincoln 9,700 4,078 2,047 2.0 1,603 2.5Mason 45,300 37,745 619 61.0 89 424.1Okanogan 36,900 21,764 1,379 15.8 724 30.1Pacific 20,800 14,035 353 39.8 58 242.0Pend Oreille 10,700 7,700 546 14.1 293 26.3Pierce 660,200 396,357 1,767 224.3 42 9437.1San Juan 12,300 10,490 272 38.6 66 158.9Skagit 93,100 43,936 804 54.6 58 757.5Skamania 9,550 7,888 247 31.9 37 213.2Snohomish 525,600 269,544 1,600 168.5 97 2778.8Spokane 401,200 191,406 2,962 64.6 1,367 140.0Stevens 35,400 26,253 1,498 17.5 890 29.5Thurston 189,200 109,860 1,000 109.9 59 1862.0Wahkiakum 3,700 3,180 143 22.2 28 113.6Walla Walla 52,700 15,645 962 16.3 391 40.0Whatcom 148,300 69,635 957 72.7 63 1105.3Whitman 40,500 6,704 1,929 3.5 1,482 4.5Yakima 204,100 94,440 1,737 54.4 660 143.1Totals 5,429,900 2,572,898 41,091 Avg. = 54.1 15,182 Avg. = 867.0
120

Appendix C
121

Complete Transcript from EWITS Forum Meeting Eastern Washington Intermodal Transportation Study
Forum Proceedings
May 13, 1998
Introduction Jerry Lenzi (moderator), Eastern Region Administrator, Washington State Department of Transportation. Welcome to the Eastern Washington Intermodal Transportation Study Forum. I believe you have heard of the Transportation Research Board. This is a national board that all states belong to through the various transportation affiliations for their state, federal agencies, and some international agencies. The Transportation Research Board has produced several studies and analyses regarding various commodity movements. The state of Washington has also been active in that field, has participated with TRB, and has produced several of their own freight mobility studies. I would like to note the Freight Action Study Task Force that was done in 1995. This Task Force looked at freight movements from approximately Everett, Washington, down through the Port of Tacoma. The results of that study encouraged our legislature to broaden the scope a bit. Our Legislative Transportation Committee (LTC) set up an Eastern Washington Freight Mobility Advisory Study that was conducted in 1997 and results were reported to the 1998 legislature. This prompted additional studies and one the legislature did pass this present session is the Freight Mobility Study Committee II. Basically, it's going to start looking at the ramifications of a potential Snake River drawdown. There are a lot of complexities to that issue. This study should provide some detailed information that will act as input into the Environmental Impact Statement that the U.S. Army Corps of Engineers and the National Marine Fisheries Service are conducting. Let's talk about acronyms. EWITS is the Eastern Washington Intermodal Transportation Study. I've talked about the Transportation Research Board or TRB. Washington State Department of Transportation (WSDOT) has participated on different subcommittees of the TRB. For example, the development of a multimodal framework for freight transportation investment consideration of real highway trade-offs. That study basically produced a measurement or methodology called multi-criteria variables. That was used in the Freight Action Strategy Task Force or the FAST study. We have Eastern EFMAC; the Eastern Washington Freight Mobility Advisory Committee Study that the 1997 legislature set up and the report was presented to the 1998 legislative session. We have FMAC, the Freight Mobility Advisory Committee, a separate committee comprised of private ports, local agencies, State Transportation Commission, and legislators that set up criteria which they presented to the legislature on recommendations in terms of what is the appropriate criteria and what should we be doing. The legislature, through various analyses determinations, enacted a Freight Mobility Strategic Investment Board that is just about to get underway.
122

ISTEA, the Intermodal Surface Transportation Efficiency Act of 1991, is a federal transportation act. You have probably been reading now about best TEA, next TEA, or ISTEA II. This is the successor to ISTEA depending on how the U.S. Senate and the U.S. House conferees come out, and how the president views that committee reference; hopefully, we'll have an act by July 4. It is very important to the states; I should point out that federal money stopped flowing May 1 and some states are going to be in a pinch shortly. And, of course, NAFTA; the North America Free Trade Agreement.
EWITS--What is it? What did we learn? How can it be used? Jerry Lenzi, Chair, EWITS Steering Committee. Eastern Region Administrator, Washington State Department of Transportation. EWITS was a precursor to many of these things and I believe it helped encourage the interest and visibility of studies in transportation needs in eastern Washington. It was a part of the ISTEA of 1991. Congress did provide $800,000 to do this eastern Washington study which required a $200,000 match from the state of Washington. In addition, notice the implications of NAFTA, especially for eastern Washington and eastern British Columbia. There are closer ties due to NAFTA. And you'll see the highway system. Of interest have been studies by the WSDOT on SR 395 and the complimentary portion of the Kootenai boundary study in British Columbia. Why did EWITS occur? We recognize that Washington is a bridge state. Eastern Washington and Canada highway corridors SR 395 and SR 97 are the primary routes to access British Columbia. Traffic goes through Washington State destined for either the hinterlands of the U.S. or the southwest part of the nation. This is a gateway to the western U.S. Shippers and producers want adequate mobility across the international borders and market access. They have concerns about several things; for example, port of entry customs hours of operations. Oroville on SR 97 is the only 24-hour border crossing we have in eastern Washington. The remainder does not open 24 hours on the U.S. side although several of them are open 24 hours on the Canadian side. The British Columbia Ministry of Transportation and Highways is also reviewing this and looking at how their transportation facilities access Washington State and eastern Washington. Another issue is the capacity and condition of the transportation infrastructure. Canadian trucks, on average, are heavier and may run up to 105,000 pounds. They wear the highways more rapidly than U.S. trucks. They are not illegally loaded, just loaded fuller. They are using more of the available cube space. How does that impact us in eastern Washington? I think you folks who live in eastern Washington are aware that we have a significant number of freeze-thaw cycles. I should point out, I'm going to contain my comments to just the state systems. You'll hear something about the county systems later. We restrict rural sections of highway to prevent damage so they don't break up. This often interferes with an individual who is trying to get his commodity to a market or transfer point. This happens with our resources, which are predominantly agriculture and timber. In eastern Washington there are currently over 250 miles
123

identified that experience these weight restrictions. To bring these 250 miles up to a standard that allows legal loads to traverse them year-round, without being weight restricted, will cost a little over $180,000,000. Eastern Washington has three Department of Transportation regions. The eastern region has budgeted just below $100 million to bring our miles up to the correct capacity and condition. North central, out of Wenatchee, has budgeted in the mid-30 million to bring their miles up to capacity. South central, out of Yakima, has a little over $50 million. Out of that $250 million currently, because of our finances, we only have 25 miles programmed. We are making headway and, hopefully, that will continue. An additional surface transportation concern is railroads. In 1970, Washington State had a little over 5,000 miles of rail line available. In 1998, that mileage is down to less than 3,100 miles. Eastern Washington took the brunt of abandonment. Of the 1,918 miles lost, we lost 1,263 miles in eastern Washington, or 66 percent! Another concern for railroad is the branch lines, especially wheat that is a big commodity here. A 100-ton hopper car is an industry standard to put wheat in and ship it. However, the mainline railroads are looking at using 125-ton hopper cars. It puts more impact on the railroad infrastructure and, frankly, some of the branch lines cannot handle that. This may cause another round of abandonment or similar activities. An additional surface mode is the river. This is a critical mode for eastern Washington and impacts Idaho, Montana, Wyoming, North Dakota, and South Dakota as well. The grain flows basically to the Lewiston-Clarkston area to be put on barges and then shipped down the river. It is very cost efficient. Compare the number of railcars and the number of trucks equivalent to one barge. These multiple modes relieve some of the potential highway congestion and highway wear. The potential of a drawdown threatens this river system in terms of not being available, which could have drastic consequences. The LTC-sponsored study that will be undertaken will address this, and Dr. Casavant will talk about some of the initial implications, which we have found. The concerns we have are from both the transportation standpoint and a producer/shipper standpoint, because economics enters it. Another issue is rural economic development. Smaller towns and cities depend on a transportation system not only to get their goods and commodities to and from market, but also to get the raw resources in, and to move about in terms of recreation, business, etc. The apple and wheat industries critically depend upon the highway system. These industries try to keep the transportation cost to a minimum. Their profit margins are fairly thin and they can be hurt very quickly. The profit margin is tied very tightly to transportation rates and fluctuations within those rates. The freight movers are also concerned about access reliability conditions of the system. In 1994, NAFTA reduced some of the trade barriers between the U.S., Canada, and Mexico. This significantly encourages cross border trade. How did EWITS come about? Early in 1991, we received a phone call from the staff of then U.S. House of Representatives Speaker of the House, Tom Foley. The staffers mentioned that they wanted to focus on transportation in eastern Washington. They wanted to identify needs, provide more visibility, and hoped this could be followed by policy changes and additional funding at the federal, state, and local levels if it was done correctly. At that point in time, we developed a Scope of Work. The Scope of
124
Work became the vehicle that was inserted into the 1991 ISTEA and $800,000 in federal monies was granted. The Washington State Legislature found the $200,000 matching funds and the study commenced. We are looking for seamless freight mobility movement in eastern Washington, but we are interconnected and interdependent on western Washington. While this is the Eastern Washington Intermodal Transportation Study, it is critical we recognize our connectivity to our deep-water ports in western Washington and the fact that we have a system that flows both ways. We chose to conduct this study through our Transportation Research Center. This is an interagency agreement between Washington State University, the University of Washington, and the Washington State Department of Transportation research office. We set up a Steering Committee in which a smaller group of people sat and I was honored to chair that committee. We had an Advisory Committee comprised of a multitude of different people. The purpose of both these committees was to provide guidance, a reality check, and an overview. Former House Speaker Tom Foley and the Washington State Legislature did go the extra mile to ensure that eastern Washington was provided the chance to investigate, analyze, review data gaps, policy implications, and provide visibility. At some point we are hopeful this will lead to additional funding and emphasis on the transportation system. EWITS is an excellent fundamental building block that is now helping us with data resources and background material for addressing our transportation needs and it will be an instrumental feature as we move ahead. But recognize that EWITS is a snapshot in time, and as time goes on, the data will age and it will need to be refreshed, or we will need to recognize that we have aged data. I would like to introduce our project director, Dr. Kenneth Casavant. He's going to talk to you a little bit about EWITS from his perspective. Ken Casavant, Project Director, EWITS. Professor, Washington State University. Thank you, Jerry, and welcome to the EWITS Forum. I'd like to take a look at the scope of EWITS, the approach we used, and some of the activities that we undertook. And then offer some of the selected findings to give you a sense of what we were looking at and what data is and are available for future work. A characteristic of EWITS is that we used "adaptive research." This was a six-year project and using adaptive research allowed us to respond to issues as they arose during the process. The Steering Committee and Advisory Committee was very active and very directive to myself as Project Director. We did this through the use of research reports and working papers. The working papers were designed to be short-term in nature. If an issue came up, if somebody wanted to know about what happened on SR 395, we could quickly respond with a working paper. Additionally, we offered newsletters. We published four of them, and two of them are available at the publications desk in the foyer. The newsletters were designed to tell people what we were doing, what we planned to do in the future, and how they might get active in the process. These newsletters were well received and we're still getting requests for some of the information in them.
125

Let me talk a bit about the research plan and the theme of EWITS. The underlying production is data. It is information to be used by many different people as they make decisions. It is oriented towards commodities; mainly the origin and destination study, the statewide study of trucking. It is also modal; all modes were covered. We spent time looking at transportation and by-pass issues which are very critical to our communities and the import of transport to them. The demand for these data are also why research results have been presented in over 75 talks in Washington, the Pacific Northwest, the nation, and internationally. Let's take a look at the scope of EWITS, particularly the policy issues that formed the framework. Obviously, the drawdown of the Snake River arose heavily during this time and we focused several of our studies in that area. World development is a continuing theme that underlies much of the commodity movements. The importance of NAFTA--the North American Free Trade Agreement--and how it is shifting commodity movements and shifting or increasing the traffic in some areas. Underlying much of this is simply the infrastructure needs associated with much of this development. We did develop a lot of data series and technical analyses. Those are in the reports and I encourage you to look up the listing. In those data series, there is a lot of information from the statewide origin and destination trucking study we compiled. This was statewide because we were convinced of the connectivity between east and west. With WSDOT's additional support, we were able to take what we were going to do in eastern Washington and make it statewide. This was the first done in the nation. We have data availability. That data is available at WSDOT and at WSU from myself. If you take a look at the listing of the reports and the order form in your registration packet, you'll have a sense of what you might want. It is important to talk about the partnership between EWITS and the Washington State Department of Transportation. In 1993, we had the Transportation Policy Plan, the systems plan, and the MPO and RTPO plans that were operating under legislative directive. We combined the issues that arose and the data needs into most of the preliminary work of the full EWITS from 1993 to 1995. Most of the data was then available to help in the 1995 series of plans. That leads us to a continuing partnership between EWITS and WSDOT. I talked about adaptive research, which allows us to provide information to system plans, WPO, RTPO, and MPO series. Legislative programs are defined by legislative policies. Let's talk about drawdown of the Snake River. We have done a preliminary look at the impact of drawdown for the grain industry that provides good, if early, initial results. Our model indicates one of the first impacts of drawdown would be increase of shipper costs of 9 cents a bushel for wheat. Barley movement goes up to 26 cents a bushel. We have been able to identify the impact on roads, and drawdown would increase road deterioration over $2 million annually. These impacts are felt heavily on State Routes 12, 17, 26, 260, 395, and so on. If we look at the cost changes under different scenarios, it indicates the complexities of the marketing system. Some of these changes include availability or non-availability of railcars at all times, a possible railroad increase in rates due to lack of barge competition, a possible increase in truck/barge rates due to lack of traffic, or any combination of these factors. The increase in costs as real life possibilities are introduced and should be information you might want to use.
126

We made it available on a commercial cost basis. In eastern Washington, on average, we spend 49 cents to bring our grain to market. As a result of drawdown that increases to 58 cents for wheat and gives us the 9 cents per bushel impact. Barley impacts were up to 26 cents. NAFTA reinforces the fact that Washington is a bridge state of highways. Seventy percent of the ton-miles moving through the state into Canada, or from Canada into the U.S., moves through without having an origin or destination in the state of Washington. We are truly operating a national trade highway system. We haven't identified it as such yet, but I think it is something we are going to have to be looking at if we want support for the system that may not provide Washington benefits, but provides service in the national category. Truck rates vary between Canada and the U.S. Although they are legal, Canadian trucks are heavier. Our study indicated 4 percent heavier in the state, overall, and 11 percent heavier in eastern Washington than were non-Canadian trucks. This is due to the type of commodity that we move in eastern Washington. Also, empty and full back hauls vary. Eighty-one percent of the Canadian trucks were full; only 70 percent of the U.S. trucks had a full load. Let's talk briefly about corridor movement trends. This comes from the statewide origin and destination study, and I think it indicates the importance of connectivity between eastern and western Washington. If you look at the traffic congestion information, it will indicate where we already have congestion; where we already have pressure on our highways; and where freight costs are increasing because we are not moving our freight as efficiently as possible. The concern and need for freight mobility efforts is a very real concern. Our freight moving into the west side is freight that gets in front of an automobile. Conversely, that automobile and the volume of it, constrains the efficiency of our movement. We are tied together. We are one state in transportation efforts. Our studies have projected growth changes from 1994 to 2005. It is evident that the changes in commodity movement on different corridors are the reason why there are changes. On I-5, it is evident that destination shipments are expected to increase by over 15 percent, whereas transit shipments are expected to decrease. This is due to expected population growth, and we can expect more destination and more movement into the west side of our state. I-90 transit movements, meaning those not originating or destined for the state of Washington, will increase. Our origin movements on I-90 are going to decrease showing that we are a traffic mover for the rest of the nation. State Route 97 has little or no change, although transit movement is expected to increase relatively over those years. If you look at SR 395, their origin traffic volumes are expected to go down, but destination is expected to increase. This is due to the Spokane and the Tri-Cities growth patterns. Another issue we spent some time on, and have had many requests for information about, deals with business locations. We looked at that two ways. We looked at the impact of bypasses on business in our communities and we looked at what new businesses in the state of Washington want or how important transportation is to them. The results from our bypass case studies were very interesting. Those case studies were on SR 195, where Rosalia has a bypass, and Colfax still has a main street. On
127

SR 95 we looked at Omak, Okanogan, and Oroville; Omak and Okanogan have a bypass, and Oroville has a main street. On I-82, we looked at Prosser and Sunnyside where a bypass had occurred. The results indicate it is necessary to develop specialized businesses to match and use main street local and transit traffic. That did occur over time, particularly in Colfax and Oroville. Also, downtown businesses need a well-developed customer base to avoid impacts; this was evident in Omak and Okanogan. To avoid negative impacts, it is necessary that they have access to a major trading center. A good example is that Rosalia has gained now as a result of its access to Spokane. It is becoming a bit of a bedroom community, gaining in some of the peripheral results. Increased highway related and retail businesses along bypasses help mitigate some of the downtown losses, particularly noticeable in Prosser and Sunnyside, but also in Omak. Further, in business locations, by annexing property towns can mitigate for losses in the tax base in the downtown area. Prosser, Omak, and Sunnyside were successful in doing so. Land use plans must remain flexible in doing this while still responding to the directives of the GMA. At the management level, transportation plans must be developed to minimize damage to parked cars. This facilitates traffic flow during peak periods and maximizes safety for pedestrians. Finally, try to entice shoppers to central business districts with signs and appropriate activities. The bottom line from that study was that previous and aggressive planning can minimize impacts and maximize the positive results of moving traffic out of downtown. We spoke to new business groups by interviewing 650 firms in the state of Washington. The results suggested that eastern Washington had significantly more retail and service industries, and less manufacturing, than our respondents in western Washington. Looking at motor freight modes, it is quickly evident that there is little or no difference between eastern and western Washington either in delivery or receiving of products. If you look at water and rail movements, it is evident that eastern Washington uses rail far more than the western portion of our state. That holds for both delivery and receipt of products. Water transportation, where we have a tendency to think that it must be very active in eastern Washington, it turns out that we are looking at manufacturing. Most of the new industries are not bulk industries; they are value-added firms, they are processing, they are electronics, they are manufacturing, and they are service firms. Water is used more in the west for providing access to important international trade and port activity. A final area that we worked heavily on was commodity marketing and transport. We did research on the I-5, I-90, SR 395, and SR 397 corridors. We have detailed rail and barge studies as well as truck studies in our work. We looked at commodities: general freight, fruit, hay, grain, vegetables, and forest products. We used a "GAMS-GIS" model, or Generalized Algebraic Modeling System, and Geographical Information System. The GAMS model identifies how to move products at least cost. The GIS model arranges and displays data. The sequence is: start with ARC information and have as many different routes identified as possible. That information is put into a spreadsheet, or database, that is fed into the optimization model. It selects the least cost way of moving products. That result then comes back
128

into the spreadsheet or database for display of the optimal solution. Finally, ARC information is used to analyze and display the results. Some of the output includes the highway system and the rail system. We can also identify our elevators in each of the counties. We have information on the location, size, and structure of every on-farm storage in eastern Washington as of a year or two ago. This is a dynamic system and it is always changing. This is probably the most popular report we have for eastern Washington as it shows where the impact is for local roadways. It generated local, state, and marketing interests. Let me conclude with the reminder that the state legislature, WSDOT, EWITS, and our RTPO's and MPO's is a continuing relationship. Our initial preliminary work on the drawdown helped provide information that will be useful in framing and actually implementing some of the Legislative Transportation Committee Study. Rural development data were useful in the Governor's Rural Development Summit in Port Angeles several months ago and they will be available for the Governor's Eastern Washington Rural Economic Development Summit in Moses Lake on June 24. NAFTA information is continually being provided at the national, state, and city level as these entities plan and prepare for some of the transportation changes that are occurring. And finally, in commodity marketing and transportation, we expect information to be continually provided to producers, shippers, users, commodity groups, and, in many cases, our officials at all county, state, and local levels. The summary report that was handed to you when you registered provides a synopsis of each EWITS report. These contain a lot of precise detailed knowledge on data series and technical analysis. We started some of that work in 1992 and 1993. That was a snapshot in time and some of the roads are now closed or mislabeled. We need to continue keeping the database up-to-date and continue monitoring and evaluating those data. And the challenges continue to evolve. We do have drawdown looking at us, with a potential decision in 1999, with implications and appropriations following that for years. We have NAFTA being reshaped between barley movements, wheat movements, and traffic movements. We've got rail line abandonment continuing to stare us in the face here in eastern Washington. Transportation is such a dynamic system that we have to stay in touch with it. Today our panels and our program are designed to show you the road ahead for transportation. It is a directed road; there are no passing lanes. We must keep heading in the same direction together, rather than trying to pass each other. Jerry Lenzi, moderator. At this time I would like to call up Jay Armstrong, the Deputy Director of the County Road Administration Board, to give us a county perspective on this. Jay is a former public works director for counties and is on the CRAB Board, so he can give us a pretty good flavor of some of the local issues as they see them.
129

County Perspectives Jay Armstrong, Deputy Director, Country Road Administration Board. One more acronym and that is CRAB which stands for County Road Administration Board. We are a Board in Olympia that works with all the county road departments by providing support and statutory oversight. The main scope of EWITS is looking at moving freight and goods across the state. But all the freight and goods originate on farms and in factories and, if we think of the state system as a body with arteries and the veins, the capillary system (or county roads) is what actually gets the products either onto or off of the farm. Historically, most county roads started as farm to market roads and, as population has increased and the types and methods of farming have changed, the roads have stayed about the same. You have the same roads in Garfield County that you had a 100 years ago. They may have changed slightly in location and they may have been slightly upgraded, but you have the same basic structure there now as you had 100 or 120 years ago. Yet the state has changed. Today in the 20 counties in the EWITS study, we have 20 percent of the rural population of the entire state; yet we have 60 percent of the road miles. By far the most population--rural and urban--is in the western part of the state, yet the most roads are on the eastern side. We have 93 percent of the state’s gravel roads in eastern Washington and those roads are mainly in support of agriculture and rural development. As we look at EWITS from a county perspective, I see two levels of information. At the first level, and the main thrust of the study, it is moving freight and goods either through the state or within the state from major focal points. On the main arteries they can detect where the freight and goods are going, but it is almost impossible to get to the county level and look at all the little roads. Most counties don't have traffic counters and can't really measure how many trucks are being used. Yet the study is effective in that, if we know there are 400 trucks in Odessa in a day, we know those 400 trucks are actually going to Odessa, but then they are dispersing out throughout Grant County. It is just a matter of the county working with the local farmers to figure out which roads are affected the most as this freight is dispersed. On the second level, we are talking about the number of trucks dispersing out from the cities. We think that studies on the grain, row crop, and timber movements were very helpful to the counties. They showed a real dependence on local roads, moving the freight and goods into the intermodal system and into the state system. Locations for wheat storage are particularly useful because they help counties identify logical frameworks and networks within the county system itself. Wheat reports clearly document that wheat is reaped during a short period of time in the late summer and early fall and put into storage over a short period of time. Yet that wheat is distributed throughout the winter, which is the worst time of year for county roads because of freeze and thaw conditions. If we do have a water drawdown on the Snake and Columbia Rivers, the impact on state highways and county roads is very alarming. We think the GIS system has great potential for counties. We would encourage the further development of the GAMS-GIS system and make it a tool available for counties to work with.
130

The ongoing work on cost factors attributable to truck damage is very interesting and it could be very valuable as we look at a future need study. The concern from a county road standpoint is that the county roads vary so much--and the geography and terrain varies so much--that it is difficult to take a cost factor and apply it across the board. We have to be very careful and look at the individual roads themselves as we develop the estimates. We think EWITS has served a very valuable purpose by focusing attention upon the movement of freight throughout eastern Washington and, from a county standpoint, it provides a solid foundation from which to build. The study clearly demonstrates the interrelationship between local and state roads, the river, and rail transport. And if one part of the system either falters or breaks down, the impact on the other parts of the system are very dramatic. Again, even though the county roads are more like the capillary systems, if you can't get the freight and the goods off the farm to the cities, the whole state system will eventually dry up. All parts of the system depend on each other. In the late 1980's, the legislature established a program in CRAB called the Rural Arterial Program or RAP program. Today this is about the only funding source for counties for the upgrade of roads. The program was established specifically to help eastern Washington upgrade its roads as a result of the abandonment of rail transportation in the area. If we look at the rural population and the number of rural miles in Adams County, we have about 4.2 residents per mile of road. Lincoln County is one of the worst cases with about 2 residents per mile of county road. Contrast this with some of the larger counties on the west side. Thurston County, has 109.9 people per mile of county road. If you are in Lincoln County, and have two rural residents per mile of county and your tax base is set upon these rural residents and you have 2.5 people in each family, then each family is supporting more than one mile of county road with their property taxes. And most of your roads are going to cost $2,500 to $3,000 a year to take care of. If you have a $3,000 to $3,500 tax bill just for the structure maintenance of the roads, then talk about libraries, schools, and other county government needs, then you are talking about a very large tax cost. It just doesn't work in eastern Washington. There are basic revenues that county road departments have to work with and these are provided by two sources of funds. You have your property tax, which is based upon the assessed value of property within the county, and you have the gas tax, which is distributed statewide. In Thurston County the property tax is about 2.6 times the gas tax and in King County the property tax is three times the gas tax. Yet in Adams County, property tax is 0.3 times the gas tax and basically there are no gas stations. All the money coming to Adams or Lincoln County from the gas tax collected comes from the west side of the mountains. The property tax is based upon the agricultural value of the property and it is held at a very low value, trying to help the farmers make a living. There is no tax base to raise money to take care of these local roads. And that is the dilemma the counties face. They have very few people; the land is basically zoned agricultural and is used for agricultural purposes. They have no gas tax. They have no money. Yet they have by far most of the roads. And they are the capillaries feeding the state system.
131

Where do we go from here? Basically, we need to strengthen the critical weak points in the total system. I think the counties understand that you have to put the most money where the most trucks and roads are located; and the interstates are moving the freight. And yet, the little county roads have to be taken care of as well. A lot of the counties in eastern Washington have formed local groups with the farmers trying to prioritize the roads in the county, either to upgrade from gravel to asphalt or decide which roads to widen and which ones to ensure are all weather. They are just trying to do a better job with the limited resources available. We need to continue working with the GIS models to provide a better framework for planning the work and give better tools to the farmers.
Combined Question and Answer Q: Stanley Green, Walla Walla 20-20. You showed some scenarios regarding drawdown. Do any of those scenarios anticipate what might happen if any rail lines were restored? A: Ken Casavant. None of the existing ones have considered additional capacity or rail lines, in or near your county or any of the counties in eastern Washington. That may well be something that should be discussed in the forthcoming LTC study. Q: Jerry Bryant, Stephens County. I'm a little confused about your slide that showed a decrease in the origin and destination on SR 395. You mentioned that was because the population was increasing or that was a contributing factor. Is that a percentage of the traffic or is there an actual decrease in the number of vehicles? A: Ken Casavant. Yes, that was a percentage. It becomes a relative value. The total volume may increase, but looking at the relative value, it was on a percentile basis. Q: Randy Bostrum, Port of Whitman County. How was the LTC set up and how would we participate in that process? A: Jerry Lenzi. How is the LTC set up? The LTC is set up internally by the legislature. It's a combination of the House Transportation Policy and Budget Committee members and the Senate Transportation Committee members. I would suggest that you contact Gene Prince, the chair of the Senate Transportation Committee, or Karen Schmidt, the chair of the House Transportation Policy and Budget Committee, and let them know. At the very least, get to me, and I'll make sure, pass it on to those folks, and see to it that they get that information. Q: Gary Olds, U.S. Army Corps of Engineers, Walla Walla. In your perspective, how adaptable are the railroads to new investment in the event of a potential drawdown? To investment in new facilities? A: Ken Casavant. Do you mean railcar capacity or new lines? Clarification: Gary Olds. Everything.
132

A: Ken Casavant. I think the shippers in eastern Washington wouldn't call the railroads highly flexible. That doesn't mean that if traffic and potential traffic appears, there might not be some investment in railcar capacity. That's a private business decision made by those railroads. It is difficult to model from our perspective and it is difficult with the Corps working with DREW to model as well. A: Jerry Lenzi. In our latest Washington freight mobility study, we had members of the Burlington Northern-Santa Fe there and I will not speak for them, but it appears they are inclined to look at their main line systems. They have some problems and need to do some major investments. A lot of the branch lines are being left to the smaller groups of folks like the Blue Mountain. Those folks have to make those business decisions to either increase car supply or put in more track--or whatever. It's a decision that would have to be arrived at in the private sector. Q: Rebecca Francik, Pasco City Council. From an economist’s point of view, when you need barges, railroads, and roads, how do you allocate those resources? For instance, rails have traditionally been private industries, but we're talking a million dollars a mile to build new ones and the railroads are saying they need help to do that. How do you perceive that interweaving as an economist; where is it prudent for a taxpayer's dollar and where is it not? A: Ken Casavant. It's probably the hardest decision we have to make. We end up doing it in the political arena and having it implemented by state agencies. Much of that investment is complex because it is private investment/public need and, in many cases, public investment competing against private investment. I can't give a specific answer, other than we know what the demand in the state is in aggregate needs and when that is translated down to a market demand, our private folks will respond. But there are some areas where market demand is not the same as what the public needs, and that's when public folks and investments have to step in. Q: Sue Miller, Franklin County Commissioner. As the studies are updated, what consideration is being given to the effects of dam removal? A: Jerry Lenzi. These studies won't be updated. EWITS is ending in another four or five months. However, there is a Legislative Transportation Committee Study that is going to look at a Snake River drawdown and there are a couple of different scenarios there. They will embark upon that work probably mid-summer and later this year. They will look at various issues of drawdown, the impact on transportation modes, pricing structures, jobs, and a whole host of issues. Hopefully, that report will be out sometime next year. Q: Bob Kelly, Kennewick City Manager. With so much of the freight traffic in Washington State passing through the state, how do we balance the cost of being the bridge for the benefit received, assuming there is some benefit associated. How does
133

that happen? Our community is being impacted right now, primarily by freight rail traffic on a line that was largely abandoned years ago and has recently been reactivated. And if the freight rail traffic increases, as is being projected, we'll have $30 or $40 million of grade separated crossings that will have to be addressed in our community because our community has grown since that freight rail traffic decreased years ago. How do we balance that? How do we gain some benefit from this through traffic, associated with the cost of the impact of that increase in through traffic? A: Ken Casavant. Any time you have a distribution of benefits that is different than the distribution of impact and costs, then you have a problem. By doing research to identify what the impacts and benefits are and who is getting what, research provides the base. Then planning allows that base to develop some alternatives. Ultimately, like the theme of this conference, research plus planning plus political support hopefully will generate success. In the larger picture, we are concerned about California trucks going to Canada and the impact being felt on our roads. They'll pay a trip permit, but we haven't looked specifically at how much is being paid. That's the larger context. You're talking about local impacts. I think I would go back to research, meaning learning what the real numbers are, planning, trying to develop alternatives, and then working with political support to try to generate some success. A: Jerry Lenzi. We did look at that in our eastern Washington study; it's a difficult equation. You have to look at it from several different perspectives. The logic in reactivating the Stampede Pass rail line was a private sector logic, because of the freight flow, which is good because things are going well so there are more freight and more movement. That helps bolster the economy. But, what happens is those trains that are a mile long pass through communities that for years have had very little traffic and are now saying, "Gee, I don't like this 'cause it's cutting off police, fire, emergency services, school bus routes, and those issues." While that is certainly true, I don't believe you can look totally to public agencies to solve that problem. This has to be an issue that reaches across public, private, shipper, and those impacted. We tried to get into that a bit in the study. That's very difficult because it immediately throws you back into the arena of politics and those decisions are made at a local level, at a state level, and at a federal level. It is trying to find a balance point. I believe it's going to be up to public and private resources to solve it and I'm not convinced we'll get 100 percent of everybody’s satisfaction. Q: Ben Bennett, Executive Director of the Port of Benton. We are sitting on a critical decision we've got to make about the Hanford railroad system that is going to be shut down at the end of September. There is about $200 million worth of assets sitting out there totally used by the federal government. One of the things we're wrestling with at the port is: what are going to be the impacts and what is the potential for that system in terms of us possibly taking that over? I know that EWITS is about to come to a conclusion, but what is the possibility of us getting included in some of those studies?
134

A: Ken Casavant. Right now, the EWITS funding source is pretty much gone. Some of the information and knowledge might be available and might be helpful. We may be able to help you on some of those projects. Together, we can help look for some funding to help get that underway. Currently, as far as EWITS itself, the funds are almost over, the time is almost over, and we'll have to rely on the existing database. And it's not specific to the needs you are identifying. Comment: Charles Kilbury, Mayor of Pasco. More of a statement than a question. There has been some talk about the railroads and what they can do to help relieve our problems. I don't think so. They're only interested in the traffic they get off the water and running it through the state of Washington. If you expect the Burlington Northern-Santa Fe to do any building of railroads for some time to come, their Board of Directors meets in Fort Worth, Texas, and I don't think they're very much interested in doing anything. They have been putting in CTC in the area east of Pasco and that's about all the action they're taking at this time.
Location, Transportation, and Economic Development Priscilla Salant (moderator), Washington State University. Earlier this morning, Ken Casavant talked about two different policy issues that EWITS research has addressed. Those were rural economic development and infrastructure needs in Washington State. This panel is going to give you an on-the-ground perspective on how these two policy issues play out with respect to transportation. Jerry talked about a seamless freight system in Washington State. These panelists are going to discuss when that seamless freight system works and when it doesn't work in their local communities. They will also talk to you regarding ways to integrate and coordinate transportation planning. Finally, they will be looking ahead to the kind of transportation policy issues on the horizon for eastern Washington. Our first panelist is Jim Kuntz, who is executive director of the Port of Walla Walla. Jim received his education in Washington State, earning a bachelor’s in Economics at Eastern Washington and a master’s in Public Administration at Evergreen State College. He was assistant manager of the Port of Benton in the 1980's. He was briefly manager of the Walla Walla Regional Airport and, since 1990, has been director of the Port of Walla Walla. As director, he is responsible for the port operations at industrial sites throughout the county, two barge slips on the Snake River, and the Walla Walla Regional Airport. He's been involved in broad economic development activities, including the Board of Eastern Washington Job Training Partnership. He has also been on the EWITS Advisory Committee, so he has specific experience with transportation planning.
135

Jim Kuntz, Executive Director, Port of Walla Walla. I have three points I want to cover this morning. One, I'll talk briefly about the port; about who we are and, more importantly, some transportation infrastructure projects that have played key roles in some recent economic development success stories. The second point I want to talk about is transportation policies to ponder from an economic developer's perspective. I'm going to talk about all four modes of transportation and what I think needs to happen in each mode. And the third and last point is some critical tools and regulatory relief that local governments must have if we are going to be part of the transportation infrastructure solution. As it relates to the port, we were founded in 1952 and are a countywide port district. We are somewhat unique in that we are also the EDC, the Economic Development Corporation for Walla Walla County. Our port is measured by two goals. One is creation and retention of family wage jobs; that is first and foremost how we are judged in our county. Our second goal is helping to maintain a multimodal transportation system for our county and our region. Our budget is approximately $4 million; about 25 percent of that comes from property taxes and 75 percent is self-support from revenues we raise ourselves. As it relates to transportation assets that we are managing, we own the Walla Walla Regional Airport, a 2,200-acre complex with commercial air service. We recently announced that we are going to be building a new airport terminal building at a cost of approximately $9 million. We own ten miles of roads within our county and we haven't been creative enough to give those responsibilities to counties or cities. River transportation is big for our port; we have multiple sites on the Columbia and Snake Rivers. Burbank is the largest of our facilities and is located at the confluence of the Columbia and Snake Rivers. It has 250 acres with two barge slips in our cargo dock. We have about 150 barge loads of grain that go through our port every year. I think our grain exports are 95 percent throughout eastern Washington. We own multiple rail sidings and have been strong advocates for preserving light density rail lines in the state. We also manage the state’s Grain Car Program, which I'll speak about shortly. Let me talk about a few economic development successes we've had as directly related to transportation infrastructure. Ponderosa Fibers of Washington built a $150 million paper recycling facility next to Boise Cascade in the western portion of Walla Walla County. This year alone they will pay $1.1 million in property taxes to Walla Walla County. One of the reasons they are there is because there is multimodal transportation at that site. They have two rail lines that come into that plant and they can be served by BN or UP. We have a barge slip close by and Highway 12 is right next to the plant. And the state deserves some credit, because there were some transportation issues of getting off and on Highway 12. Ponderosa and the state pooled their money and developed some turn lanes and acceleration lanes off of Highway 12. That's a model that needs to be continued throughout the state.
136

The other interesting transportation mode that has really helped us a lot is the airport and its importance. We recently got a company called Regents Washington Health to locate a Claims Processing Center in downtown Walla Walla. Regents Washington Health is located in downtown Seattle and had a very difficult time maintaining a work force. If it wasn't for the airport we would not have them because one of their critical needs is the ability to get into their car in downtown Seattle, drive to SeaTac, get in an airplane, and be in Walla Walla in an hour. The second issue is transportation policy issues to ponder from an economic developer's perspective. Let's talk about the roadway systems and what is the most important part of the roadway system from an economic developer's perspective. We need to maintain what we do have. Business prospects that visit our area don't see what we don't have, they only see what we have. The second issue is that the state needs to focus on developing divided, four-lane highways in eastern Washington. We need a four-lane from the Tri-Cities to Walla Walla, and from Spokane north to the Canadian border on SR-395. My concern is that our freeway system of divided four lanes is really the transportation engine with tight budgets. I have concerns about funding small projects that are not saving money for four-lane projects and I hope we can be more strategic in our long-term investment. If we can get the highways built, we can always come back and do the interchanges and smaller projects. The last thing that is absolutely critical is that in economic development we need flexibility. The state of Washington, and WSDOT in particular, needs to have a strategic economic development fund that we can use to land family wage jobs in eastern Washington. We can do all the planning and brain storming we want, but all it takes is one or two companies to knock on our door and say, "We need a turn lane...." We can't wait for the next biennium to get funded. We have to fund that project now or we lose that opportunity in the state of Washington and it goes somewhere else. It's tough in state government where you basically build your biennium budget and spend all your money; and if you don't spend it, you lose it. But we need to have a strategic investment pot that we can get out when we have economic development opportunities. I think some criteria is needed on how you would use the money, preferably for family wage jobs that support the community. From the roadway perspective we need an investment pot that we can use strategically. I'd like to talk a little bit about the rail system. From businesses that we are recruiting, the most important thing they really want is dual service. They want a rail line that BN or UP can show up on. As it relates to rural eastern Washington, we want the service. To have service, we need to have rail lines, they need to be maintained, and we need to maintain some investment for railcars. I think there are some things that the state of Washington can do to help us in making rail infrastructure investments. I think we need to be smarter negotiators when the BN and the UP show up at the door and want something from the state of Washington. It wasn't too long ago that BN showed up at the state door to support their merger with the Santa Fe. When they come with needs from the state of Washington, whether it is regulatory relief, or a merger, or state support for putting in a fast corridor, we need to pull out our issues and say this is what
137

they need to do to help us. I think the state has a hammer they can use. I would tell them to open some of the exclusive lines so we can have some competition. They won't like that, but if they want regulatory relief or support for one of their mergers, then they might be willing to do so. I think that we should ask the BN and the UP to donate some of their light density lines to local governments. Don't charge local government the cost of what they would have for salvage and the land cost under the rails; they should be able to donate those to local governments. If that doesn't work then we should look at some tax policies that would encourage them to make those donations. As it relates to car supply, I'm not sure how successful we're going to be with the railroads. The railroads like long haul; they don't like short hauls. That is one of the problems we have with the car supply. WSDOT has done a great job in their rail branch as it relates to car supply. They bought some cars and the Port of Walla Walla is managing those cars. We are supplying cars, when the railroads won't, to the local growers. I think it's been a very successful program and I would like to see it continue. Another thing that we should talk to the railroads about when they need favors is allowing us to put fiber optics, gas lines, and community infrastructure within their right of ways. That would help us all. Let me switch now to river barging and transportation, especially as it relates to the upper Columbia and Snake Rivers. Breaching of the dams and tearing out the dams is on the table for the first time and it's a scary perspective. Our greatest attribute is maintaining our intermodal transportation systems. One of our greatest assets, Ken Casavant, is leaving us and I'm really concerned about the river and what may come of it. First and foremost, one of the big problems with all of the studies going on right now is the unknown outcome. What is going to happen? Quite frankly, I think it is hurting investments in eastern Washington. Who in their right mind would invest in a plant on the upper Columbia or Snake system if they want the product barged? Who would make that investment with the uncertainty? I don't think Ponderosa Fibers of Washington would knock on our door today and say they had some interest. What is the impact? What needs to be done? And what can we do? Obviously everyone says it's a federal issue, but I think there are some things we can do and I'd like to challenge some people in this room. First and foremost, it seems that all of the side groups are taking a stance. For instance, the Idaho Fish and Game Department announced last week that they feel that the four lower Snake River dams need to be taken out. They got a lot of press. I'd like to see our Washington State Transportation Commission take a stand at one of their meetings and pass a resolution that breeching or taking out dams is not the way to go. Don't forget the airports. They make our state of Washington a lot smaller. I was telling you about the Regents Washington story. We are not going to be building any new airports in the state. It's just too hard to build new airports. We need to do two things. First, we need to protect airports from incompatible land uses, and second, we need to maintain the airports we have. I'm very concerned about small regional airports that do not have commercial air service so they do not qualify for FAA money. There are a whole host of them throughout the state of Washington and they are all World War II
138

vintage. All their infrastructure is going down at the same time. To their credit the Washington State Transportation Commission recently passed an aviation policy, which is just outstanding. However, we need to find a source of money, possibly a ticket tax on passengers, to start maintaining some of our smaller airports. My last comments relate to critical tools in state regulatory relief that local governments must have to be part of the transportation infrastructure solution. If local governments are expected to be part of the solution, then you need to make sure at the state level, that you are encouraging our investment. Quite frankly, the state of Washington has built-in disincentives for us to invest in transportation infrastructure projects. For example, I told you about our new airport terminal building that is going to cost $9 million. We are going to pay the state of Washington $500,000 just for the right to build the new terminal. We are being taxed $500,000 in sales tax to build an important public infrastructure facility. I think public agencies should be exempted when they are making infrastructure projects from paying sales tax. Or maybe we should just exempt the portion of the state sales tax from public infrastructure. The second issue in infrastructure projects is the state of Washington Prevailing Wage Law. It is absolutely unacceptable. I'll give you some examples from Walla Walla County. For the port district to build a road or participate in a project, we'd probably have to have someone do some flagging. In Walla Walla, the prevailing wage for someone to flag is $20.85 an hour. For someone to lay asphalt, we have to pay $23 an hour. To get water and sewer in our roadways, labor is $22.83. A backhoe operator or truck driver is $26.00 an hour. We cannot afford to do business with those prevailing wage rates. They have absolutely nothing to do with the prevailing wage rates in Walla Walla County. This is an unacceptable way of doing business. Obviously, in the state of Washington, we are not going to repeal the Prevailing Wage Law. That is not realistic at all. But there is a common sense approach we can do and the state legislature needs to do. Let's establish a prevailing wage project threshold so local government can do business. My recommendation is, if it's $250,000 or less, we wouldn't be subject to prevailing wage. We could go out, just like anybody else, and bid a small road project, and we would truly pay the prevailing local wage. Anything over $250,000 is fine, we'll follow the state Prevailing Wage Law. This law is taking a lot of money out of local pockets and draining it from funds that could be used in transportation. Almost every state in the union has a fairly high cost threshold before state Prevailing Wage Law comes into effect. The state of Washington does not. I would like to see a local option gas tax to help cities and counties fund their local infrastructure road projects. Make sure it is a public vote and make sure there is 60 percent approval. I think cities and counties need a mechanism to pay for repairs on their roads and streets. Let me give you an example of what my city is doing. They are trying to fund police, fire, and everything, and there is not enough money for our local roads. They are putting a street bond on the ballot for $3.81 million in September. It's really a tough way to fund transportation and it's really unfair. I live two blocks out of the city of Walla Walla and, if this thing passes, it's not going to cost me a nickel; but every single day I'm up and down city streets. I get a free ride! I don't have to pay anything
139

because the only option the city has is to do this street bond. I think a gas tax is the most equitable way for our cities and counties to fund their streets. I think they should have the option and the flexibility to do that. If we want to tax ourselves, let us do that. I think local tools are important, because we can control our own destiny. My biggest concern for eastern Washington is getting its share of state resources. Washington State Office of Financial Management just came out with the fact that 78 percent of the entire state of Washington lives west of the Cascades! When the year 2000 comes and we redistrict, we will lose at a minimum one legislative district. That means sending one senator and two representatives over to western Washington. That has really got me concerned. Some of the issues so important to us, like drawdowns, are not really getting a lot of attention because they are not really a western Washington issue; they are an eastern Washington issue. I'm concerned demographics are working against us. That's why it is so important and critical that the state legislature helps us get Prevailing Wage Law reform, takes the sales tax off of infrastructure projects, and allows us to have a local sales tax. Priscilla Salant, moderator. The next panelist is Bob Mathison, who is vice president of Stemilt Growers in Wenatchee. Stemilt Growers provides cold storage, packaging, shipping, and sales services for the tree fruit industry in north central Washington. The company was founded by Bob's dad, Tom Mathison, in the early 1960's. The company has around 600 employees now, and ships five to six million boxes of fruit each year. Bob's family homesteaded in the Wenatchee area in the 1890's. Bob is the fourth generation to farm in the area and his son is also farming. He has been an orchardist for 25 years and he started working at Stemilt about three years ago. His job is vice president for incoming products. He's going to give us an insider’s look at some of the transportation issues that a large agricultural firm like Stemilt faces on a day-to-day basis. Bob Mathison, Vice President, Stemilt Growers. I'm not an expert on transportation, but transportation is extremely important to Stemilt Growers. We have growers who bring their fruit to us and we pack and ship it. That's about 10,000 acres of orchard. We also directly manage about 7,000 acres of orchard. Our estimate for the coming year is 350,000 bins of pears and apples, and 17,000 tons of cherries. Our orchards are scattered throughout the state. We started down in Pasco and now have growers all through the Yakima Valley, the Wenatchee Valley, and big acreages in the Columbia Basin all the way up to Oroville. Highways mean a lot to us. I want to talk about our area in north central Washington. Our fruit industry ships about 80,000 truckloads of fruit in a two-month period during apple harvest. It's very crowded on the highways at that time. Each year we ship out about 65,000 truckloads of packed fruit worldwide. Add to that another 20,000 trucks to haul in the boxes, trays, and pallets to the packing shed. We figure that's about 165,000 truckloads on the highways in north central Washington. This is just half, or less than half, of the trucks in eastern Washington, and just in the apple industry.
140

We don't have a lot of complaints about the highways, although we do have a bottleneck in our own town. On Sunset Highway, between our two, bridges we have a two-lane road; the highway department had purchased land by the river to put in a new four-lane highway, but a small group of people objected. The WSDOT said that, if the community is not behind it, then they will put money into communities that really want a highway. We are going to put in a turn lane on that highway, so perhaps that will make things better. We have a plant right in Wenatchee, but the downtown association doesn't want our trucks there anymore. I guess this a typical problem that many cities have. We tell our truckers to get around town any way they can because there is not really a good way. We want to touch a little bit on the economics of apples. Apples add over a billion dollars to the economy of eastern Washington. I think if you took what the fruit sells for, it would be like a billion and half in our economy. We are big in cherries in Stemilt and that adds about $125 million to the economy. For the people in eastern Washington fruit growing areas, our livelihood depends on roads. There is some talk of increasing access to the Port of Seattle. We do a lot of business with the ports and send 40 percent of our product overseas. If we get a whole ship full of something going to Saudi Arabia, we need to get a lot of trucks to the ports in a hurry. We have got to fill the roads with trucks. Another concern is all-season highways and extending snow sheds to get over Snoqualmie Pass. Our nightmare was always January 1997, when you literally could not get from Seattle to Wenatchee by any means. Airports were closed; highways were closed. I'm glad everyone is talking about barge traffic, even though apples don't go on barges on the Snake River, because we're thinking about trucks and the availability of trucks. There are not enough trucks to carry both apples and wheat at the same time. We all affect each other. I know this is getting off the subject, but I was talking to some of our people about trucking. We have learned at Stemilt the hard way that we need to treat our people as customers and we need to take care of our truckers. We used to be known as the worst place to load in the state. We've turned things around. There are some complaints that came from the truckers, such as bridge weight laws. Of course, truckers never like log books, but they are essential. In Wenatchee, they are always angry about the turn. We have to use our streets to take our freight in and out and the streets are set up for cars. When trucks have to swing out and take up two lanes of traffic they can't wait there forever, so they need to go when they can, and hope the cars will stop. Another thing is location. We used to have straight loads of fruit. A truck would come in, load a thousand boxes, and leave. Now they have to go to eight or ten different places to get a load. They get two pallets here, a pallet there, and maybe they have to drive clear to Brewster to get the last two pallets. Truckers like coming to Stemilt, because we do have a scale right there and we will reload our truckers at no cost so they can get their tonnage right. And we have a nice coffee room.
141

The way it works with us, trucks are unloaded in Seattle, and then they drive 150 miles back to Wenatchee to get reloaded, so they can go back. If they don't get there by noon on Saturday, they have to wait until Monday. At Stemilt Growers, truckers face the problem of getting back on the highway. If there is heavy traffic and they have to get on 97A, they have to cross all those lanes of traffic, with never a break in traffic; so they just go and hope. For truckers, it's just a nightmare. They're putting their lives on the line, and they're putting the lives of other people on the line, every time they turn into a highway. Stoplights would be great, but they won't put them in until there are a certain number of fatalities in an area. In conclusion, highways mean a lot to us at Stemilt, as they do to all apple shippers and cherry shippers in eastern Washington. The thing we need to keep in mind, maybe the highways are okay now, but they may not be in the future. If you look across the state, the amount of fruit being produced is being increased by 5 to 10 percent a year, for the next five to ten years, at least. We are going to have a huge increase in the number of trucks on the roads. We are asking ourselves: are our highways up to the challenge? Speaking for Stemilt, we certainly hope so. Priscilla Salant, moderator. That was an excellent presentation. Bob gave us a good illustration of how decisions made at the state level about transportation can have serious impacts at the local level and, depending upon how firms at the local level respond, can have a big impact on the overall economy of the state. Especially when they make as large a contribution as Stemilt Growers. Our last panelist is Joe Tortorelli, who is economic director of Washington Water Power. Joe grew up in eastern Washington and graduated from Eastern Washington University in 1972. He's had 16 years of experience in the economic development field, working for Washington Water Power throughout the company’s territory, which is eastern Washington, northern Idaho, and part of Oregon. Joe works directly with communities in the region on strategic economic development planning and specializes not only in transportation, but also in telecommunications and energy. He's a past board member of both Washington and Idaho Rural Development Councils. Joe Tortorelli, Economic Development Director, Washington Water Power. I work for Washington Water Power and most of you know that Water Power serves electric and natural gas in nine counties in Washington, the northern panhandle of Idaho, and some areas in Oregon. Except for the Spokane-Coeur d'Alene corridor, it's all rural. Our economic development interests include not only where we serve, but throughout the Inland Northwest, which is all of eastern Washington, northern Idaho, and western Montana. We feel it is a regional economy, and what benefits one, benefits all, and some more than others. We've assisted communities in planning and funding economic development. We spend close to a million dollars a year in economic development initiatives, advertising on both a national and regional basis. We fund
142

much of the Economic Development Council Help Fund along with other agencies in your communities, economic development councils, and other initiatives. We have primarily focused on community development during the last ten years. More recently we have focused our emphasis on business recruitment, retention, and expansion. My remarks are going to address primarily the association of industry recruitment, and its related activity of retention and expansion, to the impacts on transportation systems. Everybody has stories about sighting businesses, as well as retaining them in the community, or helping them expand. Whenever you ask anybody what was the most critical factor in a company locating in a town or doing an expansion, they can't pinpoint it to one or two primary factors. It's usually a combination of a number of things. Everything from cost, which is obvious, to the labor force, and transportation. This combination of things is what goes into the mix of what we call the process of economic development, of sighting companies, or helping them expand. In all cases, transportation has been one of the top four or five major factors. Recently, it has become one of the very top. In the past, transportation has been assumed as being available in most locations. Now it has become absolutely critical. The reason for this is getting finished products to market and has become a critical element in all-manufacturing processes. Cost reduction and the logistics of getting materials in and out of sites are high on the list of operational improvements. Drivers behind this new focus are the new emerging global markets. In the past, we usually only dealt with international trade with some of the larger manufacturers when they looked at sighting in our area. Now very small, 10- to 15-employee firms, are doing an international trade. They are looking at getting their products out to the world. An efficient transportation system is absolutely critical for their growth. Just-in-time supply systems, overnight delivery of products, and flexible manufacturing are all driving the need for an efficient transportation infrastructure. Site consultants are doing about 50 percent of the sightings and there are a plethora of site consultants from accounting firms to real estate people. All large companies, or their consultants, who look at doing a site location process are doing transportation studies. Even some of the smaller ones that are just manufacturing and distributing regionally in the Northwest are doing transportation studies. Most recently, a machine parts’ manufacturer with about 60 people was looking at locating, and did locate, in our area. They did a transportation study and found out that we could not distribute to the East Coast very efficiently. It was very time consuming. So they almost eliminated us from their sites, until they decided to actually put a manufacturing facility on the East Coast. Then they could look at our area even though we didn't have a very good transportation network back to the East Coast. According to a recent study, transportation is second only to labor availability and cost when selecting the right site for new and expanding facilities. A key transportation service factor that they emphasized was highway access. Highway access is also a means for eliminating a lot of different areas. They stated that sites need to be within six miles or less of a major four-lane highway, but there are tradeoffs for trading
143

congestion in metro areas for poor two-lane access roads that have direct access to freeways and don't go through a bunch of little towns. With airport access, the limit is 60 minutes to a commercial airport and sightings outside that zone usually involve smaller low cost manufacturers, or distribution with limited executive and vendor travel. Railroad service is increasingly important due to the short-haul rates that railroads are offering. Inland waterways are mostly for boat commodities with lower costs. Washington is blessed with an excellent Columbia and Snake River system. Intermodal is probably the new hot button for faster freight in reaching global markets. A number of companies that have recently located in our area have touted the excellent intermodal facilities in the Spokane area. They wouldn't even have considered the Northwest if it hadn't been for those. Our experience working with companies and site consultants tell us that communities that plan for industrial development have a better chance of sighting some of the 700 to 1,000 major sightings that occur in the United States every year. A major sighting is usually 50 to 75 employees or more. Oftentimes transportation planners think only of the vehicles per day, and the growth that subsequent demand on the transportation system produces, as opposed to the consideration of what drives population growth and that is the creation of new jobs. I wouldn't advocate that we should take a "build it and they will come" strategy. I believe that with a little public investment in strategic areas to prepare for the right type of targeted industry development, we will produce private investment that will increase our tax base. And since we, in this state, choose not to offer tax-increment finance as some of the neighboring states have, we are going to have to be very strategic in public investment in our transportation infrastructure in order to compete with those areas that can build the transportation infrastructure based upon the growth of locating industry. Planners need to sit alongside industry and developers, and not across the table from them, rubbing their hands together and saying, "Oh boy, here it comes; here's more money for us to build more highways." Finally, we've not been very good at informing the public on the state's transportation needs. It seems that things either have to come to a standstill, as in the Puget Sound area, or we have to kill or maim an inordinate amount of people before we take action to correct some of the problems. Our officers and our company take economic development as a corporate responsibility to our community as well as a means of growth in our revenues in electricity and gas. They also said it's all second nature if we destroy the quality of life in our area by outgrowing our infrastructure to provide for the industry that we recruit. So they tasked us with being advocates in taking care of the infrastructure in our areas. They recognized that we didn't have good quality, affordable housing. They put us all on point to advocate for affordable housing and we invested some money in our area. I'm not saying that it's going to be a precedent that we will invest in highways but we'll do whatever we can. Private industry will invest in public infrastructure where it's needed, but it has to be cost effective.
144

Question and Answer Q: Bob Reynolds, Port of Whitman County. Just a clarification: when you do business recruiting, is labor availability the number one question or problem that you deal with? A: Joe Tortorelli. Yes, most studies in the last three or four years said labor availability and cost has become the number one issue, especially in our state with a record low unemployment rate. It is really difficult to get labor. We're seeing that all across the United States. We have always been an advocate for eastern Washington; our unemployment figures don't really reflect labor availability. A number of our manufacturers have come into the tight labor market and found excellent, trainable labor available. We just have to get that message across. Q: Don Phillips, a wheat farmer from Lincoln County and directly involved with EWITS. I'm surprised to hear that EWITS and ISTEA are going back behind the scenes. I'm very concerned about the impact for eastern Washington. We need to be represented well from eastern Washington. We need to have thought and direction because we feed Seattle. And Seattle seems to have most of the votes that it takes to regulate things that happen in eastern Washington. Transportation is very important to all commodities that are grown in eastern Washington. I'm involved in a project called Northwest Straw Board. We are trying to make a board out of straw and move it to the western part of the state for construction purposes. We've found that to be a transportation nightmare because we have to move the straw from the fields to the plant and from the plant to western Washington. We see the future as being a need to have that type of infrastructure that it takes to get our commodities over. I also see that the need for the wheat industry as looking at identified types of wheat varieties and moving grain in identified parcels of containerized cargo. We are looking at the future. I guess I'd like to ask Jim Kuntz or Bob Mathison for their comments on what we could do, besides work with the Legislative Transportation Committee and the legislators, to get our impact across. We've worked in the wheat industry quite a bit to try to work with the legislators in a lot of different areas. We seem to be gaining some ground, but we're also losing quite a bit. A: Jim Kuntz. We do a fairly good job of talking amongst ourselves in eastern Washington, but we need to start getting our message across to western Washington. I'm not sure exactly how you do that. Demographics are certainly working against us. It's interesting that we always talk about intermodalism, and how eastern Washington is so important to western Washington, but I hear very few people from western Washington stand up and talk about transportation problems in eastern Washington. They seem to really focus on a lot of issues that they have. You can't fund transportation just on per capita, but you can at least see where the resources are. The list that I've seen for eastern Washington doesn't seem to have a proportionate amount of investment being made. We need to be in western Washington delivering the message.
145

A: Bob Mathison. We need to get something together locally to have our voice heard, because we are being drowned out by these "Save the River Front" people. Everybody is kind of apathetic, "We'll let the other guy handle it." Nobody's really stepping forward saying, "Hey, for the good of all the people, we need a new highway." A: Jim Kuntz. Even though the demographics are working against us, I would make a strong agreement that we can still control our own destiny. We do a lot of things here for eastern Washington, for the population that we serve, by not paying sales tax; by having some reasonable prevailing wage; and by having a local gas tax option. There are a lot of things we can do to fund things ourselves that we don't necessarily need western Washington for. Although I think communications are real important. I think there's a whole bunch we can do here if we were just given the flexibility. Q: Charlie Howard, Washington State Department of Transportation. I want to follow up on something that Joe Tortorelli said, which is that we need to engage the public. I want to ask the panel members: “How do you educate the general public on the interests that we have in transportation? How do we engage them in the solutions and support for those solutions?” A: Joe Tortorelli. Spokane County tried to pass an additional sales tax on our gas tax in order to fund additional transportation. It was turned down. I think that we ought to turn over the education of the public on the transportation issues to qualified promotional people. We utilize public relations firms that try to get our message out and are a lot more effective getting out the transportation message. I think we need to spend a little money up front in order to educate the public. I wish I had a better answer for you. The public does not understand the issue unless they see an accident on the highway or see news accounts of things that went bad. We should be more positive about things that we are doing right in the transportation system. A: Bob Mathison. You only hear when the roads are bad; you hear them complain. When the roads are good, they think about their taxes and how high their taxes are. There is an ongoing need to keep people thinking about it. A: Jerry Lenzi. That is a difficult question, and I think the comment here is absolutely right. When there is a problem: a road is weight restricted, it's fouled up with snow or ice, or just falling-apart rutted, we hear about it promptly. When it's okay and passable, it is fine. I don't know if it's apathy or if you only go after things that concern you at the time. I think the system has been taken for granted. I know our Transportation Commission has grappled with this in terms of public outreach, public participation, and a whole host of issues. They have engaged consultants. Most of us in the transportation arena have been to more public meetings, talk shows, or editorial boards than you can shake a stick at, but for some reason that does not seem to get to the local individual on the street. We need more financial resources. And how to convince the public on that? We're going to give it another shot. There are a lot of issues on the ballot this fall and it will be interesting to see how the public responds. But in terms of getting it out to a person, it has to be personalized. The best methods, I've found, are in our RTPO and MPO meetings, when we sit down and talk with people in their jurisdiction. We personalize it to their issues, their concerns, and their needs. It helps. It is not the solution, but it helps.
146

A: Jim Kuntz. As it relates to getting people involved in transportation and helping make decisions, Jerry is right about all these new taxes and I've been advocating a local option. But in transportation, we never are willing to tackle the tough issues. I think the public would be willing to listen if we say, “Here are some options to save money and have more resources put into transportation.” But no one has the political courage to say: "Are you willing to look at prevailing wages; are you willing to look at not paying sales tax for public agencies?" Those are two very valid issues that the public would probably listen to and say: "Hmm, I could save some money here, and put more money in transportation." I think the public would look at and listen to those. Maybe we should put them up to a vote and see what they think about those two issues. That's something the public would listen to, but no one is willing to talk to us about that. That's off the table. And I think that's unfortunate. Comment: John Manten, Tri-County RTPO. Let me just point out one avenue that the organization we call the Eastern Washington RTPO Forum is involved in. In November last, we had a summit meeting to address transportation issues before the now past legislative session began. It was held in this auditorium; we had a turn out of about 220 people. Yesterday, we began serious planning for another summit meeting on October 1 in Yakima. The Yakima RTPO-MPO has arranged for extensive television coverage. Now this may be another "ho-hum event," and people turn off their television. We think not. It's going to be held in a very timely manner within four weeks or so of the upcoming balloting on vital transportation issues. We think we're getting at least some impact. The reason I'm bringing this to your attention is that through your RTPOs and MPOs in eastern Washington, you can help us in this effort. The Spokane MPOs have done a lot toward organizing it. We need a lot of organizing and backing still for it to be accomplished. If you are interested, if anyone is interested in giving us a hand in what we consider to be a pretty effective effort, we would appreciate you contacting your local RTPOs or MPOs. Incidentally, this organization I'm speaking of, the Eastern Washington RTPO Forum, meets monthly here in Moses Lake. We would welcome any and all of you, particularly those of you who are elected officials. Q: Pam Ray, Walla Walla County Commissioner. As a local elected official, charged with the public health and safety of our citizens, I would like to hear more on the safety aspects of those highways should those dams be breached and the impact on our highways if we don't get some four laning, especially in Walla Walla. The other element is recreation. We talk about the quality of life we have. These are areas that need to be addressed. I'd like to know your thoughts on those issues. A: Joe Tortorelli. We have been real advocates of four lanes on 395 North. It isn't just because of economic growth; primarily our interest is in the safety aspect. We are instrumental in helping to establish the safety corridor in that area. North of Spokane is where the economic growth is going to be. I think the safety issue is probably one area where we can get the public most involved and keep awareness high. We still believe that the safety issue is the primary issue, but there is an economic advantage to advocate for four lanes. As I told you, when we entertain industries that are looking at locating in our area, they want a four-lane highway and it has to be within visual sight of where they are going to locate. That criteria is a fatal flaw for deciding on eliminating potential communities. We're not going to have economic growth if we don't have four lane or access close to a four lane.
147

Q: Randy Bostrum, Port of Whitman County. Bob Mathison had mentioned that if you take the dams out, you have about 330,000 truckloads of apples per year. About 700,000 truckloads of wheat would have to move to Portland. So your safety and impacts would be of that magnitude. You would double the apple industry’s use of the highway system if you took the dams out of the Snake River. Those are the safety issues communities would have to deal with. A: Jim Kuntz. I'm not sure we should be looking for the state to solve all of our problems. If we had a local gas tax, we could say: "Residents of Walla Walla, are you willing to spend an extra couple cents at the gas pump to put into a pot of funds so we can eventually start four laning on Highway 12?" And that at least becomes part of the solution. It really hits home in Walla Walla County when we have friends that have passed away, but it's not hitting home in the state legislature. In the 20-year plan for the state, we are on the very bottom. It's not going to happen in our lifetime unless we take control locally, and that's why we need local options. Q: Thomas Noyes, WSDOT Northwest Region in Seattle. I have a question for Jim Kuntz. With the drawdown study coming, you had some good ideas and comments on the state needing to be more proactive in working with the railroads on strategies and things like that. I wonder if you could comment on that, and things such as the grain car program. Do you see that possibly expanding? I realize that's been a little controversial. Also, realizing there are two major railroads left in the state, and their focus is more on nationwide hauls, and I think they're looking at more and more spinning off regional spurs. What kind of strategies do you suggest and how can we move forward with that? A: Jim Kuntz. I appreciate your question. A couple years ago, when Burlington Northern and Sante Fe wanted to merge, Burlington Northern obviously needed federal approval as it is regulated. The Port of Seattle went to the BN and they said: "We have certain issues in our port district related to rail, and we're really not all that fond of your merging to begin with, but if you can work with us on these issues, we think we can support the merger." I thought that was a heck of a good strategy and I think we need to use that statewide. The UP and the BN on occasion need the state legislature, whether it's regulatory reform, another merger, or state investment on a high-speed corridor. When they knock on the door, we need to have a strategy that says: "Fine. If these are the things you need, these are the things that we want you to do for the state of Washington." I think we need to be more strategically aligned and talk about them giving up some of their exclusive rail line, and work on them donating some of their light rail. I think we can get them to do some give and take to get the type of things they need. As it relates to the railcar shortage, I'm not optimistic at all that if the dams are taken out and we need more railcars that we're going to have them. The BN and the UP make their money on long hauls. They have no interest in these short hauls. The State Grain Car Program has been excellent. When UP and BN have not been able to provide cars, the state cars go locally. We fill them up and we let our small regional carriers take
148

them to Portland. We own the cars and the cars actually make money. There is actually $400,000 in the Port of Walla Walla State Grain Car account that has been pure profit since the state bought the cars. It has been a tremendous success. The port district believes we should take that money and buy more cars. We would have a whole fleet that can be used throughout eastern Washington, not just the Palouse and Walla Walla, but throughout eastern Washington. If you need a grain car, we should be able to provide it in the event BN and UP do not want to provide or do not have the cars. I think it's a wonderful program. We need to continue and expand it. It is a really good resource for short-line operators. The state is doing well as it relates to abandonment, we're trying to get on top of those. My concern is that Blue Mountain Rail is not generating enough revenue to maintain the lines, so we have a maintenance issue. Somehow we need to find some source of money to maintain the light rail systems that we have been able to save. That's going to be a big issue in eastern Washington: “How can we maintain those?” Hopefully, we can be a little smarter with UP and BN. I can promise you in the next five years they will want something from the state legislature--regulatory relief, helping with a merger, or an investment in a fast corridor. We need to get out on the table our list of the things that they need to give up and help us with.
Transportation and Trade Ken Casavant. As you look at the program, it says "research plus planning plus political support equals success." We've heard about research, we've heard about planning, and we're going to hear more about implementation and needs, but I'd like to point out the political support section of that equation, and thank the legislators that have attended here today. I'd also like the opportunity to thank, both for EWITS and for the state of Washington, the Legislative Transportation Committee Staff: Vicky, Jeff, Mary, Brad, and particularly, the newest member of the group, Ashley Probart. Ashley was with WSDOT, was an active part of the EWITS Advisory Committee, and the shape and style of the summary report comes about because of an e-mail Ashley wrote to us. I have the pleasure to introduce Bob Hannus, of the Port of Seattle. Bob got his B.A. with Honors at Washington State University, then a master’s in economics at Washington State University. Bob then worked for Boeing, followed by time with Flying Tiger Lines, working in marketing, sales, and planning. He is now with the Port of Seattle and has been there since 1975, working in market research, market planning, and forecasting. He is trying to show, and support, that connectivity between eastern and western Washington. He has accepted an appointment as a lecturer at the University of Washington.
149

Bob Hannus (moderator), Senior Market Research Analyst, Port of Seattle. I wanted to say something on behalf of the Port of Seattle, in particular, and that is that our interests are very much in line with the interests of eastern Washington exporters and people involved in growing and distributing products. We realize the importance of those cargos; we estimate that about 50,000 to 75,000 containers full of cargo come from eastern Washington through our port each year. They are very important to our long-term success. I can also add that we are the only port in the Northwest that has an eastern Washington representative, Howard Granger. I'm going to be the moderator, but I'm going to do a little more than that. I'm going to give a five-minute introduction to trade growth. I want to talk about the future growth of international trade, particularly waterborne trade. I'm primarily going to be quoting from some recent work by Warton Econometric Forecasting Consultants, who have updated their forecast to reflect the Asian issues that have come up recently. Their bottom line view is that after a two- to four-year hiatus, Asia will be back in force in terms of economic growth and things will straighten out. Now that doesn't solve a lot of problems, such as devaluation of currencies. Their long-term view is that conditions for economic growth are there in Asian economies and they will be back, albeit it will take some time. The long-term prospects are quite good. In a previous forecast done in 1995 for the Washington Public Ports Association and, incidentally, co-sponsored by the Washington State Department of Transportation, the results were that container trade growth would average 4 percent per year for the next 20 years. That implies more than a doubling of the container trade in the next 20 years. Furthermore, that growth rate is about double the growth rate of most world economies. We're looking at an entity, which, while right now in a hiatus, is projected to grow strongly in the future. In fact, Warton is saying that around the year 2000, GDP growth in Asia will probably average about 6 percent per year. In Asia right now, overall economic growth is flat; it will likely grow some in 1999, and then resume a strong long-term growth rate. They are looking at GNP of Europe and the USA averaging about 2.5 percent per year after the turn of the century for a number of years. They are very bullish about Central and South America. They are saying that those economies will grow at a rate of about 5 percent per year beyond the year 2000. We're seeing that ourselves in Central and South America in the volume of container trade, which is growing very rapidly at present. I just wanted to set the stage for what is going to happen to international waterborne trade. Now let me begin by introducing our speakers. Our first speaker is Roger Dormaier. Roger is a family wheat farmer from Hartline. He is the co-chair for transportation of the Washington Association of Wheat Growers. He is also a graduate of Washington State University in Agricultural Economics, and a graduate of Washington Agriculture Forestry Education Foundation.
150

Roger Dormaier, Transportation Co-Chair, Washington Association of Wheat Growers. I represent the wheat industry and, specifically, the Washington Association of Wheat Growers. Wheat contributes approximately $1.2 billion toward the state’s economy. For every bushel of wheat that we put into the state’s economy, the benefits to business activities in the state are about $8.83. Washington is fortunate, or unfortunate with the Asian problems, to export 85 to 90 percent of the wheat that is grown here. Many of our prime customers are in the affected economies, so the wheat industry is suffering from lower prices. We need more money for our wheat to make a reasonable return. Last year’s production was 168.1 million bushels and we grew it on 2.65 million acres. As farmers, we spent an estimated $70 million to move the crop to points of export for use. One hundred percent of our crop moves by truck at some time in the post-harvest period. You probably all know how our harvest works, but in the late summer we harvest our grain. Fields that are green now with grain will turn golden and we'll harvest it, and it will either go to home storage on the farm, to a miniature elevator, or possibly to the elevators on the river system. Sixty-two percent of the wheat in the state moves through the truck-barge system. Then 35 percent of our grain tends to move to market by truck to a close elevator, and then is sent to market by rail. That is approximately 104 bushels by truck-barge and 58.8 million bushels by rail. Transportation is like a three-legged stool. Our legs are rail, truck, and barge. When everything is in balance, and we have a good demand for our crops, then things move pretty smoothly. But all the legs are necessary for the equilibrium we have now. When we get a disruption in the system, it usually leads to lost marketing opportunities for our growers. Because most of Washington's wheat is stored at interior elevators, either locally or on-farm, the roads are very important to us throughout the year. We need adequate, well maintained, all weather roads so that we can move the product whether by rail, barge, or all the way to export in southwestern Washington or Portland. Freight mobility studies have dealt with the roads issue at the state level. Farmers and counties have some problems that don't necessarily meet the criteria looked at in the freight mobility studies, and they create things for which we need funding or solutions to update our roads at the local and county levels. Once you get off of the interstate or even off of the state highways, you'll still run into a lot of paved roads that do not have a proper base under them for the loads we put across them and are not wide enough. It is very important that the counties have funds to look after these problems so we can keep our local economies going in the rural areas. Since the 1970's, 2,000 miles of rail lines have been abandoned. Many of those were used to haul wheat. The industry has adapted. We have several branch lines, being used by short line railroads. Many of these short branch lines have maintenance problems. The maintenance on the lines, while adequate for short-term operations, is on such a tight margin that it is often hard to think in terms of long-term maintenance and upgrades. So, we are looking for solutions. Last year, we had a little bit of money the legislature gave the WSDOT to use to help with rural rail. WSDOT made a loan to the Palouse River-Coulee City Railroad to help replace ties at the end of the rails on
151

each of the tracks. The elevators that were using those tracks also were able to contribute a loan to the line, so that they could get that track moved up to a higher rate of speed. It points to the fact that there is a lot of maintenance that needs to be done if we are to keep them viable, because the money that was loaned was used primarily to stabilize the end of the rails. One has to look at what the returns will be on those short line rails. I know it is a constant juggling act for the state to think about what would happen if we did lose those rails. In the legislature they worry about helping to replace and rebuild those lines, since it's a private industry and not publicly owned. It was alluded to this morning that with some branch lines, we could convince the rail carriers to contribute them to the state for a tax credit. Then perhaps the state could let a public entity operate them, or lease them out. Maybe that would get around some of those problems. We have to take a look at what it's going to cost if we end up abandoning more branch lines that are being used and ultimately make a decision. Are we willing to help? Is it worth it to keep them running, or are we going to turn it out on the roads and take the increased usage of the roads? From a philosophical point, I think that transportation is one thing that governments definitely have to look at, because it affects so many people. Sometimes indirectly, but it affects everyone. Without a good infrastructure, I think this country would not be where it is today. Another problem the branch lines face is the shortage of railcars. We have had a continued shortage at harvest. Part of the problem is that railroads make most of their money on long-distance carried crops or long-distance used cars. The short turn around the state of Washington is not conducive to a great rate of return for UP or BN. It should also be noted that if we lose the rails we have, it affects the economy of the communities through which they run. My line not only hauls wheat, it also hauls John Deere farm machinery and, in some cases, fertilizer. The last leg of my stool is the river barge system. Today it is in fair condition, but salmon and drawdown issues remain a big question. As you heard this morning, 1999 is not too far away. Bob Hannus, moderator: Our next speaker is Don Barcham. Don is Manager of Planning and Programming for the British Columbia Ministry of Transportation and Highways for the Kootenays region. Don is a graduate of the University of British Columbia with bachelor’s and master’s degrees. His area of expertise has been land use planning. Today he is going to talk to us about a very interesting subject: a highway system study at three border crossings between eastern Washington and eastern British Columbia. Don Barcham, Planning and Program Manager, Ministry of Transportation and Highways, Kootenays Region, British Columbia. The province of British Columbia is divided into six highway regions, most of which are about the size of the state of Washington. Within those regions, there are 27 highways districts. I represent region three, which is a very small portion of the province in the
152
southeast corner. The area that I represent goes from the American border up to the Mica Dam. It takes in virtually all the Columbia River drainage and all the Kootenay River drainage in British Columbia. From the border to Mica is probably 200 miles; and from the Okanogan Valley watershed over to the province of Alberta border is another 200 miles at the south end. Basically, we began by looking at the area centered on the Castlegar-Trail area. In this particular area, we have a border crossing on Highway 395, we have the Patterson crossing on Highway 25, Waneta on County Road 251, and then on your Highway 31 we have our Nelway crossing. The Rossland-Trail area is basically the industrial heart of the Kootenays. The main industries are the Cominco Smelter, the largest smelter in the world; a major pulp mill in Castlegar; a major saw mill in Castlegar; and many supporting industries. The population in the area is somewhere around 60,000. We discovered that we have a microeconomy here. We realize that because of the pulp mill, the sawmill, and the smelter in this area, and what was happening down at Colville with Washington Water Power, we were seeing a little microeconomy with a border running through it. It didn't seem too important that a border runs through it; the system happens anyway. The people that live in this area, on both sides of the border, are really dependent on this little economy. It's based primarily on forest fiber, wood chips that go north, hog fuel, which goes south, minerals, and chemicals. The border crossings have not been open 24 hours a day. Recently we did open the Patterson crossing to northbound traffic 24 hours a day. We are really concerned that this little economy keeps going. We have an unemployment rate of 14 percent in the Kootenays. The values of imports and exports in British Columbia and the Kootenay region by 1996 indicates that provincial totals are really quite substantial. The regional totals don't look like much. About $1.2 billion, but that's huge for us. The export total is 100 percent more than the import total. It is $2.5 billion roughly through our region; most of it by road, and some of it by rail. In the region I have described, we have 13 border crossings. Only one, at Kings Gate, is a 24-hour full service crossing. So between Osoyoos and Kings Gate, which goes down into Idaho, we have no 24-hour commercial permitting ports with full inspection and other facilities. We're looking primarily at Patterson, which is the main one, Nelway over at Highway 6, and Waneta on a county road, which doesn't have a lot of business. We would like to see this export/import business come over to Waneta. In the area we studied, we have severe sustained grades. Coming up over the Patterson border crossing to Rossland is about 11 miles of 6-8 percent grade. In order to get anywhere, you have to go 11 miles down again back to the level of the Columbia River, through three municipalities to Trail, to Highway 22, and on to Highway 3 if you want to go east. The costs of that are enormous. The Kootenay Boundary System Study looked at that and said that we could save about a million dollars a year just in trucking costs alone if we focused on the border crossing at Waneta. We have an
153

immense safety problem. We have tried weigh and motion systems to warn the truckers, but they don't work in the winter on 8 percent grades. We have basically the same problems that you have. We would love to get this traffic off the highways and onto rail, but we have very limited options because the rail systems have largely been abandoned. The Southern Transprovincial-Kettle Valley Route of the CPR was abandoned from Castlegar right through to the coast over the past ten years. CPR has abandoned other lines in our region and if we don't maintain rail traffic on those remaining lines through more freight, we stand a very good chance of losing those as well. Although the jurisdictions are different, countries are different, and political processes are different, it's apparent that the issues and problems are virtually identical. As a result of the Kootenay Boundary System Study, which began somewhat with our participation in your Highway 395 corridor study, we have been able to come up with a strategic document that gives us a direction for the future in terms of highway improvements. And this particular document, we call it a strategic plan, deals with everything from operational activities to maintenance and rehabilitation, to new projects, and to helping to promote other government initiatives and policies such as economic development and job creation. Burlington Northern accesses our region at several points. We have a reload center at Salmo on Burlington Northern; the line is abandoned from there to Nelson. We have a reload center just above Waneta; we have reload centers at Cascade and Lauriea, all Burlington Northern. Reload centers are fine from our perspective. We'd like to maintain the two railroads. They get traffic off of the highway on a regional basis and a provincial basis, but they tend to increase traffic locally because someone has a few more trucks running on the local roads to reach the center. They get traffic off for the long run and they help to sustain the rail development. We are going to be undertaking studies of the highway system from Castlegar to Trail, and from Trail to Waneta, in support of the recommendation that Waneta be the main 24-hour border crossing in the future. In the past, I know that the Joint Border Facilities Committee did have Waneta on its agenda as a priority for joint facility. I'm not sure it's still the same. We have a good working relationship with Washington State Department of Transportation, largely due to Jerry Lenzi's encouragement and participation. The availability of the information from the EWITS study was a great help to us in our little Kootenay Boundary Study, which was much more localized. We do not have the same working relationship with Idaho and Montana, unfortunately, but we are working on that. The little microeconomy that I spoke of is going to continue. We just heard that the outlook for international trade is healthy. NAFTA has certainly increased the truck traffic north on almost all routes into Canada. These microeconomies are going to continue, despite what we do, and we had better prepare for them. They don't seem to mind that they have a border running through them, they're just like another river.
154

You mentioned public participation. I'd like to close on an encouraging note. I've done a lot of public participation over many years, in many different forums, and I see the EWITS study as a great example of, not only public participation, but also regional thinking. We've identified many local issues, but there seems to be a regional perspective in trying to address those issues and you can't ask for anything better than that. It's an educational process and no doubt it takes long, but I really hope it doesn't stop. Ken, if you can take EWITS and delete the word "study" and put in the word "synergy," so we have Eastern Washington Intermodal Transportation Synergy, it can go on forever. It obviously is a synergistic process you have going. Lots of good discussion, lots of good debate, lots of energy being created in many forums. I hope you manage to keep it up and I hope you can keep us involved in it. Bob Hannus, moderator. Our next speaker is a friend and colleague of mine at the Port of Seattle, Craig Hatamaki. Craig is a graduate of the University of Wisconsin. Craig had a long career with American President Lines. He's been with the Port of Seattle for eight years and most recently was appointed the Director of Intermodal. He's going to speak to you about that subject as it involves some of your own needs. Craig Hatamaki, Intermodal Manager, Port of Seattle. I would like to talk to you about the intermodal area at the Port of Seattle. As Bob has said, I deal with the intermodal activities. I have been doing transportation for 25 years. I have been with two major steamship lines, both domestically and internationally. I've worked in the stevedore industry. I've worked in the truck industry; I've owned a trucking company. I've been in the aviation side, both airport manager and air traffic controller, so I have some background in transportation, most of it in the operating and marketing area. Transportation planners across our state, even the country, are looking at a tab that will run into the billions of dollars to rebuild the state's, and the nation's, aging intermodal infrastructure. They're scared because they don't know where the money is going to come from for all these projects. The projects that are needed include deeper harbors; bigger cranes; larger marine terminals; more on-dock, near-dock, rail transfer yards; hundreds of grade separations throughout the country within congested urban areas; and better rail and highway access in and out of ports. It is becoming a nationwide dilemma. In our state, I understand that our population growth is looking to increase by 25 percent over the next 25 years. We see new companies continuing to open their doors. Road and rail traffic are both on the rise. U.S. container cargo is projected to more than double in the next 12 years. I'm told the prediction is they're going to increase sevenfold over the next 50 years. The Ports of Seattle and Tacoma are expected to nearly double their international container trade by the year 2015. I assure you that this type of growth will severely stress the nation's ports, rail, and highway infrastructure systems, a network that many
155

believe today is already operating at near capacity. I'd like to get into the questions and answers as soon as we can, to areas that you have a real interest in, and see if we can't work out some types of solutions rather than just continue to identify problems. I'd like to touch upon a few critical points that I have not heard today and, hopefully, these are points that threaten our state's economy and will be fuel for discussion later. Our Washington State planners have a good idea what projects are needed to accommodate the growth volume that we see projected here in this state. But it's going to take a grass roots effort, and understanding by the citizens of this state, to help our legislators secure partnerships and financial leveraging to accomplish these critical infrastructure projects. While it's true that in the area of the ports, water depth is a significant problem for us in gateways that are looking to become mega-ports of the future to handle these large vessels that we see arriving in our ports in ever increasing volumes, it is really the landside access, which is becoming a critical issue for us. It's a challenge for most U.S. ports today since the traffic congestion on our major truck routes and numerous ungraded rail crossings are creating confrontations, safety and efficiency problems, and are areas affecting our ports’ efficient operations. Most of the international goods arriving in our ports are sent to other parts of the country, inland to warehousing and distribution centers. If we keep these goods moving quickly once they arrive in our ports, we'll be able to hang on to this lucrative international trade business. Our own exporters here, especially in eastern Washington, benefit greatly from the cross-state movement of goods. When the empty containers come back through Washington to return to Asia, our farmers and other exporters fill these containers with their own products and sell them abroad. In fact, as you heard earlier, 65 percent of the container exports currently headed for the Pacific Rim, come from ports out of Washington State, carrying Washington State goods. If these empty containers were not returning to Asia via Washington State, shipping overseas would become so expensive that most of our exporters would not be able to compete. Today one in four jobs across our state depends on international trade. I doubt that anyone would want to see any of these jobs lost or our quality of life diminished as a result of international trade and business being frustrated with congestion problems and moving their business to other West Coast states or ports. That's why I think efforts like today's Forum, where we can bring transportation folks together to talk about problems, issues, and ideas to resolve these problems, are constructive and will help us to solve and meet our critical challenges. I would like to get into the question and answer area, so that we can discuss areas that are important to you whether they are what is going on with the steamship line industry: their alliances and expansions. What's going on with the rail investments in the state of Washington. What's going on in the trucking industry on the western side regarding the port areas. Both the Port of Seattle and the Port of Tacoma have formed a Joint Intermodal Infrastructure Committee and, along with commissioners and executives from both ports, are trying to work out the intermodal difficulties that are facing all of us in this state. For our gates to the ports are really over in eastern Washington.
156

Question and Answer Q: Would somebody explain again how the purchasing of grain cars works for local shippers during the wheat harvest? The purchase of railcars to ship wheat that way, other than shipping out large carriers? A: Glen Squires, Washington Wheat Commission. We have a system where we have a certain number of cars that are tariff cars that are available to the public, so to speak, and they have a pool of cars that elevator operators basically buy in advance so that they are guaranteed to have cars available when harvest comes. They pay a premium in order to have those cars. It costs more to make sure the elevator will have railcars available for shipment. If the time comes when the railroads aren't able to supply that car on time, it costs the railroad an amount to the shipper for not supplying the car. If the car doesn't show up, then the elevators put the grain on trucks and send it to the river. The grain will move one way or the other. If the cars aren't around, it still moves, it just goes by truck. Q continuation: What about the other alternative? The tariff cars? A: Glen Squires. As I understand the tariff cars, the railroads have tried to even out the number of cars that an elevator operator can obtain. Instead of just supplying the cars at harvest when they need to move the grain, they'll tell the shipper or the elevator they can have, for example, one car per month instead of twelve cars in two months. They try to balance tariff cars out. Inaudible question from floor. A: Glen Squires. The question is whether that system could account for increased rail needs for the grain if there is no river. I understand the railroads are having a hard time supplying the cars now, when we have a river. If we don't have the river, they will have a harder time. Q: Rebecca Francik, Pasco City Council. Mr. Ben Bennett from the Port of Benton has been proposing a regional transportation program for the year 2050. It's a very comprehensive plan, which basically involves taking railcars from Seattle and bringing them across the state to hook up in the Pasco area and then going on east. This plan has a lot of appeal; it could create a lot of jobs. But it also has some very serious problems in that it's going to require the building of a bridge and the building of a rail line that has already been removed. Are you, as ports in Seattle and Tacoma, willing to help finance such a program recognizing that it does move your product off of your docks in a more timely manner? A: Craig Hatamaki. The Ports of Seattle and Tacoma are working together on a number of intermodal projects. We have publicly stated that we will continue to participate in efforts that will involve a number of intermodal infrastructure projects. Today we have committed $360 million worth of corridor projects within the western part
157

of the state. I'm sure that as projects are identified on a statewide basis, the ports will be involved again. To what extent would be up to our commissioners. We, along with the railroads, have committed to be partners and participants in addressing infrastructure improvements throughout the state of Washington. Those efforts, to date, have obviously centered in western Washington, are the ones that we have conducted our study for, the ones that we have gone to the railroads and asked for their participation on the first portion. We have commitments from the BN-Sante Fe. We have met with the Union Pacific and we have requested them as partners. It is my understanding that the railroads have said that as they partnered in the west, they would be willing to partner in the east given the same type of bringing together of partners and communities to address what the priorities are and how they benefit each of the partners. Q: David Spivey, Asphalt Paving Association of Washington. Craig, you were saying that there is an infrastructure crisis occurring all over the States. My understanding is that on the West Coast here in the Northwest, we have a 24-hour advantage to Southeast Asia over ports in Los Angeles. Is that correct? A: Craig Hatamaki. I think you are referring to what was in the past, a 24-hour advantage to the Pacific Basin. Southeast Asia doesn't necessarily have the same type of advantage since it's a farther distance. However, that advantage has been dwindling all along due to faster vessels and the realignment of deployments. Taken into consideration, vessel to vessel, we suggest that there is a 24-hour advantage. The next choke point in the logistics chain is that connection from the port terminal to the railhead. That is the one that Los Angeles is addressing with their Alameda corridor. Q Two: David Spivey. I was down in California quite recently and it looks as if they seemed to have secured adequate funding. Can you tell me what the people in California are doing that the people in Washington are not doing? A: Craig Hatamaki. You need to understand what the people in California are doing, and what the Alameda corridor is in essence. In Washington we are blessed with deep water and the fact that our railheads are very close. They are within minutes of our port terminals. In Los Angeles and Long Beach, the rail hub was about 27 miles away. So they had to move everything from the Los Angeles-Long Beach area to the rail head 27 miles away and continue to deal with the frustrations of vehicular traffic, road crossings, and rail delays. They have proceeded to make that connection that we in Washington State already had. A very short connection, a dedicated lane so to speak, from the terminal port area to the rail hub. Where we are ahead of Los Angeles is that our fast corridor projects that our ports are dealing with in western Washington, is the area where the main lines pass through the communities as they head out across the county going to inland destinations, to the populous areas and where those grade crossings create confrontations with vehicles, because they are at grade, they're not grade separated.
158

The second project that California is getting into is their Corridor Two Project or their East Los Angeles Project. Communities east of Los Angeles are going to face the same thing we do in Washington where the main lines pass through communities at grade. We are two years ahead of them in working on that project. However, they have a lot experience in working with building financial support and leveraging money, and we seem to have more difficulty here in Washington. They are a little behind us in dealing with communities and addressing the problems of rail and road conflicts in that corridor for moving on the main line, and we're ahead of them in that corridor and trying to get the connections from the main line to the port taken care of. A: Bob Hannus. Your question related to the funding of those projects. The state of California has used three sources to fund those projects: the federal government; state transportation bonds, which are funded as a total then allocated to municipalities, including the municipalities in the port regions, and the third source is the Ports of Los Angeles and Long Beach which, for what it's worth, are reasonably profitable as moneymaking entities. Q: Charles Kilbury, Mayor of Pasco. We get most of your traffic from the ports, and I would like to have you speculate on what we can expect regarding Long Beach-Los Angeles, which is a prime port on the West Coast now, and Seattle-Tacoma, which is a second place port. Is Seattle-Tacoma going to overcome the lead that Long Beach-Los Angeles has now? Is the traffic going to increase into Seattle-Tacoma greater than Los Angeles-Long Beach ports? A: Bob Hannus. I believe your first question was, will we ever overtake Los Angeles and Long Beach as container ports? The answer to that question is probably not, because right now about 65 percent of the container trade of the West Coast moves through Long Beach and Los Angeles. It is a huge market. Our recent growth over the last ten years has essentially matched the growth of Los Angeles and Long Beach. Recently, there has been an increased threat of those ports and the market share situation has been strongly contested. Last year our market share was down and this year it is modestly up. Does that answer your question? A: Craig Hatamaki. The facilities that Los Angeles and Long Beach have built over the last 30 years have been supported by commitments from those lines that are building those facilities for 30-year agreements and longer. Those agreements call for them to put certain minimum volumes through to support those facilities that are being built. Taking volume out of there and pushing them to some other gateway is probably not too feasible. Second of all, every transportation mode wants to run balanced. They have the ability to get equipment back because they have a large population, which gives them an opportunity to not only secure export modes going overseas, but also inland containers can be used for domestic use and brought back to the West Coast. Unless we have a population of that size, the ability to compete with them for back haul opportunity would not be there.
159

Q: Sharon Martin, transportation company owner in Wenatchee. I wonder if the ports have ever given any thought to extending their hours so that they are open and more user friendly? A: Craig Hatamaki. This is an issue that has come up at almost every opportunity. When will the Ports of Seattle and Tacoma get to 24-hour a day operation, seven days a week? We meet on a regular basis with the steamship lines and the stevedore operators. Obviously, we don't operate our terminals, they operate the terminals. However, we are suggesting strongly that they take a look at other opportunities. We know that it costs them money to keep their gates open at night. It's a basis of return on their investment. If there was the ability to change the hours so that they could get enough volume and afford those types of gate expenses, I think they would be more willing to do so. As of this time, they have not been very receptive. They are very vocal asking who is going to pay the bill to man gates when you only have a limited number of containers that are coming through. They will have gates, but they have to have almost a guaranteed volume to support the expense of opening a gate. That is the answer that we are given at this point. But we are still working with them and trying to see if we can't extend the operating hours. Q: Randy Bostrum, Port of Whitman County. One of the things we have discussed is the rail service availability as far as car availability, but the other factor is how many trains you can put on the system. I know that Stampede Pass opening up again is relieving some of that. But in your projections, what do you see as the capacity of the line itself? Could that handle the additional traffic that closure of the Snake River dams would impact? A: Craig Hatamaki. You know that both Port of Seattle and Port of Tacoma are strongly behind the opening of Stampede Pass as well as the enlargement so that it would accommodate stack trains. At this point we continually meet with both railroads and, specifically, the topic for the Burlington Northern-Santa Fe is: when are you going to open up Stampede Pass so it will accommodate stack trains? At this time their studies, their projections, and their modeling suggest that by taking general traffic and other types of cargo being diverted off both Stevens Pass and Columbia River routes over Stampede Pass, the minimum amount so far, would allow greater capacity on a north and south run of Columbia and Stevens. My personal opinion is they are going to see significant growth and the railroad is going to have to address Stampede Pass. It's going to have to be opened up to accommodate stack trains in the future. As for us as a state, it gives us another avenue. We want the maximum flexibility and the maximum capacity to move traffic. We do not want to continue to create weak links in the logistics chain. Inaudible question on stack trains. A: Craig Hatamaki. The time frame for double-stacks to go through Stampede Pass? Right now the president of the railroad has information which suggests that it will be years down the line before the capacity in western Washington will get to the point that it requires stack trains to utilize Stampede Pass. Railroads can't plan past three years.
160

Q: Mr. Barcham, you made the comment that with the passage of NAFTA, the flow north and south has increased greatly. Is the flow greater coming south or going north? And as far as the flow coming south, what is the nature of the cargo and what is its final destination? Is it passing clear through the state of Washington or is it coming into Washington and turning to the ports? Where is that cargo headed? A: Don Barcham. I think Ken Casavant can answer that better than I. He did all the detailed studies. The north-south traffic that we see is relatively steady and varies through Patterson, particularly with the chip market. The pulp mill in Castlegar buys its chips on the open market. It is a custom mill so it buys five different varieties of chips and it seeks them out wherever it can find them. So, the traffic does fluctuate somewhat, but these are not high volumes. In terms of destinations, I know that a lot of the hog fuel ends up at Washington Water Power. Beyond that, where Cominco and other mills are shipping; I'm sorry, I don't have that information. Ken took a pretty hard look at that type of information and he will make it available to you. Q: One of the predictions about NAFTA was that it would greatly increase north-south traffic. What are the issues in southeast British Columbia that have arisen because of NAFTA that weren't part of the discussions before NAFTA passed? A: Don Barcham. I guess the issues are largely similar to your communities. The road systems are generally two-lane rural highways in very mountainous terrain with very difficult winter conditions and very high mountain passes on each side. Safety is a major issue, and that is what drove our system study. The proliferation of trucks is a major issue. Our apparent inability to move more freight by rail. The reluctance of Canadian Pacific Railway to accept general cargo; I've heard the term "long heavy haul" used here and that is exactly what our two railways are focusing on. Our trucks are larger and our residents feel they are too large for the nature of the road. Sometimes the design configuration of the road, in terms of its geometry, doesn't seem acceptable for such large trucks. The one bright light in this is the portion of the Canadian Pacific Railway, which serves the area from Kings Gate into Trail, has become what is called an "internal short line." It's being operated by the employees; they have a five-year window in which to prove themselves and make it profitable. In the first year, I understand they have reduced operating costs by about 25 percent. We are hoping they will be successful. The hours that border crossings are open is quite a concern, particularly to tourism associations and others, and we are trying to work toward improving that with our counterparts in customs and immigration. Comment: Charles Kilbury, Mayor of Pasco. I'm sorry to monopolize this, but I think information on rail traffic through the state of Washington might give you a better idea of what is going on. On Stevens Pass the Cascade tunnel is eight miles long. They can only put a freight train through there every 30 minutes, because they have to clear out the tunnel or the diesel gases would asphyxiate the crew members. As far as Stampede Pass is concerned, they've got to either raise the top or dig the floor out of
161

the tunnel, which is two miles long, for two feet before they can run those double-stacked trains through there. The route between Vancouver and Pasco is running at capacity right now and I'm sure the Stevens Pass route almost is. There are better than 40 trains a day that run through Pasco. That is a tremendous number. I think that gives you an idea of the problems that are coming up. Q: I want to pick on the ports a little bit. It amazes me that the Port of Seattle is located in the most heavily populated district in the state. I was wondering if you would talk about the expenses of going from Issaquah to downtown Seattle? And I wonder if there is ever any consideration given to shutting down the Port of Seattle, selling it for condos, and moving up to Bellingham to a deep water port? A: Bob Hannus. The infrastructure the Port of Seattle has put into place for the last hundred years has a book value of over a billion dollars. We also have an established reputation as a major world port. My personal belief is there is no other area that has the natural advantages and the embedded infrastructure to do that. We are the message, we are not the medium. You make the decision. The ports are there for good reasons, they are at natural intermodal connecting places for the cargo. A: Craig Hatamaki. In addition, consider the capital investment for the future that's going to have to be made, even by the ports that are seeking to be the mega-ports on the West Coast. Seattle has never had to dredge in the past. We are now facing a situation where we have to dredge to get to the 50 feet that the new vessels are going to require. You have to make significant capital investments, just as the Ports of Seattle and Tacoma are, in larger cranes to be able to handle the mega-ships that are coming out. You also have to have the infrastructure in place, with road, rail, manning, population, back haul opportunities, and the domestic opportunities. Can Bellingham do that? They probably can, but it's going to require a significant amount of capital and a significant amount of infrastructure building. We're having difficulty, as mega-ports on the West Coast today, building infrastructure for existing ports. Q: Has there been a study of the benefit cost ratio to improving the border crossing at Waneta and what is now the county road into SR25? That was formerly a state highway. Has there been a study of projected traffic volume to the port if the road were improved to support the heavy truck traffic that Don Barcham indicated would originate in British Columbia? A: Don Barcham. The volume currently through Patterson and the other ports are quite low, under a thousand vehicles a day. They vary in terms of truck traffic. There is no benefit cost analysis I know of on the Waneta Route 251; that would certainly have to be done. I don't know what happens in Stevens County, or Washington State in terms of benefit cost, but we are required to do benefit cost analyses for all our projects and multiple account evaluations as well. At the present time we are just requesting funding to look at the highway between Trail and Waneta. Part of that will be benefit cost and multiple account evaluation. Jurisdictionally, we will have to work jointly with Washington State and Stevens County to ensure that the work we are doing on both sides of the border is consistent.
162

Q: I suppose the RTPOs will have to moderate between the agencies? A: Don Barcham. I'm not sure what the process would be. I'm sure Jerry Lenzi knows. Q: Jerry, is there any thought of the state taking back that section of roadway? A: Jerry Lenzi. That used to be Highway 251. We took over Highway 25 long before my tour of duty and it went back to the county. There are a couple of dynamics you need to look at. First of all, this is not simply a transportation issue although that is one element. Recognize that we have another major player in here that's very warm and friendly, the Department of the Interior, i.e. Customs. Right now Waneta is open eight hours a day. I don't see the Canadian government making the investment in Waneta, if they are only going to get eight hours out of it. They've got to have more. That means the U.S. and Canadians have to come to terms. Assuming they do, the next issue is the cost benefit, and Don is looking at that to some degree. We are talking about this and have been talking for the past two years. This is not going to happen next year or even in two or three years. It's more of a long-range plan. At that point in time, if the situation warrants, there will have to be some investment in our old state Highway 251. It is narrow and has sharp corners that are not conducive to our bigger trucks at the current time. We've ballparked an estimate, and it is really rough, in the range of $15 to $20 million in improvements to bring it up to standard to accommodate those trucks. That will be a wrong number once we get in there, because other things may need to be modified. At some point in time, we will have to engage our legislature, perhaps the federal government, and so forth, to really get this planned out. Q: Ken Casavant. Don, you have been privatizing your maintenance work in that region. Could you describe just a bit of what that means and your assessment of how well that is working? A: Don Barcham. Back in 1989 the provincial government decided they would privatize road maintenance activities. This was primarily a political decision. We had a very right-wing government at the time; we now have a very left-wing government. Some people feel that the condition of the road is better; others feel it’s much worse. There was a study done to indicate that it is, in fact, more expensive. If it's your political will to create private sector jobs and reduce the size of government, then you go that direction. In terms of the financial rewards from that process, we have had two or three of the private contractors lose their contracts through lack of performance. It's a political decision that is based upon perception. In some areas it has worked well and not in others. What happened to the government employees? All of the government employees went with the package and are still covered by the same union. The second round of contracts has recently been negotiated. They are basically three-year contracts with extensions to five years if the standards are maintained. We employ area managers to enforce the contracts and make sure the work is up to specification.
163

Q: Dick Keeney, Mayor of Wharton. I understand it takes a truck as long to get from Enumclaw to the port as it does from Moses Lake to Enumclaw. Are the Ports of Seattle and Tacoma doing any studies with the state or having any conversation whatsoever to take that into consideration? A: Craig Hatamaki. There are a number of projects that are underway and a number of committees that are taking a look at the access and egress of the port area, both by rail and by road. We have a number of community groups, a contracted engineer, and industry people that are taking a look at activity levels. They are taking a look at traffic patterns, hours of operation and projected improvements that are being suggested in roads and highways. We're sponsoring corridor projects that take a look at grade separations, and aligning highways and roadways so they will work better together. We know that there are difficulties getting in and out of there and we are trying to get everyone together to solve these problems. The one fast corridor project that I spoke of, the initial $360 million projects; that has been almost two and a half years of working to bring everyone together. It won't come quickly, but it appears that the freight and personal mobility has now gotten more visibility. We've gotten a lot more press and we are getting a lot more legislative support on it. I think it will get corrected in the future, not overnight, but in the coming years.
Policy and Politics: Transportation and Freight Mobility Ken Casavant (moderator), Project Director, EWITS. Professor, Washington State University. I mentioned earlier the idea that research plus planning plus political support can bring about success. We are fortunate today to have two folks who are willing to discuss how their vision of what political support, political direction there is for transportation and, specifically, how we can work together. I would like to point out that Karen and I were talking about the fact that at a conference 12 years ago, she and I discussed how we might better emphasize the connectivity between east and west. We both felt that there wasn't an understanding of how important it was from both sides of the state. That has been a continuing theme. Our first speaker this afternoon will be Karen Schmidt. Karen is Chair of the House Transportation Policy and Budget Committee as well as Chair of the Legislative Transportation Committee. Representative Karen Schmidt, Chair, Legislative Transportation Committee. It's been interesting to listen to some of the comments and concerns. They are not unfamiliar, but it's always nice to have a refresher.
164

I'm going to start with the transportation revenue package that passed, the options, and what we felt went on during this last session. Actually, going back to the session last year, we failed to pass any transportation revenue at that time. A group of us sat down in July of last year and started talking about what to do. We felt there was a problem in this state; that we would not have the votes for a gas tax; and we believed that we still needed to do something. Then we went to work to find out what would come together that we felt could get the votes. We tried a number of different approaches in the summer and the early fall. The final approach was the one that did pass through the legislative process this year. Basically, we faced going into this session an increase of the gas tax, which was the Governor’s plan. That was a 50 percent increase on our current gas tax. Using existing surplus revenues, this is the undedicated portion of the MVET. We came up with a package that supports a comprehensive transportation-financing package for a short term of $2.4 billion. It provides additional funding for local government, particularly in the area of criminal justice. It reduces the motor vehicle excise tax by $30 and establishes a joint blue ribbon committee to study the long-term financing needs for the state and local transportation, as well as look at some other ways of doing business and how we can change the way transportation is delivered in this state. In the new revenue package, the legislative plan is funded with a mix of bonds and cash. It is funded without raising taxes. It provides motor vehicle excise taxes for transportation purposes, where most people believe it goes now. Highways, bridges, and ferries will be used while they're being paid for. They will be paid over time and the transportation facilities will provide benefits long after the bond retirements. We looked at 1997-1999 and the state economist’s numbers for the projection of what revenue would be coming in. These are provided by the independent state economist, Dr. Song. Even after beginning the transfer of the undedicated MVET, you will still have $813 million above the 601 limit of what you can spend. In the next biennium, we knew that a downturn of the economy is projected and the Asian problems that are going on. That was already factored into the 1999-2001 numbers. If we were going to err, we wanted to err on the side of being conservative and not have any nasty surprises. Even with that, the reserve above 601 is $638 million. The following biennium was once again projected on a normal average year. It is not viewing it with a rosy economy. That would again bring the total reserves, even after the transfer of the money to transportation, with a $798 million surplus above the 601 limit of spending. Currently, we are dealing with a couple of big lies. The first big lie is that it would hurt education. This is absolutely not true. This money is above the 601 limit; education would continue to be funded. This is money that would either sit in reserve or be used for transportation solutions. In the General Fund Budget, K-12 is $8.9 billion, higher education is $2.2 billion, and a small amount of the reserve is what we are talking about putting into transportation.
165

The second big lie that has been thrown around the state is about bonding. Traditionally, transportation has always required bonding. We cannot build the kind of projects we need to build without bonding. No matter what the revenue source is, we will have to bond. The Governor’s plan bonded 67 percent of the revenue; our plan bonds 79 percent of the revenue, a difference of $300 million. You will also hear that this is the highest level of debt ever taken on by the state. If you see the whole transportation bond pattern, it is very similar to what we have historically done. As a matter of fact, in the 1970's there was a higher percentage of bond than what we are proposing now. And that was during a time when we had a downturn in the state economy. Once we raised the money, our goal was how to spend it. We found that people wanted accountability. They want to know what they are getting and they want some coordination between jurisdictions on how this planning is taking place. They are no longer willing to spread a little bit of the money all over the state, but never have enough to really attack the very big projects. As Jerry Lenzi knows, it is projects like a billion dollars in Spokane on something called the North-South Freeway. We have a number of projects like that, that we will never get to, unless we make strategic investments. We need greater cooperation in identifying projects and leveraging dollars to build meaningful projects with the cities, the counties, the MPOs, and the RTPOs. All of us working independently have not solved the problems. Unless we start working more cooperatively in targeting our money so that we all come up with a plan for the region, this isn't going to work. We need a realistic inventory of needs, not just one of wants. It doesn't do any good to say we have $30 billion of infrastructure if we can never get to that. So let's find out what we can realistically approach in the next 20 years, identify it regionally so we have a balance all over the state, and go ahead and attack that problem. The blue ribbon committee will be looking at a number of things, including financing. One of which is how we can change the way we do business. We learned many lessons with things like the Intel interchange on I-5, where the developer came in, bought the right-of-way, and was able to move that project along cheaper and faster than what we have done by the traditional methods. We are employing that same sort of an approach on the Sunset interchange on I-90 and we hope to have that project save about six months of time. We would like to find other areas where cost savings and time savings can be achieved by having communities working more cooperatively together through the permitting process and doing a lot of the advance work on these projects. A bipartisan approach on priorities was the other thing we tried to establish. When we sat down in the House, we sat down with every member of the House Transportation Committee, so the Republicans and the Democrats sat through every meeting. First of all, we decided what are our priorities and how are we going to address them. It was remarkable, but our first priority was obviously congestion. Congestion means different things around the state, but it was the same message, so over half of the money is going for congestion relief, particularly in large project areas.
166

We found that we have companies coming in and making decisions on a daily basis, whether they are going to locate here, whether they are going to expand a business here, and we need to be able to respond quickly to those opportunities and keep those jobs here. We wanted to have some money in an economic development pool available so we could step in right away. We wanted to continue to work aggressively on the highway safety and bridge projects. We wanted to put more money into flood mitigation and fish passage barriers so that we could work cooperatively on those problems that we are facing. We would like to address the causes of flooding, not just going back year after year, cleaning up after the flood and repairing. The ferries are the interstate for the western side of the state. There are no county roads in Puget Sound and there are no city streets. The only way you get across the water is on the ferry. Two hundred million dollars would be dedicated to the purpose of expanding capacity and retiring vessels that are 71 years old and number of them that are in the 50-year-old bracket. We cannot only expand the capacity, but also get rid of some of the older vessels that are in jeopardy of being red-tagged by the Coast Guard and put out of service. Passenger and freight rail programs also benefit from the investment here, because we are multimodal in this state and to address our needs, we need to address all of them. We began a program this year where we will have a permanent funding program for freight mobility. It will bring all of the partners together with their checkbooks around the table, scoring projects, and deciding how they're going to spend money to start relieving the choke points for our freight delivery. The earlier discussions today about east side versus west side is not where our problems are. Our biggest threat is from the Alameda corridor where $2 million is being spent to keep that port not only competitive, but to steal more market share. We have a port to the north of us, Delta Port in Vancouver, which is very new, modern, and high tech, and can expedite a lot of cargo. We have a lot of competition where money has been invested and we have to do the same thing, but we have to do it smart. The partnerships will bring an independence, this is not going to be run out of the Department of Transportation, and it will be an independent group. Partners will be the state, the city, the counties, the port, the shippers, the truckers, the rail lines, everyone who has a checkbook will sit down and talk about where we need to make these strategic investments. It's not going to be solved in six years. As I said, this is ongoing. We are going to have to continue to fight long term for our freight corridors. The first six-year project has been identified, but it hasn't been finished or perfected. There are still some problems with determining who is going to pay what share. This group will also decide how to rank projects, to deal with the most critical projects statewide, and how to assign financial responsibility. If the greatest benefit is to the county and to the port, then that is where the majority of the dollars will be sought.
167

In his approach, the Governor agreed with us on nearly everything. He wanted to have a 20 percent minimum participation from all the players. We did not support that position; we said there are too many areas where that's not going to work. We want partnerships, but we don't want an artificial barrier. The drawdown issue obviously is a concern to us. That's why we have an LTC study that will be taking place to look at that issue. We will be touring eastern Washington to look at the drawdown problem. The purpose of the tour is to bring the western Washington legislators to see what the problems are and better understand what the issues are over here. This is not just about fish; it has a tremendous impact on our state. Next week, I believe we will be touring Yakima and the Tri-Cities area. We are going to be looking at the projects that are scheduled to be built there, to talk about the needs, and see what relief we can provide. We have identified some rather large programs. For instance, the snow shed project at Snoqualmie Pass. This is one of the arguments that we could use with the governor, that if you want 20 percent of participation, the citizens of Easton are never going to be able to come up with their 20 percent. It is important that we keep the pass open, so that money will be spent there. Another project is ASR 519; a lot of you have talked about the access to the Port of Seattle, this is the most treacherous, worst part of how to do everything wrong on a highway. This is between a Mariner stadium and a Seahawk stadium, with the railcars coming in, both freight and passenger, and the ferry traffic going through the main access to the Port of Seattle. This is the area we want to target right away and, while the money will be spent there, the greatest beneficiaries will be eastern Washington shipping. We know we have huge projects up in the 395 area and we are going to have to incrementally start nipping away at opening that up. I asked local government the question, if we have a dollar left, when we go through our needs here, how would we spend it? You tell us how we should bring it in. They said this is what we feel we need for CRAB, for TIB, for distribution to small cities, and other programs and requested $230 million. We also added an additional $140 million because we took a look at the freight mobility costs for local governments. They weren't going to be able to come up with the money and we didn't want to see the projects delayed, so an additional $140 million was put in to help local governments meet their freight mobility issues. This package passed the House of Representatives with a very strong bipartisan vote. It was 81 votes strong. It's a package that people felt strongly about, because we did have bipartisan cooperation all the way through in writing it, and over 80 percent also reflected what was in the Governor’s request. It wasn't that we were plowing new ground, we were simply trying to look at what the needs were and trying to spread the money realistically statewide.
168

The last day of the session we were finally able to pass a local option package. It passed the House with over 80 votes. It ran out of time in the Senate, and that's why it didn't pass over there, but it was one that was worked quite heavily in the House. Again, it received strong bipartisan support. Partnerships became extremely important; if we don't work with our money together, we're not going to get to those big projects. When we look at the freight mobility at the state level, as well as the local level, you can see what the anticipated partnerships are going to be. Those partnerships are coming from Burlington Northern, from the Ports of Seattle and Tacoma, from RTA, from a whole host of other players who will be part of this equation. In our passenger rail program, we also have heavy partnering in that area. So the money we put in is leveraging quite a bit of outside money and we feel we can get a much better bang for our buck by using this approach. Some discussion was held about statewide needs and statewide focus. The money that is collected in eastern Washington basically supports other counties in eastern Washington. It's a very close symbiotic relationship coming from the west side to the east side. We can't break down on that basis. We need to look at what our needs are statewide. As I tell our folks, if we fix something on one side of the state, and we haven't fixed it on the other, we haven't solved the problem. You have to look on a statewide basis because everything does flow. It doesn't stop at a legislative district, it doesn't stop at a city limit, and it doesn't stop at county lines. I hope with new partnerships we can get away from worrying about whether we have this and that, and whether we can get together and say we are going to make an real impact. Ken Casavant, moderator. Our second speaker is Eugene Prince. Gene is the Chair of the Senate Transportation Committee and Vice Chair of the Legislative Transportation Committee. He is also an old friend of mine, and of eastern and western Washington over the years. He's a straight shooter. We've argued about issues, but we've understood each other’s position. Senator Eugene Prince, Vice Chair, Legislative Transportation Committee. I've particularly enjoyed this session today. And it really pleases me to find you coming together to talk about the issues that are confronting us. But realize that we are the choir. Transportation today is potentially facing possibly the biggest crisis that it's known for a long time. A lot of people haven't thought a lot about this. Karen has explained the referendum that's on the ballot quite well. But we may have an initiative or two on that ballot at the same time. And if those initiatives, doing away with the MVET should pass, if they get on the ballot, and if people really don't understand the impact they will have, you stand a chance to see them pass. And if they pass, this funding package that has been explained to you, disappears. The money is gone, because it's the same MVET money; in fact, it's more money than what this fund takes. It puts transportation in real stress, and it puts the general fund in some stress. Our
169

ability to come back to the legislature and do something about it, like passing a gas tax, is not that great. We have too many legislatures in today’s environment signing "no tax" pledges. That is the perception that is out there at the moment. It's been asked, "What can we do to help this situation?" I'm one who believes that politics is the art of perception and politics is based upon perception. Yet our opponents are primarily the one’s establishing the perceptions. The talk shows are driving a lot of this type of thing. It was mentioned this morning that they said if we had an audit of the WSDOT, we would find a $150 million of waste. It didn't happen. A lot of us knew it wouldn't happen and they ended up with only $10 million. The perception is what people believe, because it's one they want to believe. They want to believe that there are ways of accomplishing this thing without them being affected. What's the first subject that we need to get public understanding on? I’m one who believes that it's the funding source, that transportation receives the bulk of its money. We have a general fund that even under the 601 limitations, went in one biennium from $17.6 billion to $19.2 billion with an extra $800 million. That's impressive. There's inflation in sales tax. There's inflation in B&O tax. There's inflation in some property tax, maybe not as rapidly as the others. But then you turn around and look at transportation. Gas tax has no inflation connected with it. We've always had to come back every five or six years for an increase in the gas tax to carry on our transportation problems and construction. People ask, "Hey, where did the money go, why do they need more money so frequently?" Because they don't understand that. This is one perception that we need to try and get people to understand. I don't know of another source of funding. If the MVET goes to transportation, it has some inflation with it, but it will still require transportation to come back rather frequently for support. There are other things that need to be discussed as well. Karen covered some of them. Everybody thinks the money goes somewhere else. Groups like this getting the education you've had today can be a help. But it was asked this morning: "How do we get this word out to the public?" I think there's only one answer to that question, and I want to challenge you with that answer. We're an interested group here today. We're all involved one way or the other. There's only one-way we can accomplish the education of the public to help make it easier for us to fund and maintain our transportation system. That answer is: each of us has to step up to the responsibility. It’s our responsibility to try and educate the public. If each of us would do that and work with the groups we're involved with and not look to somebody else to do the job, I think we can get there. But, whether we can get everybody to say, "Yes, I'll step up and I realize that it’s my responsibility," is something that I don’t know if we can accomplish. But to me it's the only way that we'll get enough education and enough background that we can prevent the two initiatives from passing; that we can get the referendum that's been placed, and it is the only game in town. It's a job that, if we don't do, we're in serious trouble. We're in the eighth year since the last gas tax. Like I said, we usually come back with revenue in five or six years. If we go down this fall in the election and the two initiatives pass, I'm not sure when you'll get funding for transportation. I think it behooves every one of us to give serious thought, to use what we've learned today, to spend more time looking at this subject, and be ready to help
170

educate the public as to the dangers that are involved in the two initiatives, and the need there is to see that this referendum of funding passes. It's not a long-term solution. It's a five or six year funding source. This is why the study was put in there, so we can help educate and determine, maybe a more long-term solution. And Karen mentioned this study. There's a broad-based group that is going to be trying to put this together. If we as a group don't educate the public and don't get others to help us educate the public, and if we can't pass the referendum and defeat the two initiatives if they get on the ballot, we are in serious trouble. I personally think, if we all step up to the line, we can do it. We all know that if we don't maintain our transportation infrastructure, and all the modal parts of it, our economy is in serious trouble. I don't care if you're eastern Washington, western Washington, or where you're at, we have to have a statewide infrastructure that is kept in good shape. We're getting a long way behind. The state’s between $20 and $30 billion behind. The counties and cities are between $20 and $30 billion behind, I’m told. So we've got a challenge facing us. I hope with meetings like this, that we find we have people willing to step up and shoulder the burden, and ensure that the state of Washington does not face a crisis, but has the funding that it needs for it's infrastructure.
Question and Answer Inaudible question from Teresa. A: Eugene Prince. Let's hope that there isn't, though they have said at this point that they do not wish to do the bonding because they felt left out. It cost us about $60 million at the end of the session because they weren't willing to bond. We had a bond that we put in place, I think in 1991, for $240 million. Interest rates are down, we want to redo it, so we could bond it for $300 million, and we lost it by one vote. I hope that if we get it passed, they will step up to it at that point. If we do get the bonding, and the referendum passed, and the two initiatives don't, none of the projects are outlined. There are outlines of suggestions, but everything is on the table, and your project is on the table as well. A: Karen Schmidt. I just want to add, in the referendum there is a portion that authorizes bonds. It will probably be challenged, if referendum 49 passes, but there is a clause in there that also authorizes the bonds to go with the appropriation. Q: Are there specific criteria for the counties that'll be attached to the local FMAC monies? A: Karen Schmidt. There is a process, and that will be to go through the Freight Mobility Strategic Investment Board. There will be criteria. Projects will be sifted through that process. Again, everyone that has a checkbook. So you need to make contact with someone on our staff, and they'll get you more information about how you can touch base with the Freight Mobility Strategic Investment Board.
171

Q continuation: But they won't be the same ones that were used for FMAC for the state? They'll be a little lower for the counties, correct? I’m talking about the criteria they have to meet to qualify. A: Karen Schmidt. They need to work on the criteria. They need to develop their criteria, and also, who is going to pay for what portion, based upon the benefits. Q: Charles Kilbury, Mayor of Pasco. We hear that we are going to have a change of trains on the Eugene to Vancouver line. We're getting new trains this fall. We have a passenger train from Spokane to Seattle over the northern route. We have a passenger from Spokane down through Pasco to Vancouver and Portland. My question is, when can we expect to get a passenger train from southeastern Washington into Seattle? The population of southeastern Washington is very nearly that of northeastern Washington, if not more, and we're the only part of the state that has no passenger trains into our largest city. A: Karen Schmidt. If I understand the question, you want to know when the passenger rail program will be extended to eastern Washington? That is a goal that has been a goal of the program all along. As a matter of fact, Representative Chandler and his father before him, were very strong champions of having a fast train that would not only go north and south, but also east and west. And certainly the passenger component of going east and west for us to link our cites in eastern Washington and western Washington is going to be an important one for us to do. Right now, Amtrak doesn't care what time the train arrives in Pasco or what time it arrives in Spokane. They care about what time it's going to arrive in Chicago. For us to get an alternative to air transportation or driving, we believe we need to operate passenger trains on that route. We currently are expanding to a second train on the northern route from Seattle to Vancouver. Currently that is the corridor that has been identified by the federal government. If we can get some help from Amtrak in expanding to come east of the mountains, that is something we have all supported. But right now we don't have a date that we can tell you. This program is still in its infancy, and there are still a lot of people who don't believe that passenger rail should be part of our mixture. It is a goal of mine and a number of other people. Q: Mary Seubert, Kittitas County. Representative Schmidt, I was very glad to see at the end of the session, taken out of the bill was the combination of the three boards TIB, TransAid, and CRAB. I hope that it is kept out permanently. As a county commissioner, and I do serve on the CRAB Board, I think that each of these boards individually need to have their own identification to help the counties, and the cities and the states. A: Karen Schmidt. It was taken out of the package, but it is currently being looked at by CRAB, TIB, and TransAid. There is very strong sentiment that the programs should still be there, but there needs to be much better coordination with the three programs. By putting them all together under one umbrella, we believe that we will have better coordination. There are still very strong feelings along that line, but we are not trying to change the program itself.
172

Q: Forrest Miller, Ferry County Fire District 3. I'm wondering if anything is being done on some of the ancillary issues on transportation. Earlier we had a gentleman from Canada talking about the increase in truck traffic from NAFTA through the Kootenay into northeast Washington. In our little all-volunteer district with practically no funding, suddenly we're faced with thousands of tons of highly dangerous HazMat material monthly, and we have no capacity and no funding to handle that. Yet we're paged out if there's a problem; at least, in theory we'd be paged out. So, I'm curious if this issue is being addressed? A: Eugene Prince. This type of issue is continually addressed; whether you're specifically included, I can't honestly say to you. We do get into this debate and the best way to bring it closer to a head is to write your representative or one of us, and urge us to take a look. We look into this type of thing continually. Q: Phil Merrell, Walla Walla County. We've heard local districts talk today about problems caused with pass-through traffic, not locally generated traffic that has to be addressed on the local level. In the past, we have been able to depend on federal money coming to the local district through ISTEA and we've been able to depend on state gas tax money coming back to the local jurisdiction to deal with our problems locally. In this bill, I don't see anything that comes directly to the local jurisdictions, and it seems like we're being left behind funding wise. The program put together money that goes into the pool; there is going to a board that has one representative from the cities and one representative from the counties on it. It is not going to local projects unless they are associated with DOT projects or freight mobility projects. I guess I'm just commenting and asking your view on this. The local jurisdictions appear to be left behind. A: Karen Schmidt. First of all, none of us knows what is going to happen at the federal level. I spoke with Congressman Metcalf, who is our lead on transportation back in D.C., and it's anticipated that we will probably end up with a package of $190 billion over the next six years, which is simply the income from the states being directed back out. The formulas and the demonstration projects, we don't know who the beneficiaries are. We certainly have an awful lot of projects in that area and we won't know until later this year. With respect to the cities, you do have money coming through this formula. We also had a local option package that would have given you some tools for self-help to raise additional dollars. What happened in the last distribution from ISTEA in 1990 were the local governments benefited by that distribution at the expense of the state. So, while there was more money flowing to the cities and the counties, it came out of the state’s portion because the amount actually coming into the state did not change appreciably. There are needs at every level and that is what we are trying to address. We're trying to also get communities to work more closely together. For instance, look at a road like the intertie outside Kennewick. Kennewick will be the beneficiary of not having that traffic coming into town, but the road will be built by the state on county land. It is those kinds of projects where it doesn't necessarily have to be right in that jurisdiction to have a benefit to your jurisdiction.
173

A: Eugene Prince. I think I should add something in terms of the ISTEA or Next T. You should support Congressman Schuster’s effort, Metcalf is working with him, and that is to use the federal gas tax for distributing back to the states, cities, and counties. The argument back there between Schuster's position and the Senate position, is the Senate would like to keep some of that money in reserve so they can spend it on other projects and use it to cover the deficit. Schuster is saying the economy is good enough that the money needs to be spent on transportation, because that's what it was set as a tax for. I personally feel that we need that money, and I certainly support what Chairman Shuster and Metcalf said. Any help you can give by writing different congressmen and senators would be useful. Q: In the referendum that you are hoping to pass this fall, do you have any money dedicated or set aside for alternate forms of transportation? Where I live, we have two highway intersections, one state, one city that run right through town, so that I or my children, even though we can see the video store, we can see the grocery store, we can see the school, we have no access to them unless we get in a car. A: Karen Schmidt. The spending plan that passed both the House and the Senate was vetoed by the Governor out of the bill. It did include both pedestrian and bicycle enhancements in that package. Currently there is no dedication. The House has said it is our turn to start the transportation package next year. What we will be proposing will be the first two years of the package that we put together this year in the House. And we will begin the process of identifying those projects and what we said we were going to do. But those were the same ones and they are the same ones the Governor had. There's not anything new. I don't see you changing dramatically away from those projects. Comment: Ben Bennett, Executive Director of the Port of Benton. I've gotten to know Representative Schmidt and Senator Prince over the years, we have dealt with this problem of the Port looking at the problem of the Hanford railroad system. I just want to extend our appreciation for bearing with us as we move from a state of not knowing very much about rail and transportation in the state, to one in which we begin to think we understand what's going on. I think we'll be able to make a much better judgment now, on how best to integrate that system into the state’s freight mobility system. Again, I just want to make sure that I let you know publicly as well as privately, that we really appreciate the help we got from you last year. Thank you. Q: Karen, could you fill me in a little more on the flood mitigation and fish passage fund? Who's managing that, and is that for both eastern and western Washington? Could you fill in a few details? A: Karen Schmidt. They are for eastern and western Washington. It would be handled by WSDOT working with the local communities. Let me give you one example of what we would like to see. In western Washington you have I-5, our major north-south corridor. When we have flooding in the Chehalis area, that corridor is closed. The idea of closing I-5 is like closing I-90 over here; it's the main artery. Currently
174
WSDOT is talking about raising the level of I-5. Well, that doesn't look at the fact that we're flooding Chehalis and we're flooding Lewis County. We are talking about putting Lewis County, Chehalis, and the state together to look at the cause of the flood, and does it mean we should be increasing the size of the dam, or building canals, or something to provide some relief so we don't have to spend the horrendous amount of money to raise I-5. We want to fix the problem not only for I-5, but also for Chehalis and the surrounding counties. We're also looking at areas like the lower Columbia and the Puget Sound areas and fish passage barriers, and particularly where you have flooding and fish passage, to try to do something to try to forestall the problem with the Chinook salmon being placed on the endangered species list. Those are the kinds of projects we're looking at. We have those kinds of projects all over the state, and we're looking for creative approaches, instead of going back and fixing flooding all the time. We'd like to fix the causes of flooding and spend the money that way. Q continuation: Can you give me a contact person there? A: Karen Schmidt. Jerry Alb, he is our wizard on everything that's environmental. Ken Casavant, moderator. With that, and knowing that Karen only has 20 minutes to get to a plane, I want to make one point, and then I want to thank them. When this session started, there are only 14 people less in the room now after an all day conference than there was at the start. That's an indication of what people wanted to hear and the importance of this discussion. Would you care to join me in thinking them. Karen Schmidt. I have a question. No one has to answer it today. But we hear a lot, and a lot of it was discussed today, about freight mobility in eastern Washington, the congestion in Pasco, crossing all the streets in Yakima, all the impacts that would be felt in those areas. We've talked about opening up the former John Wayne trail, whether the state should invest in that project. We're not the ones to decide what should happen there. Eastern Washington needs to figure out what makes sense for all eastern Washington, and that's where we should place our money as an investment. You need to talk about what makes sense. Do we fix the streets in Yakima and Pasco, and everything else, and not go with the straight shot across? Or do we take our money and invest there, and provide the relief to these communities by taking traffic out of their towns? I think that's one that eastern Washington needs to make the recommendation on and we need to try to work with them to fund. Eugene Prince: I would just like to thank the group I really appreciate seeing a group of this nature deal with this issue. Keep up the good work. We need all the help we can get, believe me. Thank you.
175

Wrap Up Ken Casavant: Now it is my pleasure to invite Charlie Howard to give a summation of what we have heard today and a bit of the future. Charlie's been with EWITS on the Steering Committee since its inception, and is here to give a sense of his thoughts. Charles E. Howard, Manager, Transportation Planning Office, Washington State Department of Transportation. As a steering committee member of EWITS, I have been involved in this for the past six years; I got the short straw for coming up here and wrapping this session up at 4:15 on a day when everybody has been sitting. What I would like to do is briefly summarize the day, briefly summarize EWITS, make a proposal for the future, and I want to give whoever is left here a homework assignment. And if you know the names of the people who have already left you can pass on the homework assignment to those people. What were the EWITS results; what did we get out this six-year effort? We got data collection. We did a statewide origin and destination study; we interviewed industries across eastern Washington, we now know their travel patterns. We've got a whole lot of data on transportation. We know the transportation needs of the major industries in eastern Washington. Which I think is a big step from where we started, where we really didn't know what the freight mobility needs were. We looked at locational factors, and what makes industries locate where they do. We got a pretty good handle on that to use in local economic development programs. We looked at international trade, the implications of NAFTA, what does that mean for our transportation system, and what do we need to be doing to invest in our system to get ready for the growing international trade. We looked at issues such as river drawdown and took a look at what the implications are. We’ve got a lot of data on that topic, so we don't have to start at ground zero to make the case that it is an important statewide transportation facility. From the discussion that took place around this room today, we realized that there are a lot of unresolved and emergent issues in freight mobility that still need to be addressed. So that's what we heard today. EWITS was both a research program and a demonstration program. I want to talk about both of those. It was funded with one-time funding through the federal Intermodal Surface Transportation Efficiency Act. We were tremendously fortunate in this state to be able to garner those types of resources and put them into an effort that looked at the transportation needs in eastern Washington. We would not have been able to do that if it had not been for the ISTEA funding. I think that we’ve got to recognize how important that federal source was. I want to talk a little bit about the research angle. A lot of times research gets a bad name because often you see a lot of research that is not answering anything, that is not important, or pertinent to the issues of the day. I think what we got from this research program are answers to pressing policy questions. We got data to help answer those questions, we got analysis capability, and the ability to respond quickly to emerging needs. The purpose of this data and research was to shape public policy and to help us target investment, so they had very practical purposes in mind.
176

And I want to make a strong support of the idea of research in general, because I think taking a research approach, as we did in EWITS, really returned a lot more benefits than just the initial investments. That's because the ability to support research institutes in this state leads to the ability to attract more federal money. Also student education should not be discounted; and the idea that what we are doing with these research grants at the universities is training the next generation of transportation professionals. I think that will return benefits long after the EWITS money is over. Also, it brings in new thinking on our transportation problems. So, I think Ken Casavant and the Washington State University should really be congratulated on the volume and the quality of the work. Twenty-six reports and nine technical papers were a really good buy. EWITS was a demonstration project; so what did we demonstrate? First we demonstrated that cooperative research works. A multimodal and multijurisdictional approach involving the cities, the counties, the state, and private industry can work together productively in developing and carrying out research. We proved and we demonstrated that the adaptive research method works. It allows us to focus on emerging problems in order to be relevant. That's what really makes EWITS so successful and why all of you have continued to support this effort. The results are relevant to the issues that are going on in the state. Finally, we demonstrated that freight and intermodal transportation is an area that needs more research. The issues haven't gone away. So, it needs to be talked about, it needs to be researched, and it needs to be developed. My proposal for the future, and this is a proposal that the Steering Committee talked about when we last met, recognizing that on June 30 of this year the EWITS funding from the federal government will be over, and EWITS as an entity or as a research effort will go away, we have proposed a four-part proposal. After the proposal, I would like to open it up for any comments and then I'll get to the homework assignment. First, our proposal is to create an ongoing cooperative freight research program; basically, let's not let EWITS die. Let's continue this program into the future because it's been so successful; that cooperative partnership should involve the state legislature, the WSDOT, cities, counties, ports, the private sector, and other jurisdictions that this research serves. The second point is to carry out research to track at the universities, perhaps with the special freight mobility research focused at Washington State University. Continue the use of the research institutes and support that. The third is to continue the adaptive research approach, which will allow us to respond to real problems as they emerge, and not get mired in some esoteric research that nobody cares about.
177

178
And finally, to extend one of the questions that I have here, should we extend this statewide, because that was brought up before, or should we keep the focus on eastern Washington? I think that is part of the proposal that we are not real clear about and need to talk about some more. What we figured is that about $200,000 a biennium would really provide a solid base of support for an ongoing research program that would continue the spirit of EWITS. What I would like to do in the remaining time, is open it up to any comments on this proposal. Does anybody have any thoughts on that direction that we got from the Steering Committee? Comment: Charlie, I think it’s very important to tie it to western Washington, not just make it an eastern Washington project and also, speaking out of self-interest, the flow of goods to and from the ports we think is very important. Comment: How would you get this funding instrument, this $200,000? A: Charlie Howard. We would be looking for an appropriation from the legislature. Possibly using it as seed for some federal grants for additional money. Use it to leverage some federal money. Comment: Charlie, I guess I have some concerns about opening it up statewide. I feel the connections to the western Washington should be considered, but it seems like we spent a million dollars on the eastern Washington study; doesn't it also seem like you're going to need to spend another million bringing western Washington up to speed also? It would be simple enough to consolidate the existing reports that are over there. I have some concerns about expanding in that we may be biting off more than we'll be able to sell for funding to the legislature. But definitely, the connection to the western Washington needs to be considered in the eastern Washington study. Charlie Howard: Anybody else? I don't see any other hands coming up. Okay, time for the homework assignment. What I’d like you to do, and on behalf of the Steering Committee, is to think about this proposal, but as something that is going to take quite a bit of effort to convince the powers that be that this is an important element to fund. If we want to see EWITS continue, we want to see that direction go forward, it's going to take some support. So, what we would like is to hear from people who have been at this meeting, anybody else, commenting on the proposal. I would really challenge you all. What you've got is Ken Casavant's phone number, his email address, or his regular address; send him, myself, or Jerry Lenzi, your thoughts. Just jot a couple of notes down on whether you support this proposal, whether you think it needs to be western or eastern Washington, whether you think the universities are the right place to carry this out. We really need to hear from people if you think that this is important, so that we can make a proposal on whether we're going to continue this or not. That's it for the homework assignment. I don't really want to keep anybody any longer. We've already lost a lot of the audience. I'll turn it back to Ken. Ken Casavant: I want to thank Charlie, obviously. But more importantly, I want to thank you folks, and why don't you just give yourself a hand. Let's bring this thing to an end. Nice job for all of you. Thanks a lot.