the e ect of taxation on informal employment: evidence ... · the e ect of taxation on informal...
TRANSCRIPT
The Effect of Taxation on Informal Employment:
Evidence from the Russian Flat Tax Reform∗
Fabian Slonimczyk†
June 1, 2011
Abstract
The 2001 Russian tax reform reduced average tax rates for thepersonal income tax and the payroll or social tax. It also made thetax structure more regressive. Because individuals in the lower incomebracket were for the most part not affected, it is possible to estimate theeffects of the reform using a differences in differences approach. I studythe effect of the reform on informal employment. Informality is definedusing information on employment registration and self-employment.There is evidence that the tax reform led to a significant reduction inthe fraction of informal employees. The reform seems to have had thestrongest effect on the prevalence of informal irregular activities.
JEL classification: H24, J3, O17, P2
Key words: informal sector, entrepreneurship, tax reform, difference-in-difference,
transition, Russia.
∗I would like to thank Vladimir Gimpelson, Rostislav Kapeliushnikov and seminar par-ticipants at the Center for Labor Market Studies for helpful comments. Support from theHSE Research Program and the MacArthur Foundation Grant “Labor Market Informalityin Russia: Economic and Social Perspectives” is acknowledged.†International College of Economics and Finance. Higher School of Economics,
Moscow, Russia; [email protected].
1
1 Introduction
The high prevalence of informality is a well-known characteristic of labormarkets in developing countries.1 Informal work is by nature heterogeneous.It includes self-employed individuals, as well as those working under them(often a few family members and friends). It also extends to those employedby larger organizations but who are not effectively covered by any of theinstitutions –such as the pension system and other social insurance– thatprotect formal employees. While for the most part the economic activitiesof informal workers are legal, they are often not taken into account in officialstatistics, and much of the income they generate goes untaxed.
An important undecided issue is to what extent informality is a variableof choice. Do individuals choose to participate in the informal sector basedon a rational calculation of costs and benefits? Or are informal workersbetter characterized as victims of a poverty trap? In this paper I provideevidence that supports the thesis that a majority of informal employmentis the result of a choice.
My empirical strategy is based on the intuition that, if informality isa voluntary state, changes in the economic environment should lead to anobservable response in participation decisions. Specifically, lower taxationrates should reduce individuals’ incentives to enter the informal sector. Inorder to document the causal effect of the level of taxation on informalityI focus on an event that exogenously reduced tax rates for a well definedgroup of individuals while leaving others mostly unaffected.2
In 2001, Russia introduced a tax reform that drastically reduced taxationlevels and simplified the process of filing taxes. The pre-reform progressivepersonal income tax rates were replaced by a ‘flat’ and low rate of 13%.Payroll taxes were also affected. Before the reform, employers had to makecontributions –adding up to 38.5% of the gross salary– to four different socialfunds. Starting in 2001, these contributions were unified into a single socialtax with a regressive scale. If lower levels of taxation causally affect infor-mality, then such a comprehensive tax reform should have had a measurableimpact.
1In many Latin American countries, the share of informal employment exceeds 50% ofthe urban labor force (Gasparini and Tornarolli, 2007). Existing estimates for Sub-SaharanAfrica and Asia are even higher (Jutting et al., 2008).
2While the existence of a causal effect of taxation on informality is interesting in itsown right, it might not suffice to prove that the latter is voluntary. This is because, evenif informality is involuntary, lower tax rates could have an effect on it through channelsother than individual participation decisions. For example, lower taxes could motivate for-mal sector firms to expand employment. However, any such alternative channel would ingeneral affect both treatment and control groups. Thus, my empirical methodology iden-tifies the effect of taxation on informality that operates exclusively through participationdecisions.
2
I exploit the fact that the reform greatly reduced tax rates for upperincome brackets but left lower brackets almost unaffected, thereby creatingwell-defined treatment and control groups. The effect of the tax reform oninformality can be estimated following a differences-in-differences strategy.Intuitively, the differences in differences estimator captures the post-reformaverage drop in the probability of participating in the informal sector ex-perienced by the treatment group relative to the control group. I interpreta statistically and economically significant negative estimate as evidencethat the reduction in tax rates caused many individuals to choose to exitthe informal sector. Specifically, I find that, after controlling for observablecharacteristics and individual fixed effect, employed individuals who wereaffected by the tax reform were on average 2.5% less likely to be informalemployees and 4% less likely to perform informal irregular activities.3 Onthe extensive margin, I find that individuals who were not-employed rightbefore the reform and found a job in its aftermath were also less likely to beinformally employed.
The debate around the causes of informality has a long history. Sincethe early contributions to the literature in the 1970s to the present, therehave been two main theories of how and why the informal sector develops.4
According to the segmented labor markets view, the urban informal sectoris for the most part comprised of migrants from urban areas who failed tosecure a formal position in the modern sector. Labor market segmentationoccurs because of rigidities that prevent wages in the formal sector fromfalling in response to excess supply.5 In turn, it is typically assumed thatthere is a potentially infinite supply of labor originating in the traditionalrural sector. The only available adjustment mechanism is for firms to limitthe quantity of formal employment to the point where the marginal prod-uct of labor equals the mandated minimum wage. Those who are rationedout of the formal segment have the opportunity to take a job in the (freeentry) informal sector. The distinctive characteristic of this view is thatself-employment and other forms of informal employment are seen as un-conditionally worse than formal jobs. Workers only accept informality asa survival strategy while queueing up for a position in the modern sector.As long as the wage in the modern sector is kept artificially high, however,people in rural areas continue to find it worthwhile to migrate to the city,and the share of informal employment keeps growing.
3As I explain below, these estimates should be interpreted as lower bounds. I find noevidence that the tax reform affected informal entrepreneurs or informality in the secondjob. See table 8.
4For clarity of exposition I focus on the extreme cases. Fields (2005) suggests labormarkets in developing countries probably have elements of both theories.
5For example, in the influential Harris-Todaro (1970) model there is a minimum wagethat is enforced only in the formal urban sector. Other rigidities –an urban trade unionin Calvo (1978), for example– lead to similar results.
3
This pessimistic interpretation of the informal sector came under reviewafter the publication of De Soto’s (1990) book, which argued that informal-ity is a rational response to the labyrinth of useless state regulations andpermits required to do business in developing countries. In this alterna-tive view, labor markets are well-integrated (as opposed to segmented) andhence informal jobs must be, at the margin, not inferior to formal sector po-sitions. The formal-informal distinction is one between alternative bundlesof characteristics including income levels, risk, taxation and regulation in-tensity, access (or lack of access) to public goods, and non-monetary aspectssuch as “being one’s own boss”, “working for an important firm/brand”,etc. According to this view, those who choose self-employment and otherforms of informal work are doing the best they can given their endowmentsand preferences. They should be seen as individuals full of entrepreneurialspirit and skills and not as excluded or disadvantaged.
To my knowledge, this is the first empirical study that attempts to testthe competing theories by studying a natural experiment like the Russiantax reform.6 Previous work has, however, provided some evidence favoringthe integrated markets hypothesis. First, average earnings of self-employedindividuals are typically higher than those of formal salaried workers.7 More-over, once longitudinal data became available in developing countries it waspossible to document that workers moving out of self-employment and intoformal employment faced, on average, a significant decline in remuneration(and viceversa for those going from formal positions into self-employment).A higher monetary remuneration for the self-employed is prima facie hard toreconcile with the segmented labor markets story. However, because benefitsand other non-monetary aspects of the job are generally unobservable, it isnot possible to draw any hard conclusions from these earnings differentials.Moreover, the earnings of formal sector workers are typically higher thanthose of informal workers other than the self-employed, so the evidence isnot unambiguous even if monetary figures are taken at face value.
Second, the analysis of the relative frequency of transitions in and outof different employment statuses does not seem to hold up well with theidea that informal workers are queueing up for formal sector jobs. In fact,transitions in and out of formal sector positions seem to be roughly as fre-quent as those in and out of self-employment and other forms of informalemployment.8 While this evidence is somewhat persuasive, it is liable to thecriticism that transitions across sectors might be systematically different
6Using a similar methodology, Ivanova et al. (2005) and Gorodnichenko et al. (2009)documented positive effects of the reform on public revenue and tax compliance at thehousehold level but did not address the issue of informality in the labor market.
7This is specially true of self-employed professionals. See Gasparini and Tornarolli(2007).
8See Maloney (1999, 2004) for evidence on Latin American countries. Using a similarmethodology, Lehmann and Pignatti (2007) find mixed evidence in the case of Ukraine.
4
from transitions within the informal sector. For example, high transitionprobabilities between formal and informal positions could be simply dueto firms in the formal sector conducting evaluations of their workers’ per-formance relatively more frequently. It is not necessarily true that highturnover between the formal and the informal sectors implies absence of en-try barriers. This kind of objection cannot be raised against the differencesin differences estimates presented below. Moreover, as I show in section sixbelow, while prima facie transition data does not favor the integrated mar-kets hypothesis, a closer analysis that separates transitions by individualsin the treatment and control groups is clearly supportive of it.
Although I focus on informal employment, this paper is also closely re-lated to the burgeoning literature on the determinants of the size of the unof-ficial economy. The unofficial –also called shadow, hidden or underground–economy refers to the production, whether legal or illegal, of goods and ser-vices for the market that escapes detection in the official estimates of GDP(Schneider and Enste, 2000). While the definition and the units of mea-surement of informal employment are different, in practice there is a strongoverlap between the two concepts since a large proportion of informal workis probably not registered in official statistics and viceversa. Moreover, aswith informal employment, one widely accepted interpretation is that un-derground economic activity is a response to excessive involvement of theState in the economy in the form of intrusive regulations and high levelsof taxation. Among post-communist countries, there is evidence that onlythose which succeeded in limiting the political control of economic activity(at the same time as they improved the provision of key public goods nec-essary for the good functioning of markets) seem to have managed to keepthe growth of the unofficial economy under control (Johnson et al., 1997,McMillan and Woodruff, 2002).
Modern Russia seems like a perfect illustration of the theory linkingexcessive government intervention and the shadow economy. Russian man-agers face higher effective tax rates, worse bureaucratic corruption, greaterincidence of mafia protection, and have less faith in the court system thantheir peers in Slovakia, Poland and Romania, and that seems to go someway into explaining why Russia’s underground economy is relatively larger(Johnson et al., 2000). Also, Russia inherited an unregulated sector fromthe Soviet times. Grossman (1977) coined the term “second economy” forthe set of illegal and quasi-legal economic activities that individuals engagedin to put up with or exploit the severe rationing of goods and services undercommunism. Such activities encompassed the cultivation of small plots ofland, simple stealing from state enterprises, speculation, illicit productionat secondary occupations, and many others. In 1990, almost 15% of per-sonal income of workers and employees had informal sources (Kim, 2003).In other words, the incipient Russian market economy inherited the ability
5
to avoid regulation by the state when such regulation is too costly or other-wise excessive (Gerxhani, 2004, Guariglia and Kim, 2006). Using differentmethods and definitions, several studies have documented a rising share ofthe underground activity in Russia during the 1990s (Lacko, 2000).9
There are, however, reasons to believe that the statistical associationbetween excessive regulation and a growing unofficial sector is not causal.Firms might decide to operate underground mainly in order to avoid preda-tory behavior by government officials rather than regulations per se (John-son et al., 1998). If that is the case, then it is not so much the letter ofthe law –for example mandating high taxes– that influences informality butrather the discretional authority of administrative officials in the context ofa corrupt administrative system. To the extent that informal employmentis a good proxy for unofficial activities, my estimates of the effect of thetax reform can also be interpreted as a test of the theory that the shadoweconomy is a response to excessive regulation.
The paper is organized as follows. The next section is dedicated to thedefinition of informal employment and how it can be implemented given theavailable data. In section three I present a descriptive analysis of informalworkers in Russia using alternative data sources. Section four focuses on thestructure of the tax reform and the definition of the treatment and controlgroups. Section five presents the main results for the intensive and extensivemargins, as well as a number of robustness checks. In section six I conductan analysis of transition probabilities. Section seven concludes.
2 Informality Definition and Measurement
The main data source for this study is the Russian Longitudinal MonitoringSurvey (RLMS). In this section I briefly describe the RLMS and discuss myworking definition of informal employment.
2.1 Data and Variables
The RLMS is a household panel survey based on the first national proba-bility sample drawn in the Russian Federation.10. I use data from roundsVIII–XVIII of phase II of the RLMS, covering the period 1998–2009.11 In a
9These estimates put the size of hidden economy in the order of 40% of official RussianGDP.
10The RLMS is conducted by the Higher School of Economics and the “Demoscope”team in Russia, together with Carolina Population Center, University of North Carolinaat Chapel Hill.
11Phase II started in 1994 and has been conducted annually thereafter, with the excep-tion of the years 1997 and 1999. In RLMS parlance the first round of phase II is referredto as “round V” (this is because phase I comprised four rounds). While every round of
6

typical round, 10,000 individuals in 4,000 households are interviewed. Theseindividuals reside in 32 oblasts (regions) and 7 federal districts of the Rus-sian Federation. A series of questions about the household (referred to asthe “family questionnaire”) are answered by one householder selected asthe reference person. In turn, each adult in the household is interviewedindividually (the “adult questionnaire”).
The adult questionnaire includes questions regarding a primary and asecondary job. In addition, individuals are also asked whether they performwhat I will refer to as “irregular remunerated activities”. The exact phrasingof the questionnaire item is as follows: “Tell me, please: in the last 30 daysdid you engage in some additional kind of work for which you were paidor will be paid? Maybe you sewed someone a dress, gave someone a ridein a car, assisted someone with apartment or car repairs, purchased anddelivered food, looked after a sick person, sold purchased food or goods ina market or on the street, or did something else that you were paid for?”The questionnaire structure is such that no one may answer questions on asecondary job unless they have a primary job. However, questions on theirregular activities are independent.12
Figure 1 shows the employment and the unemployment rate, accordingto the RLMS and the standard labor force survey conducted by ROSTAT.While the two data sources display some minor discrepancies13, all seriesshow that the period under analysis was –at least labor market wise– one ofrelative economic prosperity and stability.
In order to gain further insight into the meaningfulness of my informalityvariables, I also make use of a special supplement of questions on informalwork (INFSUP14) that was added to the RLMS adult interview in 2009(round XVIII). The INFSUP questionnaire was administered to all employedindividuals after the regular interviews had been completed.15
2.2 Definition of Informal Employment
As has been clearly put in a recent book-length study by the World Bank:“The term informality means different things to different people, but al-
the RLMS is designed to be nationally representative, phase I and phase II cannot becombined for longitudinal analysis. Questions on informality were not asked until roundVIII.
12In fact, 8.5% of those considered employed only work doing irregular activities.13The ROSTAT labor force survey counts any form of work, including barter, as em-
ployment. It also asks employment-related questions regarding a reference week, whilethe RLMS asks about activities during the last month.
14The INFSUP was designed and financed by the Center for Labor Market Studies atthe Higher School of Economics in Moscow. I thank Vladimir Gimpelson for generouslymaking these data available.
15In rare opportunities, the INFSUP was administered on a later date than the regularquestionnaire, although always by the same interviewer.
7

Figure 1 – Employment and Unemployment Rates
0
10
20
30
40
50
60
1998 1999 2000 2001 2002 2003 2004 2005 2006 2007 2008 2009
RLMS Emp RLMS Unemp LFS Emp LFS Unemp
Notes: RLMS, rounds VIII–XVIII and ROSTAT labor force survey (1998–2009).
most always bad things: unprotected workers, excessive regulation, low pro-ductivity, unfair competition, evasion of the rule of law, underpayment ornonpayment of taxes, and work ‘underground’ or in the shadows.” (Perryet al., 2007) The idea of the informal sector was originally adopted andpopularized by economic anthropologist Keith Hart (1973) and a series ofstudies sponsored by the International Labour Office (ILO, 1972). Since thebeginning, the concept was meant to comprise heterogenous labor practicesincluding petty trading, self-employment of different sorts, own-account pro-fessionals, family workers, and other forms of non-standard (from a Westernperspective) work prevalent in developing countries. Moreover, many of theinitial bounds of the concept were eventually trespassed in one way or an-other. For example, while the informal sector was originally thought to bepredominantly urban, it was quickly accepted that it should also includesome forms of small-scale agricultural work. Despite these ambiguities –andpartly thanks to them– the concept has proved useful to researchers with awide range of interests.16
While the literature widely recognizes the blurry bounds of the concept,there are two most commonly used definitions of informality. On the onehand, the so called ‘productive’ definition focuses on a number of character-istics of the production unit (Hussmanns, 2004). First, informal sector en-terprises typically include only private unincorporated units, i.e. enterprisesnot constituted as separate legal entities independently of their owners. Sec-
16There are numerous reviews of the literature on the informal sector and informalemployment. See for example: Peattie (1987), Swaminathan (1991), and Jutting et al.(2008).
8
ond, at least part of the goods or services they produce is meant for sale orbarter. Lastly, their scale of operations is assumed to be very small. In fact,when better data is lacking, informal enterprises are often defined as thosewhose size in terms of employment is below a given threshold (typically lessthan 5 employees).
On the other hand, the ‘legalistic’ or social protection definition focuseson the status of workers in relation to labor law and the social safety net.It measures to what extent workers are effectively –as opposed to only dejure– protected by labor market institutions. Informal sector employmentoccurs in cases of noncompliance to the State in terms of labor regulationsand the social security system.
Table 1 – Working Definitions of Informal Work
Employed
Main Job
EntrepreneurFirm Owners†
FormalInformal
Individual Entrepreneur‡ Informal§
EmployeeFor Firm
Formal
Informal\
For Individual Entrepreneur Informal§
Second JobFormal
Informal[
Irregular ActivitiesFormal
Informal]
†Firm owners work for a firm or organization which they own and where they performentrepreneurial activities. Considered informal if unregistered.‡Individual entrepreneurs do entrepreneurial activities independently (not within a firmor organization).\Employees are considered informal if they are not registered.§Registration information is not available for those not working within firms or organiza-tions.[Informal in second job if unregistered or not working for a firm or organization.]Irregular activities involve remunerated work like sewing a dress for someone or givingsomeone a ride in a car. Considered informal if not employed under official contract oragreement.
In this paper I use both legalistic and productive criteria to determineif an individual is informally employed. Table 1 shows a schematic repre-sentation of the different employment types and my working definition ofinformality in each case. Throughout the paper, I analyze informality atthe main job, the secondary job and the remunerated irregular activitiesseparately.
At the main job, I start by distinguishing between entrepreneurs andemployees. The former group is composed of those doing entrepreneurialactivities who are either owners of firms or self-employed individuals whowork on their own account with or without employees but not at a firm or
9
organization.17 Following the productive definition, those not working atfirms or organizations are considered informal. For those working at firmsor organizations, the RLMS questionnaire includes an item that permitsdetermining whether they are registered, i.e. working officially.18 The Rus-sian labor code mandates that all employees sign a written contract anddeposit their ‘labor book’ with the employer. Therefore, following the socialprotection criterion, I classify unregistered entrepreneurs and employees asinformal.
Some firms in Russia register their employees but declare a fictitioussalary that is lower than the real amount in order to reduce the base ofpayroll and other taxes. The difference between the declared and the realsalary is settled with an “envelope payment” at the end of the month. If sucha practice were widespread, the registration criterion could err on the sideof underestimating the extent of informality. Fortunately, the 2009 roundof the RLMS included an item on envelope payments, which I use below toshow that this is probably not an important reason for concern.
While using the productive definition to classify all self-employed indi-viduals and their employees as informal is standard practice, it would bereassuring if the social protection criterion could be applied as well. Unfor-tunately, a limitation of the RLMS data is that non-enterprise individualsare not asked about registration, so it is not possible to apply the legalisticdefinition to them.19 However, thanks to the INFSUP we have some goodindication of the extent to which self-employed individuals comply with theregulations. As I show below, the level of compliance is quite low, so choos-ing between the legalistic and productive definition does not make a bigdifference for these workers. The supplementary questions also confirm thatthere is a high correlation between lack of registration and other forms ofnon-compliance with labor regulations.
In principle, the RLMS questionnaire contains enough detail to treat the
17This classification is based on four items of the adult questionnaire: 1) “do you workat an enterprise or organization? We mean any organization or enterprise where more thanone person works, no matter if it is private or state-owned. For example, any establish-ment, factory, firm, collective farm, state farm, farming industry, store, army, governmentservice, or other organization.” Enterprise workers are considered entrepreneurs if theyanswer positively to both 2) “Are you personally an owner or co-owner of the enterprisewhere you work?” and 3) “In your opinion, are you doing entrepreneurial work at thisjob?”. The distinction between entrepreneurs and employees for non-enterprise individu-als is based on: 4) “At this job are you...(a) involved in an employer’s or individual laboractivity or (b) work for a private individual?”
18The question is: “Tell me, please: are you employed in this job officially, in otherwords, by labor book, labor agreement, or contract?” This item was not included inround X (2001).
19Russian law does not require self-employed individuals to create a corporation orspecial legal entity. They are instead allowed to operate under a special and simplerregistration procedure. However, the obligation to sign a written contract and registeremployees applies to all employers without exception.
10
main and the second job symmetrically. However, the number of observa-tions would not be large enough for a meaningful statistical analysis of theresulting sub-categories. For example, only about 40 individuals per rounddo entrepreneurial activities in the second job. Therefore, a single cate-gory of informal work in the second job is considered, consisting of thoseunregistered20 plus those not working for a firm or organization.
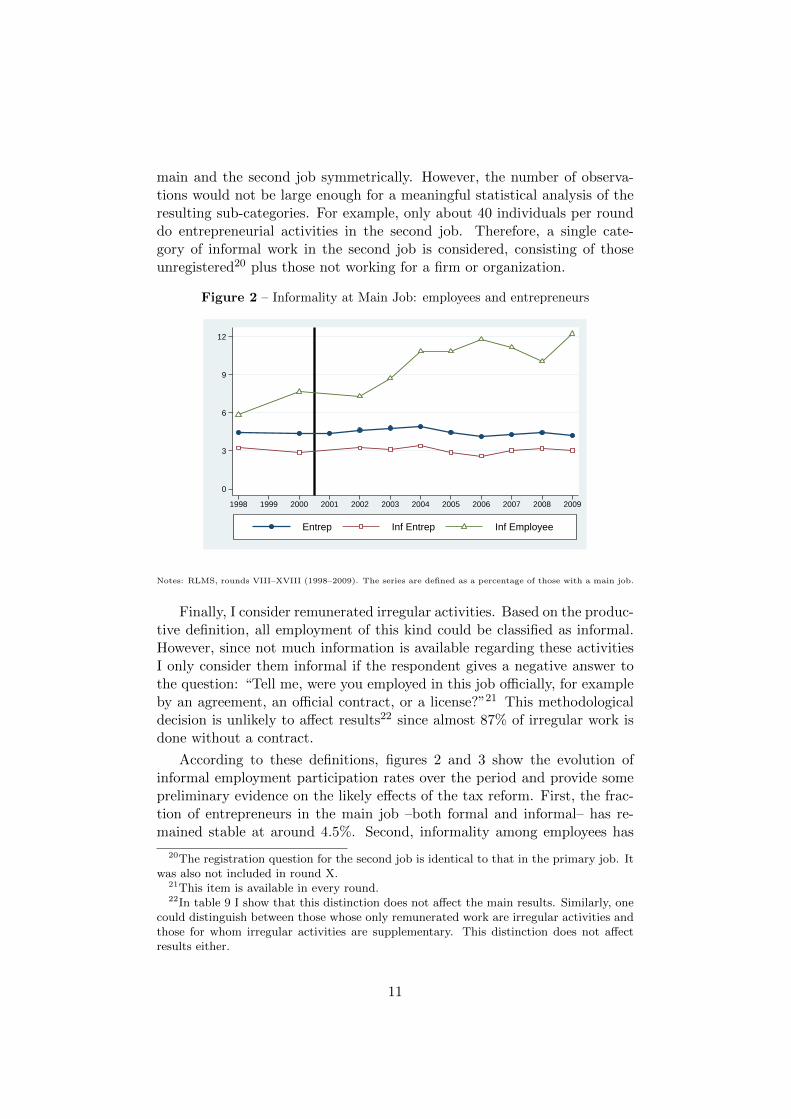
Figure 2 – Informality at Main Job: employees and entrepreneurs
0
3
6
9
12
1998 1999 2000 2001 2002 2003 2004 2005 2006 2007 2008 2009
Entrep Inf Entrep Inf Employee
Notes: RLMS, rounds VIII–XVIII (1998–2009). The series are defined as a percentage of those with a main job.
Finally, I consider remunerated irregular activities. Based on the produc-tive definition, all employment of this kind could be classified as informal.However, since not much information is available regarding these activitiesI only consider them informal if the respondent gives a negative answer tothe question: “Tell me, were you employed in this job officially, for exampleby an agreement, an official contract, or a license?”21 This methodologicaldecision is unlikely to affect results22 since almost 87% of irregular work isdone without a contract.
According to these definitions, figures 2 and 3 show the evolution ofinformal employment participation rates over the period and provide somepreliminary evidence on the likely effects of the tax reform. First, the frac-tion of entrepreneurs in the main job –both formal and informal– has re-mained stable at around 4.5%. Second, informality among employees has
20The registration question for the second job is identical to that in the primary job. Itwas also not included in round X.
21This item is available in every round.22In table 9 I show that this distinction does not affect the main results. Similarly, one
could distinguish between those whose only remunerated work are irregular activities andthose for whom irregular activities are supplementary. This distinction does not affectresults either.
11
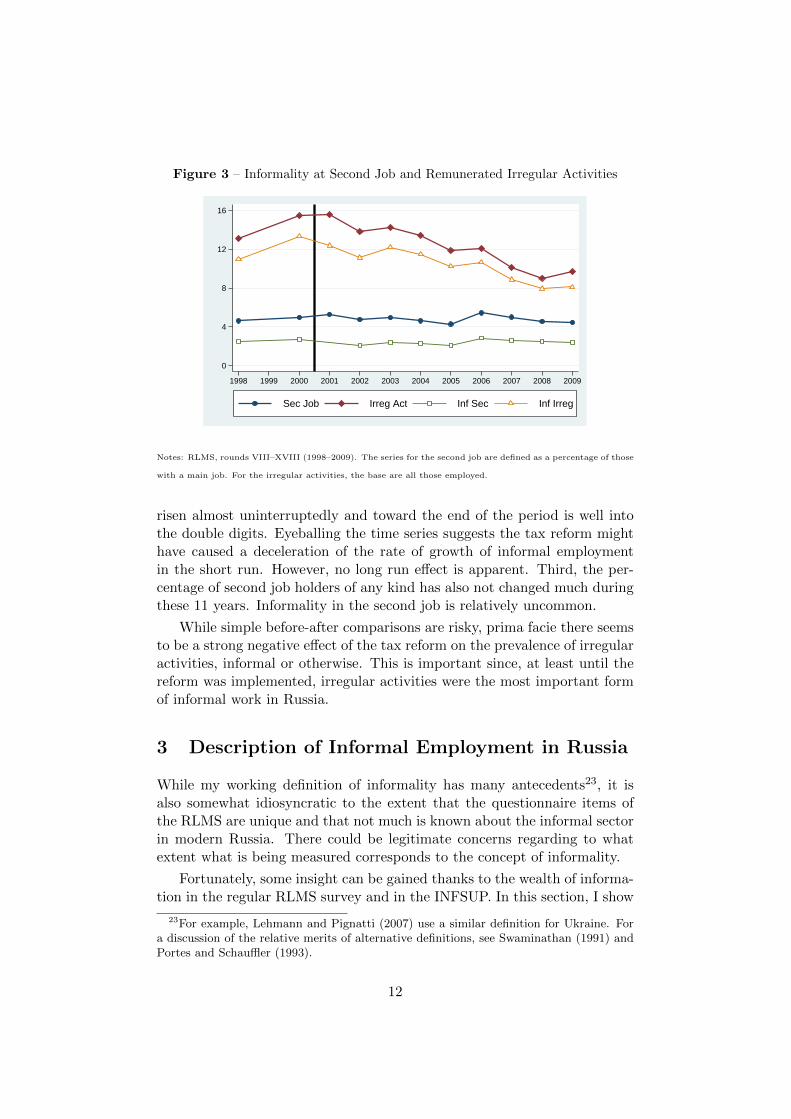
Figure 3 – Informality at Second Job and Remunerated Irregular Activities
0
4
8
12
16
1998 1999 2000 2001 2002 2003 2004 2005 2006 2007 2008 2009
Sec Job Irreg Act Inf Sec Inf Irreg
Notes: RLMS, rounds VIII–XVIII (1998–2009). The series for the second job are defined as a percentage of those
with a main job. For the irregular activities, the base are all those employed.
risen almost uninterruptedly and toward the end of the period is well intothe double digits. Eyeballing the time series suggests the tax reform mighthave caused a deceleration of the rate of growth of informal employmentin the short run. However, no long run effect is apparent. Third, the per-centage of second job holders of any kind has also not changed much duringthese 11 years. Informality in the second job is relatively uncommon.
While simple before-after comparisons are risky, prima facie there seemsto be a strong negative effect of the tax reform on the prevalence of irregularactivities, informal or otherwise. This is important since, at least until thereform was implemented, irregular activities were the most important formof informal work in Russia.
3 Description of Informal Employment in Russia
While my working definition of informality has many antecedents23, it isalso somewhat idiosyncratic to the extent that the questionnaire items ofthe RLMS are unique and that not much is known about the informal sectorin modern Russia. There could be legitimate concerns regarding to whatextent what is being measured corresponds to the concept of informality.
Fortunately, some insight can be gained thanks to the wealth of informa-tion in the regular RLMS survey and in the INFSUP. In this section, I show
23For example, Lehmann and Pignatti (2007) use a similar definition for Ukraine. Fora discussion of the relative merits of alternative definitions, see Swaminathan (1991) andPortes and Schauffler (1993).
12
that workers that are informal according to my definition have many of thecharacteristics found in other studies. I also present evidence that alterna-tive definitions, while reasonable, would probably not affect the results.
3.1 Demographics
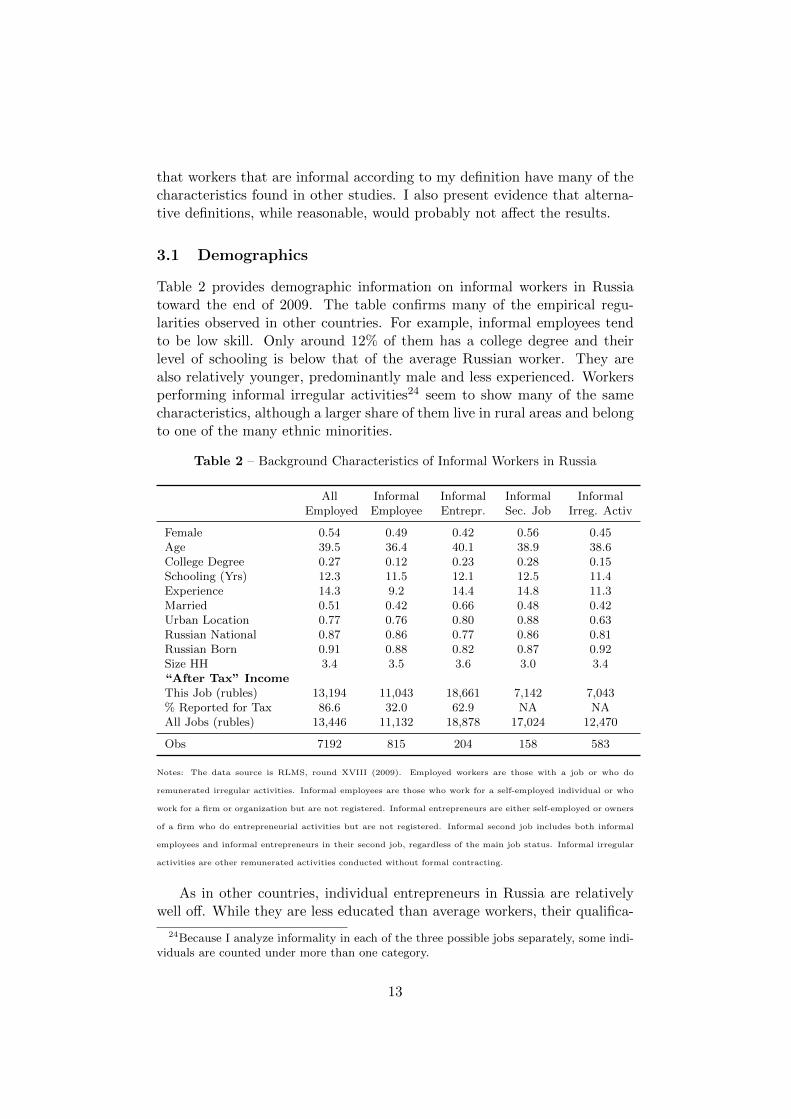
Table 2 provides demographic information on informal workers in Russiatoward the end of 2009. The table confirms many of the empirical regu-larities observed in other countries. For example, informal employees tendto be low skill. Only around 12% of them has a college degree and theirlevel of schooling is below that of the average Russian worker. They arealso relatively younger, predominantly male and less experienced. Workersperforming informal irregular activities24 seem to show many of the samecharacteristics, although a larger share of them live in rural areas and belongto one of the many ethnic minorities.
Table 2 – Background Characteristics of Informal Workers in Russia
AllEmployed
InformalEmployee
InformalEntrepr.
InformalSec. Job
InformalIrreg. Activ
Female 0.54 0.49 0.42 0.56 0.45Age 39.5 36.4 40.1 38.9 38.6College Degree 0.27 0.12 0.23 0.28 0.15Schooling (Yrs) 12.3 11.5 12.1 12.5 11.4Experience 14.3 9.2 14.4 14.8 11.3Married 0.51 0.42 0.66 0.48 0.42Urban Location 0.77 0.76 0.80 0.88 0.63Russian National 0.87 0.86 0.77 0.86 0.81Russian Born 0.91 0.88 0.82 0.87 0.92Size HH 3.4 3.5 3.6 3.0 3.4“After Tax” IncomeThis Job (rubles) 13,194 11,043 18,661 7,142 7,043% Reported for Tax 86.6 32.0 62.9 NA NAAll Jobs (rubles) 13,446 11,132 18,878 17,024 12,470
Obs 7192 815 204 158 583
Notes: The data source is RLMS, round XVIII (2009). Employed workers are those with a job or who do
remunerated irregular activities. Informal employees are those who work for a self-employed individual or who
work for a firm or organization but are not registered. Informal entrepreneurs are either self-employed or owners
of a firm who do entrepreneurial activities but are not registered. Informal second job includes both informal
employees and informal entrepreneurs in their second job, regardless of the main job status. Informal irregular
activities are other remunerated activities conducted without formal contracting.
As in other countries, individual entrepreneurs in Russia are relativelywell off. While they are less educated than average workers, their qualifica-
24Because I analyze informality in each of the three possible jobs separately, some indi-viduals are counted under more than one category.
13
tions are not as low as those of informal employees. Entrepreneurs are alsorelatively more likely to marry and form a family.
Individuals who participate in the informal sector through a secondaryjob also have higher than average incomes. In almost all other respects,however, they are difficult to distinguish from the average worker.
The 2009 round of the RLMS included an item on “envelope payments”.25
Formal employees answered that 92% of their earnings were reported to taxauthorities. In turn, informal employees and individual entrepreneurs con-fessed having payed taxes on a significantly lower fraction of earning. Whileresponses to such sensitive issues cannot be taken at face value, the highcorrelation between informality and declared tax avoidance is reassuring.
Tables 14 and 15 in the appendix show that informal workers overwhelm-ingly belong to unskilled and service occupations, and work in the trade andconstruction industries. This is consistent with the idea that informal work-ers work in occupations/industries with low barriers to entry –i.e. requiringalmost no start-up capital or specific knowledge.
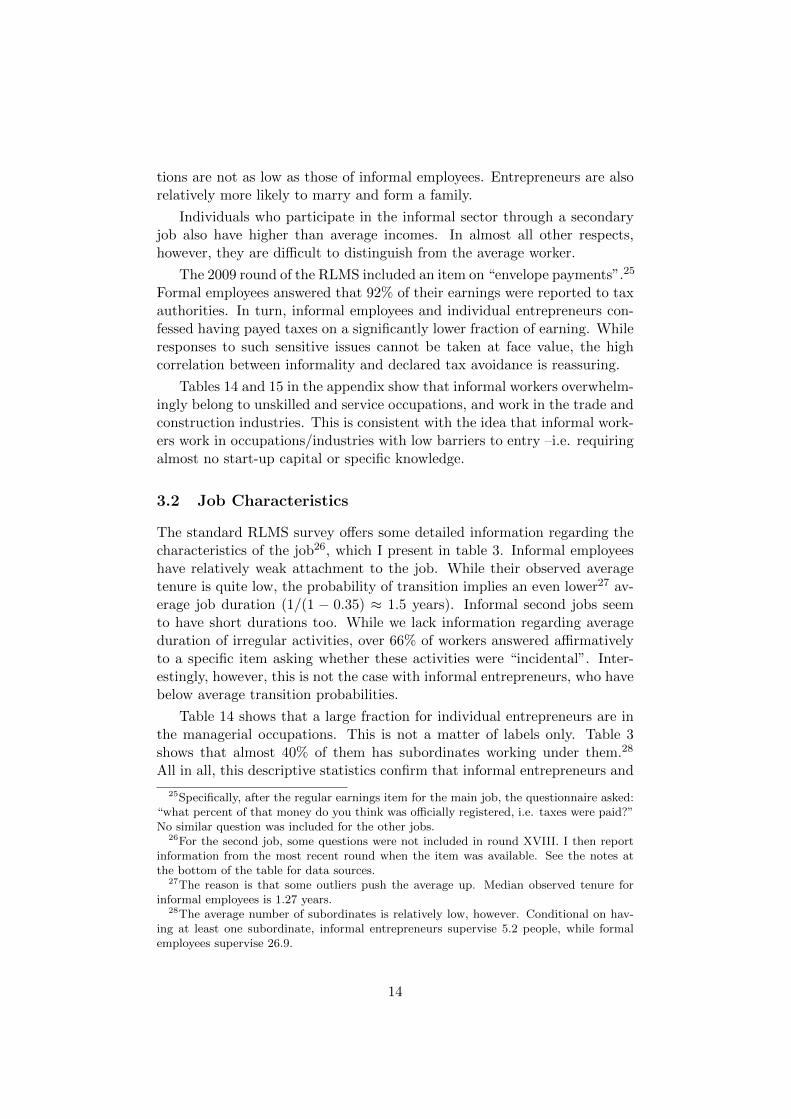
3.2 Job Characteristics
The standard RLMS survey offers some detailed information regarding thecharacteristics of the job26, which I present in table 3. Informal employeeshave relatively weak attachment to the job. While their observed averagetenure is quite low, the probability of transition implies an even lower27 av-erage job duration (1/(1 − 0.35) ≈ 1.5 years). Informal second jobs seemto have short durations too. While we lack information regarding averageduration of irregular activities, over 66% of workers answered affirmativelyto a specific item asking whether these activities were “incidental”. Inter-estingly, however, this is not the case with informal entrepreneurs, who havebelow average transition probabilities.
Table 14 shows that a large fraction for individual entrepreneurs are inthe managerial occupations. This is not a matter of labels only. Table 3shows that almost 40% of them has subordinates working under them.28
All in all, this descriptive statistics confirm that informal entrepreneurs and
25Specifically, after the regular earnings item for the main job, the questionnaire asked:“what percent of that money do you think was officially registered, i.e. taxes were paid?”No similar question was included for the other jobs.
26For the second job, some questions were not included in round XVIII. I then reportinformation from the most recent round when the item was available. See the notes atthe bottom of the table for data sources.
27The reason is that some outliers push the average up. Median observed tenure forinformal employees is 1.27 years.
28The average number of subordinates is relatively low, however. Conditional on hav-ing at least one subordinate, informal entrepreneurs supervise 5.2 people, while formalemployees supervise 26.9.
14
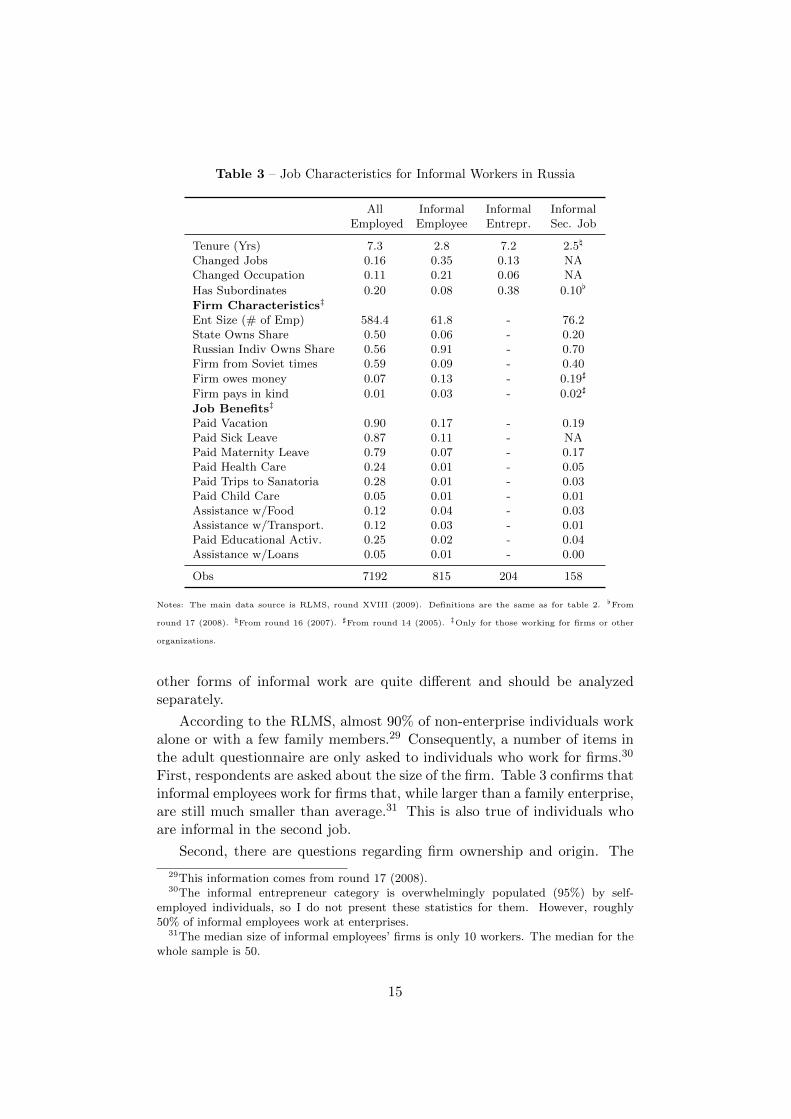
Table 3 – Job Characteristics for Informal Workers in Russia
AllEmployed
InformalEmployee
InformalEntrepr.
InformalSec. Job
Tenure (Yrs) 7.3 2.8 7.2 2.5\
Changed Jobs 0.16 0.35 0.13 NAChanged Occupation 0.11 0.21 0.06 NA
Has Subordinates 0.20 0.08 0.38 0.10[
Firm Characteristics‡
Ent Size (# of Emp) 584.4 61.8 - 76.2State Owns Share 0.50 0.06 - 0.20Russian Indiv Owns Share 0.56 0.91 - 0.70Firm from Soviet times 0.59 0.09 - 0.40
Firm owes money 0.07 0.13 - 0.19]
Firm pays in kind 0.01 0.03 - 0.02]
Job Benefits‡
Paid Vacation 0.90 0.17 - 0.19Paid Sick Leave 0.87 0.11 - NAPaid Maternity Leave 0.79 0.07 - 0.17Paid Health Care 0.24 0.01 - 0.05Paid Trips to Sanatoria 0.28 0.01 - 0.03Paid Child Care 0.05 0.01 - 0.01Assistance w/Food 0.12 0.04 - 0.03Assistance w/Transport. 0.12 0.03 - 0.01Paid Educational Activ. 0.25 0.02 - 0.04Assistance w/Loans 0.05 0.01 - 0.00
Obs 7192 815 204 158
Notes: The main data source is RLMS, round XVIII (2009). Definitions are the same as for table 2. [From
round 17 (2008). \From round 16 (2007). ]From round 14 (2005). ‡Only for those working for firms or other
organizations.
other forms of informal work are quite different and should be analyzedseparately.
According to the RLMS, almost 90% of non-enterprise individuals workalone or with a few family members.29 Consequently, a number of items inthe adult questionnaire are only asked to individuals who work for firms.30
First, respondents are asked about the size of the firm. Table 3 confirms thatinformal employees work for firms that, while larger than a family enterprise,are still much smaller than average.31 This is also true of individuals whoare informal in the second job.
Second, there are questions regarding firm ownership and origin. The
29This information comes from round 17 (2008).30The informal entrepreneur category is overwhelmingly populated (95%) by self-
employed individuals, so I do not present these statistics for them. However, roughly50% of informal employees work at enterprises.
31The median size of informal employees’ firms is only 10 workers. The median for thewhole sample is 50.
15
issue of informality and the shadow economy in Russia is often discussed inthe context of the transition from the Soviet system (Johnson et al., 1997,McMillan and Woodruff, 2002). A familiar argument is that the incipientcapitalist sector makes use of informal arrangements to escape confiscatoryintrusions by the State. The data is consistent with this story. The in-volvement of the Russian State in the economy is very substantial. This isreflected not only in the relatively high prevalence of state ownership, butalso in the fact that almost 60% of employment in Russia is still supplied byenterprises that originate in Soviet times. Informal employment is, however,almost exclusively provided by new private firms.
A third important set of questions touch on the issue of wage arrears.Faced with a negative shock, firms in Russia often choose to adjust via delay-ing the payment of wages (Lehmann et al., 1999, Gimpelson and Kapeliush-nikov, 2011). Predictably, table 3 shows that wage arrears and payments inkind happen relatively more frequently to informal employees.
Finally, the RLMS asks enterprise workers regarding fringe benefits. Paidvacation, sick leave, and maternity leave are mandatory benefits accordingto the labor code and a large majority of employees claim to have them.However, many firms do not provide these benefits in practice. For exam-ple, only 66% of those employed had actually been on paid vacation in theprevious 12 months, compared to the 90% who claim to have entitlement. Inany case, the proportion of informal employees who are given the mandatorybenefits is substantially lower than average.32 Non-mandatory benefits areinfrequent in Russia, and almost non-existent for informal employees.
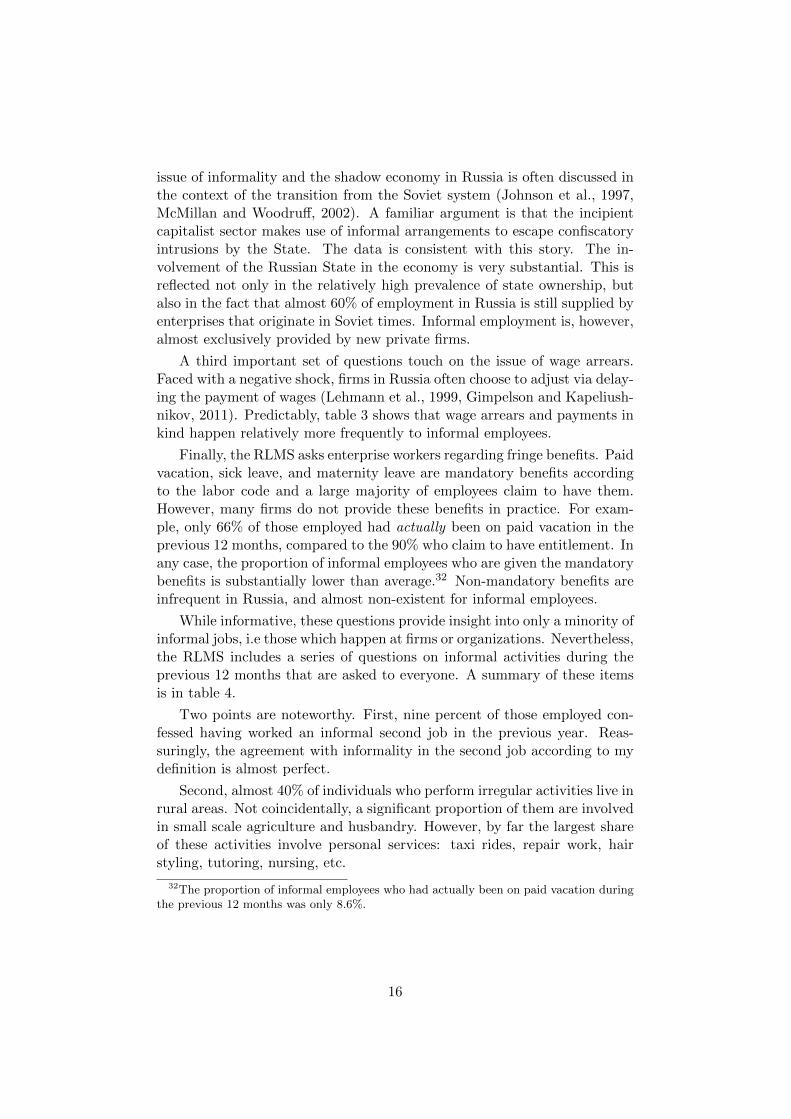
While informative, these questions provide insight into only a minority ofinformal jobs, i.e those which happen at firms or organizations. Nevertheless,the RLMS includes a series of questions on informal activities during theprevious 12 months that are asked to everyone. A summary of these itemsis in table 4.
Two points are noteworthy. First, nine percent of those employed con-fessed having worked an informal second job in the previous year. Reas-suringly, the agreement with informality in the second job according to mydefinition is almost perfect.
Second, almost 40% of individuals who perform irregular activities live inrural areas. Not coincidentally, a significant proportion of them are involvedin small scale agriculture and husbandry. However, by far the largest shareof these activities involve personal services: taxi rides, repair work, hairstyling, tutoring, nursing, etc.
32The proportion of informal employees who had actually been on paid vacation duringthe previous 12 months was only 8.6%.
16
Table 4 – Informal Activities Last Year
AllEmployed
InformalEmployee
InformalEntrepr.
InformalSec. Job
Inf. Irreg.Activ
Worked extra job 0.09 0.08 0.08 0.96 0.33Raised cattle for sale 0.04 0.03 0.04 0.03 0.14Agric. on own plot for sale 0.04 0.02 0.03 0.04 0.14Performed services for pay 0.08 0.08 0.06 0.11 0.61
Obs 7192 815 204 158 583
Notes: The data sources is RLMS round XVIII.
3.3 Compliance with the Law
Table 5 contains statistics based on answers to the INFSUP. An importantcautionary note is that the INFSUP consisted of a stand-alone questionnairethat was administered to all individuals who had any form of employment.Respondents answered informality-related questions about two jobs (hence-forth33 job-A and job-B). Unfortunately, these jobs are not certain to corre-spond to those of the standard adult questionnaire.34 I proceed as follows.I assume that the information about job-A corresponds to the main job ifsuch a job is present. For individuals without a main job, I assume job-Amust refer to (the main) remunerated irregular activity. In fact, all statis-tics on informal irregular activities are based on the latter group. Finally, Iassume that job-B refers to the secondary job as long as the individual doesnot also perform irregular activities. This is the source of information oninformal secondary jobs.
A second issue is that the INFSUP asks a different set of questionsregarding job-A depending on whether the individual is an entrepreneur oran employee. While for the most part individuals who identify themselves asentrepreneurs in the INFSUP are also classified as such based on the adultquestionnaire, the correspondence is not perfect. I base the statistics onlyon individuals for whom the classifications coincide.
A positive spillover is that the INFSUP provides us with some idea of thecomposition of remunerated irregular activities. A stunning 40% of theseworkers consider themselves entrepreneurs.
Working under an oral agreement is strictly forbidden under Russianlabor law. The INFSUP asks all employees in job-A whether they have awritten contract. This questions is important for validating my workingdefinition of informality, since the adult questionnaire only has registration
33I reserve the terms ‘main job’ and ‘secondary job’ to refer to the adult questionnaire-based categories.
34The most significant concern arises for individuals who, according to the adult ques-tionnaire, performed both a second job and irregular activities.
17

Table 5 – Compliance with the Law
Sup for employees AllEmployed
InformalEmployee
InformalSec. Job
Inf. Irreg.Activ
Under oral agreement 0.11 0.69 0.81\ 0.96]
% Labor Law Compliace 83.1 52.9 NA 53.2]
% Contract Compliance 86.1 64.3 NA 65.5]
% of Inc Declared for SS 87.6 31.2 NA 10.5]
Obs 6453 777 80 186
Sup for entrepreneurs AllEmployed
FormalEntrep
InformalEntrepr.
Inf. Irreg.Activ
Unregistered 0.48 0.03 0.27 0.98]
% Labor Law Compliance 64.4 85.9 53.6 21.3]
% Contract Compliance 66.3 87.5 55.5 27.5]
% Formal Employees 64.0 85.7 53.4 8.3]
Contributes to SS fund 0.47 0.95 0.60 0.06]
Obs 397 64 194 126
Notes: The data sources are RLMS round XVIII and the supplementary questionnaire on informality by the
Center of Labor Market Studies, Higher School of Economics (2009). \Based on job-B answers by individuals
who do not perform irregular activities. ]Based on job-A answers by individuals who do not have a main job.
information for enterprise workers in the main job. Remarkably, over 97%of those who work under an oral agreement according to the INFSUP areclassified as either informal employees or individuals whose only source ofincome originates in informal irregular activities.
The supplement also asks employees about the extent to which theiremployers comply with labor law and the specifics of the individual laborcontract or agreement. These items are interesting because registrationis only one of the many mandates of labor law. The average workplacehas compliance levels well over 80%. Informal workers report significantlylower levels of compliance. These figures are consistent with the finding(table 3) that absence of mandatory benefits and wage arrears are morefrequent for informal employees. Finally, employees are also asked about thepercentage of their earnings that is reported for social security purposes. Ingeneral, responses are very much in agreement with a similar item in theRLMS adult questionnaire (table 2). Thanks to the INFSUP, however, wehave information on those performing irregular activities. Predictably, taxcompliance is extremely low for this kind of jobs.
The questionnaire for entrepreneurs provides information regarding reg-istration of business operations. In Russia, the self-employed can eitherregister individually or as a company. While some form of registration isnecessary to operate formally, it is unclear whether it is sufficient. Practi-cally all of the few formal entrepreneurs in the RLMS sample are registered
18
according to the INFSUP. Moreover, 64% of registrations are in the formof incorporated businesses. On the other extreme, individuals performingirregular activities are overwhelmingly unregistered. In between, a majorityof those classified as informal entrepreneurs in the main job are registered,but only 17% of them have an incorporated business.
Entrepreneurs are also asked a number of questions regarding their em-ployees. On one hand, in formal firms labor law and contract compliance ishigh, the share of informal work is low and contributions to social securityare very frequent. Informal entrepreneurs, on the other hand, confess tomuch lower levels of compliance, specially in the irregular activities sector.
Overall, the information in the regular adult questionnaire of the RLMSand the INFSUP confirm that my working definition of informality is mean-ingful and that informal workers in Russia share many of the characteristicsdocumented in other countries.
4 The Tax Reform
In January 2001, Russia introduced a radical reform of its tax system. Themain components of the reform are shown in table 6. A number of changesinvolved the personal income tax (PIT). Before 2001, the PIT had a pro-gressive scale with marginal rates starting at 12% and reaching 30%. Thenew system fixed a flat and low rate of 13%. The reform touched otheraspects of the PIT. The standard allowance was slightly increased, from3,168 to 4,800 rubles but now could only be claimed by those earning lessthan 20,000 rubles. Also, the number of permissible deductions and otherloopholes was greatly limited.
Before the reform, employers were supposed to make separate contribu-tions –adding up to 38.5% of the gross salary– to four independent socialfunds. The reform replaced this system with a unified social tax (ST) witha regressive scale. It also eliminated the 1% employee contribution to thesocial fund.
Overall, the message of the reform was unambiguous. The governmentwas offering a new deal to the Russian public: lower taxation levels and amore reasonable system. In exchange, it expected higher levels of compli-ance. The response from the public has been widely regarded as positive.Tax compliance improved significantly and government revenue increaseddespite the lower average tax rates (Ivanova et al., 2005, Gorodnichenkoet al., 2009).
19
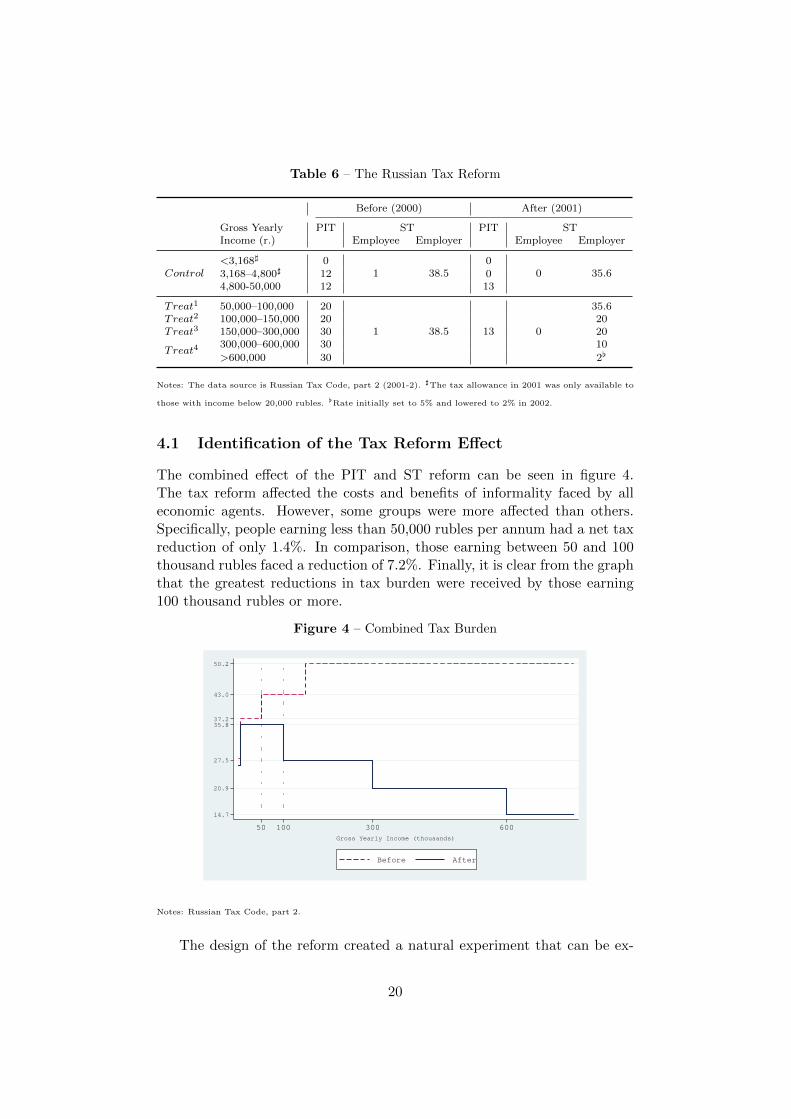
Table 6 – The Russian Tax Reform
Before (2000) After (2001)
Gross Yearly PIT ST PIT STIncome (r.) Employee Employer Employee Employer
Control<3,168] 0
1 38.50
0 35.63,168–4,800] 12 04,800-50,000 12 13
Treat1 50,000–100,000 20
1 38.5 13 0
35.6Treat2 100,000–150,000 20 20Treat3 150,000–300,000 30 20
Treat4300,000–600,000 30 10
>600,000 30 2[
Notes: The data source is Russian Tax Code, part 2 (2001-2). ]The tax allowance in 2001 was only available to
those with income below 20,000 rubles. [Rate initially set to 5% and lowered to 2% in 2002.
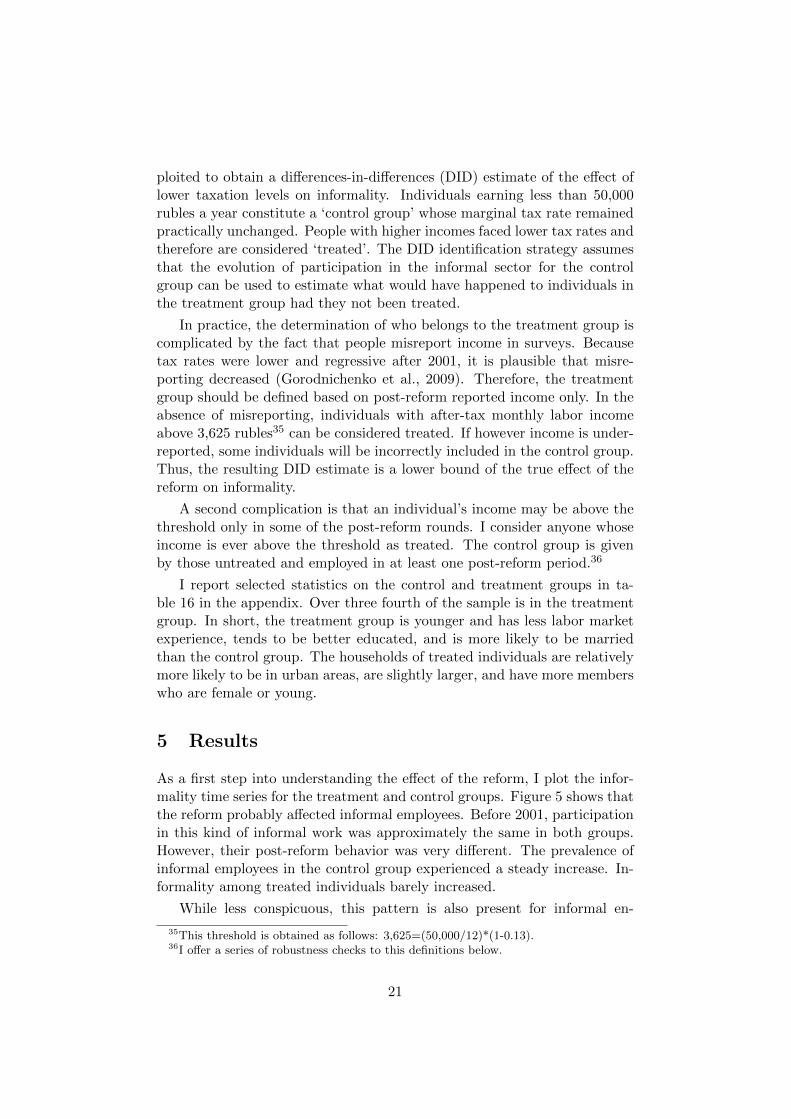
4.1 Identification of the Tax Reform Effect
The combined effect of the PIT and ST reform can be seen in figure 4.The tax reform affected the costs and benefits of informality faced by alleconomic agents. However, some groups were more affected than others.Specifically, people earning less than 50,000 rubles per annum had a net taxreduction of only 1.4%. In comparison, those earning between 50 and 100thousand rubles faced a reduction of 7.2%. Finally, it is clear from the graphthat the greatest reductions in tax burden were received by those earning100 thousand rubles or more.
Figure 4 – Combined Tax Burden
14.7
20.9
27.5
35.837.2
43.0
50.2
50 100 300 600
Gross Yearly Income (thousands)
Before After
Notes: Russian Tax Code, part 2.
The design of the reform created a natural experiment that can be ex-
20
ploited to obtain a differences-in-differences (DID) estimate of the effect oflower taxation levels on informality. Individuals earning less than 50,000rubles a year constitute a ‘control group’ whose marginal tax rate remainedpractically unchanged. People with higher incomes faced lower tax rates andtherefore are considered ‘treated’. The DID identification strategy assumesthat the evolution of participation in the informal sector for the controlgroup can be used to estimate what would have happened to individuals inthe treatment group had they not been treated.
In practice, the determination of who belongs to the treatment group iscomplicated by the fact that people misreport income in surveys. Becausetax rates were lower and regressive after 2001, it is plausible that misre-porting decreased (Gorodnichenko et al., 2009). Therefore, the treatmentgroup should be defined based on post-reform reported income only. In theabsence of misreporting, individuals with after-tax monthly labor incomeabove 3,625 rubles35 can be considered treated. If however income is under-reported, some individuals will be incorrectly included in the control group.Thus, the resulting DID estimate is a lower bound of the true effect of thereform on informality.
A second complication is that an individual’s income may be above thethreshold only in some of the post-reform rounds. I consider anyone whoseincome is ever above the threshold as treated. The control group is givenby those untreated and employed in at least one post-reform period.36
I report selected statistics on the control and treatment groups in ta-ble 16 in the appendix. Over three fourth of the sample is in the treatmentgroup. In short, the treatment group is younger and has less labor marketexperience, tends to be better educated, and is more likely to be marriedthan the control group. The households of treated individuals are relativelymore likely to be in urban areas, are slightly larger, and have more memberswho are female or young.
5 Results
As a first step into understanding the effect of the reform, I plot the infor-mality time series for the treatment and control groups. Figure 5 shows thatthe reform probably affected informal employees. Before 2001, participationin this kind of informal work was approximately the same in both groups.However, their post-reform behavior was very different. The prevalence ofinformal employees in the control group experienced a steady increase. In-formality among treated individuals barely increased.
While less conspicuous, this pattern is also present for informal en-
35This threshold is obtained as follows: 3,625=(50,000/12)*(1-0.13).36I offer a series of robustness checks to this definitions below.
21
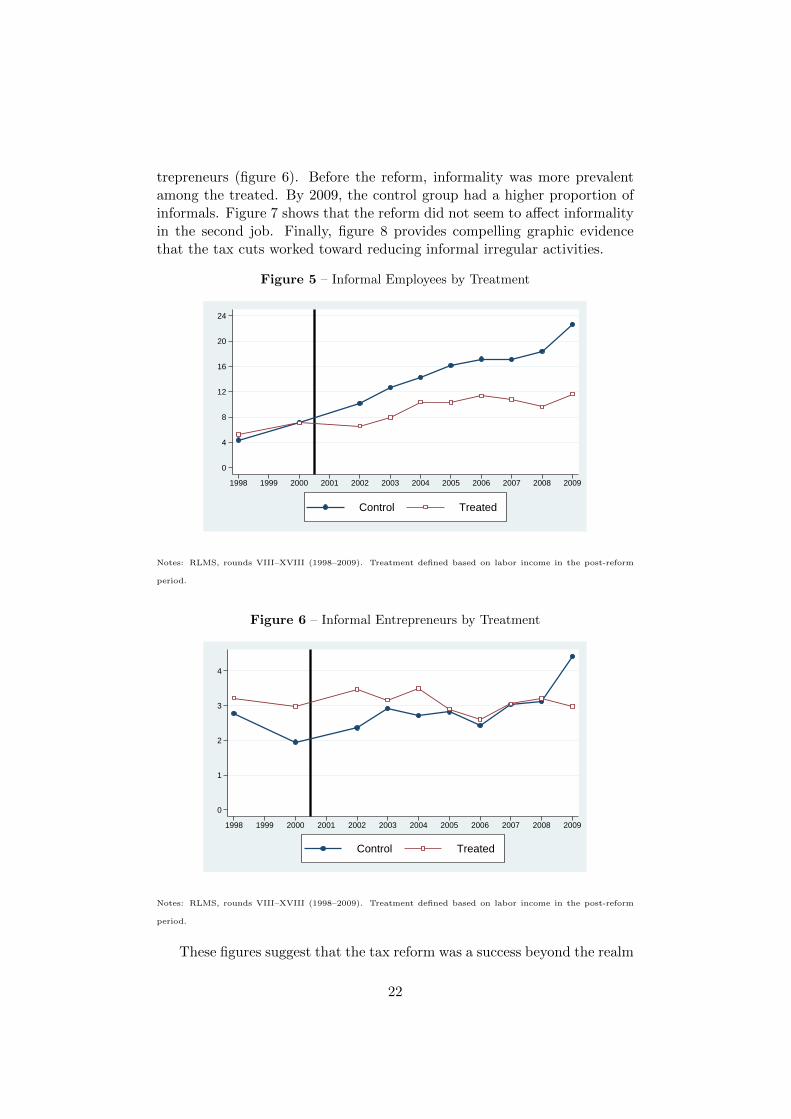
trepreneurs (figure 6). Before the reform, informality was more prevalentamong the treated. By 2009, the control group had a higher proportion ofinformals. Figure 7 shows that the reform did not seem to affect informalityin the second job. Finally, figure 8 provides compelling graphic evidencethat the tax cuts worked toward reducing informal irregular activities.
Figure 5 – Informal Employees by Treatment
0
4
8
12
16
20
24
1998 1999 2000 2001 2002 2003 2004 2005 2006 2007 2008 2009
Control Treated
Notes: RLMS, rounds VIII–XVIII (1998–2009). Treatment defined based on labor income in the post-reform
period.
Figure 6 – Informal Entrepreneurs by Treatment
0
1
2
3
4
1998 1999 2000 2001 2002 2003 2004 2005 2006 2007 2008 2009
Control Treated
Notes: RLMS, rounds VIII–XVIII (1998–2009). Treatment defined based on labor income in the post-reform
period.
These figures suggest that the tax reform was a success beyond the realm
22
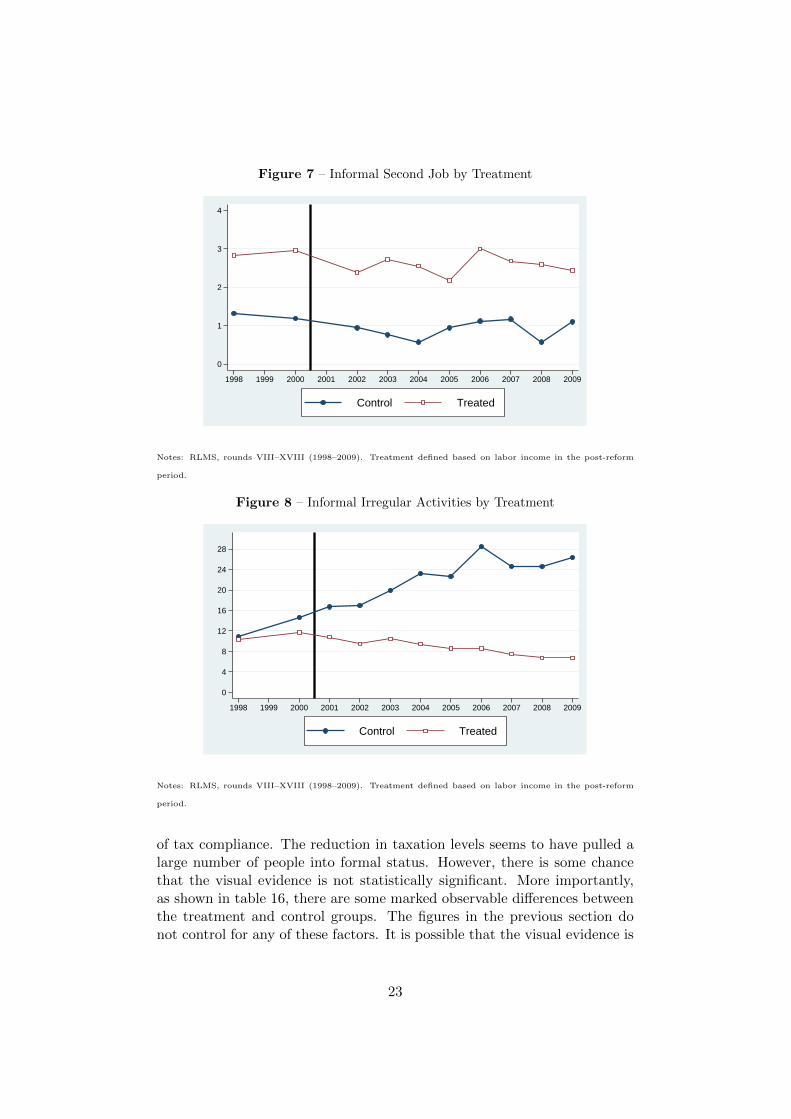
Figure 7 – Informal Second Job by Treatment
0
1
2
3
4
1998 1999 2000 2001 2002 2003 2004 2005 2006 2007 2008 2009
Control Treated
Notes: RLMS, rounds VIII–XVIII (1998–2009). Treatment defined based on labor income in the post-reform
period.
Figure 8 – Informal Irregular Activities by Treatment
0
4
8
12
16
20
24
28
1998 1999 2000 2001 2002 2003 2004 2005 2006 2007 2008 2009
Control Treated
Notes: RLMS, rounds VIII–XVIII (1998–2009). Treatment defined based on labor income in the post-reform
period.
of tax compliance. The reduction in taxation levels seems to have pulled alarge number of people into formal status. However, there is some chancethat the visual evidence is not statistically significant. More importantly,as shown in table 16, there are some marked observable differences betweenthe treatment and control groups. The figures in the previous section donot control for any of these factors. It is possible that the visual evidence is
23
an artifact of spurious correlation.
In order to obtain statistical evidence on the effect of the reform andcontrol for the possible confounding effect of observable characteristics, Iestimate the following DID equation:
INFit = θt +Xitβ + Ziγ + ψPostt + µTreati + α(Treati × Postt) + uit(1)
where INFit is one of the informality-related dependent variables, θt aretime dummies, Xit and Zi represent sets of time-varying and time-invariantindividual characteristics respectively, Postt is a post-reform dummy, Treatiis the treatment group indicator, and uit is the error term. The main objectof interest is α, the DID parameter that measures the average change in theprobability of informal status for the treatment group relative to the controlgroup, conditional on all the observables.
Table 7 presents OLS estimates of equation (1). I report Arellano (1987)standard errors that allow for heteroscedasticity and autocorrelation of ar-bitrary form.37 The main identifying assumption of OLS-DID is that noneof the unobservable characteristics that influence informality participationare correlated with treatment status.
The results provide further confirmation that the tax reform reducedthe prevalence of informal employees. On one hand, after controlling for allobservable individual and household characteristics and for any macroeco-nomic shocks absorbed by the year dummies, the expected probability ofinformal status for the control group was 8% higher in the period after thereform. In contrast, informality grew 4% less among those facing lower levelsof taxation. These estimates are statistically significant despite the robuststandard errors. Finally, the coefficients for the control variables have theexpected signs. Informality is less likely among women, Russian nationals,and high-skill and married workers.
The effect of the reform on informal irregular activities is estimated tobe 7.2%. This is a very large effect considering that the overall share ofworkers in this category was just above 13% in 2000.
As anticipated, the regression results also show that the effect on informalentrepreneurs and informality in the second job was neither economically norstatistically significant. I conclude that the reform did not have a strongimpact on these groups.
The reduction in the share of informal employment among wage andsalary workers and those performing irregular activities could be due toomitted variable bias. Specifically, it could be the case that unobservable
37This is one of the recommended approaches for DID studies (Bertrand et al., 2004).
24
Table 7 – The Effect of Tax Reform on Informality: DID OLS
Inf Employee Inf Entrep Inf Sec Job Inf Irreg Act
Household CharacteristicsNumber of Members -0.0006 0.0003 -0.0054*** -0.0033
(0.002) (0.002) (0.001) (0.002)Number of Female Members 0.0059* -0.0027 0.0018 0.0039
(0.003) (0.002) (0.001) (0.003)Number of Youth, 18- -0.0090*** 0.0057** 0.0058*** 0.0129***
(0.003) (0.002) (0.001) (0.003)Number of Elderly, 65+ -0.0106** -0.0003 -0.0024 -0.0050
(0.004) (0.003) (0.002) (0.004)Urban Location 0.0043 0.0178*** 0.0045 -0.0228***
(0.008) (0.006) (0.003) (0.009)Individual CharacteristicsFemale -0.0189*** -0.0161*** -0.0001 -0.0555***
(0.004) (0.003) (0.002) (0.004)Russian National -0.0096** -0.0106*** 0.0006 -0.0011
(0.004) (0.004) (0.002) (0.004)Age 0.0025 0.0087*** -0.0012 -0.0008
(0.002) (0.001) (0.001) (0.002)
Age2/100 0.0056** -0.0060*** 0.0006 0.0158***(0.003) (0.002) (0.001) (0.003)
Experience -0.0117*** -0.0043*** 0.0017*** -0.0111***(0.001) (0.001) (0.000) (0.001)
Experience2/100 0.0056** 0.0011 -0.0027*** -0.0048**(0.003) (0.002) (0.001) (0.002)
Secondary Sch Comp -0.0026 0.0053 0.0007 -0.0190***(0.007) (0.005) (0.003) (0.007)
Vocat Sch Comp -0.0023 -0.0044 -0.0000 -0.0171*(0.010) (0.006) (0.005) (0.010)
Tech Sch Comp -0.0349*** 0.0021 0.0011 -0.0484***(0.007) (0.004) (0.003) (0.007)
College Comp -0.0942*** -0.0077 0.0036 -0.0751***(0.007) (0.005) (0.004) (0.007)
Grad Level Comp -0.1270*** -0.0198*** 0.0224** -0.1244***(0.010) (0.007) (0.011) (0.016)
Married -0.0248*** 0.0012 -0.0040** -0.0335***(0.003) (0.002) (0.002) (0.003)
DID EstimatesPost 0.0774*** 0.0017 -0.0026 0.0089
(0.010) (0.007) (0.005) (0.010)Treat 0.0109 0.0072 0.0112*** -0.0049
(0.007) (0.005) (0.004) (0.009)Treat×Post -0.0427*** -0.0060 -0.0010 -0.0722***
(0.009) (0.006) (0.004) (0.010)
Region Dummies[ YES YES YES YES
Year Dummies[ YES YES YES YESConstant 0.1475*** -0.1544*** 0.0649*** 0.2299***
(0.042) (0.027) (0.017) (0.039)
Obs 44,452 44,452 44,452 53,769
R2 0.061 0.022 0.012 0.115
Notes: RLMS, rounds VIII–XVIII (1998–2009). Definitions are as in table 2. Arellano (1987) robuststandard errors in parentheses allow for heteroscedasticity and auto-correlation of arbitrary form. Omitted
category is no educational degree. [Thirty-eight regional dummies, including Moscow and St Petersburg,and nine year dummies were included but not reported. ***p < 0.01, **p < 0.05, *p < 0.1.
characteristics of people in the control group systematically differed fromthose of individuals that were treated. The panel structure of the RLMScan be used to control for individual heterogeneity by relying on within-individual changes only. The key identifying assumption of the fixed effectsmodel is that the effect of unobservables is constant over time. Formally,this is stated by assuming that the error term in equation (1) can be writtenas: uit = ci + εit, where ci is the constant individual heterogeneity and εitis an idiosyncratic error term with zero mean conditional on treatment, theother covariates, and the individual heterogeneity.38 As is well-known, the
38That is, E[ε | X,Z, Post, T reat, c] = 0.
25
price to be paid for the robustness of the fixed effects estimator is that noneof the parameters of the time-constant regressors are identified.
Table 8 – The Effect of Tax Reform on Informality: DID FE
Informal Employee Informal Irreg Activ Any Informal Employment
Household CharacteristicsNumber of Members 0.0010 -0.0088*** -0.0121***
(0.003) (0.003) (0.004)Number of Female Members -0.0040 0.0083 0.0095
(0.005) (0.005) (0.007)Number of Youth, 18- -0.0003 0.0112*** 0.0105**
(0.004) (0.004) (0.005)Number of Elderly, 65+ -0.0100* 0.0005 -0.0011
(0.006) (0.006) (0.008)Individual CharacteristicsAge -0.0091 -0.0135* -0.0062
(0.010) (0.008) (0.012)
Age2/100 0.0130*** 0.0173*** 0.0213***(0.004) (0.004) (0.005)
Experience -0.0025 -0.0048*** -0.0061***(0.002) (0.002) (0.002)
Experience2/100 -0.0008 0.0006 -0.0013(0.003) (0.003) (0.004)
Secondary Sch Com -0.0053 -0.0066 0.0037(0.010) (0.009) (0.011)
Vocat Sch Comp -0.0113 -0.0075 -0.0029(0.011) (0.010) (0.013)
Tech Sch Comp -0.0132* -0.0214*** -0.0174*(0.008) (0.007) (0.010)
College Comp -0.0276** -0.0394*** -0.0506***(0.011) (0.011) (0.015)
Grad Level Comp -0.0321* -0.0704*** -0.0649*(0.019) (0.025) (0.034)
Married -0.0086** -0.0098*** -0.0137***(0.004) (0.004) (0.005)
DID EstimatesPost 0.0495 0.0350 -0.0315
(0.099) (0.075) (0.119)Treat×Post -0.0250** -0.0403*** -0.0584***
(0.010) (0.010) (0.014)
Year Dummies[ YES YES YESConstant 0.2799 0.4481* 0.2996
(0.306) (0.232) (0.365)
Obs 44,452 53,769 47,718# of Indiv 11,263 12,411 11,969
R2 Overall 0.04 0.03 0.01
Notes: RLMS, rounds VIII–XVIII (1998–2009). Any informal employment includes informality at themain job, the second job or irregular activities. Other definitions are as in table 2. Arellano (1987) robuststandard errors in parentheses allow for heteroscedasticity and auto-correlation of arbitrary form. Omitted
category is no educational degree. [Nine year dummies were included but not reported. ***p < 0.01,**p < 0.05, *p < 0.1.
Table 8 presents the fixed effects estimation results for equation (1). Theeffect on informal employees is now estimated as -2.5%, while the effect oninformal irregular activities is -4.0%. Both results are still statistically sig-nificant. Attenuation in the absolute size of the coefficients is a frequent oc-currence with fixed effects estimates, since within-individual variation is rel-atively more sensitive to measurement error (Griliches and Hausman, 1986).I interpret these results as indication that, while unobservable ability biasmight be a factor influencing the OLS estimates, the tax reform indeed madeinformality less desirable.
Rather than reflecting a real reduction in overall informality, the resultsin this section could be illusory if the tax reform pushed individuals fromone form of informal employment into others. To check against this perverse
26
case, I estimate the same equation for an index of overall informality. Theestimates in the third column of table 8 suggest that, if anything, the resultsfor the detailed informality categories are conservative.
5.1 Robustness Checks
In table 9, I present estimates of the tax reform effect under alternativespecifications.39 I also provide estimates for all irregular activities (contrac-tual or otherwise) and for informal irregular activities as exclusive source ofearnings.
In order to control for changes in characteristics at the regional level–such as local tax enforcement efforts, financial markets, etc– I add to theequation interactions between the 39 districts and the year dummies. In-cluding these additional controls does not affect the results significantly.
Table 9 – Robustness Checks
InformalEmployee
InformalIrreg Activ
Any InformalEmployment
AllIrregular
Activ
InformalIrreg Activas Main Job
Baseline -0.0250** -0.0403*** -0.0584*** -0.0421*** -0.0343***(0.010) (0.010) (0.014) (0.010) (0.009)
Including interactions -0.0246** -0.0337*** -0.0467*** -0.0373*** -0.0295***District× Y ear (0.011) (0.010) (0.015) (0.011) (0.009)
Control group excludes -0.0256** -0.0408*** -0.0588*** -0.0427*** -0.0350***unreported income (0.010) (0.010) (0.014) (0.011) (0.009)
Treatment defined using -0.0363** -0.0219** -0.0708*** -0.0339** -0.0219**income from all sources (0.014) (0.011) (0.019) (0.013) (0.011)
Treat× Trend[ -0.0063** -0.0148*** -0.0187*** -0.0159*** -0.0137***(0.003) (0.003) (0.003) (0.003) (0.003)
Placebo Reform] -0.0008 0.0128 0.0251 0.0055 -0.0074(0.012) (0.015) (0.019) (0.016) (0.010)
Notes: RLMS, rounds VIII–XVIII (1998–2009). Arellano (1987) robust standard errors in parenthesesallow for heteroscedasticity and auto-correlation of arbitrary form. “All irregular activities” includesthose done under contract. “Informal irregular activities as main job” excludes individuals with any other
form of remunerated work. [Includes a post-reform time trend (2000 = 1) instead of the post-reform
dummy. ]The placebo “reform” estimates are obtained by assuming that a similar change in the tax codehappened between rounds 8 and 9 (it did not). All other covariates are the same as in table 8. ***p < 0.01,**p < 0.05, *p < 0.1.
I also try a number of modifications in the definitions of the treatmentand control groups. First, I exclude from the analysis individuals whoselabor income is never reported, which under my baseline definition fell inthe control group. Second, I define treatment based on an alternative incomeitem in the adult questionnaire. This alternative includes income from allsources –some of them non-taxable– and is therefore not entirely appropriateto define treatment.40 Nevertheless, it is reassuring to verify that the main
39To save space I omit all other covariates.40The question is: “What is the total amount of money that you received in the last 30
days? Please include everything: wages, retirement pensions, premiums, profits, materialaid, incidental earnings, and other receipts, including foreign currency, but convert thecurrency into rubles.”
27
results hold with this alternative definition. Finally, I obtain an estimate ofthe effect of the reform on the time trend of informality in the post-reformperiod. This final specification implies a much larger overall effect. Forexample, by 2009 the reform is predicted to have reduced informal irregularactivities by 1.5 × 8 = 12%.
The final set of estimates in table 9 correspond to a placebo regression.I (wrongly) assume that a similar tax reform happened some time betweenrounds 8 and 9 of the RLMS. The new “treatment” variable equals one ifthe individual is in the upper income brackets (> 50, 000 rubles) in round9. In the table are fixed effects estimates of equation (1) using the lattertreatment definition. As expected, none of the estimates are significantlydifferent from zero and most have the wrong sign.
5.2 Detailed Treatment Groups
The tax reform affected individuals with annual earnings of 50,000 rublesor more. However, the effect was heterogeneous even within this group. Inparticular, as figure 4 shows, those in relatively higher tax brackets experi-enced a larger reduction in marginal tax rates. It is natural to expect thatthe effect of the reform was stronger for them.
Following this intuition, I define four detailed treatment variables thatdistinguish among individuals with after-tax monthly earnings in the fol-lowing intervals: 3,625–7,250, 7,250–10,875, 10,875–21,750, and 21,750+. Irefer to these variables as Treat1 through Treat4 respectively.41 Naturallysome individuals fall into different brackets in different periods. I opera-tionalize the definition so that the groups are mutually exclusive.42 I thenre-specify the DID equation as follows:
INFit = θt +Xitβ + Ziγ + ψPostt +4∑
h=1
µhTreathi + (2)
+4∑
h=1
αh(Treathi × Postt) + uit
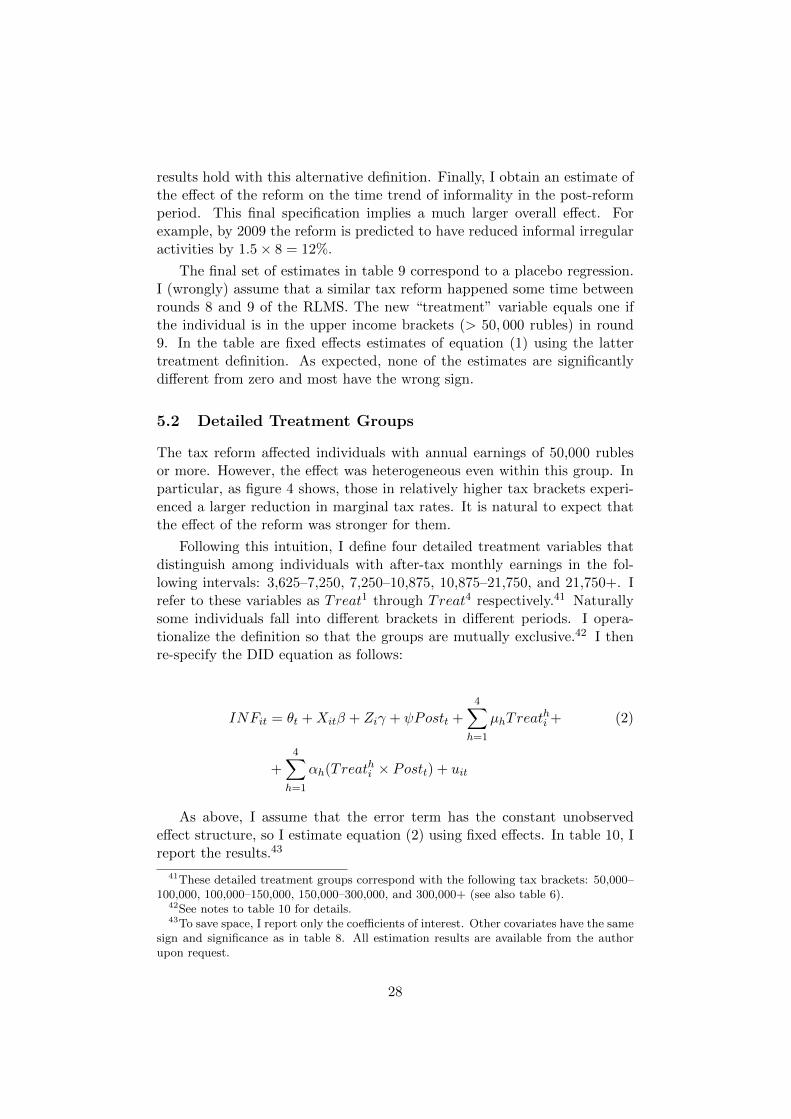
As above, I assume that the error term has the constant unobservedeffect structure, so I estimate equation (2) using fixed effects. In table 10, Ireport the results.43
41These detailed treatment groups correspond with the following tax brackets: 50,000–100,000, 100,000–150,000, 150,000–300,000, and 300,000+ (see also table 6).
42See notes to table 10 for details.43To save space, I report only the coefficients of interest. Other covariates have the same
sign and significance as in table 8. All estimation results are available from the authorupon request.
28
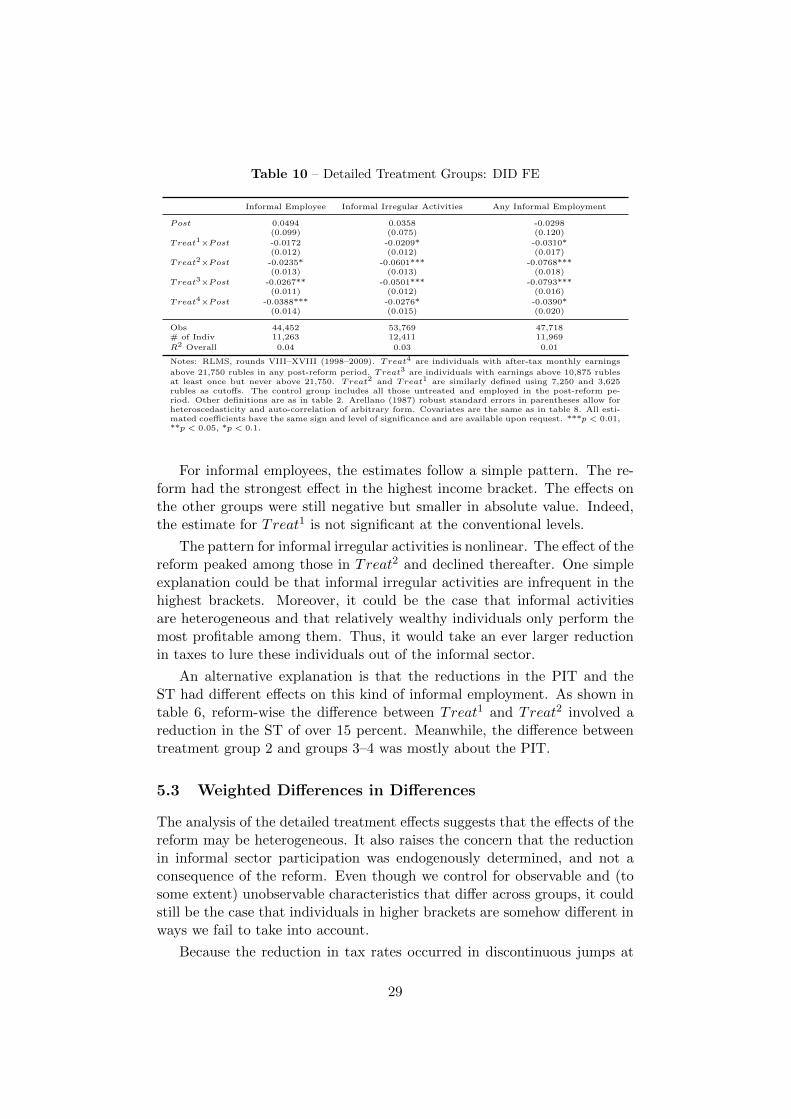
Table 10 – Detailed Treatment Groups: DID FE
Informal Employee Informal Irregular Activities Any Informal Employment
Post 0.0494 0.0358 -0.0298(0.099) (0.075) (0.120)
Treat1×Post -0.0172 -0.0209* -0.0310*(0.012) (0.012) (0.017)
Treat2×Post -0.0235* -0.0601*** -0.0768***(0.013) (0.013) (0.018)
Treat3×Post -0.0267** -0.0501*** -0.0793***(0.011) (0.012) (0.016)
Treat4×Post -0.0388*** -0.0276* -0.0390*(0.014) (0.015) (0.020)
Obs 44,452 53,769 47,718# of Indiv 11,263 12,411 11,969
R2 Overall 0.04 0.03 0.01
Notes: RLMS, rounds VIII–XVIII (1998–2009). Treat4 are individuals with after-tax monthly earnings
above 21,750 rubles in any post-reform period. Treat3 are individuals with earnings above 10,875 rublesat least once but never above 21,750. Treat2 and Treat1 are similarly defined using 7,250 and 3,625rubles as cutoffs. The control group includes all those untreated and employed in the post-reform pe-riod. Other definitions are as in table 2. Arellano (1987) robust standard errors in parentheses allow forheteroscedasticity and auto-correlation of arbitrary form. Covariates are the same as in table 8. All esti-mated coefficients have the same sign and level of significance and are available upon request. ***p < 0.01,**p < 0.05, *p < 0.1.
For informal employees, the estimates follow a simple pattern. The re-form had the strongest effect in the highest income bracket. The effects onthe other groups were still negative but smaller in absolute value. Indeed,the estimate for Treat1 is not significant at the conventional levels.
The pattern for informal irregular activities is nonlinear. The effect of thereform peaked among those in Treat2 and declined thereafter. One simpleexplanation could be that informal irregular activities are infrequent in thehighest brackets. Moreover, it could be the case that informal activitiesare heterogeneous and that relatively wealthy individuals only perform themost profitable among them. Thus, it would take an ever larger reductionin taxes to lure these individuals out of the informal sector.
An alternative explanation is that the reductions in the PIT and theST had different effects on this kind of informal employment. As shown intable 6, reform-wise the difference between Treat1 and Treat2 involved areduction in the ST of over 15 percent. Meanwhile, the difference betweentreatment group 2 and groups 3–4 was mostly about the PIT.
5.3 Weighted Differences in Differences
The analysis of the detailed treatment effects suggests that the effects of thereform may be heterogeneous. It also raises the concern that the reductionin informal sector participation was endogenously determined, and not aconsequence of the reform. Even though we control for observable and (tosome extent) unobservable characteristics that differ across groups, it couldstill be the case that individuals in higher brackets are somehow different inways we fail to take into account.
Because the reduction in tax rates occurred in discontinuous jumps at
29
different income thresholds, it would in principle be possible to analyze theeffect of the reform in a regression discontinuity framework. There are, how-ever, not enough individuals in the RLMS to apply the RD method mean-ingfully. An alternative approach involves weighting observations by thedistance of reported earnings from the threshold of 50,000 rubles.44 Specif-ically, the weighted differences-in-differences estimand is:
n∑i=1
ωi [INFit − θt −Xitβ − ψPostt − α(Treati × Postt) − uit]2 (3)
where ωi is the individual weight and I omit the time-constant regres-sors. The weights are a decreasing function of the distance of the indi-vidual’s post-reform income from the threshold at 50,000 rubles. Specif-ically, given reported monthly income Yit, the weights are calculated asK(Yit−3625h )/
∑ni=1K(Yit−3625h ), where K(·) is a Gaussian kernel and h is
the optimal bandwidth.45 I interpret the resulting weighted differences indifferences estimates as robustness check in the spirit of regression discon-tinuity, since individuals with incomes close to the threshold are probablyrelatively closer in terms of all unobservable characteristics.
Table 11 – Weighted DID with FE
Informal Employee Informal Irregular Activities Any Informal Employment
Post -0.0658 0.0245 -0.1852(0.121) (0.063) (0.141)
Treat×Post -0.0178 -0.0329* -0.0546**(0.019) (0.019) (0.027)
Obs 41,930 50,914 45,134
R2 Overall 0.005 0.03 0.001# of Indiv 10,180 11,220 10,856
Notes: RLMS, rounds VIII–XVIII (1998–2009). Treatment effect estimated by a weighted fixed effectsregression. Included covariates are the same as in table 8. Arellano (1987) robust standard errors inparentheses allow for heteroscedasticity and auto-correlation of arbitrary form. ***p < 0.01, **p < 0.05,*p < 0.1.
Table 11 reports the estimation results for equation (3) with individualfixed effects. The estimates are fairly close to those in table 8. The number ofobservations goes down because of a number of individuals who are assignedzero weights, which is the intended effect of the strategy. As a consequence,including the weights almost doubles the standard errors of the treatmentinteraction term.
44This approach was first suggested in Gorodnichenko et al. (2009). See also Duncanand Sabirianova Peter (2009).
45h = 0.9 σ5√n and σ is the smaller amount between the standard deviation of reported
income and the inter-quartile range.
30
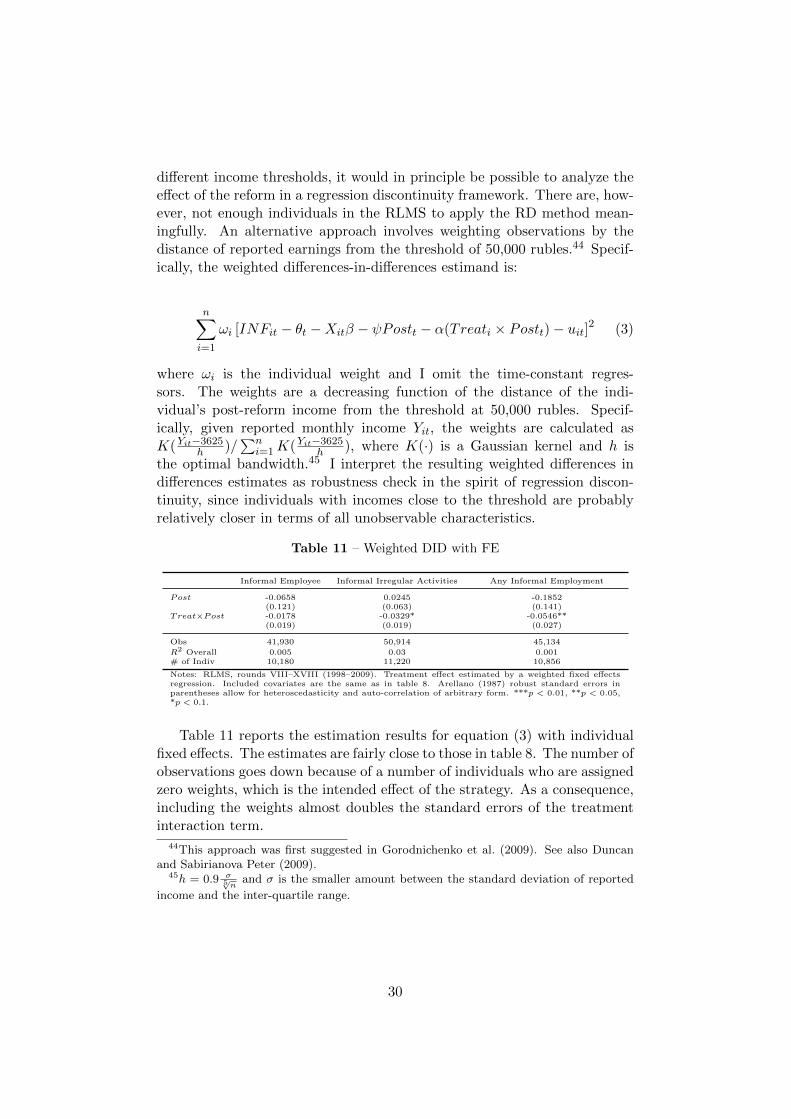
5.4 The Extensive Margin
So far, all estimates of the effect of the reform on informality have implicitlyrelied on individual transitions in and out of informal employment. How-ever, an alternative route through which the reform might have affectedinformality is by changing the probability of choosing a formal job for thosethat were unemployed before the reform and found employment in the post-reform period.
Table 12 – Tax Reform Effect on the Extensive Margin
InformalEmployee
Informal IrregActiv
Any InformalEmployment
A. BaselinePost 0.2740*** 0.4429*** 0.5704***
(0.093) (0.058) (0.114)Treat×Post -0.0146 -0.1433*** -0.1355***
(0.025) (0.023) (0.027)
Obs 21,224 24,924 22,899# of Indiv 7,339 8,080 7,709
R2 Overall 0.027 0.016 0.054
B. Robustness TestsIncluding District× Y ear interactions -0.0111 -0.1467*** -0.1357***
(0.025) (0.023) (0.028)Treatment defined using income from all sources -0.0314 -0.0948*** -0.1242***
(0.029) (0.026) (0.031)Control group excludes unreported income -0.0121 -0.1387*** -0.1310***
(0.025) (0.023) (0.027)
Treat× Trend[ -0.0007 -0.0212*** -0.0197***(0.004) (0.004) (0.005)
Notes: RLMS, rounds VIII–XVIII (1998–2009). Sample restricted to those unemployed just before thereform and who were employed at least once in the post-reform period. The dependent variable is set to
zero in round 9. Round 8 is excluded. [Includes a post-reform time trend (2000 = 1) instead of the post-reform dummy. All other covariates are the same as in table 8. Arellano (1987) robust standard errors inparentheses allow for heteroscedasticity and auto-correlation of arbitrary form. ***p < 0.01, **p < 0.05,*p < 0.1.
In order to estimate the effect of the reform on the extensive margin,I restrict the sample to individuals who were unemployed in round 9 butfound employment some time during the post-reform period.
The top panel of table 12 reports estimation results for the baselinefixed effect specification. I interpret these estimates as the predicted changeinduced by the reform in the probability of informal employment, otherthings constant, and conditional46 on finding employment in the post-reformperiod.
The tax reform significantly reduced the probability of informal irregularactivities for new jobs. Specifically, individuals in the treated group were
46Duncan and Sabirianova Peter (2009) study the effect of the reform on the extensivemargin of employment in general (independently of formal status). Using the same DIDmethodology, they find that the expected probability of finding a job in the post-reformperiod was significantly higher for individuals in the treated group. The estimated effect isbetween 0.09 and 0.14, depending on whether they use a male or female sample. However,these estimates require extrapolating earnings for individuals not employed throughout thepost-reform period in order to assign them to treatment or control. This is not necessaryfor investigating the effect on informality, conditional on employment.
31
over 14% less likely to choose this form of informal employment relative tothe control group. The estimate for informal employment in the main jobis negative but not statistically significant. Finally, the effect on the overallinformality indicator was similar to that on irregular activities.
In the bottom panel of the table I report some robustness tests (compa-rable to those in table 9). In general, the results reinforce the message thatthe reform had a strong effect on the extensive margin for irregular activities,while for informal employees the effect was probably not significant.
6 Did lower taxes push people into formality, pullthem out of informality, or both?
The tax reform significantly reduced participation in informal irregular ac-tivities and, to a smaller extent, in informal employment at the main job.In principle, the impact of the reform could have taken two avenues: anincrease in the relative flow of workers into formal employment or a slow-down of the flow into informality. In this section I try to assess the relativeimportance of each.
In order to consistently account for all labor market flows, I divide work-ers into six mutually exclusive and exhaustive categories: not-in-the-labor-force, unemployed, formally employed (either working for others or as anentrepreneur), informal employees, informal entrepreneurs, and employed inirregular activities only (IAO).47 Using this classification, table 17 in theappendix reports overall patterns of mobility in the Russian labor marketbetween rounds 9 and 11 of the RLMS.
The study of labor market transitions in a developing economy has animportant antecedent in Maloney (1999), which argued that patterns ofworker mobility are better than sectoral earnings differentials for investigat-ing the extent of dualism in the labor market. Maloney argued that thedifferent sectors of the labor market were well integrated Mexico. First, heobserved relatively high turnover rates in the formal salaried sector, with animplied average duration (tenure) of formal positions of 5.7 years. For theself-employed, average duration was in the same ball park at 4 years. Sec-ond, he showed that —after appropriate normalization— transitions intoand out of formal and informal positions were of similar magnitude. To-gether with other evidence, these two points made a strong case against the
47Informal employees and entrepreneurs are defined as above. The consolidation offormal employees and entrepreneurs is due to the low number of transitions into and outof the latter category. For the same reason, the IAO category includes all workers doingirregular activities regardless of registration or official contracting. The classification isbased on the main job only, and so irregular activities done in parallel with a main jobare not taken into account in the classification.
32
dualist model of the labor market.
Table 17 shows that the same methodology would lead to different con-clusions for the Russian labor market. First, the implied duration of formalsector jobs is much higher than that found in Mexico.48 Moreover, all of theinformal sector categories have markedly lower probabilities of permanence.Note this is not an artifact of the level of aggregation (3 informal categoriesvs only one formal). Consolidating all informal categories gives a probabilityof permanence of 0.41 (implied duration of 3.37 years).49
Second, even after the normalizations50 suggested by Maloney, the flowsacross sectors do not seem to lend support to the hypothesis of integratedmarkets. In general, flows from the informal sector into the formal sectorseem more frequent than the reverse. Furthermore, workers coming fromnon-employment seem to prefer the formal sector over any of the informalalternatives.
The relative longer duration of formal jobs is even higher among workersbetween 25 and 60 years of age.51 This suggests that, once they have founda formal job, Russian workers rarely move to the informal sector. All in all,Russian transition data does not seem to lead to conclusions similar to thosein Maloney (1999).
Table 13 presents the same type of transition data, this time disaggre-gated into treatment and control groups as determined by the flat tax reformin 2001.52 We apply the same normalization steps to the disaggregated ma-trices, only that in this case we use the overall terminal sector distributionand overall durations (from table 17) for normalization.53 Conditional ontreatment, it is still generally the case that flows from informal and intoformal status are larger than the reverse. Also, workers coming out of non-employment seem to prefer the formal over the informal sector.54
48For each labor market state, this is calculated as 2/(1− pii) since we are consideringtransitions between rounds two years apart. Because we cannot considering within-sectorturnover, this is an estimate of tenure in the sector and not at a job.
49Lehmann and Pignatti (2007) find a similar asymmetry in the implied durations ofinformal and formal sector tenure using two rounds of the Ukrainian Longitudinal Moni-toring Survey (2003–4).
50First, we normalize transition probabilities between sectors by the size of the desti-nation cell (second panel of table 17). This makes flows in both directions between twosectors comparable. Second, in order to make all flows comparable, each cell is multipliedby the churning rates in the origin and destination state (bottom panel).
51These results are not included to save space but are available upon request.52More precisely, these transitions are a disaggregation from a subset of all transitions
presented in table 17. The subset corresponds to individuals who were employed at leastonce during the post-reform period and for whom, accordingly, it is possible to determinetreatment status.
53This is the correct procedure as long as segmentation does not occur across treatmentstatus.
54The main exceptions to these observations are flows into irregular activities in thecontrol group, specially for those that were out of the labor force in 2000.
33
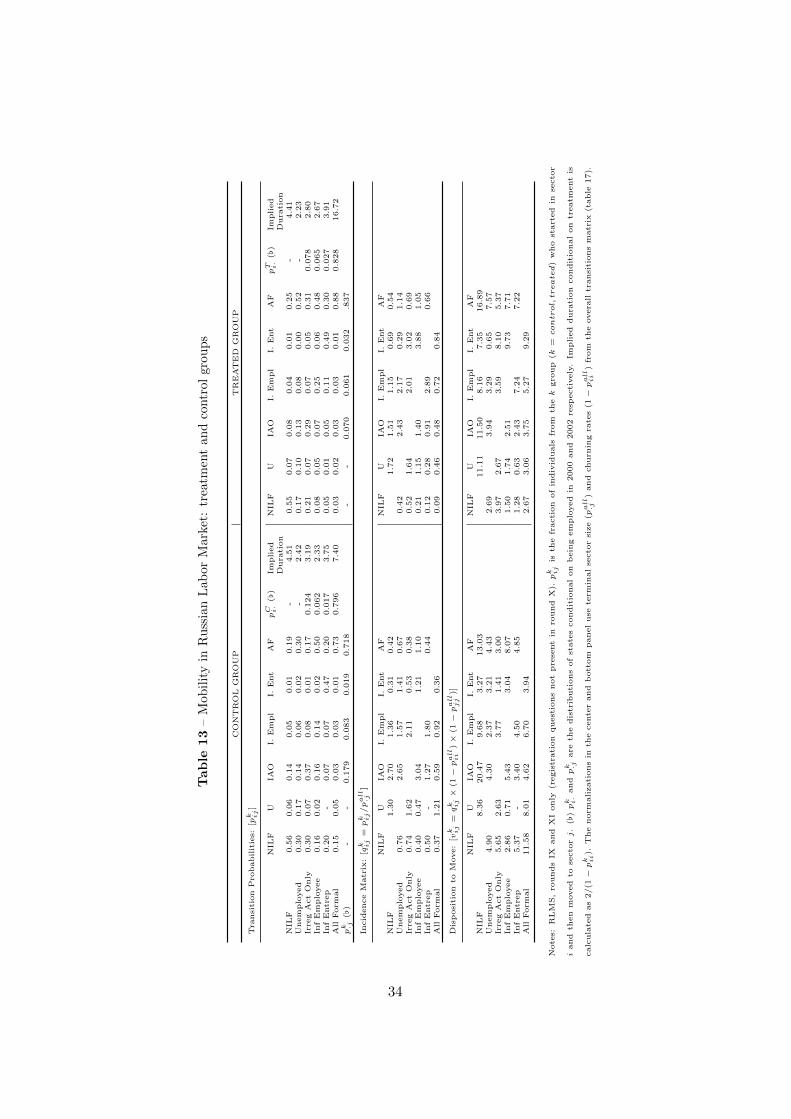
Table
13
–M
obil
ity
inR
uss
ian
Lab
or
Mark
et:
trea
tmen
tan
dco
ntr
ol
gro
up
s
CO
NT
RO
LG
RO
UP
TR
EA
TE
DG
RO
UP
Tra
nsi
tion
Pro
babilit
ies:
[pk ij]
NIL
FU
IAO
I.E
mpl
I.E
nt
AF
pC i·
([)
Implied
Dura
tion
NIL
FU
IAO
I.E
mpl
I.E
nt
AF
pT i·
([)
Implied
Dura
tion
NIL
F0.5
60.0
60.1
40.0
50.0
10.1
9-
4.5
10.5
50.0
70.0
80.0
40.0
10.2
5-
4.4
1U
nem
plo
yed
0.3
00.1
70.1
40.0
60.0
20.3
0-
2.4
20.1
70.1
00.1
30.0
80.0
00.5
2-
2.2
3Ir
reg
Act
Only
0.3
00.0
70.3
70.0
80.0
10.1
70.1
24
3.1
90.2
10.0
70.2
90.0
70.0
50.3
10.0
78
2.8
0In
fE
mplo
yee
0.1
60.0
20.1
60.1
40.0
20.5
00.0
62
2.3
30.0
80.0
50.0
70.2
50.0
60.4
80.0
65
2.6
7In
fE
ntr
ep
0.2
0-
0.0
70.0
70.4
70.2
00.0
17
3.7
50.0
50.0
10.0
50.1
10.4
90.3
00.0
27
3.9
1A
llForm
al
0.1
50.0
50.0
30.0
30.0
10.7
30.7
96
7.4
00.0
30.0
20.0
30.0
30.0
10.8
80.8
28
16.7
2
pk ·j
([)
--
0.1
79
0.0
83
0.0
19
0.7
18
--
0.0
70
0.0
61
0.0
32
.837
Incid
ence
Matr
ix:
[qk ij
=pk ij/pall·j
]
NIL
FU
IAO
I.E
mpl
I.E
nt
AF
NIL
FU
IAO
I.E
mpl
I.E
nt
AF
NIL
F1.3
02.7
01.3
60.3
10.4
21.7
21.5
11.1
50.6
90.5
4U
nem
plo
yed
0.7
62.6
51.5
71.4
10.6
70.4
22.4
32.1
70.2
91.1
4Ir
reg
Act
Only
0.7
41.6
22.1
10.5
30.3
80.5
21.6
42.0
13.0
20.6
9In
fE
mplo
yee
0.4
00.4
73.0
41.2
11.1
00.2
11.1
51.4
03.8
81.0
5In
fE
ntr
ep
0.5
0-
1.2
71.8
00.4
40.1
20.2
80.9
12.8
90.6
6A
llForm
al
0.3
71.2
10.5
90.9
20.3
60.0
90.4
60.4
80.7
20.8
4
Dis
posi
tion
toM
ove:
[vk ij
=qk ij×
(1−pall
ii
)×
(1−pall
jj
)]
NIL
FU
IAO
I.E
mpl
I.E
nt
AF
NIL
FU
IAO
I.E
mpl
I.E
nt
AF
NIL
F8.3
620.4
79.6
83.2
713.0
311.1
111.5
08.1
67.3
516.8
9U
nem
plo
yed
4.9
04.3
02.3
73.2
14.4
32.6
93.9
43.2
90.6
57.5
7Ir
reg
Act
Only
5.6
52.6
33.7
71.4
13.0
03.9
72.6
73.5
98.1
05.3
7In
fE
mplo
yee
2.8
60.7
15.4
33.0
48.0
71.5
01.7
42.5
19.7
37.7
1In
fE
ntr
ep
5.3
7-
3.4
04.5
04.8
51.2
80.6
32.4
37.2
47.2
2A
llForm
al
11.5
88.0
14.6
26.7
03.9
42.6
73.0
63.7
55.2
79.2
9
Note
s:R
LM
S,
rounds
IXand
XI
only
(regis
trati
on
quest
ions
not
pre
sent
inro
und
X).pk ij
isth
efr
acti
on
of
indiv
iduals
from
thek
gro
up
(k=control,treated)
who
start
ed
inse
cto
r
iand
then
moved
tose
cto
rj.
([)pk i·
andpk ·j
are
the
dis
trib
uti
ons
of
state
scondit
ional
on
bein
gem
plo
yed
in2000
and
2002
resp
ecti
vely
.Im
pli
ed
dura
tion
condit
ional
on
treatm
ent
is
calc
ula
ted
as
2/(1−pk ii).
The
norm
alizati
ons
inth
ecente
rand
bott
om
panel
use
term
inal
secto
rsi
ze
(pall·j
)and
churn
ing
rate
s(1−pall
ii
)fr
om
the
overa
lltr
ansi
tions
matr
ix(t
able
17).
34
A very different lesson emerges by comparing the treatment and the con-trol groups: 1) Before the reform, the distribution of employment categorieswas quite different in the two groups. Conditional on employment, treatedindividuals were more likely to have a formal job. The tax reform operatedto widen this gap significantly, specially because of the marked reduction inthe fraction of formal workers in the control group. The same conclusioncan be reached by looking at the implied durations. Over 88% of treatedformal workers remained in the formal sector. Only 73% did so in the controlgroup. 2) Every flow (except informal entrepreneurs) into the formal sectoris larger for the treatment than for the control group. In particular, whileonly 17% of workers in the control group who performed irregular activitiesbefore the reform became formal, more than 30% of comparable treated in-dividuals acquired a formal job by 2002. 3) All flows (again except informalentrepreneurs) moving workers away from the formal sector were smaller forthose treated by the reform. In particular, the probability of moving froma formal job and into irregular activities was halved for those facing lowermarginal tax rates.
Overall, examining the flows resulting from the Russian tax reform sug-gests that the pattern of transitions observed by Maloney in Mexico is nota necessary condition for an integrated labor market. In Russia workerschoose among sectors and, when the underlying parameters of the decisionchange, they change sectors accordingly. The evidence suggests that sectorchoice is fairly stable unless major parameters affecting the participationdecision change. In particular, Russian workers are very unlikely to leavethe formal sector once they have entered it.
The tax reform provided strong incentives in favor of formal employ-ment. Consequently, workers in the treated group were less likely to leaveformal sector jobs, and more likely to transition from non-employment orinformality into formal positions.
7 Conclusions
The modern Russian economy is notorious for the high level of uncertaintyregarding regulations, the pervasiveness of corruption and tax evasion, andthe relative powerlessness of the State to enforce the law. The economic andsocial costs of these institutional failures are probably large. Unfortunately,there are negative feedback effects that make the emergence of better insti-tutions unlikely. Russia seems to be trapped in low-level equilibrium of highinformality and poor public goods provision by the State.
In this context, the tax reform of 2001 appears as a highly importantexperiment. The reform reduced average tax rates for the PIT and the STand made the tax structure more regressive. Because individuals in the
35
lower income bracket were for the most part not affected, it is possible toestimate the effects of the reform using a DID approach.
In this paper I study the effect of the reform on individual participationin the informal sector. I find evidence that the reform led to a reduction inthe fraction of informal employees. The reform seems to have had an evenstronger negative effect on the prevalence of informal irregular activities.These effects –which I estimate to be in the order of 2.5 and 4.0 percentrespectively– are robust to a number of different specifications and smallalterations in the definition of treatment status. I also find that, predictably,the effects were relatively stronger in the top income brackets, where thereduction in marginal tax rates was more radical. Finally, the reform madeit 14% less likely that someone entering the job market in the post-reformperiod would perform informal irregular activities.
I interpret these estimates as strong evidence that informality, at leastin Russia, is mostly a voluntary state. Intuitively, the decline in tax ratesreduced the benefits to being informal and, as a result, induced a significantfraction of individuals to migrate to the formal sector. This kind of behav-ioral response would be impossible if people were trapped in the informalsector due to the existence of entry barriers. Moreover, informal employeesand individuals performing irregular activities are arguably the most vul-nerable groups (at least within the realm of people who have some sort ofemployment) in society. If someone is trapped, they should be the ones.The two categories of informal employment that were not affected by thereform –entrepreneurs and second job informals– constitute a small fractionof overall informality and are certainly not among the most vulnerable.
References
Manuel Arellano. Practitioners Corner: Computing Robust Standard Er-rors for Within-groups Estimators. Oxford Bulletin of Economics andStatistics, 49(4):431–434, 1987.
M. Bertrand, E. Duflo, and S. Mullainathan. How Much Should We TrustDifferences-in-Differences Estimates? Quarterly Journal of Economics,119(1):249–275, 2004.
Guillermo A. Calvo. Urban Unemployment and Wage Determination inLDC’S: Trade Unions in the Harris-Todaro Model. International Eco-nomic Review, 19(1):65–81, 1978.
Hernando de Soto. The Other Path: the Invisible Revolution in the ThirdWorld. Perennial Library, Washington DC, 1990.
Denvil Duncan and Klara Sabirianova Peter. Does Labor Supply Respond
36
to a Flat Tax? Evidence from the Russian Tax Reform. IZA DiscussionPaper, 4257, 2009.
G.S. Fields. A Guide to Multisector Labor Market Models. World BankSocial Protection Discussion Paper, Apr 2005.
L. Gasparini and L. Tornarolli. Labor Informality in Latin America andthe Caribbean: Patterns and Trends from Household Survey Microdata.CEDLAS Working Paper, Feb 2007.
K. Gerxhani. The Informal Sector in Developed and Less Developed Coun-tries: a Literature Survey. Public Choice, 120(3):267–300, 2004.
V. Gimpelson and R. Kapeliushnikov. Labor Market Adjustment: Is RussiaDiffernt? IZA Discussion Paper, 5588, Mar 2011.
Y. Gorodnichenko, J. Martinez-Vazquez, and K. Sabirianova Peter. Mythand Reality of Flat Tax Reform: Micro Estimates of Tax Evasion Responseand Welfare Effects in Russia. Journal of Political Economy, 117(3):504–554, 2009.
Zvi Griliches and Jerry A. Hausman. Errors in Variables in Panel Data.Journal of Econometrics, 31(1):93–118, 1986.
Grigory Grossman. The ‘Second Economy’ of the USSR. Problems of Com-munism, 26(5):25–40, 1977.
A. Guariglia and B.Y. Kim. The Dynamics of Moonlighting in Russia: Whatis Happening in the Russian Informal Economy? Economics of Transition,14(1):1–45, 2006.
John R. Harris and Michael P. Todaro. Migration, Unemployment andDevelopment: A Two-Sector Analysis. The American Economic Review,60(1):126–142, 1970.
K. Hart. Informal Income Opportunities and Urban Employment in Ghana.The Journal of Modern African Studies, 11(1):61–89, 1973.
R. Hussmanns. Measuring the Informal Economy: From Employment in theInformal Sector to Informal Employment. ILO Working Paper, Dec 2004.
International Labour Office. Employment, Income and Equality : A Strategyfor Increasing Productive Employment in Kenya. Geneva, 1972.
A. Ivanova, M. Keen, and A. Klemm. The Russian ‘Flat Tax’ Reform.Economic Policy, 20(43):397–444, 2005.
S. Johnson, D. Kaufmann, A. Shleifer, M.I. Goldman, and M.L. Weitzman.The Unofficial Economy in Transition. Brookings Papers on EconomicActivity, 1997(2):159–239, 1997.
37
S. Johnson, D. Kaufmann, and P. Zoido-Lobaton. Regulatory Discretion andthe Unofficial Economy. The American Economic Review, 88(2):387–392,1998.
S. Johnson, D. Kaufmann, J. McMillan, and C. Woodruff. Why do FirmsHide? Bribes and Unofficial Activity after Communism. Journal of PublicEconomics, 76:495–520, 2000.
J. Jutting, J. Parlevliet, and T. Xenogiani. Informal Employment Re-loaded.IDS Bulletin, 39(2):28–36, 2008.
Byung-Yeon Kim. Informal Economy Activities of Soviet Households: Sizeand Dynamics. Journal of Comparative Economics, 31(3):532–551, 2003.
M. Lacko. Hidden Economy – An Unknown Quantity? Comparative Analy-sis of Hidden Economies in Transition Countries, 1989–95. Economics ofTransition, 8(1):117–149, 2000.
H. Lehmann and N. Pignatti. Informal Employment Relationships andLabor Market Segmentation in Transition Economies: Evidence fromUkraine. IZA Discussion Papers, 3269, 2007.
H. Lehmann, J. Wadsworth, and A. Acquisti. Grime and Punishment: JobInsecurity and Wage Arrears in the Russian Federation. Journal of Com-parative Economics, 27(4):595–617, 1999.
W.F. Maloney. Does Informality Imply Segmentation in Urban Labor Mar-kets? Evidence from Sectoral Transitions in Mexico. The World BankEconomic Review, 13(2):275–302, 1999.
W.F. Maloney. Informality Revisited. World Development, 32(7):1159–1178,2004.
J. McMillan and C. Woodruff. The Central Role of Entrepreneurs in Tran-sition Economies. The Journal of Economic Perspectives, 16(3):153–170,2002.
L. Peattie. An Idea in Good Currency and How it Grew: the InformalSector. World Development, 15(7):851–860, 1987.
G. Perry, W. Maloney, O. Arias, P. Fajnzylber, A. Mason, and J. Saavedra-Chanduvi. Informality: Exit and Exclusion. The World Bank, WashingtonDC, 2007.
A. Portes and R. Schauffler. Competing Perspectives on the Latin AmericanInformal Sector. Population and Development Review, 19(1):33–60, 1993.
F. Schneider and D. Enste. Shadow Economies: Size, Causes, and Conse-quences. Journal of Economic Literature, 38(1):77–114, Mar 2000.
38

M. Swaminathan. Understanding the “Informal Sector”: A Survey. WIDERWorking Papers, 95, 1991.
39
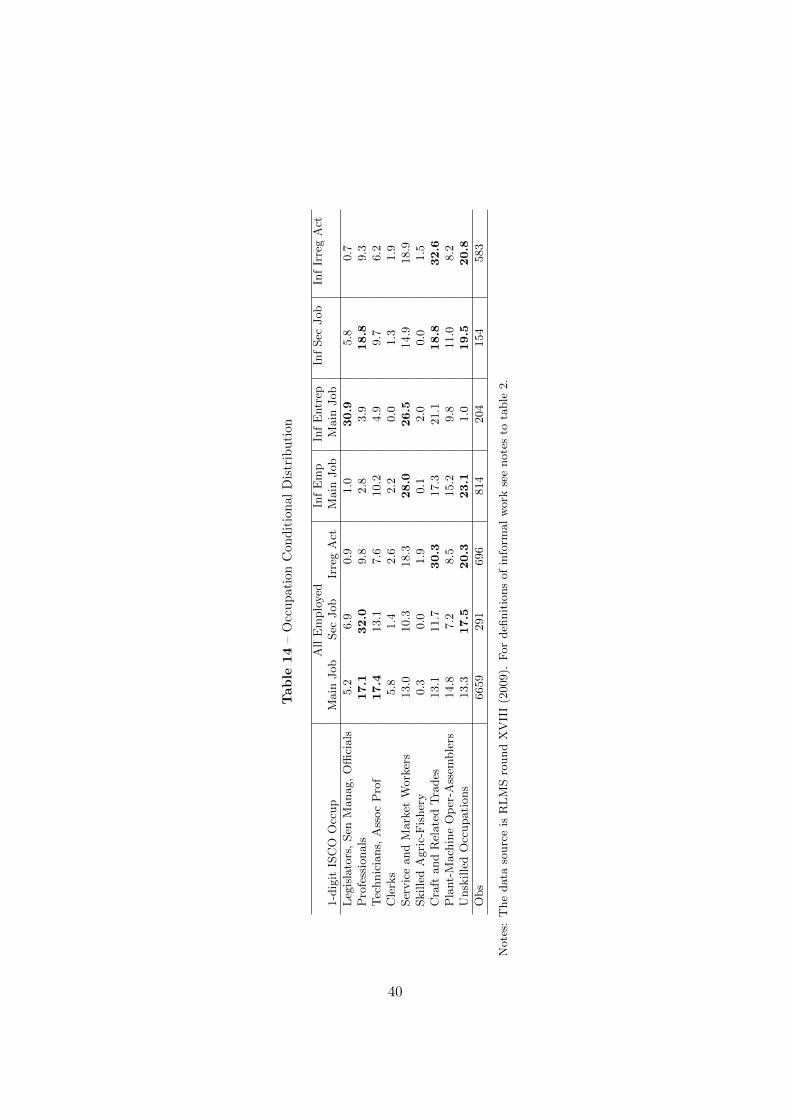
Table
14
–O
ccu
pati
on
Con
dit
ional
Dis
trib
uti
on
All
Em
plo
yed
Inf
Em
pIn
fE
ntr
epIn
fSec
Job
Inf
Irre
gA
ct1-d
igit
ISC
OO
ccup
Main
Job
Sec
Job
Irre
gA
ctM
ain
Job
Main
Job
Leg
isla
tors
,Sen
Manag,
Offi
cials
5.2
6.9
0.9
1.0
30.9
5.8
0.7
Pro
fess
ionals
17.1
32.0
9.8
2.8
3.9
18.8
9.3
Tec
hnic
ians,
Ass
oc
Pro
f17.4
13.1
7.6
10.2
4.9
9.7
6.2
Cle
rks
5.8
1.4
2.6
2.2
0.0
1.3
1.9
Ser
vic
eand
Mark
etW
ork
ers
13.0
10.3
18.3
28.0
26.5
14.9
18.9
Skille
dA
gri
c-F
isher
y0.3
0.0
1.9
0.1
2.0
0.0
1.5
Cra
ftand
Rel
ate
dT
rades
13.1
11.7
30.3
17.3
21.1
18.8
32.6
Pla
nt-
Mach
ine
Op
er-A
ssem
ble
rs14.8
7.2
8.5
15.2
9.8
11.0
8.2
Unsk
ille
dO
ccupati
ons
13.3
17.5
20.3
23.1
1.0
19.5
20.8
Obs
6659
291
696
814
204
154
583
Note
s:T
he
data
sourc
eis
RL
MS
round
XV
III
(2009).
For
defi
nit
ions
of
info
rmal
work
see
note
sto
table
2.
40
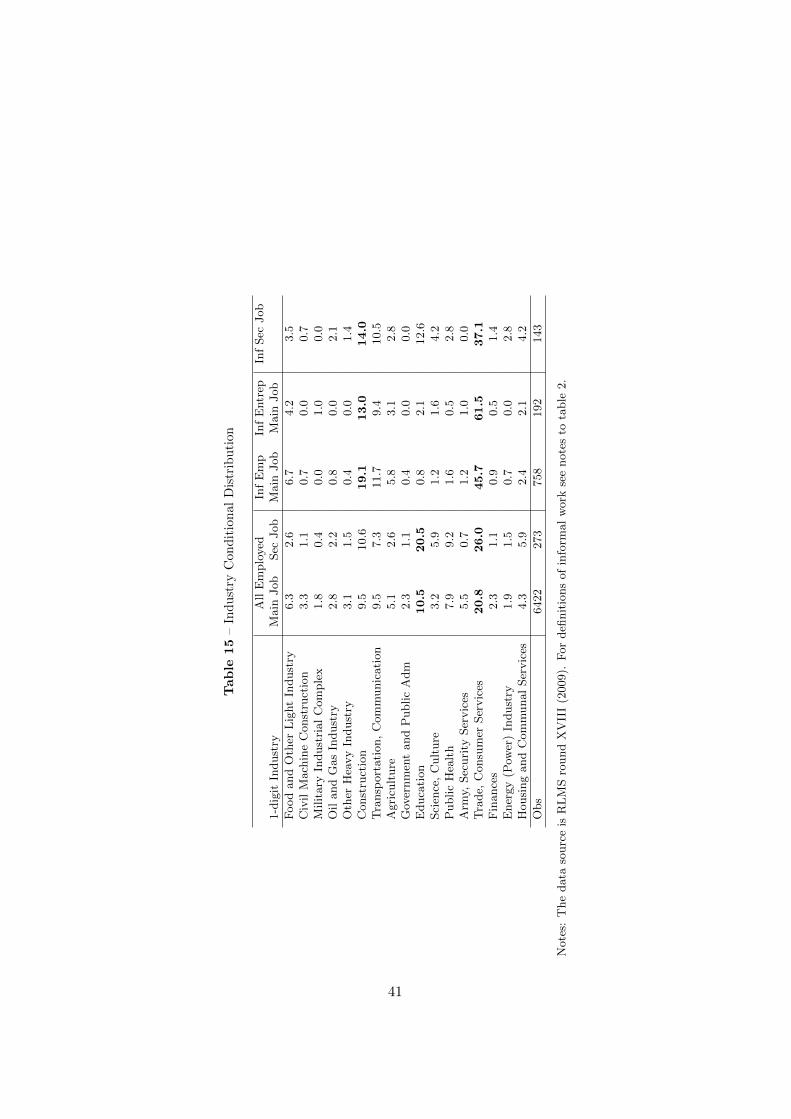
Table
15
–In
du
stry
Con
dit
ion
al
Dis
trib
uti
on
All
Em
plo
yed
Inf
Em
pIn
fE
ntr
epIn
fSec
Job
1-d
igit
Indust
ryM
ain
Job
Sec
Job
Main
Job
Main
Job
Food
and
Oth
erL
ight
Indust
ry6.3
2.6
6.7
4.2
3.5
Civ
ilM
ach
ine
Const
ruct
ion
3.3
1.1
0.7
0.0
0.7
Milit
ary
Indust
rial
Com
ple
x1.8
0.4
0.0
1.0
0.0
Oil
and
Gas
Indust
ry2.8
2.2
0.8
0.0
2.1
Oth
erH
eavy
Indust
ry3.1
1.5
0.4
0.0
1.4
Const
ruct
ion
9.5
10.6
19.1
13.0
14.0
Tra
nsp
ort
ati
on,
Com
munic
ati
on
9.5
7.3
11.7
9.4
10.5
Agri
cult
ure
5.1
2.6
5.8
3.1
2.8
Gov
ernm
ent
and
Public
Adm
2.3
1.1
0.4
0.0
0.0
Educa
tion
10.5
20.5
0.8
2.1
12.6
Sci
ence
,C
ult
ure
3.2
5.9
1.2
1.6
4.2
Public
Hea
lth
7.9
9.2
1.6
0.5
2.8
Arm
y,Sec
uri
tySer
vic
es5.5
0.7
1.2
1.0
0.0
Tra
de,
Consu
mer
Ser
vic
es20.8
26.0
45.7
61.5
37.1
Fin
ance
s2.3
1.1
0.9
0.5
1.4
Ener
gy
(Pow
er)
Indust
ry1.9
1.5
0.7
0.0
2.8
Housi
ng
and
Com
munal
Ser
vic
es4.3
5.9
2.4
2.1
4.2
Obs
6422
273
758
192
143
Note
s:T
he
data
sourc
eis
RL
MS
round
XV
III
(2009).
For
defi
nit
ions
of
info
rmal
work
see
note
sto
table
2.
41
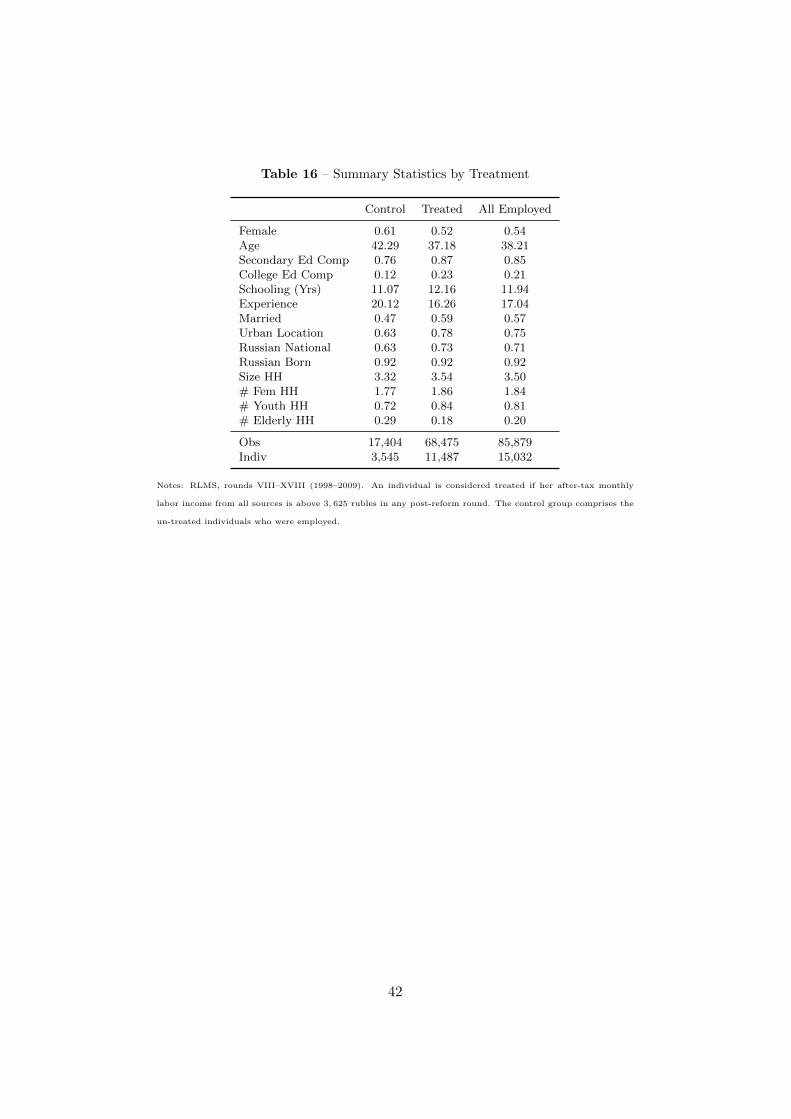
Table 16 – Summary Statistics by Treatment
Control Treated All Employed
Female 0.61 0.52 0.54Age 42.29 37.18 38.21Secondary Ed Comp 0.76 0.87 0.85College Ed Comp 0.12 0.23 0.21Schooling (Yrs) 11.07 12.16 11.94Experience 20.12 16.26 17.04Married 0.47 0.59 0.57Urban Location 0.63 0.78 0.75Russian National 0.63 0.73 0.71Russian Born 0.92 0.92 0.92Size HH 3.32 3.54 3.50# Fem HH 1.77 1.86 1.84# Youth HH 0.72 0.84 0.81# Elderly HH 0.29 0.18 0.20
Obs 17,404 68,475 85,879Indiv 3,545 11,487 15,032
Notes: RLMS, rounds VIII–XVIII (1998–2009). An individual is considered treated if her after-tax monthly
labor income from all sources is above 3, 625 rubles in any post-reform round. The control group comprises the
un-treated individuals who were employed.
42
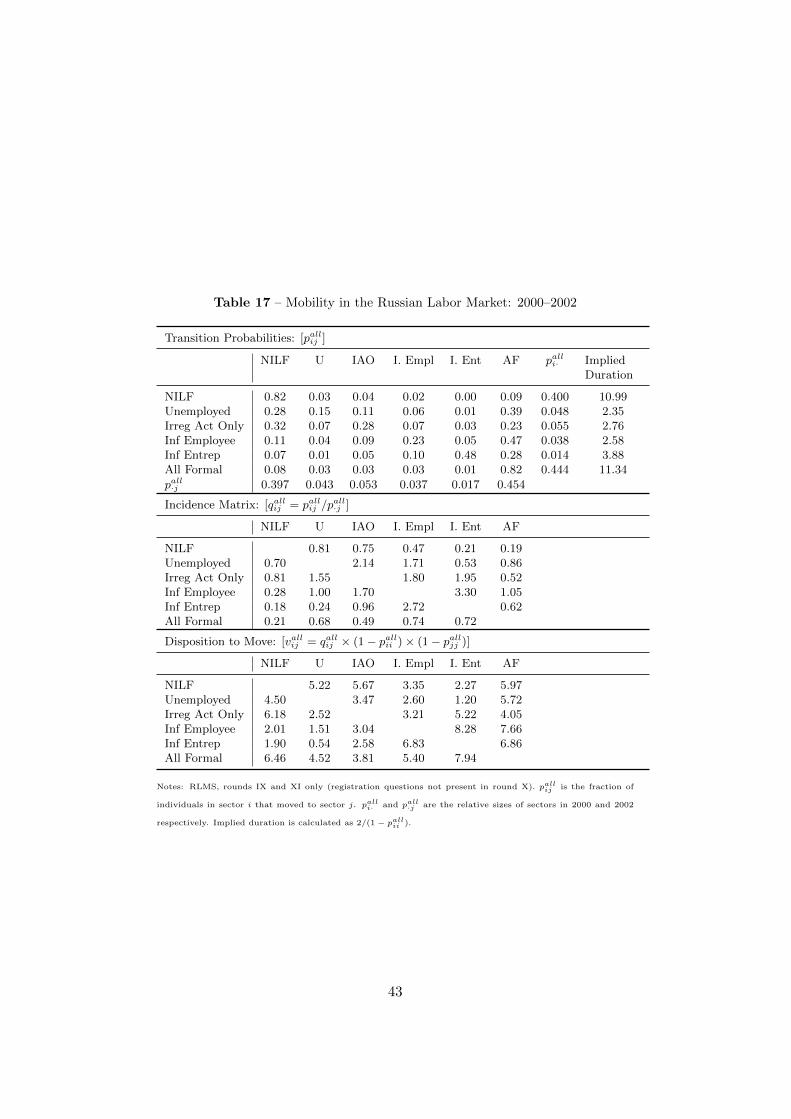
Table 17 – Mobility in the Russian Labor Market: 2000–2002
Transition Probabilities: [pallij ]
NILF U IAO I. Empl I. Ent AF palli· ImpliedDuration
NILF 0.82 0.03 0.04 0.02 0.00 0.09 0.400 10.99Unemployed 0.28 0.15 0.11 0.06 0.01 0.39 0.048 2.35Irreg Act Only 0.32 0.07 0.28 0.07 0.03 0.23 0.055 2.76Inf Employee 0.11 0.04 0.09 0.23 0.05 0.47 0.038 2.58Inf Entrep 0.07 0.01 0.05 0.10 0.48 0.28 0.014 3.88All Formal 0.08 0.03 0.03 0.03 0.01 0.82 0.444 11.34
pall·j 0.397 0.043 0.053 0.037 0.017 0.454
Incidence Matrix: [qallij = pallij /pall·j ]
NILF U IAO I. Empl I. Ent AF
NILF 0.81 0.75 0.47 0.21 0.19Unemployed 0.70 2.14 1.71 0.53 0.86Irreg Act Only 0.81 1.55 1.80 1.95 0.52Inf Employee 0.28 1.00 1.70 3.30 1.05Inf Entrep 0.18 0.24 0.96 2.72 0.62All Formal 0.21 0.68 0.49 0.74 0.72
Disposition to Move: [vallij = qallij × (1− pallii )× (1− palljj )]
NILF U IAO I. Empl I. Ent AF
NILF 5.22 5.67 3.35 2.27 5.97Unemployed 4.50 3.47 2.60 1.20 5.72Irreg Act Only 6.18 2.52 3.21 5.22 4.05Inf Employee 2.01 1.51 3.04 8.28 7.66Inf Entrep 1.90 0.54 2.58 6.83 6.86All Formal 6.46 4.52 3.81 5.40 7.94
Notes: RLMS, rounds IX and XI only (registration questions not present in round X). pallij is the fraction of
individuals in sector i that moved to sector j. palli· and pall
·j are the relative sizes of sectors in 2000 and 2002
respectively. Implied duration is calculated as 2/(1− pallii ).
43