the development and use of quantitative models of diffusion of new information technologies
TRANSCRIPT
ISSN 0147�6882, Scientific and Technical Information Processing, 2014, Vol. 41, No. 2, pp. 119–127. © Allerton Press, Inc., 2014.Original Russian Text © L.L. Delitsyn, 2014, published in Nauchno�Technicheskaya Informatsiya, Seriya 1, 2014, No. 5, pp. 24–33.
119
The information boom of this century is developingalongside accelerated development and rapid diffusionand evolution of new technologies, their competition,and their replacement. Such devices as personal com�puters, cell phones, digital cameras, and plastic cardsare used by more than two billion people. New informa�tion services, such as e�commerce, e�advertisement,Internet access, online conferences, remote education,and Software as a Service (SaaS) enjoy great popularity.At the same time, such services and devices as commu�nication by telegraph, fax, compact discs, and (in somecountries) wire�based telephones are gradually losingtheir popularity and are becoming obsolete.
The rapid technological progress leads to changesin consumer behavior and forces managers and expertsto make decisions in the context of considerableuncertainty and lack of time; the large number of dif�ferent and contradictory statistical indexes makes itmore complicated to choose alternative methods. Inthe end, the appraisal of the current state and predic�tions of diffusion of new information and communica�tion technologies (ICTs) come to the attention ofmanagers and experts in education, publishing, andlibrary services, while in the past they used to be ofinterest mainly for linemen, financial and marketingexperts, as well as hardware and software producers.
Methodologically, the modeling and prediction ofdiffusion of new technologies is based on classicalquantitative models of diffusion of innovations thatwere created about half a century ago, have been usedin many research works, and were systematized in anumber of monographs. Just to name a few, such works
include the well�known work by V. Mahajan andR. Peterson [1], detailed overviews by R. Perez et al.[2], N. Mead and T. Islam [3], collective monographsedited by V. Mahajan et al. [4], and by A.Vishwanathand G.Barnett [5].
Unfortunately, the classical models make use ofonly a minor part of the currently available data andhave limited explanatory and prediction abilities,which restrains their practical application. The devel�opment and testing of new models that better fit thesolution of practical tasks (predictions, scenario anal�yses, appraisals of regulation effects) is becoming pos�sible, first of all, owing to the availability of statisticaland sociological data about the use of new technolo�gies and, secondly, increased computational capabili�ties of computer equipment and the availability of thenecessary software.
The subject matter of this study is the diffusion ofnew information technologies, which is viewed as acommunicative process of spreading informationabout innovations. Traditionally, this information hasbeen spread either by mass media or by interpersonalcommunication [1, 6, 7]. In this study two more chan�nels are taken into account that have not been consid�ered before, namely: family education and instructionin educational establishments. The topic for analysiscan be defined as the quantitative appraisal of diffusionof new ICTs and, in the narrower sense, as quantitativemodels of dynamics (temporal variations) of statisticalindicators of diffusion of new information technologies.
Following E. Rodgers, we define an innovation asany idea, object, or practice that is conceived as new
The Development and Use of Quantitative Models of Diffusion of New Information Technologies
L. L. DelitsynDepartment of Informatization, Moscow State University of Culture and Arts
e�mail: [email protected] February 14, 2014
Abstract—The development and use of new quantitative models is viewed as part of research and informationactivities. An attempt has been made to identify indexes that are used by participants in information supportto appraise alternative methods of control over the diffusion of innovations. The participants include a deci�sion�making entity, an analyst, and a measurer. The development of the model of the diffusion of the Internetin Russia, which makes it possible to calculate the dynamics of the reach of the Internet for different periods(1 month, 1 week, and 1 day), is taken as an example. Possible factors of differences between the new actualdata of mass�scale sampling surveys and the predicted data that were published by the authors in 2008–2011are discussed.
Keywords: diffusion of innovations, the reach of the Internet, research and information activities
DOI: 10.3103/S0147688214020063
120
SCIENTIFIC AND TECHNICAL INFORMATION PROCESSING Vol. 41 No. 2 2014
DELITSYN
by an individual, a household, an organization, orother entity that decides to use them, and diffusion ofinnovations as an information process in the course ofwhich innovations spread over time along certainchannels among the members of the social system [7].
The participants, the purposes of using quantitativemodels, and the specifics of data handled by an analyst[8–10] will be considered below.
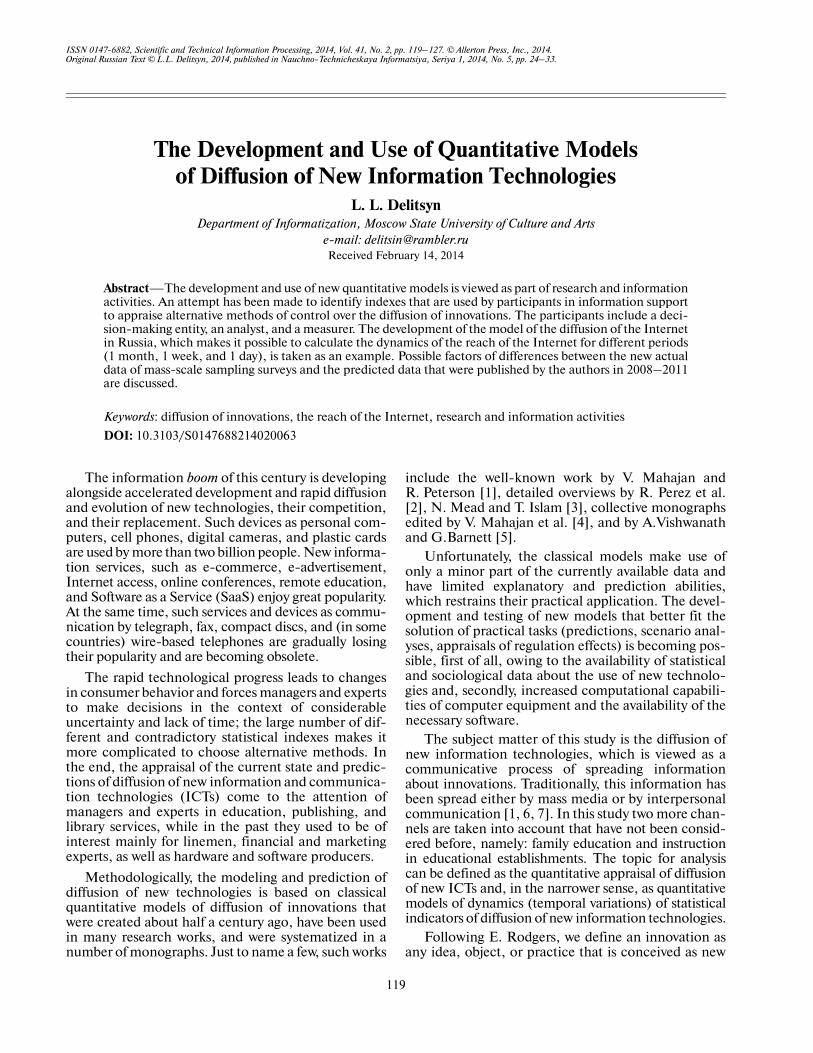
Decision�making entities may include ministries,organizations, and companies that are able in certaincases (but not necessarily) to affect the diffusion ofinnovations. Unlike consumers, these entities do notmake decisions about using information and telecom�munication technologies personally but on their useby other people or organizations. Feedback, whichmakes data transfer from the object to the decision�making entity possible, can be ensured either by directparticipation in control over diffusion of innovations(the wide arrow in Fig. 1) or by data collected by mea�surers.
Considering the information overload and constantlack of time, which result from rapid changes of con�trolled objects and the external environment, deci�sion�making entities require modeling data and resultsin the real�time mode.
We propose that the choice of alternatives by deci�sion�making entities (and other participants as well)can be explored by using aggregate indexes of uncer�tainty and attractiveness that were used previously inthe analysis of decision making by venture funds [11].
Aiming to decrease the uncertainty of the effects ofusing the model (the risks of wasting time and money),the decision�making entity will prefer:
• intuitive knowledge proven by personal or corpo�rate experience;
• simple models that make a part of a manager’seducational background;
• verbal and qualitative models (such as the abyssmodel by J. Moore [12]);
• models considered to be standard;
• developments by reliable (large, well�known)organizations;
• models used by other organizations (rival estab�lishments, for example);
• use of ready�made models instead of designing anew one;
• results that confirm a decision that has alreadybeen made.
When maximizing the model utility indicator, thedecision�making entity will prefer developments thatwill make it possible to:
• solve the most important problem in the choiceof alternatives;
• make short�term predictions;
• make use of information about actions by marketplayers and legislative initiatives in preparation;
• use input and output indicators accepted in theentire industry;
AnalysMeasurer
Report
DME
Data
Object
M4
M2
M1
M3
Fig. 1. Information traffic circulating among the participants of the information support of the control over diffusion of new ITCT,that include a decision�making entity (DM), a measurer, and an analyst. The circle with the word Object indicates a spreadinginnovation and covers both new information technologies and people or organizations that use them. M1–M4 are the modelsused by the participants in the process.

SCIENTIFIC AND TECHNICAL INFORMATION PROCESSING Vol. 41 No. 2 2014
THE DEVELOPMENT AND USE OF QUANTITATIVE MODELS 121
• easily incorporate expert opinions and empiricalcorrections;
• manipulate other participants.If the above�given signs of uncertainty and attrac�
tiveness are appraised using a five�point scale, forexample, and the evaluations are summed, the alter�natives (different models, either already designed orproposed) can be depicted as points on the diagram ofdiffusion, along the axes of which the total indicatorsof uncertainty and attractiveness are plotted. Then theboundary (determinative surface) can be laid to sepa�rate the models that are accepted by a decision�mak�ing entity from the discarded variants.
An analyst appraises attractiveness and uncertaintyin a different way: his indicator of uncertainty includesevaluations of a task’s complexity, its proximity to theknowledge accumulated by the analyst himself (seemodel M3 in Fig. 1) and by the decision�making entity(model M1), and by appraisals of his own expertise. Inthis case the indicator of attractiveness shows theobject’s significance not only for the decision�makingentity but also for other organizations and society ingeneral, the range of the field in which the model canbe potentially used, the possibility of high expert esti�mation, etc. In the end, the analyst and the decision�making entity will generally prefer different models ofthe same objects.
Usually, the data that we use are the results of sta�tistical or sociological surveys of social diffusion ofnew technologies that are performed by a specializedcompany (measurer) according to parameters set inadvance, imply continuous changes in the object’sstate, and are aimed at predicting and working outoptimal managerial solutions. In a work by O.B. Slad�kova [13] the set of mandatory survey characteristicswas validated, which includes the complexity of theobject’s attributes, data operability and continuity,exactness, and consistency in data collection and pre�sentation format.
Large amounts of sociological and statistical datahave been accumulated both by reporting and mass�scale surveys and by using technical means such asinternet counters. However, these data are very diverseand are provided by different organizations to solvedifferent and sometimes contradictory tasks.
Most of the data is computer processed and onlyvery little data can be processed by the analyst in per�son. In particular, one does not separately analyze theextent of the reach of the Internet in every age group inthe city or in the country in 2002–2013 because thisanalysis would not be of much use. Instead one usesthe quantitative model of the reach of the Internet,which makes it possible to compress the data array to asmall number of indexes sufficient for reconstructingthe past and making predictions for the future.
We do not consider separately all the elementsbetween the model and its user who makes decisions(customer), in particular, a consulting company or an
industrial association that cooperates directly with acustomer, a research establishment (department, lab�oratory, or R&D center) that fulfils the task, and amodeling specialist. All these elements are combinedand together referred to as the analyst, which impliesthat the development of the quantitative model forprocessing available data makes up part of informationanalytics. To our mind, it is more efficient to developthe quantitative model in a sectoral research establish�ment rather than in a consulting company; when spe�cialized scientific establishments decrease in numberthe model can be developed by institutions of highereducation.
In Fig. 1 a report is the term that refers to a subsetof data that are available to the analyst and provided bythe measurer (possibly, in open�access publications).In particular, these data may include digitized inquiryforms filled out by respondents and a report may referto a balanced distribution of answers to ensure repre�sentativeness. Usually, the analyst does not take part inthe planning of surveys (or other observations) and theformation of the list of measurable characteristics andthe data that are available to the analyst are deter�mined by the measurer and the decision�making entityaccording to the conventional object models (M1 andM2 in Fig. 1), which differ from the models used bythe analyst (M3 in Fig. 1).
If M3 describes the behavior of the analyzed (orsimilar) object with indexes other than the ones thatare contained in a report, the analyst will choose oneof the four alternatives enumerated below in accor�dance with the synchonous increase in potentialreturn and accompanying risks:
(i); Give up on using M3 and confine oneself todata extrapolation using a trend that matches M1;
(ii); Do not take into account the formal and essen�tial differences among the indexes or make empiricaldata corrections and use M3;
(iii); Develop an additional model, M4, as theinterface for the reported data and use M3 and M4 incombination;
(iv); Give up on using the available data and start tosearch for or collect data required by M3.
Are the differences among M1, M2, and M3 largeenough to justify expenses on building M4? The ana�lyst has to answer this question again and again in eachparticular situation and the answers may be differenton different occasions and depend on the analyst’sspecialization.
As an example, the statistics on cellular communi�cation will be taken in which the general characteristicof the use level is the number of active users, which isdetermined by communication service providers bycounting the number of active SIM cards or othermodules of user identification. The number of SIMcards is not found in the theory of diffusion of innova�tions and different communication service providersdefine the number of active users differently; there was
122
SCIENTIFIC AND TECHNICAL INFORMATION PROCESSING Vol. 41 No. 2 2014
DELITSYN
even a case when a large Russian cellular communica�tion provider wrote off eight million inactive users atonce. The quantitative models of diffusion of innova�tions can be applied more effectively using data fromsample opinion surveys, but the small size of a stan�dard sampling requires that the share of cell�phoneowners make up at least 1% of the total population. Bythe time this level had been achieved the referenceindex of cellular communication reach was the num�ber of SIM cards.
That is the reason that specialists who analyze thereach of cellular communication would initially notuse models of diffusion of innovations at all [14], oruse them with regard to the number of SIM cards [15–19]. However, the theory of diffusion of innovationsimplies communication among people, not amongmultiplying SIM cards, and is unable to provide anexplanation of such indexes as the level of cellularcommunication reach in Russia in 2012. According tothe International Telecommunication Union, thislevel in 2012 was 183 cell�phone users per 100 people.It is clear that many individuals use several SIM cardsand a model can be developed that would show the dis�tribution of the number of cell phone numbers peruser. However, even this model will be unable to pre�dict the moment when a large cellular communicationprovider decides to write off several million inactiveusers. To solve this task, other knowledge will be nec�essary, i.e., expertise in business strategies of cellularcommunication providers and not models of cell�phone�user behavior.
If the analyst does not see any possibility to confinehimself to empirical corrections and decides todevelop M4, then how can the effectiveness of thismodel be appraised? If it complements M3 wellenough to explain new facts, can it be considered as asignificant contribution to the development of M3, oronly a minor complication that is necessary to explaina confusing but not very topical phenomenon? Theanswer depends on the frequency of the analyzed phe�nomenon rather than on the level of effort necessaryfor building M3. The necessary labor expenses can bevery significant but the study will not go beyond strictlyapplied limits and will hardly be of any interest for aca�demic researchers. As for an analytical or a consultingcompany working under lack of time and dealing withpressing task flows, this development will be too com�plicated technically and unfeasible commercially.
Having encountered a minor problem that makes itnecessary to solve difficult but unrewarding tasks, theanalyst will give up any attempt to apply models of dif�fusion of innovations and choose alternative (i), con�fining himself to data smoothing and extrapolation. Ifthe analyst chooses alternative (ii) and starts to useavailable data without necessary adaptation, the mod�eling effectiveness will be low.
In the case of a large and important object such ascellular communication or the Internet, the impetus
for developing M4 increases. If the analyst successfullymanages to resolve the contradictions between thenew facts and the classical theory the practical effectwill be seen in more exact predictions and the theoret�ical importance of M4 will be justified by its contribu�tion to the development of M3. It is no wonder thatattempts to predict the reach of the Internet all overthe world have been made not only by academicresearchers [20], but also by analytical companies [21]and even by scientific�opinion writers [22].
The classical models of diffusion of innovationswere used for modeling and predicting the dynamics ofInternet and cellular communication in Russia andother countries in works by L.E. Varakin [23],Yu.V. Deart [16], T.A. Kuzovkova and L.S. Timosh�enko [24], S.Yu. Kazantsev and I.E. Frolov [17 and18], K.E. Afanasieva and V.I. Shiryaev [15], and sev�eral other studies. The spread of the Internet in Russiawas viewed as a diffusion of innovations in a book byYu.Yu. Perfilyev [25], where the author pointed outthat the reach of the Internet is unevenly distributedacross regions, Internet services are highly affordablein big cities and expensive and technically inaccessiblein the country. Other approaches to analyzing and pre�dicting the spread of the Internet in Russia were usedin works by V.A. Konyavskii [26], G.L. Smolyan,V.N. Tsygichko, and D.D. Khan�Magomedov [27].
The example that will be considered is the quanti�tative model of the spread of the Internet in a societysegmented by the sex and type of populated locality inwhich reproduction tendencies are taken intoaccount, as well as changes in accessibility to newproducts or services over time. We published thismodel in 2008 and used it for predicting the full (half�year) reach of the Internet in Russia [11 and 28]. Theneed to design the model was due to the considerabledifferences between the data of sociological surveysand the predictions made using classical models andby the internal contradictions of the approach basedon independent logistic models for modeling the dif�fusion of innovations among particular age groups.
Let the continuous variable π correspond to the birthdate of an individual. All the individuals will be dividedin twelve homogenous disjoint segments by sex (maleand female) and type of populated locality (Moscow, St.Petersburg, cities with a population of a million ormore, cities with a hundred thousand or more inhabit�ants, small towns, and villages) and the segments will beindexed by using the integer variable i.
At each moment in time an individual can existonly in one of the three following states: unresponsive�ness to innovations, responsiveness to innovations,and use of innovations. At the same time, the individ�ual’s state may change over time from the first to thesecond and then to the third. Hence, at each momentin time t every i segment of each generation deter�mined by birth date π is divided in three separate parts(subsets) depending on the inidividual’s use of innova�
SCIENTIFIC AND TECHNICAL INFORMATION PROCESSING Vol. 41 No. 2 2014
THE DEVELOPMENT AND USE OF QUANTITATIVE MODELS 123
tions. The total densities of the size of these subsets perage unit yield the population density per age unit:
(1)
where xi(t, π), yi(t, π), and zi(t, π) are the densities perage unit of current users, potential users, individualswho are responsive to innovations, and those who willremain unresponsive to innovations until they becomesimpler and more affordable.
Value
(2)
indicates the innovation diffusion potential.
Functions xi(t, π), yi(t, π), and zi(t, π) are supposedto meet the integrodifferential balance equations thatwe proposed earlier in [11]. These are:
(3)
with the threshold conditions
(4)
and restrictions for the parameters
where Bj(t, π) indicates the birth rates in generation πof segment j at moment t; μi(t, π) indicates death rates(the so�called death intensity); hi(t, π) is the so�calledrisk function; fi(t, π, u(t)) is the density per age unit ofthe number of transitions from the irresponsive subsetto the subset of potential users in a unit of time; u(t) isthe path of control parameters (for example, the priceor geographical reach of innovation) in time; factors cij
determine shares of segments (in particular, boys andgirls) among newborn infants; and J is the number ofhighlighted segments.
The initial conditions are restricted with limita�tions in the form of the following inequalities:
and equations xi(0, π) + yi(0, π) + zi(0, π) = ki(0, π).
We suppose that the influence of different groups ofindividuals in interpersonal communication is addi�
ki t π,( ) xi t π,( ) yi t π,( ) zi t π,( ),+ +=
mi t π,( ) ki t π,( ) z t π,( )–=
∂xi
∂t����� hi t π,( )yi t π,( ) μi t π,( )xi t π,( ),–=
∂yi
∂t����� –hi t π,( )yi fi t π u t( ), ,( ) μi t π,( )yi t π,( ),–+=
∂zi
∂t����� –fi t π u t( ), ,( ) μi t π,( )zi t π,( )–=
yi t t,( ) cij
j 1=
J
∑ Bj t π,( )kj t π,( )dπ,
∞–
t
∫=
cij
j 1=
J
∑ 1, cij 0,≥=
0 xi 0 π,( ) ki 0 π,( ), 0 yi 0 π,( ) ki 0 π,( ),≤ ≤≤ ≤
0 zi 0 π,( ) ki 0 π,( )≤ ≤
tive; the risk function we use is therefore a sum not ofshares but absolute levels of users of innovations:
(5)
where K(t) is the total population size; pi(π) are thesex�and�age factors of external action; qij(t, π, θ) arethe functions of internal action that describe the influ�ence of individuals of generation θ from segment j onindividuals of generation π from segment i.
In this form the risk function expresses F. Bass’smodel [6], which is the most popular model that isused in works on diffusion of innovations, in the casewhere the influence of actual users on potential usersdepends on the age of communicating participants.The qij(t, π, θ) functions are similar to internal action(innovation) parameter q, and the pi(π) functions aresimilar to the external action parameter p in F. Bass’smodel. It should be emphasized that decisions bypotential users in models of diffusion of innovationsdepend on information received in communicationwith real users. In different periods this relationshipwas interpreted as imitation [28], social contamina�tion, etc.
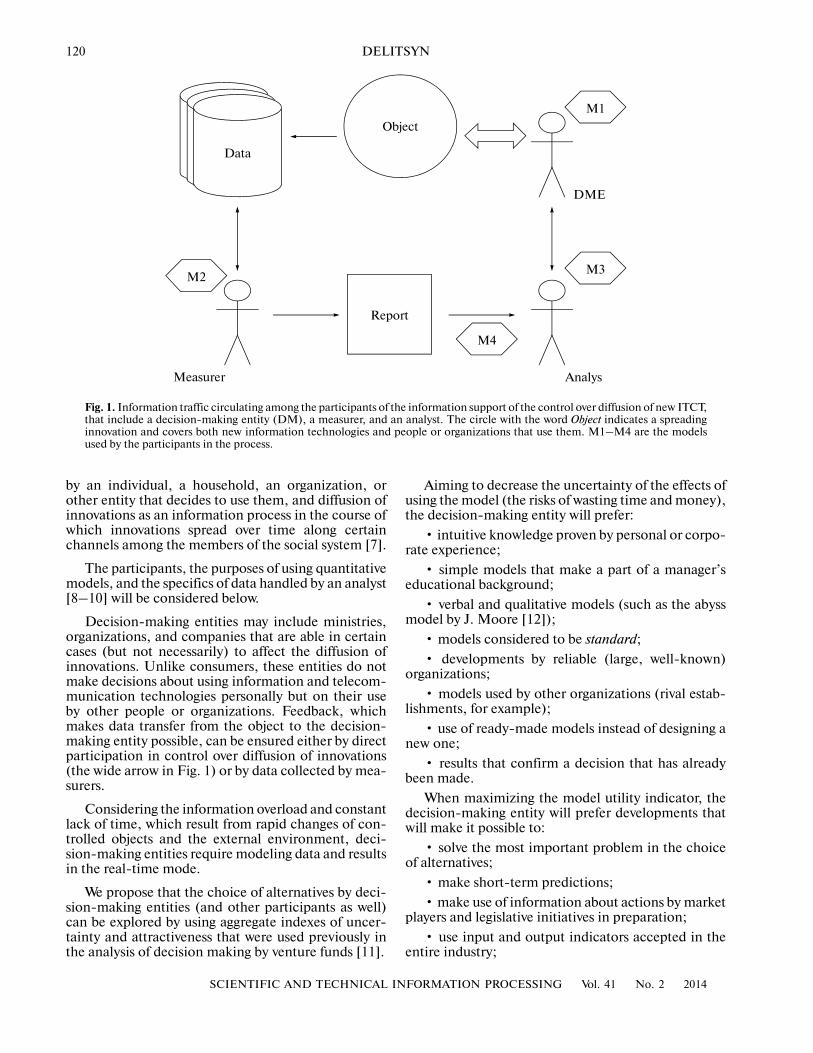
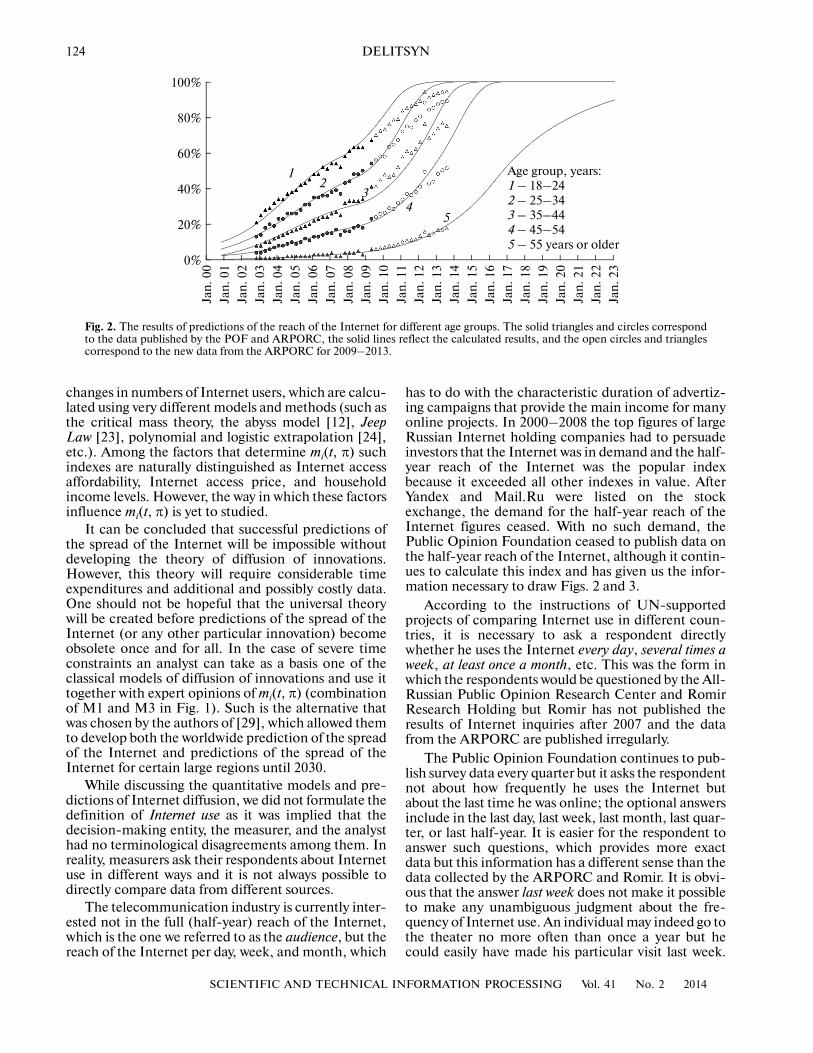
Equations (1–5) were used to model the data fromthe Public Opinion Foundation (POF) and the All�Russian Public Opinion Research Center (ARPORC)about the spread of the Internet in Russia among dif�ferent age groups. In Fig. 2 the results of calculationsof the overall share of Internet users in Russia in 2009are shown.
The mean square error in the prediction of theshare of Internet users above 18 from the summer of2009 to the spring of 2013 was 3%, while the maximumerror was 6%. The maximum error for a particular agegroup (18–24) was 12%. (see Fig. 2).
The main reason for the observed deviations con�sists in the incorrectly predicted transition intensityfi(t, π, u(t)). The conditions contained in our predic�tion said that Internet access would become cheaperby 5% per quarter throughout the entire period and itwas also supposed that innovation diffusion potentialmi(t, π) had unitary price elasticity, which determinedthe form of fi(t, π, u(t)). Both assertions are yet to beproven. The information about the average price ofInternet access was collected by analytical agencies,although some sources say that the price decrease wassharp and more significant that expected. Since theactual Internet diffusion among all the age groupsappeared to be less intensive than expected, it can besupposed that the price relationship of mi(t, π) has adifferent form than the one used in our calculations.
To predict the dynamics of the mi(t, π) potentials isno easier than to predict the reach of the Internet,because it is necessary to foresee decisions by Internetservice providers. In their respect, Internet serviceproviders and regulatory bodies appeal to expected
hi t π,( ) pi π( )1
K t( )�������� qij t π θ, ,( )xj t θ,( )dθ,
∞–
t
∫j 1=
J
∑+=
124
SCIENTIFIC AND TECHNICAL INFORMATION PROCESSING Vol. 41 No. 2 2014
DELITSYN
changes in numbers of Internet users, which are calcu�lated using very different models and methods (such asthe critical mass theory, the abyss model [12], JeepLaw [23], polynomial and logistic extrapolation [24],etc.). Among the factors that determine mi(t, π) suchindexes are naturally distinguished as Internet accessaffordability, Internet access price, and householdincome levels. However, the way in which these factorsinfluence mi(t, π) is yet to studied.
It can be concluded that successful predictions ofthe spread of the Internet will be impossible withoutdeveloping the theory of diffusion of innovations.However, this theory will require considerable timeexpenditures and additional and possibly costly data.One should not be hopeful that the universal theorywill be created before predictions of the spread of theInternet (or any other particular innovation) becomeobsolete once and for all. In the case of severe timeconstraints an analyst can take as a basis one of theclassical models of diffusion of innovations and use ittogether with expert opinions of mi(t, π) (combinationof M1 and M3 in Fig. 1). Such is the alternative thatwas chosen by the authors of [29], which allowed themto develop both the worldwide prediction of the spreadof the Internet and predictions of the spread of theInternet for certain large regions until 2030.
While discussing the quantitative models and pre�dictions of Internet diffusion, we did not formulate thedefinition of Internet use as it was implied that thedecision�making entity, the measurer, and the analysthad no terminological disagreements among them. Inreality, measurers ask their respondents about Internetuse in different ways and it is not always possible todirectly compare data from different sources.
The telecommunication industry is currently inter�ested not in the full (half�year) reach of the Internet,which is the one we referred to as the audience, but thereach of the Internet per day, week, and month, which
has to do with the characteristic duration of advertiz�ing campaigns that provide the main income for manyonline projects. In 2000–2008 the top figures of largeRussian Internet holding companies had to persuadeinvestors that the Internet was in demand and the half�year reach of the Internet was the popular indexbecause it exceeded all other indexes in value. AfterYandex and Mail.Ru were listed on the stockexchange, the demand for the half�year reach of theInternet figures ceased. With no such demand, thePublic Opinion Foundation ceased to publish data onthe half�year reach of the Internet, although it contin�ues to calculate this index and has given us the infor�mation necessary to draw Figs. 2 and 3.
According to the instructions of UN�supportedprojects of comparing Internet use in different coun�tries, it is necessary to ask a respondent directlywhether he uses the Internet every day, several times aweek, at least once a month, etc. This was the form inwhich the respondents would be questioned by the All�Russian Public Opinion Research Center and RomirResearch Holding but Romir has not published theresults of Internet inquiries after 2007 and the datafrom the ARPORC are published irregularly.
The Public Opinion Foundation continues to pub�lish survey data every quarter but it asks the respondentnot about how frequently he uses the Internet butabout the last time he was online; the optional answersinclude in the last day, last week, last month, last quar�ter, or last half�year. It is easier for the respondent toanswer such questions, which provides more exactdata but this information has a different sense than thedata collected by the ARPORC and Romir. It is obvi�ous that the answer last week does not make it possibleto make any unambiguous judgment about the fre�quency of Internet use. An individual may indeed go tothe theater no more often than once a year but hecould easily have made his particular visit last week.
100%
80%
60%
40%
20%
0%
Jan
. 23
Jan
. 20
Jan
. 18
Jan
. 14
Jan
. 07
Jan
. 02
Jan
. 00
Jan
. 05
Jan
. 01
Jan
. 10
Jan
. 22
Jan
. 21
Jan
. 19
Jan
. 11
Jan
. 06
Jan
. 08
Jan
. 03
Jan
. 15
Jan
. 16
Jan
. 12
Jan
. 13
Jan
. 17
Jan
. 09
Jan
. 04
Age group, years:1 – 18–242 – 25–343 – 35–444 – 45–545 – 55 years or older
12
34
5
Fig. 2. The results of predictions of the reach of the Internet for different age groups. The solid triangles and circles correspondto the data published by the POF and ARPORC, the solid lines reflect the calculated results, and the open circles and trianglescorrespond to the new data from the ARPORC for 2009–2013.
SCIENTIFIC AND TECHNICAL INFORMATION PROCESSING Vol. 41 No. 2 2014
THE DEVELOPMENT AND USE OF QUANTITATIVE MODELS 125
Nonetheless, practicing specialists resort to POF�col�lected data because only these are published on a reg�ular basis. The prediction of the value of these data inthe future is exactly the information expected by thetelecommunication industry from the analyst.
If alternative (iii) is chosen, the analyst’s workingalgorithm can be a series of the following steps:
1. M4 is developed; it describes the relationship ofthe frequency of Internet use to a 1�day, week�long,month�long, and half�year Internet audience reach;
2. M2 output data are transformed into M3 inputdata using M4;
3. Predictions are made using M3;4. M3 output data are transformed into M2 output
data using M4.To describe the relationship between the frequency
of Internet use and the Internet audience reach, wedesigned a special model based on superposition ofelementary event streams [30]. However, pressed bythe real�time mode in 2011, we chose the simpler andless correct alternative (ii) and applied the previouslydescribed model of frequency evolution of Internet usedirectly to the data from the POF without their trans�formation.
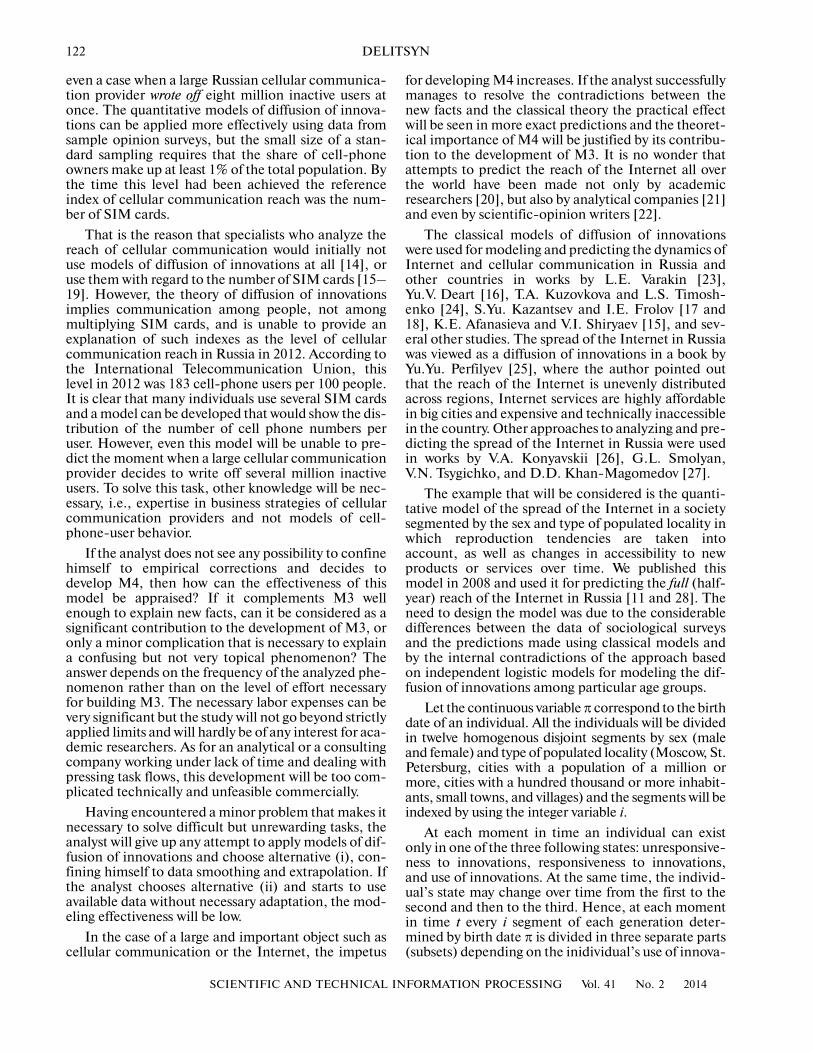
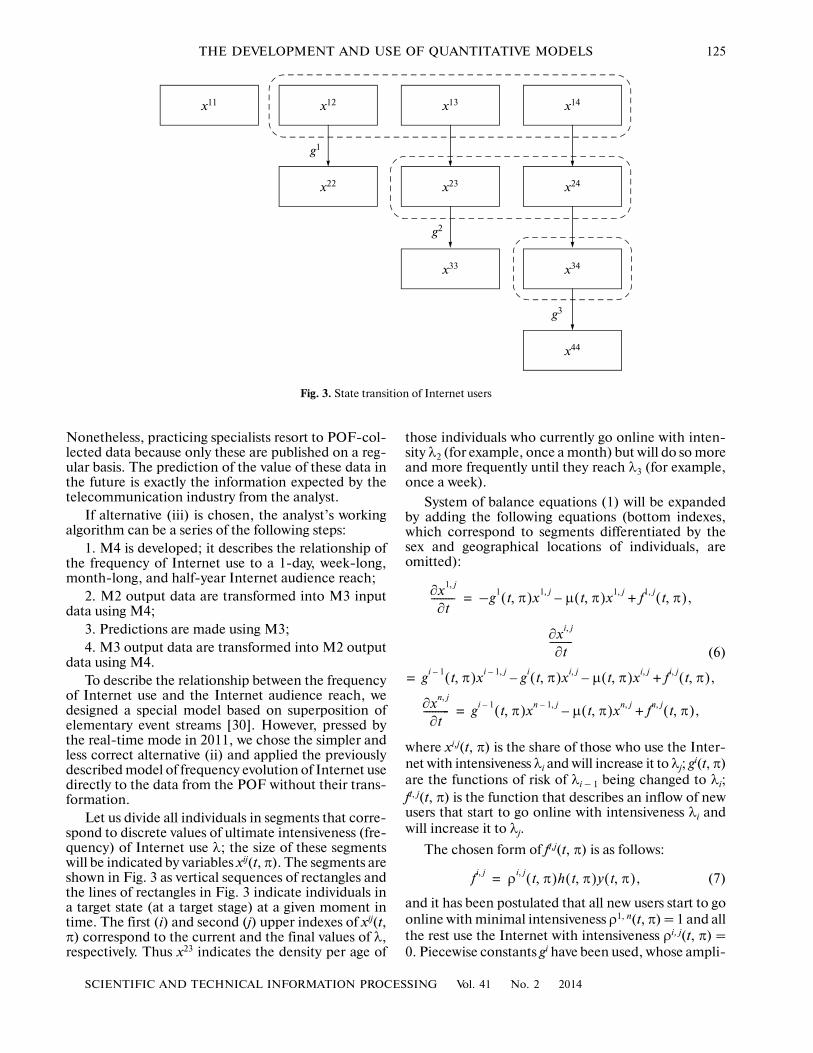
Let us divide all individuals in segments that corre�spond to discrete values of ultimate intensiveness (fre�quency) of Internet use λ; the size of these segmentswill be indicated by variables xij(t, π). The segments areshown in Fig. 3 as vertical sequences of rectangles andthe lines of rectangles in Fig. 3 indicate individuals ina target state (at a target stage) at a given moment intime. The first (i) and second (j) upper indexes of xij(t,π) correspond to the current and the final values of λ,respectively. Thus x23 indicates the density per age of
those individuals who currently go online with inten�sity λ2 (for example, once a month) but will do so moreand more frequently until they reach λ3 (for example,once a week).
System of balance equations (1) will be expandedby adding the following equations (bottom indexes,which correspond to segments differentiated by thesex and geographical locations of individuals, areomitted):
(6)
where xi,j(t, π) is the share of those who use the Inter�net with intensiveness λi and will increase it to λj; gi(t, π)are the functions of risk of λi – 1 being changed to λi;fi, j(t, π) is the function that describes an inflow of newusers that start to go online with intensiveness λi andwill increase it to λj.
The chosen form of fi,j(t, π) is as follows:
(7)
and it has been postulated that all new users start to goonline with minimal intensiveness ρ1, n(t, π) = 1 and allthe rest use the Internet with intensiveness ρi, j(t, π) =0. Piecewise constants gi have been used, whose ampli�
∂x1 j,
∂t�������� –g1 t π,( )x1 j,
μ t π,( )x1 j,– f1 j, t π,( ),+=
∂xi j,
∂t��������
= gi 1– t π,( )xi 1– j, gi t π,( )xi j,– μ t π,( )xi j,– fi j, t π,( ),+
∂xn j,
∂t��������� gi 1– t π,( )xn 1– j,
μ t π,( )xn j,– fn j, t π,( ),+=
fi j,ρ
i j, t π,( )h t π,( )y t π,( ),=
x12
g1
x13 x14
x22
g2
x23 x24
x33 x34
x44
x11
g3
Fig. 3. State transition of Internet users
126
SCIENTIFIC AND TECHNICAL INFORMATION PROCESSING Vol. 41 No. 2 2014
DELITSYN
tudes are calculated by the least�squares methodaccording to historical data from the Public OpinionFoundation.
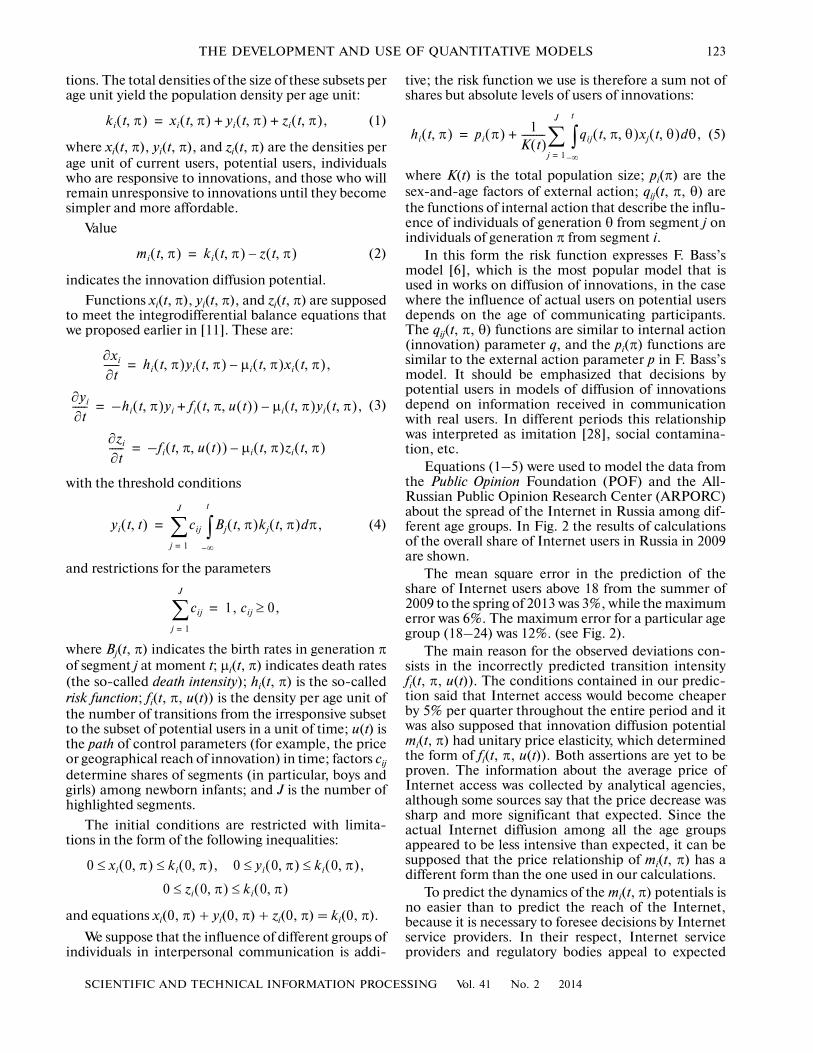
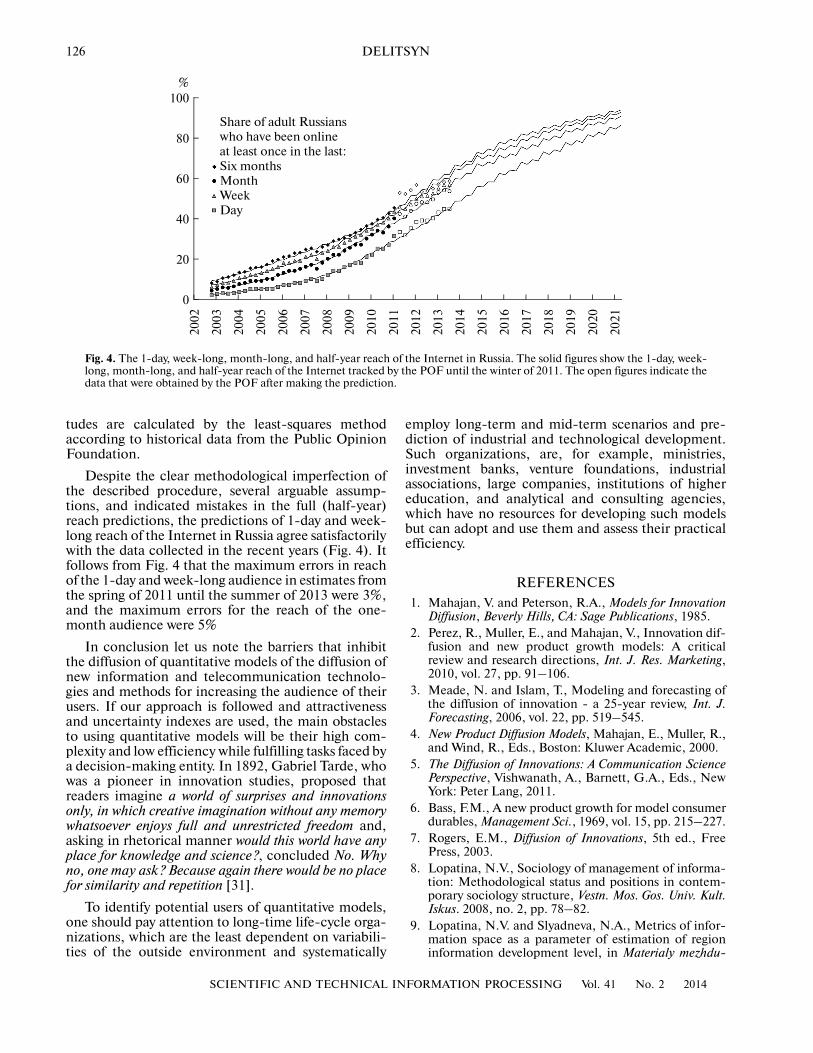
Despite the clear methodological imperfection ofthe described procedure, several arguable assump�tions, and indicated mistakes in the full (half�year)reach predictions, the predictions of 1�day and week�long reach of the Internet in Russia agree satisfactorilywith the data collected in the recent years (Fig. 4). Itfollows from Fig. 4 that the maximum errors in reachof the 1�day and week�long audience in estimates fromthe spring of 2011 until the summer of 2013 were 3%,and the maximum errors for the reach of the one�month audience were 5%
In conclusion let us note the barriers that inhibitthe diffusion of quantitative models of the diffusion ofnew information and telecommunication technolo�gies and methods for increasing the audience of theirusers. If our approach is followed and attractivenessand uncertainty indexes are used, the main obstaclesto using quantitative models will be their high com�plexity and low efficiency while fulfilling tasks faced bya decision�making entity. In 1892, Gabriel Tarde, whowas a pioneer in innovation studies, proposed thatreaders imagine a world of surprises and innovationsonly, in which creative imagination without any memorywhatsoever enjoys full and unrestricted freedom and,asking in rhetorical manner would this world have anyplace for knowledge and science?, concluded No. Whyno, one may ask? Because again there would be no placefor similarity and repetition [31].
To identify potential users of quantitative models,one should pay attention to long�time life�cycle orga�nizations, which are the least dependent on variabili�ties of the outside environment and systematically
employ long�term and mid�term scenarios and pre�diction of industrial and technological development.Such organizations, are, for example, ministries,investment banks, venture foundations, industrialassociations, large companies, institutions of highereducation, and analytical and consulting agencies,which have no resources for developing such modelsbut can adopt and use them and assess their practicalefficiency.
REFERENCES
1. Mahajan, V. and Peterson, R.A., Models for InnovationDiffusion, Beverly Hills, CA: Sage Publications, 1985.
2. Perez, R., Muller, E., and Mahajan, V., Innovation dif�fusion and new product growth models: A criticalreview and research directions, Int. J. Res. Marketing,2010, vol. 27, pp. 91–106.
3. Meade, N. and Islam, T., Modeling and forecasting ofthe diffusion of innovation � a 25�year review, Int. J.Forecasting, 2006, vol. 22, pp. 519–545.
4. New Product Diffusion Models, Mahajan, E., Muller, R.,and Wind, R., Eds., Boston: Kluwer Academic, 2000.
5. The Diffusion of Innovations: A Communication SciencePerspective, Vishwanath, A., Barnett, G.A., Eds., NewYork: Peter Lang, 2011.
6. Bass, F.M., A new product growth for model consumerdurables, Management Sci., 1969, vol. 15, pp. 215–227.
7. Rogers, E.M., Diffusion of Innovations, 5th ed., FreePress, 2003.
8. Lopatina, N.V., Sociology of management of informa�tion: Methodological status and positions in contem�porary sociology structure, Vestn. Mos. Gos. Univ. Kult.Iskus. 2008, no. 2, pp. 78–82.
9. Lopatina, N.V. and Slyadneva, N.A., Metrics of infor�mation space as a parameter of estimation of regioninformation development level, in Materialy mezhdu�
100
80
60
40
20
0
2021
2018
2016
2012
2005
2002
2003
2008
2020
2019
2017
2009
2004
2006
2013
2014
2010
2011
2015
2007
%
Share of adult Russianswho have been onlineat least once in the last:Six monthsMonthWeekDay
Fig. 4. The 1�day, week�long, month�long, and half�year reach of the Internet in Russia. The solid figures show the 1�day, week�long, month�long, and half�year reach of the Internet tracked by the POF until the winter of 2011. The open figures indicate thedata that were obtained by the POF after making the prediction.
SCIENTIFIC AND TECHNICAL INFORMATION PROCESSING Vol. 41 No. 2 2014
THE DEVELOPMENT AND USE OF QUANTITATIVE MODELS 127
nar.nauch.konf. “Regional’nye aspekty informatsionno�kul’turologicheskoi deyatel’nosti” (Proc. Int. Sci. Conf.“Regional Aspects of Information�Cultural Activity”),Krasnodar, 1998.
10. Slyadneva, N.A., Information–analytical activity:Problems and perspectives, Fakt, 2000, no. 6.
11. Delitsyn, L.L., Kolichestvennye modeli rasprostraneniyanovovvedenii v sfere informatsionnykh i telekommunikat�sionnykh tekhnologii (Quantitative Models of Innova�tion Distribution in Sphere of Information and Tele�communication Technologies), Moscow: Mos. Gos.Univ. Kult. Iskus., 2009.
12. Moore, G.A., Crossing the Chasm: Marketing and Sell�ing High�Tech Products to Mainstream Customers, 3rded., New York: Harper Collins, 2014.
13. Sladkova, O.B., Quantitative methods in socioculturalspace investigation, Lichnost’. Kul’tura. Obshchestvo2007, no. 3, pp. 113–123.
14. Kramin, T.V., To the evaluation of potential and supplystructure for the services of mobile connection in Rus�sian regions, Problemy Sovrem. Ekonom., 2004, no. 1–2, pp. 152–154.
15. Afanas’eva, K.E. and Shiryaev, V.I., Forecasting ofregional markets of net communication, ProblemyPrognoz., 2007, no. 5, pp. 97–105.
16. Deart, Yu.V., Burtsev, I.V., Krutyakov, K.A., andTsym, A.Yu., Forecasting of net communication devel�opment in Russia, Vestn. Svyaz, 2005, no. 4, C,pp. 152–155.
17. Kazantsev, S.Yu. and Frolov, I.E., State and potential ofdevelopment of infocommunication complex in Rus�sia, Problemy Prognoz., 2005, no. 3, pp. 17–40.
18. Kazantsev, S.Yu. and Frolov, I.E., Conditions andpotential of development of infocommunication com�plex, Problemy Prognoz., 2006, no. 4, pp. 80–97.
19. Centrone, F., Goia, A. and Salinelli, E., Demographicprocesses in a model of innovation diffusion with adynamic market, Technol. Forecasting Social Change,2007, vol. 74, pp. 247–266.
20. Modis, T., The end of the internet rush, Technol. Fore�casting Social Change, 2005, vol. 72, pp. 938–943.
21. Global Internet Users Forecast. Areppim Insight. http://stats.areppim.com/stats/stats_internetxfcstx2012.htm(20.01.2014)
22. Arbesman, S. and Courtland, R., 2011 preview: Peakinternet comes into view, New Scientist, 2011.
23. Varakin, L.E., Informatsionno�ekonomicheskii zakon.Vzaimosvyaz’ infokommunikatsionnoi infrastruktury iekonomiki (Information�Economic Law. Interconnec�tion of Infocommunication Infrastrucrure and Eco�nomics), Moscow: MAS, 2006.
24. Kuzovkova, T.A. and Timoshenko, L.S., Analiz i prog�nozirovanie razvitiya infokommunikatsii (Analysis andForecasting of Infocommunication Development),Moscow: Goryachaya Liniya�Telekom, 2009.
25. Perfil’ev, Yu.Yu., Rossiiskoe Internet�prostranstvo: razvi�tie i struktura (Russian Internet Space: Developmentand Structure), Moscow: Gardariki, 2003.
26. Konyavskii, V.A., Forecasting of development of Rus�sian segment of Internet until 2010, Upravlenie Zash�chitoi Informatsii, 2003, vol. 7, pp. 266–279.
27. Smolyan, G.L., Tsygichko, V.N., and Khan�Magome�dov, D.D., Internet v Rossii. Perspektivy razvitiya (Inter�net in Russia. Perspectives of Development), Moscow:Editorial URSS, 2004.
28. Delitsyn, L.L., For auditorium to get up, it is necessaryto let fall the prices, InformKurier�Svyaz’. – 2008,no. 11, pp. 45–47.
29. Delitsyn, L.L. and Matveeva, N.S., Forecasting of glo�bal Internet auditorium on the basis of its regional seg�ments dynamics, Nauch. Trudy Vol’nogo Ekonom.Obshch. Rossii, 2013, vol. 179, pp. 248–256.
30. Delitsyn, L.L., Is it possible to conform the sociologicalopinion poll data on Internet use intensity? Internet�Marketing, 2008, no. 6, pp. 334–352.
31. Tarde, G., Les lois de l’imitation Paris, 1890.
Translated by S. Kuznetsov