the democratic deficit in the states - columbia …jrl2124/democratic deficit.pdfthe democratic...
TRANSCRIPT
The Democratic Deficit in the States
Jeffrey R. Lax Columbia UniversityJustin H. Phillips Columbia University
We study how well states translate public opinion into policy. Using national surveys and advances in subnational opinionestimation, we estimate state-level support for 39 policies across eight issue areas, including abortion, law enforcement, healthcare, and education. We show that policy is highly responsive to policy-specific opinion, even controlling for other influences.But we also uncover a striking “democratic deficit”: policy is congruent with majority will only half the time. The analysisconsiders the influence of institutions, salience, partisan control of government, and interest groups on the magnitude andideological direction of this democratic deficit. We find the largest influences to be legislative professionalization, termlimits, and issue salience. Partisanship and interest groups affect the ideological balance of incongruence more than theaggregate degree thereof. Finally, policy is overresponsive to ideology and party—leading policy to be polarized relative tostate electorates.
How responsive is state policy to public opinion?Erikson, Wright, and McIver (1993) overturnedthe long-standing view that the public had lit-
tle influence and established a clear correlation betweenvoter ideology and aggregate state policy. Simply put, lib-eral states have more liberal policy. Subsequent studies ofpolicymaking at the state level have reached similar con-clusions. By this test, then, statehouse democracy receivesa passing grade.
One might worry, however, that this test is too lenient.The ideology-policy correlation is the dominant approachin studies of state responsiveness, and it has been themost fruitful approach to date. However, problems ofinference arise because researchers cannot know exactlyhow diffuse preference measures ought to translate intopolicy. That is, policy and ideology lack a common metric(Erikson, Wright, and McIver 1993, 93; Matsusaka 2001).For example, how liberal should policy be in a state inwhich 30% of voters self-identify as liberal? Clearly, policyin a state with 35% liberals should be even more liberal,but how much more? A high correlation between ideologyand policy reveals a strong relationship between the two,
Jeffrey R. Lax is Associate Professor, Department of Political Science, Columbia University, 420 W. 118th, MC3320, New York, NY 10027([email protected]). Justin H. Phillips is Associate Professor, Department of Political Science, Columbia University, 420 W. 118th,MC3320, New York, NY 10027 ([email protected]).
For helpful comments and discussion, we thank Fred Boehmke, Tom Clark, Robert Erikson, Andrew Gelman, Shigeo Hirano, AndrewKarch, Tom Ogorzalek, Robert Shapiro, Elizabeth Theiss Smith, Christopher Wlezien, and Gerald Wright. We also thank seminar/panelparticipants at the 2009 State Politics and Policy Conference, Temple University, University of California – Berkeley, Emory University, the2010 Midwest Political Science Association Annual Meeting, the 2009 American Political Science Association Annual Meeting, and at theRussell Sage Foundation. For research assistance, we thank Jared Drucker, Jacob Feldman, and Thomas Langer. Earlier drafts of this articlereceived the State Politics and Policy Quarterly Award for Best Paper presented at any professional meeting in 2009 and the Pi Sigma AlphaAward for Best Paper at the 2010 Annual Meeting of the Midwest Political Science Association. (Replication data can be obtained from theauthors or from their faculty websites.)
but without knowing the mapping of ideology to voterpolicy preferences, we cannot tell if policy is over- orunderresponsive to preferences.
Most existing work, by focusing on the ideology-policy correlation, also does not assess how responsivestates are to voter preferences on specific policies. Nor doesit tell us how effective state political systems are at translat-ing opinion majorities into public policy. If a majority ofvoters in a state wants to adopt a lottery or impose an abor-tion restriction, how likely is the state to do so? In otherwords, is policy usually congruent with majority will?
Both responsiveness and congruence are forms ofpolicy representation, but they capture different dimen-sions of democratic performance. To be clear, by respon-siveness, we mean a positive correlation between opinionand policy; by congruence, we mean that policy actu-ally matches majority opinion. Where majority will istruly sovereign, you would expect both strong respon-siveness and a high level of congruence. Policy adoptionmay increase with higher public support (suggesting re-sponsiveness), but policy may still often be inconsistentwith majority opinion (suggesting a lack of congruence),
American Journal of Political Science, Vol. 56, No. 1, January 2012, Pp. 148–166
C! 2011, Midwest Political Science Association DOI: 10.1111/j.1540-5907.2011.00537.x
148
DEMOCRATIC DEFICIT 149
perhaps because policymaking is biased in the liberal orconservative direction. In fact, there can be significantresponsiveness without congruence.
We argue that a full picture of statehouse democracyrequires studying both. The existing literature establishesa high degree of responsiveness to ideology and attitudes(this contribution should not be understated), but notgenerally to policy-specific opinion, and it cannot usuallyanswer questions about congruence. Doing so raises se-vere methodological challenges because of the lack of statepolling data and the difficulties of estimating voters’ pre-ferred policy choices. Our work relies on recent advancesin estimating state-level opinion using national data, ad-vances which enable our substantive findings about re-sponsiveness and congruence and allow us to draw outtheoretical distinctions between them.
We build on the rich state politics and public opinionliteratures to develop a distinct and fine-grained assess-ment of how well state policymaking conforms to thepublic will. Our approach reveals a rich set of new “styl-ized facts” about statehouse democracy and allows us tocarefully grade, and explain variation in, democratic per-formance in the American states. On the positive side, weshow that in a broad sweep of state policymaking there isclear influence of policy-specific opinion over and abovethe influence of diffuse voter ideology, an effect that isstrong and robust across model specifications. This isconsistent with, while also adding to, the existing liter-ature, and reveals an even more fundamental form ofresponsiveness. However, we also uncover a rather strik-ing democratic deficit in state policymaking. Roughly halfthe time, opinion majorities lose—even large superma-jorities prevail less than 60% of the time. In other words,state governments are on average no more effective intranslating opinion majorities into public policy than asimple coin flip.
Together, the presence of clear responsiveness toopinion combined with clear evidence of policy incon-gruence creates a rather complicated picture of statehousedemocracy. We might not be shocked by the democraticdeficit were policy-specific opinion irrelevant. But it cre-ates a deeper puzzle to find so large a deficit when policy-specific opinion is one of the strongest determinants ofpolicy. The early literature painted too bleak a picture bycasting the public as an ignorant and ineffectual actor atbest and finding little to no evidence of any influence ofpublic opinion. Newer literature might imply too rosy apicture.
We explore a more nuanced view of statehousedemocracy. Specifically, we study the magnitude and vari-ation of the democratic deficit across states, apportioningthe “blame” among the forces that shape congruence,and explaining the ideological direction of incongruence.
(Do the “mistakes” tend to be in the liberal or conserva-tive direction?) We consider various determinants of andconstraints on democratic performance: which state insti-tutions enhance or distort responsiveness and congruenceand whether other forces such as partisanship and interestgroup activity induce or restrain congruence. We indeedfind that the influence of opinion is particularly strongunder favorable institutional and political conditions, andfor policies of greater salience. We show that there is policybias associated with incongruence and that it is connectedto overresponsiveness to voter ideology and the distort-ing influence of party control. The net result is that statepolicy is far more polarized than public preferences.
Studies of Responsiveness
Early analyses indeed found virtually no relationship be-tween political variables and the ideological direction ofstate policy (inter alia, Dye 1966; Plotnick and Winters1985). Treadway (1985), in an influential review of thestate policy literature, blamed voters’ lack of knowledgeand interest in state politics. More recent scholarship,however, dramatically shifted the debate, showing evi-dence of a linkage between state policy and voter prefer-ences. Erikson, Wright, and McIver estimated voter lib-eralness in each state by pooling national surveys over a12-year period and found that the more liberal a state’svoters, the more liberal the state scored on a policy index:“even under adverse conditions such as the limited inter-est and information that the average voter has regardingstate politics, public opinion can serve to influence statepolicy” (1993, 253). Subsequent research, employing asimilar methodological approach, has confirmed thesefindings, and other work, such as Stimson, MacKuen,and Erikson (2002), has shown aggregate responsivenessat the national level. To be sure, some policies map quitenicely to general ideology, but some do not (Norrander2001). Others connect general attitudes (e.g., toward ho-mosexuals or feminism) to related policies and outcomes(e.g., gay marriage bans or number of abortions; Braceet al. 2002; Haider-Markel and Kaufman 2006).
As we noted in the introduction, one concern withusing ideology (and even general attitudes) is that we donot know the latent mapping from the diffuse measureto actual policy choice. Some scholars focus on attitudesand ideology because they think it too demanding toexpect detailed policy preferences from voters and toodemanding to expect statehouse democracy to functionon the basis of voters’ detailed preferences. But anotherreason is practical, not theoretical: the lack of comparableopinion polls across states. To compensate for this, stud-ies typically estimate opinion using disaggregation, a
150 JEFFREY R. LAX AND JUSTIN H. PHILLIPS
technique that pools national polls (typically over manyyears) until there are a sufficient number of survey re-spondents to calculate opinion percentages in each state.Unfortunately, polling firms do not usually ask policy-specific questions frequently enough to generate reliableestimates of policy-specific preferences. Researchers haveinstead had to limit themselves to those questions thathave been asked in dozens of compatible surveys (theoccasional policy question but usually only ideology orattitudes). This limits generalizability across policies andcan render conclusions about congruence impossible.
A small number of single-issue studies have directlyestimated voters’ preferred policy choices and comparedthose to actual state policies adopted. For example, Gerber(1996, 1999) pools several national surveys to estimatestate-level support for the death penalty and abortion re-strictions; Lax and Phillips (2009b) estimate public sup-port for eight policies regulating gay and lesbian rights;Lupia et al. (2010) uses state polls to study state con-stitutional bans on same-sex marriage; and Norrander(2000) ties death penalty–specific opinion and policy.While these studies found evidence of responsiveness,results may be difficult to generalize (Burnstein 2003).These studies focus on highly salient morality policy is-sues, and, as Lax and Phillips (2009b) demonstrate, re-sponsiveness to majority opinion is greatly enhanced bysalience.
Responsiveness vs. Congruence
We address the various concerns above by estimatingstate-level opinion across a wide range of issues usingmultilevel regression and poststratification (MRP). MRPis a technique presented by Gelman and Little (1997), val-idated by Park, Gelman, and Bafumi (2006) and Lax andPhillips (2009a), and extended in Berkman and Plutzer(2005), Lax and Phillips (2009b), and Kastellec, Lax, andPhillips (2010), inter alia. It has been shown to pro-duce highly accurate estimates even with a single nationalpoll and simple demographic-geographic models (sim-pler than we use herein). There are two stages to MRP.First, individual survey response is modeled as a func-tion of a nuanced demographic and geographic typology,using multilevel regression. For each demographic-geographic type of voter, predicted policy support is esti-mated. The second step is poststratification: the estimatesfor each demographic-geographic type are weighted bythe percentages of each type in actual state populationsusing Census data, so that we can estimate the per-centage of respondents within each state who take aparticular position. This yields estimates of explicit pol-icy support, explicit opposition, and, thereby, policy sup-
port among those with an opinion, for each policy, andfor each state. For full details of this method, see Laxand Phillips (2009a, 2009b). The demographic predictorsused here are age, education, race, and gender. The state-level variables are percentage religious conservatives and2004 Democratic presidential vote share, with state andregion modeled effects. Below we use percentage supportout of those with an opinion.
We use MRP to estimate opinion for 39 policies thatare set by state governments. These policies are drawnfrom eight issue areas: immigration, abortion, criminaljustice, health care, gay rights, electoral reform, gaming,and education. These are all issue areas that are salientand over which opinion and policy vary across states.While some, such as abortion, have been the subject ofnumerous inquiries in the opinion literature, others, suchas health care and education, have not. By consideringsuch a diverse set of policies, we can explore whetherand how responsiveness and congruence vary across issueareas.
The policies used here are clearly not a random sam-ple, and so some caution must be taken in generalizingour findings.1 However, policies were not purposefullyselected on substantive grounds or because they lined upwith traditional measures of ideology. Rather, the poli-cies included here are all those for which we were ableto obtain state policy data and at least one large nationalopinion survey (though for most policies we rely on mul-tiple surveys). We conducted our search for survey datausing iPoll from the Roper Center for Public OpinionResearch (see Supporting Information [SI] for details).State policy data were obtained as of 2008 from varioussources (SI Table 5), including advocacy groups, policyfoundations, and research organizations.
Policy and opinion are both dichotomous, so thatthey share a directly common metric (e.g., “Does the lawrequire women seeking an abortion to wait 24 hours” and“Do you favor a law requiring women seeking abortionsto wait 24 hours?”). Policy and opinion are coded to pointin the liberal direction (e.g., having the death penalty iscoded as 0; having affirmative action is coded as 1; codingsverified through factor analysis). Policies are listed below(SI Table 5 has details):
• Abortion—Require doctors to counsel patients onabortion alternatives; Require parental consentfor teenagers; Require parental notification forteenagers; Ban late-term abortions; Require a 24-hour waiting period for an abortion.
• Education—Ban race-based affirmative action foradmissions in higher education; Allow charter
1 One exception to our issue coverage is fiscal policy interpretednarrowly, though many of the policies do have fiscal implications.
DEMOCRATIC DEFICIT 151
schools; Require students to pass a standardizedtest before graduating from high school; Allow tax-funded vouchers to be used for private or religiousschools.
• Electoral Reform—Limit corporate/union cam-paign contributions; Limit individual contribu-tions; Require a photo ID to vote; Allow recallelections; Mandate legislative term limits.
• Gaming—Legalize casino gambling; Legalize astate lottery.
• Gay and Lesbian Rights—Allow second parentadoption statewide; Allow civil unions; Providehealth insurance for domestic partners of state em-ployees; Allow same-sex marriage; Legalize same-sex sodomy (as of 2003); Include sexual orientationin employment nondiscrimination laws; Includesexual orientation in hate crimes laws; Include sex-ual orientation in housing nondiscrimination laws.
• Health Care—Legalize physician-assisted suicide;Reduce the number of people who are eligible forMedicaid (in fiscal year 2005); Legalize medicalmarijuana; Extend eligibility for the State Chil-dren’s Health Insurance (SCHIP) program to chil-dren in a family of four making up to $60,000 ayear; Allow embryonic stem cell research.
• Immigration—Prohibit public schools from teach-ing the children of immigrants in their native lan-guage (bilingual education); Issue driver’s licensesto illegal immigrants; Allow the children of ille-gal immigrants to attend state public colleges anduniversities at the same in-state tuition rates asother state residents; Require the state governmentto verify citizenship status (using the federal gov-ernment’s E-Verify database) before making hiringdecisions.
• Law Enforcement—Ban assault weapons; Allowconcealed weapons; Allow the death penalty; Man-date prison sentences for nonviolent drug crimes;Decriminalize small amounts of marijuana; Re-quire a waiting period for gun purchases.
Table 1 shows the number of liberal policies and av-erage liberal opinion by state. Table 2 shows the same byissue area. Opinion and policy are mapped in Figure 1.
Responsiveness
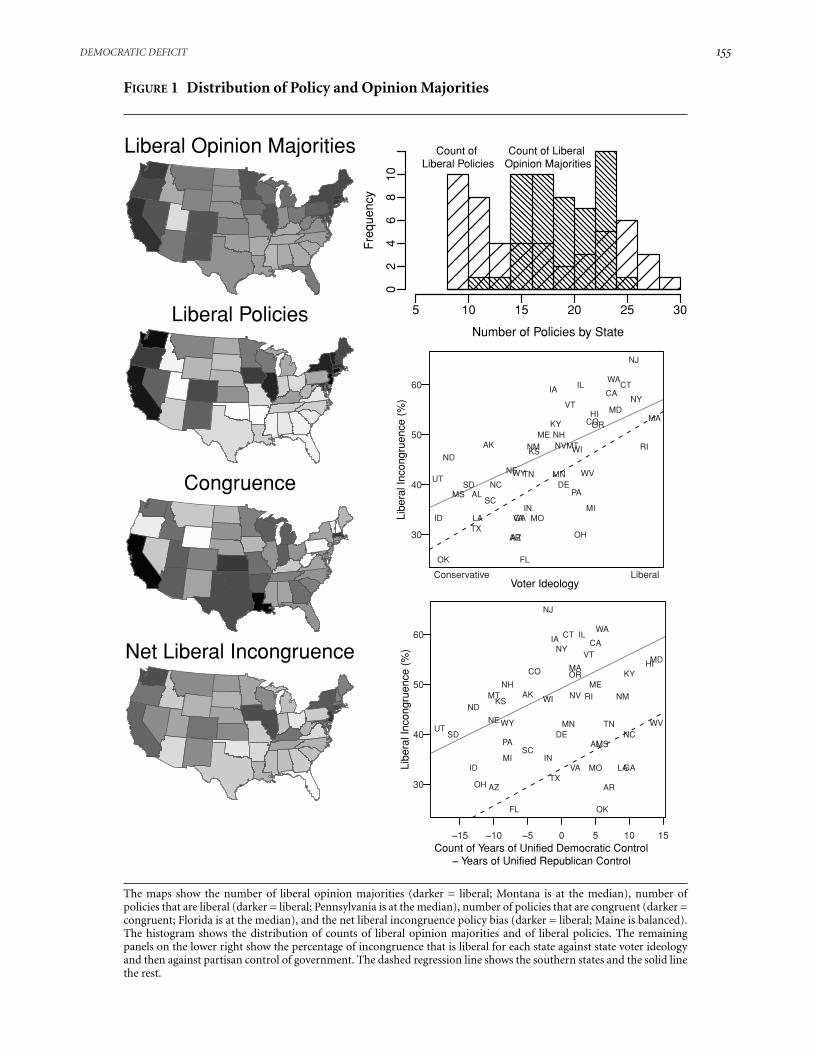
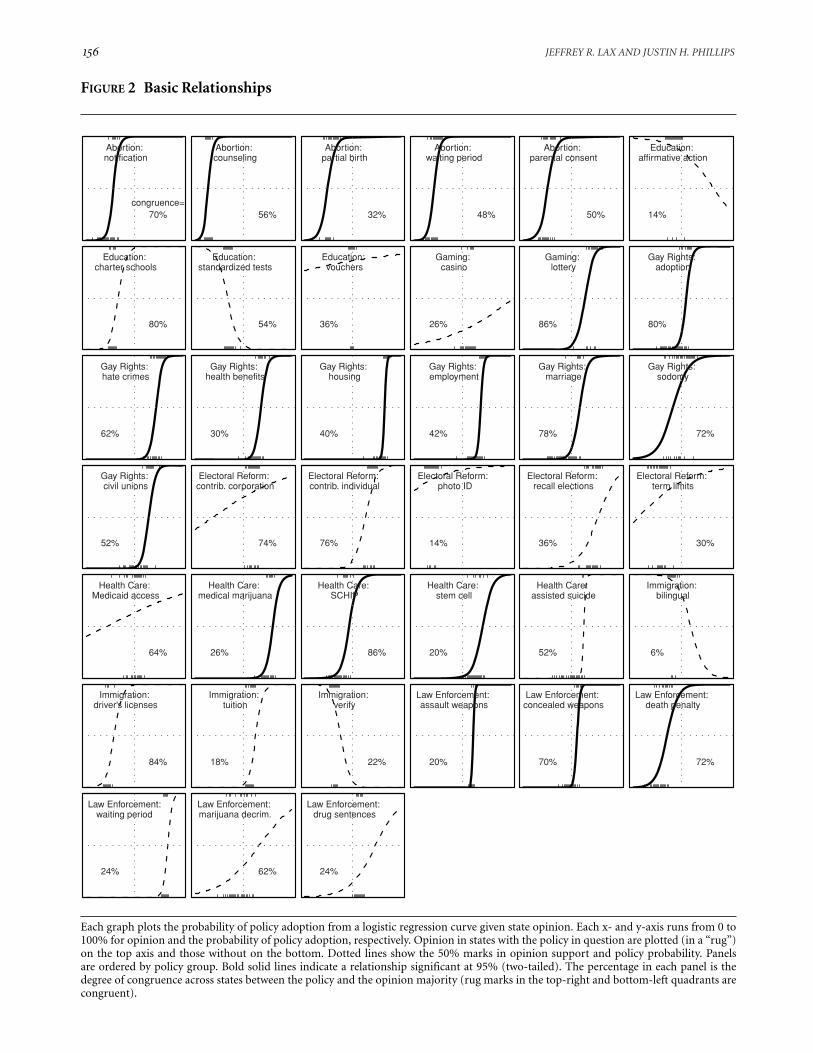
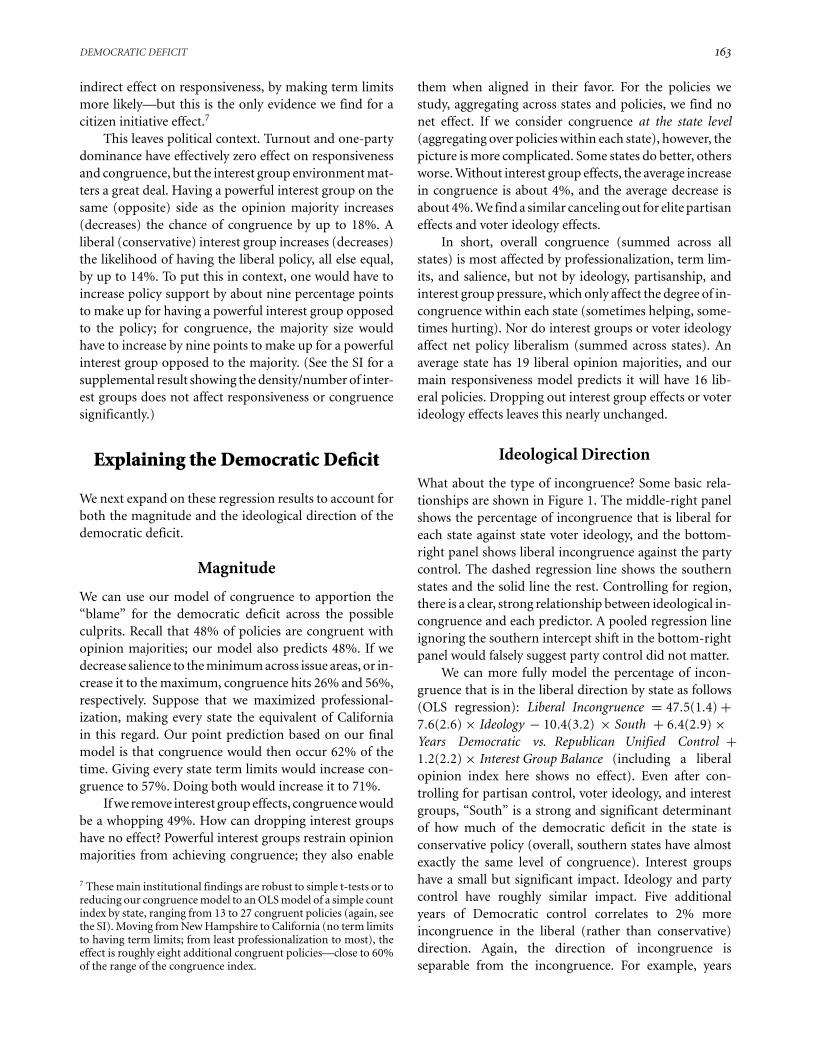
We begin by considering responsiveness at the level ofindividual policies. Each graph in Figure 2 takes a policyand plots the probability of policy adoption on the y-axis, against our estimates of state opinion on the x-axis.The small tick marks along the top (bottom) axis show theopinion in states that have (do not have) the liberal policy.
We show the logit regression curve for each panel. A pol-icy is strongly responsive if it has a steep positively slopedcurve. Bold solid curves indicate a statistically significantresponsiveness coefficient (at the 95% level). Otherwise,a dashed curve is plotted. Overall, we find strong evi-dence of responsiveness, a finding that is strengthenedlater by multivariate analysis. In all but four graphs, theprobability of having liberal policy is positively correlatedto policy-specific opinion. However, responsiveness doesvary across policies.
First, the strength of the opinion-policy relationshipdiffers, as is indicated by variation in the steepness of theregression curves. Second, policymaking often has eithera liberal or conservative bias. To see this, consider the lo-cation of the logit curves, which are sometimes shifted leftor right of center, meaning either less or more liberal opin-ion is needed, respectively, to bring about policy adop-tion. The dotted lines extending from the x- and y-axesindicate (respectively) where public support and theprobability of policy adoption each reach 50%. The pointat which the regression curve intersects the vertical dot-ted line reveals (read on the y-axis) the predicted prob-ability of policy adoption when public support is 50%.The point at which the regression curve intersects thehorizontal dotted line reveals (read on the x-axis) theneeded level of support for the predicted probability ofadoption to reach 50%. The crosshair at the intersectionof the two dotted lines marks the point at which 50%public support corresponds to a 50% chance of policyadoption.
For perfect majoritarian responsiveness, the slope ofthe estimated logit curve would be very steep at 50% andgo through the crosshair within each panel. Even whenyou have responsiveness, there are two ways to get in-congruence then. The more obvious possibility is thatthe curve goes through the crosshairs but is insufficientlysteep. The other way is policy bias: when the curve isshifted to the right of the crosshair, it means that a largelevel of liberal opinion (likely more than a majority) isneeded to bring about policy adoption. This indicates aconservative bias in policymaking (underresponsivenessto liberal opinion). When the curve is to the left of thecrosshairs, it indicates the opposite. Even a cursory glanceat Figure 2 shows that we rarely observe perfect majori-tarian control.
Congruence and the Democratic Deficit
As noted above, when policy responsiveness is weak orbiased relative to majority opinion, the consequence isat least some incongruence. Indeed, our results showclear examples of strong responsiveness (a steep curve)coinciding with frequent mismatches between majority
152 JEFFREY R. LAX AND JUSTIN H. PHILLIPS
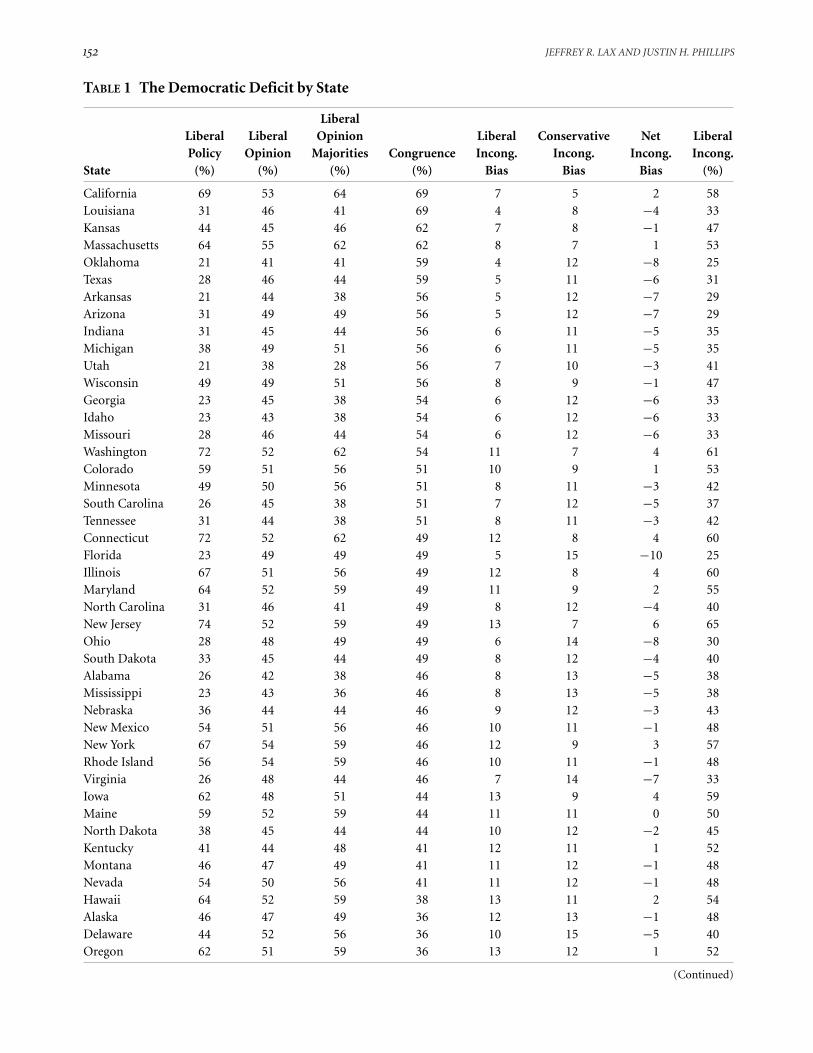
TABLE 1 The Democratic Deficit by State
LiberalLiberal Liberal Opinion Liberal Conservative Net LiberalPolicy Opinion Majorities Congruence Incong. Incong. Incong. Incong.
State (%) (%) (%) (%) Bias Bias Bias (%)
California 69 53 64 69 7 5 2 58Louisiana 31 46 41 69 4 8 "4 33Kansas 44 45 46 62 7 8 "1 47Massachusetts 64 55 62 62 8 7 1 53Oklahoma 21 41 41 59 4 12 "8 25Texas 28 46 44 59 5 11 "6 31Arkansas 21 44 38 56 5 12 "7 29Arizona 31 49 49 56 5 12 "7 29Indiana 31 45 44 56 6 11 "5 35Michigan 38 49 51 56 6 11 "5 35Utah 21 38 28 56 7 10 "3 41Wisconsin 49 49 51 56 8 9 "1 47Georgia 23 45 38 54 6 12 "6 33Idaho 23 43 38 54 6 12 "6 33Missouri 28 46 44 54 6 12 "6 33Washington 72 52 62 54 11 7 4 61Colorado 59 51 56 51 10 9 1 53Minnesota 49 50 56 51 8 11 "3 42South Carolina 26 45 38 51 7 12 "5 37Tennessee 31 44 38 51 8 11 "3 42Connecticut 72 52 62 49 12 8 4 60Florida 23 49 49 49 5 15 "10 25Illinois 67 51 56 49 12 8 4 60Maryland 64 52 59 49 11 9 2 55North Carolina 31 46 41 49 8 12 "4 40New Jersey 74 52 59 49 13 7 6 65Ohio 28 48 49 49 6 14 "8 30South Dakota 33 45 44 49 8 12 "4 40Alabama 26 42 38 46 8 13 "5 38Mississippi 23 43 36 46 8 13 "5 38Nebraska 36 44 44 46 9 12 "3 43New Mexico 54 51 56 46 10 11 "1 48New York 67 54 59 46 12 9 3 57Rhode Island 56 54 59 46 10 11 "1 48Virginia 26 48 44 46 7 14 "7 33Iowa 62 48 51 44 13 9 4 59Maine 59 52 59 44 11 11 0 50North Dakota 38 45 44 44 10 12 "2 45Kentucky 41 44 48 41 12 11 1 52Montana 46 47 49 41 11 12 "1 48Nevada 54 50 56 41 11 12 "1 48Hawaii 64 52 59 38 13 11 2 54Alaska 46 47 49 36 12 13 "1 48Delaware 44 52 56 36 10 15 "5 40Oregon 62 51 59 36 13 12 1 52
(Continued)
DEMOCRATIC DEFICIT 153
TABLE 1 Continued
LiberalLiberal Liberal Opinion Liberal Conservative Net LiberalPolicy Opinion Majorities Congruence Incong. Incong. Incong. Incong.
State (%) (%) (%) (%) Bias Bias Bias (%)
Vermont 67 54 59 36 14 11 3 56New Hampshire 59 51 59 33 13 13 0 50Pennsylvania 38 50 54 33 10 16 "6 38West Virginia 36 46 46 33 11 15 "4 42Wyoming 36 44 46 33 11 15 "4 42
min 21 38 28 33 4 5 "10 25max 74 55 64 69 14 16 6 65mean 44 48 49 48 9 11 "2 44
The first data column is the percentage of liberal policies by state (out of 39 total). The second is mean liberal opinion across policies bystate. The third is the percentage of opinion majorities that are liberal. The fourth is the percentage of policies congruent with opinionmajorities. The fifth and sixth are the counts of liberal and conservative policies that are incongruent, respectively. The final columns givethe net bias from these and the percentage of the incongruence in the liberal direction.
will and policy, due to a biased policy curve. “Health Care:Medical Marijuana” and “Health Care: SCHIP” both showa significant positive relationship between opinion andpolicy and have similarly steep responsiveness curves.When plotted, however, the curve for the latter passesthrough the 50% crosshair while the former is shiftednoticeably to the right. This shift means that support formedical marijuana has to be far above 50% (approxi-mately 70%) to have a 50% chance of policy adoption.The consequence is that congruence for medical mari-juana policy is relatively low—only 26% compared with86% for SCHIP.
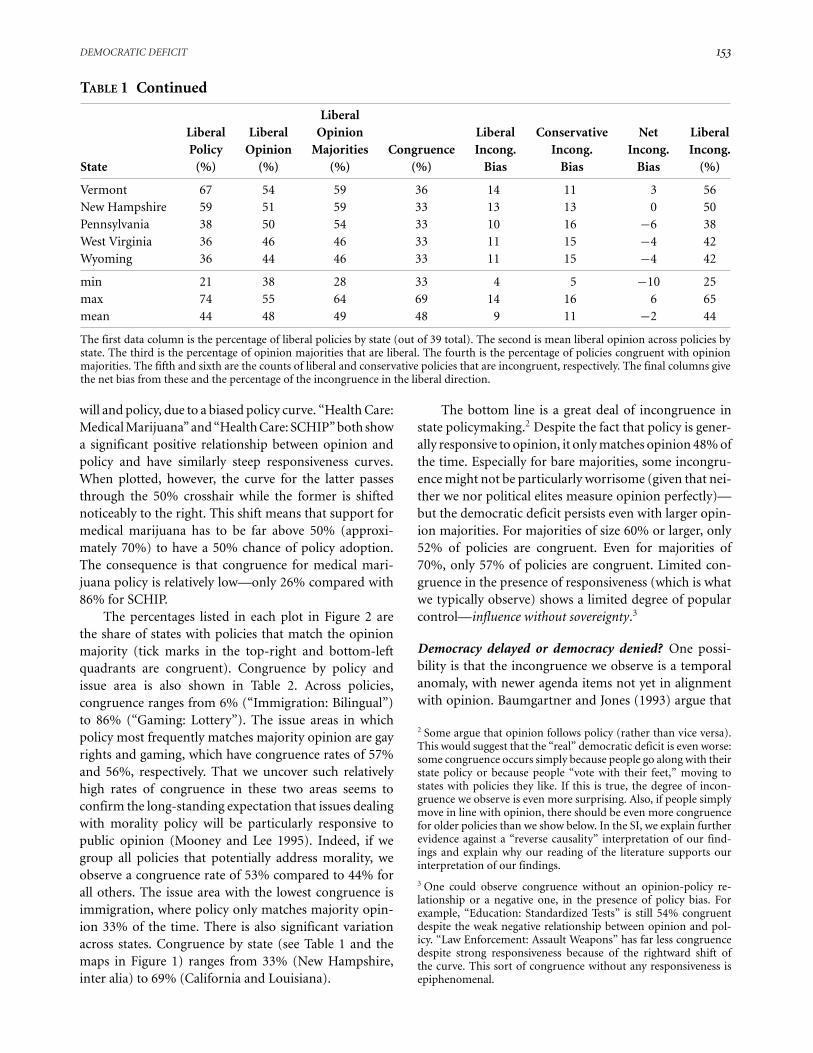
The percentages listed in each plot in Figure 2 arethe share of states with policies that match the opinionmajority (tick marks in the top-right and bottom-leftquadrants are congruent). Congruence by policy andissue area is also shown in Table 2. Across policies,congruence ranges from 6% (“Immigration: Bilingual”)to 86% (“Gaming: Lottery”). The issue areas in whichpolicy most frequently matches majority opinion are gayrights and gaming, which have congruence rates of 57%and 56%, respectively. That we uncover such relativelyhigh rates of congruence in these two areas seems toconfirm the long-standing expectation that issues dealingwith morality policy will be particularly responsive topublic opinion (Mooney and Lee 1995). Indeed, if wegroup all policies that potentially address morality, weobserve a congruence rate of 53% compared to 44% forall others. The issue area with the lowest congruence isimmigration, where policy only matches majority opin-ion 33% of the time. There is also significant variationacross states. Congruence by state (see Table 1 and themaps in Figure 1) ranges from 33% (New Hampshire,inter alia) to 69% (California and Louisiana).
The bottom line is a great deal of incongruence instate policymaking.2 Despite the fact that policy is gener-ally responsive to opinion, it only matches opinion 48% ofthe time. Especially for bare majorities, some incongru-ence might not be particularly worrisome (given that nei-ther we nor political elites measure opinion perfectly)—but the democratic deficit persists even with larger opin-ion majorities. For majorities of size 60% or larger, only52% of policies are congruent. Even for majorities of70%, only 57% of policies are congruent. Limited con-gruence in the presence of responsiveness (which is whatwe typically observe) shows a limited degree of popularcontrol—influence without sovereignty.3
Democracy delayed or democracy denied? One possi-bility is that the incongruence we observe is a temporalanomaly, with newer agenda items not yet in alignmentwith opinion. Baumgartner and Jones (1993) argue that
2 Some argue that opinion follows policy (rather than vice versa).This would suggest that the “real” democratic deficit is even worse:some congruence occurs simply because people go along with theirstate policy or because people “vote with their feet,” moving tostates with policies they like. If this is true, the degree of incon-gruence we observe is even more surprising. Also, if people simplymove in line with opinion, there should be even more congruencefor older policies than we show below. In the SI, we explain furtherevidence against a “reverse causality” interpretation of our find-ings and explain why our reading of the literature supports ourinterpretation of our findings.
3 One could observe congruence without an opinion-policy re-lationship or a negative one, in the presence of policy bias. Forexample, “Education: Standardized Tests” is still 54% congruentdespite the weak negative relationship between opinion and pol-icy. “Law Enforcement: Assault Weapons” has far less congruencedespite strong responsiveness because of the rightward shift ofthe curve. This sort of congruence without any responsiveness isepiphenomenal.
154 JEFFREY R. LAX AND JUSTIN H. PHILLIPS
TABLE 2 The Democratic Deficit by Policy and Issue Area
LiberalLiberal Liberal Opinion Liberal Conserv. Net LiberalPolicy Opinion Majorities Congruence Incong. Incong. Incong. Incong.
Issue Area Policy (%) (%) (%) (%) Bias Bias Bias (%)
Gaming lottery 86 74 100 86 0 7 "7 0Health Care SCHIP 16 36 2 86 7 0 7 100Immigration driver’s licenses 16 22 0 84 8 0 8 100Education charter schools 20 28 0 80 10 0 10 100Gay Rights adoption 18 46 34 80 1 9 "8 10Gay Rights marriage 12 44 30 78 1 10 "9 9Elect. Reform contrib. indiv. 76 70 100 76 0 12 "12 0Elect. Reform contrib. corp. 74 59 100 74 0 13 "13 0Law Enforce. death penalty 28 29 0 72 14 0 14 100Gay Rights sodomy 70 50 50 72 12 2 10 86Abortion notification 30 24 0 70 15 0 15 100Law Enforce. concealed weapons 20 50 50 70 0 15 "15 0Health Care Medicaid access 64 52 76 64 6 12 "6 33Gay Rights hate crimes 62 75 100 62 0 19 "19 0Law Enforce. marijuana decrim. 26 45 36 62 7 12 "5 37Abortion counseling 44 13 0 56 22 0 22 100Education standardized tests 46 34 0 54 23 0 23 100Gay Rights civil unions 24 56 72 52 0 24 "24 0Health Care assisted suicide 4 49 52 52 0 24 "24 0Abortion parental consent 50 25 0 50 25 0 25 100Abortion waiting period 52 21 0 48 26 0 26 100Gay Rights employment 40 67 98 42 0 29 "29 0Gay Rights housing 40 81 100 40 0 30 "30 0Elect. Reform recall elections 36 71 100 36 0 32 "32 0Education vouchers 86 49 30 36 30 2 28 94Abortion partial birth 68 28 0 32 34 0 34 100Gay Rights health benefits 28 64 98 30 0 35 "35 0Elect. Reform term limits 70 29 0 30 35 0 35 100Gaming casino 22 58 92 26 1 36 "35 3Health Care med. marijuana 26 76 100 26 0 37 "37 0Law Enforce. waiting period 24 82 100 24 0 38 "38 0Law Enforce. drug sentences 22 57 98 24 0 38 "38 0Immigration verify 78 31 0 22 39 0 39 100Law Enforce. assault weapons 20 60 100 20 0 40 "40 0Health Care stem cell 20 62 100 20 0 40 "40 0Immigration tuition 18 57 100 18 0 41 "41 0Education affirmative action 90 43 8 14 42 1 41 98Elect. Reform photo ID 86 18 0 14 43 0 43 100Immigration bilingual 94 40 0 6 47 0 47 100
Gay Rights 37 60 73 57 14 158 "144 8Gaming 54 66 96 56 1 43 "42 97Abortion 49 22 0 51 122 0 122 100Health Care (all policies) 26 55 66 50 13 113 "100 10Education 61 38 10 46 105 3 102 97Elect. Reform 68 49 60 46 78 57 21 58Law Enforce. 23 54 64 45 21 143 "122 13Immigration 52 37 25 33 94 41 53 70
The first data column is the percentage of liberal policies by policy (across the 50 states). The second is mean liberal opinion across statesby policy. The third is the percentage of opinion majorities that are liberal. The fourth is the percentage of policies congruent with opinionmajorities. The fifth and sixth are the counts of liberal and conservative policies that are incongruent, respectively. The final columns givethe net bias from these and the percentage of the incongruence that is in the liberal direction. The bottom section of the table does thesame by issue area.
DEMOCRATIC DEFICIT 155
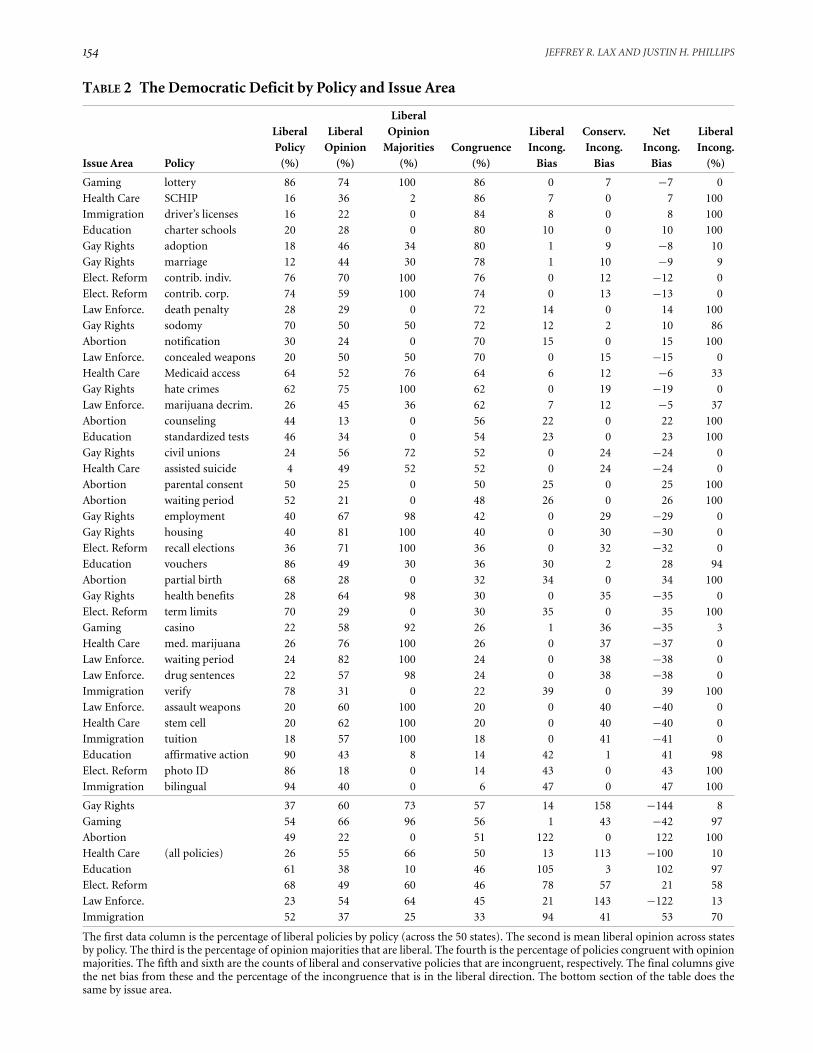
FIGURE 1 Distribution of Policy and Opinion Majorities
Liberal Opinion Majorities
Liberal Policies
Congruence
Net Liberal Incongruence
Number of Policies by State
Freq
uenc
y
5 10 15 20 25 30
02
46
810
Count of Liberal Opinion Majorities
Count of Liberal Policies
30
40
50
60
AK
AL
ARAZ
CA
CO
CT
DE
FL
GA
HI
IA
ID
IL
IN
KS
KY
LA
MAMD
ME
MI
MN
MO
MS
MT
NC
ND
NE
NH
NJ
NM NV
NY
OH
OK
OR
PA
RI
SC
SDTN
TX
UT
VA
VT
WA
WI
WVWY
LiberalConservativeVoter Ideology
Libe
ral I
ncon
grue
nce
(%)
30
40
50
60
AK
AL
ARAZ
CA
CO
CT
DE
FL
GA
HI
IA
ID
IL
IN
KS
KY
LA
MAMD
ME
MI
MN
MO
MS
MT
NC
ND
NE
NH
NJ
NMNV
NY
OH
OK
OR
PA
RI
SC
SDTN
TX
UT
VA
VT
WA
WI
WVWY
15 10 5 0 5 10 15Count of Years of Unified Democratic Control
Years of Unified Republican Control
Libe
ral I
ncon
grue
nce
(%)
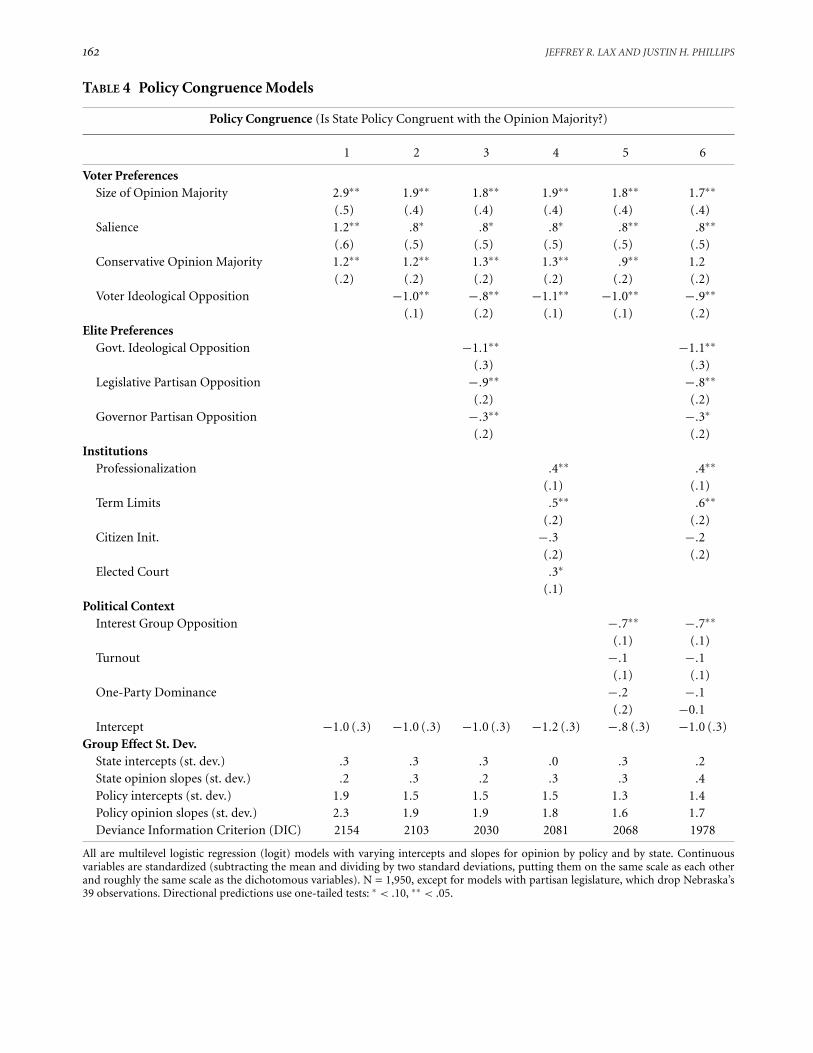
The maps show the number of liberal opinion majorities (darker = liberal; Montana is at the median), number ofpolicies that are liberal (darker = liberal; Pennsylvania is at the median), number of policies that are congruent (darker =congruent; Florida is at the median), and the net liberal incongruence policy bias (darker = liberal; Maine is balanced).The histogram shows the distribution of counts of liberal opinion majorities and of liberal policies. The remainingpanels on the lower right show the percentage of incongruence that is liberal for each state against state voter ideologyand then against partisan control of government. The dashed regression line shows the southern states and the solid linethe rest.
156 JEFFREY R. LAX AND JUSTIN H. PHILLIPS
FIGURE 2 Basic Relationships
Abortion: notification
70%congruence=
Abortion: counseling
56%
Abortion: partial birth
32%
Abortion: waiting period
48%
Abortion: parental consent
50%
Education: affirmative action
14%
Education: charter schools
80%
Education: standardized tests
54%
Education: vouchers
36%
Gaming: casino
26%
Gaming: lottery
86%
Gay Rights: adoption
80%
Gay Rights: hate crimes
62%
Gay Rights: health benefits
30%
Gay Rights: housing
40%
Gay Rights: employment
42%
Gay Rights: marriage
78%
Gay Rights: sodomy
72%
Gay Rights: civil unions
52%
Electoral Reform: contrib. corporation
74%
Electoral Reform: contrib. individual
76%
Electoral Reform: photo ID
14%
Electoral Reform: recall elections
36%
Electoral Reform: term limits
30%
Health Care: Medicaid access
64%
Health Care: medical marijuana
26%
Health Care: SCHIP
86%
Health Care: stem cell
20%
Health Care: assisted suicide
52%
Immigration: bilingual
6%
Immigration: driver's licenses
84%
Immigration: tuition
18%
Immigration: verify
22%
Law Enforcement: assault weapons
20%
Law Enforcement: concealed weapons
70%
Law Enforcement: death penalty
72%
Law Enforcement:waiting period
24%
Law Enforcement: marijuana decrim.
62%
Law Enforcement: drug sentences
24%
Each graph plots the probability of policy adoption from a logistic regression curve given state opinion. Each x- and y-axis runs from 0 to100% for opinion and the probability of policy adoption, respectively. Opinion in states with the policy in question are plotted (in a “rug”)on the top axis and those without on the bottom. Dotted lines show the 50% marks in opinion support and policy probability. Panelsare ordered by policy group. Bold solid lines indicate a relationship significant at 95% (two-tailed). The percentage in each panel is thedegree of congruence across states between the policy and the opinion majority (rug marks in the top-right and bottom-left quadrants arecongruent).
DEMOCRATIC DEFICIT 157
policymaking is an evolutionary process: change is slowand new issues create instability, taking time to move intoequilibrium. Of policies that have largely entered statepolicy agendas during the last decade or so, only 46%are congruent, compared to 50% for all remaining poli-cies. This is compatible with the view that it takes timefor policy to move into congruence with opinion. On theother hand, that so much incongruence remains even forpolicies that have long been on state agendas (e.g., recallelections, gun restrictions, etc.) suggests strongly that thedemocratic deficit we document is not simply a short-runphenomenon.
Polarized Policy, Unpolarized Voters. Incongruence canoccur when policy is liberal and the opinion majority isconservative or vice versa—and so the direction of incon-gruence can vary and not just the extent thereof. When thepolicy curve goes through the 50-50 crosshair but is in-sufficiently steep, incongruence will be balanced betweenthe liberal and conservative directions. When the curvedoes not hit this crosshair, incongruence will not be sobalanced, and indeed this is what we usually observe. Theideological tendency of state incongruence is shown in therightmost columns of Tables 1 and 2 (also see the bottommap in Figure 1). Of overall incongruence, 55% is conser-vative in direction, suggesting a conservative bias relativeto opinion majorities. The opinion majority is conser-vative and policy liberal 448 times (of 1,950 state-policycomparisons); the opinion majority is liberal and policyconservative 558 times (so net bias due to incongruenceis 110 conservative policies).4
At first glance, the ideological direction of incongru-ence correlates to the popular “red” versus “blue” statedivision of conservative and liberal states: see the bottom-left map in Figure 1, which shades states based on netliberal incongruence (e.g., a liberal state like Washingtonis quite dark because it has four more liberal incongru-ent policies than conservative incongruent policies; Okla-homa, a conservative state, is much lighter because it haseight more conservative incongruent policies than it hasliberal incongruent policies). Indeed, the middle-rightgraph in Figure 1 shows that the percentage of incongru-ence that is liberal correlates to voter ideology (we developthis analysis later).
In fact, blue states tend to go “too far” in adopting lib-eral policies and the red states go “too far” in the other di-rection. The consequences can be seen in simple counts of
4 For supermajorities of size 60% or more (1,307 state-policy com-parisons), we see a different picture: 54% of incongruence is in theliberal direction, and the net bias due to incongruence is 52 policiesin the liberal direction. This suggests that smaller liberal opinionmajorities are being frustrated in comparison to larger conservativeopinion majorities.
liberal opinion majorities and liberal policies. Histogramsof these counts are shown in the top right of Figure 1. Thepolicy count histogram is bimodal and spread out relativeto the more concentrated (darkly shaded) opinion count.All but two states have between 15 and 25 liberal opinionmajorities, yet 29 states have liberal policy counts outsidethis central region. That is, two states are “extreme” inthe number of liberal opinion majorities and 29 are “ex-treme” in actual policy. Of these 29, 22 lie outside thisrange by being more conservative than the moderate re-gion; seven lie outside to the liberal side.5 To put it simply,policy is polarized relative to public opinion, which variesmuch less across states. This polarization can also be seenby comparing the top-left policy and opinion maps inFigure 1. There are many states with middling gray levelsof opinion liberalism, whereas the policy maps show aclearer split between light and dark states. (The lightertone overall suggests a slight conservative policy bias.)
Our findings are consistent with a world in whichstates implement either a largely liberal or largely con-servative slate of policies, rather than a policy-by-policymedian voter world, in which it is possible to mix andmatch policies as preferred by opinion majorities. Thispolarization also suggests that incongruence is not ran-dom error, but rather systematic.
Explaining Variation inResponsiveness and Congruence
We now explore factors that potentially shape responsive-ness and congruence, starting with salience.
Salience. The strength of the opinion-policy linkageshould be conditioned by the salience of the policy, thatis, its importance to the public and its prominence inpublic discourse. For salient policies, citizens are morelikely to hold strong opinions, to convey those opinions totheir representatives, and to hold their representatives ac-countable (Page and Shapiro 1983). When salience is low,however, officials may be unaware of their constituents’preferences, and so might follow cues such as ideology tofill in the gaps (Druckman and Jacobs 2006). Finally, bygiving voters what they want on salient policies, legisla-tors may be more free in making other less salient policychoices, so long as they are responsive “enough.”
To measure Salience, we conducted a Proquestsearch of New York Times articles counting how often thepolicy was mentioned in some form (details available by
5 For a moderate region of 17 to 22, 25 states are extreme in opinionand 41 in policy.
158 JEFFREY R. LAX AND JUSTIN H. PHILLIPS
request), averaging within each issue area, and taking thelog number of such stories. Although obviously crude,this technique performs reasonably well, and similar mea-sures have been used with success (Haider-Markel andMeier 1996; Lax and Phillips 2009b). It is not designed tocapture variation in state media coverage; such coveragemight be endogenous to policy adoption by state, whereasthe national measure will more cleanly capture the relativevisibility of each issue. The specific issues we study varywidely in terms of their salience. Some, such as same-sexmarriage laws and abortion restrictions, have been atthe center of recent political conflict in the United States,whereas others have been less important (though nonehave been entirely absent from media coverage or statepolicy agendas).
Ideology. As we noted, politicians might cue off of voterideology in lieu of specific policy preferences, and theyno doubt want to fulfill their own ideological goals. Thus,we compare the impact of policy-specific Opinion esti-mates against voter and government ideology. Voter Lib-eralism is based on Erikson, Wright, and McIver’s ideologyscores (1993): the self-identified liberalism/conservatismof voters in national survey data. Opinion does not reduceto ideology, though they do correlate. This relationshipvaries by policy (mean correlation is .56, ranging from".83 for charter schools to +.83 for stem cell). Also, whileevery state has more self-identified conservatives than lib-erals, 49% of opinion majorities are liberal. GovernmentLiberalism is the Berry et al. (1998) ideology score forstate elected officials, based on the partisan configura-tion of state government and interest group ratings ofthe state congressional delegation (averaged 1995–2005).Higher numbers on both scores are more liberal.
Institutions. Many of the largest debates in the state pol-itics literature involve which, if any, institutional featuresof state government enhance or undercut the relationshipbetween policy and opinion. One feature is the citizeninitiative, which exists in 24 states. There are two ways itmight enhance the effects of opinion. First, when a major-ity of voters prefer an alternative policy to that of the statusquo, they can circumvent elected officials and enact theirpreferred policy outright. Second, the initiative may func-tion as a “gun behind the door,” even if it is never used.Interest groups or citizens can, in response to legislativeinaction or unpopular legislation, threaten to pursue theirpolicy goals via the initiative. This threat may then spurelected officials to make changes in their policy choices asa means of avoiding a ballot measure. Even in the absenceof an explicit threat, officials may anticipate the behavior
of potential initiative authors and draft laws in a man-ner that preempt future ballot measures. Both effects arelikely to be median enhancing (Gerber 1996, 1999).
Some disagree, given the costs of the initiative pro-cess; the role that interest groups play in writing, quali-fying, and financing ballot measures; and the limited un-derstanding that voters have of policy questions on whichthey are asked to vote (Lascher, Hagen, and Rochlin 1996).Some studies find evidence supporting the initiative ef-fect, at least in some policy areas (Arceneaux 2002; Gerber1996, 1999; Matsusaka 2010; Phillips 2008), whereas oth-ers do not find an effect (Monogan, Gray, and Lowery2009; Lascher, Hagen, and Rochlin 1996; Lax and Phillips2009b). Our policy-specific opinion measures might helpresolve this thorny debate. Citizen Initiative is an indica-tor for states that allow either constitutional or statutorycitizen initiatives.
Next, we expect that legislative professionalizationwill enhance the effects of public opinion. Some statesuse highly professional chambers that resemble the U.S.House of Representatives (e.g., California and New York),whereas others rely on “citizen” chambers (e.g., NewHampshire). Professionalized legislatures are well paid,meet in lengthy sessions, and employ numerous non-elected staff. This allows lawmakers to treat their legisla-tive service as a career. In citizen chambers, in contrast,the number of days legislators are allowed to meet is of-ten constitutionally restricted (in extreme cases, 60 or 90days biennially); compensation is low; there are few staff;and legislators hold outside jobs. Professional chambersshould have a greater capacity and resources to assessand respond to public opinion. Longer sessions allowthem to consider more issues, including those of relativelylower salience, and outside employment is less likely toconstrain attention to constituents. Seats in professionalchambers are also more valuable, so there are greater in-centives for lawmakers to be responsive (Maestas 2000).We thus expect to see greater responsiveness and morecongruence in states with professionalized legislatures.
On the other hand, some argue that professional-ization leads to elite capture of the governing apparatus(Weber 1999) and that citizen legislatures will be morein touch with the people. Still, we are not aware of anysystematic evidence that professionalization undercutsthe link between the people and policy. Our LegislativeProfessionalization measure comes from Squire (2007). Itis a weighted combination of salary, days in session, andstaff per legislator, as compared to those in Congress thesame year.
Next, term limits may reduce the capacity of lawmak-ers to assess and respond to opinion by reducing experi-ence (Kousser 2005) and may reduce incentives to respond
DEMOCRATIC DEFICIT 159
to public opinion by limiting the value of a legislative seat.On the other hand, as proponents of term limits argue,to the extent term limits induce greater turnover, theymight lead to legislators who better reflect current con-stituents’ preferences directly and might reduce the extentto which legislators are “captured” by interest groups orpolitical insiders. Additionally, they might shift a legis-lator’s attention to future statewide races (Carey, Niemi,and Powell 2000). Term Limits is our indicator for statesthat currently have such limits for legislative office.
Finally, we also might expect to observe greater re-sponsiveness and congruence in states that elect their highcourt judges (39 states require judges to be approved byvoters via a partisan, nonpartisan, or retention election).Judicial decisions on important social issues often play asignificant role in such elections. Elected Court is our indi-cator for states that elect the judges in their highest court(including partisan, nonpartisan, and retention elections;other codings yielded the same findings).
Interest Groups. All states have numerous interestgroups, with hundreds or even thousands of registeredlobbyists, representing a wide array of economic and so-cial concerns (Lowery and Gray 1995, 2004). The polit-ical power of these groups varies strongly across states(Thomas and Hrebenar 2008). To be sure, interest groupsneed not be seen as purely counterdemocratic. Thesegroups can even strengthen the effect of opinion. Therecan be policies for which lawmakers are unaware ofconstituent opinion. Furthermore, given limitations onagenda space, lawmakers simply may not have the time toconsider all policies preferred by voters. Organized inter-ests can act as information providers and can use their re-sources to pressure lawmakers to place popular measureson the agenda. They can also undertake activities to raisethe salience of a particular policy. In direct democracystates, they can circumvent the legislature entirely andpursue popular measures via the initiative process. All ofthese could strengthen the policy-opinion relationship.
On the other hand, powerful interest groups may usetheir resources to block popular policies, and elected offi-cials may be pressured to satisfy such groups instead of themedian voter (to garner campaign contributions or othertypes of support). Overall, we expect that responsivenessand congruence will be conditioned by the net balance ofpowerful interest groups in a state targeting a particularpolicy. When the interest group and the popular majorityare aligned, we should expect greater policy congruencethan when the two are opposed. If there are such groupson both sides, they can cancel out.
Powerful Interest Group Balance captures whetherthere is a powerful interest group in the state pushing forthe liberal policy (+1) or conservative policy ("1). Specif-
ically, the score is the sum of these forces within a state ona policy (so it ranges from "1 to 1, with opposing groupscanceling out at 0). First, we identified powerful interestgroups using an updated list by Thomas and Hrebenar(2008, original list), which provides an expert qualitativeevaluation of interest groups by state. We then identifiedwhich of them would normally be associated with eachpolicy, and likely position on them (see the SI). For ex-ample, we code the pharmaceutical industry (“powerful”in eight states) as preferring to allow stem cell research;and social conservative groups (“powerful” in 24 states)to oppose it. Given overlap, four states get scored +1; 20at "1; and 26 at 0 (due to neither or both being powerfulin the state).
Party Politics. Finally, there is the role of elite partypolitics, namely the impact of party control of thelegislature and governorship. We would expect that thestronger the hold of the Republican (Democratic) partyon the state government, the more conservative (liberal)state policy will be, holding policy support constant.When party pressures and public preferences both pushfor a particular policy, we should be far more likely tosee congruence. Besides party, we also control for theideological liberalness of state governments. Closelyrelated to partisan control is electoral competition.When one party dominates the electoral landscape,monopolizing the reins of government, we would expectpublic influence to be more limited than when the partiesare actively competing for support.
We calculated the Democrats’ mean share of statelegislative seats (averaging the two chambers) over theperiod 1990 to 2007, as well as the amount of time theycontrolled the governorship in each state. We call theseDemocratic Legislature % and Democratic Governor %.We next calculate, by state, the number of years of unifiedDemocratic control and the number of years of unifiedRepublican control. One-Party Dominance is the absolutevalue of the difference between them (a state has a lowscore if it rarely has unified government or does have itbut party control flips back and forth; if it usually hasunified partisan control by one party and not the other,it will have a high score).
Finally, we control for another aspect of politicalcontext, Turnout averaged over the last three presiden-tial elections (broader participation might induce greatercongruence).
Results
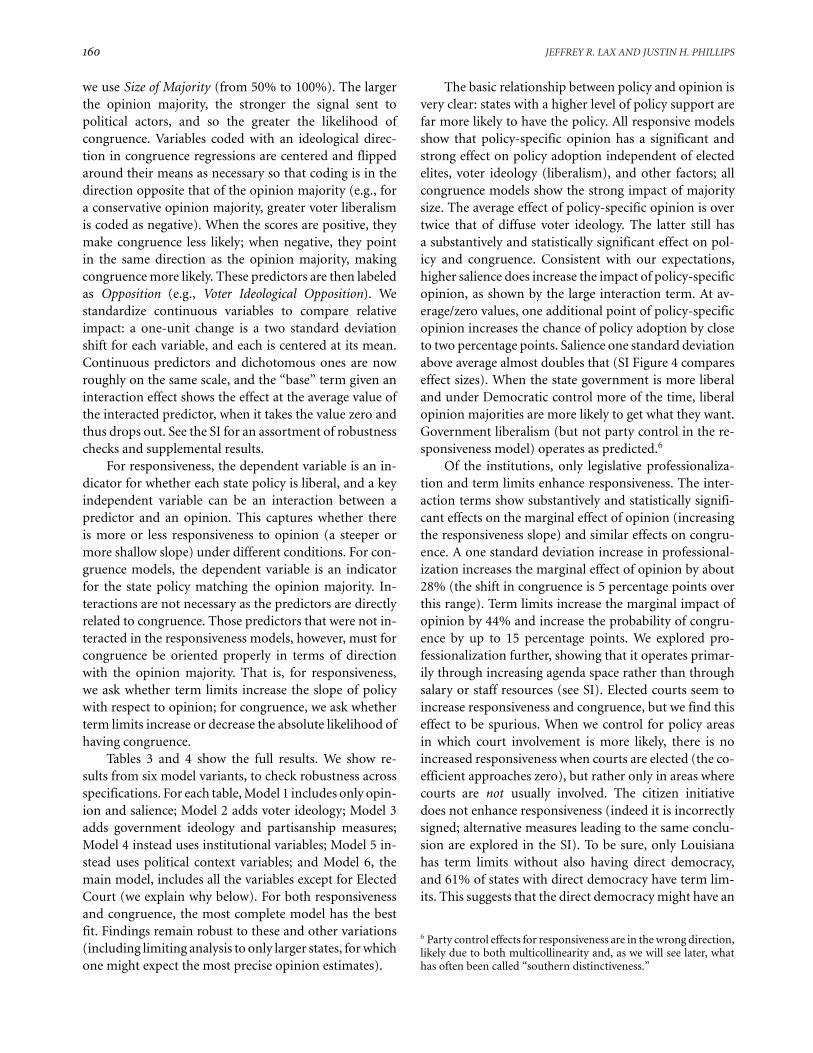
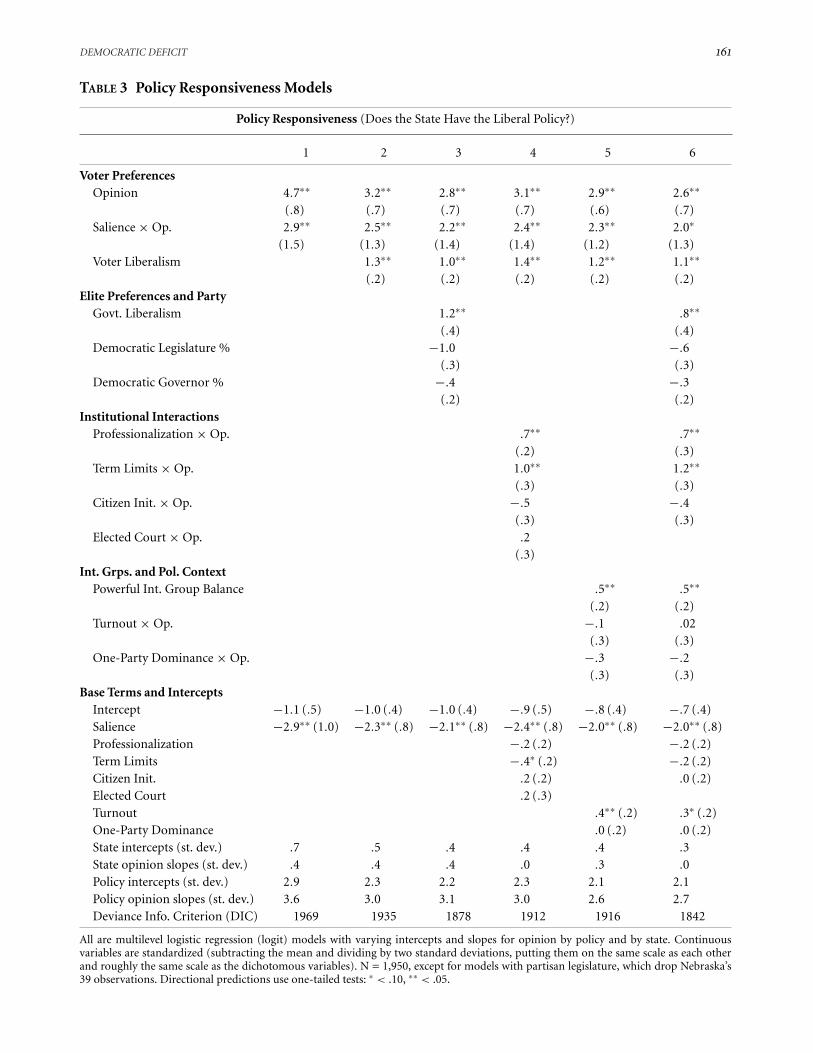
Explaining Responsiveness and Congruence. Wemove now to multilevel logistic regression models ofresponsiveness and congruence. For congruence models,
160 JEFFREY R. LAX AND JUSTIN H. PHILLIPS
we use Size of Majority (from 50% to 100%). The largerthe opinion majority, the stronger the signal sent topolitical actors, and so the greater the likelihood ofcongruence. Variables coded with an ideological direc-tion in congruence regressions are centered and flippedaround their means as necessary so that coding is in thedirection opposite that of the opinion majority (e.g., fora conservative opinion majority, greater voter liberalismis coded as negative). When the scores are positive, theymake congruence less likely; when negative, they pointin the same direction as the opinion majority, makingcongruence more likely. These predictors are then labeledas Opposition (e.g., Voter Ideological Opposition). Westandardize continuous variables to compare relativeimpact: a one-unit change is a two standard deviationshift for each variable, and each is centered at its mean.Continuous predictors and dichotomous ones are nowroughly on the same scale, and the “base” term given aninteraction effect shows the effect at the average value ofthe interacted predictor, when it takes the value zero andthus drops out. See the SI for an assortment of robustnesschecks and supplemental results.
For responsiveness, the dependent variable is an in-dicator for whether each state policy is liberal, and a keyindependent variable can be an interaction between apredictor and an opinion. This captures whether thereis more or less responsiveness to opinion (a steeper ormore shallow slope) under different conditions. For con-gruence models, the dependent variable is an indicatorfor the state policy matching the opinion majority. In-teractions are not necessary as the predictors are directlyrelated to congruence. Those predictors that were not in-teracted in the responsiveness models, however, must forcongruence be oriented properly in terms of directionwith the opinion majority. That is, for responsiveness,we ask whether term limits increase the slope of policywith respect to opinion; for congruence, we ask whetherterm limits increase or decrease the absolute likelihood ofhaving congruence.
Tables 3 and 4 show the full results. We show re-sults from six model variants, to check robustness acrossspecifications. For each table, Model 1 includes only opin-ion and salience; Model 2 adds voter ideology; Model 3adds government ideology and partisanship measures;Model 4 instead uses institutional variables; Model 5 in-stead uses political context variables; and Model 6, themain model, includes all the variables except for ElectedCourt (we explain why below). For both responsivenessand congruence, the most complete model has the bestfit. Findings remain robust to these and other variations(including limiting analysis to only larger states, for whichone might expect the most precise opinion estimates).
The basic relationship between policy and opinion isvery clear: states with a higher level of policy support arefar more likely to have the policy. All responsive modelsshow that policy-specific opinion has a significant andstrong effect on policy adoption independent of electedelites, voter ideology (liberalism), and other factors; allcongruence models show the strong impact of majoritysize. The average effect of policy-specific opinion is overtwice that of diffuse voter ideology. The latter still hasa substantively and statistically significant effect on pol-icy and congruence. Consistent with our expectations,higher salience does increase the impact of policy-specificopinion, as shown by the large interaction term. At av-erage/zero values, one additional point of policy-specificopinion increases the chance of policy adoption by closeto two percentage points. Salience one standard deviationabove average almost doubles that (SI Figure 4 compareseffect sizes). When the state government is more liberaland under Democratic control more of the time, liberalopinion majorities are more likely to get what they want.Government liberalism (but not party control in the re-sponsiveness model) operates as predicted.6
Of the institutions, only legislative professionaliza-tion and term limits enhance responsiveness. The inter-action terms show substantively and statistically signifi-cant effects on the marginal effect of opinion (increasingthe responsiveness slope) and similar effects on congru-ence. A one standard deviation increase in professional-ization increases the marginal effect of opinion by about28% (the shift in congruence is 5 percentage points overthis range). Term limits increase the marginal impact ofopinion by 44% and increase the probability of congru-ence by up to 15 percentage points. We explored pro-fessionalization further, showing that it operates primar-ily through increasing agenda space rather than throughsalary or staff resources (see SI). Elected courts seem toincrease responsiveness and congruence, but we find thiseffect to be spurious. When we control for policy areasin which court involvement is more likely, there is noincreased responsiveness when courts are elected (the co-efficient approaches zero), but rather only in areas wherecourts are not usually involved. The citizen initiativedoes not enhance responsiveness (indeed it is incorrectlysigned; alternative measures leading to the same conclu-sion are explored in the SI). To be sure, only Louisianahas term limits without also having direct democracy,and 61% of states with direct democracy have term lim-its. This suggests that the direct democracy might have an
6 Party control effects for responsiveness are in the wrong direction,likely due to both multicollinearity and, as we will see later, whathas often been called “southern distinctiveness.”
DEMOCRATIC DEFICIT 161
TABLE 3 Policy Responsiveness Models
Policy Responsiveness (Does the State Have the Liberal Policy?)
1 2 3 4 5 6
Voter PreferencesOpinion 4.7## 3.2## 2.8## 3.1## 2.9## 2.6##
(.8) (.7) (.7) (.7) (.6) (.7)Salience $ Op. 2.9## 2.5## 2.2## 2.4## 2.3## 2.0#
(1.5) (1.3) (1.4) (1.4) (1.2) (1.3)Voter Liberalism 1.3## 1.0## 1.4## 1.2## 1.1##
(.2) (.2) (.2) (.2) (.2)Elite Preferences and Party
Govt. Liberalism 1.2## .8##
(.4) (.4)Democratic Legislature % "1.0 ".6
(.3) (.3)Democratic Governor % ".4 ".3
(.2) (.2)Institutional Interactions
Professionalization $ Op. .7## .7##
(.2) (.3)Term Limits $ Op. 1.0## 1.2##
(.3) (.3)Citizen Init. $ Op. ".5 ".4
(.3) (.3)Elected Court $ Op. .2
(.3)Int. Grps. and Pol. Context
Powerful Int. Group Balance .5## .5##
(.2) (.2)Turnout $ Op. ".1 .02
(.3) (.3)One-Party Dominance $ Op. ".3 ".2
(.3) (.3)Base Terms and Intercepts
Intercept "1.1 (.5) "1.0 (.4) "1.0 (.4) ".9 (.5) ".8 (.4) ".7 (.4)Salience "2.9## (1.0) "2.3## (.8) "2.1## (.8) "2.4## (.8) "2.0## (.8) "2.0## (.8)Professionalization ".2 (.2) ".2 (.2)Term Limits ".4# (.2) ".2 (.2)Citizen Init. .2 (.2) .0 (.2)Elected Court .2 (.3)Turnout .4## (.2) .3# (.2)One-Party Dominance .0 (.2) .0 (.2)State intercepts (st. dev.) .7 .5 .4 .4 .4 .3State opinion slopes (st. dev.) .4 .4 .4 .0 .3 .0Policy intercepts (st. dev.) 2.9 2.3 2.2 2.3 2.1 2.1Policy opinion slopes (st. dev.) 3.6 3.0 3.1 3.0 2.6 2.7Deviance Info. Criterion (DIC) 1969 1935 1878 1912 1916 1842
All are multilevel logistic regression (logit) models with varying intercepts and slopes for opinion by policy and by state. Continuousvariables are standardized (subtracting the mean and dividing by two standard deviations, putting them on the same scale as each otherand roughly the same scale as the dichotomous variables). N = 1,950, except for models with partisan legislature, which drop Nebraska’s39 observations. Directional predictions use one-tailed tests: # < .10, ## < .05.
162 JEFFREY R. LAX AND JUSTIN H. PHILLIPS
TABLE 4 Policy Congruence Models
Policy Congruence (Is State Policy Congruent with the Opinion Majority?)
1 2 3 4 5 6
Voter PreferencesSize of Opinion Majority 2.9## 1.9## 1.8## 1.9## 1.8## 1.7##
(.5) (.4) (.4) (.4) (.4) (.4)Salience 1.2## .8# .8# .8# .8## .8##
(.6) (.5) (.5) (.5) (.5) (.5)Conservative Opinion Majority 1.2## 1.2## 1.3## 1.3## .9## 1.2
(.2) (.2) (.2) (.2) (.2) (.2)Voter Ideological Opposition "1.0## ".8## "1.1## "1.0## ".9##
(.1) (.2) (.1) (.1) (.2)Elite Preferences
Govt. Ideological Opposition "1.1## "1.1##
(.3) (.3)Legislative Partisan Opposition ".9## ".8##
(.2) (.2)Governor Partisan Opposition ".3## ".3#
(.2) (.2)Institutions
Professionalization .4## .4##
(.1) (.1)Term Limits .5## .6##
(.2) (.2)Citizen Init. ".3 ".2
(.2) (.2)Elected Court .3#
(.1)Political Context
Interest Group Opposition ".7## ".7##
(.1) (.1)Turnout ".1 ".1
(.1) (.1)One-Party Dominance ".2 ".1
(.2) "0.1Intercept "1.0 (.3) "1.0 (.3) "1.0 (.3) "1.2 (.3) ".8 (.3) "1.0 (.3)
Group Effect St. Dev.State intercepts (st. dev.) .3 .3 .3 .0 .3 .2State opinion slopes (st. dev.) .2 .3 .2 .3 .3 .4Policy intercepts (st. dev.) 1.9 1.5 1.5 1.5 1.3 1.4Policy opinion slopes (st. dev.) 2.3 1.9 1.9 1.8 1.6 1.7Deviance Information Criterion (DIC) 2154 2103 2030 2081 2068 1978
All are multilevel logistic regression (logit) models with varying intercepts and slopes for opinion by policy and by state. Continuousvariables are standardized (subtracting the mean and dividing by two standard deviations, putting them on the same scale as each otherand roughly the same scale as the dichotomous variables). N = 1,950, except for models with partisan legislature, which drop Nebraska’s39 observations. Directional predictions use one-tailed tests: # < .10, ## < .05.
DEMOCRATIC DEFICIT 163
indirect effect on responsiveness, by making term limitsmore likely—but this is the only evidence we find for acitizen initiative effect.7
This leaves political context. Turnout and one-partydominance have effectively zero effect on responsivenessand congruence, but the interest group environment mat-ters a great deal. Having a powerful interest group on thesame (opposite) side as the opinion majority increases(decreases) the chance of congruence by up to 18%. Aliberal (conservative) interest group increases (decreases)the likelihood of having the liberal policy, all else equal,by up to 14%. To put this in context, one would have toincrease policy support by about nine percentage pointsto make up for having a powerful interest group opposedto the policy; for congruence, the majority size wouldhave to increase by nine points to make up for a powerfulinterest group opposed to the majority. (See the SI for asupplemental result showing the density/number of inter-est groups does not affect responsiveness or congruencesignificantly.)
Explaining the Democratic Deficit
We next expand on these regression results to account forboth the magnitude and the ideological direction of thedemocratic deficit.
Magnitude
We can use our model of congruence to apportion the“blame” for the democratic deficit across the possibleculprits. Recall that 48% of policies are congruent withopinion majorities; our model also predicts 48%. If wedecrease salience to the minimum across issue areas, or in-crease it to the maximum, congruence hits 26% and 56%,respectively. Suppose that we maximized professional-ization, making every state the equivalent of Californiain this regard. Our point prediction based on our finalmodel is that congruence would then occur 62% of thetime. Giving every state term limits would increase con-gruence to 57%. Doing both would increase it to 71%.
If we remove interest group effects, congruence wouldbe a whopping 49%. How can dropping interest groupshave no effect? Powerful interest groups restrain opinionmajorities from achieving congruence; they also enable
7 These main institutional findings are robust to simple t-tests or toreducing our congruence model to an OLS model of a simple countindex by state, ranging from 13 to 27 congruent policies (again, seethe SI). Moving from New Hampshire to California (no term limitsto having term limits; from least professionalization to most), theeffect is roughly eight additional congruent policies—close to 60%of the range of the congruence index.
them when aligned in their favor. For the policies westudy, aggregating across states and policies, we find nonet effect. If we consider congruence at the state level(aggregating over policies within each state), however, thepicture is more complicated. Some states do better, othersworse. Without interest group effects, the average increasein congruence is about 4%, and the average decrease isabout 4%. We find a similar canceling out for elite partisaneffects and voter ideology effects.
In short, overall congruence (summed across allstates) is most affected by professionalization, term lim-its, and salience, but not by ideology, partisanship, andinterest group pressure, which only affect the degree of in-congruence within each state (sometimes helping, some-times hurting). Nor do interest groups or voter ideologyaffect net policy liberalism (summed across states). Anaverage state has 19 liberal opinion majorities, and ourmain responsiveness model predicts it will have 16 lib-eral policies. Dropping out interest group effects or voterideology effects leaves this nearly unchanged.
Ideological Direction
What about the type of incongruence? Some basic rela-tionships are shown in Figure 1. The middle-right panelshows the percentage of incongruence that is liberal foreach state against state voter ideology, and the bottom-right panel shows liberal incongruence against the partycontrol. The dashed regression line shows the southernstates and the solid line the rest. Controlling for region,there is a clear, strong relationship between ideological in-congruence and each predictor. A pooled regression lineignoring the southern intercept shift in the bottom-rightpanel would falsely suggest party control did not matter.
We can more fully model the percentage of incon-gruence that is in the liberal direction by state as follows(OLS regression): Liberal Incongruence = 47.5(1.4) +7.6(2.6) $ Ideology " 10.4(3.2) $ South + 6.4(2.9) $Years Democratic vs. Republican Unified Control +1.2(2.2) $ Interest Group Balance (including a liberalopinion index here shows no effect). Even after con-trolling for partisan control, voter ideology, and interestgroups, “South” is a strong and significant determinantof how much of the democratic deficit in the state isconservative policy (overall, southern states have almostexactly the same level of congruence). Interest groupshave a small but significant impact. Ideology and partycontrol have roughly similar impact. Five additionalyears of Democratic control correlates to 2% moreincongruence in the liberal (rather than conservative)direction. Again, the direction of incongruence isseparable from the incongruence. For example, years
164 JEFFREY R. LAX AND JUSTIN H. PHILLIPS
of unified control (or even uncompetitive one-partydominance) do not seem to lead to more congruence,yet unified partisan control does predict the form ofincongruence.
Conditional on there being incongruence, ideologicalor partisan factors affect the direction of incongruence.And the result is polarized policy. The histograms inFigure 1 showed the wider spread of liberal policy countsrelative to the spread of liberal opinion majorities. Oneway to measure polarization is the standard deviation ofthe liberal policy count relative to that of the liberal opin-ion majority count. The current policy count standarddeviation is 7.0. Removing interest group effects only re-duces this to 6.7. Removing voter ideology effects, on theother hand, would reduce the standard deviation of statepolicy counts to 3.8, much closer to the 3.4 standard de-viation in liberal opinion majority counts. Overrespon-siveness to ideology is thus responsible for most of thepolarization we observe.
Conclusion
What do our results tell us about the quality of democraticgovernment at the state level? First, state governments aregenerally responsive to voter preferences across a widerange of issue areas, particularly when salience is high,even after controlling for the ideology of state voters andelected elites. Policy-specific opinion often has the largestsubstantive impact, indicating that it is indeed a key driverof policymaking.
We agree that “state political structures appear to do agood job in delivering more liberal policies to more liberalstates and more conservative policies to more conserva-tive states” (Erikson, Wright, and McIver, 1993, 95). Ourfindings, however, suggest a far deeper form of represen-tation than simple ideological correspondence. It is notonly that more liberal states have more liberal policies,but that states with voters who want a specific policy aremore likely to get it.
That policy-specific opinion is such a strong predic-tor of policy seems reassuring as to the ability of stategovernment to reflect constituent will. Indeed, it sug-gests that the states should earn a rather respectable gradefor the responsiveness portion of the democratic per-formance test. However, we have also uncovered a clear“democratic deficit”—states effectively translate majorityopinion into policy only about half the time, a clear “fail-ing” grade on the congruence test. This is true even whenmajorities are large and when salience is high, which raises
significant questions about the democratic performanceof state government.8
For aggregate congruence, salience and (some) in-stitutional effects are far more important than interestgroup or partisan effects. That said, these forces do tell usin which ideological direction policy will “err” within eachstate when it does not match opinion majorities. It is notthat conservative states have only conservative opinionmajorities, and thus only liberal incongruence. Rather,they instead have too many conservative policies relativeto their number of conservative opinion majorities. Theideological direction of incongruence correlates to thestandard red-state/blue-state map. In states where votersare ideologically conservative, policy, when incongruentwith opinion majorities, tends to be more conservativethan preferred by the median voter on that policy (that is,incongruence occurs in the form of liberal opinion ma-jorities and conservative policy). In liberal states, the op-posite is true. Thus, states tend to “overshoot” relative tothe median voter’s specific policy preferences. This leadsto greater policy polarization than is warranted by suchpreferences, caused primarily by over-“responsiveness”to voter ideology. The bottom line is polarized (ideolog-ically sorted) state policy slates, relative to less polarized(ideologically mixed) opinion majorities.9 Perhaps thisis a consequence of a well-ordered two-party system, inwhich the parties form distinct blocs.
Clearly, responsiveness to voter ideology is still an im-portant form of responsiveness, even if we might think re-sponsiveness to policy-specific opinion preferable at leastsome of the time. State lawmakers might be doing the bestthey can to represent their constituents given insufficientinformation about preferences. Indeed, given the limitsof specific responsiveness, overresponsiveness to ideol-ogy can sometimes be helpful, particularly when opinionmajorities are in line with ideology. Of course, politi-cians could simply be satisfying their ideological base inspite of majority opinion. The median voter simply mightnot have sufficient intensity of opinion for some poli-cies, so that politicians know they can shirk. Again, the
8 One could, of course, prefer incongruence on normativegrounds—e.g., women’s rights groups would not be unhappy whenmajority opinion support for abortion restrictions goes unsatisfied,and nor would gay rights opponents be unhappy with unsatisfiedmajority support for employment nondiscrimination for gays andlesbians.
9 Note that detecting this would be quite difficult without opinionand policy measured on the same scale (and without the MRPtechnology). It also suggests that some of the relationship be-tween ideology and policy found in previous work might be over-responsiveness (as was cautioned by Erikson, Wright, and McIver1993, 93).
DEMOCRATIC DEFICIT 165
two-party system makes it more difficult to hold law-makers accountable policy by policy. Finally, some poli-cies may be easier to frame and defend to the public insymbolic or ideological terms, rather than policy-specificterms.
Institutional design can enhance responsiveness andcongruence. We find that legislative professionalizationhas a strong, robust, and positive effect on both respon-siveness and congruence. To the extent that profession-alization leads to disadvantages such as insulation oflegislators, this effect seems overridden by itsresponsiveness-enhancing effects. Interestingly, somehave pushed to roll back professionalization to punishunpopular legislators and in response to perceived stategovernment failure (e.g., a ballot measure in Californiacalled the “Citizen Legislature Act” to make its legislaturepart-time). Ironically, then, concerns about shortfalls ingovernment performance may lead to greater shortfalls ingovernment performance. Indeed, we find that the lengthof legislative sessions is the key component of profession-alization (so that the California ballot measure wouldbe particularly counterproductive). The only other in-stitutional feature found to increase responsiveness andcongruence is term limits. On the other hand, the citizeninitiative (even at high levels of use) and an elected judi-ciary do not seem to do much for majoritarianism. Theterm limits effect may be an indirect effect of the citizeninitiative, to the extent that term limits are almost neverenacted in states without the initiative.10
The opinion-policy relationship is also affected byinterest group balance, but our policy-specific interestgroup scores show that the effects are not black-and-white. Interest groups can enable or block opinion ma-jorities. Because of this and because the balance of interestgroups is the key, interest groups have only a small impacton the net amount of incongruence and net number ofliberal policies. They do have a disparate impact acrossstates: whereas some states would have higher congruencewithout interest groups, other states would have lowercongruence.
Finally, our analysis has important implications forour assessment of American federalism. Some argue thatstate governments, being closer to the people, are bet-ter able to tailor public policy to the preferences of theirconstituents than is the national government. Allowingstates to set policy thus accommodates heterogeneous
10 Of course, if institutional “effects” are simply spurious correla-tions, that would not change the fact that states are performingquite poorly in congruence. Future work could consider this fur-ther, examine temporal dynamics, and study congruence patternsin more detail.
preferences across jurisdictions and improves aggregatewelfare. The strength of this claim, however, rests uponthe heretofore untested assumption that state elected of-ficials effectively match policy to local opinion. We showclear evidence to the contrary. While a strong relationshipbetween state ideology and government policy is certainlysuggestive of of good democratic performance as well assuggesting federalism is welfare improving, we show thateven this strong relationship can mask potentially signif-icant shortcomings in statehouse democracy.11
References
Arceneaux, Kevin. 2002. “Direct Democracy and the Link be-tween Public Opinion and State Abortion Policy.” State Pol-itics and Policy Quarterly 2(4): 372–88.
Baumgartner, Frank R., and Bryan D. Jones. 1993. Agendaand Instability in American Politics. Chicago: University ofChicago Press.
Berkman, Michael B., and Eric Plutzer. 2005. Ten ThousandDemocracies: Politics and Public Opinion in America’s SchoolDistricts. Washington, DC: Georgetown University Press.
Berry, William D., Evan J. Ringquist, Richard C. Fording, andRussell L. Hanson. 1998. “Measuring Citizen and Govern-ment Ideology in the American States, 1960–93.” AmericanJournal of Political Science 42(1): 327–48.
Brace, Paul, Kellie Sims-Butler, Kevin Arceneaux, and MartinJohnson. 2002. “Public Opinion in the American States: NewPerspectives Using National Survey Data.” American Journalof Political Science 46(1): 173–89.
Carey, John M., Richard G. Niemi, and Lynda W. Powell. 2000.Term Limits in State Legislatures. Ann Arbor: University ofMichigan Press.
Druckman, James N., and Lawrence R. Jacobs. 2006. “Lumpersand Splitters: The Public Opinion Information That Politi-cians Collect and Use.” Public Opinion Quarterly 70:453–76.
Dye, Thomas R. 1966. Politics, Economics, and the Public: Politi-cal Outcomes in the American States. Chicago: Rand McNally.
Erikson, Robert S., Gerald C. Wright, and John P. McIver. 1993.Statehouse Democracy: Public Opinion and Policy in the Amer-ican States. Cambridge: Cambridge University Press.
Gelman, Andrew, and Thomas C. Little. 1997. “Poststratifica-tion into Many Categories Using Hierarchical Logistic Re-gression.” Survey Methodology 23(2): 127–35.
Gerber, Elisabeth R. 1996. “Legislative Response to the Threat ofthe Popular Initiative.” American Journal of Political Science40: 99–128.
11 Our ability to explore these shortcomings, differences betweencongruence and responsiveness, and the ideological bias in policy-making is a direct payoff of being able to put policy and opinion onthe same metric. Key to this are the MRP opinion estimation tech-nique and the “crosshair technology” used to assess responsiveness.
166 JEFFREY R. LAX AND JUSTIN H. PHILLIPS
Gerber, Elisabeth R. 1999. The Populist Paradox: Interest GroupInfluence and the Promise of Direct Legislation. Princeton, NJ:Princeton University Press.
Haider-Markel, Donald P., and Matthew S. Kaufman. 2006.“Public Opinion and Policy Making in the Culture Wars: IsThere a Connection Between Opinion and State Policy onGay and Lesbian Issues?” In Public Opinion in State Politics,ed. Jeffrey E. Cohen. Stanford, CA: Stanford University Press,163–82.
Haider Markel, Donald P., and Kenneth J. Meier. 1996. “ThePolitics of Gay and Lesbian Rights: Expanding the Scope ofthe Conflict.” The Journal of Politics 58(2): 332–49.
Huber, G. A., and Sanford C. Gordon. 2004. “Accountabilityand Coercion: Is Justice Blind When It Runs for Office?”American Journal of Political Science 48(2): 247–63.
Kastellec, Jonathan P., Jeffrey R. Lax, and Justin H. Phillips.2010. “Public Opinion and Senate Confirmation of SupremeCourt Nominees.” Journal of Politics 73(3): 767–84.
Kousser, Thad. 2005. Term Limits and the Dismantling of StateLegislative Professionalism. Cambridge: Cambridge Univer-sity Press.
Lascher, Edward L., Jr., Michael G. Hagen, and Steven A.Rochlin. 1996. “Gun Behind the Door: Ballot Initiatives,State Policies and Public Opinion.” Journal of Politics 58(3):760–75.
Lax, Jeffrey R., and Justin H. Phillips. 2009a. “How Should WeEstimate Public Opinion in the States?” American Journal ofPolitical Science 53(1): 107–21.
Lax, Jeffrey R., and Justin H. Phillips. 2009b. “Gay Rights in theStates: Public Opinion and Policy Responsiveness.” Ameri-can Political Science Review 103(3): 367–86.
Lowery, David, and Virginia Gray. 1995. “The Population Ecol-ogy of Gucci Gulch, or the Natural Regulation of InterestGroup Numbers in the American States.” American Journalof Political Science 39(1): 1–29.
Lowery, David, and Virginia Gray. 2004. “A Neopluralist Per-spective on Research on Organized Interests.” Political Re-search Quarterly 57(1): 163–75.
Lupia, Arthur, Yanna Krupnikov, Adam Seth Levine, SpencerPiston, and Alexander Von Hagen-Jamar. 2010. “Why StateConstitutions Differ in Their Treatment of Same-Sex Mar-riage.” Journal of Politics 72(4): 122–235.
Maestas, Cherie. 2000. “Professional Legislatures and Am-bitious Politicians: Policy Responsiveness of State In-stitutions.” Legislative Studies Quarterly 25(4): 663–90.
Matsusaka, John G. 2001. “Problems with a Methodology Usedto Evaluate the Voter Initiative.” Journal of Politics 63(4):1250–56.
Matsusaka, John G. 2005. For the Many or the Few: The Initiative,Public Policy, and American Democracy. Chicago: Universityof Chicago Press.
Matsusaka, John G. 2010. “Popular Control of Public Policy: AQuantitative Approach.” Quarterly Journal of Political Sci-ence 5(2): 133–67.
Monogan, James, Virginia Gray, and David Lowery. 2009. “Pub-lic Opinion, Organized Interests, and Policy Congruence inInitiative and Noninitiative States.” State Politics and PolicyQuarterly 9(3): 304–24.
Mooney, Christopher Z., and Mei-Hsein Lee. 1995. “Legislat-ing Morality in the American States.” American Journal ofPolitical Science 39(3): 599–627.
Norrander, Barbara. 2000. “The Multi-Layered Impact of Pub-lic Opinion on Capital Punishment Implementation inthe American States.” Political Research Quarterly 53:771–94.
Norrander, Barbara. 2001. “Measuring State Public Opinionwith the Senate National Election Study.” State Politics andPolicy Quarterly 1(1): 111–25.
Page, Benjamin I., and Robert Y. Shapiro. 1983. “The Effects ofPublic Opinion on Policy.” American Political Science Review77(1): 175–90.
Park, David K., Andrew Gelman, and Joseph Bafumi. 2006.“State-Level Opinions from National Surveys: Poststratifica-tion Using Multilevel Logistic Regression.” In Public Opinionin State Politics, ed. Jeffrey E. Cohen. Stanford, CA: StanfordUniversity Press, 209–28.
Phillips, Justin H. 2008. “Does Direct Democracy Weaken PartyGovernment in the U.S. States?” State Politics and PolicyQuarterly 8(2): 127–49.
Plotnick, Robert D., and Richard F. Winters. 1985. “A Politi-cal Economic Theory of Income Redistribution.” AmericanPolitical Science Review 79: 458–473.
Squire, Peverill. 2007. “Measuring State Legislative Profession-alism: The Squire Index Revisited.” State Politics and PolicyQuarterly 7(2): 211–27.
Stimson, James A., Michael B. MacKuen, and Robert S. Erik-son. 2002. The Macro Polity. Cambridge, MA: CambridgeUniversity Press.
Thomas, Clive S., and Ronald J. Hrebenar. 2008. “InterestGroups in the States.” In Politics in the American States:A Comparative Analysis. 9th ed., ed. Virginia Gray, RussellL. Hanson, and Herbert Jacob. Washington, DC: CQ Press.
Treadway, Jack M. 1985. Public Policymaking in the States. NewYork: Praeger.
Weber, Ronald E. 1999. “The Quality of State Legislative Rep-resentation: A Critical Assessment.” Journal of Politics 61(3):609–27.
Supporting Information
Additional Supporting Information may be found in theonline version of this article:• Robustness Checks and Extensions
% Table 1. Policies Included in Empirical Analysis, byIssue Area
% Table 2. Interest Groups and Policies% Figure 3. Responsiveness and Congruence Models% Figure 4. Predicted Probability of Congruence or
Policy Adoption
Please note: Wiley-Blackwell is not responsible for thecontent or functionality of any supporting materials sup-plied by the authors. Any queries (other than missingmaterial) should be directed to the corresponding authorfor the article.
The Democratic Deficit in the States
Supporting Information (SI)
Je↵rey R. Lax Justin H. Phillips
June 1, 2011
Online Appendix: Supporting Information (SI)
Robustness Checks and Extensions
Basic robustness checks. In alternative specifications of our main models, we added
mean liberal opinion across all 39 issues within each state (the coe�cient on policy-specific
opinion remained similar); let the slope of voter ideology vary by policy; and dropped po-
tential outliers. Findings were the same. Our findings also remain the same if we weight
the congruence model observations by the size of the majority, under the assumption that
our congruence codings might be less accurate for smaller majorities. Shifting policies into
other groups (e.g., stem cell research into Abortion or combining a�rmative action with
Immigration) did not change results other than yielding a smaller salience e↵ect.
Salience. We also tried measuring salience as the percent of those who have an opinion,
aggregated by policy or by policy area. The former produced nothing of interest; using just
the latter was similar; controlling for the latter and continuing to include our newspaper
measure of salience increased the size and statistical significance of the newspaper salience
coe�cient.
Institutions. We found no significant interaction e↵ect between term limits and profes-
sionalization, results not shown. One could be concerned that term limits are endogenous,
adopted as a remedy to unresponsive elected o�cials. This would possibly dampen or ren-
der negative the estimated e↵ect of term limits and therefore would not explain the positive
coe�cient we find for the term limits-opinion interaction. While we include term limits as
an institutional variable and also look at term limits as a policy, we reran models dropping
SI p.1
it as a policy and results were unchanged. We tried to push our term limits finding further,
evaluating whether the length of term limits (ranging from 6 to 12) mattered, but found no
significant di↵erences. It would make sense that lower salience policies would be the ones
most a↵ected by professionalization, but we cannot find such an e↵ect with our data (an
added interaction term was not significant and also not in the predicted direction).
Squire’s index of professionalization has three components: sta↵ per legislator, ses-
sion length, and salary. Session length yields the best model fit among the three individ-
ually; yields the strongest e↵ect when all are included; and then is the only component to
reach statistical significance. We thus conclude that professionalization enhances respon-
siveness/congruence primarily by increasing available agenda space rather than through seat
value (salary) or resources for investigating opinion (sta↵).
To explore the citizen initiative further, we replaced our indicator for having the citizen
initiative with an indicator for High Use (using the initiative more than 50 times since
adoption versus lower usage or not having it at all) and then with a measure of usage per
year—we still found no positive e↵ects. We also checked whether di↵erent levels of signature
requirement for qualifying an initiative for the ballot (which range from 2% to 15%) might
condition direct democracy e↵ects. Only in rather sparse models, and only at the minimum
signature requirement (2%), was the direct democracy e↵ect significant and positive.
Our main institutional findings are robust to using simple t-tests. Term limit states
have mean congruence of 53% against 47% without; states with above average professional-
ization have 51% congruence against 47% without (both di↵erences are significant at 95%).
Contrast this with the citizen initiative: states with it have mean congruence of 50%;
without 47% (p=.3). They are also robust to using an index model is Congruence Index
SI p.2
= 17.2(.9)+2.2(.9)⇥Professionalization+2.3(1.3)⇥Term Limits (standard errors in paren-
theses). In a simple model of the count of liberal policies, generally only the count of liberal
opinion majorities in the state or average liberal policy support has a significant e↵ect (not,
for example, ideology, voter or elite). An additional liberal opinion majority (that is, for
one more policy) actually corresponds to over one additional liberal policy, suggesting over-
responsiveness. A two-standard deviation swing in average liberal policy support correlates
to eight additional liberal policies, even controlling for state ideology (which has half that
e↵ect). A two-standard deviation swing in professionalization or having term limits makes
an additional 2 policies congruent (about 16% of the range).
Interest Groups. It is not the case that opinion is simply a proxy for interest group ac-
tivity. Moreover, our results are unchanged if we limit our sample to only those observations
where there is no related powerful interest group, or to observations where there is no in-
terest group on the liberal side, or to observations where there is no interest group on the
conservative side. We also explored whether an interest group aligned with the majority had
a di↵erent magnitude of e↵ect than one opposed to it; they were not statistically di↵erent.
Research also shows that states vary widely with respect to the density of organized
interests (Gray and Lowery 1995, 2001). While a great deal has been written about the
potential consequences of this variation, analysis is fraught with theoretical and empirical
di�culties. High interest group density may be good if it means that groups represent a
broad array of policy needs and transmit these preferences to the government. Or it might
be bad if it means capture or gridlock. Density alone also does not tell us much about the
balance between competing groups. Moreover, the size of state interest group populations
SI p.3
has been shown to be endogenous to state political institutions. Berkman (2001) finds this to
be true for legislation professionalization and Boehmke (2002, 2008) for the citizen initiative.
Additionally, the size of the interest group community is influenced by the policy problems
present in the state and proposed solutions (Lowery and Gray 1995, 2004). Perhaps not
surprisingly, when we added interest group density (the number of registered lobbyists by
state) to our analysis, we found no e↵ect.
Political Context. We next tried supplementing our models with other measures of polit-
ical context. While some argue divided government leads to gridlock, we found no evidence
that divided government (the share of time that control was split between Democrats and
Republicans over 1995-2005) leads to less congruence (in fact, it was weakly correlated to
higher congruence). We also assessed whether legislative turnover itself explained congruence
(with or without term limits) and found no meaningful e↵ect.
Culture. Some attribute di↵erences in state politics to political culture. Elazar (1984)
argues that culture and values, dating back to settlement patterns in the early twentieth
century, shape the operation of state political systems. We assessed whether congruence or
responsiveness were aligned with his tripartite typology of states: “traditionalist,” “individ-
ualist,” and “moralist.” We found little di↵erence. As another way of picking up cultural
di↵erences, we tried a proxy for a state’s populist tendencies—the presidential vote share
of William Jennings Bryan against William McKinley in 1896. A populist tradition could
directly impact responsiveness or have shaped institutional development. A long shot to
say the least, we do find that there is more congruence in states with a higher Bryan vote.
While not huge, the e↵ect is still roughly half that of term limits or professionalization,
SI p.4

and statistical significance hovers around the 90% confidence level (two-tailed). This e↵ect
does not exist for current-day Democratic vote share. These e↵ects become perhaps less
surprising given that there is a correlation between Bryan vote and term limits, albeit weak
(but not professionalization). The Bryan “e↵ect” does persist when this is controlled for but
might capture other “populist” institutions. More generally, we cannot rule out that culture
shapes institutions (professionalization, term limits, and the like) and so has that indirect
e↵ect on congruence. Cultural di↵erences across state might manifest in opinion di↵erences.
Our responsiveness and congruence results would stand, but we cannot rule out that culture
has such an impact.
“Reverse Causality?” As Erikson, Wright, and McIver note, “conceivably it is the policy
tendency of the state that drives public preferences rather than the other way around” (1993,
88). In this context, perhaps public support for liberal policies rises after the exposure to the
policy itself. While we acknowledge the general problems of assessing causality in respon-
siveness research, we o↵er four responses. First, Erikson, Wright, and McIver themselves
find no such e↵ect and show evidence instead of the “normal” direction of causality. Second,
as they argue, there are strong theoretical reasons to suppose that opinion a↵ects policy and
the choices of policymakers—would we expect a New York legislator who was moved to the
Alabama state house to continue to vote the way he did in New York?—but at best limited
theoretical reasons to think that people simply adopt the preferences that match their states
policy. Third, demographic characteristics, which are (relatively) fixed by state, explain a
significant amount of the variation in support for liberal policies. We inspected the state
random e↵ects in the MRP survey response models—these are the intercept shifts for each
SI p.5
individual state beyond the e↵ects of demographics. For some policies, there is e↵ectively
zero residual state-level variation after we control for demographics and region. Therefore, it
is highly unlikely that having a liberal policy is causing liberal. Even though small residual
state variation exists for other policies, demographics still explain much variation in opinion,
so policy adoption can still only have a relatively small e↵ect on state estimates by a↵ecting
intercept shifts or national correlations. Moreover, if having the liberal policy caused higher
opinion, then having the policy would be correlated with positive intercept shifts (higher
state opinion after controlling for demographic and regional e↵ects). There was no such sys-
tematic relationship. Finally, for five policies (same-sex marriage, civil unions, hate crimes,
medical marijuana, and verify), we have su�cient polling data before policy adoption to
generate estimates that cannot generally have been influenced by respondents exposure to
the policy. The responsiveness correlations remain strong for all five.
Notes
Poll selection Our search was limited to polls conducted in the past decade that identified
the state of residence for all respondents. The polls are random national samples conducted
by Gallup, Pew, ABC News, CBS News, Harvard, AP, Kaiser, and Newsweek. We combine
polls on each policy into a single internally-consistent dataset for that policy. There are,
of course, slight variations across polls in question wording and ordering (each polling firm
tends to use the same wording over time). We control for such di↵erences using random
e↵ects.
E↵ect Magnitude Notes. In terms of partisanship, the states with congruence scores
that would be higher were there no partisan e↵ects include AL, OH, WV, LA, and MD.
SI p.6
Those that would be lower include NJ, NY, CT, IL, DE, VT, and WA. Those states hurt
most by interest group activity are AZ, DE, ME, OR, RI, WI, and WV. Those states helped
the most are GA, NJ, UT, and VA. (If there is a pattern here, it escapes us.) Education
and Gay Rights policies are held back in congruence (each would be 5% higher) by interest
groups such as teacher’s unions and social conservative groups respectively; Abortion policies
would be slightly lower in congruence (3%). At average state ideology, we would see slightly
more congruence in Abortion policies but less in Gay Rights, Health, and Law Enforcement
(di↵erences of up to 4%). Removing party e↵ects would have a smaller net e↵ect at this
level of aggregation.
Regression notes. There is little residual state variation in responsiveness slopes, but
there remains residual variation in slopes across policies. Coding policy as having the liberal
policy, the mean is 44%; we would, with the full model, predict 42% (80% correctly predicted,
proportional reduction of error 55%. Mean congruence is 48%; we would, with the full model,
predict 48% (79% correctly predicted, proportional reduction of error 56%.
Supplemental Citations:
Berkman, Michael. 2001. “Legislative Professionalism and the Demand for Groups:
The Institutional Context and Interest Population Density.” Legislative Studies Quarterly
26: 661-79.
Boehmke, Frederick J. 2002. “The E↵ect of Direct Democracy on the Size and Diversity
of State Interest Group Populations.” Journal of Politics 64:827-44.
Boehmke, Frederick J. 2008. “The Initiative Process and the Dynamics of State Interest
Group Populations.” State Politics and Policy Quarterly 8(4): 362-83.
SI p.7
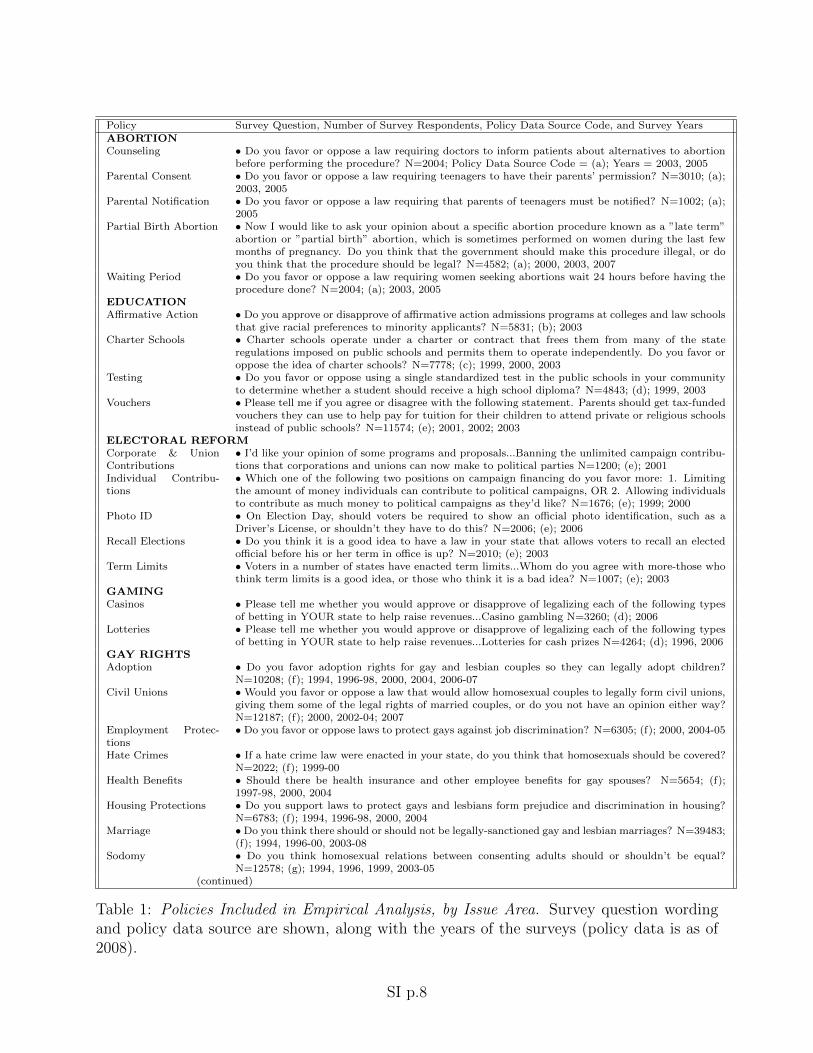
Policy Survey Question, Number of Survey Respondents, Policy Data Source Code, and Survey YearsABORTIONCounseling • Do you favor or oppose a law requiring doctors to inform patients about alternatives to abortion
before performing the procedure? N=2004; Policy Data Source Code = (a); Years = 2003, 2005Parental Consent • Do you favor or oppose a law requiring teenagers to have their parents’ permission? N=3010; (a);
2003, 2005Parental Notification • Do you favor or oppose a law requiring that parents of teenagers must be notified? N=1002; (a);
2005Partial Birth Abortion • Now I would like to ask your opinion about a specific abortion procedure known as a ”late term”
abortion or ”partial birth” abortion, which is sometimes performed on women during the last fewmonths of pregnancy. Do you think that the government should make this procedure illegal, or doyou think that the procedure should be legal? N=4582; (a); 2000, 2003, 2007
Waiting Period • Do you favor or oppose a law requiring women seeking abortions wait 24 hours before having theprocedure done? N=2004; (a); 2003, 2005
EDUCATIONA�rmative Action • Do you approve or disapprove of a�rmative action admissions programs at colleges and law schools
that give racial preferences to minority applicants? N=5831; (b); 2003Charter Schools • Charter schools operate under a charter or contract that frees them from many of the state
regulations imposed on public schools and permits them to operate independently. Do you favor oroppose the idea of charter schools? N=7778; (c); 1999, 2000, 2003
Testing • Do you favor or oppose using a single standardized test in the public schools in your communityto determine whether a student should receive a high school diploma? N=4843; (d); 1999, 2003
Vouchers • Please tell me if you agree or disagree with the following statement. Parents should get tax-fundedvouchers they can use to help pay for tuition for their children to attend private or religious schoolsinstead of public schools? N=11574; (e); 2001, 2002; 2003
ELECTORAL REFORMCorporate & UnionContributions
• I’d like your opinion of some programs and proposals...Banning the unlimited campaign contribu-tions that corporations and unions can now make to political parties N=1200; (e); 2001
Individual Contribu-tions
• Which one of the following two positions on campaign financing do you favor more: 1. Limitingthe amount of money individuals can contribute to political campaigns, OR 2. Allowing individualsto contribute as much money to political campaigns as they’d like? N=1676; (e); 1999; 2000
Photo ID • On Election Day, should voters be required to show an o�cial photo identification, such as aDriver’s License, or shouldn’t they have to do this? N=2006; (e); 2006
Recall Elections • Do you think it is a good idea to have a law in your state that allows voters to recall an electedo�cial before his or her term in o�ce is up? N=2010; (e); 2003
Term Limits • Voters in a number of states have enacted term limits...Whom do you agree with more-those whothink term limits is a good idea, or those who think it is a bad idea? N=1007; (e); 2003
GAMINGCasinos • Please tell me whether you would approve or disapprove of legalizing each of the following types
of betting in YOUR state to help raise revenues...Casino gambling N=3260; (d); 2006Lotteries • Please tell me whether you would approve or disapprove of legalizing each of the following types
of betting in YOUR state to help raise revenues...Lotteries for cash prizes N=4264; (d); 1996, 2006GAY RIGHTSAdoption • Do you favor adoption rights for gay and lesbian couples so they can legally adopt children?
N=10208; (f); 1994, 1996-98, 2000, 2004, 2006-07Civil Unions • Would you favor or oppose a law that would allow homosexual couples to legally form civil unions,
giving them some of the legal rights of married couples, or do you not have an opinion either way?N=12187; (f); 2000, 2002-04; 2007
Employment Protec-tions
• Do you favor or oppose laws to protect gays against job discrimination? N=6305; (f); 2000, 2004-05
Hate Crimes • If a hate crime law were enacted in your state, do you think that homosexuals should be covered?N=2022; (f); 1999-00
Health Benefits • Should there be health insurance and other employee benefits for gay spouses? N=5654; (f);1997-98, 2000, 2004
Housing Protections • Do you support laws to protect gays and lesbians form prejudice and discrimination in housing?N=6783; (f); 1994, 1996-98, 2000, 2004
Marriage • Do you think there should or should not be legally-sanctioned gay and lesbian marriages? N=39483;(f); 1994, 1996-00, 2003-08
Sodomy • Do you think homosexual relations between consenting adults should or shouldn’t be equal?N=12578; (g); 1994, 1996, 1999, 2003-05
(continued)
Table 1: Policies Included in Empirical Analysis, by Issue Area. Survey question wordingand policy data source are shown, along with the years of the surveys (policy data is as of2008).
SI p.8
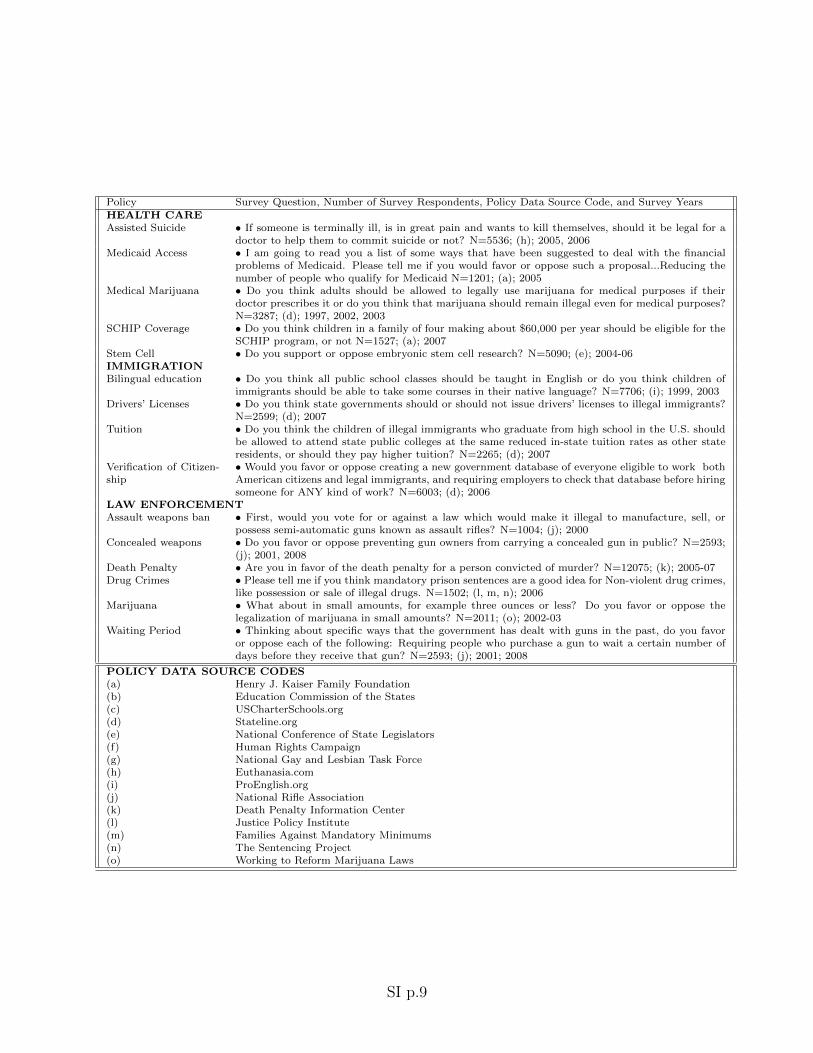
Policy Survey Question, Number of Survey Respondents, Policy Data Source Code, and Survey YearsHEALTH CAREAssisted Suicide • If someone is terminally ill, is in great pain and wants to kill themselves, should it be legal for a
doctor to help them to commit suicide or not? N=5536; (h); 2005, 2006Medicaid Access • I am going to read you a list of some ways that have been suggested to deal with the financial
problems of Medicaid. Please tell me if you would favor or oppose such a proposal...Reducing thenumber of people who qualify for Medicaid N=1201; (a); 2005
Medical Marijuana • Do you think adults should be allowed to legally use marijuana for medical purposes if theirdoctor prescribes it or do you think that marijuana should remain illegal even for medical purposes?N=3287; (d); 1997, 2002, 2003
SCHIP Coverage • Do you think children in a family of four making about $60,000 per year should be eligible for theSCHIP program, or not N=1527; (a); 2007
Stem Cell • Do you support or oppose embryonic stem cell research? N=5090; (e); 2004-06IMMIGRATIONBilingual education • Do you think all public school classes should be taught in English or do you think children of
immigrants should be able to take some courses in their native language? N=7706; (i); 1999, 2003Drivers’ Licenses • Do you think state governments should or should not issue drivers’ licenses to illegal immigrants?
N=2599; (d); 2007Tuition • Do you think the children of illegal immigrants who graduate from high school in the U.S. should
be allowed to attend state public colleges at the same reduced in-state tuition rates as other stateresidents, or should they pay higher tuition? N=2265; (d); 2007
Verification of Citizen-ship
• Would you favor or oppose creating a new government database of everyone eligible to work bothAmerican citizens and legal immigrants, and requiring employers to check that database before hiringsomeone for ANY kind of work? N=6003; (d); 2006
LAW ENFORCEMENTAssault weapons ban • First, would you vote for or against a law which would make it illegal to manufacture, sell, or
possess semi-automatic guns known as assault rifles? N=1004; (j); 2000Concealed weapons • Do you favor or oppose preventing gun owners from carrying a concealed gun in public? N=2593;
(j); 2001, 2008Death Penalty • Are you in favor of the death penalty for a person convicted of murder? N=12075; (k); 2005-07Drug Crimes • Please tell me if you think mandatory prison sentences are a good idea for Non-violent drug crimes,
like possession or sale of illegal drugs. N=1502; (l, m, n); 2006Marijuana • What about in small amounts, for example three ounces or less? Do you favor or oppose the
legalization of marijuana in small amounts? N=2011; (o); 2002-03Waiting Period • Thinking about specific ways that the government has dealt with guns in the past, do you favor
or oppose each of the following: Requiring people who purchase a gun to wait a certain number ofdays before they receive that gun? N=2593; (j); 2001; 2008
POLICY DATA SOURCE CODES(a) Henry J. Kaiser Family Foundation(b) Education Commission of the States(c) USCharterSchools.org(d) Stateline.org(e) National Conference of State Legislators(f) Human Rights Campaign(g) National Gay and Lesbian Task Force(h) Euthanasia.com(i) ProEnglish.org(j) National Rifle Association(k) Death Penalty Information Center(l) Justice Policy Institute(m) Families Against Mandatory Minimums(n) The Sentencing Project(o) Working to Reform Marijuana Laws
SI p.9
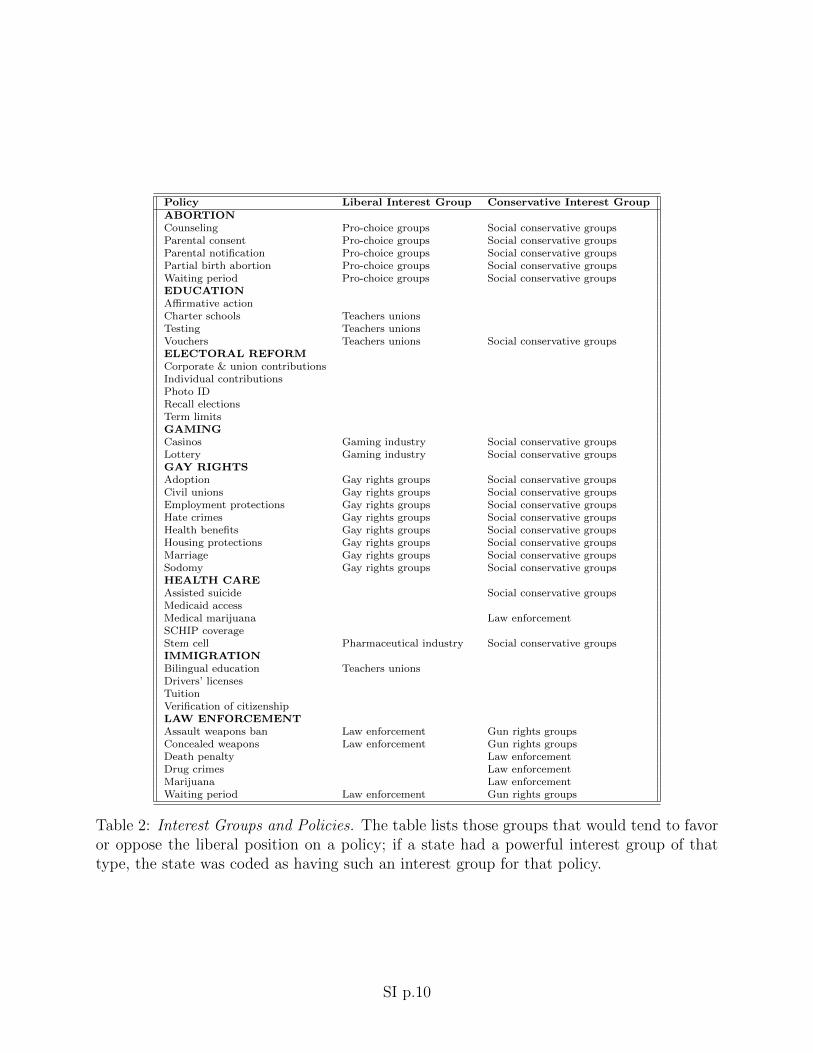
Policy Liberal Interest Group Conservative Interest GroupABORTIONCounseling Pro-choice groups Social conservative groupsParental consent Pro-choice groups Social conservative groupsParental notification Pro-choice groups Social conservative groupsPartial birth abortion Pro-choice groups Social conservative groupsWaiting period Pro-choice groups Social conservative groupsEDUCATIONA�rmative actionCharter schools Teachers unionsTesting Teachers unionsVouchers Teachers unions Social conservative groupsELECTORAL REFORMCorporate & union contributionsIndividual contributionsPhoto IDRecall electionsTerm limitsGAMINGCasinos Gaming industry Social conservative groupsLottery Gaming industry Social conservative groupsGAY RIGHTSAdoption Gay rights groups Social conservative groupsCivil unions Gay rights groups Social conservative groupsEmployment protections Gay rights groups Social conservative groupsHate crimes Gay rights groups Social conservative groupsHealth benefits Gay rights groups Social conservative groupsHousing protections Gay rights groups Social conservative groupsMarriage Gay rights groups Social conservative groupsSodomy Gay rights groups Social conservative groupsHEALTH CAREAssisted suicide Social conservative groupsMedicaid accessMedical marijuana Law enforcementSCHIP coverageStem cell Pharmaceutical industry Social conservative groupsIMMIGRATIONBilingual education Teachers unionsDrivers’ licensesTuitionVerification of citizenshipLAW ENFORCEMENTAssault weapons ban Law enforcement Gun rights groupsConcealed weapons Law enforcement Gun rights groupsDeath penalty Law enforcementDrug crimes Law enforcementMarijuana Law enforcementWaiting period Law enforcement Gun rights groups
Table 2: Interest Groups and Policies. The table lists those groups that would tend to favoror oppose the liberal position on a policy; if a state had a powerful interest group of thattype, the state was coded as having such an interest group for that policy.
SI p.10
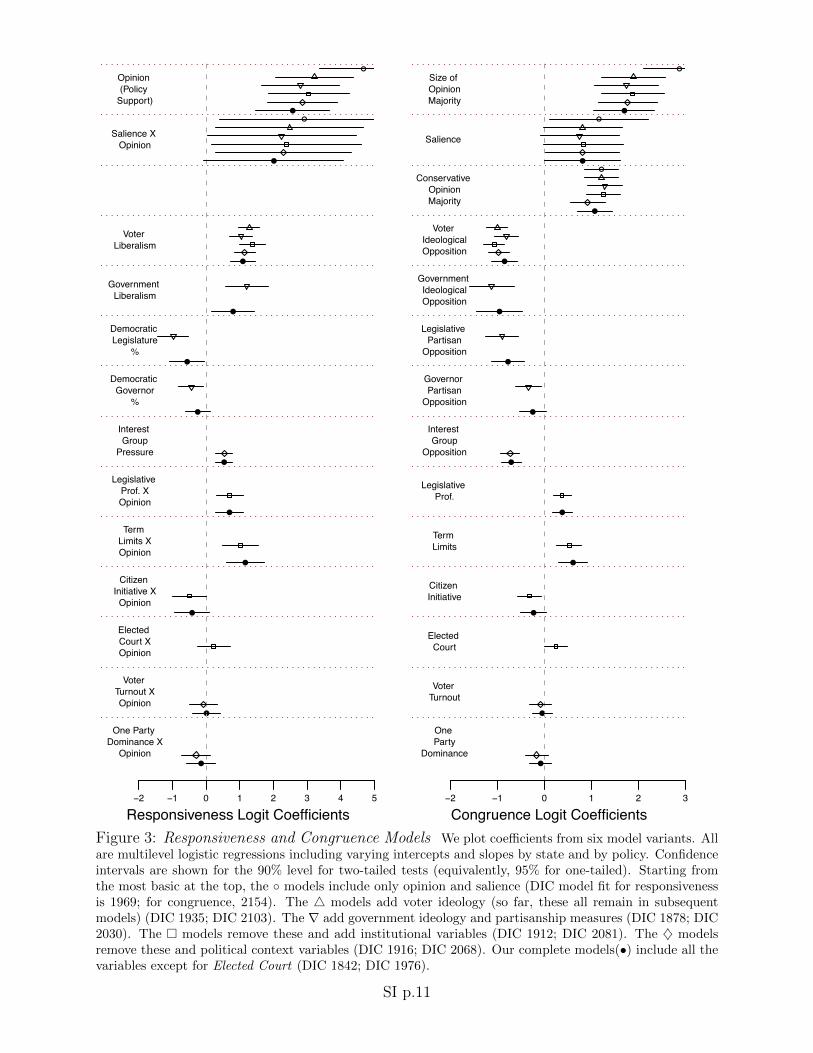
●
●
●
●
●
●
●
●
●
●
●
●
●
●
−2 −1 0 1 2 3 4 5
Responsiveness Logit Coefficients
One Party Dominance X
Opinion
Voter Turnout X Opinion
Elected Court X Opinion
Citizen Initiative X
Opinion
Term Limits X Opinion
Legislative Prof. X Opinion
Interest Group
Pressure
Democratic Governor
%
Democratic Legislature
%
Government Liberalism
Voter Liberalism
Salience X Opinion
Opinion(Policy
Support)
●
●
●
●
●
●
●
●
●
●
●
●
●
●
●
●
−2 −1 0 1 2 3
Congruence Logit Coefficients
One Party
Dominance
Voter Turnout
Elected Court
Citizen Initiative
Term Limits
Legislative Prof.
Interest Group
Opposition
Governor Partisan
Opposition
Legislative Partisan
Opposition
Government Ideological Opposition
Voter Ideological Opposition
Conservative Opinion Majority
Salience
Size of Opinion Majority
Figure 3: Responsiveness and Congruence Models We plot coe�cients from six model variants. Allare multilevel logistic regressions including varying intercepts and slopes by state and by policy. Confidenceintervals are shown for the 90% level for two-tailed tests (equivalently, 95% for one-tailed). Starting fromthe most basic at the top, the � models include only opinion and salience (DIC model fit for responsivenessis 1969; for congruence, 2154). The 4 models add voter ideology (so far, these all remain in subsequentmodels) (DIC 1935; DIC 2103). The r add government ideology and partisanship measures (DIC 1878; DIC2030). The ⇤ models remove these and add institutional variables (DIC 1912; DIC 2081). The } modelsremove these and political context variables (DIC 1916; DIC 2068). Our complete models(•) include all thevariables except for Elected Court (DIC 1842; DIC 1976).
SI p.11
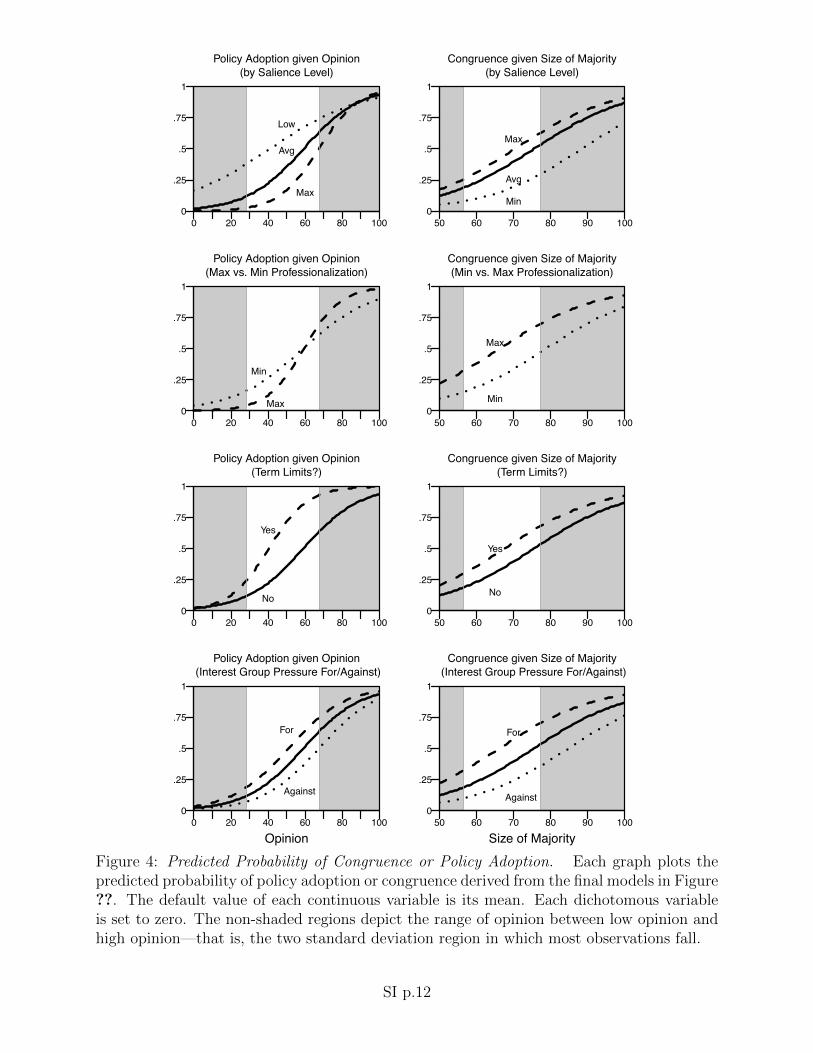
0 20 40 60 80 1000
.25
.5
.75
1
Policy Adoption given Opinion(by Salience Level)
Low
Avg
Max
50 60 70 80 90 1000
.25
.5
.75
1
Congruence given Size of Majority(by Salience Level)
Min
Avg
Max
0 20 40 60 80 1000
.25
.5
.75
1
Policy Adoption given Opinion(Max vs. Min Professionalization)
Max
Min
50 60 70 80 90 1000
.25
.5
.75
1
Congruence given Size of Majority(Min vs. Max Professionalization)
Min
Max
0 20 40 60 80 1000
.25
.5
.75
1
Policy Adoption given Opinion(Term Limits?)
No
Yes
50 60 70 80 90 1000
.25
.5
.75
1
Congruence given Size of Majority(Term Limits?)
No
Yes
0 20 40 60 80 1000
.25
.5
.75
1
Policy Adoption given Opinion (Interest Group Pressure For/Against)
For
Against
Opinion50 60 70 80 90 100
0
.25
.5
.75
1
Congruence given Size of Majority (Interest Group Pressure For/Against)
Against
For
Size of Majority
Figure 4: Predicted Probability of Congruence or Policy Adoption. Each graph plots thepredicted probability of policy adoption or congruence derived from the final models in Figure??. The default value of each continuous variable is its mean. Each dichotomous variableis set to zero. The non-shaded regions depict the range of opinion between low opinion andhigh opinion—that is, the two standard deviation region in which most observations fall.
SI p.12