the cost of spousal health coverage, p. 2 - ebri · the cost of spousal health coverage, p. 2 ......
TRANSCRIPT

A monthly newsletter from the EBRI Education and Research Fund © 2014 Employee Benefit Research Institute
January 2014 • Vol. 35, No. 1
The Cost of Spousal Health Coverage, p. 2
The Role of Social Security, Defined Benefits, and Private Retirement Accounts in the Face of the Retirement Crisis, p. 15
A T A G L A N C E
The Cost of Spousal Health Coverage, by Paul Fronstin, Ph.D., EBRI, and M. Christopher Roebuck, Ph.D., RxEconomics
As of 2012, 7 percent of employers did not cover spouses when other coverage was available to them and 4 percent of employers with 1,000 or more employees reported not providing such spousal coverage. As of late 2012–early 2013, another 8 percent of large employers were reporting that they planned to exclude spouses from coverage when other coverage was available.
A recent decision by United Parcel Service to eliminate health benefits for spouses who were eligible for coverage through their own employer may be a tipping point in employment-based health benefits, in part due to provisions in the Patient Protection and Affordable Care Act (PPACA).
This study documents that spouses, on average, cost more to cover than otherwise comparable policyholders. This, in conjunction with the latitude offered by PPACA, makes spousal coverage a target for employers seeking ways to lower their health care expenditures. However, this analysis finds that working and non-working spouses are likely quite different in their use of health services. Therefore, the strategy of not covering spouses who are employed may have unintended consequences for employers.
The Role of Social Security, Defined Benefits, and Private Retirement Accounts in the Face of the Retirement Crisis, by Jack VanDerhei, Ph.D., EBRI
For years, EBRI research has documented and quantified the role of Social Security, defined benefit and private retirement accounts on retirement income adequacy for Baby Boomers and Gen Xers in the United States. This report summarizes that research and presents new evidence on the importance of 401(k) plans for workers currently entering the workforce.
EBRI’s modeling shows a substantial improvement in in the probability of attaining a financially successful retirement if workers are eligible for automatic enrollment in a 401(k) plan, compared with voluntary enrollment.
Assuming current Social Security benefits are not reduced, between 83 and 86 percent of workers with more than 30 years of eligibility in a voluntary enrollment 401(k) plan are simulated to have sufficient 401(k) accumulations that, combined with Social Security retirement benefits, will be able to replace at least 60 percent of their age-64 wages and salary on an inflation-adjusted basis. The same analysis under automatic enrollment shows the probability of success increases substantially: 88–94 percent would be successful.

ebri.org Notes • January 2014 • Vol. 35, No. 1 2
The Cost of Spousal Health Coverage By Paul Fronstin, Ph.D., Employee Benefit Research Institute, and M. Christopher Roebuck, Ph.D., RxEconomics
Introduction As of 2012, 7 percent of employers did not cover spouses when other coverage was available to them (Figure 1), and 4 percent of employers with 1,000 or more employees reported not providing such spousal coverage (Figure 2). As of late 2012–early 2013, another 8 percent of large employers were reporting that they planned to exclude spouses from coverage when other coverage was available. As of yet, employers have been more likely to impose spousal surcharges when other coverage is available. About one-third of large employers have either introduced or planned to introduce such spousal surcharges. However, the recent decision by United Parcel Service (UPS) to eliminate health benefits for spouses who are eligible for coverage through their own employer1 may be a tipping point in employment-based health benefits.
These decisions come at a time when employers are wrestling with how to control the rising cost of providing health benefits to workers, in part due to the requirements of the Patient Protection and Affordable Care Act of 2010 (PPACA). While recent evidence suggests that increases in the cost of health coverage have slowed compared to past years,2 those cost increases are still double the rate of increase in worker wages and are about four times the overall rate of inflation.
Arguably, PPACA provides an impetus for employers to reconsider providing coverage for spouses with access to other health coverage. In fact, UPS cited the new law as a reason for its policy change, stating, “since the Affordable Care Act requires employers to provide affordable coverage, we believe your spouse should be covered by their own employer.”
PPACA requires that employers with 50 or more workers provide health coverage to workers and dependent children until they reach age 26. It does not, however, require employers to provide health coverage to spouses, whether or not they are eligible for other health insurance.
Although employers that exclude working spouses from coverage may save money in the short run by way of the reduction in the number of covered lives, the effect of this strategy over the long term is less clear. Undoubtedly, more employers will follow suit, which will result in more workers reverting to enrollment in their own employer’s plan. This hypothetical re-sorting of members according to whether they are policyholders or the spouses and whether they themselves are employed or not prompts a critical question that is the focus of this article: All else equal, do spouses use more health services and cost more to cover? This report conducts a novel analysis that addresses this question and discusses the implications for plan sponsors.
Data and Methods The data for this study are derived from Truven Health Analytics MarketScan® Commercial Database. Claims data are analyzed for 317,180 couples (634,360 individuals) with continuous coverage through an employer in 2011. Health services utilization and costs are examined for differences according to whether the member was the policyholder or the spouse. Using nonlinear, multivariate regression models, this study sequentially controls for gender, age, overall health status (using the Charlson Comorbidity Index), geographic region, and health insurance plan type. Finally, it examines whether remaining differences in health care spending are due to the spouse’s employment status using a novel proxy measure—the age of the youngest dependent insured by the policyholder.

7% 7%
6% 6%
7%
4%
2%
4%
0%
1%
2%
3%
4%
5%
6%
7%
8%
9%
10%
Total Fewer than 500 500 or More 500–999 1,000–4,999 5,000–9.999 10,000–19,999 20,000 or More
Figure 1Percentage of Employers that Do Not Cover Spouse
When Other Coverage is Available, by Firm Size, 2012
Source: Mercer’s 2012 National Survey of Employer-Sponsored Health Plans, http://www.mercer.com/survey-reports/2009-US-national-health-plan-survey.
Firm Size (employees)
1%
4%
5%
7%
15%
20%
42%
4%
8%
10%
11%
9%
13%
19%
0% 10% 20% 30% 40% 50% 60% 70%
Eliminate/don’t offer subsidy for spousal coverage (provide access only)
Exclude spouses from enrolling in your health plan when similarcoverage is available through their own employer
Increase employee contributions per each dependent covered
Require spouses to purchase health insurance through their employerplan before enrolling in your health plan
Expand number of coverage tiers
Use spousal surcharges (when other coverage is available)
Increase employee contributions in tiers with dependent coverage athigher rate than single coverage
Figure 2Redefining the Commitment to Dependents, Late 2012‒Early 2013
In place in 2013
Planned for 2014
Source: Figure 22 in http://www.towerswatson.com/DownloadMedia.aspx?media={BAD5FE64-62FD-492A-8F24-A3C6E5B075B8}
ebri.org Notes • January 2014 • Vol. 35, No. 1 3

ebri.org Notes • January 2014 • Vol. 35, No. 1 4
Results In 2011, policyholders spent an average of $5,430 on health care services, compared with $6,609 for spouses (Figure 3). Because spouses in an employment-based health plan are more likely to be female than male (twice as likely in this study), a key question is how much of the $1,179 difference is due to gender. This analysis estimates that the marginal effect of being a spouse on annual total healthcare costs declines by $268, which means gender explains about 23 percent of the difference. Next, it includes age and overall health status in the model and finds the spouse effect on total healthcare costs further declines to $392. Finally, controlling for region and plan type only slightly increases the estimate, to $404.
Because spouses still have health care costs that are roughly 7 percent higher than policyholders for reasons other than gender, age, and general health status, the source of this variation remains a question. A key limitation of this study is that it does not have information on the employment status and other health insurance eligibility of spouses. As a result, it cannot directly determine if the remaining differences in health services spending are attributable to employment status.
As a proxy, it constructs a variable equal to the age of the youngest dependent enrolled on the subscriber’s policy, based on a premise that spouses with young children will be more likely to be “stay-at-home” parents. This correlation is likely strongest with children below age 6 (i.e., pre-grade school). While certainly not a perfect measure, the age of youngest child may provide some sense as to whether there is a difference in healthcare spending for spouses with and without access to their own employment-based health care coverage.
Figure 4 plots the marginal effect of the spouse’s coverage on total healthcare costs, estimated by year of youngest dependent. Earlier model estimates are stratified by two-year age bands of the youngest dependent from birth through 17. In general, spouses with children younger than 6 years have increasing healthcare costs compared with those with older children. In fact, the spousal impact on healthcare costs is seen declining for all youngest-dependent ages after 6, a result that has no obvious explanation. If the proxy measure accurately classifies stay-at-home parents, then their higher healthcare costs may be due to greater exposure to communicable diseases, which are not captured in the Charlson Comorbidity Index. The general health status measure is also insensitive to mental-health conditions, which may be more prevalent among non-working spouses. Guesswork aside, this analysis concludes that the cost of spousal health care coverage is higher than that for policyholders, and non-working spouses cost more than working spouses.
Implications This study’s main findings have important implications for employers considering altering spousal health care coverage. While “first-mover” firms may save money in the short run by eliminating working spouses from their plan, they may in time gain the responsibility for covering employees who were previously covered as a spouse under another plan, now left without that coverage by other employers implementing the same strategy. Ultimately, savings over the long term will depend upon each firm’s composition of couples and their respective employment statuses. This study suggests that the working spouses being sorted by primary insurance coverage likely have lower spending than non-working spouses. Therefore, employers with net reductions in covered spouses may experience a worsening in average risk, resulting in higher spending than expected.
In any event, given prevailing levels of cost sharing, employers might end up worse off under a change in spousal coverage policies. Employers subsidize employee-only coverage more than they subsidize family coverage. According to a recent survey,3 workers paid 18 percent toward the cost of employee-only coverage and 29 percent toward the cost of family coverage in 2013 (Figure 5). In other words, employers paid 82 percent toward the cost of employee-only coverage and 71 percent toward the cost of family coverage. In dollar terms, workers paid an annual average of $996 toward employee-only coverage and $4,560 toward family coverage in 2013 (Figure 6). Using the data from Figure 3, and

$5,430
$6,609
$4,453
$4,095
$0
$1,000
$2,000
$3,000
$4,000
$5,000
$6,000
$7,000
Employee Spouse
Figure 3Average Annual Spending on Health Coverage,
Employee and Spouse, 2011
Average Total Spending Average Employer Spending
Source: EBRI estimates derived from Truven Health Analytics MarketScan® Commercial Database (copyright © 2011 Truven Health Analytics, all rights reserved).
$-
$100
$200
$300
$400
$500
$600
$700
0–1 2–3 4–5 6–7 8–9 10–11 12–13 14–15 16–17
Mar
gina
l Eff
ect o
f S
pous
e
Age of Youngest Dependent
Figure 4Impact of Spouse on Total Health Care Cost,
by Age of Youngest Dependent
Source: EBRI estimates derived from Truven Health Analytics MarketScan® Commercial Database (copyright © 2011 Truven Health Analytics, all rights reserved).
ebri.org Notes • January 2014 • Vol. 35, No. 1 5

14% 14% 14%
16% 16% 16% 16% 16% 16% 16%17%
19%18% 18% 18%
27%26% 26%
28%27%
28%
26%27%
28%27% 27%
30%
28% 28%29%
0%
5%
10%
15%
20%
25%
30%
35%
1999 2000 2001 2002 2003 2004 2005 2006 2007 2008 2009 2010 2011 2012 2013
Figure 5Average Percentage of Premium Paid by Covered Workers for
Employee-only and Family Coverage, 1999‒2013
Employee-only Coverage
Family Coverage
Source: Exhibit 6.1 in http://kaiserfamilyfoundation.files.wordpress.com/2013/08/8465-employer-health-benefits-20131.pdf
$324 $336 $360 $468 $504 $564 $612 $624 $694 $720 $780
$900 $924 $948 $996
$1,548 $1,620 $1,788
$2,136
$2,412
$2,664 $2,712
$2,976
$3,281 $3,360 $3,516
$3,996 $4,128
$4,320
$4,560
$-
$500
$1,000
$1,500
$2,000
$2,500
$3,000
$3,500
$4,000
$4,500
$5,000
1999 2000 2001 2002 2003 2004 2005 2006 2007 2008 2009 2010 2011 2012 2013
Figure 6Average Annual Worker Premium Contributions Paid by Covered
Workers for Employee-only and Family Coverage, 1999‒2013
Employee-only Coverage
Family Coverage
Source: Calculated from Exhibit 6.2 in http://kaiserfamilyfoundation.files.wordpress.com/2013/08/8465-employer-health-benefits-20131.pdf
ebri.org Notes • January 2014 • Vol. 35, No. 1 6

ebri.org Notes • January 2014 • Vol. 35, No. 1 7
assuming that a family is composed of only the employee and spouse (no children), total spending for a married couple will be $12,039, comprised of $5,430 from the employee and $6,609 from the spouse. In other words, the employer pays $4,095 toward the cost of spousal coverage.
Were the employer to experience a situation where a new employee (say a worker who had previously been covered as a spouse under another employer’s plan, now refused coverage) joined the plan for each spouse that dropped off the plan (instead of paying $4,095 per spouse), they would pay $4,453 per worker that joined the plan. It should be noted that one of the limitations of this illustration is that it uses average employer subsidies and average spending, and these findings may not be generalized to all employers.
Conclusion This study documents that spouses, on average, cost more to cover than otherwise comparable policyholders. This, in conjunction with the latitude offered by PPACA, makes spousal coverage a target for employers seeking ways to lower their health care expenditures. However, this analysis finds that working and non-working spouses are likely quite different in their use of health services. Therefore, the strategy of not covering spouses who are employed may have unintended consequences for employers.
Notes 1 Hancock, Jay. “UPS won't insure spouses of many employees.” USAToday/Kaiser Health News, Aug. 20, 2013. http://www.usatoday.com/story/money/business/2013/08/20/ups-spouses-health-insurance/2651713/
2 http://kaiserfamilyfoundation.files.wordpress.com/2013/08/8466-employer-health-benefits-2013_summary-of-findings1.pdf
3 Kaiser Family Foundation and Health Research and Educational Trust, “Employer Health Benefits: 2013 Annual Survey,” http://kaiserfamilyfoundation.files.wordpress.com/2013/08/8465-employer-health-benefits-20131.pdf

ebri.org Notes • January 2014 • Vol. 35, No. 1 8
The Role of Social Security, Defined Benefits, and Private Retirement Accounts in the Face of the Retirement Crisis By Jack VanDerhei, Ph.D., Employee Benefit Research Institute
Introduction Measuring retirement income adequacy is an extremely important and complex topic. The Employee Benefit Research Institute (EBRI) started to provide this type of measurement in the late 1990s with the development of the EBRI Retirement Security Projection Model® (RSPM),1 a computer simulation model that projects the financial outcomes for U.S. households in retirement. When EBRI most recently modeled retirement income adequacy for the Baby Boomers2 and Gen Xers3 in 2013, it was found that their Retirement Readiness Ratings (or RRRs,™ defined as the probability of having adequate retirement income for standard retirement expenses—housing, food, etc.—plus uninsured health care costs, including long-term care) were between 55 and 58 percent. Not surprisingly, lower-income households have much lower RRRs: The 2013 baseline RRRs range from 16 percent for the households in the lowest-income quartile (meaning that 16 percent of the simulated lifepaths for that demographic are projected not to run short of funds in retirement) to 86 percent for the households in the highest-income quartile.
EBRI first calculated the accumulated retirement-adequacy deficits by age, family status, and gender for Baby Boomers and Gen Xers in 2010. At that time, the aggregate deficit number, assuming current Social Security retirement benefits, was estimated to be $4.6 trillion,4 with an individual average shortfall of approximately $48,000. These numbers are present values at retirement age, and represent the additional amount each member in that group would need at age 65 to eliminate his or her expected deficits in retirement (which could be a relatively short period or could last decades).
Social Security benefits are, of course, an integral component of this equation. If Social Security benefits were to be eliminated, the aggregate deficit would jump to $8.5 trillion and the average individual shortfall would increase to approximately $89,000.
The 2010 analysis noted above incorporated the impact of the crisis in financial and housing markets in the period from 2007 through 2009. Even with these financial shocks to retirement savings, it was found that, overall, the Baby Boomers and Gen Xers were significantly better off in 2010 than when EBRI first ran its national model in 2003. The primary reason for this change was the adoption of automatic enrollment by a growing number of 401(k) plans (often accompanied by the adoption of automatic escalation of contributions).5
An EBRI analysis in 2011 showed the importance of defined benefit pension plans in achieving retirement income adequacy for Baby Boomers and Gen Xers who have access to such programs. Overall, the presence of a defined benefit accrual at age 65 increases the probability of not running short of money in retirement by 11.6 percentage points. The defined-benefit-plan advantage is particularly valuable for the lowest-income quartile but also has a strong impact on the middle class.6
The Potential of 401(k) Plans to Produce Adequate Income Replacement The EBRI/ICI 401(k) database has been used to provide annual reports based on actual account balances of large cross sections of 401(k) plan participants since 1996.7 Looking at consistent participants in the EBRI/ICI 401(k) database in the wake of the financial crisis (over the four-year period from year-end 2007 to year-end 2011), a joint EBRI/Investment Company Institute (ICI) analysis found that the average 401(k) account balance fell 34.8 percent in 2008, then rose from 2009 to 2011.8 Overall, the average account balance in this consistent sample increased at a compound, annual, average growth rate of 5.4 percent over the 2007–2011 period.

ebri.org Notes • January 2014 • Vol. 35, No. 1 9
While this information is certainly useful to evaluate assertions (and anecdotal claims) with respect to the impact of the financial crisis on 401(k) plans, it needs to be supplemented with simulation modeling for a proper evaluation of the potential of 401(k) plans to produce “adequate” income replacement for several reasons:
The EBRI/ICI 401(k) database does not contain information on individual retirement account (IRA) rollovers and therefore may only represent a fraction of a participant’s retirement accumulations if he or she has had job changes.
Even if one looks only at 401(k) participants who have had decades of tenure with the current employer, there is a significant likelihood that they would not have been eligible to participate in a 401(k) plan during their entire career with the current employer.9
Since the passage of the Pension Protection Act of 2006, many of the 401(k) plans that had previously allowed eligible employees to voluntarily enroll have been modified to automatically enroll eligible employees. While employees have the ability to opt out of such enrollment, it is clear that these plans have had a substantial impact on increasing retirement plan-participation rates, especially for lower-income employees.10
An analysis based solely on current balances will not incorporate the impact of future employee activity (such as potential cashout behavior at job change), nor the impact of future financial market returns.
To assist in the evaluation of the role of 401(k) plans, EBRI has used its RSPM to analyze the potential of 401(k) plans to produce “adequate” income replacement.11 The analysis provides probabilities of successful retirement (defined below) by income quartile for both voluntary- and automatic-enrollment 401(k) plans. Given that the objective of this analysis is to focus on the potential for 401(k) plans to produce a threshold level of income replacement at retirement, the analysis is limited to individuals who are simulated to have more than 30 years of eligibility to participate (whether or not they actually choose to participate in each of those years) by the time they reach age 65.12
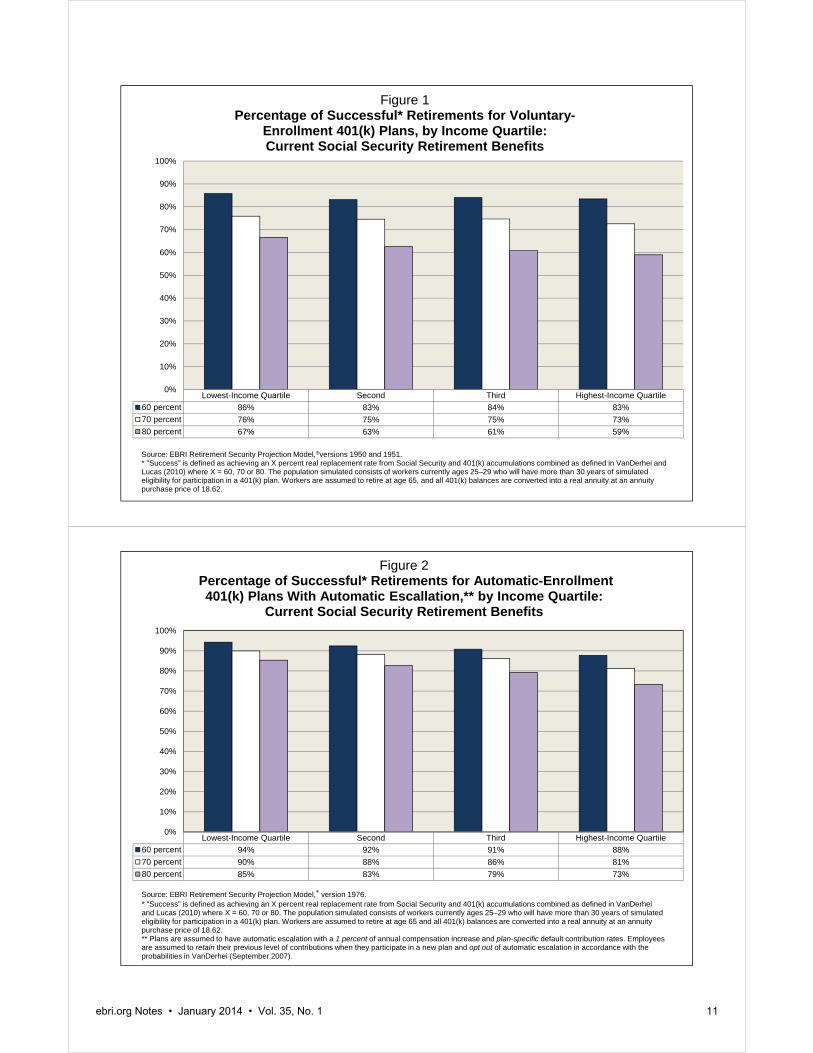
Figure 1 summarizes the projections for the percentage of “successful” retirements for 401(k) participants, by income quartile, for those currently ages 25-29 in a voluntary-enrollment 401(k) plan. Workers are assumed to retire at age 65, and all balances are converted into an inflation-adjusted annuity at an annuity purchase price of 18.62 at that point.13 The annual income provided by this annuity in the first year of retirement is added to the simulated Social Security retirement benefit provided for the worker (spousal benefits are not included), and the combined retirement income is expressed as a percentage of the salary the worker was simulated to have earned at age 64.
One difficulty in evaluating the potential of any type of retirement income source is the determination of the threshold for “success.” While there have been a number of attempts to quantify this in the past,14 there appears to be little consensus on the appropriate level(s).15 Therefore, this analysis uses three alternative “success” thresholds: attaining 60, 70, and 80 percent (respectively) of the preretirement income replaced by the combination of the annuitized value of the 401(k) accumulations16 combined with the primary Social Security benefit amounts.
The top row in the grid for Figure 1 shows that for the lowest-income quartile,17 86 percent of the workers currently ages 25–29 who will have more than 30 years of eligibility for participation in a 401(k) plan are simulated to be able to replace at least 60 percent of their age-64 salary from their annuitized 401(k) accumulations and Social Security. This percentage decreases somewhat for their higher-income counterparts, but goes no lower than 83 percent.
The second row in the grid for Figure 1 provides the same results when the threshold is increased to 70 percent. As expected, the percentage of workers able to meet this more stringent threshold decreases, and the percentage of those in the lowest-income quartile with successful retirements under this analysis is now 76 percent. The

ebri.org Notes • January 2014 • Vol. 35, No. 1 10
percentages for the second-, third-, and fourth-income quartiles are somewhat smaller, but none are less than 73 percent.
The third row in the Figure 1 grid illustrates the impact of increasing the threshold for success to 80 percent. At this point, the progressive nature of the benefit formula in Social Security produces a much higher probability of success for the lowest-income quartile (67 percent) than the highest-income quartile (59 percent).
Figure 2 presents a similar type of analysis as Figure 1, but in this case the automatic-enrollment type of 401(k) plan is simulated rather than the voluntary-enrollment type, where employees must make a positive election to participate in the plan. In addition, the simulated analysis for Figure 2 assumes that 401(k) sponsors adopting automatic-enrollment provisions also adopt an automatic annual escalation of contributions. Note that while automatic-enrollment plans have been in place for a number of years, there has been a substantial increase in the proportion of employers incorporating some type of an automatic-escalation feature as a result of the Pension Protection Act of 2006. However, it will be a number of years before these provisions have been in place long enough to accurately assess participant response with respect to items such as opt-out behavior and whether participants will retain their current savings rates when they change jobs or simply revert to the default deferral rate in the plan of the new employer. In the current analysis, plans are assumed to have automatic escalation with a 1 percent of compensation increase annually along with the current plan-specific default contribution rates.18 Employees are assumed to retain their previous level of contributions when they change employers and participate in a new plan and to opt out of automatic escalation in accordance with the probabilities outlined in VanDerhei (September 2007).
It would appear from even a cursory comparison of the results in Figures 1 and 2 that this type of automatic-enrollment plan would result in additional contributions sufficient to produce higher probabilities of success than the voluntary-enrollment 401(k) plans in all income quartiles. For example, the top grid of Figure 2 shows that 94 percent of the lowest-income quartile of workers currently ages 25–29 who will have more than 30 years of eligibility for participation in a 401(k) plan are simulated to be able to replace at least 60 percent of their age-64 salary in retirement from the annuitized 401(k) accumulations and Social Security. Again, these numbers drop somewhat for their higher-income counterparts (88 percent for the highest-income quartile) but are still substantially higher than the probabilities when voluntary enrollment is assumed.
The second row in the grid for Figure 2 presents the results when the threshold is increased to 70 percent. As expected, the percentage of workers able to meet this more stringent threshold decreases; the percentage of those in the lowest-income quartile with successful retirements under this analysis is now 90 percent. Again the success percentages for the second-, third-, and fourth-income quartiles are somewhat smaller, but none are less than 81 percent.
The third row in the Figure 1 grid shows the impact of raising the threshold for success to 80 percent. At this point, the benefit formula in Social Security causes the lowest-income quartile to have a much higher probability of success (85 percent) than the highest-income quartile (73 percent).
Impact of a Potential Reduction in Social Security Retirement Benefits The analysis presented in both Figures 1 and 2 assumes that the computation of Social Security retirement benefits under current law would not be modified. However, the current Social Security Trustee’s Report projects that the fund for Old-Age, Survivors and Disability Insurance (OASDI) will be exhausted by 2033.19 While this would not result in Social Security retirement benefits being eliminated, left unaddressed it would seem to require a reduction in benefits for at least some cohorts of retirees. For purposes of the analysis in Figures 3 and 4, it is assumed that a proportional (and permanent) 24-percent reduction would be applied to the Social Security retirement benefits for all simulated workers, beginning in 2033.
Lowest-Income Quartile Second Third Highest-Income Quartile
60 percent 86% 83% 84% 83%
70 percent 76% 75% 75% 73%
80 percent 67% 63% 61% 59%
0%
10%
20%
30%
40%
50%
60%
70%
80%
90%
100%
Figure 1Percentage of Successful* Retirements for Voluntary-
Enrollment 401(k) Plans, by Income Quartile: Current Social Security Retirement Benefits
Source: EBRI Retirement Security Projection Model,®versions 1950 and 1951. * "Success" is defined as achieving an X percent real replacement rate from Social Security and 401(k) accumulations combined as defined in VanDerhei and Lucas (2010) where X = 60, 70 or 80. The population simulated consists of workers currently ages 25–29 who will have more than 30 years of simulated eligibility for participation in a 401(k) plan. Workers are assumed to retire at age 65, and all 401(k) balances are converted into a real annuity at an annuity purchase price of 18.62.
Lowest-Income Quartile Second Third Highest-Income Quartile
60 percent 94% 92% 91% 88%
70 percent 90% 88% 86% 81%
80 percent 85% 83% 79% 73%
0%
10%
20%
30%
40%
50%
60%
70%
80%
90%
100%
Figure 2Percentage of Successful* Retirements for Automatic-Enrollment 401(k) Plans With Automatic Escallation,** by Income Quartile:
Current Social Security Retirement Benefits
Source: EBRI Retirement Security Projection Model,® version 1976. * "Success" is defined as achieving an X percent real replacement rate from Social Security and 401(k) accumulations combined as defined in VanDerhei and Lucas (2010) where X = 60, 70 or 80. The population simulated consists of workers currently ages 25–29 who will have more than 30 years of simulated eligibility for participation in a 401(k) plan. Workers are assumed to retire at age 65 and all 401(k) balances are converted into a real annuity at an annuity purchase price of 18.62. ** Plans are assumed to have automatic escalation with a 1 percent of annual compensation increase and plan-specific default contribution rates. Employees are assumed to retain their previous level of contributions when they participate in a new plan and opt out of automatic escalation in accordance with the probabilities in VanDerhei (September 2007).
ebri.org Notes • January 2014 • Vol. 35, No. 1 11

Lowest-Income Quartile Second Third Highest-Income Quartile
60 percent 73% 73% 75% 76%
70 percent 63% 61% 61% 62%
80 percent 50% 47% 48% 50%
0%
10%
20%
30%
40%
50%
60%
70%
80%
Figure 3Percentage of Successful* Retirements for Voluntary-
Enrollment 401(k) Plans, by Income Quartile: Current Social Security Retirement Benefits Reduced by 24 Percent
Source: EBRI Retirement Security Projection Model,® versions 1950 and 1951. * "Success" is defined as achieving an X percent real replacement rate from Social Security and 401(k) accumulations combined as defined in VanDerhei and Lucas (2010) where X = 60, 70 or 80. The population simulated consists of workers currently ages 25–29 who will have more than 30 years of simulated eligibility for participation in a 401(k) plan. Workers are assumed to retire at age 65, and all 401(k) balances are converted into a real annuity at an annuity purchase price of 18.62.
Lowest-Income Quartile Second Third Highest-Income Quartile
60 percent 89% 88% 86% 83%
70 percent 83% 82% 79% 75%
80 percent 76% 72% 70% 67%
0%
10%
20%
30%
40%
50%
60%
70%
80%
90%
100%
Figure 4Percentage of Successful* Retirements for Automatic-Enrollment 401(k) Plans With Automatic Escallation,** by Income Quartile:
Current Social Security Retirement Benefits Reduced by 24 Percent
Source: EBRI Retirement Security Projection Model,® version 1976. * "Success" is defined as achieving an X percent real replacement rate from Social Security and 401(k) accumulations combined as defined in VanDerhei and Lucas (2010) where X = 60, 70 or 80. The population simulated consists of workers currently ages 25–29 who will have more than 30 years of simulated eligibility for participation in a 401(k) plan. Workers are assumed to retire at age 65 and all 401(k) balances are converted into a real annuity at an annuity purchase price of 18.62. ** Plans are assumed to have automatic escalation with a 1 percent of annual compensation increase and plan-specific default contribution rates. Employees are assumed to retain their previous level of contributions when they participate in a new plan and opt-out of automatic escalation in accordance with the probabilities in VanDerhei (September 2007).
ebri.org Notes • January 2014 • Vol. 35, No. 1 12

ebri.org Notes • January 2014 • Vol. 35, No. 1 13
As expected, the simulated reduction in Social Security retirement benefits has a much larger impact on the lower-income quartile: The percentage of the lowest-income quartile under voluntary enrollment 401(k) plans with an 80 percent threshold drops 17 percentage points, from 67 percent to 50 percent, while the highest-income quartile—which receives less proportionate benefits from Social Security—drops by only 9 percentage points, from 59 percent to 50 percent ( Figure 1 compared with Figure 3).
A similar (but less pronounced) impact is found for the automatic-enrollment plans (Figure 2 compared with Figure 4). In this case, the percentage of the lowest-income quartile with successful retirements at an 80-percent threshold drops 9 percentage points (from 85 percent to 76 percent) with the potential reduction in Social Security retirement benefits, while the highest-income quartile drops only by 6 percentage points (from 73 percent to 67 percent).
Summary Since 2003, EBRI research has documented and quantified the role of Social Security, defined benefit and private retirement accounts on retirement income adequacy for Baby Boomers and Gen Xers in the United States.
Assuming current Social Security benefits are not reduced, between 83 and 86 percent of workers with more than 30 years of eligibility in a voluntary enrollment 401(k) plan are simulated to have sufficient 401(k) accumulations that, combined with Social Security retirement benefits, will be able to replace at least 60 percent of their age-64 wages and salary on an inflation-adjusted basis. When the threshold for a financially successful retirement is increased to 70 percent replacement of age-64 income, 73–76 percent of these workers will still meet that threshold, relying only on 401(k) and Social Security combined. At an 80 percent replacement rate, 67 percent of the lowest-income quartile will still meet the threshold; however the percentage of those in the highest-income quartile deemed to be “successful” relying on just these two retirement components slips to 59 percent.
When the same analysis is conducted for automatic enrollment 401(k) plans (with an annual 1 percent automatic-escalation provision and empirically derived opt-outs), the probability of success increases substantially: 88–94 per-cent at a 60 percent threshold; 81–90 percent at a 70-percent replacement threshold; and 73–85 percent at an 80 percent threshold.

ebri.org Notes • January 2014 • Vol. 35, No. 1 14
Appendix A: Brief Chronology of the EBRI Retirement Security Projection Model® The Retirement Security Projection Model® (RSPM) grew out of a multi-year project to analyze the future
economic well-being of the retired population at the state level. The Employee Benefit Research Institute (EBRI) and the Milbank Memorial Fund, working with the office of the governor of Oregon, set out in the late 1990s to see if this situation could be evaluated for the state. The resulting analysis (VanDerhei and Copeland, September 2001) focused primarily on simulated retirement wealth with a comparison to ad hoc thresholds for retirement expenditures.
The April 2001 EBRI Issue Brief (VanDerhei and Copeland, April 2001) highlighted the changes in private pension plan participation for defined benefit (DB) and defined contribution (DC) plans and used the model to quantify how much the importance of individual-account plans was expected to increase because of these changes.
With the assistance of the Kansas Insurance Department, EBRI was able to create the EBRI Retirement Readiness RatingTM (RRR) based on a full stochastic decumulation model that took into account the household’s longevity risk, post-retirement investment risk, and exposure to potentially catastrophic nursing-home and home-health-care risks. The first state-level RSPM results were presented to the Kansas’ Long-Term Care Services Task Force on July 11, 2002 (VanDerhei and Copeland, July 2002), and the results of the Massachusetts study were presented on Dec. 1, 2002 (VanDerhei and Copeland, December 2002).
RSPM was expanded to a national model—the first national, micro-simulation, retirement-income-adequacy model, built in part from administrative 401(k) data. The initial results were presented at the EBRI December 2003 policy forum (VanDerhei and Copeland, 2003).
The basic model was subsequently modified for testimony for the Senate Special Committee on Aging to quantify the beneficial impact of a mandatory contribution of 5 percent of compensation. (VanDerhei, January 2004).
The model was enhanced to allow an analysis of the impact of annuitizing defined contribution and individual retirement account (IRA) balances at retirement age (VanDerhei and Copeland, 2004).
Additional refinements were introduced to evaluate the impact of purchasing long-term care insurance on retirement income adequacy (VanDerhei, 2005).
The model was used to evaluate the impact of defined benefit freezes on participants by simulating the minimum employer-contribution rate that would be needed to financially indemnify the employees for the reduction in their expected retirement income under various rate-of-return assumptions (VanDerhei, March 2006).
Later that year, an updated version of the model was developed to enhance the EBRI interactive Ballpark E$timate® by providing Monte Carlo simulations of the replacement rates needed for specific probabilities of retirement-income adequacy under alternative-risk-management treatments (VanDerhei, September 2006).
RSPM was significantly enhanced for the May 2008 EBRI policy forum by allowing automatic enrollment of 401(k) participants with the potential for automatic escalation of contributions to be included (VanDerhei and Copeland, 2008).
Additional modifications were added for a Pension Research Council presentation that involved a “winners/losers” analysis of defined benefit freezes and the enhanced employer contributions provided to defined contribution plans at the time the defined benefit plans were frozen (Copeland and VanDerhei, 2010).
Also in 2009, a new subroutine was added to allow simulations of various styles of target-date funds for a comparison with participant-directed investments (VanDerhei, June 2009).
ebri.org Notes • January 2014 • Vol. 35, No. 1 15
In April 2010, the model was completely re-parameterized with 401(k)-plan design parameters for sponsors that had adopted automatic-enrollment provisions (VanDerhei, April 2010).
A completely updated version of the national model was produced for the May 2010 EBRI policy forum and used in the July 2010 EBRI Issue Brief (VanDerhei and Copeland, 2010).
The new model was used to analyze how eligibility for participation in a defined contribution plan impacts retirement income adequacy in September 2010 (VanDerhei, September 2010), and was later used to compute Retirement Savings Shortfalls (RSS) for Baby Boomers and Generation Xers in October 2010 (VanDerhei, October 2010a).
In October testimony before the Senate Health, Education, Labor and Pensions Committee on “The Wobbly Stool: Retirement (In)security in America,” the model was used to analyze the relative importance of employer-provided retirement benefits and Social Security (VanDerhei, October 2010b).
The November 2010 EBRI Issue Brief expanded upon earlier work by EBRI to provide the first results of a new simulation model that estimated the impact of changing 401(k) plan design variables and assumptions on retirement income adequacy. Until recently however, there was extremely limited evidence on the impact of automatic contribution escalation (VanDerhei and Lucas, 2010).
In February 2011, the model was used to analyze the impact of the 2008–2009 crisis in the financial and real estate markets on retirement income adequacy (VanDerhei, February 2011).
An April 2011 article introduced a new method of analyzing the results from RSPM (VanDerhei, April 2011). Rather than simply computing an overall percentage of the simulated life paths in a particular cohort that would not have sufficient retirement income to pay for the simulated expenses, the new method computed the percentage of households that would meet that requirement more than a specified percentage of times in the simulation.
As explored in the June 2011 EBRI Issue Brief, the RSPM allowed retirement-income adequacy to be assessed at retirement ages later than 65 (VanDerhei and Copeland, June 2011).
In a July 2011 EBRI Notes article (VanDerhei, July 2011), RSPM was used to provide preliminary evidence of the impact of the “20/20 caps” on projected retirement accumulations proposed by the National Commission on Fiscal Responsibility and Reform.
The August 2011 EBRI Notes article (VanDerhei, August 2011) used RSPM to analyze the impact of defined benefit plans in achieving retirement income adequacy for Baby Boomers and Gen Xers.
In September, it was used to support testimony before the Senate Finance Committee (VanDerhei, September 2011) in analyzing the potential impact of various types of tax-reform options on retirement income. This was expanded in the November 2011 EBRI Issue Brief (VanDerhei, November 2011).
A March 2012 EBRI Notes article (VanDerhei, March 2012) used new survey results to update the analysis of the potential impact of various types of tax-reform options on retirement income.
The May 2012 EBRI Notes article (VanDerhei, May 2012) provided 2012 updates for the previously published RRRs as well as the RSS.
The June 2012 EBRI Notes article (VanDerhei, June 2012) introduced severity categories in the RSS projections for Gen Xers.

ebri.org Notes • January 2014 • Vol. 35, No. 1 16
The August 2012 EBRI Notes article (VanDerhei, August 2012) provided additional evidence on whether deferring retirement to age 70 would provide retirement income adequacy for the vast majority of Baby Boomers and Gen Xers.
The September 2012 EBRI Notes article (VanDerhei, September 2012) analyzed the impact of increasing the default-contribution rate for automatic enrollment 401(k) plans with automatic escalation of contributions.
The November 2012 EBRI Notes article (VanDerhei, November 2012) reclassified the RRRs to provide additional information on those substantially above the threshold; close to the threshold; and substantially below the threshold.
The March 2013 EBRI Notes article (VanDerhei and Adams, March 2013) used a modified version of RSPM to assess the probability that respondent households would not run short of money in retirement if they did, in fact, accumulate the amount they said would be required in the 2013 Retirement Confidence Survey.
The June 2013 EBRI Issue Brief (VanDerhei, June 2013a) used RSPM to provide a direct comparison of the likely benefits under specific types of DC and DB retirement plans.
The June 2013 EBRI Notes article (VanDerhei, June 2013b) used RSPM to show that 25–27 percent of Baby Boomers and Gen Xers who would have had adequate retirement income under return assumptions based on historical averages were simulated to end up running short of money in retirement if today’s historically low interest rates were assumed to be a permanent condition.
The August 2013 EBRI Issue Brief (VanDerhei, August 2013) used RSPM to analyze the Obama administration’s fiscal year (FY) 2014 budget proposal to include a cap on tax-deferred retirement savings that would limit the amounts accumulated in specified retirement accounts to that necessary to provide the maximum annuity permitted for a tax-qualified defined benefit plan under current law.
The December 2013 EBRI Notes article (VanDerhei, December 2013) used RSPM to expand the analysis in the June 2013 Issue Brief. Rather than trying to reflect the real-world variation in DB accruals, the baseline analysis in the previous analysis used the median accrual rate in the sample (1.5 percent of final compensation per year of participation) as the stylized value for the baseline counterfactual simulations. The new research computed the actual final-average DB accrual that would be required to provide an equal amount of retirement income at age 65 as would be produced by the annuitized value of the projected sum of the 401(k) and IRA rollover balances.
ebri.org Notes • January 2014 • Vol. 35, No. 1 17
References Copeland, Craig, and Jack VanDerhei. “The Declining Role of Private Defined Benefit Pension Plans: Who Is Affected, and
How.” In Robert L. Clark and Olivia Mitchell, eds., Reorienting Retirement Risk Management. New York: Oxford University Press for the Pension Research Council, 2010: 122–136.
MacDonald, Bonnie-Jeanne, and Kevin D. Moore. 2011. “Moving Beyond the Limitations of Traditional Replacement Rates.” Society of Actuaries (September).
Social Security Administration, Board of Trustees. “The 2013 Annual Report of the Board of Trustees of the Federal Old-Age and Survivors Insurance and Federal Disability Insurance Trust Funds.” http://www.ssa.gov/oact/tr/2013/tr2013.pdf
Utkus, Stephen P., and Jean A. Young. 2013. “How America Saves 2013, A Report On Vanguard 2012 Defined Contribution Plan Data.” https://institutional.vanguard.com/VGApp/iip/site/institutional/clientsolutions/dc/howamericasaves
VanDerhei, Jack. “How Much Would it Take? Achieving Retirement Income Equivalency between Final-Average-Pay Defined Benefit Plan Accruals and Voluntary Enrollment 401(k) Plans in the Private Sector.” EBRI Notes, no. 12 (Employee Benefit Research Institute, December 2013): 11–23.
. “The Impact of a Retirement Savings Account Cap,” EBRI Issue Brief, no. 389, (Employee Benefit Research Institute, August 2013).
. “Reality Checks: A Comparative Analysis of Future Benefits from Private-Sector, Voluntary-Enrollment 401(k) Plans vs. Stylized, Final-Average-Pay Defined Benefit and Cash Balance Plans” EBRI Issue Brief, no. 387 (Employee Benefit Research Institute, June 2013a). http://www.ebri.org/publications/ib/index.cfm?fa=ibDisp&content_id=5229
. “What a Sustained Low-yield Rate Environment Means for Retirement Income Adequacy: Results From the 2013 EBRI Retirement Security Projection Model.®” EBRI Notes, no. 3 (Employee Benefit Research Institute, June 2013b): 2–12.
. “All or Nothing? An Expanded Perspective on Retirement Readiness.” EBRI Notes, no. 11 (Employee Benefit Research Institute, November 2012): 11–23.
. “Increasing Default Deferral Rates in Automatic Enrollment 401(k) Plans: The Impact on Retirement Savings Success in Plans With Automatic Escalation.” EBRI Notes, no. 9 (Employee Benefit Research Institute, September 2012): 12–22.
. “Is Working to Age 70 Really the Answer for Retirement Income Adequacy?” EBRI Notes, no. 8 (Employee Benefit Research Institute, August 2012): 10–21.
. “Retirement Readiness Ratings and Retirement Savings Shortfalls for Gen Xers: The Impact of Eligibility for Participation in a 401(k) Plan.” EBRI Notes, no. 6 (Employee Benefit Research Institute, June 2012): 9–21.
. “Retirement Income Adequacy for Boomers and Gen Xers: Evidence from the 2012 EBRI Retirement Security Projection Model.®” EBRI Notes, no. 5 (Employee Benefit Research Institute, May 2012): 2–14.
. “Modifying the Federal Tax Treatment of 401(k) Plan Contributions: Projected Impact on Participant Account Balances.” EBRI Notes, no. 3 (Employee Benefit Research Institute, March 2012): 2–18.
. “Tax Reform Options: Promoting Retirement Security.” EBRI Issue Brief, no. 364 (Employee Benefit Research Institute, November 2011).

ebri.org Notes • January 2014 • Vol. 35, No. 1 18
. Testimony. U.S. Congress. Senate Finance Committee. Tax Reform Options: Promoting Retirement Security (T-170), 15 Sept. 2011.
. “The Importance of Defined Benefit Plans for Retirement Income Adequacy.” EBRI Notes, no. 8 (Employee Benefit Research Institute, August 2011): 7–16.
. “Capping Tax-Preferred Retirement Contributions: Preliminary Evidence of the Impact of the National Commission on Fiscal Responsibility and Reform Recommendations.” EBRI Notes, no. 7 (Employee Benefit Research Institute, July 2011): 2–6.
. “Retirement Income Adequacy: Alternative Thresholds and the Importance of Future Eligibility in Defined Contribution Retirement Plans.” EBRI Notes, no. 4 (Employee Benefit Research Institute, April 2011): 10–19.
. “The Impact of Modifying the Exclusion of Employee Contributions for Retirement Savings Plans From Taxable Income: Results From the 2011 Retirement Confidence Survey.” EBRI Notes, no. 3 (Employee Benefit Research Institute, March 2011): 2–10.
. “A Post-Crisis Assessment of Retirement Income Adequacy for Baby Boomers and Gen Xers.” EBRI Issue Brief, no. 354 (Employee Benefit Research Institute, February 2011).
. Testimony. U.S. Congress. Senate Health, Education, Labor and Pensions Committee. The Wobbly Stool: Retirement (In)security in America (T-166), 7 Oct. 2010b.
. “Retirement Savings Shortfalls for Today’s Workers.” EBRI Notes, no. 10 (Employee Benefit Research Institute, October 2010a): 2−9.
. “Retirement Income Adequacy for Today’s Workers: How Certain, How Much Will It Cost, and How Does Eligibility for Participation in a Defined Contribution Plan Help?” EBRI Notes, no. 9 (Employee Benefit Research Institute, September 2010): 13–20.
. “The Impact of Automatic Enrollment in 401(k) Plans on Future Retirement Accumulations: A Simulation Study
Based on Plan Design Modifications of Large Plan Sponsors.” EBRI Issue Brief, no. 341 (Employee Benefit Research Institute, April 2010). http://www.ebri.org/publications/ib/index.cfm?fa=ibDisp&content_id=4495
. “Falling Stocks: What Will Happen to Retirees' Incomes? The Worker Perspective,” Presentation for The Economic Crisis of 2008: What Will Happen to Retirees’ Incomes? 2009 APPAM Fall Conference (November 2009).
. Testimony. Joint DOL/SEC Public Hearing on Target Dates Funds. “How Would Target-Date Funds Likely Impact Future 401(k) Accumulations?” (T-160), June 2009. www.ebri.org/pdf/publications/testimony/t160.pdf
. “The Expected Impact of Automatic Escalation of 401(k) Contributions on Retirement Income.” EBRI Notes, no. 9 (Employee Benefit Research Institute, September 2007): 2–8
. “Measuring Retirement Income Adequacy: Calculating Realistic Income Replacement Rates.” EBRI Issue Brief, no. 297 (Employee Benefit Research Institute, September 2006).
. “Defined Benefit Plan Freezes: Who's Affected, How Much, and Replacing Lost Accruals.” EBRI Issue Brief, no. 291 (Employee Benefit Research Institute, March 2006).
. “Projections of Future Retirement Income Security: Impact of Long Term Care Insurance.” 2005 American Society on Aging/National Council on Aging Joint Conference, March 2005.

ebri.org Notes • January 2014 • Vol. 35, No. 1 19
. Testimony. U.S. Congress. Senate Special Committee on Aging. “Do We Have a Crisis in America? Results From the EBRI-ERF Retirement Security Projection Model” (T-141), 27 Jan. 2004.
VanDerhei, Jack, and Nevin Adams. “A Little Help: The Impact of On-line Calculators and Financial Advisors on Setting Adequate Retirement-Savings Targets: Evidence from the 2013 Retirement Confidence Survey,” EBRI Notes, no. 3 (Employee Benefit Research Institute, March 2013).
VanDerhei, Jack, and Craig Copeland. “The Impact of Deferring Retirement Age on Retirement Income Adequacy.” EBRI Issue Brief, no. 358 (Employee Benefit Research Institute, June 2011). http://papers.ssrn.com/sol3/papers_LAB.cfm?abstract_id=1152392
. “The EBRI Retirement Readiness Rating:TM Retirement Income Preparation and Future Prospects.” EBRI Issue Brief, no. 344 (Employee Benefit Research Institute, July 2010).
. “The Impact of PPA on Retirement Income for 401(k) Participants.” EBRI Issue Brief, no. 318 (Employee Benefit Research Institute, June 2008).
. “ERISA At 30: The Decline of Private-Sector Defined Benefit Promises and Annuity Payments: What Will It Mean?” EBRI Issue Brief, no. 269 (Employee Benefit Research Institute, May 2004).
. “Can America Afford Tomorrow's Retirees: Results From the EBRI-ERF Retirement Security Projection Model.®” EBRI Issue Brief, no. 263 (Employee Benefit Research Institute, November 2003).
. “Kansas Future Retirement Income Assessment Project.” A project of the EBRI Education and Research Fund and the Milbank Memorial Fund. July 16, 2002.
. “Massachusetts Future Retirement Income Assessment Project.” A project of the EBRI Education and Research Fund and the Milbank Memorial Fund. December 1, 2002.
. “Oregon Future Retirement Income Assessment Project.” A project of the EBRI Education and Research Fund and the Milbank Memorial Fund. September 2001.
. “A Behavioral Model for Predicting Employee Contributions to 401(k) Plans.” North American Actuarial Journal (November 2001).
. “The Changing Face of Private Retirement Plans.” EBRI Issue Brief, no. 232 (Employee Benefit Research Institute, April 2001).
VanDerhei, Jack, Sarah Holden, Luis Alonso, and Steven Bass. “401(k) Plan Asset Allocation, Account Balances, and Loan Activity in 2012.” EBRI Issue Brief, no. 394, (Employee Benefit Research Institute, December 2013); and ICI Research Perspective , Vol. 19, no. 12 (December 2013).
. “401(k) Participants in the Wake of the Financial Crisis: Changes in Account Balances, 2007–2011,” EBRI Issue Brief, no. 391 (Employee Benefit Research Institute, October 2013); and ICI Research Perspective, Vol. 19, no. 7 October 2013.
VanDerhei, Jack, and Lori Lucas. “The Impact of Auto-enrollment and Automatic Contribution Escalation on Retirement Income Adequacy.” EBRI Issue Brief, no. 349 (Employee Benefit Research Institute, November 2010); and DCIIA Research Report (November 2010).

ebri.org Notes • January 2014 • Vol. 35, No. 1 20
Endnotes 1 See Appendix A for a brief chronology of the model.
2 Born between 1948–1964.
3 Born between 1965–1974.
4 This number is somewhat larger than the $4.3 trillion reported in VanDerhei (May 2012); however, the baseline assumptions used in the 2010 analysis did not provide for the utilization of net housing equity to ensure retirement income adequacy. When the analysis is repeated with the same assumptions as used in 2010, the aggregate deficit actually increases to $4.8 trillion.
5 As a result of several requests to determine the impact of the financial and real estate market crises on overall retirement income adequacy, EBRI conducted another analysis in 2011 that found the percentage of households that would not have been “at risk” without the 2008–2009 crisis but that ended up “at risk” varies from a low of 3.8 percent to a high of 14.3 percent. See VanDerhei (February 2011) for more detail.
6 See VanDerhei (August 2011) for more detail. It should be noted that the huge impact on retirement income adequacy of having a defined benefit plan accrual at age 65 may be a bit misleading given that any participant changing jobs prior to age 65 is assumed to receive a lump-sum distribution instead of a terminated, vested annuity if the present value of the accrual falls below statutory thresholds. Although the “defined benefit vs. defined contribution” debate has produced a substantial amount of conjecture in recent years, a careful analysis of the ability to generate “adequate” retirement income under either type of retirement plan needs to include proper data and methods to simulate future job changes and employee behavior at that time as well as future participation, contribution and asset allocation decisions by defined contribution participants. See VanDerhei (June 2013a) and VanDerhei (December 2013) for an example of this type of comparative analysis.
7 See VanDerhei, Holden, Alonso and Bass (December 2013) for the most recent results.
8 VanDerhei, Holden, Alonso and Bass (October 2013).
9 The proposed regulations for 401(k) plans were first introduced in November of 1981, and it took several years for many sponsors to introduce the plans. Moreover, many plans that were originally introduced as supplemental plans to existing defined benefit plans have been modified to provide more generous employer contributions at the time the defined benefit plans were frozen (VanDerhei, April 2010).
10 See Figure 23 of Utkus and Young (2013) for recent evidence.
11 Additional details on RSPM and the assumptions used in 2013 can be found in VanDerhei (June 2013b). The financial-market results are generated from stochastic annual returns with a log-normal distribution and an arithmetic mean of 8.6 percent real return for stocks and 2.6 percent real return for bonds.
12 For an indication of how years of eligibility impact overall Retirement Readiness Ratings, see VanDerhei (June 2013b). This analysis simulates the impact of future years of eligibility for a defined contribution plan on the probability of households not running short of money in retirement. As can be seen in Figure 3 of that analysis, the probability that a Gen-Xer household with no future years of defined contribution eligibility will not run short of money in retirement is 38.6 percent. This increases to 59.8 percent for Gen-Xer households with one to nine years of future eligibility and 73.4 percent for those with 10–19 years. More than 17 out of 20 (86.1 percent) of Gen-Xer households with more than 20 years of future eligibility are simulated to not run short of money in retirement. This analysis was for all income quartiles combined. Similar results are found when controlling for relative levels of pre-retirement income (see Figure 4 of VanDerhei May 2012).
13 The annuitization of the balances are performed only for purposes of providing an income stream that can be added to the inflation-adjusted annuity provided by Social Security. Indeed, only a small percentage of defined contribution participants currently annuitize their entire account balance at retirement (and even a smaller percentage purchase an inflation-adjusted annuity for the entire amount). When RSPM is used to compute the Retirement Readiness Rating (the probability that a particular cohort will not run short of money in retirement), the defined contribution and IRA balances are not assumed to be annuitized but instead are assumed to be spent down as needed.

ebri.org Notes • January 2014 • Vol. 35, No. 1 21
14 See MacDonald and Moore (2011) for a very thorough review of the literature.
15 One reason for this is the need to determine how potentially catastrophic health care costs (such as nursing home costs) in retirement will be handled. Even though these costs will not be an issue for all retirees, and certainly not a problem in every year of retirement, a multi-year stay in a nursing home in retirement may deplete the retirement savings of a household to the point where it eventually runs short of money in retirement. See VanDerhei (August 2012) for more detail.
16 The phrase “401(k) accumulations” in this analysis denotes both accumulations in 401(k) accounts at retirement age as well as IRA rollovers that originated from 401(k)-plan accumulations.
17 RSPM needs to use information during the worker’s entire career to determine pre-retirement income quartiles (similar to the calculation of average indexed monthly earnings (AIME) for Social Security). This is explained in endnote 17 of VanDerhei and Copeland (2010).
18 VanDerhei (September 2012) simulated the impact of increasing the current plan-specific default rates (typically 3 percent of compensation) to 6 percent. Under a set of specified behavioral assumptions, more than a quarter of those in the lowest-income quartile who had previously not been successful under actual default contribution rates were found to be successful as a result of the change in deferral percentage.
19 Social Security Administration (2013).

1100 13th Street NW · Suite 878 Washington, DC 20005
(202) 659-0670 www.ebri.org
www.choosetosave.org
Where the world turns for the facts on U.S. employee benefits. Retirement and health benefits are at the heart of workers’, employers’, and our nation’s economic security. Founded in 1978, EBRI is the most authoritative and objective source of information on these critical, complex issues. EBRI focuses solely on employee benefits research — no lobbying or advocacy.
EBRI stands alone in employee benefits research as an independent, nonprofit, and nonpartisan organization. It analyzes and reports research data without spin or underlying agenda. All findings, whether on financial data, options, or trends, are revealing and reliable — the reason EBRI information is the gold standard for private analysts and decision makers, government policymakers, the media, and the public.
EBRI explores the breadth of employee benefits and related issues.
EBRI studies the world of health and retirement benefits — issues such as 401(k)s, IRAs, retirement income adequacy, consumer-driven benefits, Social Security, tax treatment of both retirement and health benefits, cost management, worker and employer attitudes, policy reform proposals, and pension assets and funding. There is widespread recognition that if employee benefits data exist, EBRI knows it.
EBRI delivers a steady stream of invaluable research and analysis.
EBRI publications include in-depth coverage of key issues and trends; summaries of research findings and policy developments; timely factsheets on hot topics; regular updates on legislative and regulatory developments; comprehensive reference resources on benefit programs and workforce issues; and major surveys of public attitudes.
EBRI meetings present and explore issues with thought leaders from all sectors. EBRI regularly provides congressional testimony, and briefs policymakers, member organizations,
and the media on employer benefits. EBRI issues press releases on newsworthy developments, and is among the most widely quoted
sources on employee benefits by all media. EBRI directs members and other constituencies to the information they need and undertakes new
research on an ongoing basis. EBRI maintains and analyzes the most comprehensive database of 401(k)-type programs in the
world. Its computer simulation analyses on Social Security reform and retirement income adequacy are unique.
EBRI makes information freely available to all.
EBRI assumes a public service responsibility to make its findings completely accessible at www.ebri.org — so that all decisions that relate to employee benefits, whether made in Congress or board rooms or families’ homes, are based on the highest quality, most dependable information. EBRI’s Web site posts all research findings, publications, and news alerts. EBRI also extends its education and public service role to improving Americans’ financial knowledge through its award-winning public service campaign ChoosetoSave® and the companion site www.choosetosave.org
EBRI is supported by organizations from all industries and sectors that appreciate the value of unbiased, reliable information on employee benefits. Visit www.ebri.org/about/join/ for more.

CHECK OUT EBRI’S WEB SITE! EBRI’s website is easy to use and packed with useful information! Look for these special features:
• EBRI’s entire library of research publications starts at the main Web page. Click on EBRI Issue Briefs and EBRI Notes for our in-depth and nonpartisan periodicals.
• Visit EBRI’s blog, or subscribe to the EBRIef e-letter.
• EBRI’s reliable health and retirement surveys are just a click away through the topic boxes at the top of the page.
• Need a number? Check out the EBRI Databook on Employee Benefits.
• Instantly get e-mail notifications of the latest EBRI data, surveys, publications, and meetings and seminars by clicking on the “Notify Me” or “RSS” buttons at the top of our home page.
There’s lots more!
Visit EBRI on-line today: www.ebri.org

EBRI Employee Benefit Research Institute Notes (ISSN 10854452) is published monthly by the Employee Benefit Research Institute, 1100 13th St. NW, Suite 878, Washington, DC 20005-4051, at $300 per year or is included as part of a membership subscription. Periodicals postage rate paid in Washington, DC, and additional mailing offices. POSTMASTER: Send address changes to: EBRI Notes, 1100 13th St. NW, Suite 878, Washington, DC 20005-4051. Copyright 2014 by Employee Benefit Research Institute. All rights reserved, Vol. 35, no. 1.
The Employee Benefit Research Institute (EBRI) was founded in 1978. Its mission is to contribute to, to encourage, and to enhance the development of sound employee benefit programs and sound public policy through objective research and education. EBRI is the only private, nonprofit, nonpartisan, Washington, DC-based organization committed exclusively to public policy research and education on economic security and employee benefit issues. EBRI’s membership includes a cross-section of pension funds; businesses; trade associations; labor unions; health care providers and insurers; government organizations; and service firms.
EBRI’s work advances knowledge and understanding of employee benefits and their importance to the nation’s economy among policymakers, the news media, and the public. It does this by conducting and publishing policy research, analysis, and special reports on employee benefits issues; holding educational briefings for EBRI members, congressional and federal agency staff, and the news media; and sponsoring public opinion surveys on employee benefit issues. EBRI’s Education and Research Fund (EBRI-ERF) performs the charitable, educational, and scientific functions of the Institute. EBRI-ERF is a tax-exempt organization supported by contributions and grants.
EBRI Issue Briefs are periodicals providing expert evaluations of employee benefit issues and trends, as well as critical analyses of employee benefit policies and proposals. EBRI Notes is a monthly periodical providing current information on a variety of employee benefit topics. EBRIef is a weekly roundup of EBRI research and insights, as well as updates on surveys, studies, litigation, legislation and regulation affecting employee benefit plans, while EBRI’s Blog supplements our regular publications, offering commentary on questions received from news reporters, policymakers, and others. EBRI’s Fundamentals of Employee Benefit Programs offers a straightforward, basic explanation of employee benefit programs in the private and public sectors. The EBRI Databook on Employee Benefits is a statistical reference work on employee benefit programs and work force-related issues.
Contact EBRI Publications, (202) 659-0670; fax publication orders to (202) 775-6312. Subscriptions to EBRI Issue Briefs are included as part of EBRI membership, or as part of a $199 annual subscription to EBRI Notes and EBRI Issue Briefs. Change of Address: EBRI, 1100 13th St. NW, Suite 878, Washington, DC, 20005-4051, (202) 659-0670; fax number, (202) 775-6312; e-mail: [email protected] Membership Information: Inquiries regarding EBRI membership and/or contributions to EBRI-ERF should be directed to EBRI President Dallas Salisbury at the above address, (202) 659-0670; e-mail: [email protected]
Editorial Board: Dallas L. Salisbury, publisher; Stephen Blakely, editor. Any views expressed in this publication and those of the authors should not be ascribed to the officers, trustees, members, or other sponsors of the Employee Benefit Research Institute, the EBRI Education and Research Fund, or their staffs. Nothing herein is to be construed as an attempt to aid or hinder the adoption of any pending legislation, regulation, or interpretative rule, or as legal, accounting, actuarial, or other such professional advice.
EBRI Notes is registered in the U.S. Patent and Trademark Office. ISSN: 10854452 10854452/90 $ .50+.50
© 2014, Employee Benefit Research InstituteEducation and Research Fund. All rights reserved.
Who we are
What we do
Our publications
Orders/ Subscriptions