the continuous mortality investigation bureau chris daykin, cmi executive committee
TRANSCRIPT
The Continuous Mortality Investigation Bureau
Chris Daykin,
CMI Executive Committee
The CMIB
• History
• Role
• Structure
• Funding
• Investigations
• Reporting results
NB “Office” = “company”
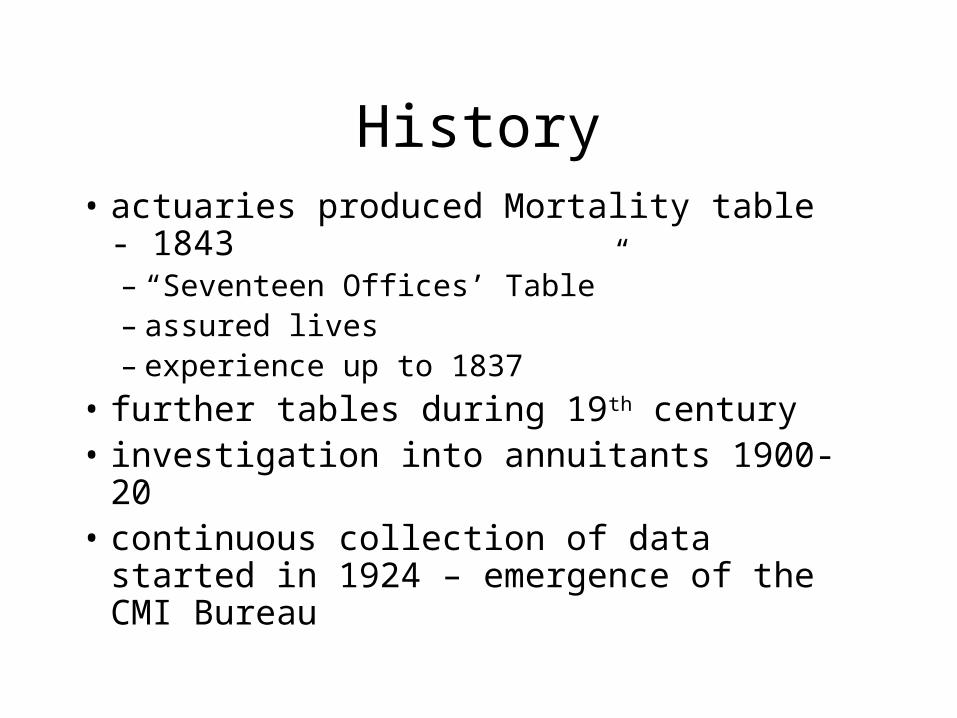
History• actuaries produced Mortality table - 1843
– “Seventeen Offices’ Table”– assured lives– experience up to 1837
• further tables during 19th century• investigation into annuitants 1900-20• continuous collection of data started in
1924 – emergence of the CMI Bureau
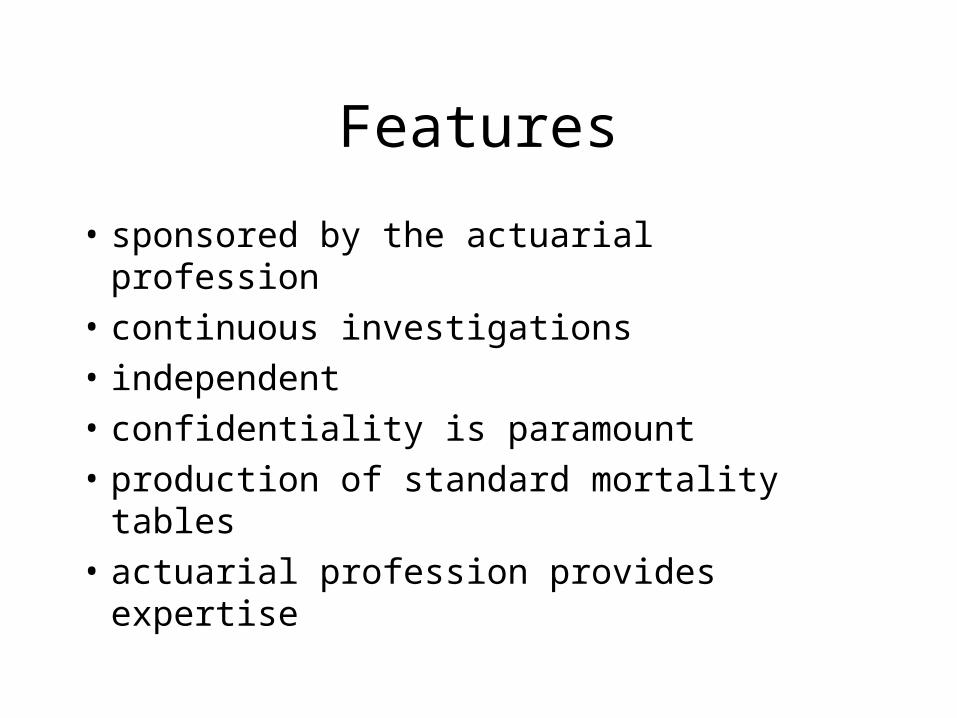
Features
• sponsored by the actuarial profession
• continuous investigations
• independent
• confidentiality is paramount
• production of standard mortality tables
• actuarial profession provides expertise
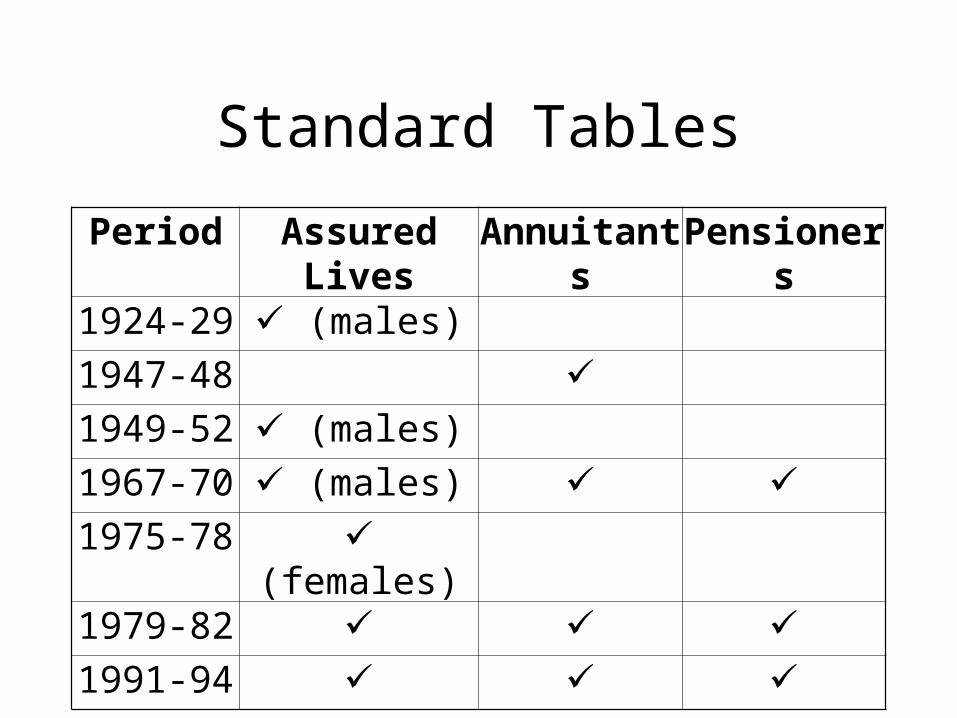
Standard Tables
Period Assured Lives Annuitants Pensioners
1924-29 (males)
1947-48 1949-52 (males)
1967-70 (males) 1975-78 (females)
1979-82 1991-94
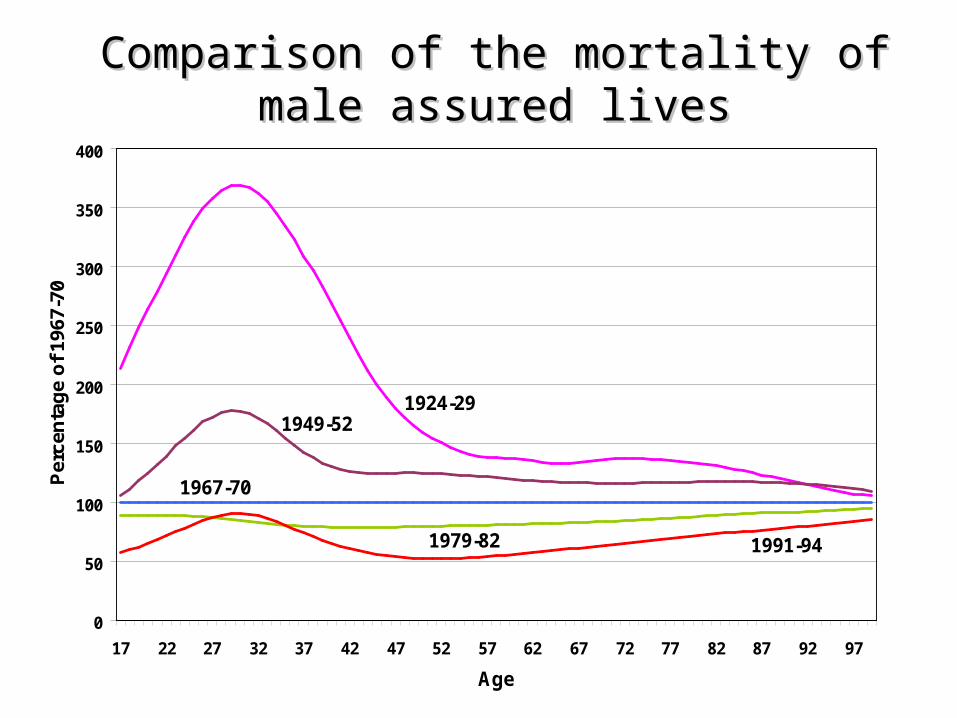
Comparison of the mortality of male assured livesComparison of the mortality of male assured lives
0
50
100
150
200
250
300
350
400
17 22 27 32 37 42 47 52 57 62 67 72 77 82 87 92 97
Age
Per
cen
tag
e o
f 19
67-7
0
1924-291949-52
1967-70
1991-941979-82
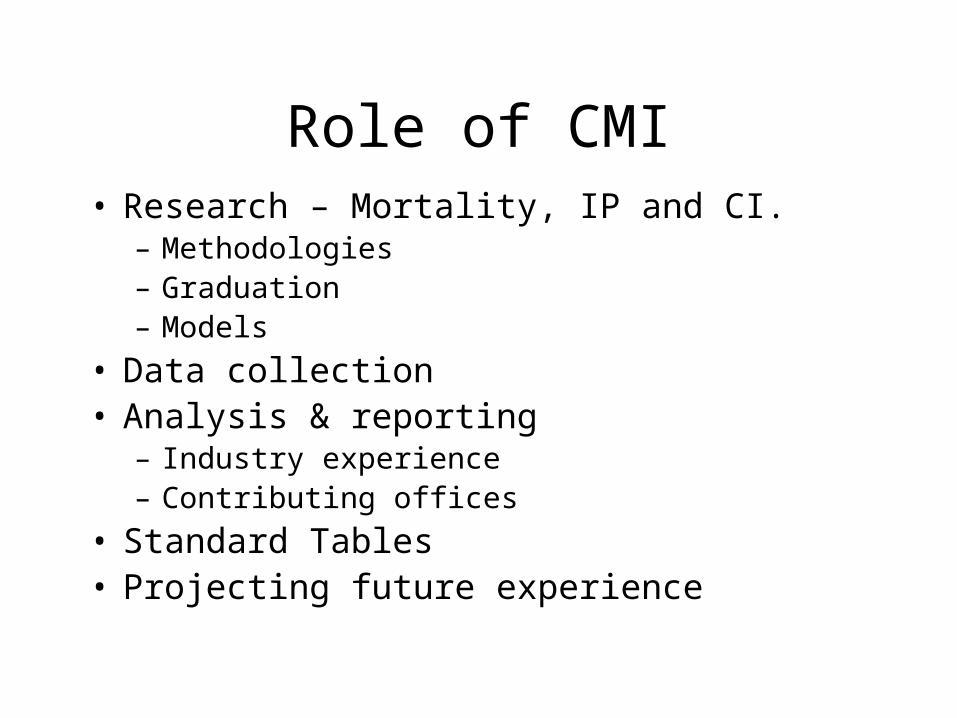
Role of CMI• Research – Mortality, IP and CI.
– Methodologies– Graduation– Models
• Data collection• Analysis & reporting
– Industry experience– Contributing offices
• Standard Tables• Projecting future experience
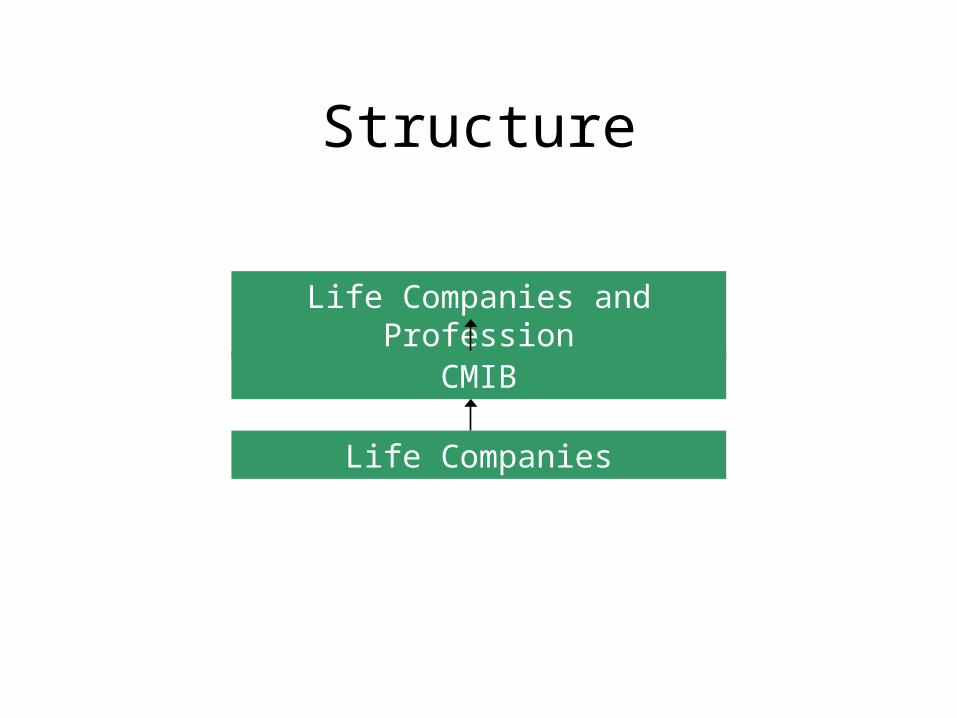
Structure
Life Companies and Profession
CMIB
Life Companies
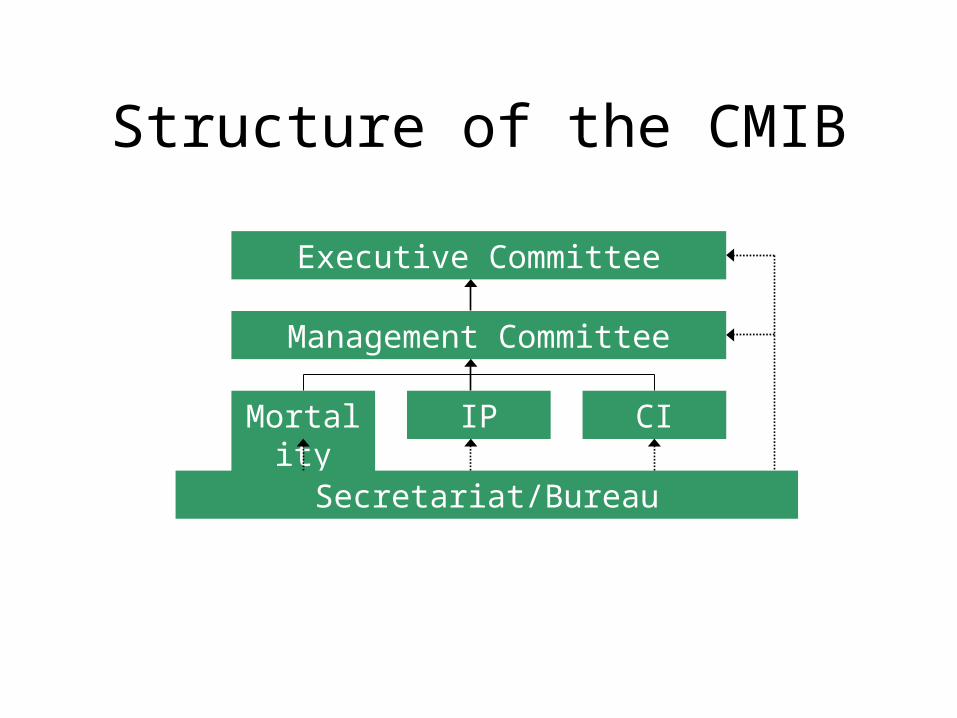
Structure of the CMIB
Executive Committee
Management Committee
Mortality IP CI
Secretariat/Bureau

Who serves on the Committees?
• life office actuaries
• reinsurance actuaries
• consultants
• government actuaries
• academics

Role of the Secretariat Servicing committees
organising Meetings drafting standard reports printing and distribution of CMI Reports
Day to day operations collecting data corresponding with offices producing results collecting money & accounts
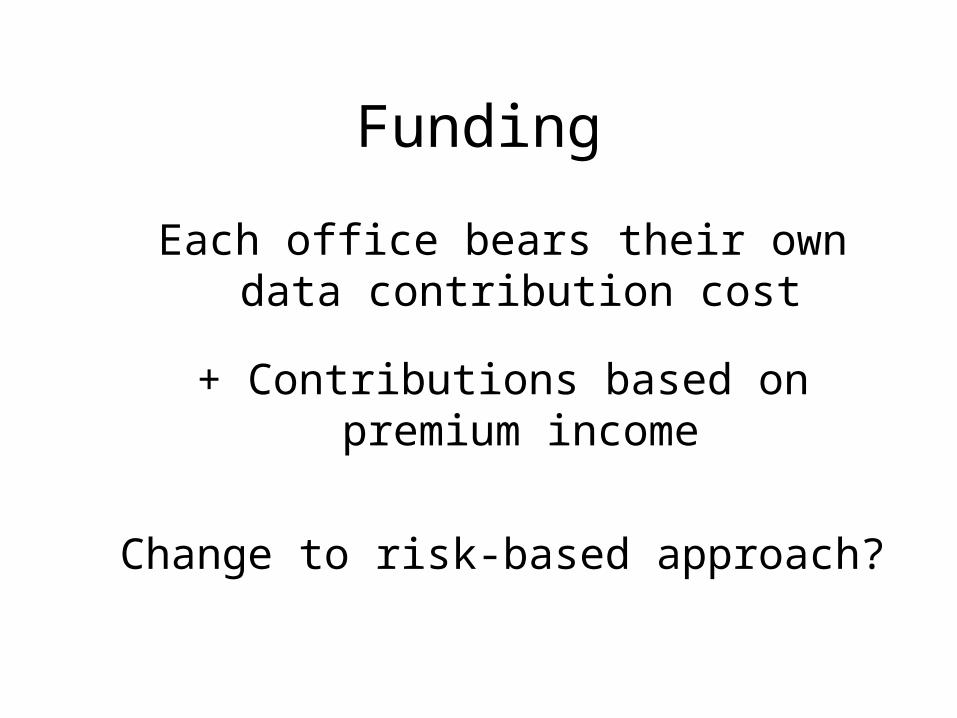
Funding
Each office bears their own data contribution cost
+ Contributions based on premium income
Change to risk-based approach?
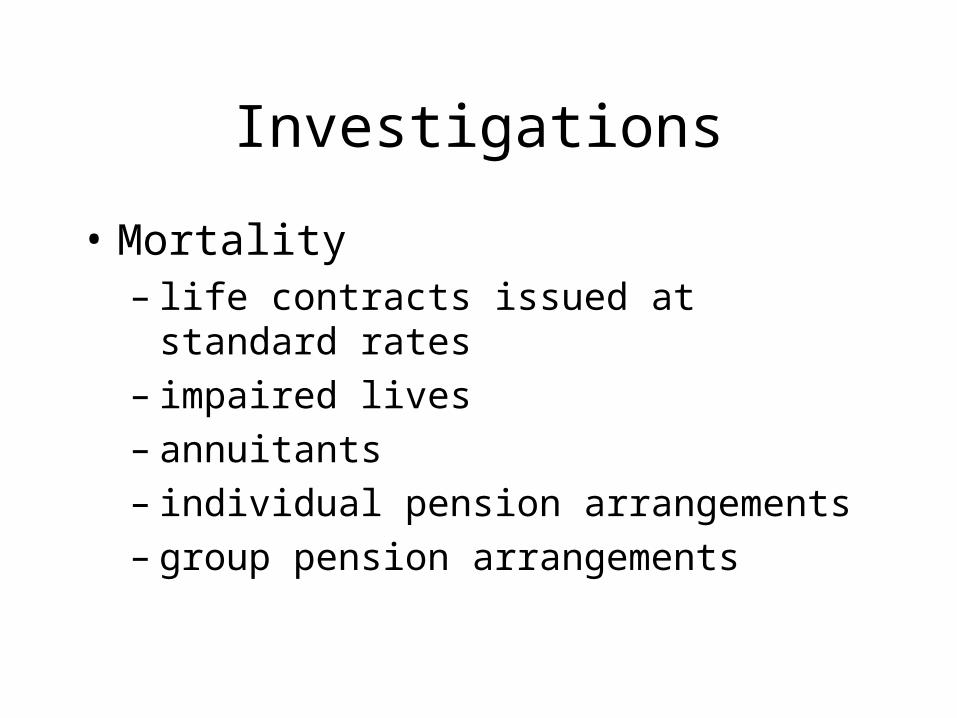
Investigations
• Mortality– life contracts issued at standard rates– impaired lives– annuitants– individual pension arrangements– group pension arrangements
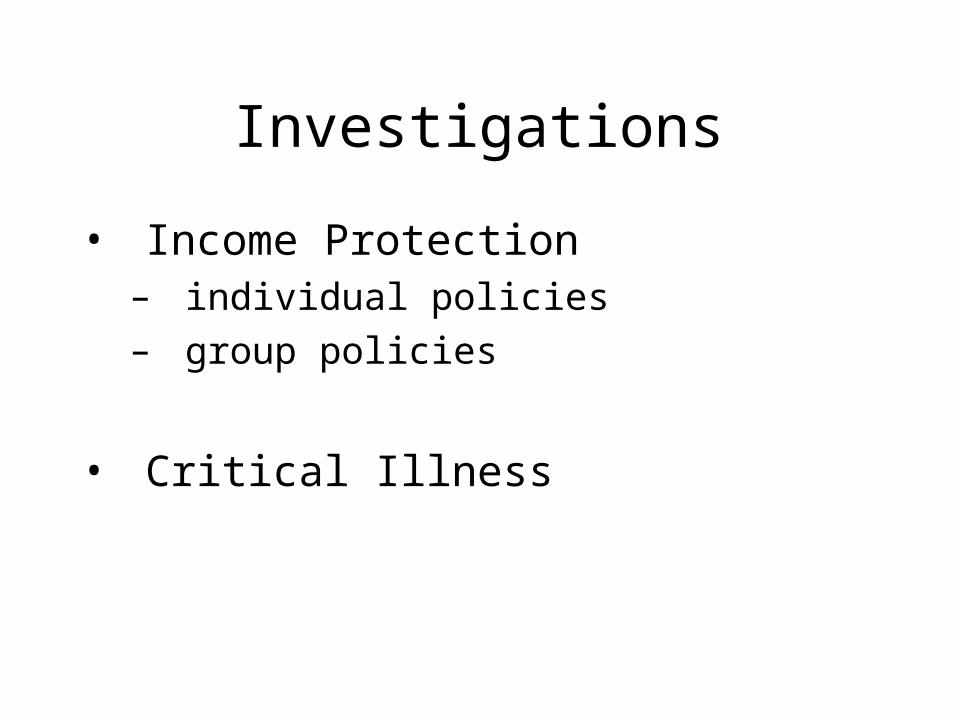
Investigations
• Income Protection– individual policies– group policies
• Critical Illness
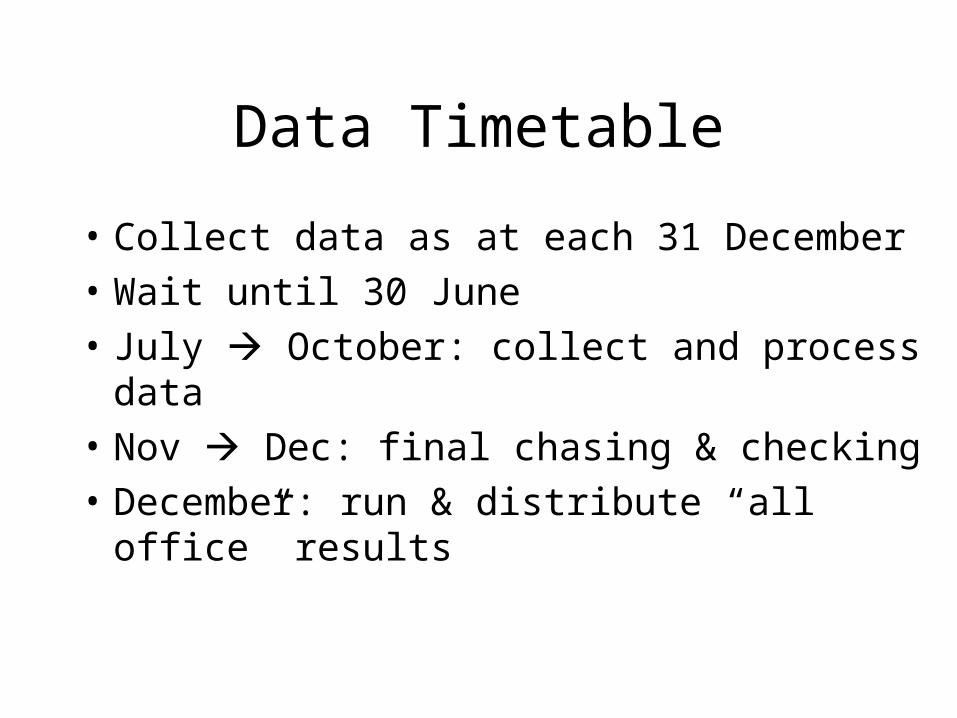
Data Timetable
• Collect data as at each 31 December
• Wait until 30 June
• July October: collect and process data
• Nov Dec: final chasing & checking
• December: run & distribute “all office” results
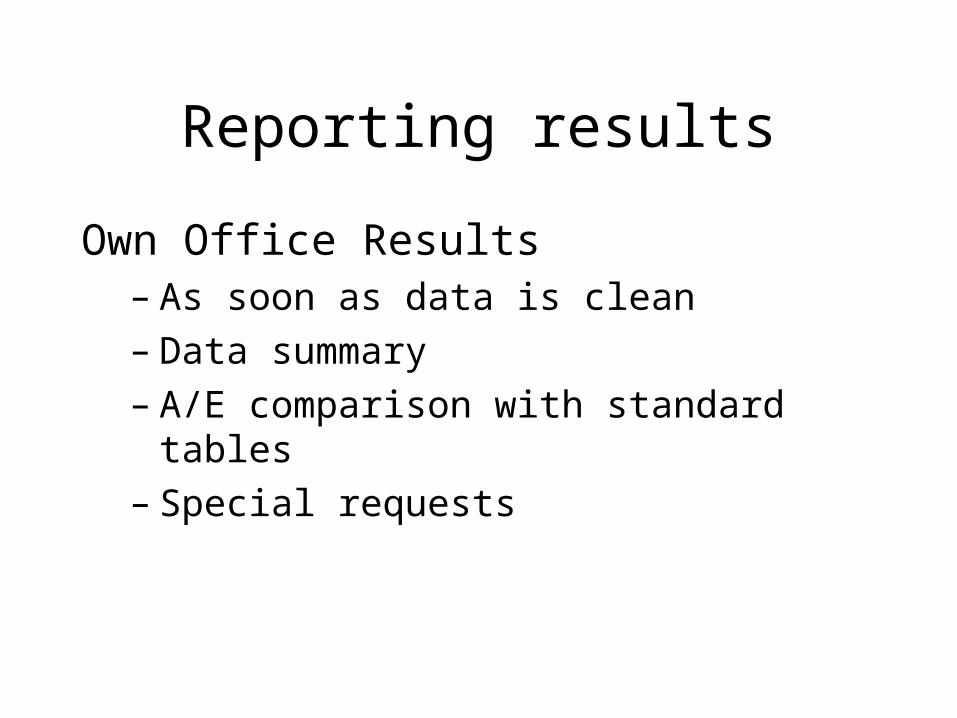
Reporting results
Own Office Results– As soon as data is clean– Data summary– A/E comparison with standard tables– Special requests
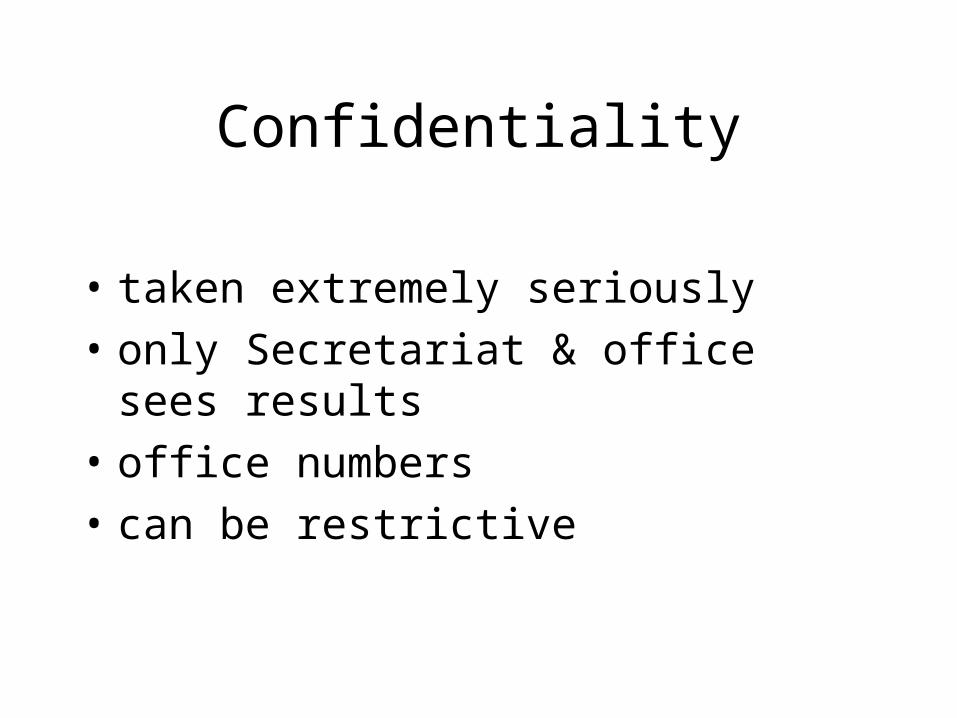
Confidentiality
• taken extremely seriously
• only Secretariat & office sees results
• office numbers
• can be restrictive
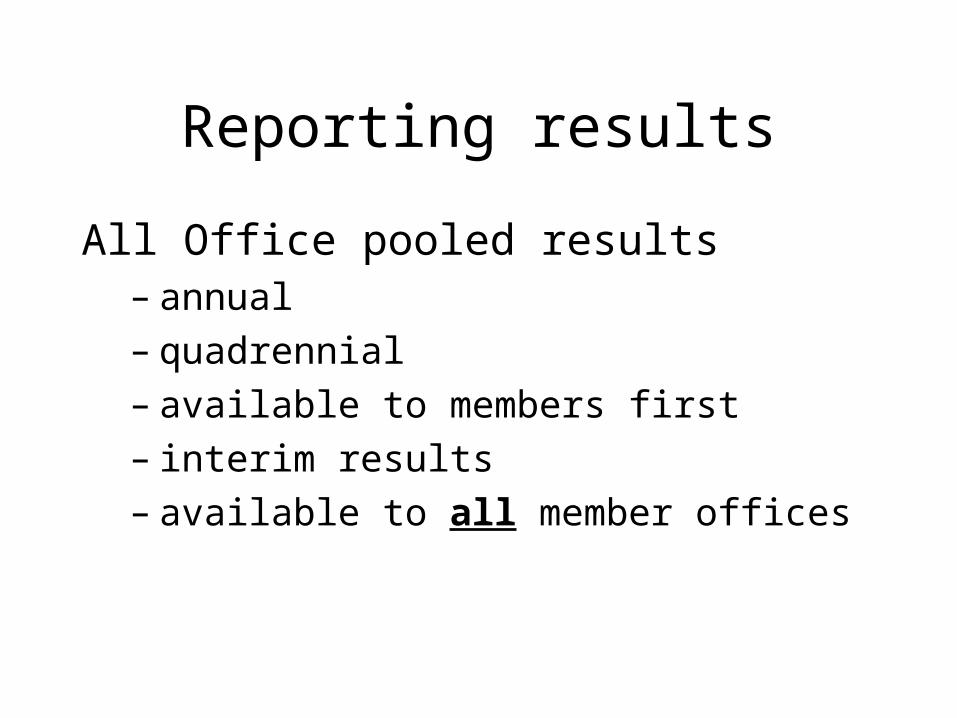
Reporting results
All Office pooled results– annual– quadrennial– available to members first– interim results– available to all member offices
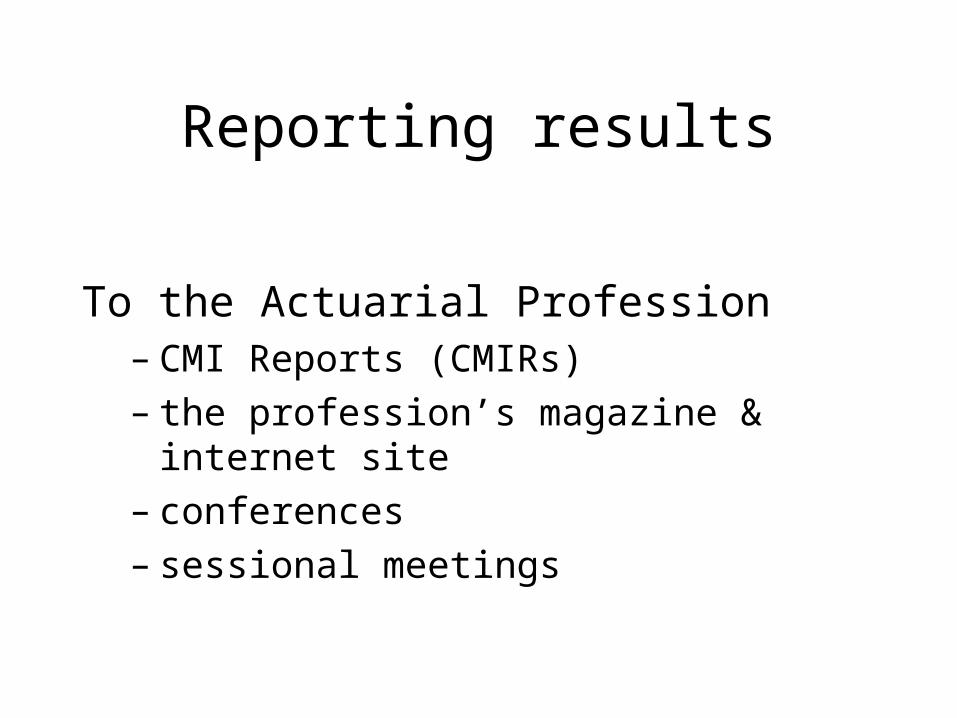
Reporting results
To the Actuarial Profession– CMI Reports (CMIRs)– the profession’s magazine & internet site– conferences– sessional meetings
Data Collection Methodologies
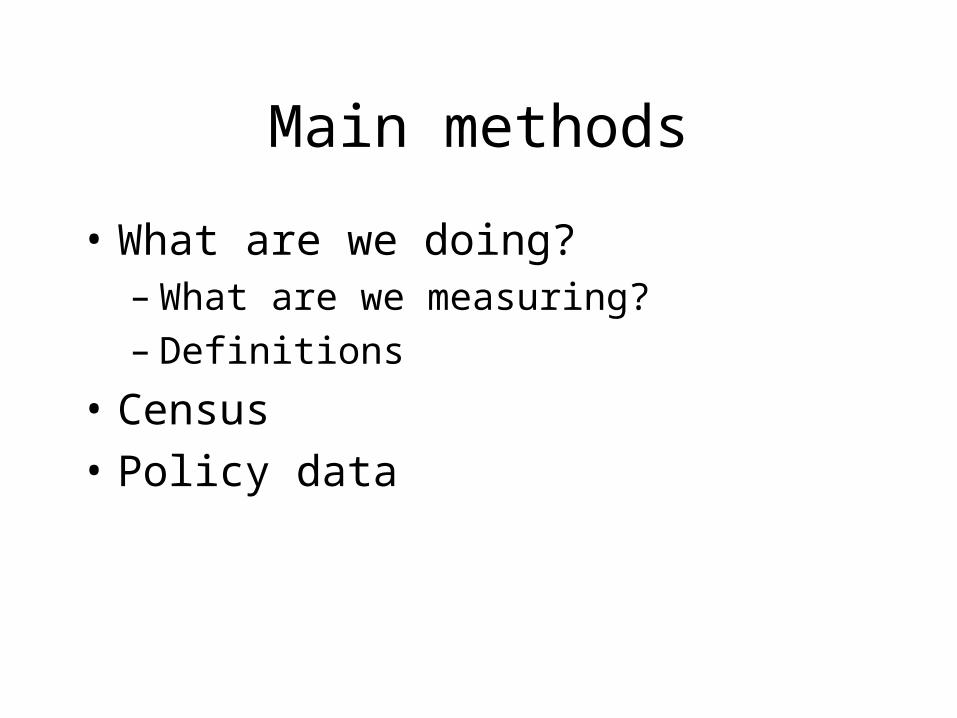
Main methods
• What are we doing?– What are we measuring?– Definitions
• Census
• Policy data
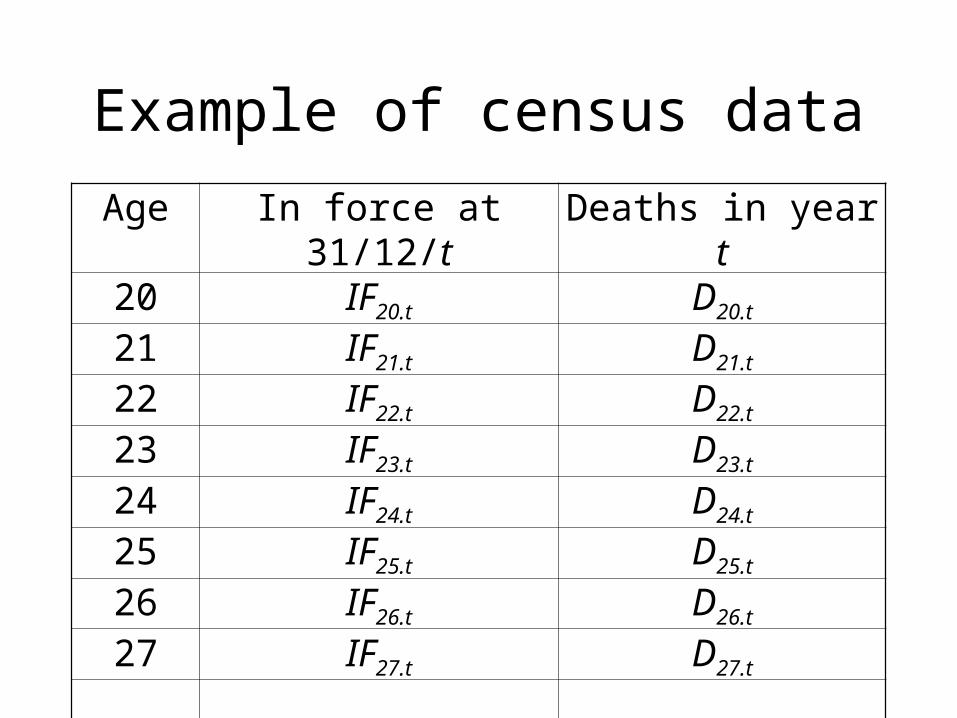
Example of census data
Age In force at 31/12/t Deaths in year t20 IF20.t D20.t
21 IF21.t D21.t
22 IF22.t D22.t
23 IF23.t D23.t
24 IF24.t D24.t
25 IF25.t D25.t
26 IF26.t D26.t
27 IF27.t D27.t
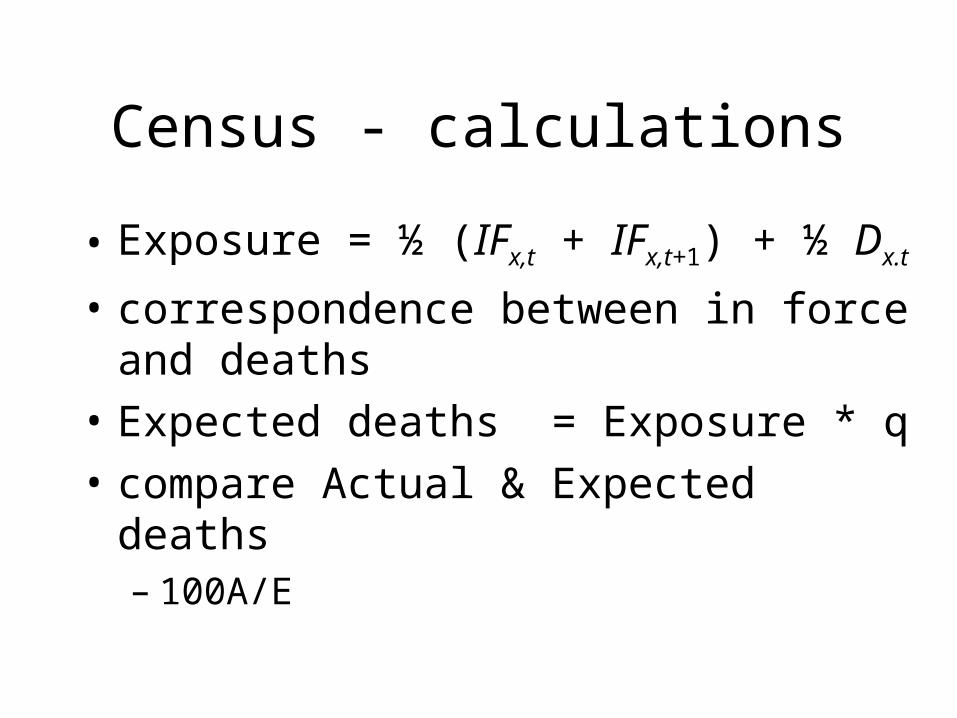
Census - calculations
• Exposure = ½ (IFx,t + IFx,t+1) + ½ Dx.t
• correspondence between in force and deaths
• Expected deaths = Exposure * q
• compare Actual & Expected deaths– 100A/E
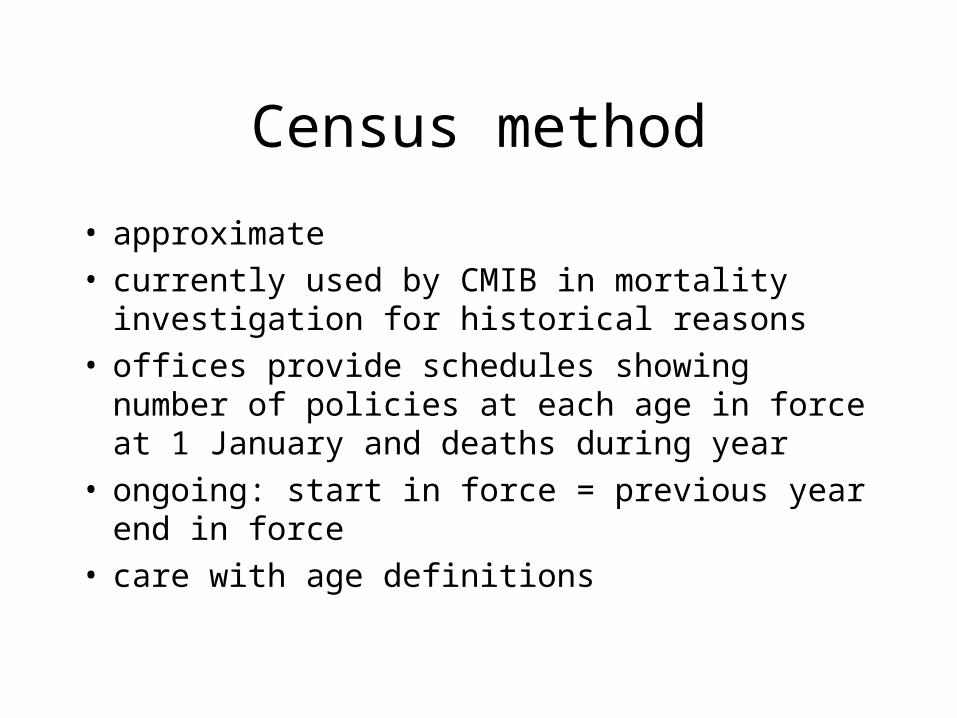
Census method
• approximate• currently used by CMIB in mortality investigation
for historical reasons• offices provide schedules showing number of
policies at each age in force at 1 January and deaths during year
• ongoing: start in force = previous year end in force• care with age definitions
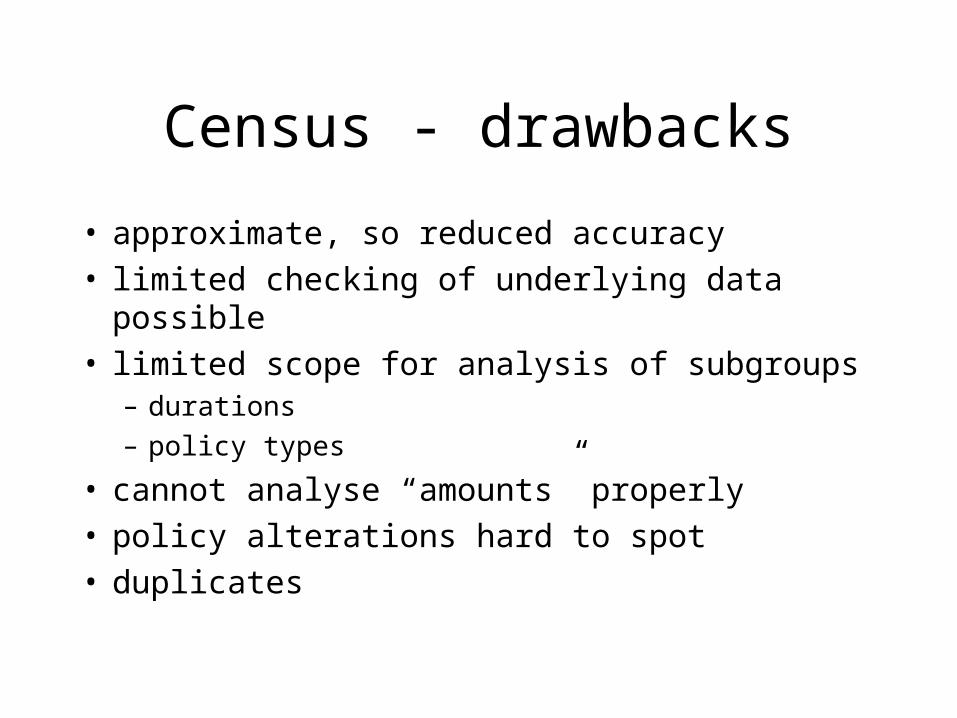
Census - drawbacks
• approximate, so reduced accuracy• limited checking of underlying data possible• limited scope for analysis of subgroups
– durations
– policy types
• cannot analyse “amounts” properly• policy alterations hard to spot• duplicates
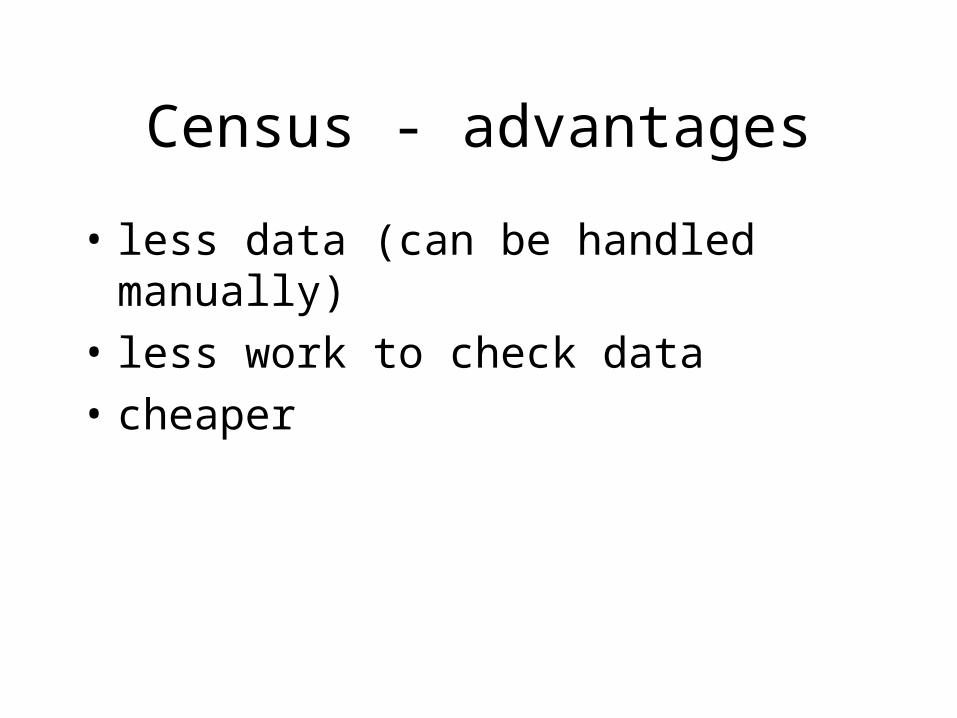
Census - advantages
• less data (can be handled manually)
• less work to check data
• cheaper
Policy data• Data on per policy basis at each 31/12/t
– date of birth (avoids defn. problems)– sex– start date of policy– date of death/claim/exit– type of exit– policy type– amount of benefit– identifier
Policy data method
• IP & CI investigations use this method
• exposure calculated exactly for each policy by counting days
• calculation of expected deaths & 100A/E as with census method
Policy data – features
• advantages over census method– greater accuracy
– more checking possible better data quality
– more control over data included in investigations
– more detailed analyses possible
• should be easier for offices to supply
But• increased storage requirements• more complex to process - hence expensive
Observations (1)
• need for detailed rules
• consistent interpretation across offices
• must check to make sure data is sensible
• will have delays in data collection
• offices “come and go”
• office mergers
Observations (2)
• staff who produce data are not the same as staff who use the results
• sometimes difficult to get offices to pay attention
• speedy turn around helps data quality
• data audits
Common data problems
• policy alterations (e.g. amounts)
• duplicates
• What is a claim? (claim date in IP)
• multiple claims (IP)
• matching data across periods
• consistency - over time - between offices
Sub-population differences
Questions to be investigated
• Do differences justify a standard table?
• if not, how to adjust current table?– pricing– valuation
• trends in sub population
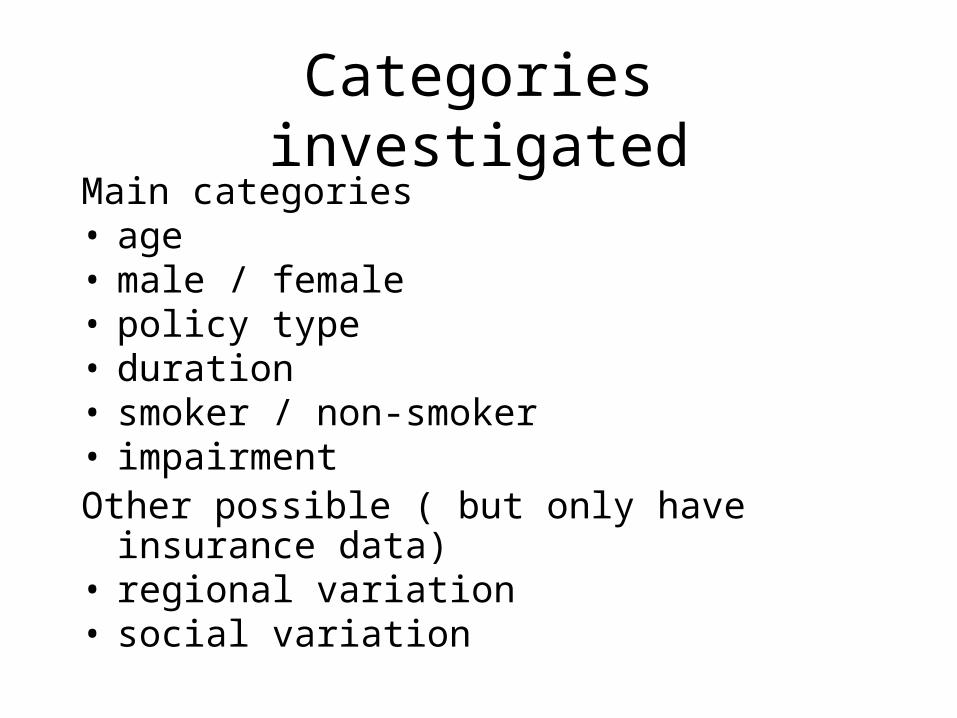
Categories investigatedMain categories• age• male / female• policy type• duration• smoker / non-smoker• impairmentOther possible ( but only have insurance data)• regional variation• social variation
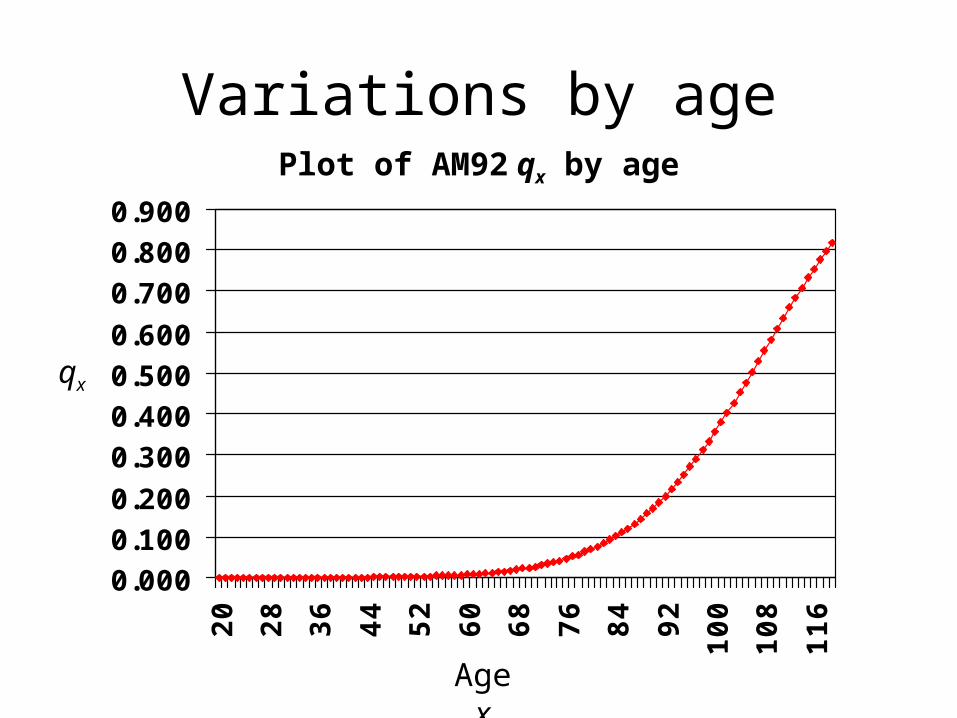
Variations by age
0.0000.1000.200
0.3000.4000.5000.600
0.7000.8000.900
20
28
36
44
52
60
68
76
84
92
100
108
116
Plot of AM92 qx by age
qx
Age x
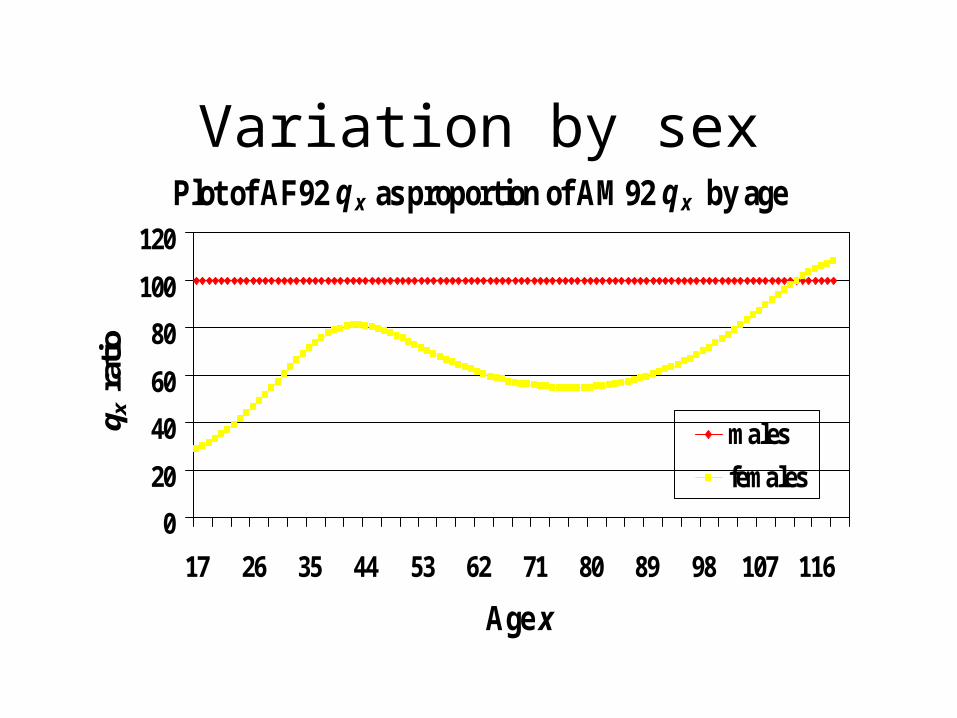
Variation by sexPlot of AF92 q x as proportion of AM92 q x by age
0
20
40
60
80
100
120
17 26 35 44 53 62 71 80 89 98 107 116
Age x
q x r
atio
males
females
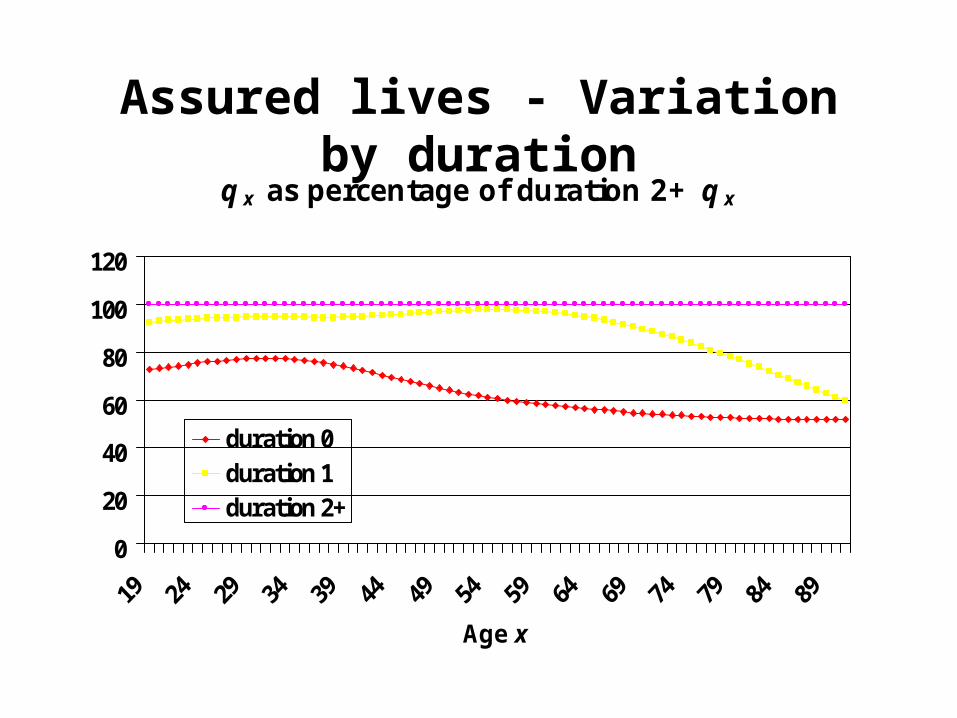
Assured lives - Variation by durationqx as percentage of duration 2+ qx
0
20
40
60
80
100
120
Age x
duration 0duration 1duration 2+
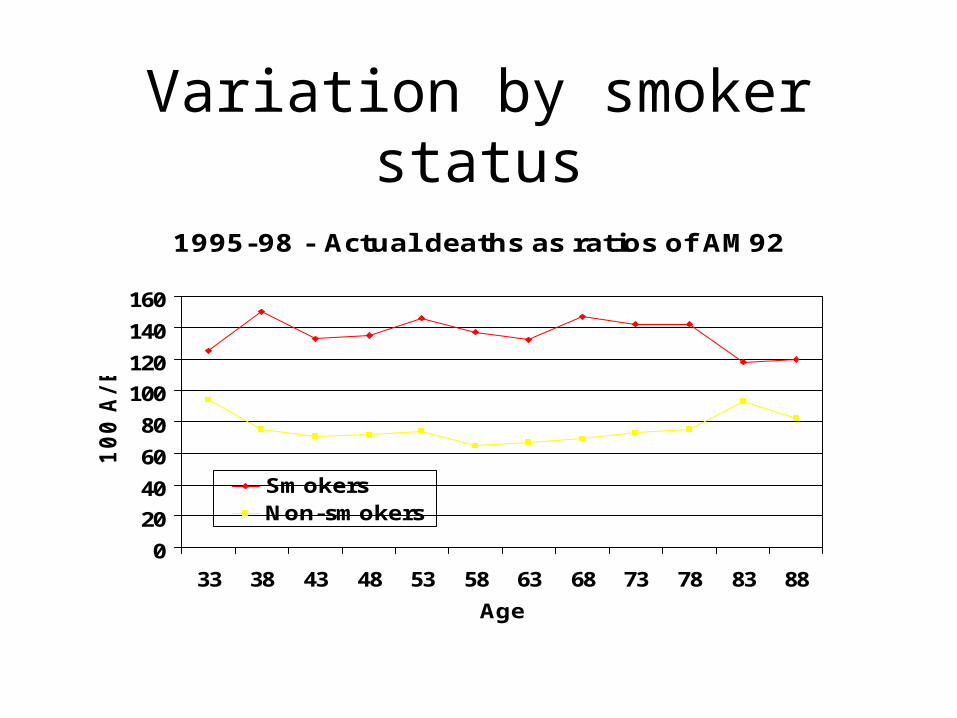
Variation by smoker status
1995-98 - Actual deaths as ratios of AM92
0
20
40
60
80
100
120
140
160
33 38 43 48 53 58 63 68 73 78 83 88
Age
100 A
/E
SmokersNon-smokers
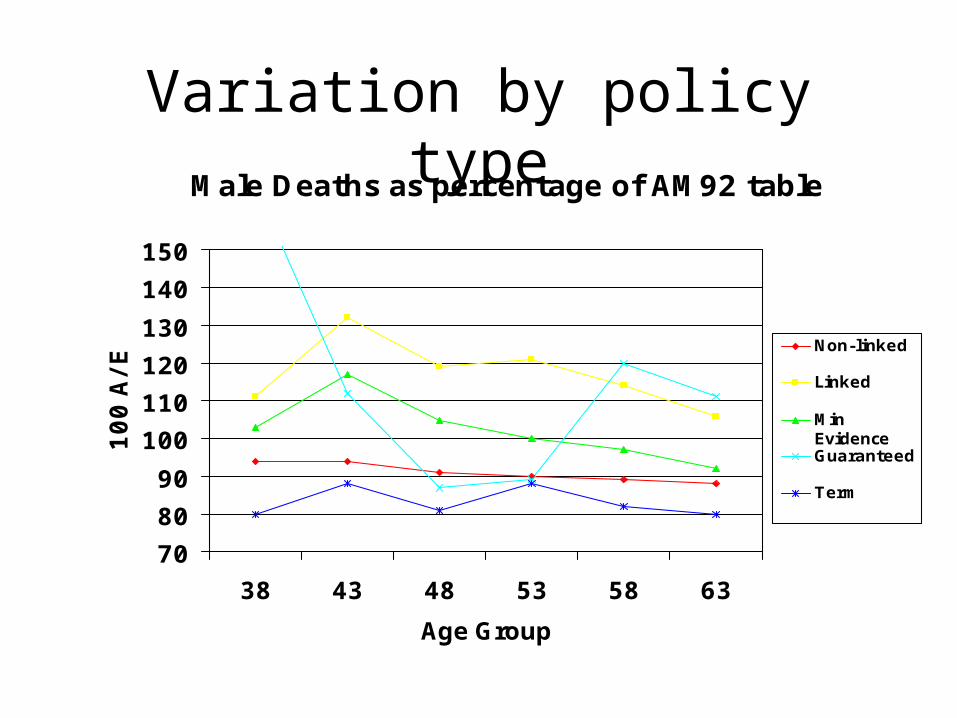
Variation by policy typeMale Deaths as percentage of AM92 table
70
80
90
100
110
120
130
140
150
38 43 48 53 58 63
Age Group
100 A
/E Non-linked
Linked
MinEvidenceGuaranteed
Term
Sub-population comments
• must collect data!
• data collection follows market
• companies that innovate via sub-population differences are exposed
• getting credible data sometimes difficult
• takes time for investigations to get established