the comscore 2010 europe digital year in review comscore 2010 europe digital year in review february...
TRANSCRIPT

The comScore 2010 Europe Digital Year in Review February 2011
2
TThhee 22001100 EEuurrooppee DDiiggiittaall YYeeaarr iinn RReevviieeww
The European Digital Landscape continues to evolve, with 2010 proving to be yet another exciting
year of change. The rise of social networking, availability of video content and growing mobile media
consumption is changing the marketer’s toolkit and creating new and unique opportunities to engage
with the European consumer.
In order to understand this opportunity more clearly we are pleased to launch our analysis of digital
trends for the European market. This report follows our Digital Year in Review for the US market,
http://www.comscore.com/Press_Events/Presentations_Whitepapers/2011/2010_US_Digital_Year_in_Review
and our Mobile Year in Review for US, EU5 (UK, France, Germany, Italy and Spain) and Japan.
http://www.comscore.com/Press_Events/Presentations_Whitepapers/2011/2010_Mobile_Year_in_Review
The many issues that will be addressed in this report include:
How does the European digital consumer compare to the rest of the world?
What European markets have the highest engagement online and how does that compare
across age groups?
Which site content categories are growing in popularity?
What trends are we seeing in the social networking space and what impact does that have on
email and instant messaging activity?
How has the consumption of online TV content changed over time?
What European smartphone operating system is growing the fastest?
Which search providers are starting to make headway against Google in Europe?
The comScore 2010 European Digital Year in Review offers a comprehensive overview of the
digital landscape in Europe. This report will examine the trends in European internet usage, social
networking trends, online video consumption, mobile and search, and includes individual scorecards
highlighting demographic data and top 20 sites for Austria, Belgium, Denmark, Finland, France,
Germany, Ireland, Italy, Netherlands, Norway, Poland, Portugal, Russia, Spain, Sweden, Switzerland,
Turkey and the United Kingdom.
The comScore 2010 Europe Digital Year in Review February 2011
3
TTaabbllee ooff CCoonntteennttss:: 22001100 EEuurrooppee DDiiggiittaall YYeeaarr iinn RReevviieeww
Europe Overview .................................................................................................................................. 4
Includes: Individual Market Penetration and Engagement, Demographic Comparison
Top Web Properties and Category Trends 2010 ............................................................................... 5
Includes: Top Properties and Categories, Trends in Instant Messaging, Email and Portals
Social Networking Trends 2010 .......................................................................................................... 7
Includes: Top Social Network Trends, Facebook Statistics, Demographic Analysis
Online Advertising Trends 2010 ....................................................................................................... 12
Includes: Ad Impressions, Advertising Exposed Reach, Top Publisher Categories
Category Spotlight: Couponing ........................................................................................................ 14
Includes: Region and Market Comparisons, Impact of Groupon
TV and Video Trends 2010 ................................................................................................................. 16
Includes: TV Category Viewing, Time Spent Watching Videos, Average Video Length,
Demographics of the Typical Video Consumer
European Mobile Market 2010 .......................................................................................................... 20
Includes: Smartphone Penetration, Comparison of Smartphone Operating Systems, Market
Enablers
European Search Market 2010 .......................................................................................................... 22
Includes: Market Comparisons, Top and Emerging Search Providers
Looking Ahead to 2011 ...................................................................................................................... 24
European Market Scorecards ........................................................................................................... 26
Includes: Demographics, Engagement, Top 20 sites for Austria, Belgium, Denmark, Finland,
France, Germany, Ireland, Italy, Netherlands, Norway, Poland, Portugal, Russia, Spain, Sweden,
Switzerland, Turkey and United Kingdom.
About comScore and Our Methodology ........................................................................................... 35

The comScore 2010 Europe Digital Year in Review February 2011
4
EEuurrooppee OOvveerrvviieeww
The Netherlands and UK Lead in Engagement
Europeans spend the equivalent of one day a month online (24:20 hours) with the Netherlands (31:39
hours) and United Kingdom (30:38 hours) far exceeding this trend. Consumers in Italy (16:02 hours)
and Austria (13:11 hours), however, spend nearly half as much time online as users in Holland and
the UK. Austria’s low engagement is not surprising as it has the lowest penetration of Social
Networking sites among all countries in Europe.
European Demographics Skew Older than Emerging Markets
Relative to the emerging markets of Asia Pacific and Latin America, Europe’s typical digital user is
markedly older, with more than half above the age of 35. Of the more than 360 million online
consumers in Europe, females represent a slightly larger percentage (48 percent) as compared to the
worldwide average (46 percent). A comparison of individual market demographics can be found later
in this report in the European Market Scorecard section.
28%
32%
24%
23%
32%
25%
25%
23%
23%
30%
26%
25%
28%
27%
19%
22%
18%
25%
28%
19%
World-Wide
Asia Pacific
Europe
North America
Latin America
Distribution of Internet Users, Age 15+Source: comScore Media Metrix, December2010
M 15-34 F 15-34 M 35+ F 35+
UV (MM)
1,323.5
111.4
534.0
361.7
204.0
0:00
4:48
9:36
14:24
19:12
24:00
28:48
33:36
0
10,000
20,000
30,000
40,000
50,000
60,000
Ave
rage H
ou
rs pe
r Visito
r (hh
:mm
)U
niq
ue
Vis
ito
rs (
00
0)
Unique Visitors (000) and Average Time Online in EuropeSource: comScore Media Metrix, Dec-2010
Total Unique Visitors (000) Average Hours per Visitor
The comScore 2010 Europe Digital Year in Review February 2011
5
Europeans Spend More Time on Facebook than Any Other Site
Facebook, with more than 230 million visitors, is the 3rd
most popular site in all of Europe and ranks
higher than any other media property at keeping consumers’ attention. The other sites within the top
10 for time spent online are local favourites from Russia (Mail.ru Group, Vkontakte and Yandex Sites),
Spain (Terra – Telefonica, the parent of Tuenti.com) and Poland (Nasza-Klasa.pl).
Fastest Growing Content Categories – Social Activities on the Rise
With many social networking sites in the top ranking for Europe, it’s no surprise that sharing
constitutes the most popular behaviour on the web. Consumers are enjoying passing along photos,
experiences and updates in order to stay connected. Instant messaging however has fallen out of
favour with a decline of 8.3 percentage points versus a year ago. Auction sites are also proving less
popular, with eBay for example losing 3.6 percentage points in 2010.
11.7%
10.4%
10.0%
Percentage of Time Spent on Top 100 Properties in EuropeSource: comScore Media Metrix, Dec-2010
Facebook.com
Google Sites
Microsoft Sites
Mail.ru Group
Vkontakte
Yahoo! Sites
eBay
Terra - Telefonica
Yandex Sites
Nasza-Klasa.pl
All Other
Reach of Top Categories in Europe Source: Panel only data, comScore Media Metrix, Dec-2010 vs. .Dec-2009
91%
84%
75%
74%
73%
67%
67%
67%
65%
64%
62%
55%
55%
52%
49%
45%
41%
40%
37%
36%
Search/Navigation
Social Networking
Directories/Resources
Multimedia
Retail
News/Information
Photos
Technology
Community
Downloads
Blogs
Games
Business/Finance
Entertainment - Music
TV
Instant Messengers
Travel
Auctions
Entertainment - Movies
8.6
10.8
7.6
6.5
7.2
6.1
17.2
3.7
4.2
7.7
5.7
3.4
2.5
3.9
2.5
4.8
-8.3
3.8
-3.6
3.6
Point Change from 2009
The comScore 2010 Europe Digital Year in Review February 2011
6
Instant Messaging Experiences Rapid Declines
Instant Messengers were once one of the most popular pastimes online but times have changed with
consumers spending 39 percent less time using IM. In their place, Social Networking sites have
eclipsed most other activities and are a magnet for consumers to while away their day with 34 percent
more time spent social networking versus last year. Contrary to the US market, web-based email has
remained a small but stable activity throughout 2010.
Email Still Popular Among the Older Generation
A further analysis of the trends for web email, Instant Messengers, Portals and Social Networking
sites show that there are slight differences between age groups. The younger generation aged 15-34
are increasingly shifting their online activity to social networking (+32 percent) whereas the older
population, above the age of 35, are experimenting with social networking but also embracing the
comfort of traditional email (+6 percent).
0%
5%
10%
15%
20%
25%
Percent (%) Share of Time Spent Online in Europe Source: Panel only data, comScore Media Metrix, Dec-2009 to Dec-2010
Social Networking Portals
Instant Messengers e-mail
-11%
6%
-38%-42%
-28%
-18%
32%38%
-50%
-40%
-30%
-20%
-10%
0%
10%
20%
30%
40%
50%
Year-over-Year Change in Time Spent Online in Europe Source: comScore Media Metrix, Dec-2010 vs .Dec-2009
Email Instant Messengers Portals Social Networking
Ages 15-34 Ages 35+
The comScore 2010 Europe Digital Year in Review February 2011
7
SSoocciiaall NNeettwwoorrkkiinngg GGrroowwtthh iinn EEuurrooppee
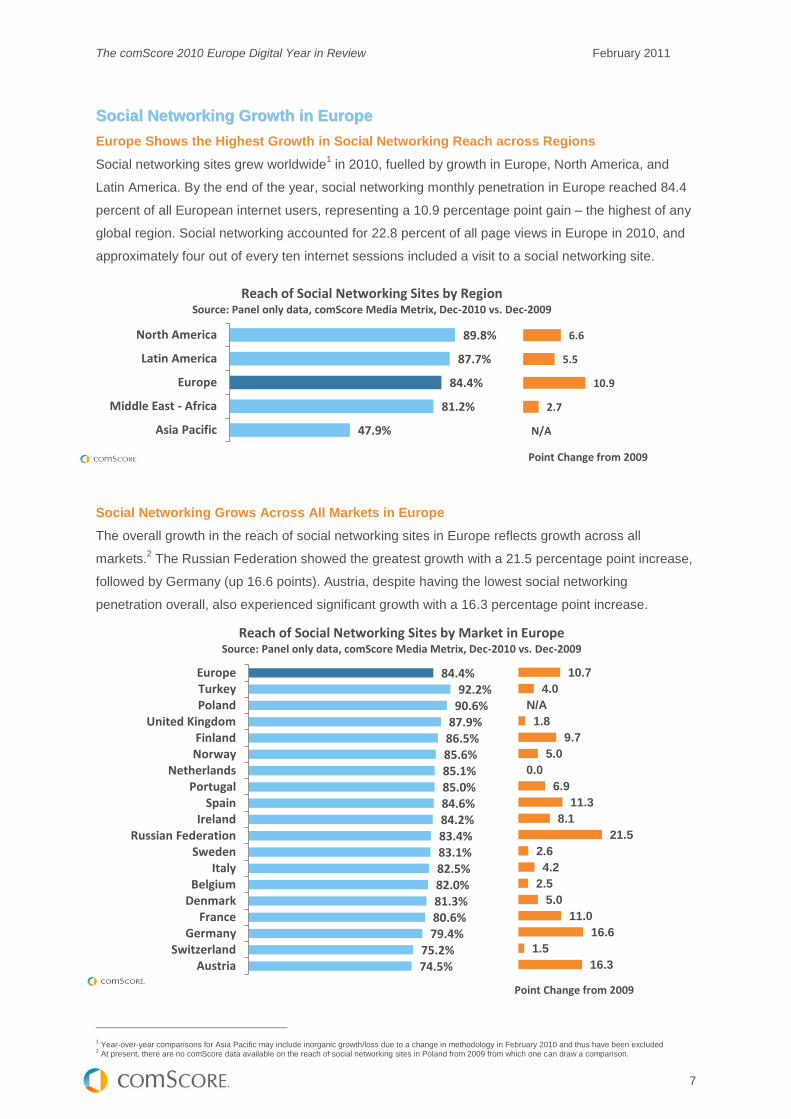
Europe Shows the Highest Growth in Social Networking Reach across Regions
Social networking sites grew worldwide1 in 2010, fuelled by growth in Europe, North America, and
Latin America. By the end of the year, social networking monthly penetration in Europe reached 84.4
percent of all European internet users, representing a 10.9 percentage point gain – the highest of any
global region. Social networking accounted for 22.8 percent of all page views in Europe in 2010, and
approximately four out of every ten internet sessions included a visit to a social networking site.
Social Networking Grows Across All Markets in Europe
The overall growth in the reach of social networking sites in Europe reflects growth across all
markets.2 The Russian Federation showed the greatest growth with a 21.5 percentage point increase,
followed by Germany (up 16.6 points). Austria, despite having the lowest social networking
penetration overall, also experienced significant growth with a 16.3 percentage point increase.
1 Year-over-year comparisons for Asia Pacific may include inorganic growth/loss due to a change in methodology in February 2010 and thus have been excluded
2 At present, there are no comScore data available on the reach of social networking sites in Poland from 2009 from which one can draw a comparison.
Reach of Social Networking Sites by Market in Europe
Source: Panel only data, comScore Media Metrix, Dec-2010 vs. Dec-2009
47.9%
81.2%
84.4%
87.7%
89.8%
Asia Pacific
Middle East - Africa
Europe
Latin America
North America
Reach of Social Networking Sites by RegionSource: Panel only data, comScore Media Metrix, Dec-2010 vs. Dec-2009
N/A
2.7
10.9
5.5
6.6
Point Change from 2009
84.4%92.2%
90.6%87.9%
86.5%85.6%85.1%85.0%84.6%84.2%83.4%83.1%82.5%82.0%81.3%80.6%79.4%
75.2%74.5%
EuropeTurkeyPoland
United KingdomFinlandNorway
NetherlandsPortugal
SpainIreland
Russian FederationSweden
ItalyBelgium
DenmarkFrance
GermanySwitzerland
Austria
10.7
4.0
N/A
1.8
9.7
5.0
0.0
6.9
11.3
8.1
21.5
2.6
4.2
2.5
5.0
11.0
16.6
1.5
16.3
Point Change from 2009
The comScore 2010 Europe Digital Year in Review February 2011
8
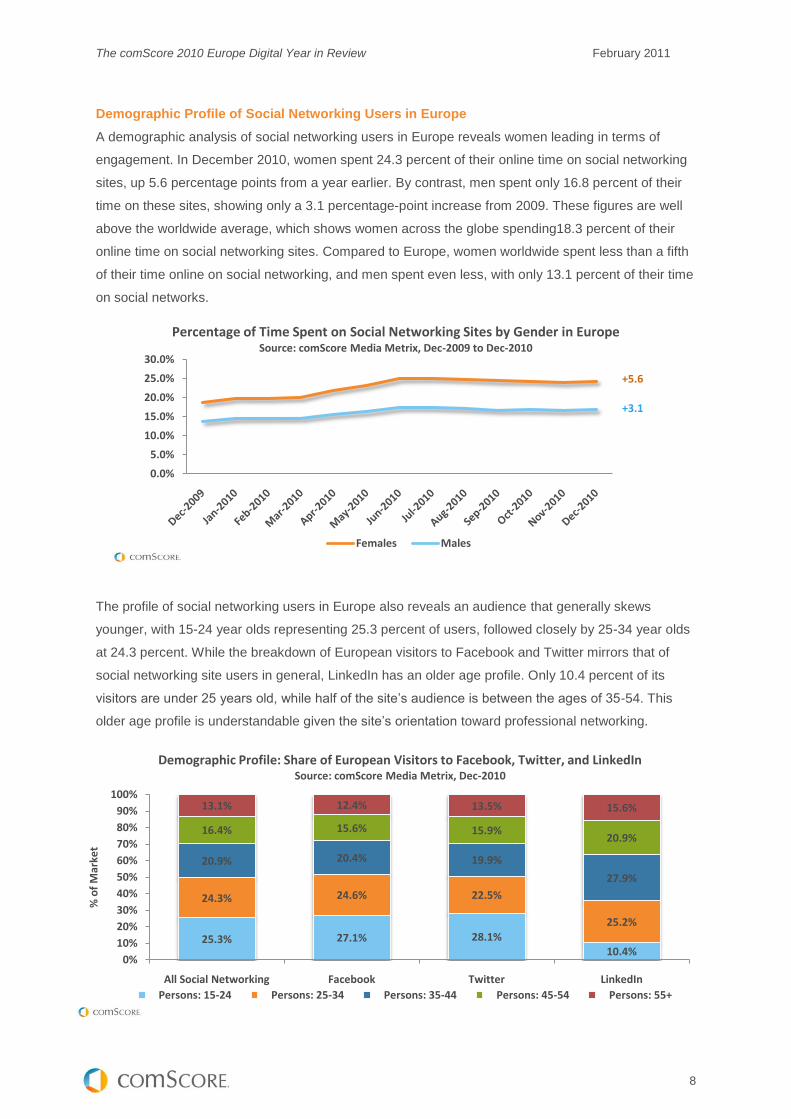
Demographic Profile of Social Networking Users in Europe
A demographic analysis of social networking users in Europe reveals women leading in terms of
engagement. In December 2010, women spent 24.3 percent of their online time on social networking
sites, up 5.6 percentage points from a year earlier. By contrast, men spent only 16.8 percent of their
time on these sites, showing only a 3.1 percentage-point increase from 2009. These figures are well
above the worldwide average, which shows women across the globe spending18.3 percent of their
online time on social networking sites. Compared to Europe, women worldwide spent less than a fifth
of their time online on social networking, and men spent even less, with only 13.1 percent of their time
on social networks.
The profile of social networking users in Europe also reveals an audience that generally skews
younger, with 15-24 year olds representing 25.3 percent of users, followed closely by 25-34 year olds
at 24.3 percent. While the breakdown of European visitors to Facebook and Twitter mirrors that of
social networking site users in general, LinkedIn has an older age profile. Only 10.4 percent of its
visitors are under 25 years old, while half of the site’s audience is between the ages of 35-54. This
older age profile is understandable given the site’s orientation toward professional networking.
0.0%
5.0%
10.0%
15.0%
20.0%
25.0%
30.0%
Percentage of Time Spent on Social Networking Sites by Gender in EuropeSource: comScore Media Metrix, Dec-2009 to Dec-2010
Females Males
+5.6
+3.1
25.3% 27.1% 28.1%10.4%
24.3% 24.6% 22.5%
25.2%
20.9% 20.4% 19.9%
27.9%
16.4% 15.6% 15.9%20.9%
13.1% 12.4% 13.5% 15.6%
0%
10%
20%
30%
40%
50%
60%
70%
80%
90%
100%
All Social Networking Facebook Twitter LinkedIn
% o
f M
arke
t
Demographic Profile: Share of European Visitors to Facebook, Twitter, and LinkedIn Source: comScore Media Metrix, Dec-2010
Persons: 15-24 Persons: 25-34 Persons: 35-44 Persons: 45-54 Persons: 55+
The comScore 2010 Europe Digital Year in Review February 2011
9
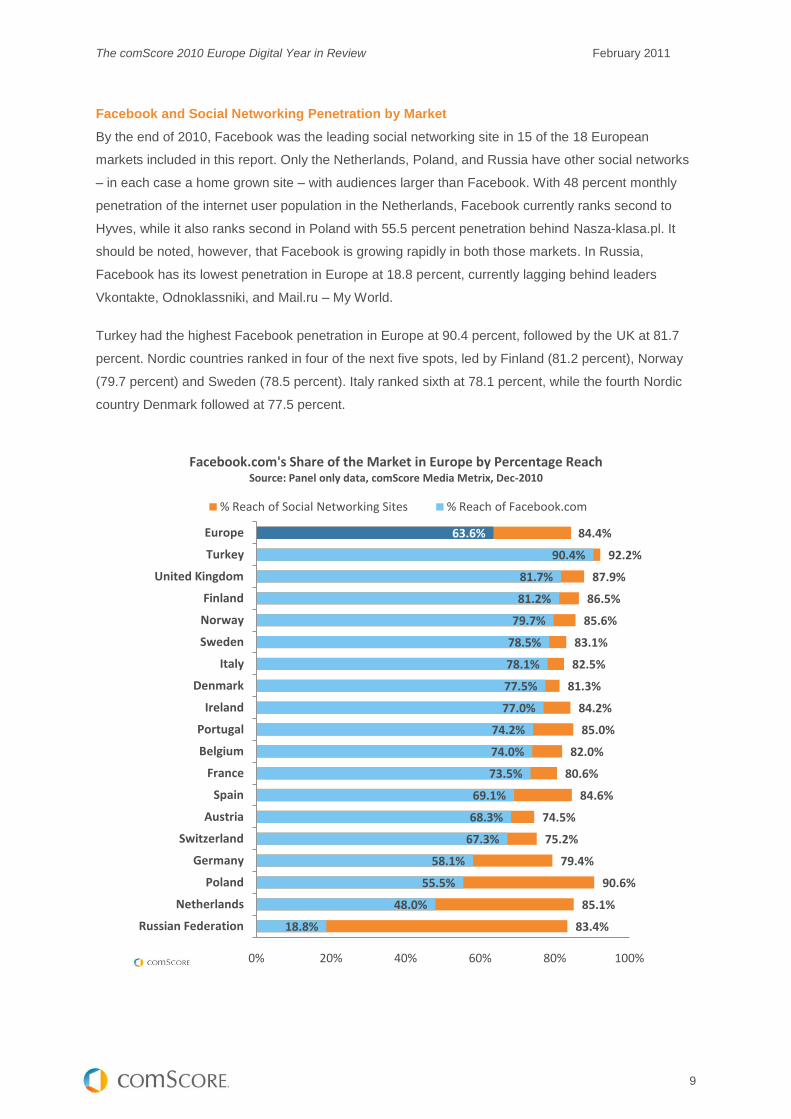
Facebook and Social Networking Penetration by Market
By the end of 2010, Facebook was the leading social networking site in 15 of the 18 European
markets included in this report. Only the Netherlands, Poland, and Russia have other social networks
– in each case a home grown site – with audiences larger than Facebook. With 48 percent monthly
penetration of the internet user population in the Netherlands, Facebook currently ranks second to
Hyves, while it also ranks second in Poland with 55.5 percent penetration behind Nasza-klasa.pl. It
should be noted, however, that Facebook is growing rapidly in both those markets. In Russia,
Facebook has its lowest penetration in Europe at 18.8 percent, currently lagging behind leaders
Vkontakte, Odnoklassniki, and Mail.ru – My World.
Turkey had the highest Facebook penetration in Europe at 90.4 percent, followed by the UK at 81.7
percent. Nordic countries ranked in four of the next five spots, led by Finland (81.2 percent), Norway
(79.7 percent) and Sweden (78.5 percent). Italy ranked sixth at 78.1 percent, while the fourth Nordic
country Denmark followed at 77.5 percent.
84.4%
92.2%
87.9%
86.5%
85.6%
83.1%
82.5%
81.3%
84.2%
85.0%
82.0%
80.6%
84.6%
74.5%
75.2%
79.4%
90.6%
85.1%
83.4%
63.6%
90.4%
81.7%
81.2%
79.7%
78.5%
78.1%
77.5%
77.0%
74.2%
74.0%
73.5%
69.1%
68.3%
67.3%
58.1%
55.5%
48.0%
18.8%
0% 20% 40% 60% 80% 100%
Europe
Turkey
United Kingdom
Finland
Norway
Sweden
Italy
Denmark
Ireland
Portugal
Belgium
France
Spain
Austria
Switzerland
Germany
Poland
Netherlands
Russian Federation
Facebook.com's Share of the Market in Europe by Percentage ReachSource: Panel only data, comScore Media Metrix, Dec-2010
% Reach of Social Networking Sites % Reach of Facebook.com

The comScore 2010 Europe Digital Year in Review February 2011
10
Markets Showing Greatest Facebook Growth
Although Facebook is not currently the leading social network in the Netherlands, it experienced
significant growth in 2010 in that country and in several other European markets. In addition to the
Netherlands, Facebook achieved its most significant gains in Portugal (up 48.2 percentage points),
Germany (up 35.7 points), Austria (up 27.2 points) and Spain (up 18.5 points). In April 2010,
Facebook eclipsed the leading social networks in Portugal (Hi5) and Germany (StudiVZ/VZ-
Netzwerke) to assume the #1 position among social networking sites in both those markets. The
previous year, Facebook grabbed the #1 position in Spain (from Tuenti.com) and in Austria (from
Netlog.com).
0%
10%
20%
30%
40%
50%
60%
70%
80%
% o
fM
arke
t
Top Five European Markets for Facebook Growth by Increase in Percentage Reach
Source: comScore Media Metrix, Dec-2009 to Dec-2010
Portugal Spain Austria Germany Netherlands
+48.2+18.5+27.2+35.7+23.6
Point Change from 2009
0%
10%
20%
30%
40%
50%
60%
70%
80%
Dec-2009
Mar-2010
Jun-2010
Sep-2010
Dec-2010
% o
f M
arke
t
Facebook.com Hi5.com
Facebook's Growth in PortugalSource: comScore Media Metrix, Dec-2009 to Dec-2010
+48.2
Facebook overtakes Hi5 in Portugal
0%
10%
20%
30%
40%
50%
60%
70%
Dec-2009
Mar-2010
Jun-2010
Sep-2010
Dec-2010
% o
f M
arke
t
Facebook.com StudiVZ Sites
Facebook's Growth in GermanySource: comScore Media Metrix, Dec-2009 to Dec-2010
+35.7
Facebook overtakes StudiVZ in Germany
The comScore 2010 Europe Digital Year in Review February 2011
11
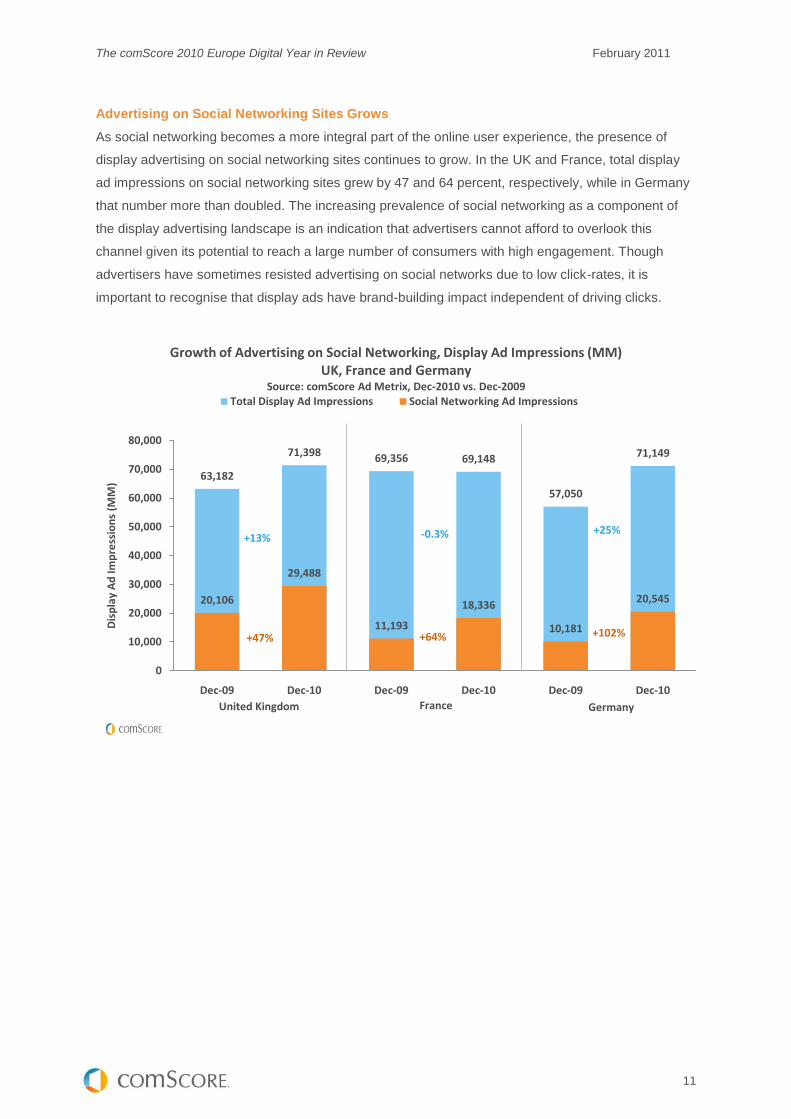
Advertising on Social Networking Sites Grows
As social networking becomes a more integral part of the online user experience, the presence of
display advertising on social networking sites continues to grow. In the UK and France, total display
ad impressions on social networking sites grew by 47 and 64 percent, respectively, while in Germany
that number more than doubled. The increasing prevalence of social networking as a component of
the display advertising landscape is an indication that advertisers cannot afford to overlook this
channel given its potential to reach a large number of consumers with high engagement. Though
advertisers have sometimes resisted advertising on social networks due to low click-rates, it is
important to recognise that display ads have brand-building impact independent of driving clicks.
63,182
71,398 69,356 69,148
57,050
71,149
20,106
29,488
11,193
18,336
10,181
20,545
0
10,000
20,000
30,000
40,000
50,000
60,000
70,000
80,000
Dec-09 Dec-10 Dec-09 Dec-10 Dec-09 Dec-10
Dis
pla
y A
d Im
pre
ssio
ns
(MM
)
Growth of Advertising on Social Networking, Display Ad Impressions (MM) UK, France and Germany
Source: comScore Ad Metrix, Dec-2010 vs. Dec-2009Total Display Ad Impressions Social Networking Ad Impressions
United Kingdom France Germany
+47% +64% +102%
+13% -0.3% +25%
The comScore 2010 Europe Digital Year in Review February 2011
12
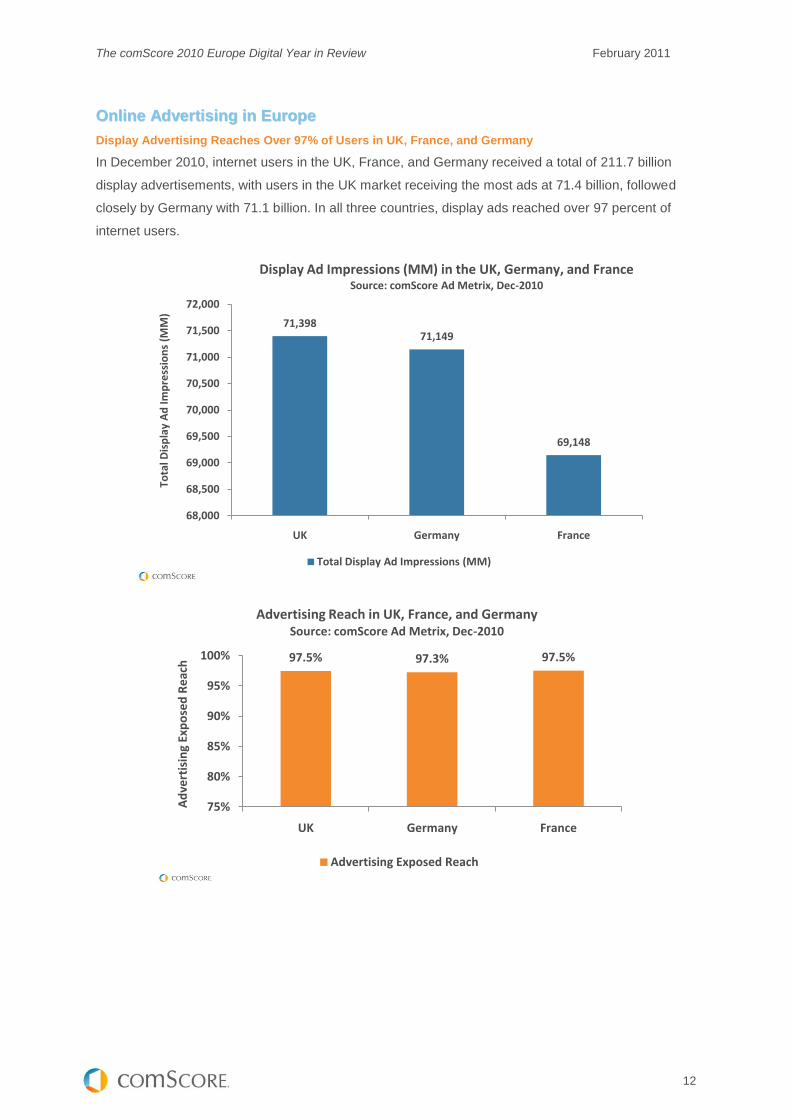
OOnnlliinnee AAddvveerrttiissiinngg iinn EEuurrooppee
Display Advertising Reaches Over 97% of Users in UK, France, and Germany
In December 2010, internet users in the UK, France, and Germany received a total of 211.7 billion
display advertisements, with users in the UK market receiving the most ads at 71.4 billion, followed
closely by Germany with 71.1 billion. In all three countries, display ads reached over 97 percent of
internet users.
71,39871,149
69,148
68,000
68,500
69,000
69,500
70,000
70,500
71,000
71,500
72,000
UK Germany France
Tota
l Dis
pla
y A
d Im
pre
ssio
ns
(MM
)
Display Ad Impressions (MM) in the UK, Germany, and FranceSource: comScore Ad Metrix, Dec-2010
Total Display Ad Impressions (MM)
97.5% 97.3% 97.5%
75%
80%
85%
90%
95%
100%
UK Germany France
Ad
vert
isin
g Ex
po
sed
Re
ach
Advertising Reach in UK, France, and GermanySource: comScore Ad Metrix, Dec-2010
Advertising Exposed Reach
The comScore 2010 Europe Digital Year in Review February 2011
13
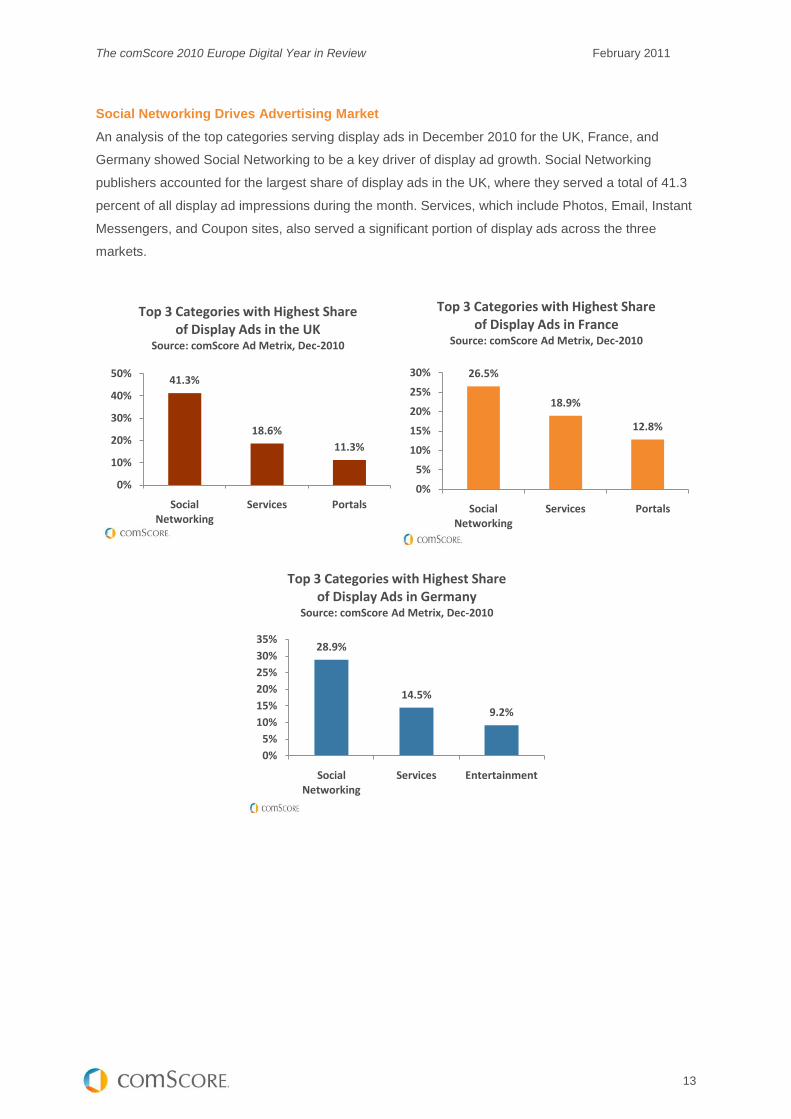
Social Networking Drives Advertising Market
An analysis of the top categories serving display ads in December 2010 for the UK, France, and
Germany showed Social Networking to be a key driver of display ad growth. Social Networking
publishers accounted for the largest share of display ads in the UK, where they served a total of 41.3
percent of all display ad impressions during the month. Services, which include Photos, Email, Instant
Messengers, and Coupon sites, also served a significant portion of display ads across the three
markets.
41.3%
18.6%
11.3%
0%
10%
20%
30%
40%
50%
Social Networking
Services Portals
Top 3 Categories with Highest Share of Display Ads in the UK
Source: comScore Ad Metrix, Dec-2010
26.5%
18.9%
12.8%
0%
5%
10%
15%
20%
25%
30%
Social Networking
Services Portals
Top 3 Categories with Highest Share of Display Ads in France
Source: comScore Ad Metrix, Dec-2010
28.9%
14.5%
9.2%
0%
5%
10%
15%
20%
25%
30%
35%
Social Networking
Services Entertainment
Top 3 Categories with Highest Share of Display Ads in Germany
Source: comScore Ad Metrix, Dec-2010
The comScore 2010 Europe Digital Year in Review February 2011
14
TThhee RRiissee ooff CCoouuppoonn SSiitteess iinn EEuurrooppee
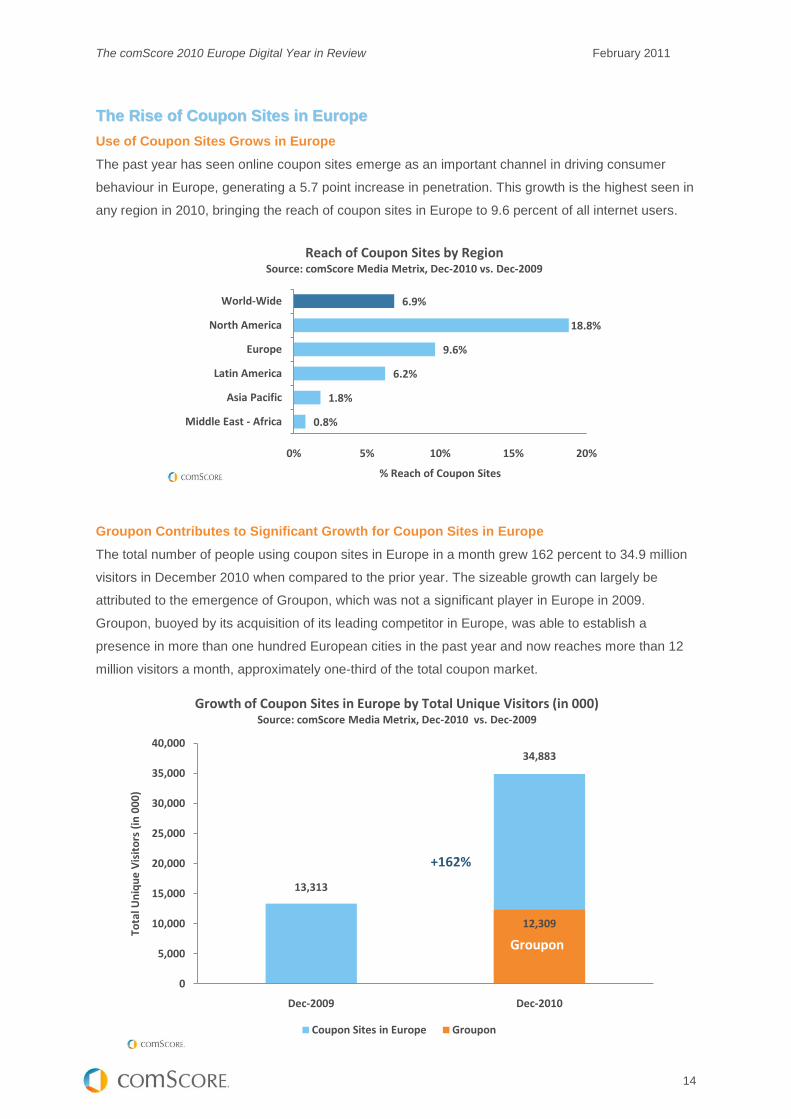
Use of Coupon Sites Grows in Europe
The past year has seen online coupon sites emerge as an important channel in driving consumer
behaviour in Europe, generating a 5.7 point increase in penetration. This growth is the highest seen in
any region in 2010, bringing the reach of coupon sites in Europe to 9.6 percent of all internet users.
Groupon Contributes to Significant Growth for Coupon Sites in Europe
The total number of people using coupon sites in Europe in a month grew 162 percent to 34.9 million
visitors in December 2010 when compared to the prior year. The sizeable growth can largely be
attributed to the emergence of Groupon, which was not a significant player in Europe in 2009.
Groupon, buoyed by its acquisition of its leading competitor in Europe, was able to establish a
presence in more than one hundred European cities in the past year and now reaches more than 12
million visitors a month, approximately one-third of the total coupon market.
13,313
34,883
12,309
0
5,000
10,000
15,000
20,000
25,000
30,000
35,000
40,000
Dec-2009 Dec-2010
Tota
l Un
iqu
e V
isit
ors
(in
00
0)
Growth of Coupon Sites in Europe by Total Unique Visitors (in 000)Source: comScore Media Metrix, Dec-2010 vs. Dec-2009
Coupon Sites in Europe Groupon
Groupon
+162%
0.8%
1.8%
6.2%
9.6%
18.8%
6.9%
0% 5% 10% 15% 20%
Middle East - Africa
Asia Pacific
Latin America
Europe
North America
World-Wide
% Reach of Coupon Sites
Reach of Coupon Sites by RegionSource: comScore Media Metrix, Dec-2010 vs. Dec-2009
The comScore 2010 Europe Digital Year in Review February 2011
15
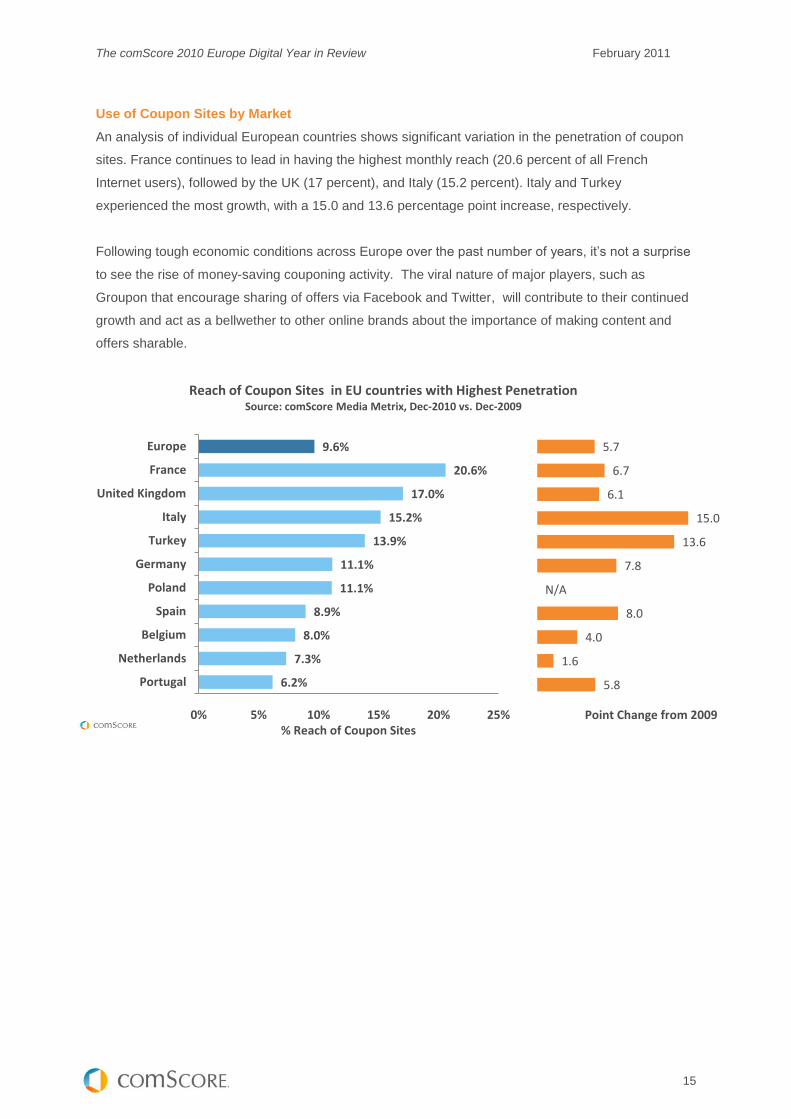
Use of Coupon Sites by Market
An analysis of individual European countries shows significant variation in the penetration of coupon
sites. France continues to lead in having the highest monthly reach (20.6 percent of all French
Internet users), followed by the UK (17 percent), and Italy (15.2 percent). Italy and Turkey
experienced the most growth, with a 15.0 and 13.6 percentage point increase, respectively.
Following tough economic conditions across Europe over the past number of years, it’s not a surprise
to see the rise of money-saving couponing activity. The viral nature of major players, such as
Groupon that encourage sharing of offers via Facebook and Twitter, will contribute to their continued
growth and act as a bellwether to other online brands about the importance of making content and
offers sharable.
6.2%
7.3%
8.0%
8.9%
11.1%
11.1%
13.9%
15.2%
17.0%
20.6%
9.6%
0% 5% 10% 15% 20% 25%
Portugal
Netherlands
Belgium
Spain
Poland
Germany
Turkey
Italy
United Kingdom
France
Europe
% Reach of Coupon Sites
Reach of Coupon Sites in EU countries with Highest PenetrationSource: comScore Media Metrix, Dec-2010 vs. Dec-2009
5.8
1.6
4.0
8.0
N/A
7.8
13.6
15.0
6.1
6.7
5.7
Point Change from 2009
The comScore 2010 Europe Digital Year in Review February 2011
16
VViiddeeoo GGrroowwtthh iinn EEuurrooppee
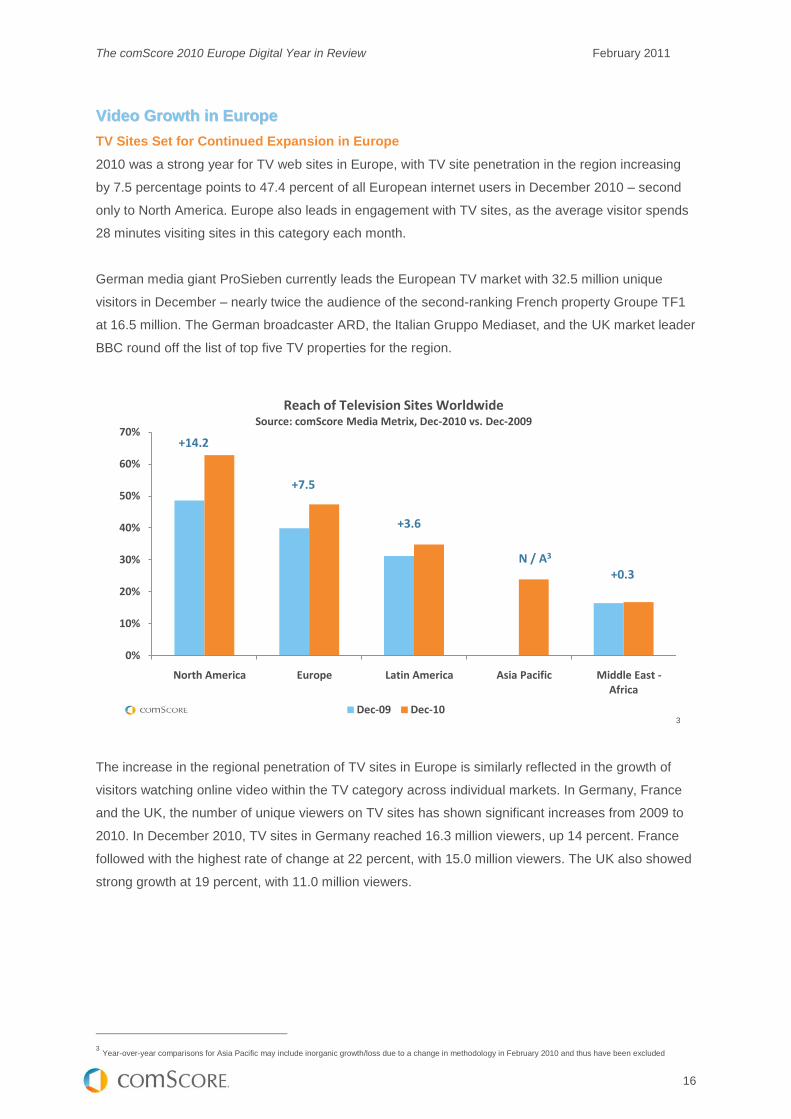
TV Sites Set for Continued Expansion in Europe
2010 was a strong year for TV web sites in Europe, with TV site penetration in the region increasing
by 7.5 percentage points to 47.4 percent of all European internet users in December 2010 – second
only to North America. Europe also leads in engagement with TV sites, as the average visitor spends
28 minutes visiting sites in this category each month.
German media giant ProSieben currently leads the European TV market with 32.5 million unique
visitors in December – nearly twice the audience of the second-ranking French property Groupe TF1
at 16.5 million. The German broadcaster ARD, the Italian Gruppo Mediaset, and the UK market leader
BBC round off the list of top five TV properties for the region.
3
The increase in the regional penetration of TV sites in Europe is similarly reflected in the growth of
visitors watching online video within the TV category across individual markets. In Germany, France
and the UK, the number of unique viewers on TV sites has shown significant increases from 2009 to
2010. In December 2010, TV sites in Germany reached 16.3 million viewers, up 14 percent. France
followed with the highest rate of change at 22 percent, with 15.0 million viewers. The UK also showed
strong growth at 19 percent, with 11.0 million viewers.
3 Year-over-year comparisons for Asia Pacific may include inorganic growth/loss due to a change in methodology in February 2010 and thus have been excluded
0%
10%
20%
30%
40%
50%
60%
70%
North America Europe Latin America Asia Pacific Middle East -Africa
Reach of Television Sites WorldwideSource: comScore Media Metrix, Dec-2010 vs. Dec-2009
Dec-09 Dec-10
+14.2
+7.5
+3.6
N / A3
+0.3

The comScore 2010 Europe Digital Year in Review February 2011
17
This growth in TV site video viewership proved to be more significant than growth in online video
viewership for the overall internet market, which held steady in Europe over the past year.
Viewers in Germany, the UK, and Spain Spend the Most Time Watching Online Videos
While all countries in the EU5 (France, Germany, Italy, Spain, UK) show similar rates of penetration
for the video market on the web, averaging 83.7 percent, the levels of engagement of users in these
markets differ. In December 2010, viewers from Germany, the UK, and Spain spent more time
watching online videos than those in the US, averaging 18.0, 17.0, and 16.2 hours respectively.
Viewers in France watched 12.2 hours of video and viewers in Italy watched the least with only 10.4
hours. On average, the time EU5 video viewers spent watching online videos in December 2010 (14.8
hours) was just an hour short of how many hours the average viewer in the US spent watching videos
in a month (15.8 hours).
0
2,000
4,000
6,000
8,000
10,000
12,000
14,000
16,000
18,000
Germany France UK
Tota
l Un
iqu
e V
iew
ers
(0
00
)Growth in Unique Video Viewers for TV Sites in Germany,
France, and the UKSource: comScore Video Metrix, Dec-2010 vs. Dec-2009
Dec-2009 Dec-2010
+14%+22%
+19%
0
2
4
6
8
10
12
14
16
18
20
Germany UK Spain US France Italy
Ho
urs
Pe
r V
iew
er
Time Spent Watching Online Videos in EU5 and US During the Month
Source: comScore Video Metrix, Dec-2010
Hours Per Viewer
The comScore 2010 Europe Digital Year in Review February 2011
18
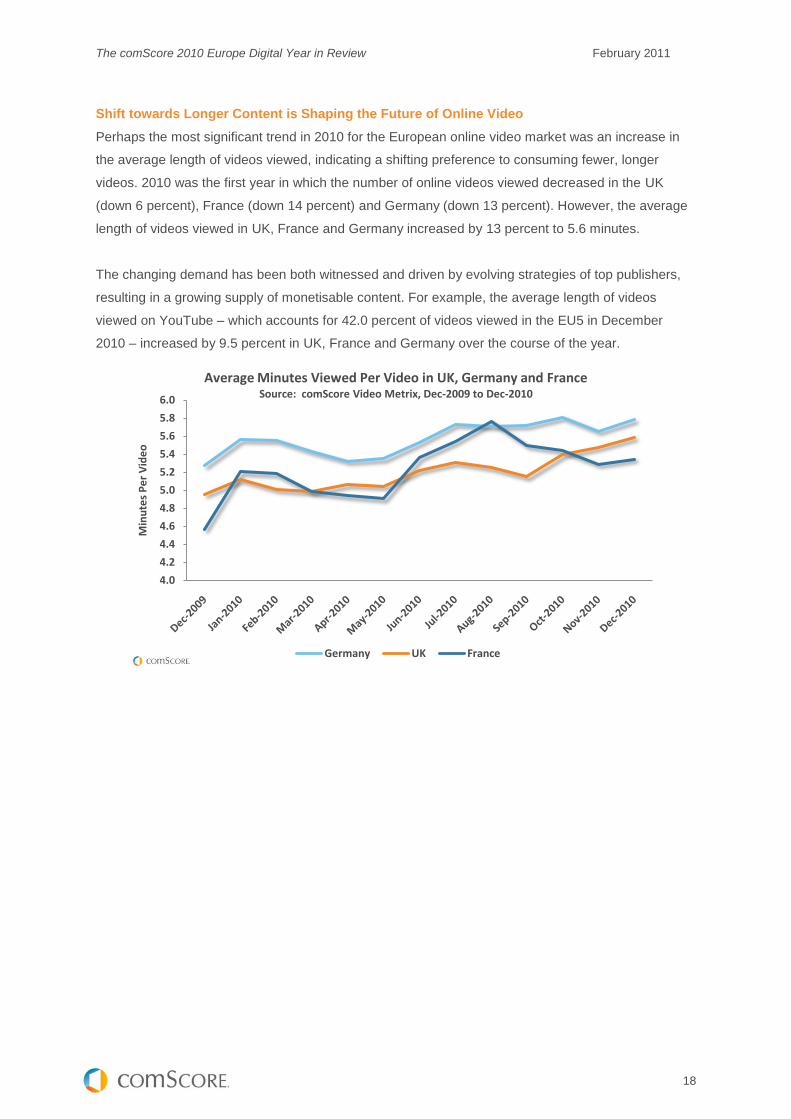
Shift towards Longer Content is Shaping the Future of Online Video
Perhaps the most significant trend in 2010 for the European online video market was an increase in
the average length of videos viewed, indicating a shifting preference to consuming fewer, longer
videos. 2010 was the first year in which the number of online videos viewed decreased in the UK
(down 6 percent), France (down 14 percent) and Germany (down 13 percent). However, the average
length of videos viewed in UK, France and Germany increased by 13 percent to 5.6 minutes.
The changing demand has been both witnessed and driven by evolving strategies of top publishers,
resulting in a growing supply of monetisable content. For example, the average length of videos
viewed on YouTube – which accounts for 42.0 percent of videos viewed in the EU5 in December
2010 – increased by 9.5 percent in UK, France and Germany over the course of the year.
4.0
4.2
4.4
4.6
4.8
5.0
5.2
5.4
5.6
5.8
6.0
Min
ute
s P
er
Vid
eo
Average Minutes Viewed Per Video in UK, Germany and FranceSource: comScore Video Metrix, Dec-2009 to Dec-2010
Germany UK France
The comScore 2010 Europe Digital Year in Review February 2011
19
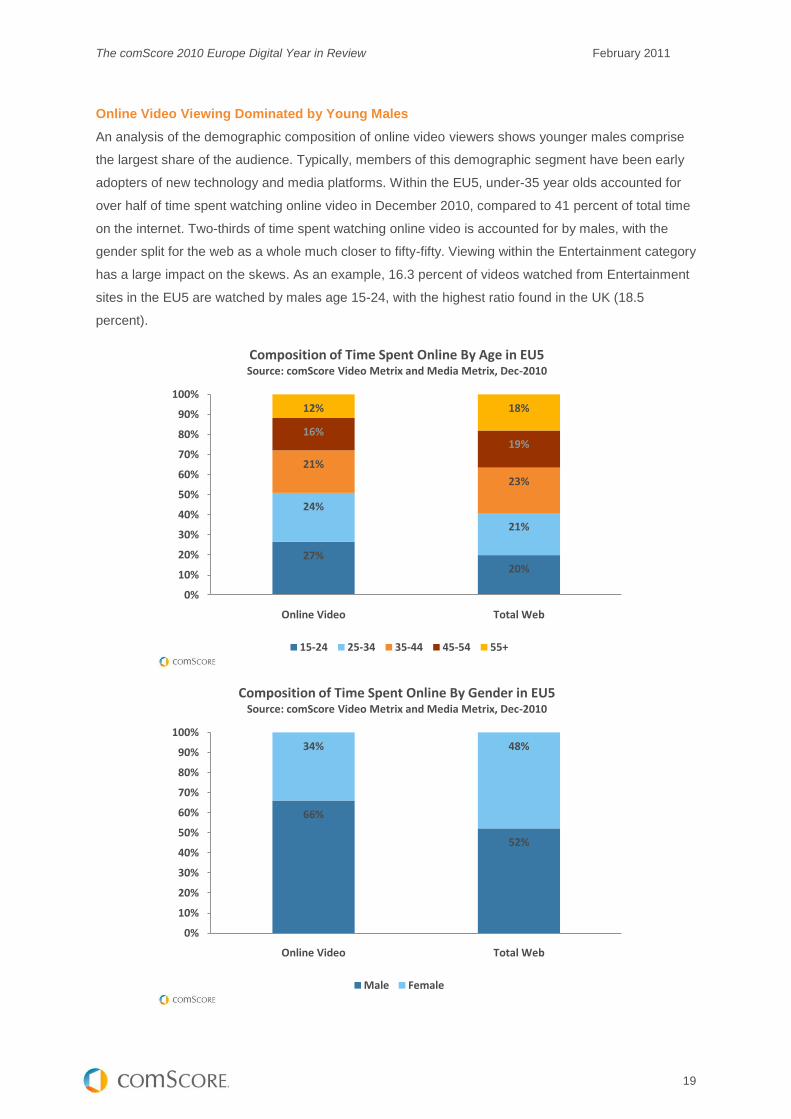
Online Video Viewing Dominated by Young Males
An analysis of the demographic composition of online video viewers shows younger males comprise
the largest share of the audience. Typically, members of this demographic segment have been early
adopters of new technology and media platforms. Within the EU5, under-35 year olds accounted for
over half of time spent watching online video in December 2010, compared to 41 percent of total time
on the internet. Two-thirds of time spent watching online video is accounted for by males, with the
gender split for the web as a whole much closer to fifty-fifty. Viewing within the Entertainment category
has a large impact on the skews. As an example, 16.3 percent of videos watched from Entertainment
sites in the EU5 are watched by males age 15-24, with the highest ratio found in the UK (18.5
percent).
27%20%
24%
21%
21%
23%
16%19%
12% 18%
0%
10%
20%
30%
40%
50%
60%
70%
80%
90%
100%
Online Video Total Web
Composition of Time Spent Online By Age in EU5Source: comScore Video Metrix and Media Metrix, Dec-2010
15-24 25-34 35-44 45-54 55+
66%
52%
34% 48%
0%
10%
20%
30%
40%
50%
60%
70%
80%
90%
100%
Online Video Total Web
Composition of Time Spent Online By Gender in EU5Source: comScore Video Metrix and Media Metrix, Dec-2010
Male Female
The comScore 2010 Europe Digital Year in Review February 2011
20
EEuurrooppeeaann MMoobbiillee UUssaaggee 22001100
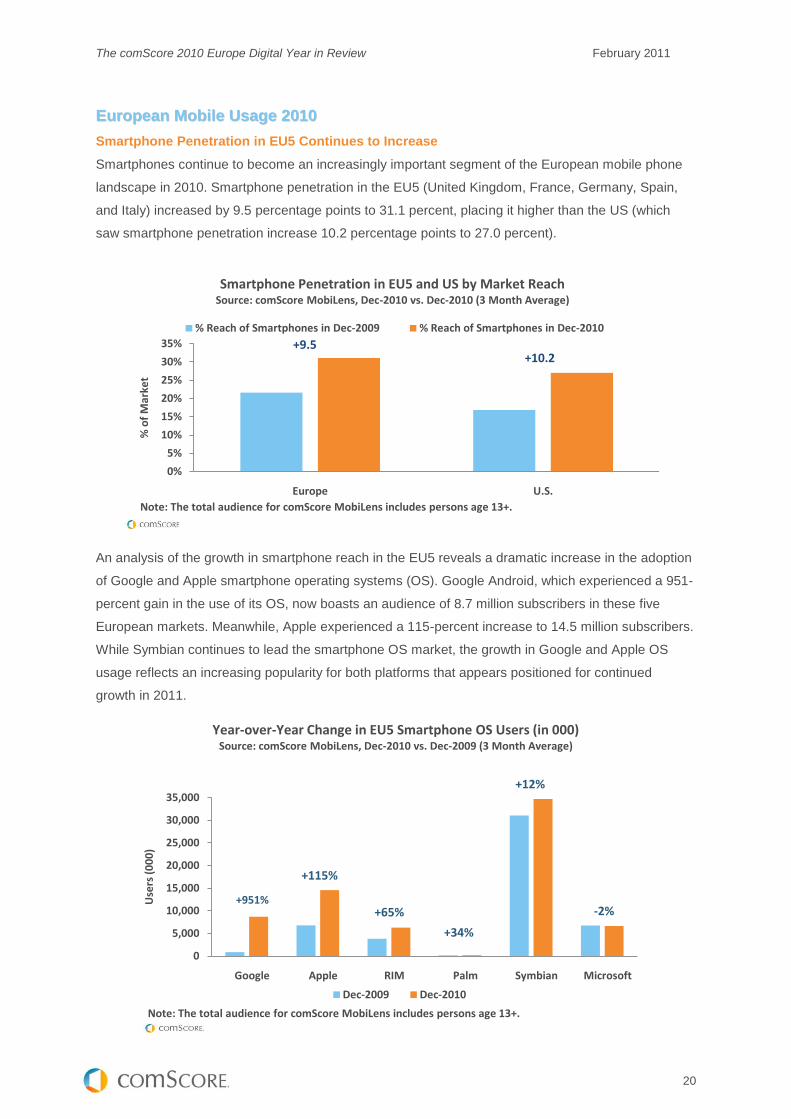
Smartphone Penetration in EU5 Continues to Increase
Smartphones continue to become an increasingly important segment of the European mobile phone
landscape in 2010. Smartphone penetration in the EU5 (United Kingdom, France, Germany, Spain,
and Italy) increased by 9.5 percentage points to 31.1 percent, placing it higher than the US (which
saw smartphone penetration increase 10.2 percentage points to 27.0 percent).
An analysis of the growth in smartphone reach in the EU5 reveals a dramatic increase in the adoption
of Google and Apple smartphone operating systems (OS). Google Android, which experienced a 951-
percent gain in the use of its OS, now boasts an audience of 8.7 million subscribers in these five
European markets. Meanwhile, Apple experienced a 115-percent increase to 14.5 million subscribers.
While Symbian continues to lead the smartphone OS market, the growth in Google and Apple OS
usage reflects an increasing popularity for both platforms that appears positioned for continued
growth in 2011.
0
5,000
10,000
15,000
20,000
25,000
30,000
35,000
Google Apple RIM Palm Symbian Microsoft
Use
rs (
00
0)
Year-over-Year Change in EU5 Smartphone OS Users (in 000)Source: comScore MobiLens, Dec-2010 vs. Dec-2009 (3 Month Average)
Dec-2009 Dec-2010
+951%
+115%
+65%
+34%
+12%
-2%
Note: The total audience for comScore MobiLens includes persons age 13+.
0%
5%
10%
15%
20%
25%
30%
35%
Europe U.S.
% o
f M
arke
t
Smartphone Penetration in EU5 and US by Market ReachSource: comScore MobiLens, Dec-2010 vs. Dec-2010 (3 Month Average)
% Reach of Smartphones in Dec-2009 % Reach of Smartphones in Dec-2010
+10.2+9.5
Note: The total audience for comScore MobiLens includes persons age 13+.
The comScore 2010 Europe Digital Year in Review February 2011
21
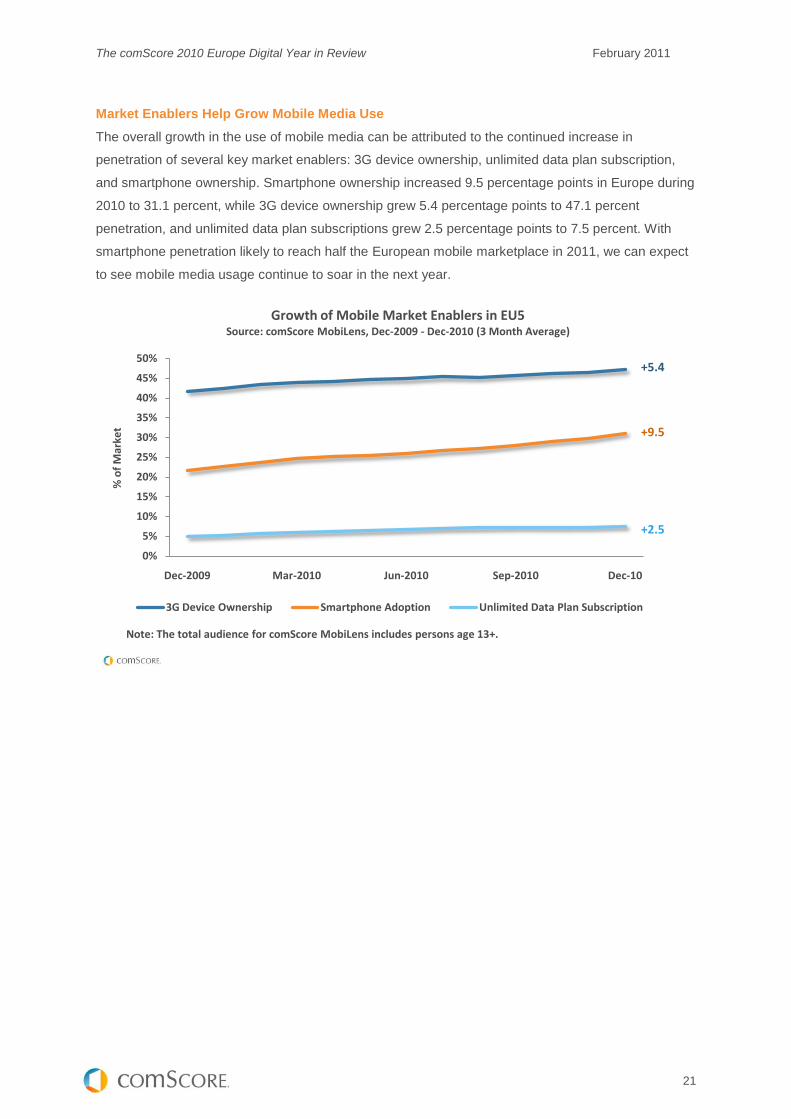
Market Enablers Help Grow Mobile Media Use
The overall growth in the use of mobile media can be attributed to the continued increase in
penetration of several key market enablers: 3G device ownership, unlimited data plan subscription,
and smartphone ownership. Smartphone ownership increased 9.5 percentage points in Europe during
2010 to 31.1 percent, while 3G device ownership grew 5.4 percentage points to 47.1 percent
penetration, and unlimited data plan subscriptions grew 2.5 percentage points to 7.5 percent. With
smartphone penetration likely to reach half the European mobile marketplace in 2011, we can expect
to see mobile media usage continue to soar in the next year.
0%
5%
10%
15%
20%
25%
30%
35%
40%
45%
50%
Dec-2009 Mar-2010 Jun-2010 Sep-2010 Dec-10
3G Device Ownership Smartphone Adoption Unlimited Data Plan Subscription
% o
f M
arke
t
Growth of Mobile Market Enablers in EU5Source: comScore MobiLens, Dec-2009 - Dec-2010 (3 Month Average)
+5.4
+9.5
+2.5
Note: The total audience for comScore MobiLens includes persons age 13+.

The comScore 2010 Europe Digital Year in Review February 2011
22
EEuurrooppeeaann SSeeaarrcchh MMaarrkkeett 22001100
European Search Intensity Varies by Market
An analysis of individual search markets in Europe reveals differing levels of search intensity in these markets.
Searchers in Poland, who make up a modest share of unique searchers in Europe, exhibit the heaviest search
intensity, with the highest number of searches per searcher across all markets. In contrast, Germany and Russia,
which have significant shares of European searchers, show lower search intensity than in most markets, indexing
below the European regional average.
0
20
40
60
80
100
120
140
160
180
200
0%
2%
4%
6%
8%
10%
12%
14%
16%
Sear
che
s P
er
Sear
che
r
Shar
e o
f U
niq
ue
Se
arch
ers
in E
uro
pe
Search Intensity in European MarketsSource: comScore qSearch, Dec-2010
Share of Europe's Unique Searchers Searches Per Searcher
The comScore 2010 Europe Digital Year in Review February 2011
23
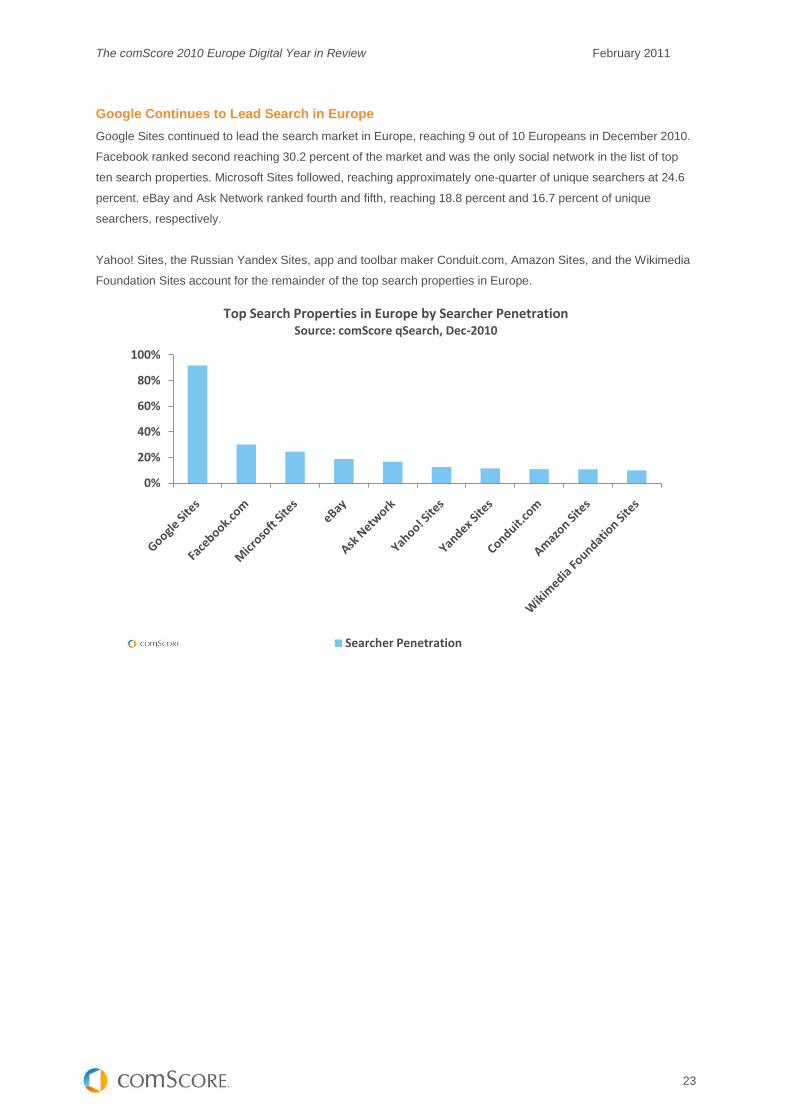
Google Continues to Lead Search in Europe
Google Sites continued to lead the search market in Europe, reaching 9 out of 10 Europeans in December 2010.
Facebook ranked second reaching 30.2 percent of the market and was the only social network in the list of top
ten search properties. Microsoft Sites followed, reaching approximately one-quarter of unique searchers at 24.6
percent. eBay and Ask Network ranked fourth and fifth, reaching 18.8 percent and 16.7 percent of unique
searchers, respectively.
Yahoo! Sites, the Russian Yandex Sites, app and toolbar maker Conduit.com, Amazon Sites, and the Wikimedia
Foundation Sites account for the remainder of the top search properties in Europe.
0%
20%
40%
60%
80%
100%
Top Search Properties in Europe by Searcher PenetrationSource: comScore qSearch, Dec-2010
Searcher Penetration
The comScore 2010 Europe Digital Year in Review February 2011
24
LLooookkiinngg AAhheeaadd ttoo 22001111
Europe is Ripe for Continued Growth and Innovation
IAB Europe reports that internet advertising is approaching a 20-percent share of total advertising
spend, almost doubling its share over the last two years. While the immediately previous years saw a
contraction in marketing budgets, the digital marketplace in Europe continues to grow. With growth
comes innovation -- from advanced planning tools to sophisticated targeting techniques. Creativity is
also beginning to take centre stage as marketers realise the previously unseen brand building
benefits that digital can deliver. Most importantly, as consumers continue to expand their media
consumption across a variety of devices and platforms, a rethinking of measurement approaches and
marketing strategies becomes necessary.
With that in mind, the following is a summary of the key digital media trends we’re seeing in Europe
that will have an impact on the year to come:
Social Networking: Social media grew immensely in 2010 and saturated at least three
quarters of individual European markets. 2011 will likely see a continued growth in the use of
such sites, as social networking continues to be an integral part of online life. Marketing on
these platforms will likely grow as well, as social networking becomes more heavily integrated
with publisher and advertiser sites. Notably, despite earlier concerns about low click-through
rates on social media advertising, advertising rates in social networks in European markets
increased in 2010, reflecting increased confidence in the value of such platforms in reaching
highly-targeted audiences. New trends such as location-based social networking will also
likely contribute to the evolution of marketing on social media.
Advertising: The display advertising market continued to grow in 2010, with the Social
Networking category accounting for a rapidly increasing share of impressions. The online ad
market continues to evolve, with more advanced ad units, improved targeting capabilities, and
higher quality creative.
Video: In 2010, a noticeable trend in video viewership in Europe was an increase in the
average length of time spent watching individual videos. With more viewers watching longer-
form content comes a more meaningful opportunity for video advertising online. It is
significant to note that although overall video viewership in Europe grew by only a few
percentage points in 2010, viewership on TV sites experienced much higher growth. As
viewers increasingly look to online video for longer, quality content traditionally found on
television, it is very likely that online video advertising will continue to experience exceptional
growth.
Mobile: As evidenced in comScore’s Mobile Year in Review report, we believe 2011 will be a
transformative year for Mobile. We predict more than half of all mobile consumers will have
access to mobile media, largely driven by growing adoption of smartphones. Identifying the
synergies that exist between all consumer touch points – traditional PC internet, mobile media
(via app and browser), tablets, etc. – and understanding how consumers use these devices to
fulfill different needs and convenience levels will be of critical importance to marketers.
The comScore 2010 Europe Digital Year in Review February 2011
25
Search: Search marketing continues to be an important component of an effective business-
building strategy. Local players are growing in popularity, particularly in Russia, which creates
more options for both consumers and marketers.
2011 will undoubtedly be an exciting year for the European digital marketplace, and a strong
understanding of both the similarities and differences across countries will be critical to the success of
the modern marketer.
The comScore 2010 Europe Digital Year in Review February 2011
26
EEuurrooppeeaann MMaarrkkeett SSccoorreeccaarrddss,, DDeecceemmbbeerr 22001100
Austria
Belgium
The comScore 2010 Europe Digital Year in Review February 2011
27
EEuurrooppeeaann MMaarrkkeett SSccoorreeccaarrddss,, DDeecceemmbbeerr 22001100
Denmark
Finland
The comScore 2010 Europe Digital Year in Review February 2011
28
EEuurrooppeeaann MMaarrkkeett SSccoorreeccaarrddss,, DDeecceemmbbeerr 22001100
France
Germany
The comScore 2010 Europe Digital Year in Review February 2011
29
EEuurrooppeeaann MMaarrkkeett SSccoorreeccaarrddss,, DDeecceemmbbeerr 22001100
Ireland
Italy
The comScore 2010 Europe Digital Year in Review February 2011
30
EEuurrooppeeaann MMaarrkkeett SSccoorreeccaarrddss,, DDeecceemmbbeerr 22001100
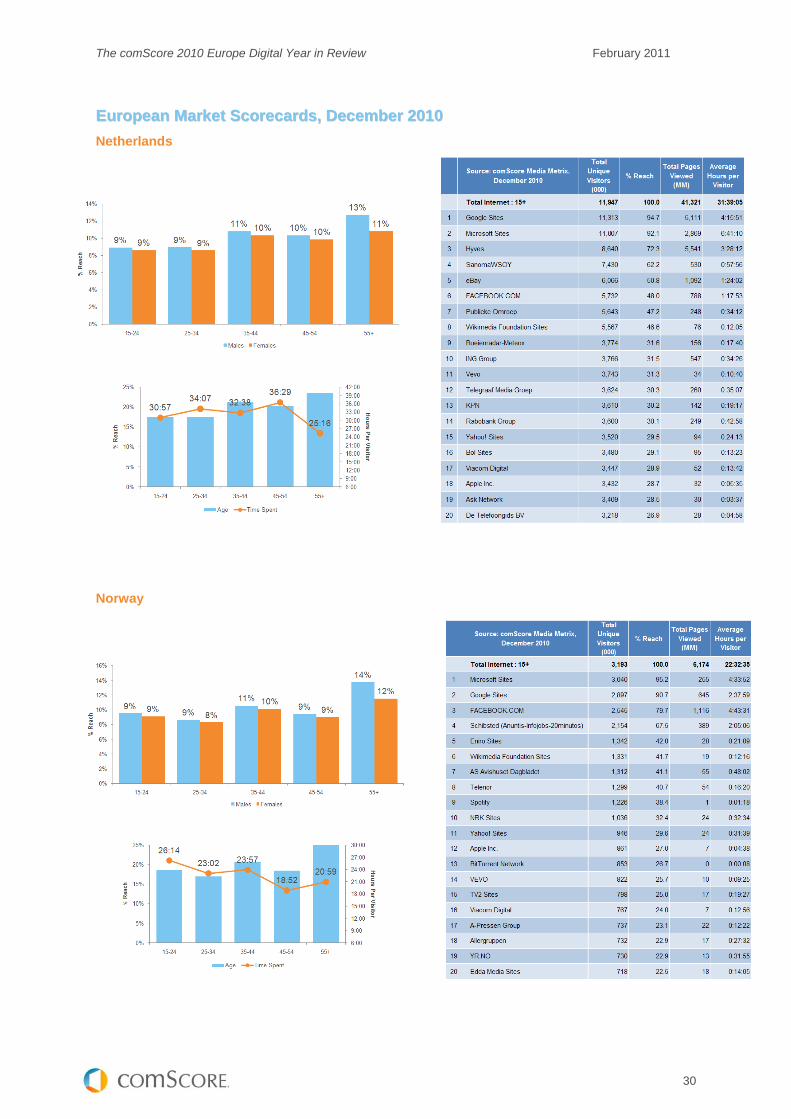
Netherlands
Norway
The comScore 2010 Europe Digital Year in Review February 2011
31
EEuurrooppeeaann MMaarrkkeett SSccoorreeccaarrddss,, DDeecceemmbbeerr 22001100
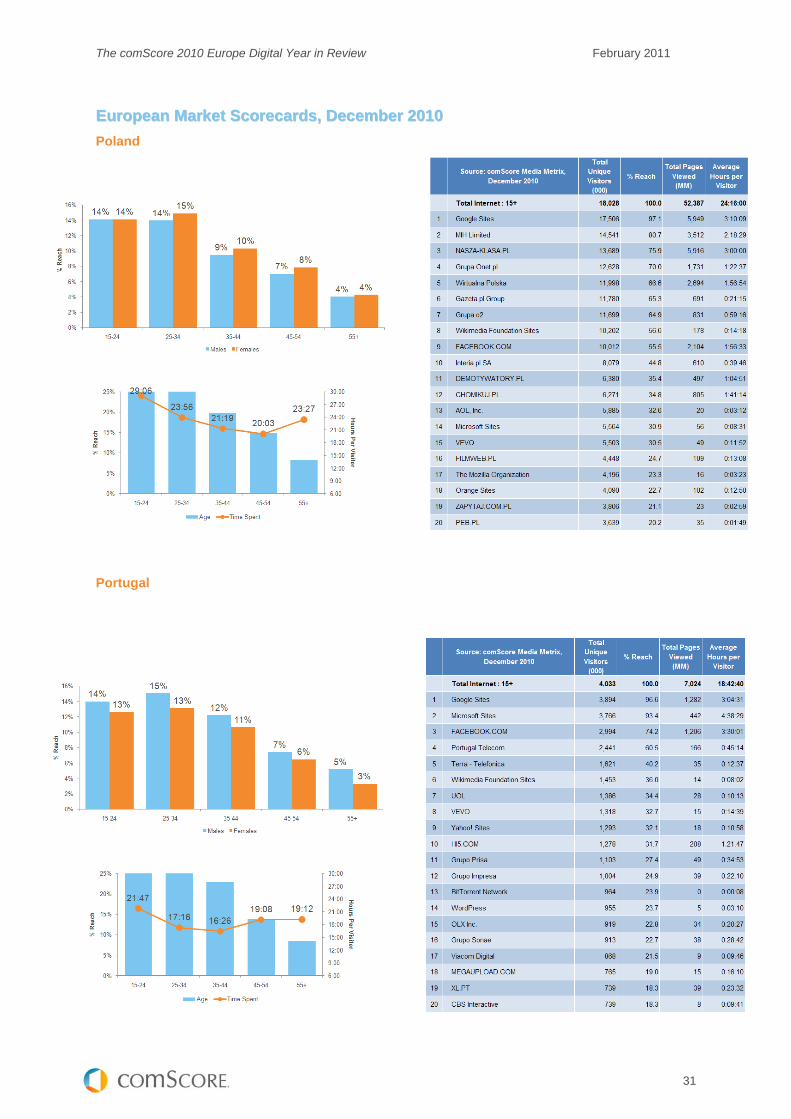
Poland
Portugal
The comScore 2010 Europe Digital Year in Review February 2011
32
EEuurrooppeeaann MMaarrkkeett SSccoorreeccaarrddss,, DDeecceemmbbeerr 22001100
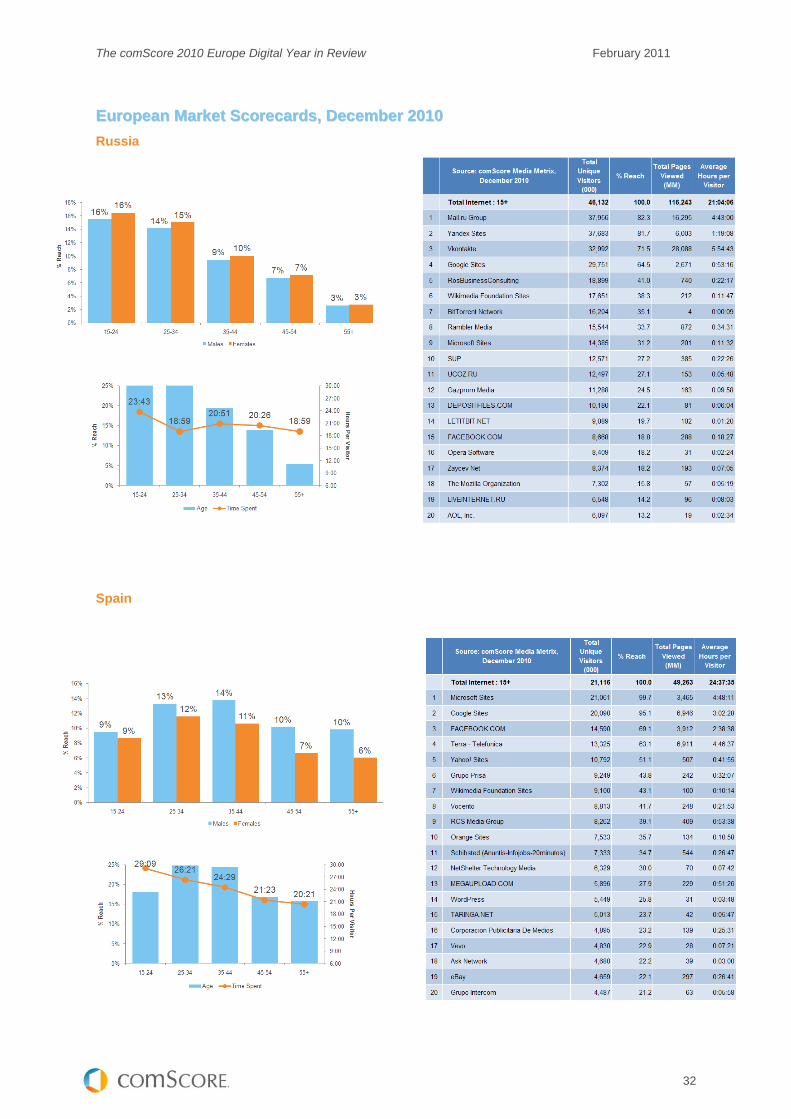
Russia
Spain

The comScore 2010 Europe Digital Year in Review February 2011
33
EEuurrooppeeaann MMaarrkkeett SSccoorreeccaarrddss,, DDeecceemmbbeerr 22001100
Sweden
Switzerland
The comScore 2010 Europe Digital Year in Review February 2011
34
EEuurrooppeeaann MMaarrkkeett SSccoorreeccaarrddss,, DDeecceemmbbeerr 22001100
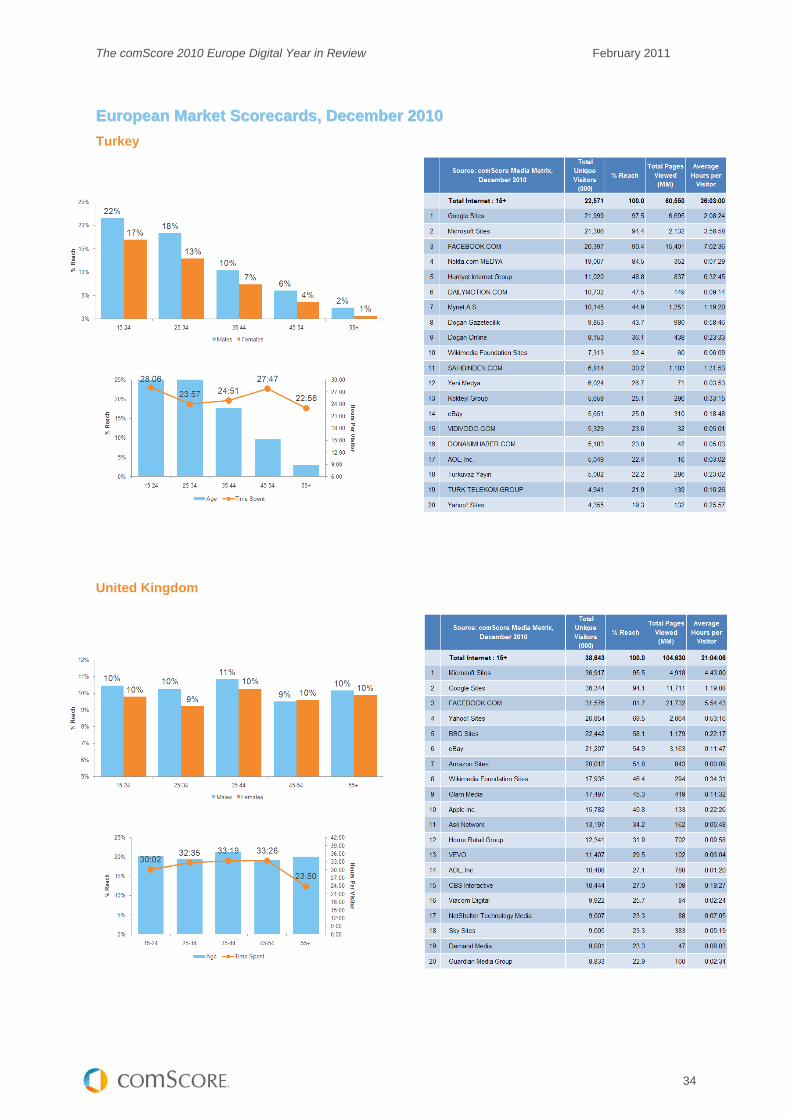
Turkey
United Kingdom
The comScore 2010 Europe Digital Year in Review February 2011
35
AAbboouutt ccoommSSccoorree
comScore, Inc. (NASDAQ: SCOR) is a global leader in measuring the digital world and preferred
source of digital business analytics. comScore helps its clients better understand, leverage and profit
from the rapidly evolving digital marketing landscape by providing data, analytics and on-demand
software solutions for the measurement of online ads and audiences, media planning, website
analytics, advertising effectiveness, copy-testing, social media, search, video, mobile, cross-media, e-
commerce, and a broad variety of emerging forms of digital consumer behaviour. comScore services,
which now include the product suites of recent acquisitions Nedstat, Nexius XPlore, ARSGroup and
Certifica, are used by more than 1,600 clients around the world, including global leaders such as
AOL, Baidu, BBC, Best Buy, Carat, Deutsche Bank, ESPN, Facebook, France Telecom, Financial
Times, Fox, Microsoft, MediaCorp, Nestle, Starcom, Terra Networks, Universal McCann, Verizon
Services Group, ViaMichelin and Yahoo!. For more information, please visit www.comScore.com.
OOuurr MMeetthhooddoollooggyy
Central to most comScore services is the comScore panel, the largest continuously measured
consumer panel of its kind. With approximately 2 million worldwide consumers under continuous
measurement, comScore delivers one of the highest quality, most comprehensive views of internet
browsing, buying and other activity, in the digital environment. Complementing the panel is a unique
census-level data collection method, which allows for the integration of consumers’ internet behaviour
with powerful audience-measurement insights. The methodology that comScore utilises to thread
census-level collected data with the comScore panel is called Unified Digital Measurement. For more
information, please visit: http://www.comscore.com/About_comScore/Methodology
The foundation of our MobiLens service is the continuous collection of consumer behaviour
information. Using proprietary data collection methods, we survey nationally representative samples
of mobile subscribers aged 13+. Survey fieldwork is conducted monthly and to ensure demographic
representation, recruitment quotas are set based on each country’s census demographic and
geographic profiles for age and gender. The resulting MobiLens survey panels are nationally
representative samples of mobile subscribers substantial enough to provide projected data for sub-
segments as small as 1% of mobile subscribers aged 13 years of age and higher. The MobiLens’
sampling and survey methods undergo extensive analysis and market validation including
comparisons to known network operator market shares, leading handset model shares, downloading
activity, and other usage metrics. For more information, please visit:
http://www.comscore.com/Products_Services/Product_Index/MobiLens
FOR MORE INFORMATION, PLEASE CONTACT:
Carmela Aquino, comScore, Inc.
+1 703 438 2024
Cathy McCarthy, comScore, Inc.
+44 203 111 1746