the collision theory and activation energy explaining how and why factors affect reaction rates
TRANSCRIPT

The Collision Theory and Activation Energy
Explaining how and why factors affect reaction rates

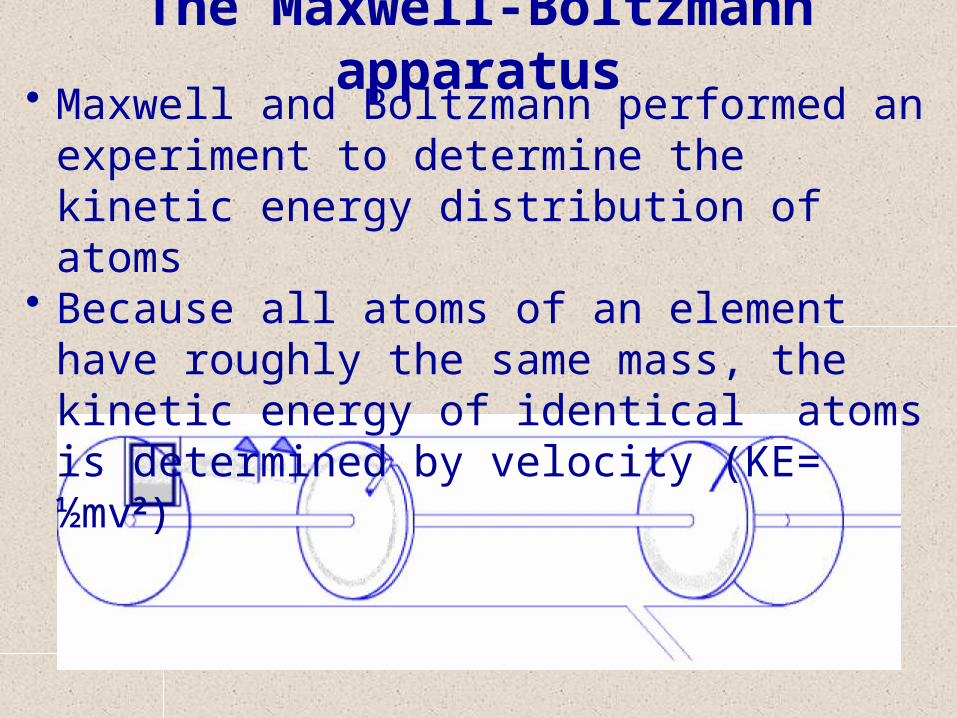
The Maxwell-Boltzmann apparatus• Maxwell and Boltzmann performed an
experiment to determine the kinetic energy distribution of atoms
• Because all atoms of an element have roughly the same mass, the kinetic energy of identical atoms is determined by velocity (KE= ½mv2)
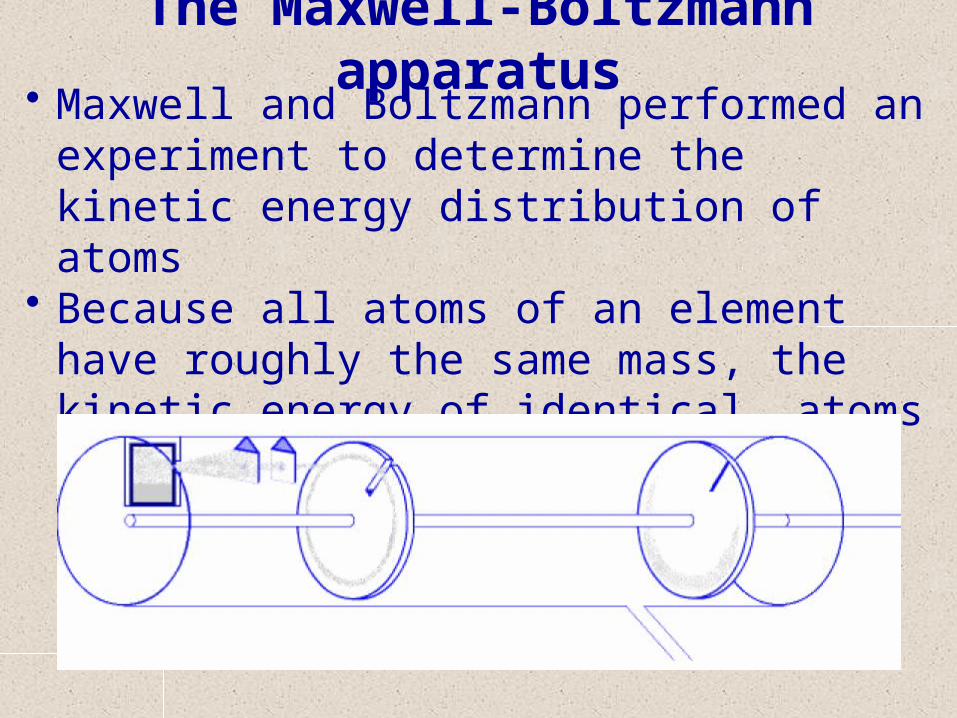
The Maxwell-Boltzmann apparatus• Maxwell and Boltzmann performed an
experiment to determine the kinetic energy distribution of atoms
• Because all atoms of an element have roughly the same mass, the kinetic energy of identical atoms is determined by velocity (KE= ½mv2)
The Maxwell-Boltzmann apparatus• Maxwell and Boltzmann performed an
experiment to determine the kinetic energy distribution of atoms
• Because all atoms of an element have roughly the same mass, the kinetic energy of identical atoms is determined by velocity (KE= ½mv2)

The Maxwell-Boltzmann distribution• The resulting disk looks like this:
Basically, if we plot the intensity of the dots on a graph we get a graph of fraction of atoms/molecules vs. kinetic energy:
Fraction of molecules
Kinetic energy
Molecules hit disk first
Molecules hit disk last
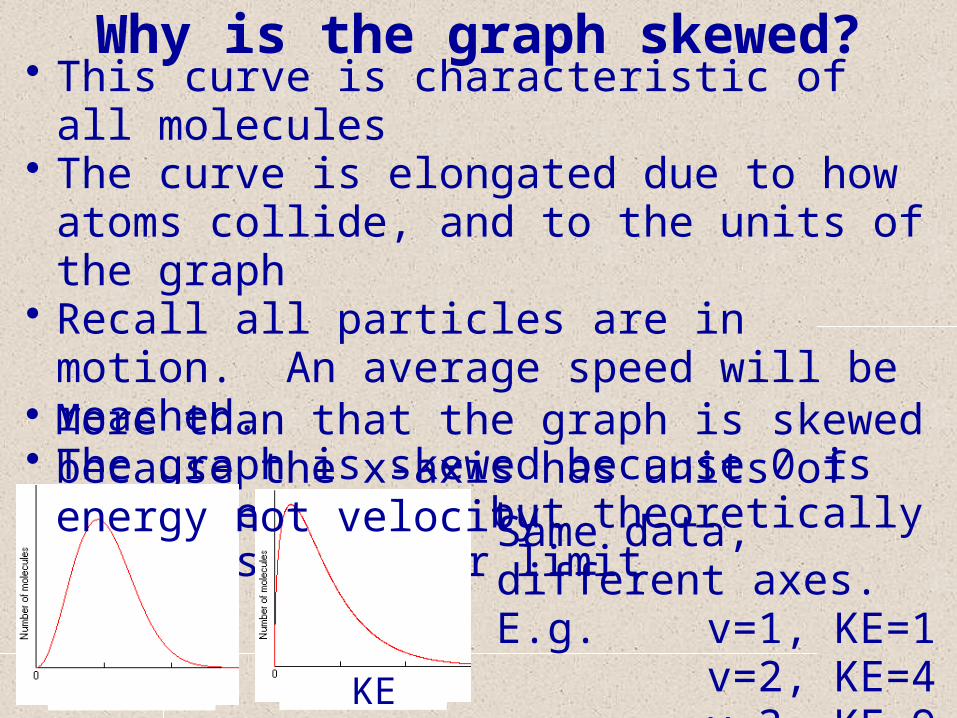
Why is the graph skewed?• This curve is characteristic of all molecules• The curve is elongated due to how atoms
collide, and to the units of the graph• Recall all particles are in motion. An average
speed will be reached.• The graph is skewed because 0 is the lower
limit, but theoretically there is no upper limit
Same data, different axes. E.g. v=1, KE=1
v=2, KE=4v=3, KE=9 velocity KE
• More than that the graph is skewed because the x-axis has units of energy not velocity

Temperature and reaction rate• By understanding the Maxwell-Boltzmann
distribution, we can begin to understand the two reasons why an increase in temperature causes an increase in reaction rate
Q- Look back at the five factors that affect reaction rates. Three of these factors can be (at least in part) explained by the collision theory. Identify the 3 factors and explain how the affect of each can be explained with reference to the collision theory

Temperature and reaction rateA- Ability to meet (molecules that are well mixed
will have a greater chance of colliding)Concentration of reactants (more molecules means more collisions)Temperature (faster moving molecules means more collisions per unit of time).

Temperature and reaction rate• By increasing the temperature, a small number
of molecules reach Ea. The reaction is exothermic, further increasing temperature and causing more molecules to reach Ea, etc.
Ea
Fraction of molecules
Kinetic energy
Shift due to higher temperature

© 2009, Prentice-Hall, Inc.
Maxwell–Boltzmann Distributions
This fraction of molecules can be found through the expression
where R is the gas constant and T is the Kelvin temperature.
f = e-Ea
RT
© 2009, Prentice-Hall, Inc.
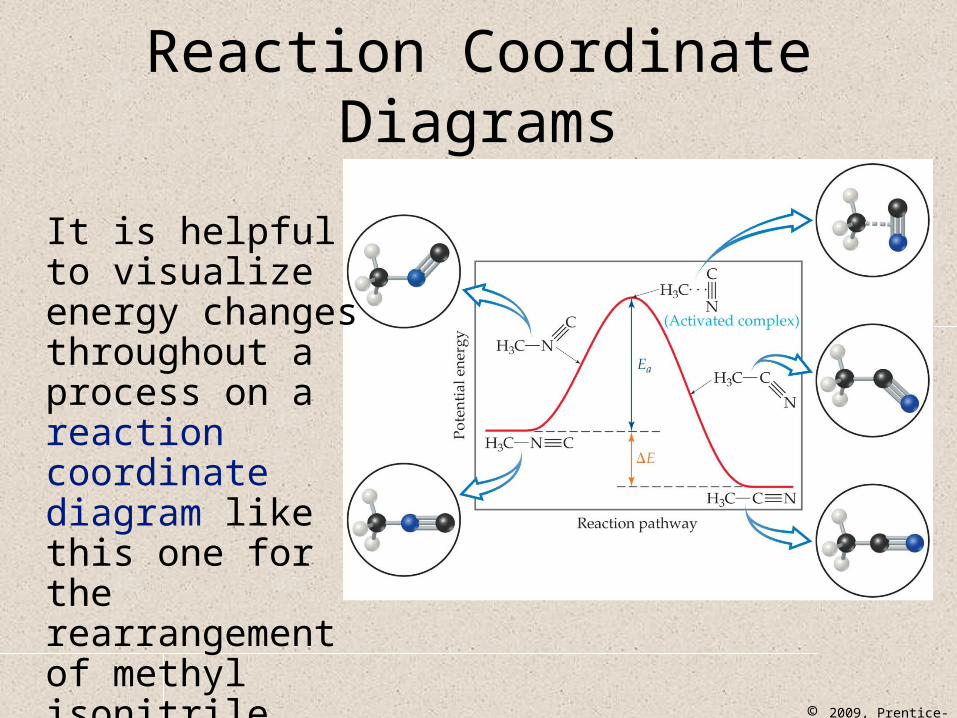
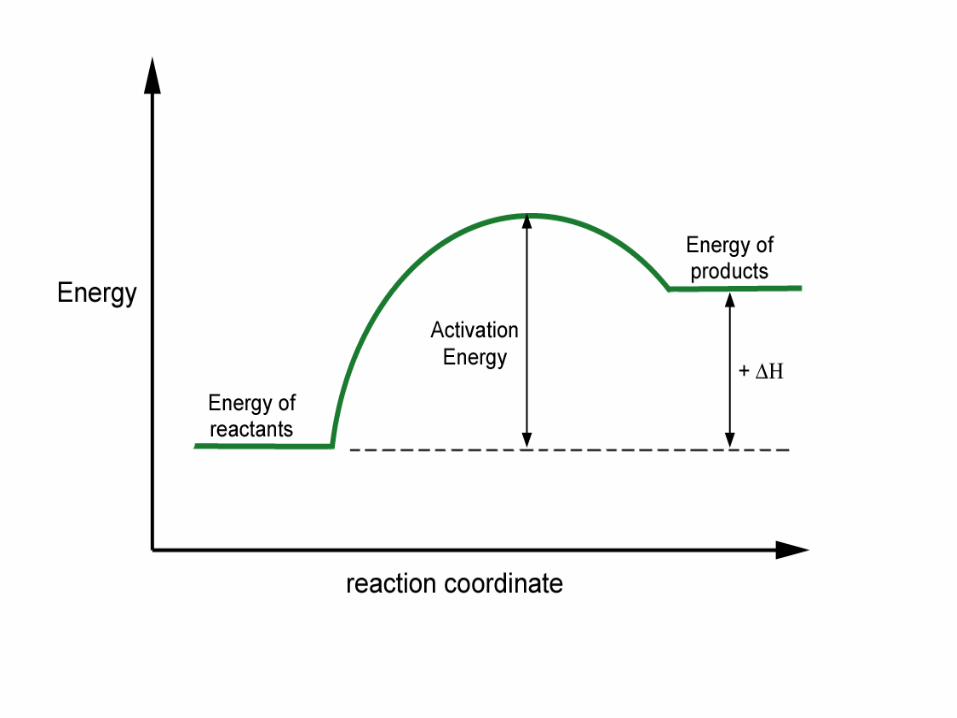
Reaction Coordinate Diagrams
It is helpful to visualize energy changes throughout a process on a reaction coordinate diagram like this one for the rearrangement of methyl isonitrile.

© 2009, Prentice-Hall, Inc.
Reaction Coordinate Diagrams• The diagram shows the
energy of the reactants and products (and, therefore, E).
• The high point on the diagram is the transition state.
• The species present at the transition state is called the activated complex.
• The energy gap between the reactants and the activated complex is the activation energy barrier.
Endothermic Reactions

Exothermic Reactions

The Arrhenius Equation
/aE RTk Ae k = rate constant at temperature T A = frequency factor Ea = activation energy R = Gas constant, 8.31451 J/K·mol

The Arrhenius Equation, Rearranged
1ln( ) ln( )aE
k AR T
Simplifies solving for Ea
-Ea / R is the slope when (1/T) is plotted against ln(k) ln(A) is the y-intercept Linear regression analysis of a table of (1/T) vs. ln(k) can
quickly yield a slope Ea = -R(slope)

© 2009, Prentice-Hall, Inc.
Arrhenius Equation
Taking the natural logarithm of both sides, the equation becomes
ln k = - ( ) + ln A1T
y = m x + b
Therefore, if k is determined experimentally at several temperatures, Ea can be calculated from the slope of a plot of ln k vs. .
Ea
R
1T
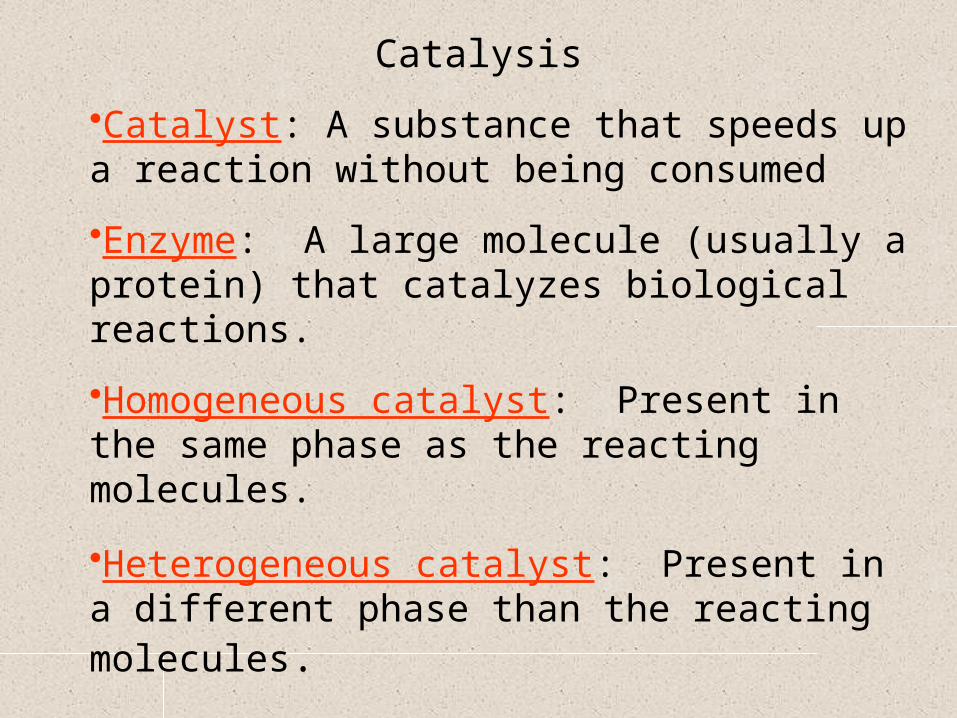
Catalysis
•Catalyst: A substance that speeds up a reaction without being consumed
•Enzyme: A large molecule (usually a protein) that catalyzes biological reactions.
•Homogeneous catalyst: Present in the same phase as the reacting molecules.
•Heterogeneous catalyst: Present in a different phase than the reacting molecules.

Lowering of Activation Energy by a Catalyst

Catalysts Increase the Number of Effective Collisions

Heterogeneous Catalysis
Step #1: Adsorption and activation of the
reactants.
Carbon monoxide and nitrogen monoxide adsorbed
on a platinum surface

Heterogeneous Catalysis
Step #2:
Migration of the adsorbed reactants on
the surface.
Carbon monoxide and nitrogen monoxide arranged
prior to reacting

Heterogeneous Catalysis
Step #3:
Reaction of the adsorbed substances.
Carbon dioxide and nitrogen form from previous molecules
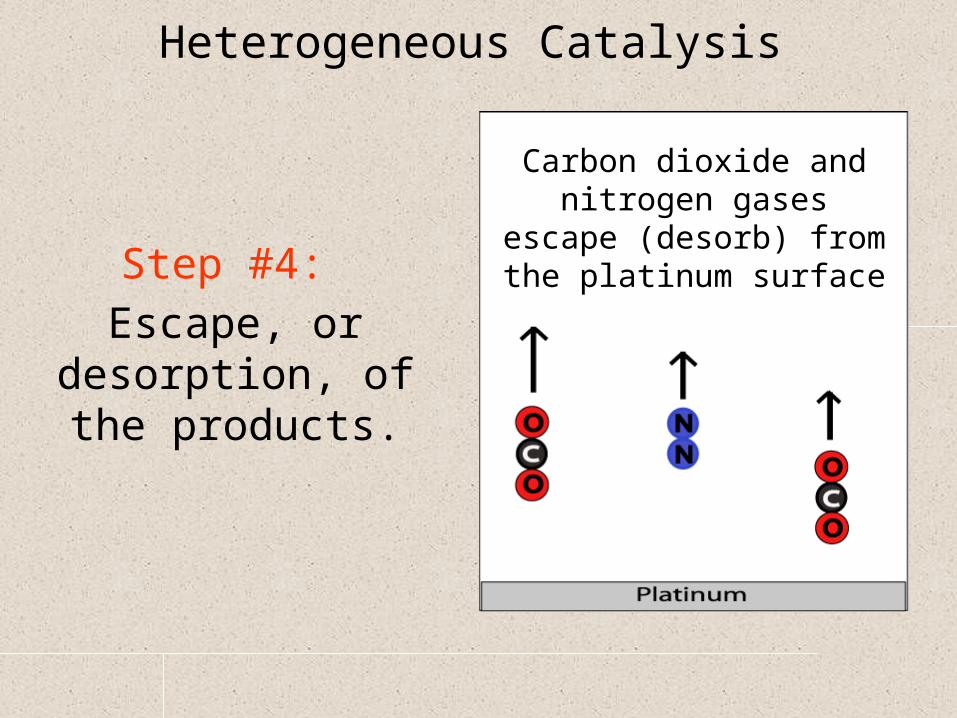
Heterogeneous Catalysis
Step #4:
Escape, or desorption, of the
products.
Carbon dioxide and nitrogen gases escape (desorb) from the
platinum surface