the cohort-component method a new method for household projections by tenure
DESCRIPTION
Projections and Forecasts Workshop Housing Demand Projection A Demographic Approach. The Cohort-Component Method A New Method for Household Projections by Tenure. Jan Freeke Glasgow City Council. Tenure Projection Model for Glasgow and the Clyde Valley Area. - PowerPoint PPT PresentationTRANSCRIPT

The Cohort-Component MethodA New Method for Household Projections by Tenure
Jan Freeke
Glasgow City Council
Projections and Forecasts WorkshopHousing Demand ProjectionA Demographic Approach

Tenure Projection Model forGlasgow and the Clyde Valley Area
Model was developed for Housing Need and Demand Assessment
This presentation will cover:
• description of the model
• projection results for 2008 to 2025
• role and use of the model
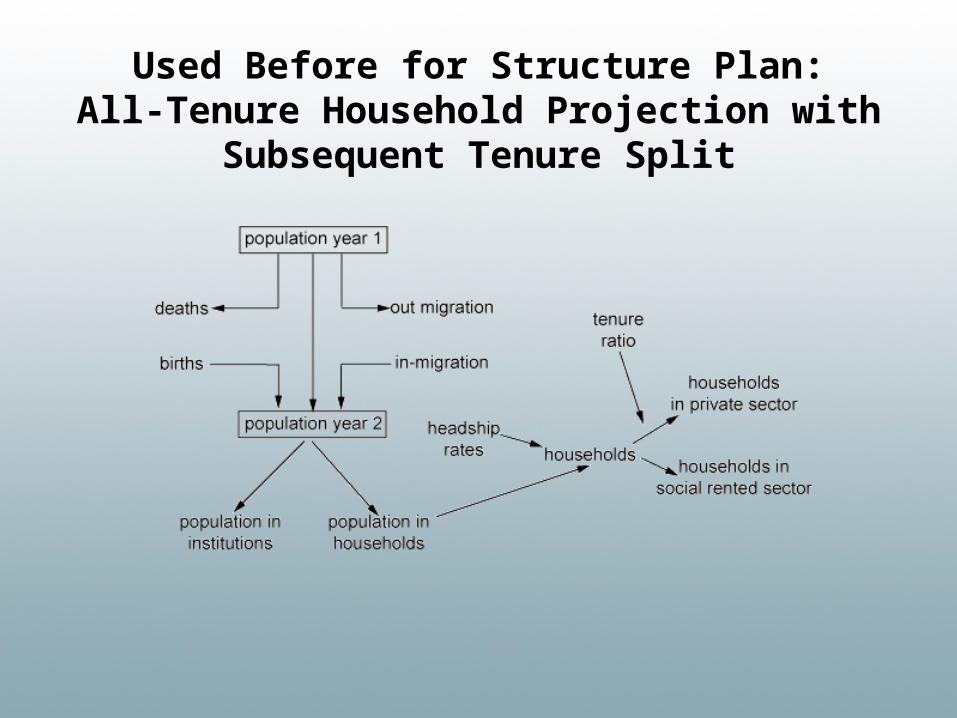
Used Before for Structure Plan:All-Tenure Household Projection with
Subsequent Tenure Split

GCV Tenure Model: Projection Using Cohort Component Method by
Tenure

Description GCV Tenure Model
Data Input Requirements:
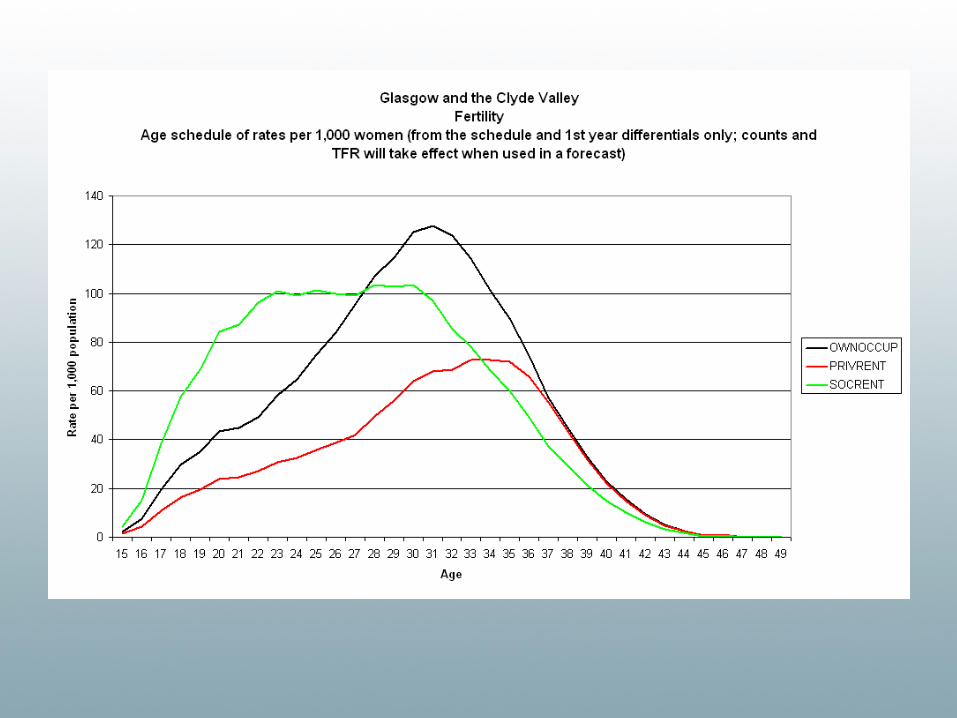
1) fertility and mortality rates by tenure
based on analysis of numbers of births and deaths in relation to population for the following categories of Data Zones: – mainly owner occupied– mainly social rented– significant private rented presence
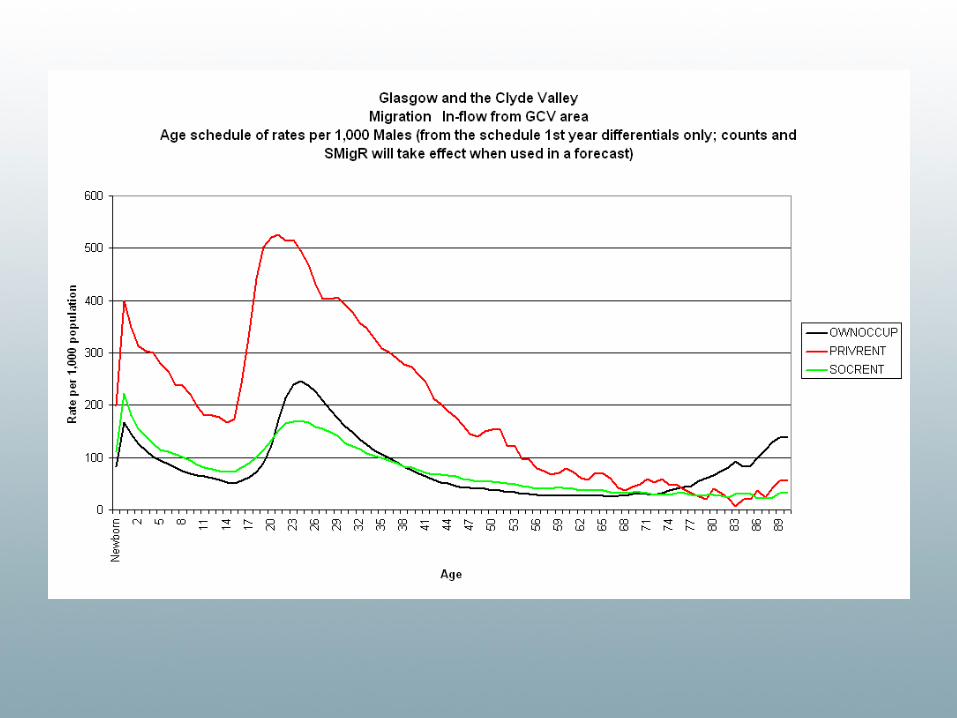
2) population inflow rates. Source: 1991 and 2001 Census
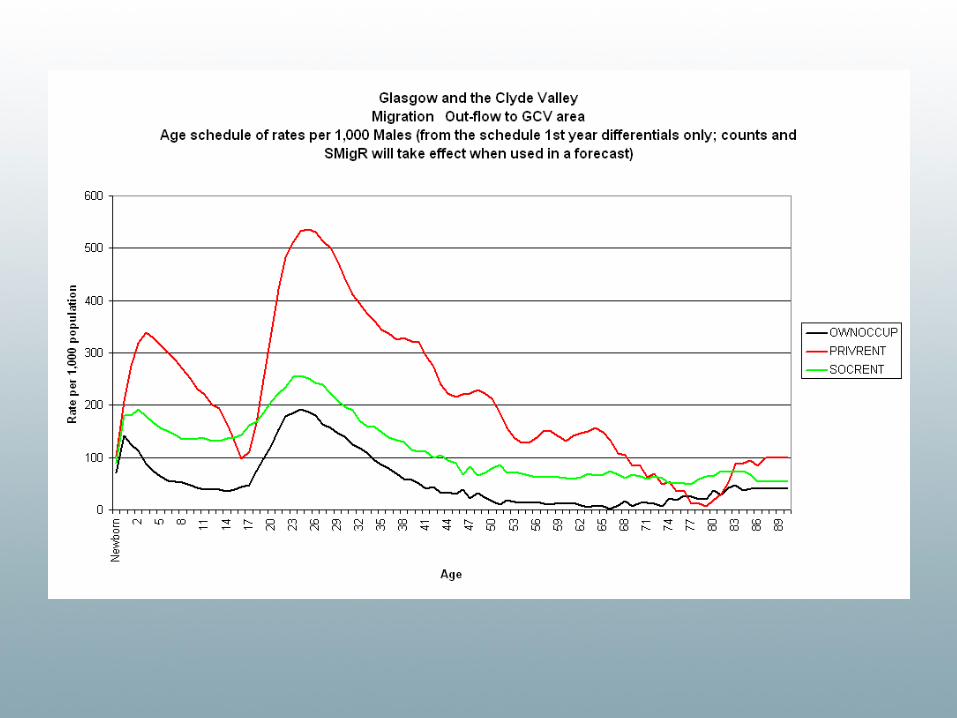
3) population outflow rates
derived from model validation process 1991-2001: outflow rates which “predict” 2001 population by tenure from a 1991 base
4) household formation rates
GROS supplied all tenure headship rates for GCV area. Calibration factors adjust for difference in household formation patterns by tenure

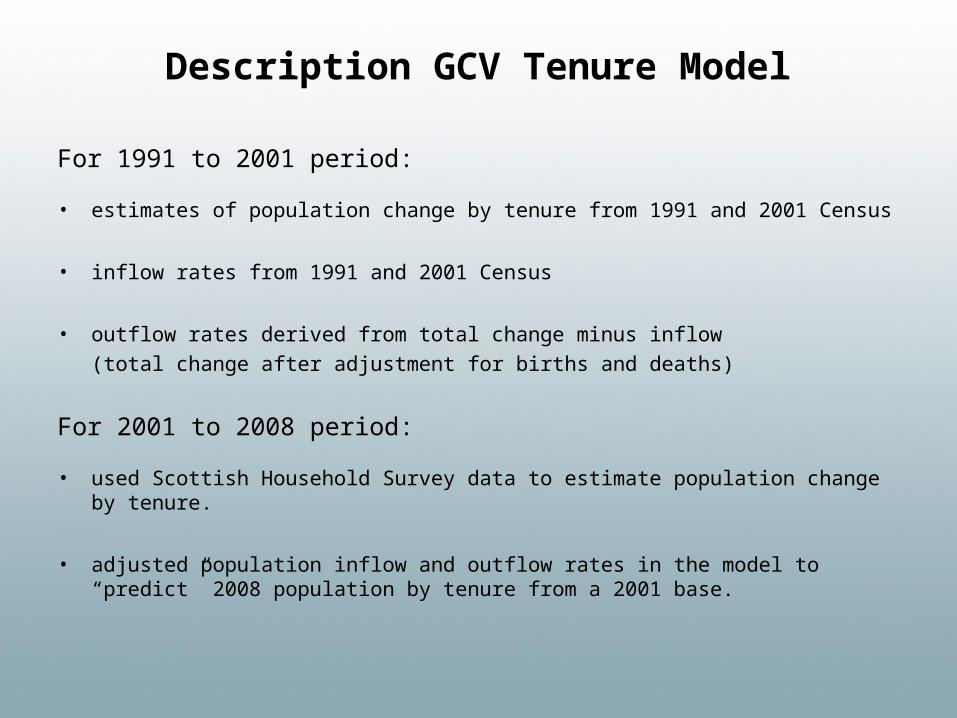
For 1991 to 2001 period:
• estimates of population change by tenure from 1991 and 2001 Census
• inflow rates from 1991 and 2001 Census
• outflow rates derived from total change minus inflow
(total change after adjustment for births and deaths)
For 2001 to 2008 period:
• used Scottish Household Survey data to estimate population change by tenure.
• adjusted population inflow and outflow rates in the model to “predict” 2008 population by tenure from a 2001 base.
Description GCV Tenure Model

Description GCV Tenure Model
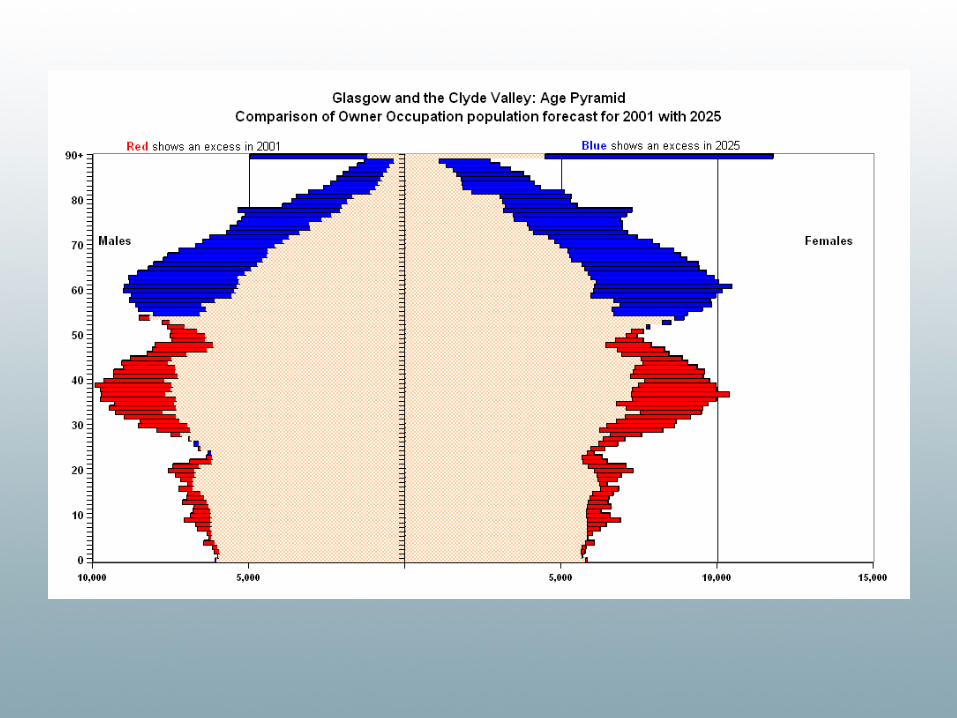
Table 1. - Estimated annual net population flow by age and by tenure
total net migration owner occupied private rented social rented1991 to 20010 to 14 -2,396 2,139 246 -4,78015 to 19 974 1,405 1,526 -1,95620 to 24 -1,529 1,164 495 -3,18825 to 29 -1,257 2,051 -544 -2,76530 to 34 -804 1,338 -157 -1,98535+ -1,713 9,181 -481 -10,413total change -6,725 17,277 1,084 -25,0872001 to 20080 to 14 -432 1,097 705 -2,23315 to 19 2,191 848 2,588 -1,24520 to 24 992 423 1,053 -48425 to 29 511 788 -471 19330 to 34 -99 614 -79 -63435+ -1,797 5,224 619 -7,640total change 1,365 8,993 4,416 -12,043
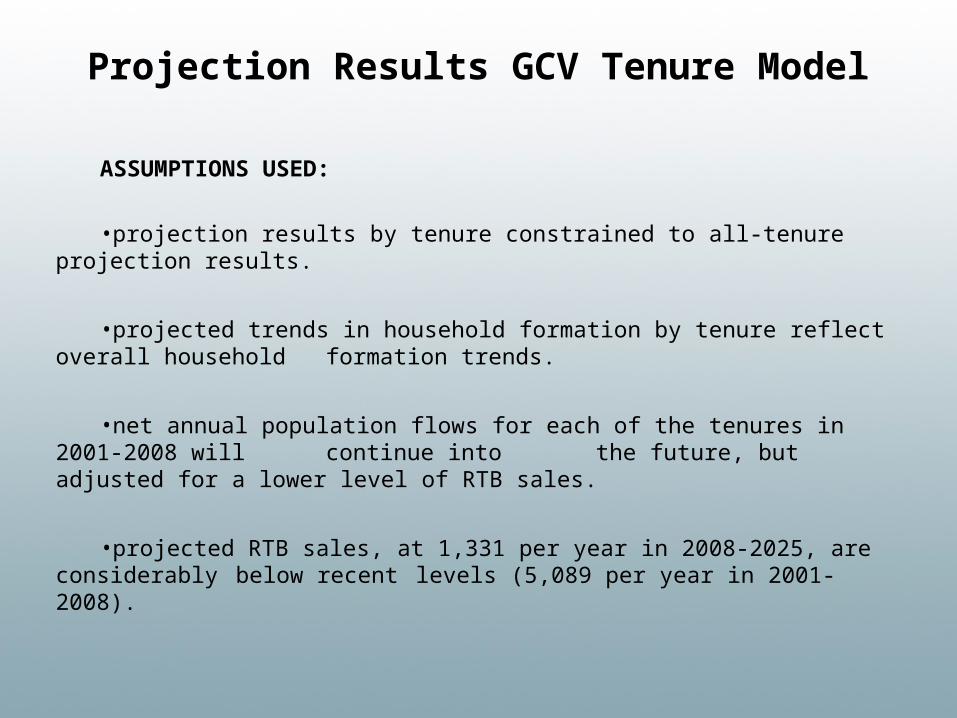
ASSUMPTIONS USED:
•projection results by tenure constrained to all-tenure projection results.
•projected trends in household formation by tenure reflect overall household formation trends.
•net annual population flows for each of the tenures in 2001-2008 will continue into the future, but adjusted for a lower level of RTB sales.
•projected RTB sales, at 1,331 per year in 2008-2025, are considerably below recent levels (5,089 per year in 2001-2008).
Projection Results GCV Tenure Model

Projection Results GCV Tenure Model
SOCIAL RENTED SECTOR
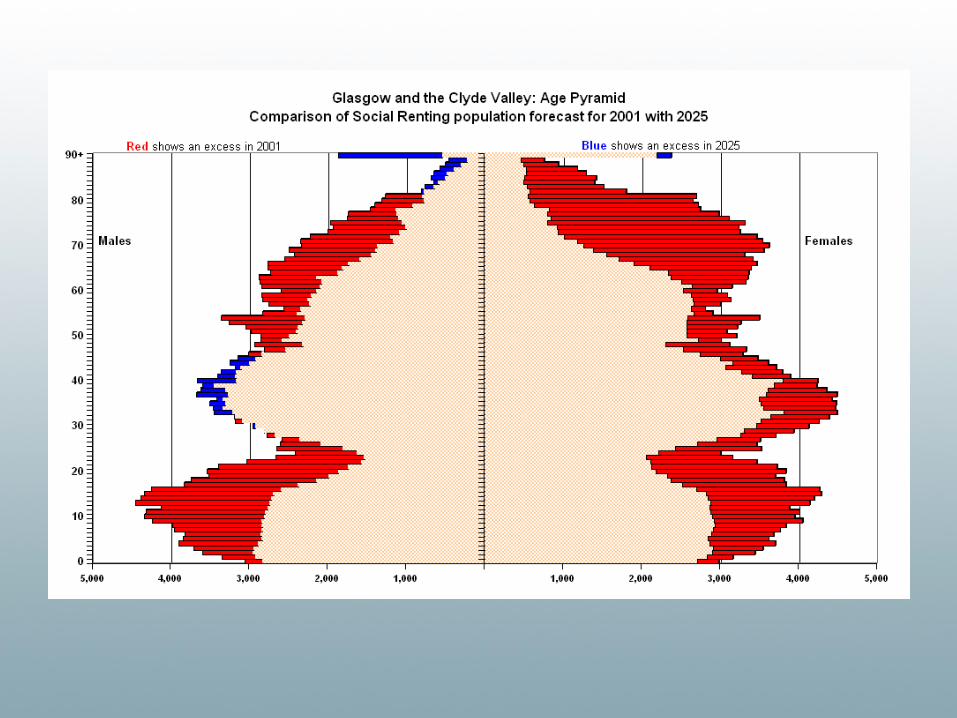
Table 2. - Annual net population flow by age
estimated estimated projected impact ofannual net flow annual net flow annual net flow lower annual RTB
1991-2001 2001-2008 2008-2025 2008-20250 to 14 -4,780 -2,233 -749 1,49915 to 19 -1,956 -1,245 -771 59420 to 24 -3,188 -484 136 59425 to 29 -2,765 193 558 34030 to 34 -1,985 -634 -215 42435+ -10,413 -7,640 -2,912 4,613total change -25,087 -12,043 -3,953 8,064
Projection Results GCV Tenure Model
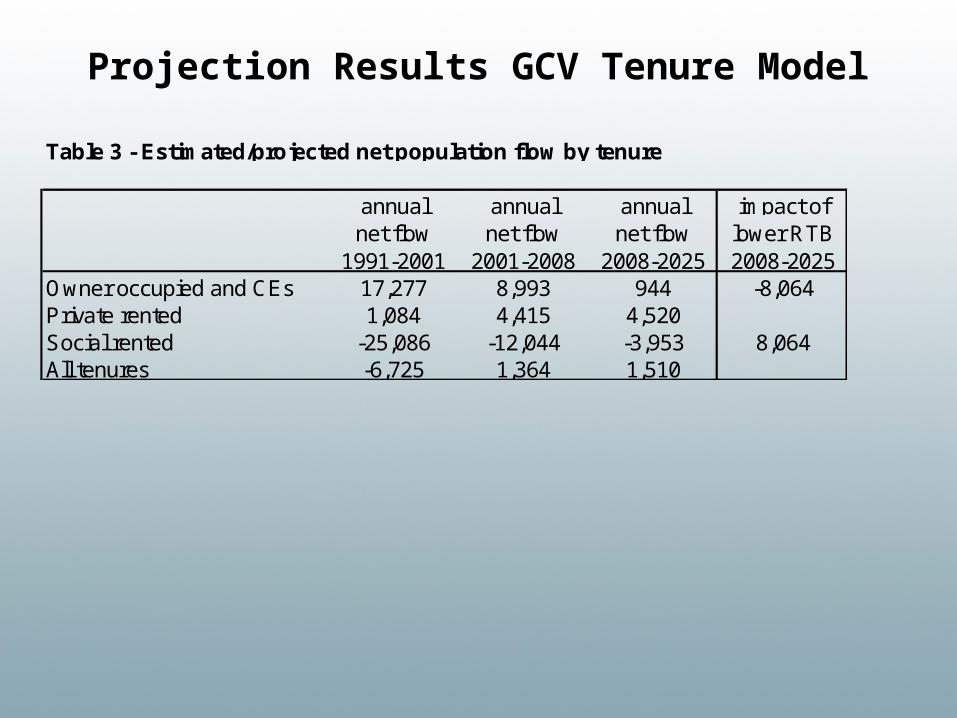
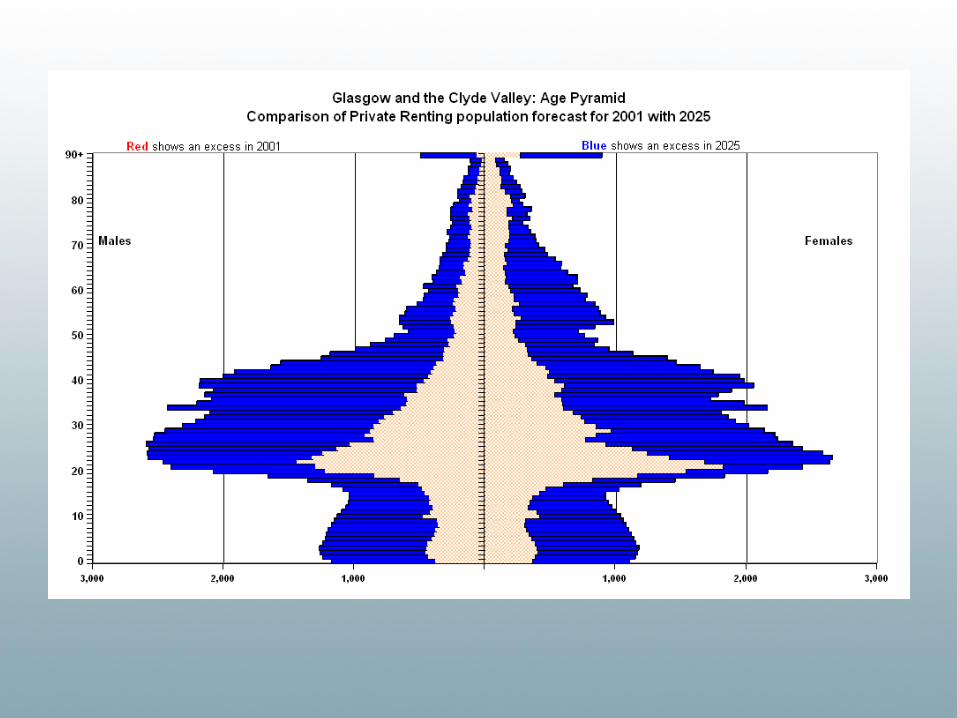
Table 3 - Estimated/projected net population flow by tenure
annual annual annual impact ofnet flow net flow net flow lower RTB
1991-2001 2001-2008 2008-2025 2008-2025Owner occupied and CEs 17,277 8,993 944 -8,064Private rented 1,084 4,415 4,520Social rented -25,086 -12,044 -3,953 8,064All tenures -6,725 1,364 1,510

Projection Results GCV Tenure Model
SOCIAL RENTED SECTOR
Table 4 - Estimated/projected annual population change by component
1991-2001 2001-2008 2008-2025births 8,292 6,045 6,125deaths 11,723 8,001 4,978natural change -3,431 -1,955 1,146net flow -25,086 -12,044 -3,953total change -28,517 -13,999 -2,807
Projection Results GCV Tenure Model
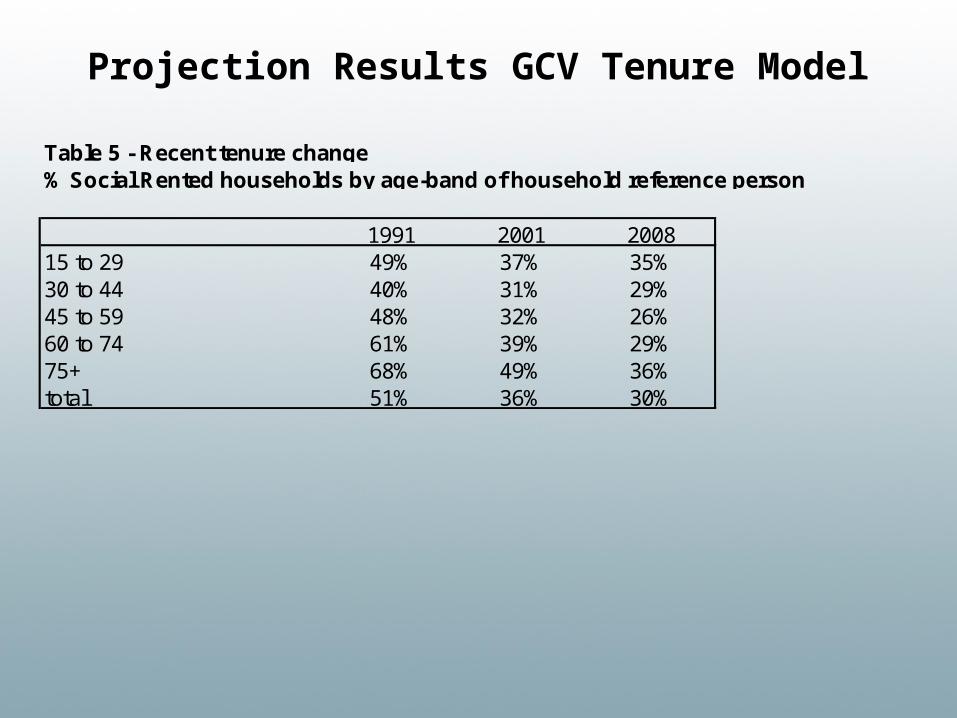
Table 5 - Recent tenure change% Social Rented households by age-band of household reference person
1991 2001 200815 to 29 49% 37% 35%30 to 44 40% 31% 29%45 to 59 48% 32% 26%60 to 74 61% 39% 29%75+ 68% 49% 36%total 51% 36% 30%
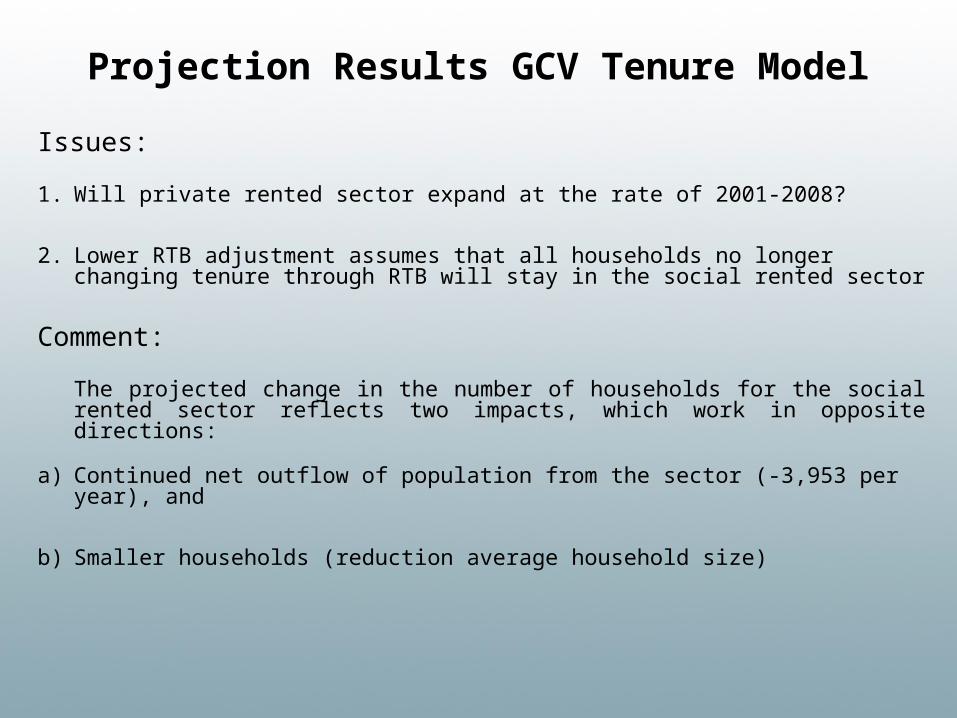
Issues:
1. Will private rented sector expand at the rate of 2001-2008?
2. Lower RTB adjustment assumes that all households no longer changing tenure through RTB will stay in the social rented sector
Comment:
The projected change in the number of households for the social rented sector reflects two impacts, which work in opposite directions:
a) Continued net outflow of population from the sector (-3,953 per year), and
b) Smaller households (reduction average household size)
Projection Results GCV Tenure Model

Use of GCV Tenure Model
1) used in parallel with Housing Affordability study Tribal HCH
2) validates an important finding from Tribal study: reductions in demand for social rented housing over the next 17 years will be considerably less than in past decades
3) projected households by tenure ‘controlled’ to all-tenure household projection
Role and Use of the Model

Role and Use of the Model
Advantages of Cohort Component Method
1) focus on population. Better understanding of factors behind tenure change:
• natural change population effect• net flow population effect• household formation effect
2) age/household structure of population by tenure relevant for service planning
3) closer link with affordability analysis than former method used for Structure Plan
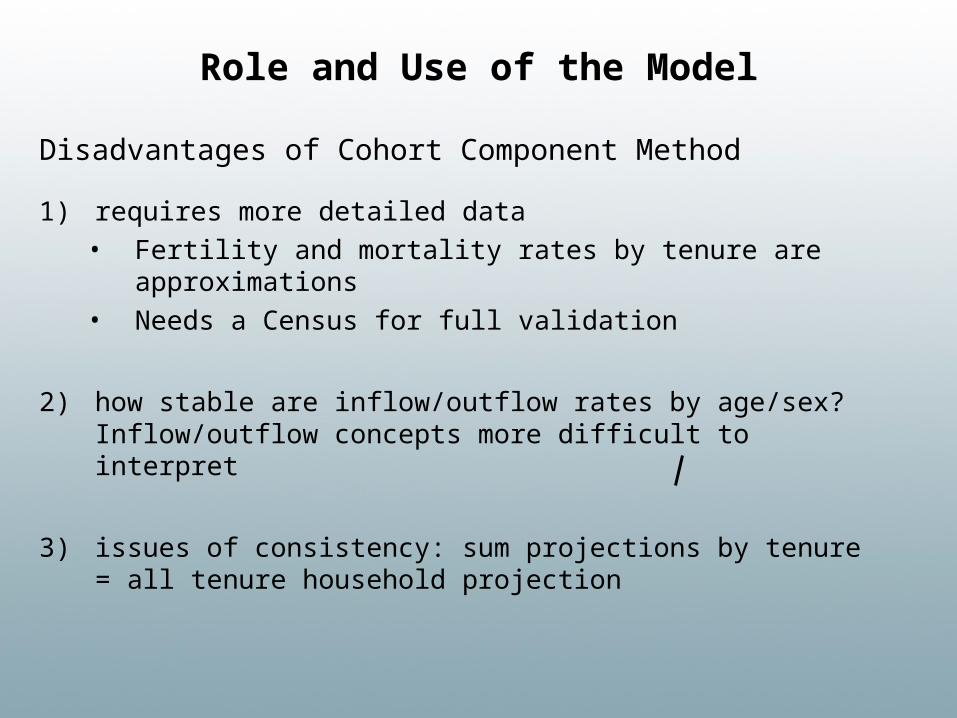
Disadvantages of Cohort Component Method
1) requires more detailed data• Fertility and mortality rates by tenure are approximations• Needs a Census for full validation
2) how stable are inflow/outflow rates by age/sex? Inflow/outflow concepts more difficult to interpret
3) issues of consistency: sum projections by tenure = all tenure household projection
Role and Use of the Model