the clinical chemistry lab vicki s. freeman, ph.d
TRANSCRIPT

The Clinical Chemistry The Clinical Chemistry LabLab
The Clinical Chemistry The Clinical Chemistry LabLab
Vicki S. Freeman, Ph.D.Vicki S. Freeman, Ph.D.
ObjectivesObjectives
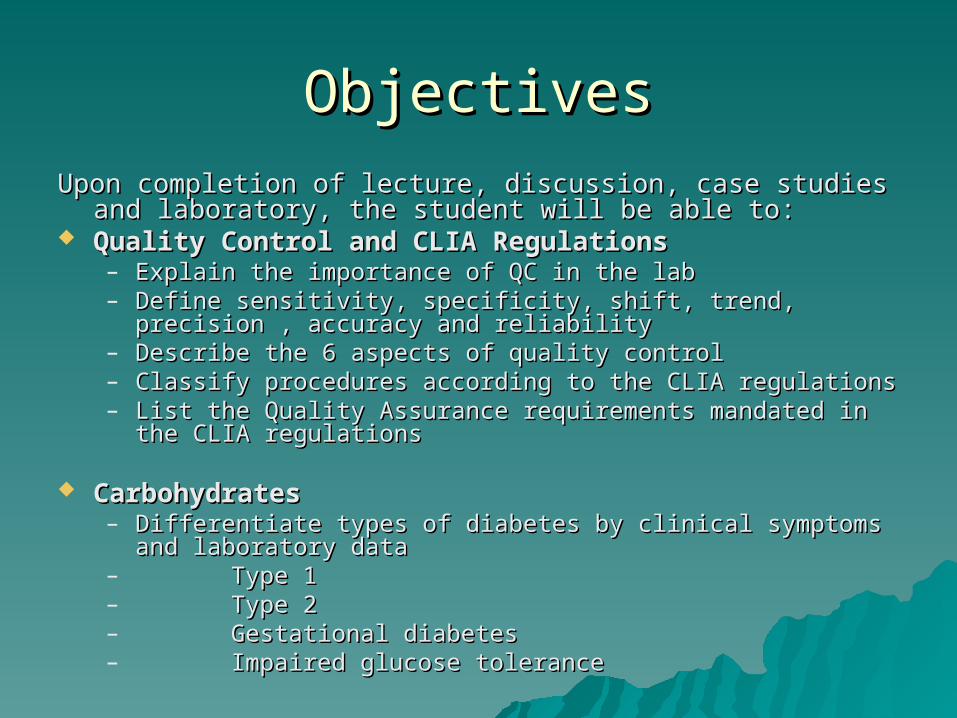
Upon completion of lecture, discussion, case studies and Upon completion of lecture, discussion, case studies and laboratory, the student will be able to:laboratory, the student will be able to:
Quality Control and CLIA RegulationsQuality Control and CLIA Regulations– Explain the importance of QC in the labExplain the importance of QC in the lab– Define sensitivity, specificity, shift, trend, precision , accuracy Define sensitivity, specificity, shift, trend, precision , accuracy
and reliabilityand reliability– Describe the 6 aspects of quality controlDescribe the 6 aspects of quality control– Classify procedures according to the CLIA regulationsClassify procedures according to the CLIA regulations– List the Quality Assurance requirements mandated in the CLIA List the Quality Assurance requirements mandated in the CLIA
regulationsregulations
CarbohydratesCarbohydrates– Differentiate types of diabetes by clinical symptoms and Differentiate types of diabetes by clinical symptoms and
laboratory datalaboratory data– Type 1 Type 1 – Type 2 Type 2 – Gestational diabetesGestational diabetes– Impaired glucose toleranceImpaired glucose tolerance
Objectives (Con’t)Objectives (Con’t)
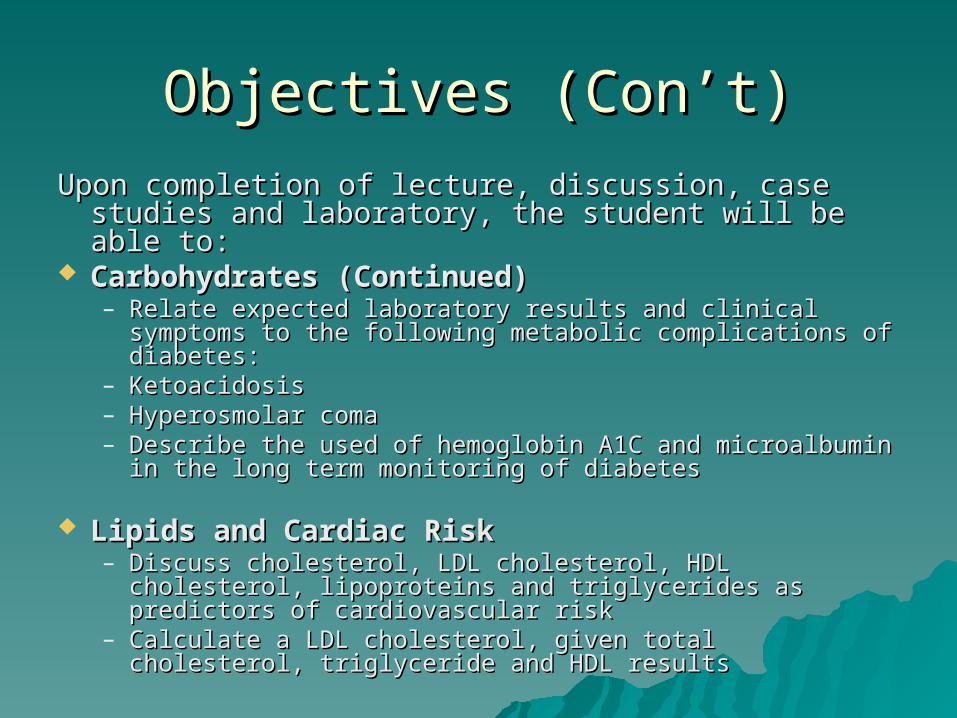
Upon completion of lecture, discussion, case studies Upon completion of lecture, discussion, case studies and laboratory, the student will be able to:and laboratory, the student will be able to:
Carbohydrates (Continued)Carbohydrates (Continued)– Relate expected laboratory results and clinical Relate expected laboratory results and clinical
symptoms to the following metabolic complications of symptoms to the following metabolic complications of diabetes:diabetes:
– KetoacidosisKetoacidosis– Hyperosmolar comaHyperosmolar coma– Describe the used of hemoglobin A1C and microalbumin Describe the used of hemoglobin A1C and microalbumin
in the long term monitoring of diabetesin the long term monitoring of diabetes
Lipids and Cardiac RiskLipids and Cardiac Risk– Discuss cholesterol, LDL cholesterol, HDL cholesterol, Discuss cholesterol, LDL cholesterol, HDL cholesterol,
lipoproteins and triglycerides as predictors of lipoproteins and triglycerides as predictors of cardiovascular riskcardiovascular risk
– Calculate a LDL cholesterol, given total cholesterol, Calculate a LDL cholesterol, given total cholesterol, triglyceride and HDL resultstriglyceride and HDL results
Quality ControlQuality Control
Purpose of QC is to Purpose of QC is to – assure the reliability of patient data assure the reliability of patient data
obtained from a procedureobtained from a procedure– monitor variables that can alter datamonitor variables that can alter data
Patient data is unknown information Patient data is unknown information and “known” samples must be run and “known” samples must be run concurrentlyconcurrently
TermsTerms
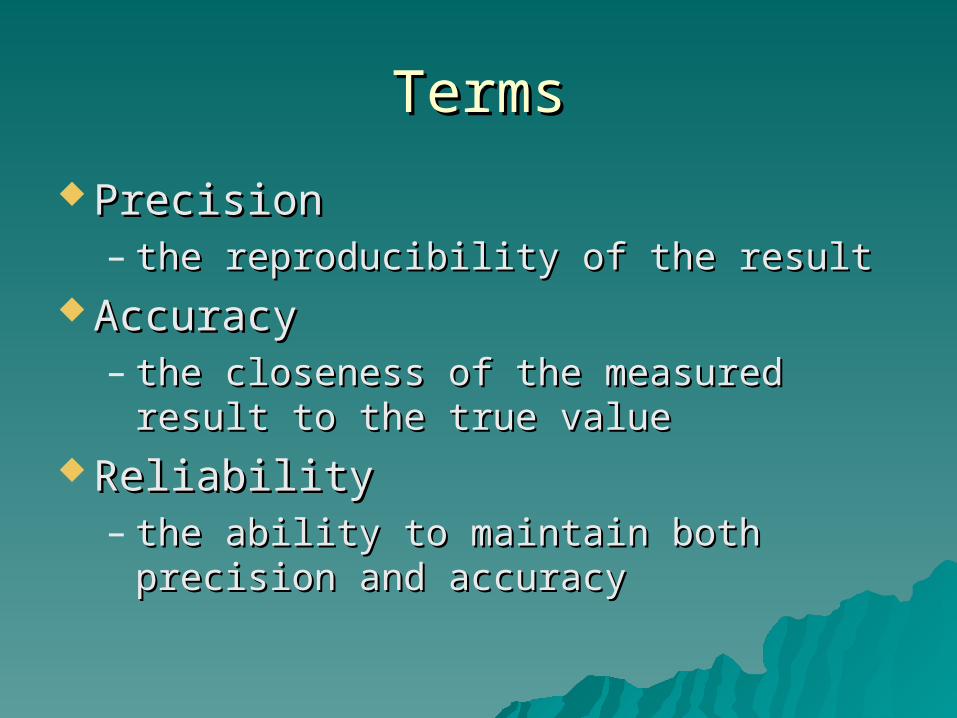
PrecisionPrecision– the reproducibility of the resultthe reproducibility of the result
AccuracyAccuracy– the closeness of the measured result to the closeness of the measured result to
the true valuethe true value ReliabilityReliability
– the ability to maintain both precision the ability to maintain both precision and accuracyand accuracy
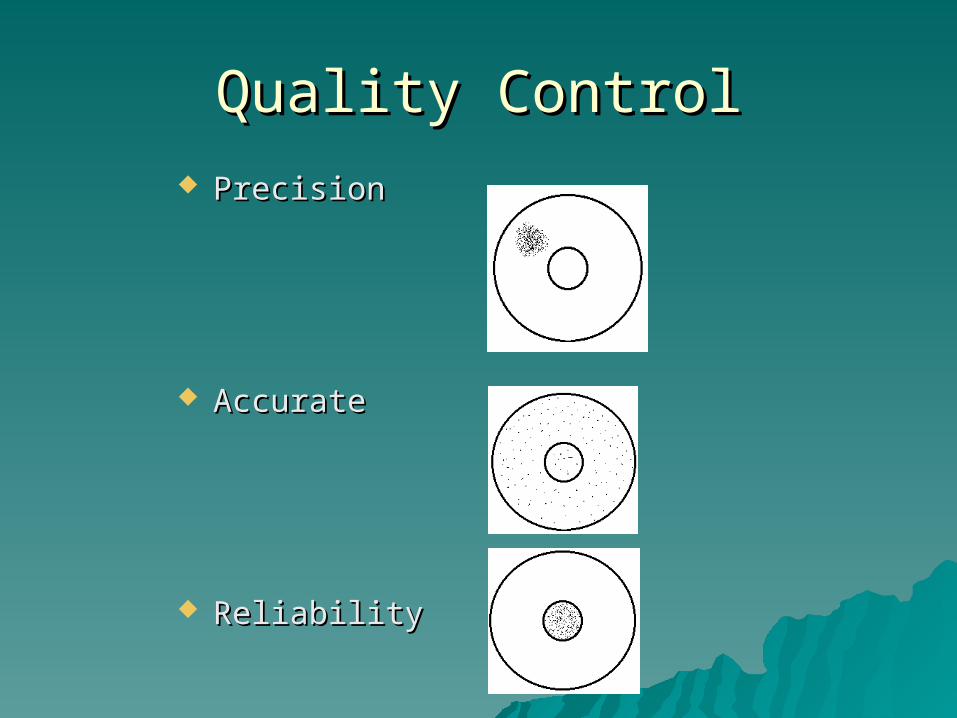
Quality ControlQuality Control PrecisionPrecision
AccurateAccurate
ReliabilityReliability

ShiftShift– 6 or more consecutive values distributed 6 or more consecutive values distributed
above or below the meanabove or below the mean TrendTrend
– A continual increase or decrease in 6 or A continual increase or decrease in 6 or more consecutive valuesmore consecutive values
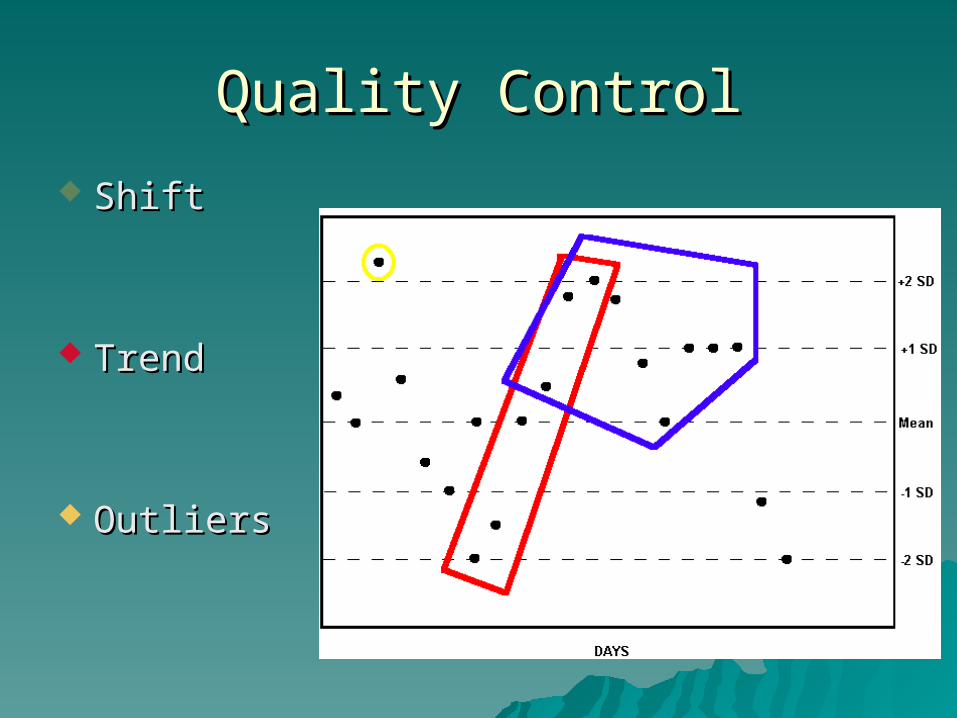
Quality ControlQuality Control
ShiftShift
TrendTrend
OutliersOutliers
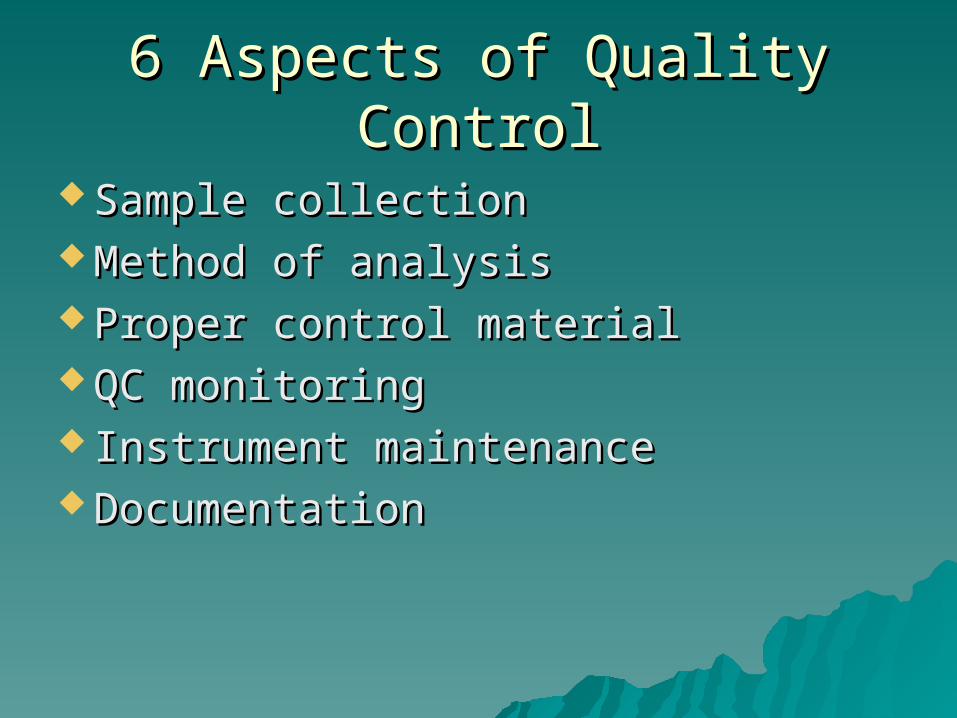
6 Aspects of Quality Control6 Aspects of Quality Control
Sample collectionSample collection Method of analysisMethod of analysis Proper control materialProper control material QC monitoringQC monitoring Instrument maintenanceInstrument maintenance DocumentationDocumentation
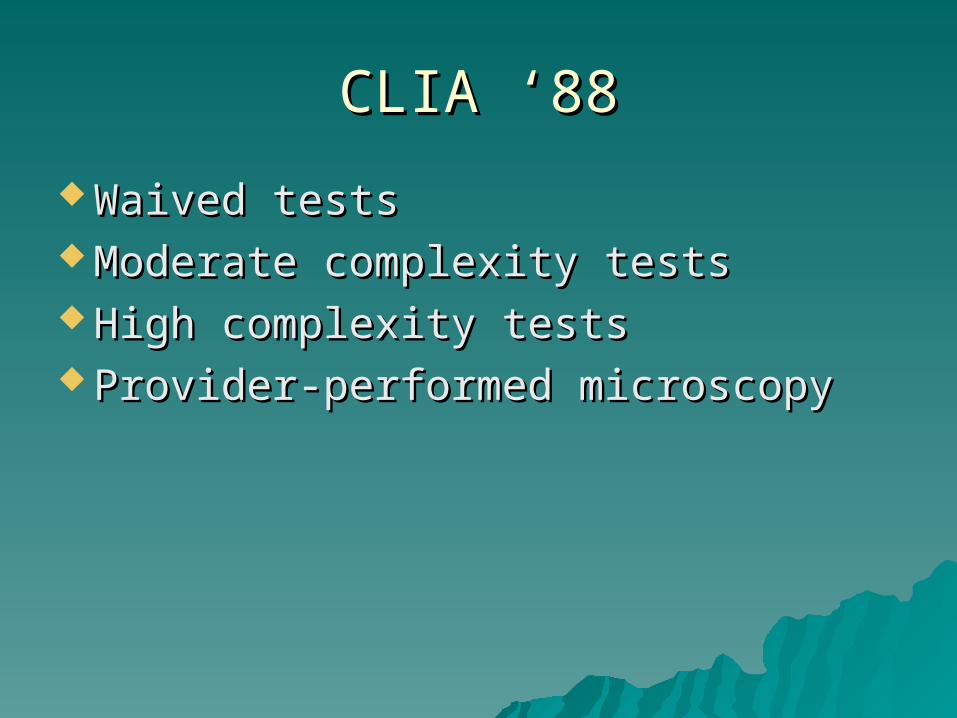
CLIA ‘88CLIA ‘88
Waived testsWaived tests Moderate complexity testsModerate complexity tests High complexity testsHigh complexity tests Provider-performed microscopyProvider-performed microscopy
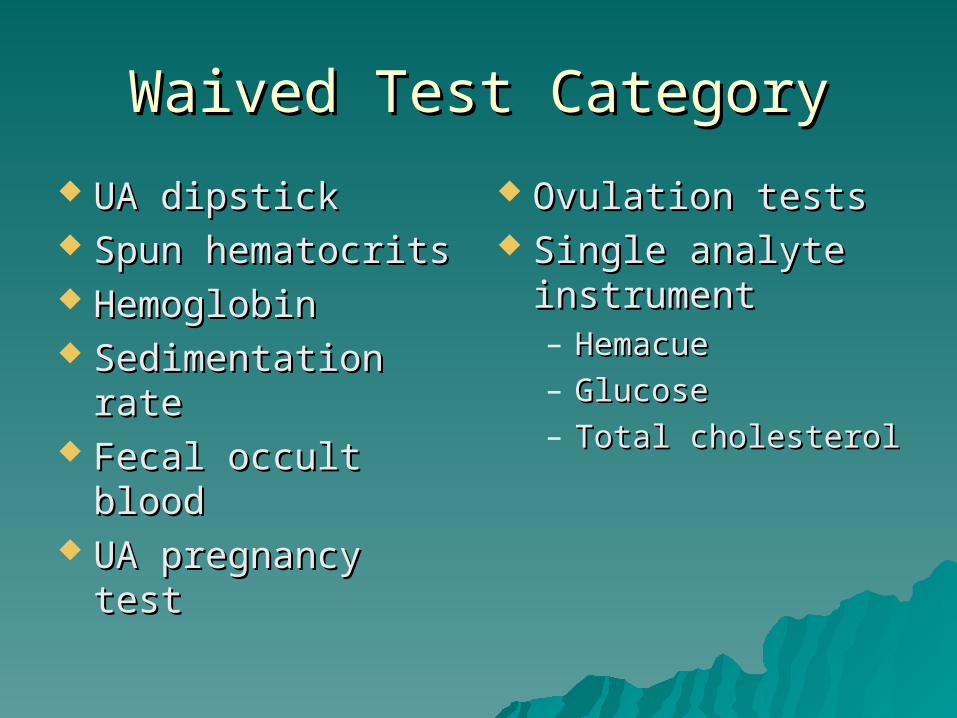
Waived Test CategoryWaived Test Category
UA dipstickUA dipstick Spun hematocritsSpun hematocrits HemoglobinHemoglobin Sedimentation rateSedimentation rate Fecal occult bloodFecal occult blood UA pregnancy testUA pregnancy test
Ovulation testsOvulation tests Single analyte Single analyte
instrumentinstrument– HemacueHemacue– GlucoseGlucose– Total cholesterolTotal cholesterol
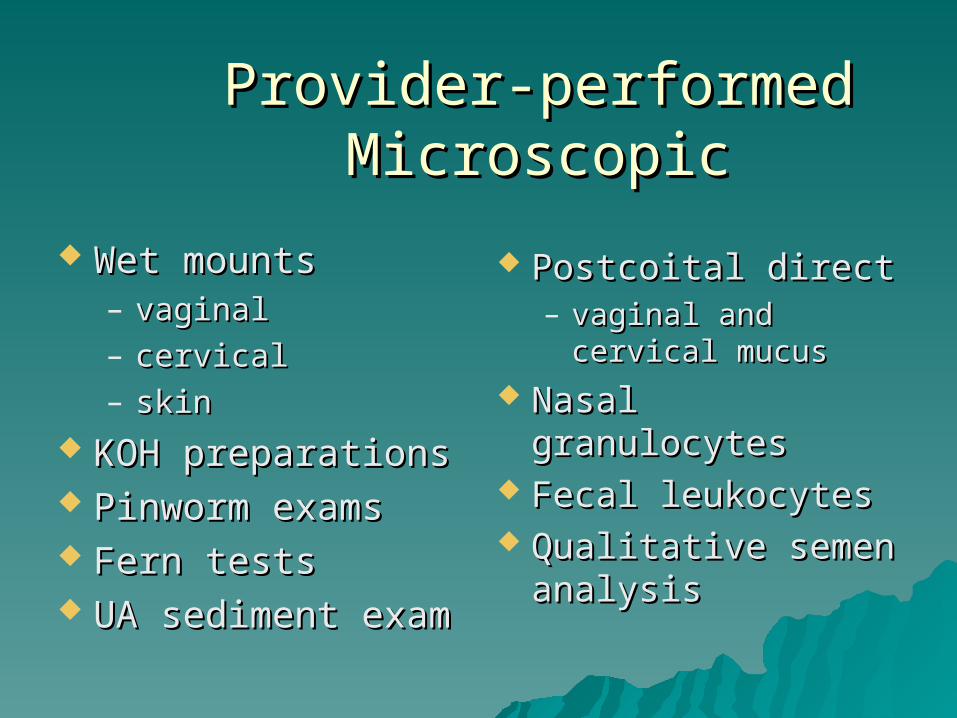
Provider-performed Provider-performed MicroscopicMicroscopic
Wet mountsWet mounts– vaginalvaginal– cervicalcervical– skinskin
KOH preparationsKOH preparations Pinworm examsPinworm exams Fern testsFern tests UA sediment examUA sediment exam
Postcoital directPostcoital direct– vaginal and cervical vaginal and cervical
mucusmucus Nasal granulocytesNasal granulocytes Fecal leukocytesFecal leukocytes Qualitative semen Qualitative semen
analysisanalysis
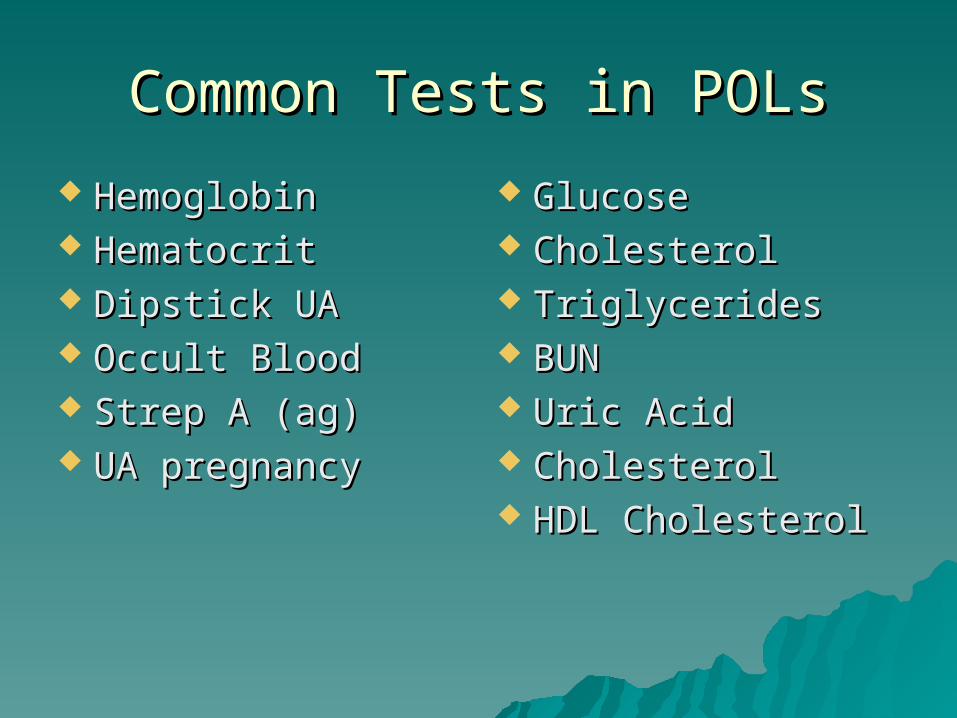
Common Tests in POLsCommon Tests in POLs
HemoglobinHemoglobin HematocritHematocrit Dipstick UADipstick UA Occult BloodOccult Blood Strep A (ag)Strep A (ag) UA pregnancyUA pregnancy
GlucoseGlucose CholesterolCholesterol TriglyceridesTriglycerides BUNBUN Uric AcidUric Acid CholesterolCholesterol HDL CholesterolHDL Cholesterol

Quality AssuranceQuality Assurance
Vicki S. Freeman, Ph.D.Vicki S. Freeman, Ph.D.

Quality Assurance ProgramQuality Assurance Program
Written laboratory procedure manualWritten laboratory procedure manual Specimen collection and Specimen collection and
identificationidentification MethodologiesMethodologies Reference RangesReference Ranges Quality controlQuality control Preventive maintenancePreventive maintenance Record keepingRecord keeping
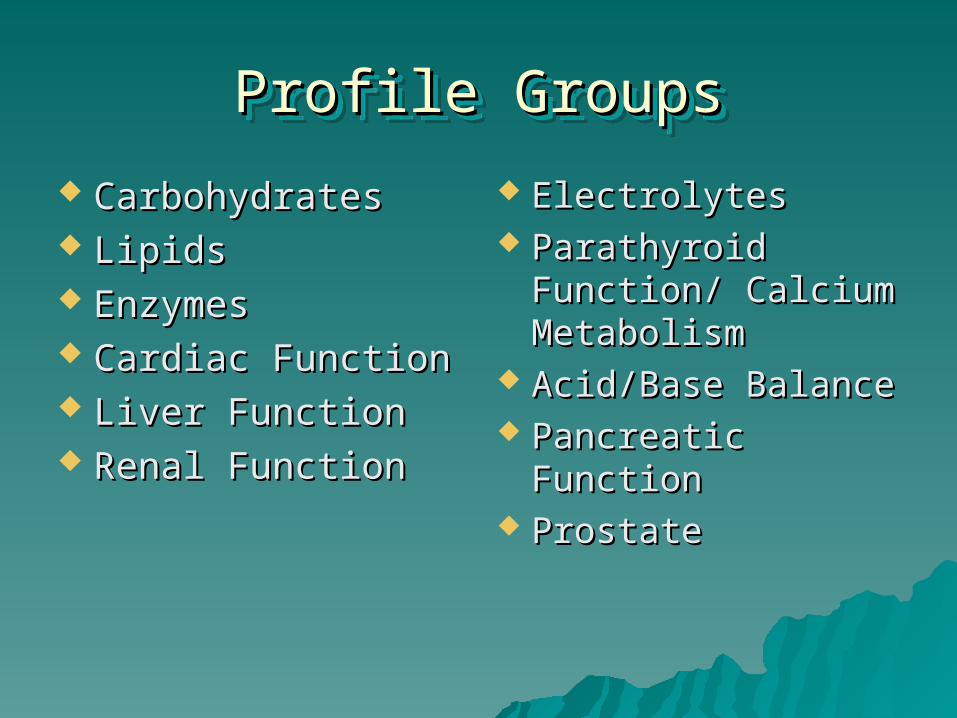
Profile GroupsProfile GroupsProfile GroupsProfile Groups
CarbohydratesCarbohydrates LipidsLipids EnzymesEnzymes Cardiac FunctionCardiac Function Liver FunctionLiver Function Renal FunctionRenal Function
Electrolytes Electrolytes Parathyroid Parathyroid
Function/ Calcium Function/ Calcium MetabolismMetabolism
Acid/Base BalanceAcid/Base Balance Pancreatic Pancreatic
FunctionFunction ProstateProstate
CarbohydratesCarbohydratesCarbohydratesCarbohydrates
Hyper and HypoglycemiaHyper and Hypoglycemia
Classes of HyperglycemiaClasses of HyperglycemiaClasses of HyperglycemiaClasses of Hyperglycemia
Diabetes MellitusDiabetes Mellitus Impaired Glucose ToleranceImpaired Glucose Tolerance Gestational DiabetesGestational Diabetes
DiabetesDiabetesDiabetesDiabetes
A syndrome characterized by A syndrome characterized by inappropriate hyperglycemia with inappropriate hyperglycemia with chronic microvascular complications.chronic microvascular complications.
Upper limit of 100 mg/dl on the FPG Upper limit of 100 mg/dl on the FPG as the upper limit of normal blood as the upper limit of normal blood glucoseglucose
Diabetes MellitusDiabetes MellitusDiabetes MellitusDiabetes Mellitus
TypesTypes– Type 1 Type 1 (Type I)(Type I) -Insulin Dependent -Insulin Dependent
Diabetes Mellitus Diabetes Mellitus IDDMIDDM
– Type 2 Type 2 (Type II)(Type II) -Non Insulin -Non Insulin Dependent Diabetes MellitusDependent Diabetes MellitusNIIDMNIIDM
– Other Types - SecondaryOther Types - Secondary
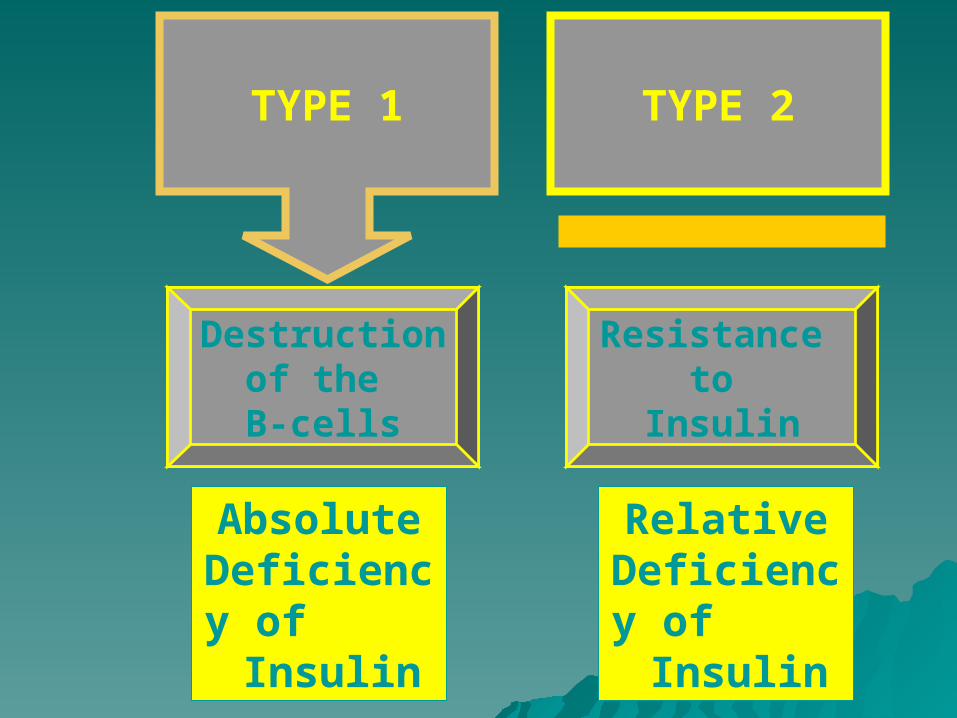
TYPE 1
Absolute Deficiency of
Insulin
Relative Deficiency of
Insulin
TYPE 2
Destruction of the B-cells
Resistance to
Insulin
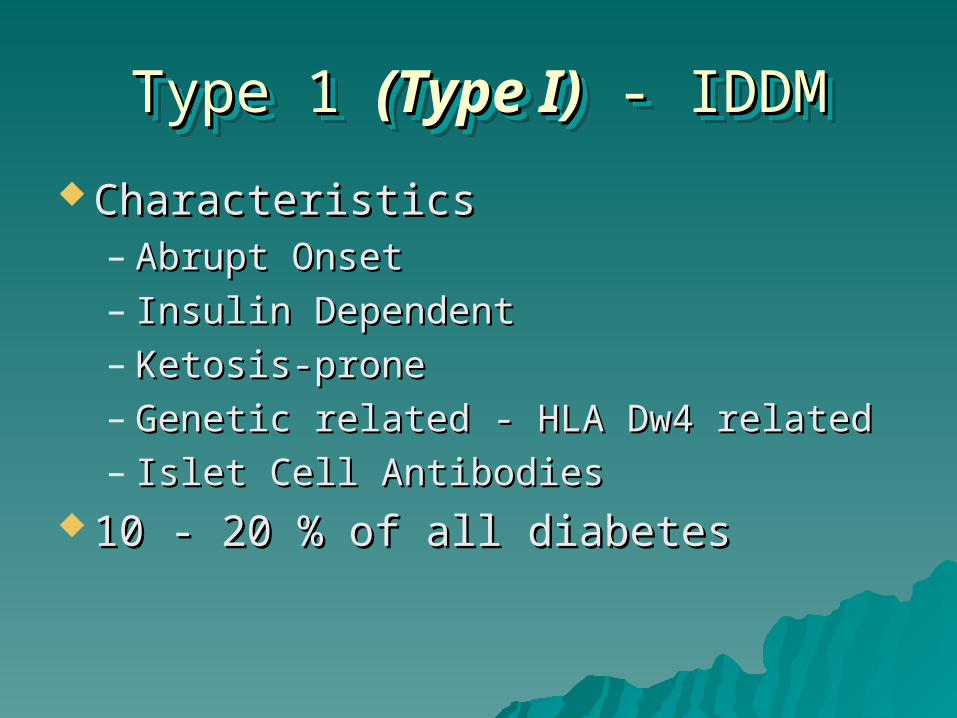
Type 1 Type 1 (Type I)(Type I) - IDDM - IDDMType 1 Type 1 (Type I)(Type I) - IDDM - IDDM
CharacteristicsCharacteristics– Abrupt OnsetAbrupt Onset– Insulin DependentInsulin Dependent– Ketosis-proneKetosis-prone– Genetic related - HLA Dw4 relatedGenetic related - HLA Dw4 related– Islet Cell AntibodiesIslet Cell Antibodies
10 - 20 % of all diabetes10 - 20 % of all diabetes
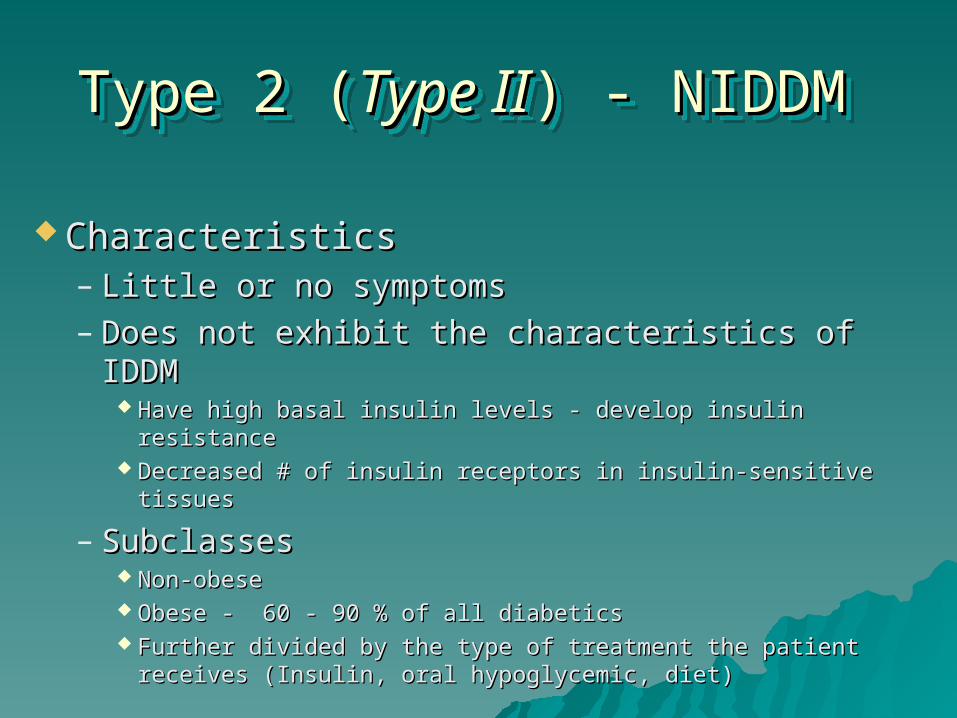
Type 2 (Type 2 (Type IIType II) - NIDDM ) - NIDDM Type 2 (Type 2 (Type IIType II) - NIDDM ) - NIDDM
CharacteristicsCharacteristics– Little or no symptomsLittle or no symptoms– Does not exhibit the characteristics of IDDMDoes not exhibit the characteristics of IDDM
Have high basal insulin levels - develop insulin resistanceHave high basal insulin levels - develop insulin resistance Decreased # of insulin receptors in insulin-sensitive Decreased # of insulin receptors in insulin-sensitive
tissuestissues
– SubclassesSubclasses Non-obeseNon-obese Obese - 60 - 90 % of all diabeticsObese - 60 - 90 % of all diabetics Further divided by the type of treatment the patient Further divided by the type of treatment the patient
receives (Insulin, oral hypoglycemic, diet)receives (Insulin, oral hypoglycemic, diet)
Other Types - SecondaryOther Types - SecondaryOther Types - SecondaryOther Types - Secondary
Destroyed pancreasDestroyed pancreas Pituitary HyperfunctionPituitary Hyperfunction Cushings DiseaseCushings Disease
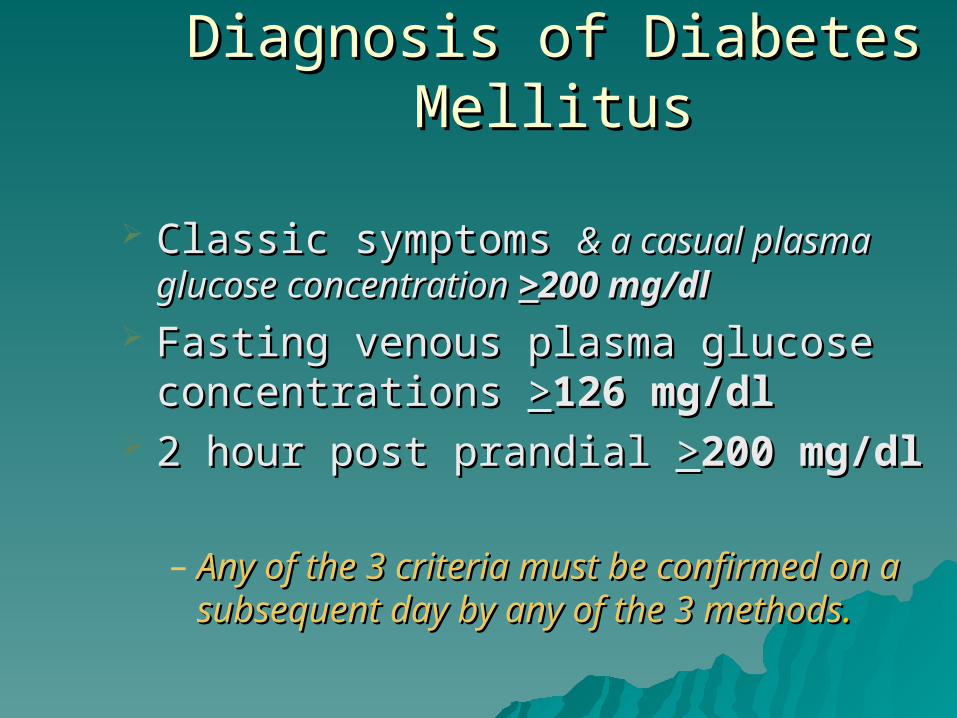
Diagnosis of Diabetes Diagnosis of Diabetes MellitusMellitus
Classic symptoms Classic symptoms & a casual plasma & a casual plasma glucose concentrationglucose concentration >>200 mg/dl200 mg/dl
Fasting venous plasma glucose Fasting venous plasma glucose concentrations concentrations >>126 mg/dl126 mg/dl
2 hour post prandial 2 hour post prandial >>200 mg/dl200 mg/dl
– Any of the 3 criteria must be confirmed Any of the 3 criteria must be confirmed on a subsequent day by any of the 3 on a subsequent day by any of the 3 methodsmethods..
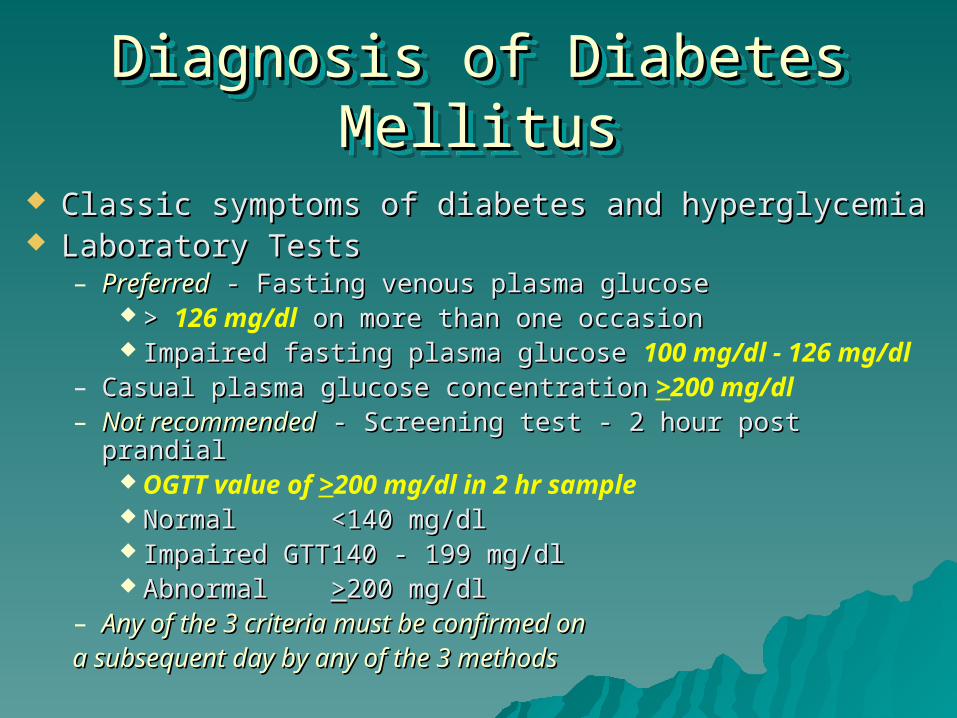
Diagnosis of Diabetes MellitusDiagnosis of Diabetes MellitusDiagnosis of Diabetes MellitusDiagnosis of Diabetes Mellitus
Classic symptoms of diabetes and hyperglycemiaClassic symptoms of diabetes and hyperglycemia Laboratory TestsLaboratory Tests
– PreferredPreferred - Fasting venous plasma glucose - Fasting venous plasma glucose > > 126 mg/dl on more than one occasion on more than one occasion Impaired fasting plasma glucoseImpaired fasting plasma glucose 100 mg/dl - 126 mg/dl
– Casual plasma glucose concentrationCasual plasma glucose concentration >200 mg/dl– Not recommendedNot recommended - Screening test - 2 hour post prandial - Screening test - 2 hour post prandial
OGTT value of >200 mg/dl in 2 hr sample NormalNormal <140 mg/dl<140 mg/dl Impaired GTTImpaired GTT 140 - 199 mg/dl140 - 199 mg/dl AbnormalAbnormal >>200 mg/dl200 mg/dl
– Any of the 3 criteria must be confirmed on Any of the 3 criteria must be confirmed on a subsequent day by any of the 3 methodsa subsequent day by any of the 3 methods
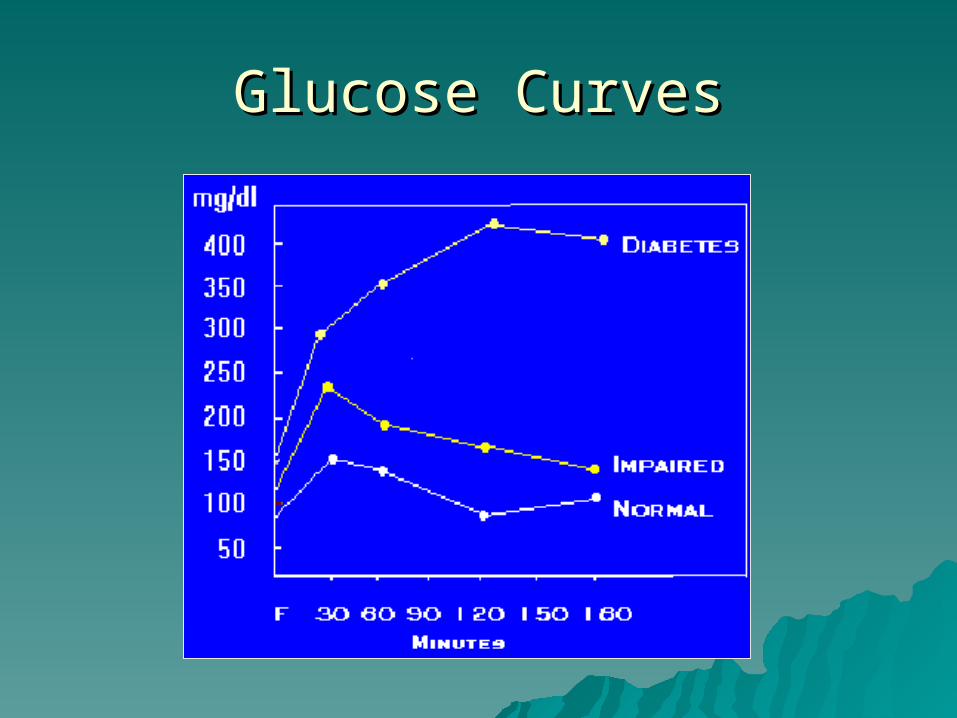
Glucose CurvesGlucose Curves
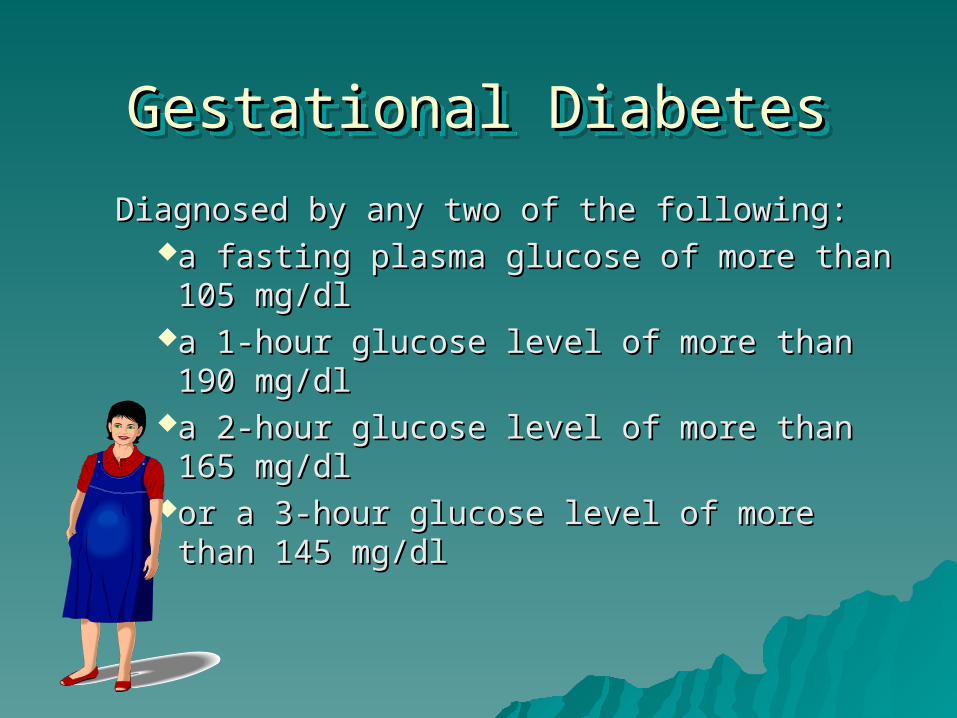
Diagnosed by any two of the following: Diagnosed by any two of the following: a fasting plasma glucose of more than 105 a fasting plasma glucose of more than 105
mg/dlmg/dla 1-hour glucose level of more than 190 a 1-hour glucose level of more than 190
mg/dlmg/dla 2-hour glucose level of more than 165 a 2-hour glucose level of more than 165
mg/dlmg/dlor a 3-hour glucose level of more than 145 or a 3-hour glucose level of more than 145
mg/dlmg/dl
Gestational Diabetes Gestational Diabetes Gestational Diabetes Gestational Diabetes
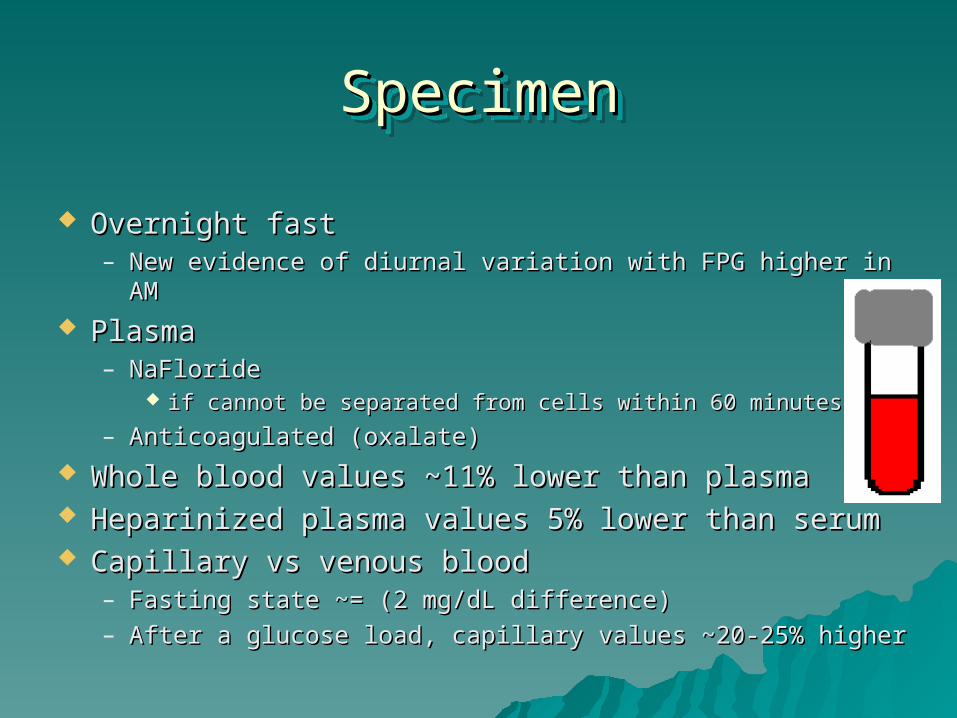
Overnight fastOvernight fast– New evidence of diurnal variation with FPG higher in AMNew evidence of diurnal variation with FPG higher in AM
PlasmaPlasma– NaFlorideNaFloride
if cannot be separated from cells within 60 minutesif cannot be separated from cells within 60 minutes
– Anticoagulated (oxalate)Anticoagulated (oxalate) Whole blood values ~11% lower than plasmaWhole blood values ~11% lower than plasma Heparinized plasma values 5% lower than serumHeparinized plasma values 5% lower than serum Capillary vs venous blood Capillary vs venous blood
– Fasting state ~= (2 mg/dL difference)Fasting state ~= (2 mg/dL difference)– After a glucose load, capillary values ~20-25% higherAfter a glucose load, capillary values ~20-25% higher
SpecimenSpecimenSpecimenSpecimen
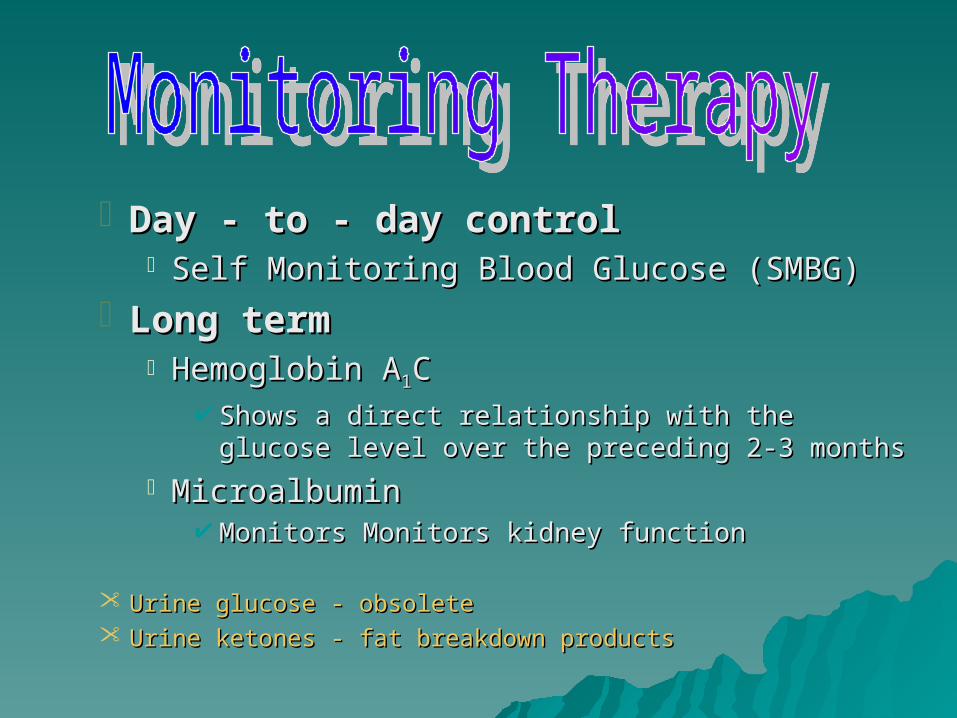
Day - to - day controlDay - to - day control Self Monitoring Blood Glucose (SMBG)Self Monitoring Blood Glucose (SMBG)
Long termLong term Hemoglobin AHemoglobin A11CC
Shows a direct relationship with the glucose level Shows a direct relationship with the glucose level over the preceding 2-3 monthsover the preceding 2-3 months
MicroalbuminMicroalbumin Monitors Monitors kidney functionMonitors Monitors kidney function
Urine glucose - obsoleteUrine glucose - obsolete Urine ketones - fat breakdown productsUrine ketones - fat breakdown products
Glycosylated (glycated) Hemoglobin Glycosylated (glycated) Hemoglobin (GHb or HgbA(GHb or HgbA1c1c))
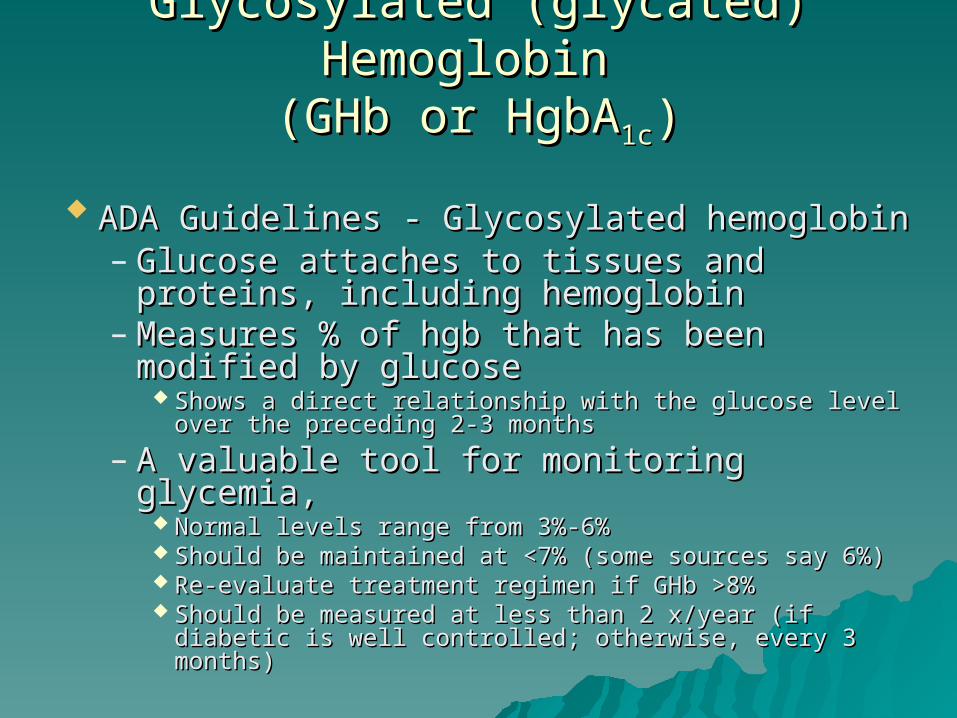
ADA Guidelines - Glycosylated hemoglobinADA Guidelines - Glycosylated hemoglobin – Glucose attaches to tissues and proteins, Glucose attaches to tissues and proteins,
including hemoglobinincluding hemoglobin– Measures % of hgb that has been Measures % of hgb that has been
modified by glucosemodified by glucose Shows a direct relationship with the glucose level over Shows a direct relationship with the glucose level over
the preceding 2-3 monthsthe preceding 2-3 months
– A valuable tool for monitoring glycemia,A valuable tool for monitoring glycemia, Normal levels range from 3%-6%Normal levels range from 3%-6% Should be maintained at <7% (some sources say 6%)Should be maintained at <7% (some sources say 6%) Re-evaluate treatment regimen if GHb >8%Re-evaluate treatment regimen if GHb >8% Should be measured at less than 2 x/year (if diabetic is Should be measured at less than 2 x/year (if diabetic is
well controlled; otherwise, every 3 months)well controlled; otherwise, every 3 months)
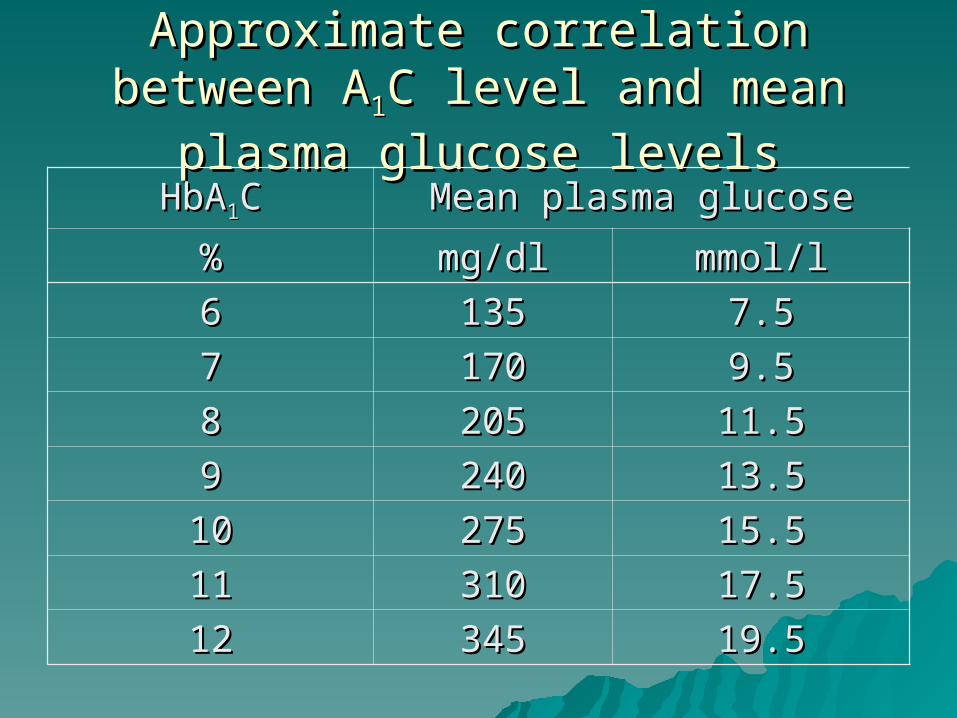
Approximate correlation between AApproximate correlation between A11C C
level and mean plasma glucose levelslevel and mean plasma glucose levels
HbAHbA11CC Mean plasma glucoseMean plasma glucose
%% mg/dlmg/dl mmol/lmmol/l
66 135135 7.57.5
77 170170 9.59.5
88 205205 11.511.5
99 240240 13.513.5
1010 275275 15.515.5
1111 310310 17.517.5
1212 345345 19.519.5
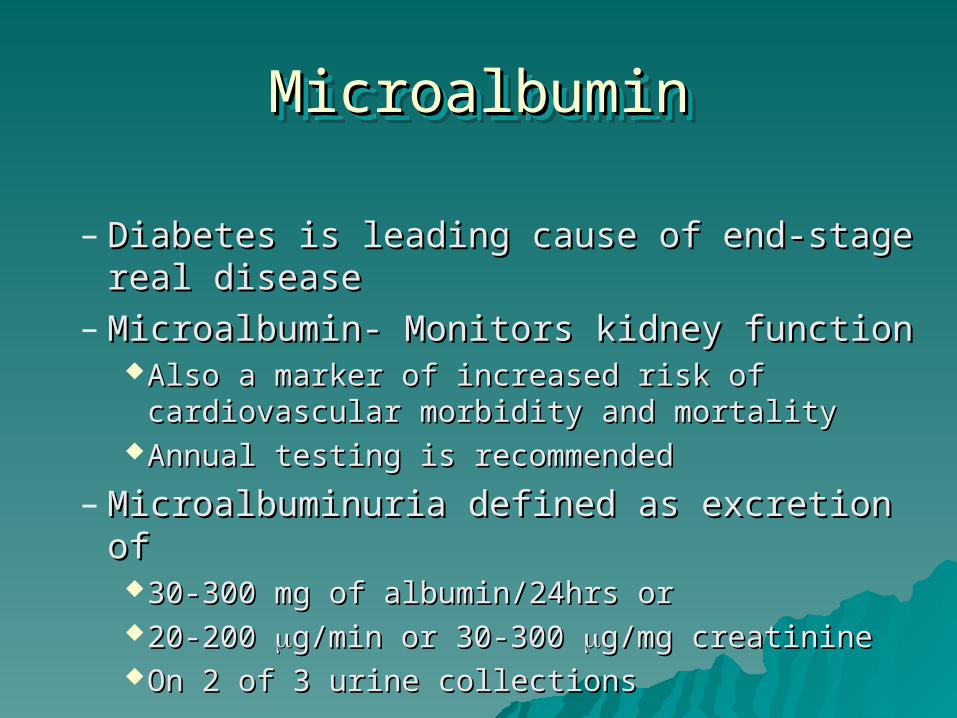
MicroalbuminMicroalbuminMicroalbuminMicroalbumin
– Diabetes is leading cause of end-stage real Diabetes is leading cause of end-stage real diseasedisease
– Microalbumin- Monitors kidney functionMicroalbumin- Monitors kidney functionAlso a marker of increased risk of cardiovascular Also a marker of increased risk of cardiovascular
morbidity and mortalitymorbidity and mortalityAnnual testing is recommendedAnnual testing is recommended
– Microalbuminuria defined as excretion of Microalbuminuria defined as excretion of 30-300 mg of albumin/24hrs or30-300 mg of albumin/24hrs or20-200 20-200 g/min or 30-300 g/min or 30-300 g/mg creatinineg/mg creatinineOn 2 of 3 urine collectionsOn 2 of 3 urine collections
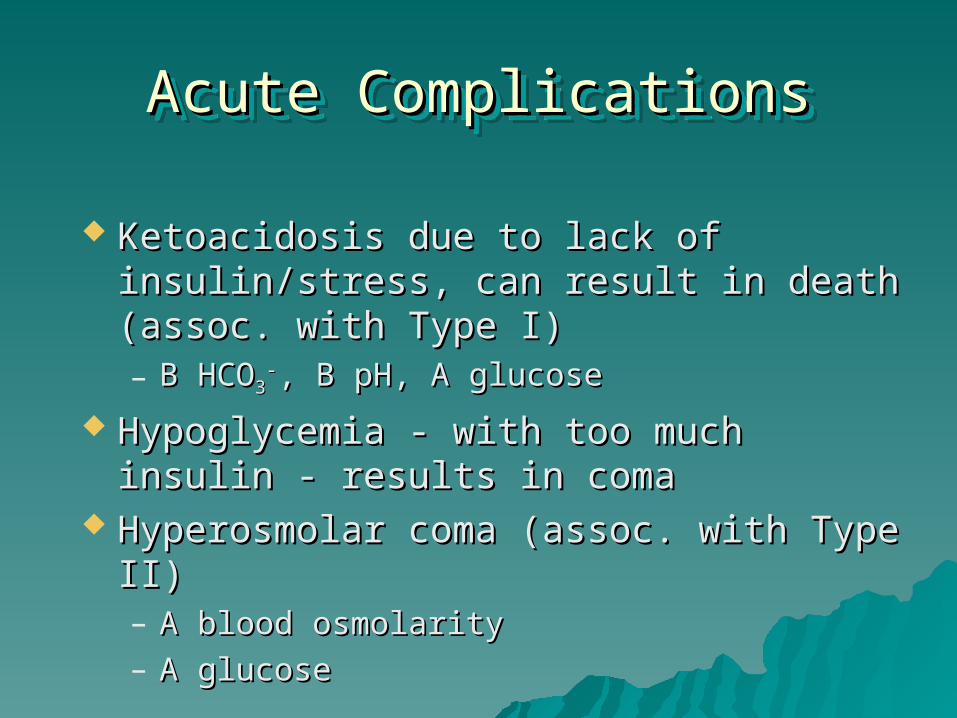
Acute ComplicationsAcute ComplicationsAcute ComplicationsAcute Complications
Ketoacidosis due to lack of insulin/stress, Ketoacidosis due to lack of insulin/stress, can result in death (assoc. with Type I)can result in death (assoc. with Type I)– B B HCOHCO33
--, , BB pH, pH, AA glucose glucose
Hypoglycemia - with too much insulin - Hypoglycemia - with too much insulin - results in comaresults in coma
Hyperosmolar coma (assoc. with Type II)Hyperosmolar coma (assoc. with Type II)– AA blood osmolarity blood osmolarity– AA glucose glucose
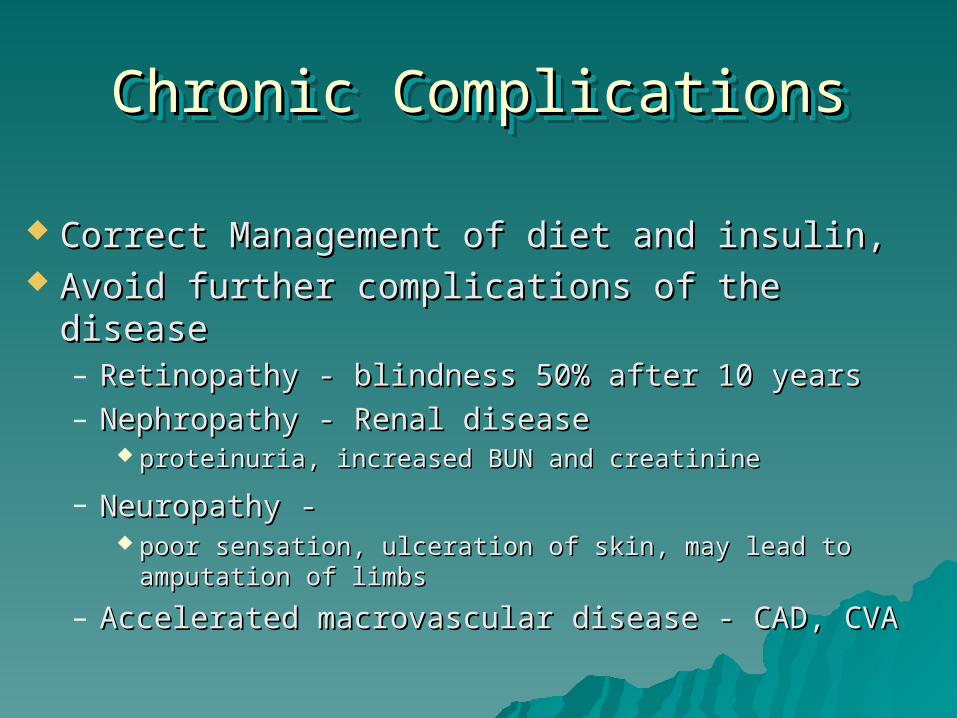
Chronic ComplicationsChronic ComplicationsChronic ComplicationsChronic Complications
Correct Management of diet and insulin,Correct Management of diet and insulin, Avoid further complications of the diseaseAvoid further complications of the disease
– Retinopathy - blindness 50% after 10 yearsRetinopathy - blindness 50% after 10 years– Nephropathy - Renal diseaseNephropathy - Renal disease
proteinuria, increased BUN and creatinineproteinuria, increased BUN and creatinine
– Neuropathy -Neuropathy - poor sensation, ulceration of skin, may lead to poor sensation, ulceration of skin, may lead to
amputation of limbsamputation of limbs
– Accelerated macrovascular disease - CAD, CVAAccelerated macrovascular disease - CAD, CVA
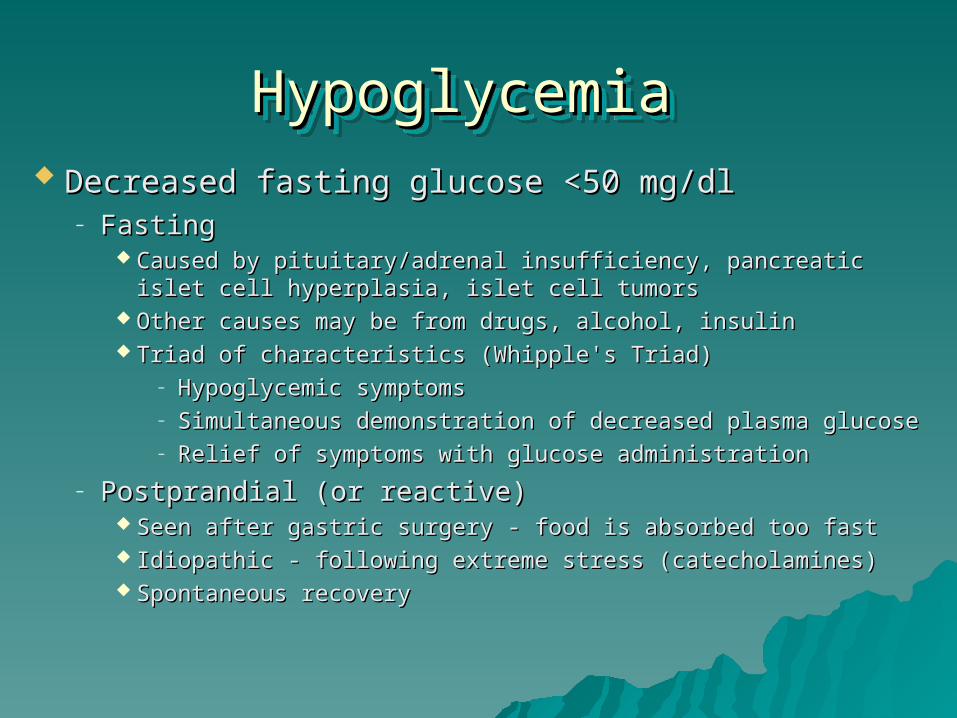
Hypoglycemia Hypoglycemia Hypoglycemia Hypoglycemia Decreased fasting glucose <50 mg/dlDecreased fasting glucose <50 mg/dl
– FastingFasting Caused by pituitary/adrenal insufficiency, pancreatic islet Caused by pituitary/adrenal insufficiency, pancreatic islet
cell hyperplasia, islet cell tumorscell hyperplasia, islet cell tumors Other causes may be from drugs, alcohol, insulinOther causes may be from drugs, alcohol, insulin Triad of characteristics (Whipple's Triad)Triad of characteristics (Whipple's Triad)
– Hypoglycemic symptomsHypoglycemic symptoms– Simultaneous demonstration of decreased plasma Simultaneous demonstration of decreased plasma
glucoseglucose– Relief of symptoms with glucose administrationRelief of symptoms with glucose administration
– Postprandial (or reactive)Postprandial (or reactive) Seen after gastric surgery - food is absorbed too fastSeen after gastric surgery - food is absorbed too fast Idiopathic - following extreme stress (catecholamines)Idiopathic - following extreme stress (catecholamines) Spontaneous recoverySpontaneous recovery
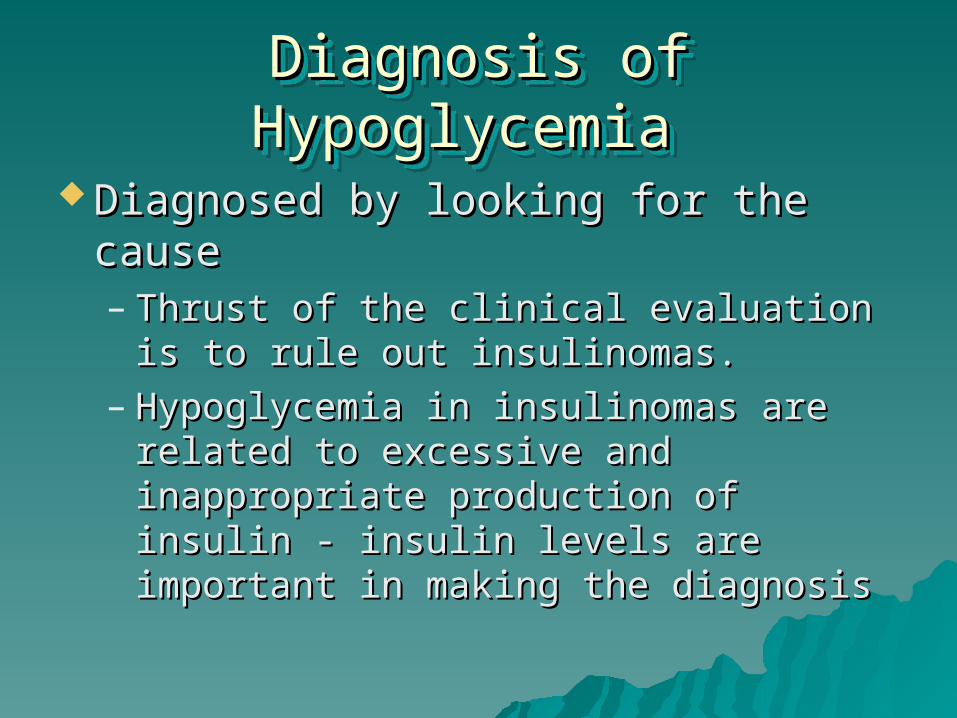
Diagnosis of Hypoglycemia Diagnosis of Hypoglycemia Diagnosis of Hypoglycemia Diagnosis of Hypoglycemia
Diagnosed by looking for the causeDiagnosed by looking for the cause– Thrust of the clinical evaluation is to rule Thrust of the clinical evaluation is to rule
out insulinomas. out insulinomas. – Hypoglycemia in insulinomas are related Hypoglycemia in insulinomas are related
to excessive and inappropriate to excessive and inappropriate production of insulin - insulin levels are production of insulin - insulin levels are important in making the diagnosisimportant in making the diagnosis

Diabetes Case Study 1Diabetes Case Study 1
A 40-year-old African American woman A 40-year-old African American woman (nonpregnant) has symptoms (nonpregnant) has symptoms suggestive of diabetes. On two suggestive of diabetes. On two occasions, the fasting plasma occasions, the fasting plasma glucose (FPG) is 130 mg/dL and 135 glucose (FPG) is 130 mg/dL and 135 mg/dL. mg/dL.
What is the next diagnostic or therapeutic What is the next diagnostic or therapeutic step?step?
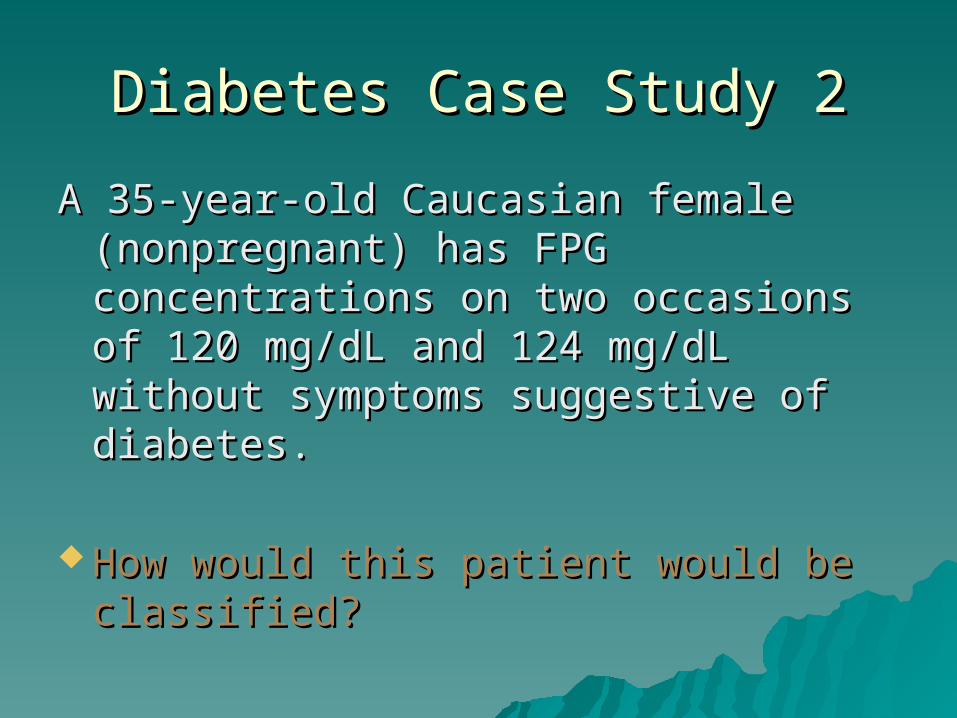
Diabetes Case Study 2Diabetes Case Study 2
A 35-year-old Caucasian female A 35-year-old Caucasian female (nonpregnant) has FPG (nonpregnant) has FPG concentrations on two occasions of concentrations on two occasions of 120 mg/dL and 124 mg/dL without 120 mg/dL and 124 mg/dL without symptoms suggestive of diabetes. symptoms suggestive of diabetes.
How would this patient would be How would this patient would be classified?classified?
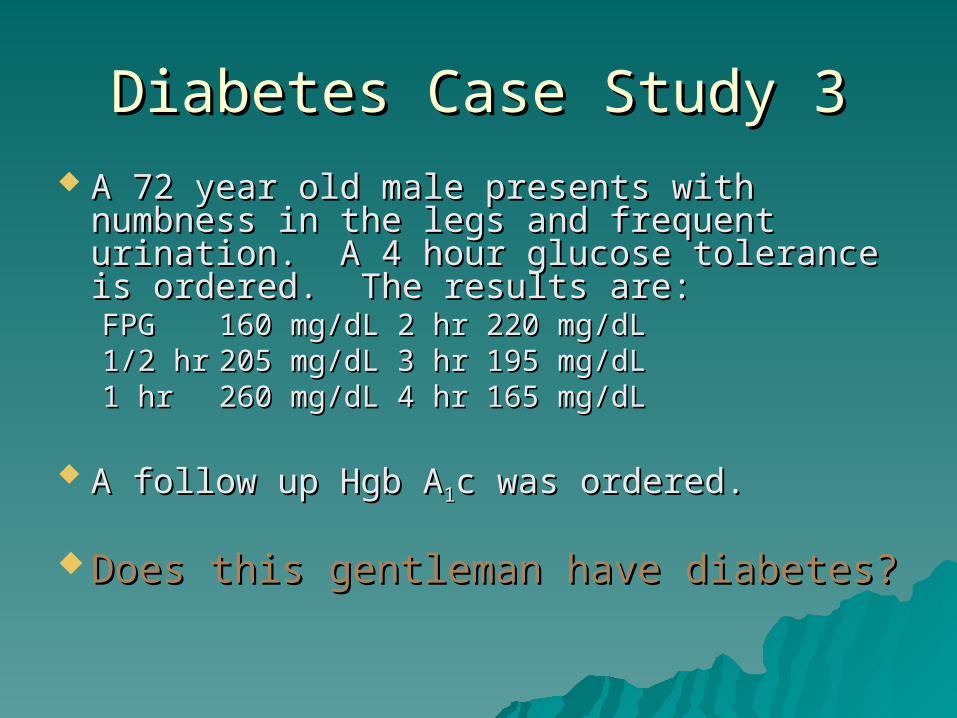
Diabetes Case Study 3Diabetes Case Study 3 A 72 year old male presents with A 72 year old male presents with
numbness in the legs and frequent numbness in the legs and frequent urination. A 4 hour glucose tolerance is urination. A 4 hour glucose tolerance is ordered. The results are:ordered. The results are:FPGFPG 160 mg/dL160 mg/dL 2 hr2 hr 220 mg/dL220 mg/dL1/2 hr1/2 hr 205 mg/dL205 mg/dL 3 hr3 hr 195 mg/dL195 mg/dL1 hr1 hr 260 mg/dL260 mg/dL 4 hr4 hr 165 mg/dL165 mg/dL
A follow up Hgb AA follow up Hgb A11c was ordered. c was ordered.
Does this gentleman have diabetes?Does this gentleman have diabetes?
Lipids and Cardiac Lipids and Cardiac RiskRisk
Lipids and Cardiac Lipids and Cardiac RiskRisk
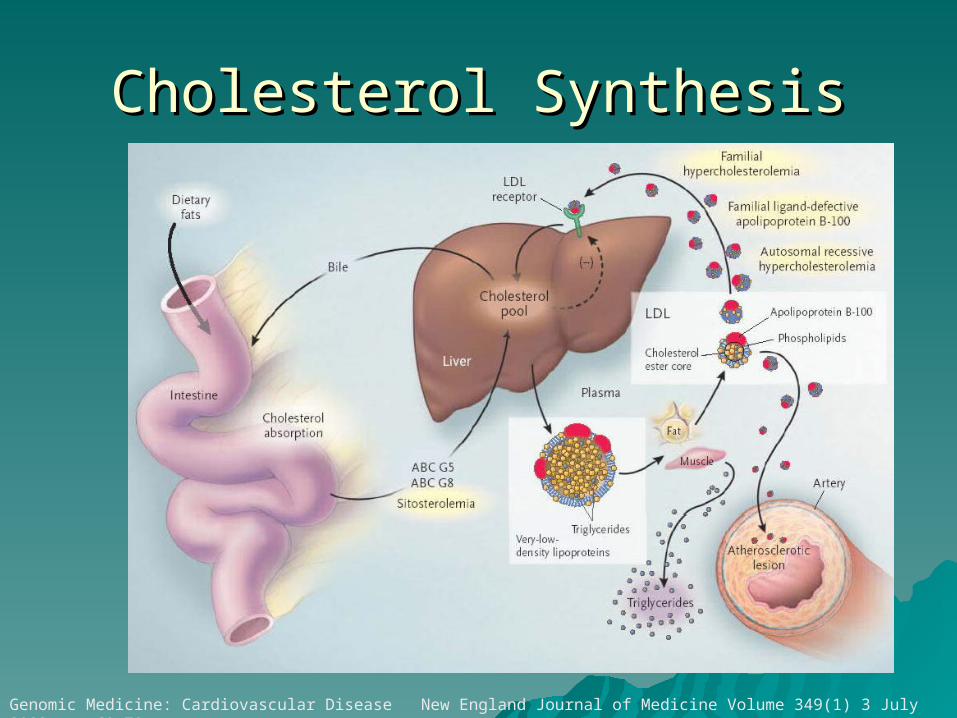
Cholesterol SynthesisCholesterol Synthesis
Genomic Medicine: Cardiovascular Disease New England Journal of Medicine Volume 349(1) 3 July 2003 pp 60-72
LipidLipid Profile and Cardiac RiskProfile and Cardiac RiskLipidLipid Profile and Cardiac RiskProfile and Cardiac Risk
Cardiac Risk FactorsCardiac Risk Factors• Cholesterol, totalCholesterol, total• TriglyceridesTriglycerides• HDL cholesterolHDL cholesterol• LDL cholesterol (calculated vs direct)LDL cholesterol (calculated vs direct)
NCEP Guidelines ATPIIINCEP Guidelines ATPIII – Fasting sample now required for:Fasting sample now required for:
Total cholesterolTotal cholesterol HDL-CHDL-C LDL-CLDL-C TriglyceridesTriglycerides
CholesterolCholesterolCholesterolCholesterol
Dependent on many factorsDependent on many factors– genetics, age, sex, diet, physical genetics, age, sex, diet, physical
activity, hormonesactivity, hormones American Heart Association < 200 American Heart Association < 200
mg/dlmg/dl MeasurementMeasurement
– Enzyme method most commonEnzyme method most common
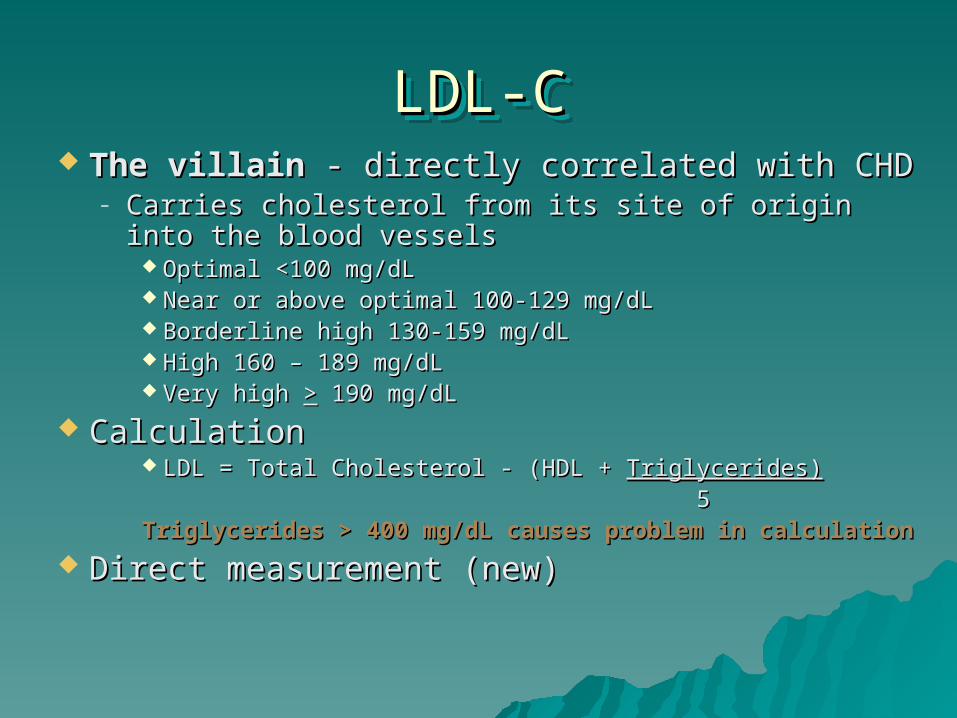
LDL-CLDL-CLDL-CLDL-C The villainThe villain - directly correlated with CHD - directly correlated with CHD
– Carries cholesterol from its site of origin into the blood Carries cholesterol from its site of origin into the blood vesselsvessels
Optimal <100 mg/dLOptimal <100 mg/dL Near or above optimal 100-129 mg/dLNear or above optimal 100-129 mg/dL Borderline high 130-159 mg/dLBorderline high 130-159 mg/dL High 160 – 189 mg/dLHigh 160 – 189 mg/dL Very high Very high >> 190 mg/dL 190 mg/dL
CalculationCalculation LDL = Total Cholesterol - (HDL + LDL = Total Cholesterol - (HDL + Triglycerides)Triglycerides)
55Triglycerides > 400 mg/dL causes problem in calculationTriglycerides > 400 mg/dL causes problem in calculation
Direct measurement (new)Direct measurement (new)
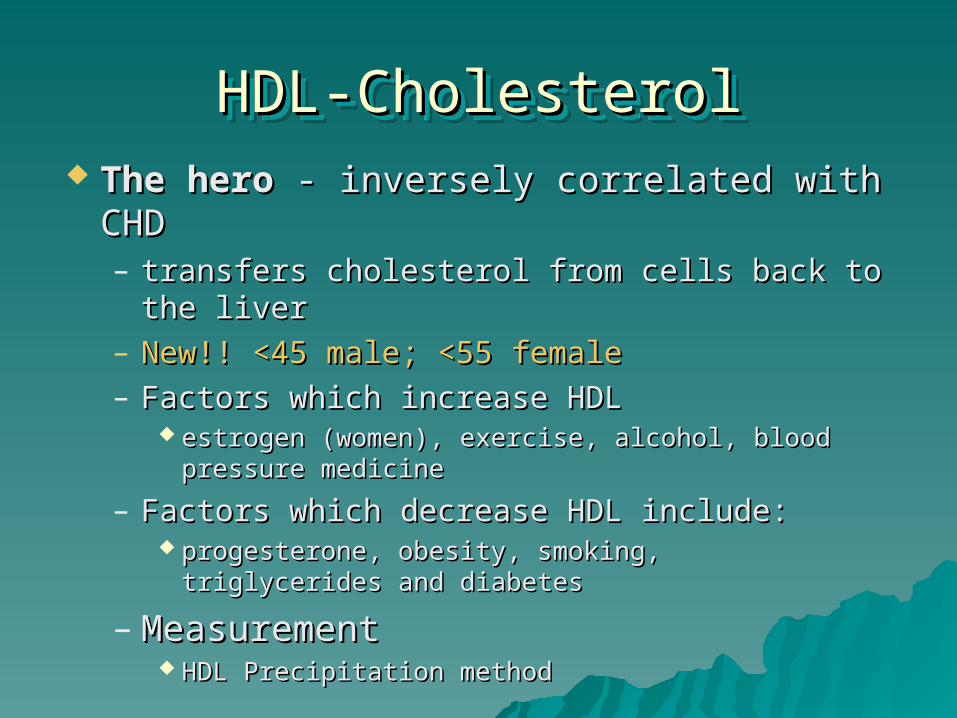
HDL-CholesterolHDL-CholesterolHDL-CholesterolHDL-Cholesterol The heroThe hero - inversely correlated with CHD - inversely correlated with CHD
– transfers cholesterol from cells back to the transfers cholesterol from cells back to the liverliver
– New!! <45 male; <55 femaleNew!! <45 male; <55 female– Factors which increase HDLFactors which increase HDL
estrogen (women), exercise, alcohol, blood pressure estrogen (women), exercise, alcohol, blood pressure medicinemedicine
– Factors which decrease HDL include: Factors which decrease HDL include: progesterone, obesity, smoking, triglycerides and progesterone, obesity, smoking, triglycerides and
diabetesdiabetes
– MeasurementMeasurement HDL Precipitation methodHDL Precipitation method
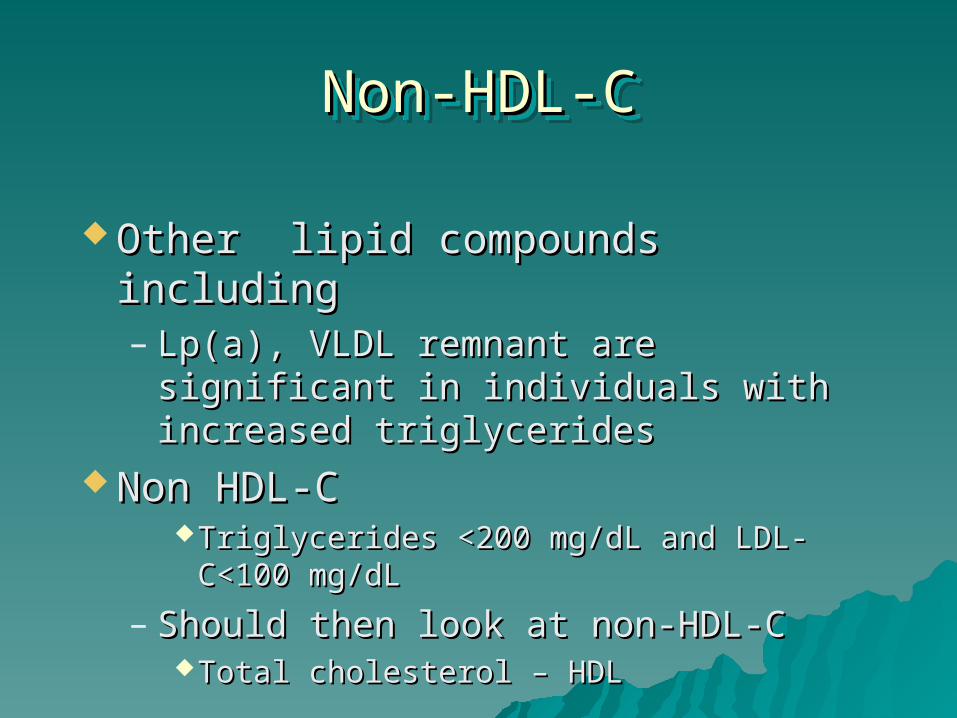
Non-HDL-CNon-HDL-CNon-HDL-CNon-HDL-C
Other lipid compounds includingOther lipid compounds including– Lp(a), VLDL remnant are significant in Lp(a), VLDL remnant are significant in
individuals with increased individuals with increased triglyceridestriglycerides
Non HDL-CNon HDL-CTriglycerides <200 mg/dL and LDL-Triglycerides <200 mg/dL and LDL-
C<100 mg/dLC<100 mg/dL
– Should then look at non-HDL-CShould then look at non-HDL-CTotal cholesterol – HDLTotal cholesterol – HDL
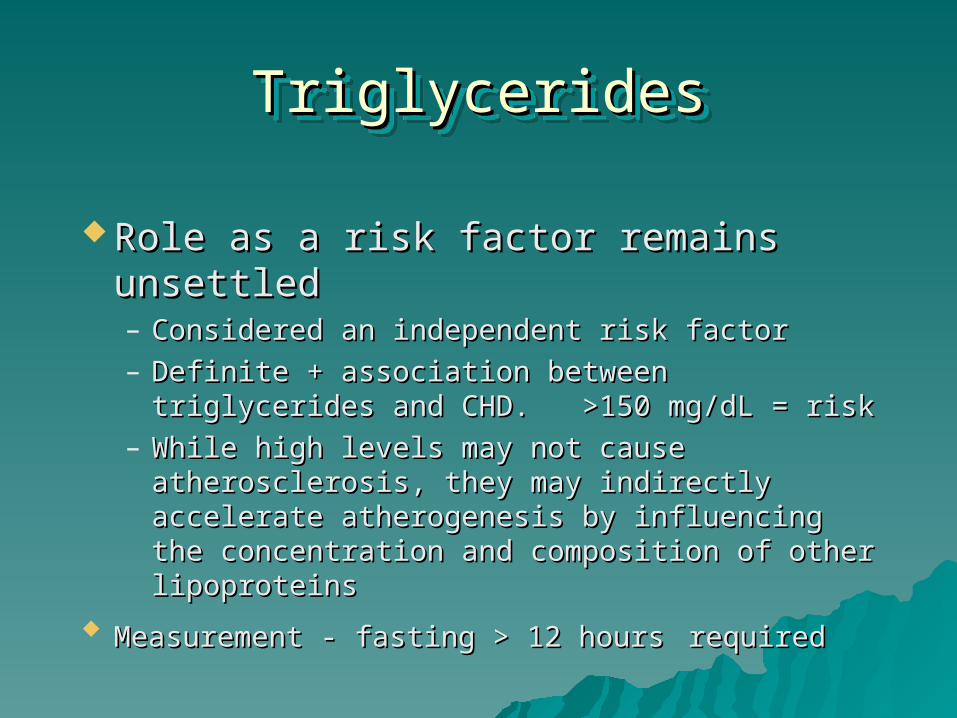
TriglyceridesTriglyceridesTriglyceridesTriglycerides
Role as a risk factor remains Role as a risk factor remains unsettled unsettled – Considered an independent risk factorConsidered an independent risk factor– Definite + association between triglycerides Definite + association between triglycerides
and CHD. >150 mg/dL = riskand CHD. >150 mg/dL = risk– While high levels may not cause While high levels may not cause
atherosclerosis, they may indirectly accelerate atherosclerosis, they may indirectly accelerate atherogenesis by influencing the atherogenesis by influencing the concentration and composition of other concentration and composition of other lipoproteins lipoproteins
Measurement - fasting > 12 hoursMeasurement - fasting > 12 hours requiredrequired
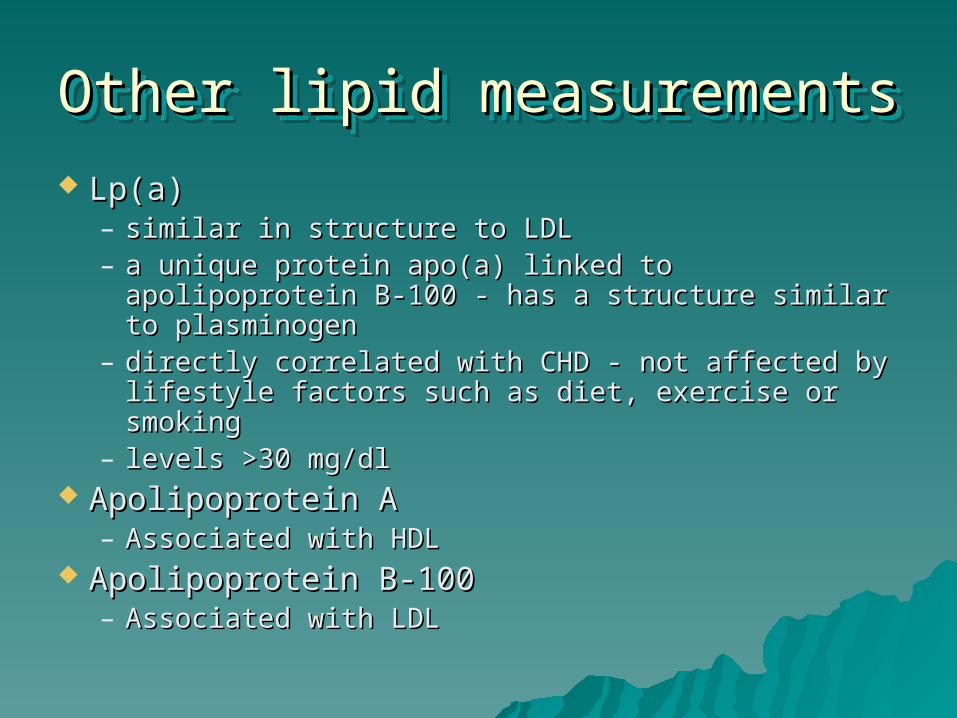
Other lipid measurementsOther lipid measurementsOther lipid measurementsOther lipid measurements
Lp(a)Lp(a)– similar in structure to LDLsimilar in structure to LDL– a unique protein apo(a) linked to apolipoprotein a unique protein apo(a) linked to apolipoprotein
B-100 - has a structure similar to plasminogenB-100 - has a structure similar to plasminogen– directly correlated with CHD - not affected by directly correlated with CHD - not affected by
lifestyle factors such as diet, exercise or smokinglifestyle factors such as diet, exercise or smoking– levels >30 mg/dllevels >30 mg/dl
Apolipoprotein AApolipoprotein A– Associated with HDLAssociated with HDL
Apolipoprotein B-100Apolipoprotein B-100– Associated with LDLAssociated with LDL
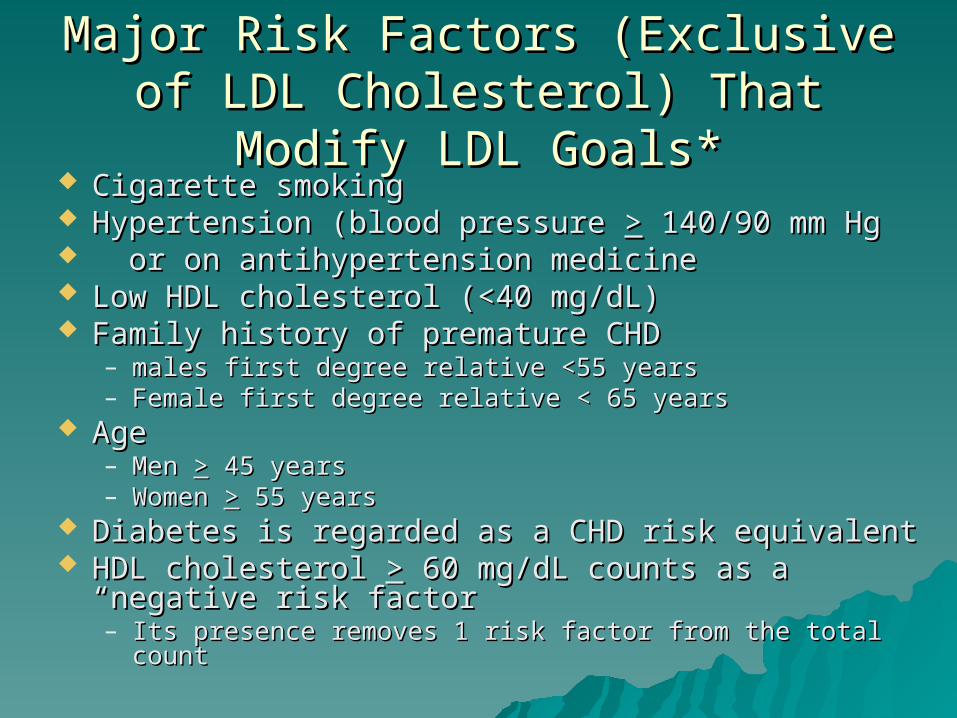
Major Risk Factors (Exclusive of LDL Major Risk Factors (Exclusive of LDL Cholesterol) That Modify LDL Goals*Cholesterol) That Modify LDL Goals*
Cigarette smokingCigarette smoking Hypertension (blood pressure Hypertension (blood pressure >> 140/90 mm Hg 140/90 mm Hg or on antihypertension medicineor on antihypertension medicine Low HDL cholesterol (<40 mg/dL)Low HDL cholesterol (<40 mg/dL) Family history of premature CHDFamily history of premature CHD
– males first degree relative <55 yearsmales first degree relative <55 years– Female first degree relative < 65 yearsFemale first degree relative < 65 years
AgeAge– Men Men >> 45 years 45 years– Women Women >> 55 years 55 years
Diabetes is regarded as a CHD risk equivalentDiabetes is regarded as a CHD risk equivalent HDL cholesterol HDL cholesterol >> 60 mg/dL counts as a “negative 60 mg/dL counts as a “negative
risk factorrisk factor– Its presence removes 1 risk factor from the total countIts presence removes 1 risk factor from the total count
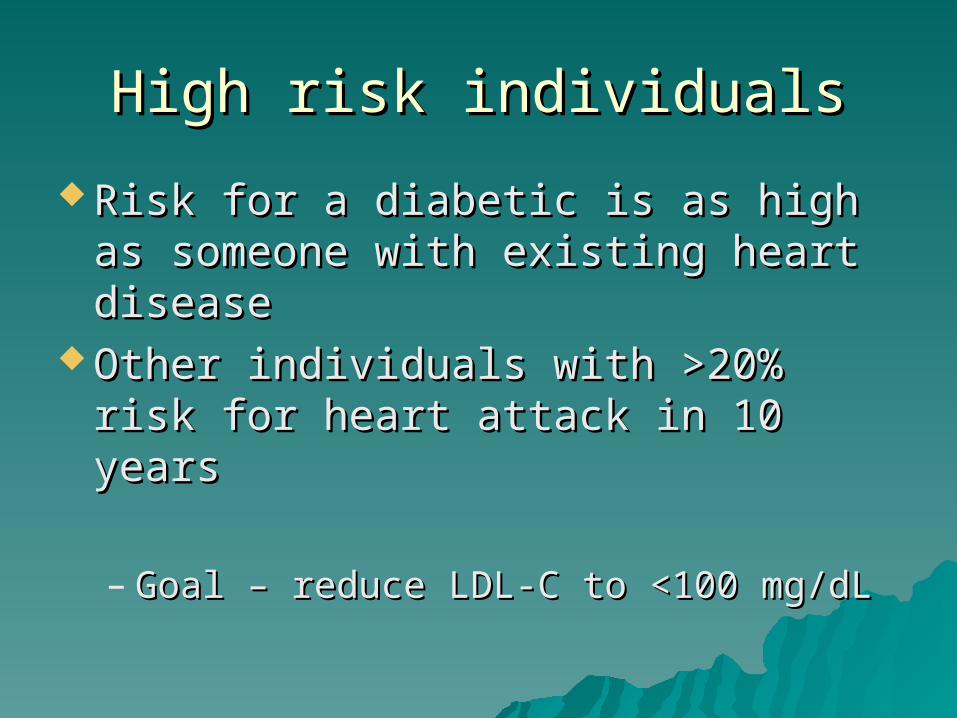
High risk individualsHigh risk individuals
Risk for a diabetic is as high as Risk for a diabetic is as high as someone with existing heart diseasesomeone with existing heart disease
Other individuals with >20% risk for Other individuals with >20% risk for heart attack in 10 yearsheart attack in 10 years
– Goal – reduce LDL-C to <100 mg/dLGoal – reduce LDL-C to <100 mg/dL

Three Categories of Risk That Three Categories of Risk That Modify LDL Cholesterol GoalsModify LDL Cholesterol Goals
Risk CategoryRisk Category LDL Goal LDL Goal (mg/dL)(mg/dL)
NON-HDL NON-HDL Goal Goal (mg/dL)(mg/dL)
CHD and CHD Risk CHD and CHD Risk Equivalents*Equivalents*
<100<100 <130<130
Multiple (2+) risk Multiple (2+) risk factorsfactors
<130<130 <160<160
0-1 risk factor0-1 risk factor <160<160 <190<190
* Diabetes counts as a CHD risk equivalent because it confers a high * Diabetes counts as a CHD risk equivalent because it confers a high risk of new CHD within 10 yearsrisk of new CHD within 10 years
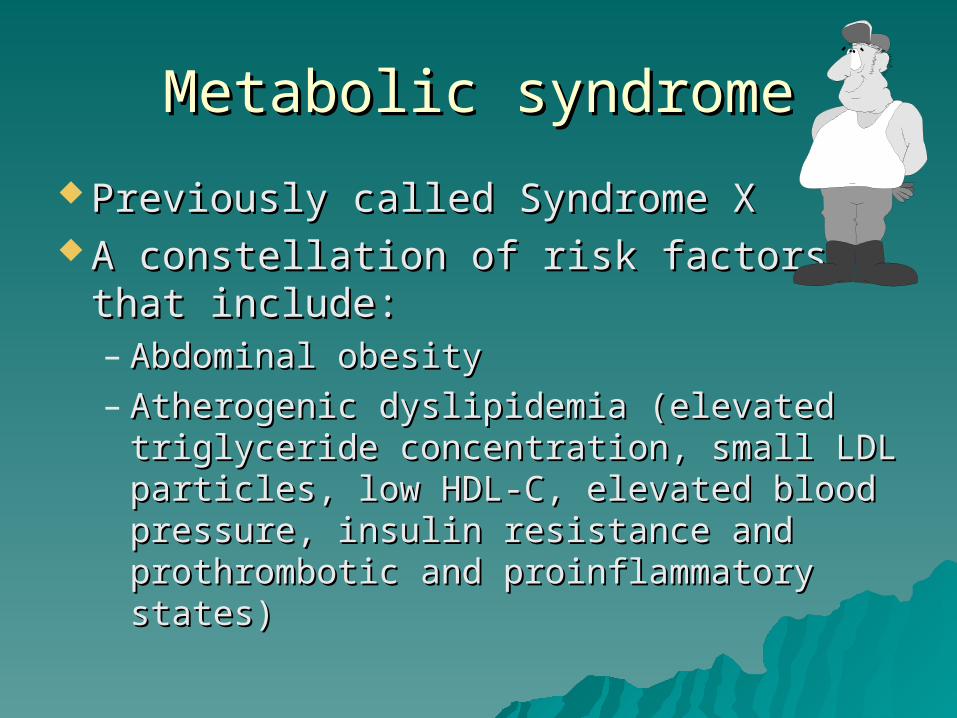
Metabolic syndromeMetabolic syndrome
Previously called Syndrome XPreviously called Syndrome X A constellation of risk factors that A constellation of risk factors that
include:include:– Abdominal obesityAbdominal obesity– Atherogenic dyslipidemia (elevated Atherogenic dyslipidemia (elevated
triglyceride concentration, small LDL triglyceride concentration, small LDL particles, low HDL-C, elevated blood particles, low HDL-C, elevated blood pressure, insulin resistance and pressure, insulin resistance and prothrombotic and proinflammatory prothrombotic and proinflammatory states)states)
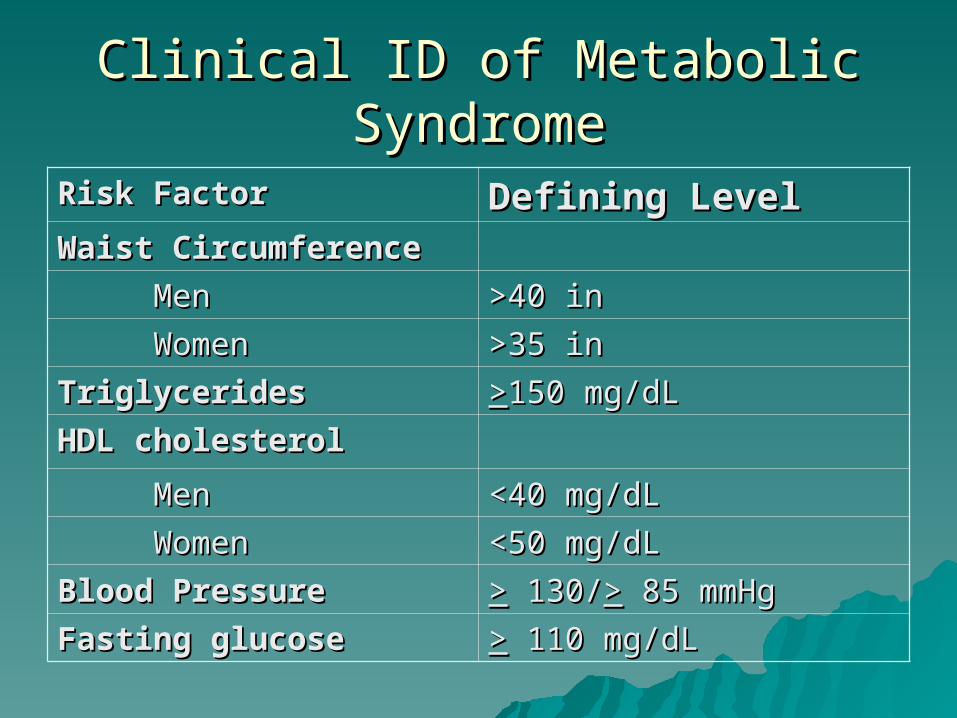
Clinical ID of Metabolic SyndromeClinical ID of Metabolic Syndrome
Risk FactorRisk Factor Defining LevelDefining LevelWaist CircumferenceWaist Circumference
MenMen >40 in>40 in
WomenWomen >35 in>35 in
TriglyceridesTriglycerides >>150 mg/dL150 mg/dL
HDL cholesterolHDL cholesterol
MenMen <40 mg/dL<40 mg/dL
WomenWomen <50 mg/dL<50 mg/dL
Blood PressureBlood Pressure >> 130/ 130/>> 85 mmHg 85 mmHg
Fasting glucoseFasting glucose >> 110 mg/dL 110 mg/dL
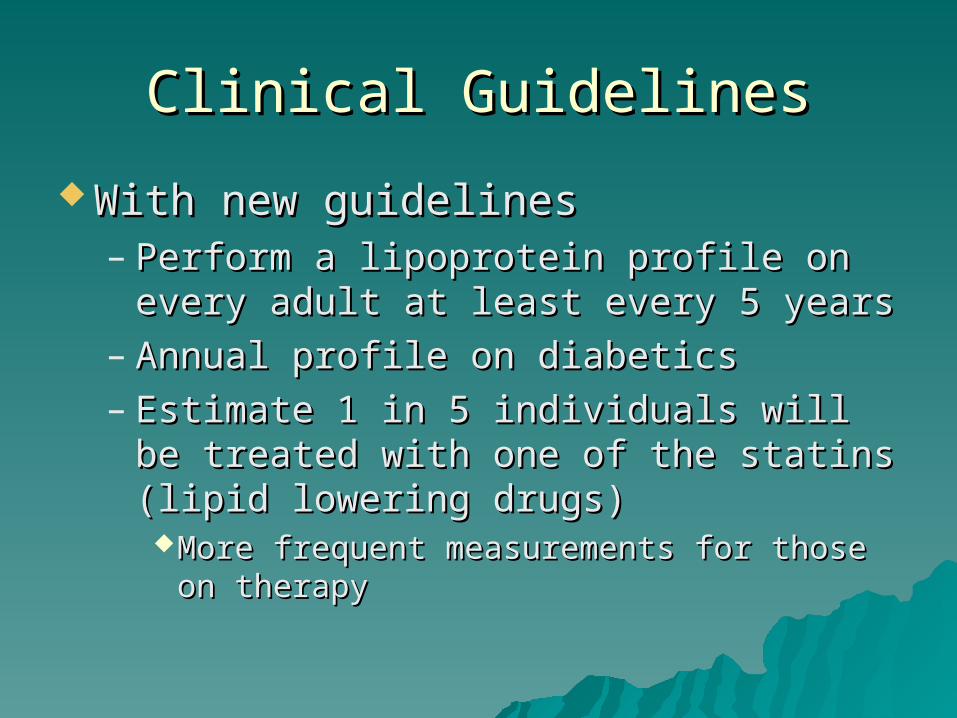
Clinical GuidelinesClinical Guidelines
With new guidelinesWith new guidelines– Perform a lipoprotein profile on every Perform a lipoprotein profile on every
adult at least every 5 yearsadult at least every 5 years– Annual profile on diabeticsAnnual profile on diabetics– Estimate 1 in 5 individuals will be Estimate 1 in 5 individuals will be
treated with one of the statins (lipid treated with one of the statins (lipid lowering drugs)lowering drugs)More frequent measurements for those on More frequent measurements for those on
therapytherapy
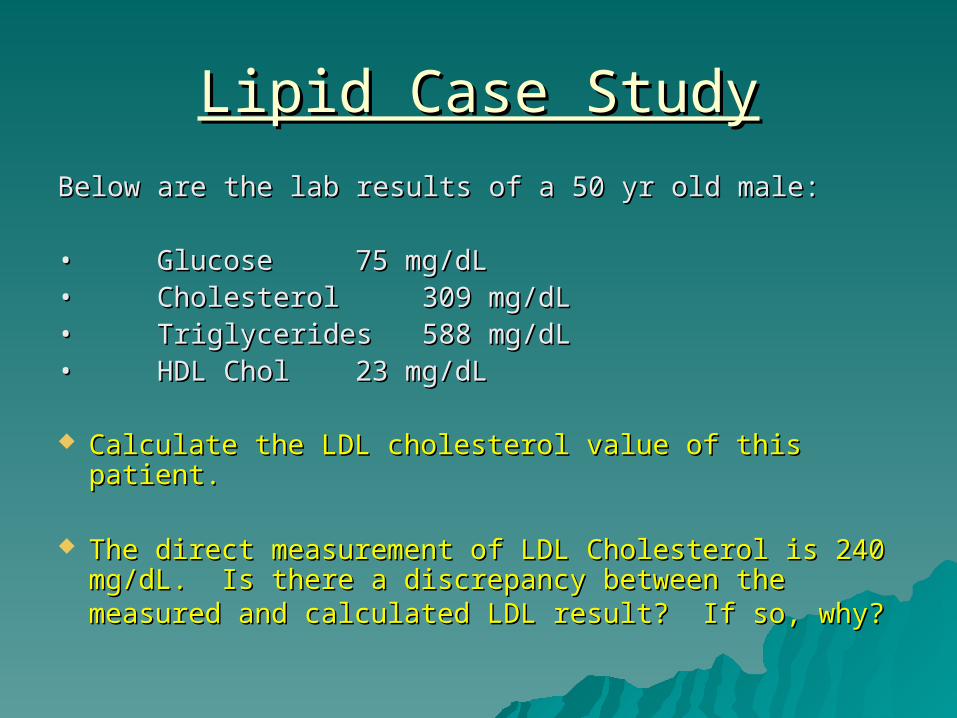
Lipid Case StudyLipid Case Study
Below are the lab results of a 50 yr old male:Below are the lab results of a 50 yr old male: •• GlucoseGlucose 75 mg/dL 75 mg/dL•• CholesterolCholesterol 309 mg/dL309 mg/dL•• TriglyceridesTriglycerides 588 mg/dL588 mg/dL•• HDL CholHDL Chol 23 mg/dL 23 mg/dL
Calculate the LDL cholesterol value of this patient.Calculate the LDL cholesterol value of this patient.
The direct measurement of LDL Cholesterol is 240 The direct measurement of LDL Cholesterol is 240 mg/dL. Is there a discrepancy between the mg/dL. Is there a discrepancy between the measured and calculated LDL result? If so, why?measured and calculated LDL result? If so, why?

Clinical Chemistry Clinical Chemistry Part 2Part 2
Vicki S. Freeman, Ph.D.Vicki S. Freeman, Ph.D.
EnzymesEnzymesEnzymesEnzymes
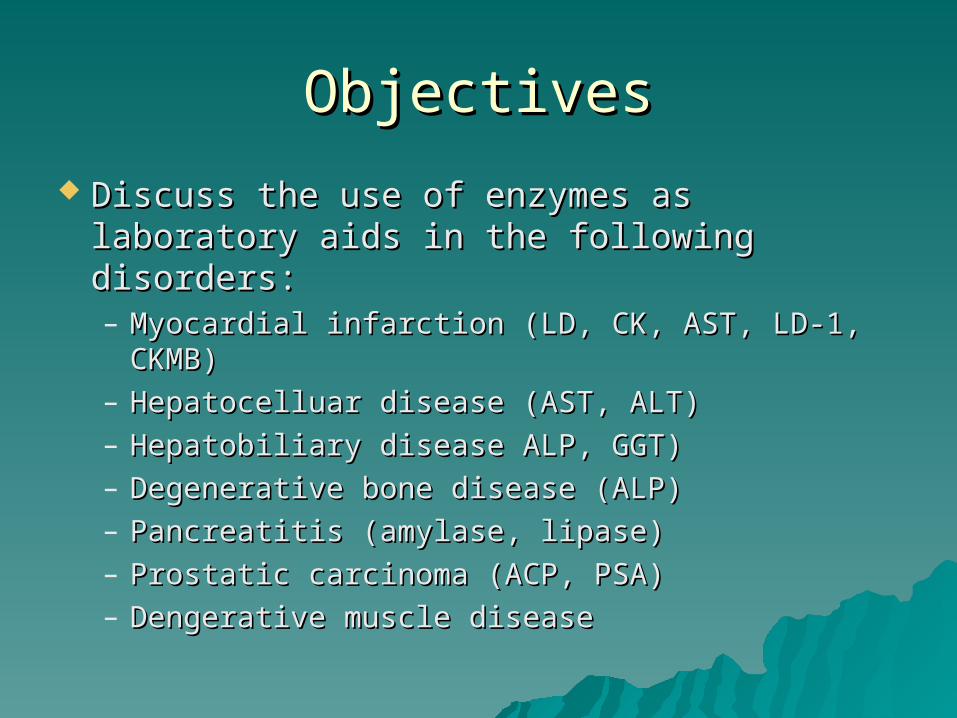
ObjectivesObjectives
Discuss the use of enzymes as laboratory Discuss the use of enzymes as laboratory aids in the following disorders:aids in the following disorders:– Myocardial infarction (LD, CK, AST, LD-1, Myocardial infarction (LD, CK, AST, LD-1,
CKMB)CKMB)– Hepatocelluar disease (AST, ALT)Hepatocelluar disease (AST, ALT)– Hepatobiliary disease ALP, GGT)Hepatobiliary disease ALP, GGT)– Degenerative bone disease (ALP)Degenerative bone disease (ALP)– Pancreatitis (amylase, lipase)Pancreatitis (amylase, lipase)– Prostatic carcinoma (ACP, PSA)Prostatic carcinoma (ACP, PSA)– Dengerative muscle diseaseDengerative muscle disease
EnzymesEnzymesEnzymesEnzymes
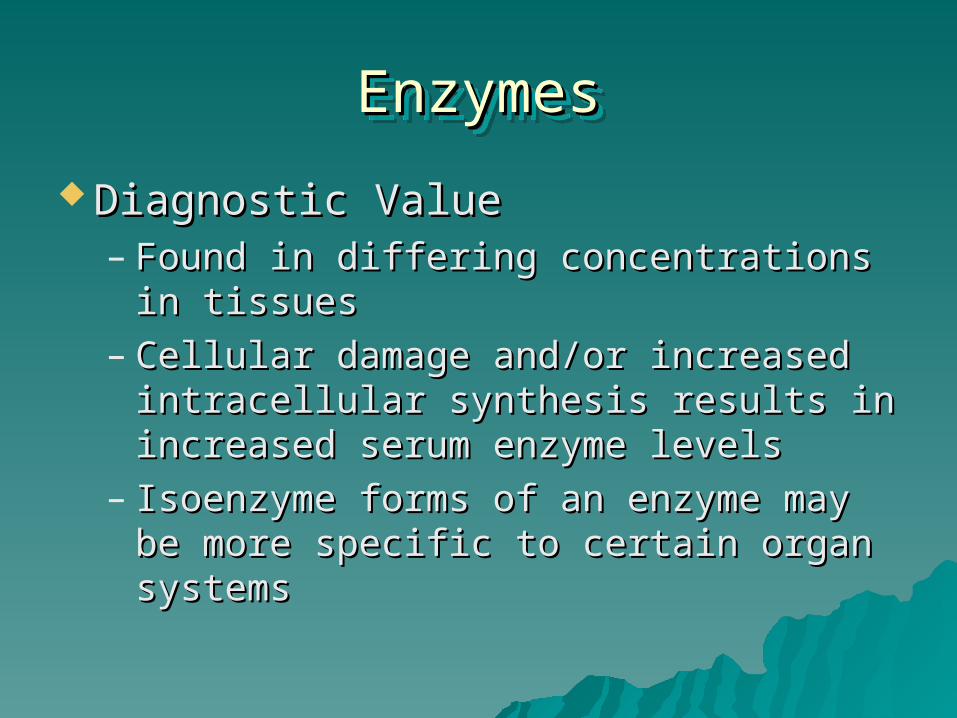
Diagnostic ValueDiagnostic Value– Found in differing concentrations in Found in differing concentrations in
tissuestissues– Cellular damage and/or increased Cellular damage and/or increased
intracellular synthesis results in intracellular synthesis results in increased serum enzyme levelsincreased serum enzyme levels
– Isoenzyme forms of an enzyme may be Isoenzyme forms of an enzyme may be more specific to certain organ systemsmore specific to certain organ systems
Clinically Significant EnzymesClinically Significant EnzymesClinically Significant EnzymesClinically Significant Enzymes
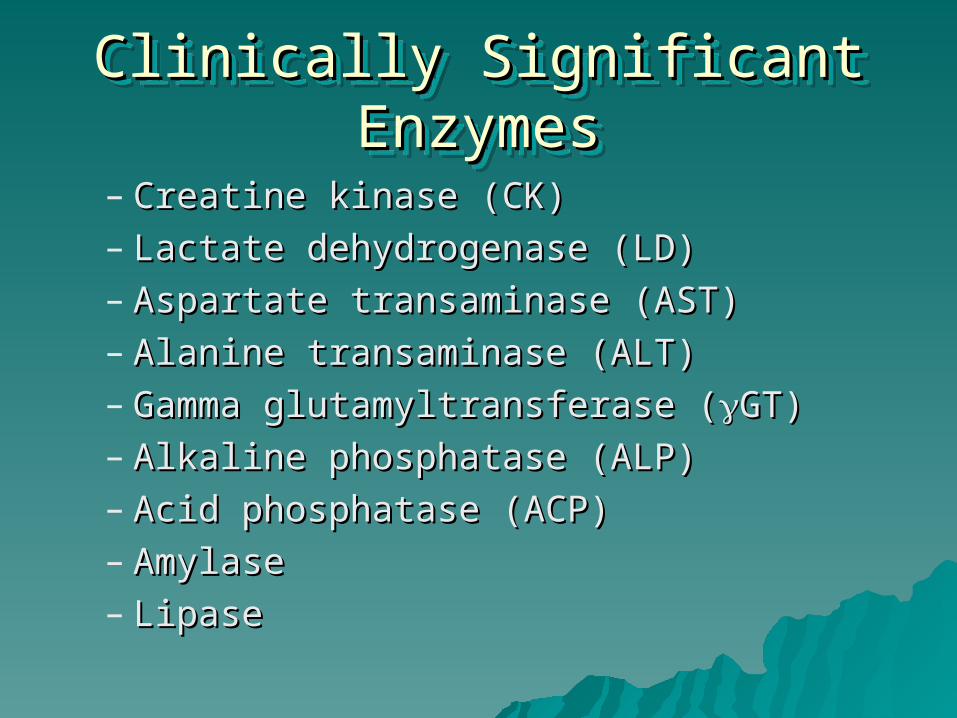
– Creatine kinase (CK)Creatine kinase (CK)– Lactate dehydrogenase (LD)Lactate dehydrogenase (LD)– Aspartate transaminase (AST)Aspartate transaminase (AST)– Alanine transaminase (ALT)Alanine transaminase (ALT)– Gamma glutamyltransferase (Gamma glutamyltransferase (GT)GT)– Alkaline phosphatase (ALP)Alkaline phosphatase (ALP)– Acid phosphatase (ACP)Acid phosphatase (ACP)– AmylaseAmylase– LipaseLipase
Creatine Kinase (CK)Creatine Kinase (CK)Creatine Kinase (CK)Creatine Kinase (CK)
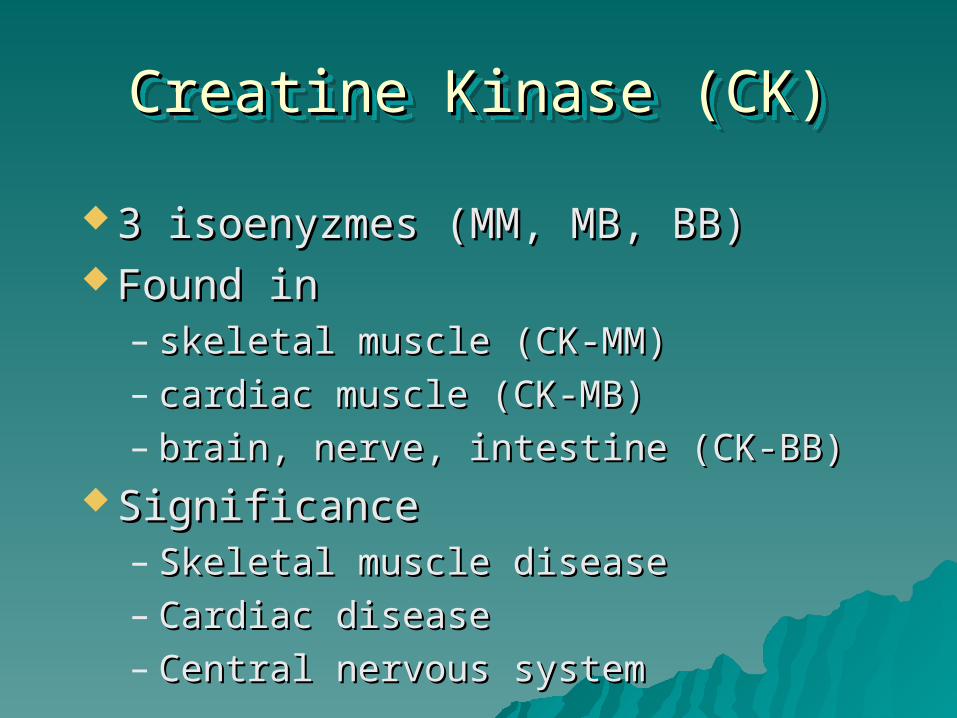
3 isoenyzmes (MM, MB, BB)3 isoenyzmes (MM, MB, BB) Found inFound in
– skeletal muscle (CK-MM)skeletal muscle (CK-MM)– cardiac muscle (CK-MB)cardiac muscle (CK-MB)– brain, nerve, intestine (CK-BB)brain, nerve, intestine (CK-BB)
SignificanceSignificance– Skeletal muscle diseaseSkeletal muscle disease– Cardiac diseaseCardiac disease– Central nervous system Central nervous system
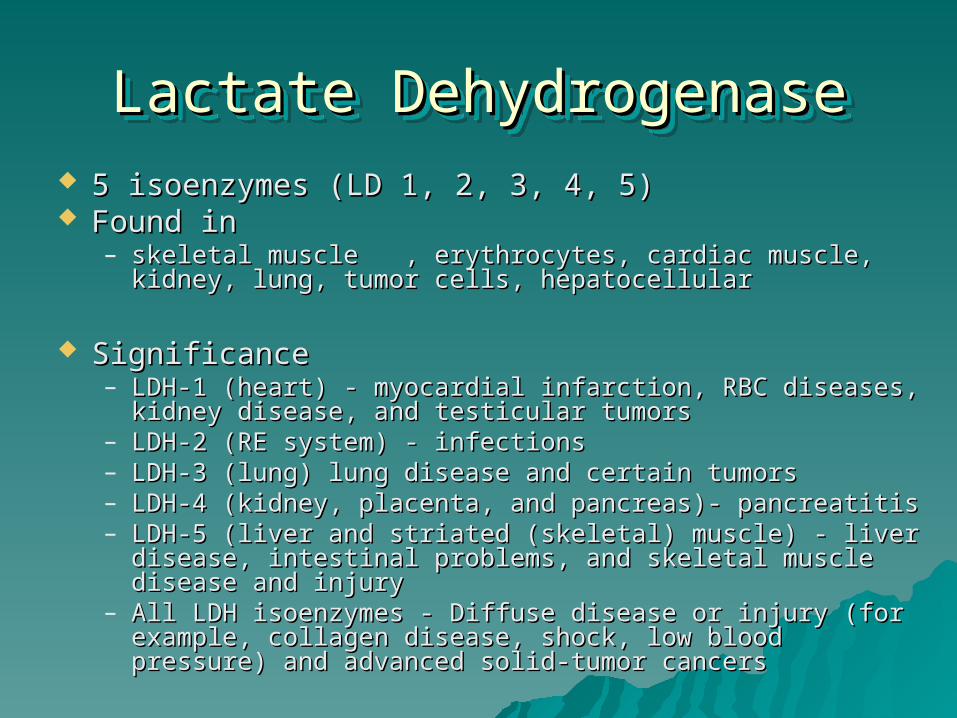
Lactate DehydrogenaseLactate DehydrogenaseLactate DehydrogenaseLactate Dehydrogenase 5 isoenzymes (LD 1, 2, 3, 4, 5)5 isoenzymes (LD 1, 2, 3, 4, 5) Found inFound in
– skeletal muscleskeletal muscle , erythrocytes, cardiac muscle, , erythrocytes, cardiac muscle, kidney, lung, tumor cells, hepatocellularkidney, lung, tumor cells, hepatocellular
SignificanceSignificance– LDH-1 (heart) - myocardial infarction, RBC diseases, LDH-1 (heart) - myocardial infarction, RBC diseases,
kidney disease, and testicular tumorskidney disease, and testicular tumors– LDH-2 (RE system) - infectionsLDH-2 (RE system) - infections– LDH-3 (lung) lung disease and certain tumorsLDH-3 (lung) lung disease and certain tumors– LDH-4 (kidney, placenta, and pancreas)- pancreatitisLDH-4 (kidney, placenta, and pancreas)- pancreatitis– LDH-5 (liver and striated (skeletal) muscle) - liver disease, LDH-5 (liver and striated (skeletal) muscle) - liver disease,
intestinal problems, and skeletal muscle disease and intestinal problems, and skeletal muscle disease and injuryinjury
– All LDH isoenzymes - Diffuse disease or injury (for All LDH isoenzymes - Diffuse disease or injury (for example, collagen disease, shock, low blood pressure) and example, collagen disease, shock, low blood pressure) and advanced solid-tumor cancersadvanced solid-tumor cancers
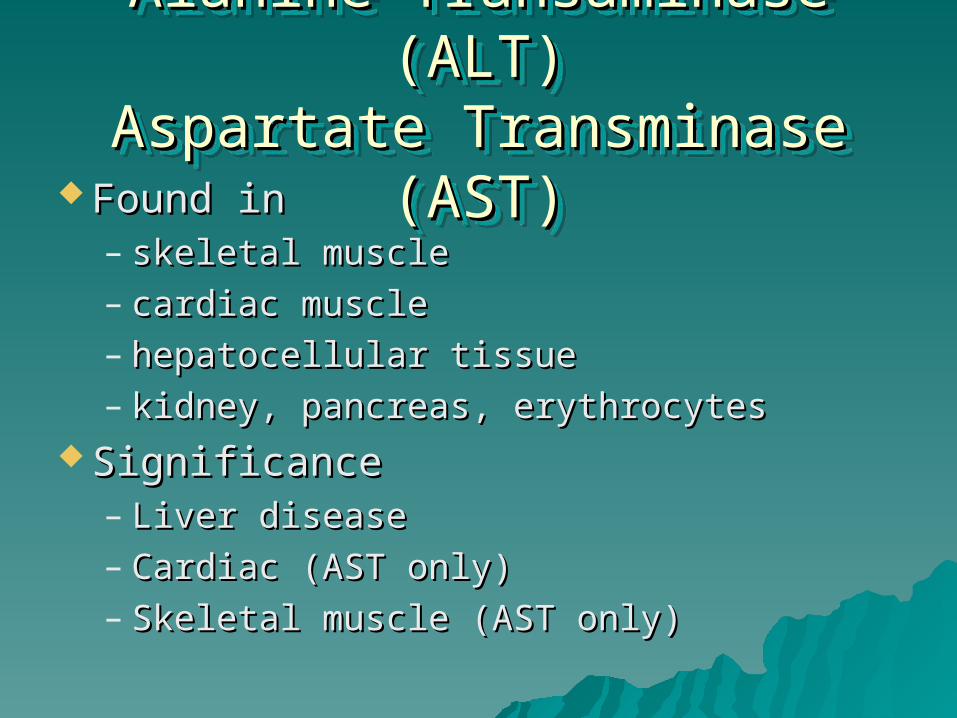
Alanine Transaminase (ALT)Alanine Transaminase (ALT)Aspartate Transminase (AST)Aspartate Transminase (AST)Alanine Transaminase (ALT)Alanine Transaminase (ALT)Aspartate Transminase (AST)Aspartate Transminase (AST)
Found inFound in– skeletal muscleskeletal muscle– cardiac musclecardiac muscle– hepatocellular tissuehepatocellular tissue– kidney, pancreas, erythrocyteskidney, pancreas, erythrocytes
SignificanceSignificance– Liver diseaseLiver disease– Cardiac (AST only)Cardiac (AST only)– Skeletal muscle (AST only)Skeletal muscle (AST only)
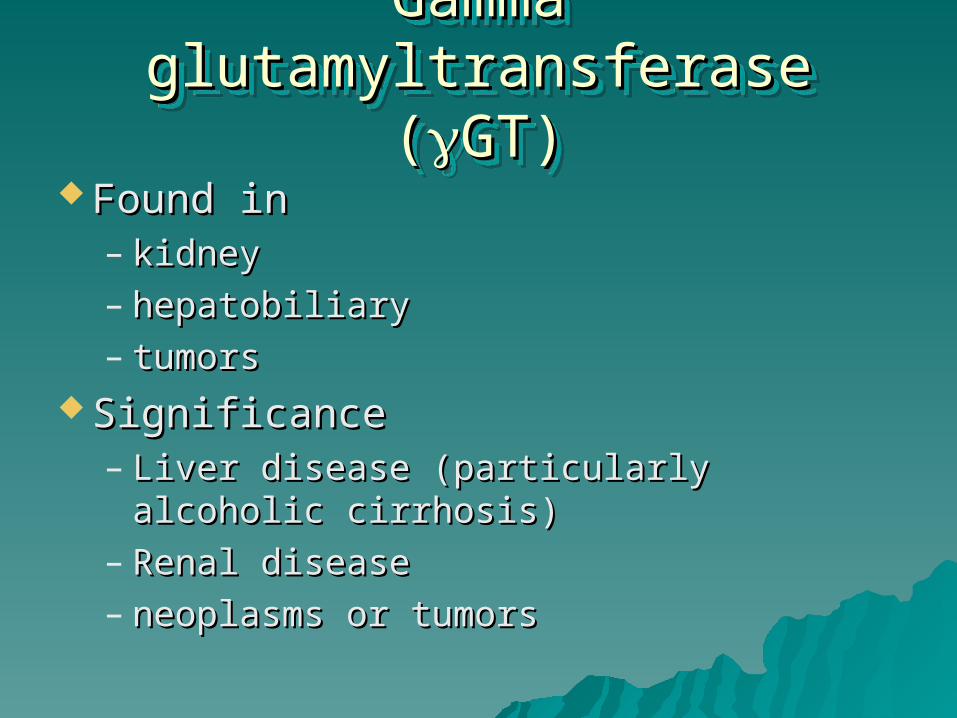
Gamma glutamyltransferase Gamma glutamyltransferase ((GT)GT)
Gamma glutamyltransferase Gamma glutamyltransferase ((GT)GT)
Found inFound in– kidneykidney– hepatobiliaryhepatobiliary– tumorstumors
SignificanceSignificance– Liver disease (particularly alcoholic Liver disease (particularly alcoholic
cirrhosis)cirrhosis)– Renal diseaseRenal disease– neoplasms or tumorsneoplasms or tumors
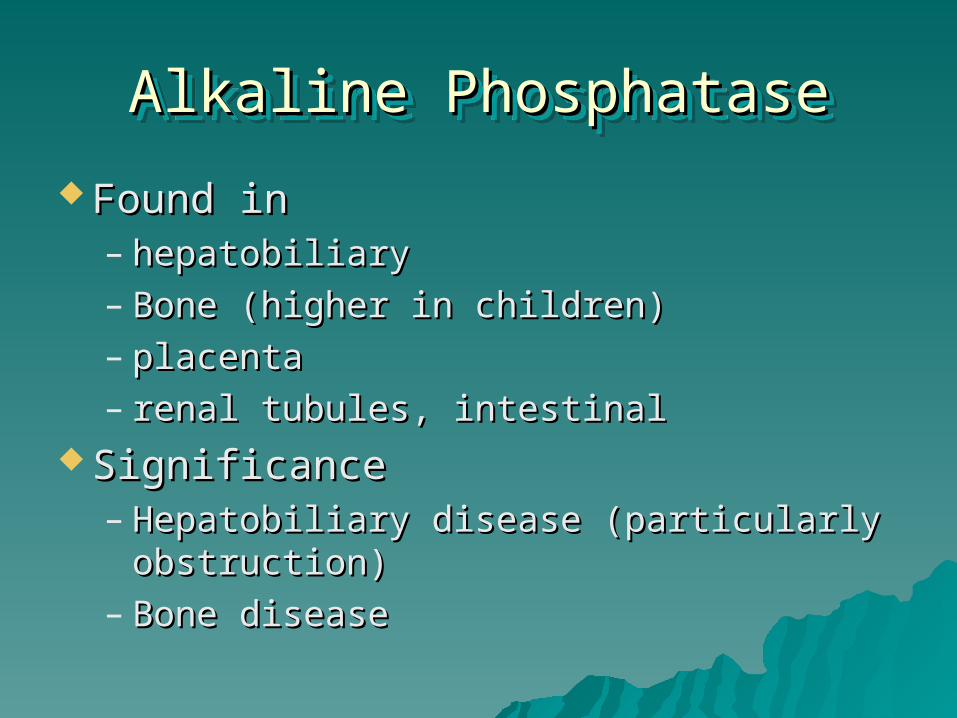
Alkaline PhosphataseAlkaline PhosphataseAlkaline PhosphataseAlkaline Phosphatase
Found inFound in– hepatobiliaryhepatobiliary– Bone (higher in children)Bone (higher in children)– placentaplacenta– renal tubules, intestinalrenal tubules, intestinal
SignificanceSignificance– Hepatobiliary disease (particularly Hepatobiliary disease (particularly
obstruction)obstruction)– Bone diseaseBone disease
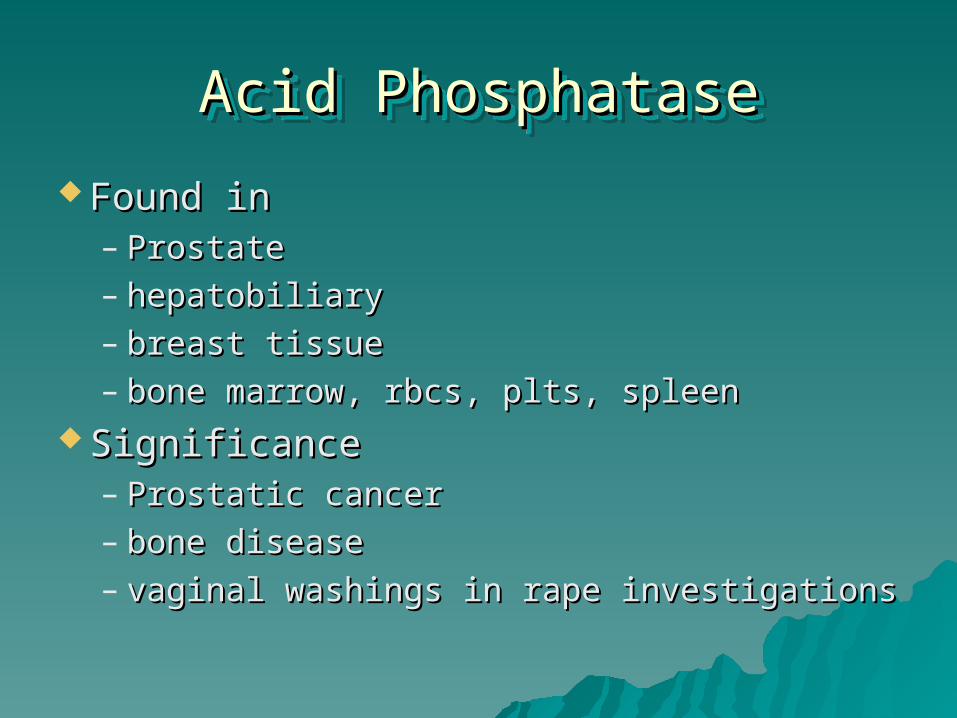
Acid PhosphataseAcid PhosphataseAcid PhosphataseAcid Phosphatase
Found inFound in– ProstateProstate– hepatobiliaryhepatobiliary– breast tissuebreast tissue– bone marrow, rbcs, plts, spleenbone marrow, rbcs, plts, spleen
SignificanceSignificance– Prostatic cancerProstatic cancer– bone diseasebone disease– vaginal washings in rape investigationsvaginal washings in rape investigations
Amylase and LipaseAmylase and LipaseAmylase and LipaseAmylase and Lipase
found infound in– PancreasPancreas– Salivary glands (amylase only)Salivary glands (amylase only)
SignificanceSignificance– Pancreatic DiseasePancreatic Disease– Mumps (amylase only)Mumps (amylase only)
Cardiac FunctionCardiac FunctionCardiac FunctionCardiac Function
Acute Coronary Acute Coronary SyndromesSyndromes
ObjectivesObjectives Discuss the changes in total serum CK, LD, Discuss the changes in total serum CK, LD,
and AST after acute myocardial infarction.and AST after acute myocardial infarction. Interpret cardiac markers in patients with Interpret cardiac markers in patients with
suspected acute myocardial infarctionsuspected acute myocardial infarction– CK and CKMBCK and CKMB– LD and LD-1LD and LD-1– TroponinTroponin
Describe the clinical usefulness of Describe the clinical usefulness of myoglobin, troponin and BNP versus CK myoglobin, troponin and BNP versus CK markers in assessing acute myocardial markers in assessing acute myocardial injury.injury.
Cardiac MarkersCardiac MarkersCardiac MarkersCardiac Markers
CK isoenzymesCK isoenzymes– CK-BBCK-BB– CK-MBCK-MB
CK-MB isoformsCK-MB isoforms– CKMB1CKMB1– CKMB2CKMB2
– CK-MMCK-MM
TroponinTroponin– complex consists of complex consists of
3 subunits:3 subunits:– troponin T (cTnTtroponin T (cTnT))– troponin I (cTnI)troponin I (cTnI)– troponin C troponin C
MyoglobinMyoglobin
B-type natriuretic B-type natriuretic peptide (BNP) peptide (BNP)
oror N-terminal pro-BNP N-terminal pro-BNP
(NT-proBNP) (NT-proBNP)
hsC-Reactive Protein hsC-Reactive Protein (hsCRP)(hsCRP)
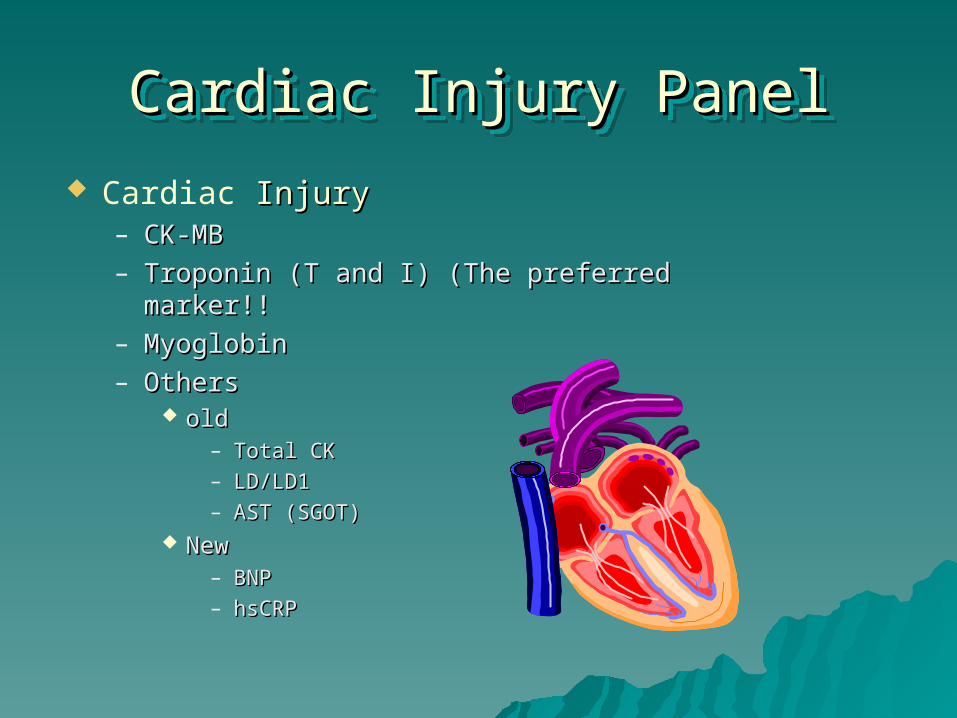
Cardiac Injury PanelCardiac Injury PanelCardiac Injury PanelCardiac Injury Panel
Cardiac Injury Injury– CK-MBCK-MB– Troponin (T and I) (The preferred marker!!Troponin (T and I) (The preferred marker!!– MyoglobinMyoglobin– Others Others
oldold– Total CKTotal CK– LD/LD1LD/LD1– AST (SGOT)AST (SGOT)
NewNew– BNPBNP– hsCRPhsCRP
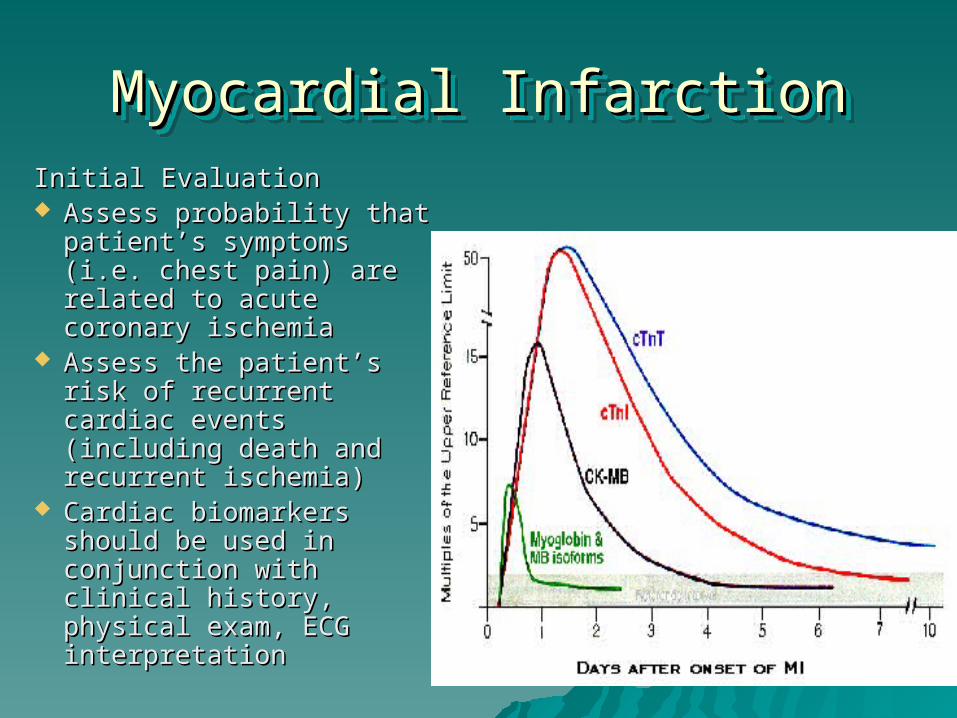
Myocardial InfarctionMyocardial InfarctionMyocardial InfarctionMyocardial InfarctionInitial EvaluationInitial Evaluation Assess probability that Assess probability that
patient’s symptoms (i.e. patient’s symptoms (i.e. chest pain) are related to chest pain) are related to acute coronary ischemiaacute coronary ischemia
Assess the patient’s risk of Assess the patient’s risk of recurrent cardiac events recurrent cardiac events (including death and (including death and recurrent ischemia)recurrent ischemia)
Cardiac biomarkers should Cardiac biomarkers should be used in conjunction with be used in conjunction with clinical history, physical clinical history, physical exam, ECG interpretationexam, ECG interpretation
TroponinTroponin
Preferred marker for detection of cardiac injury and risk Preferred marker for detection of cardiac injury and risk stratificationstratification
Has isoforms that are unique to cardiac myocytesHas isoforms that are unique to cardiac myocytes Fewer false positive results (when concomitant with skeletal Fewer false positive results (when concomitant with skeletal
injury)injury) Rises within 3-4 hours after onsetRises within 3-4 hours after onset Remains elevated 10-14 daysRemains elevated 10-14 days Independent risk factor of death and ischemic events in Independent risk factor of death and ischemic events in
acute coronary syndromeacute coronary syndrome– 4 fold higher risk of death and recurrent MI in patients with an 4 fold higher risk of death and recurrent MI in patients with an
elevated troponin (both T and I)elevated troponin (both T and I)– Independent of other clinical indicators such as age, ST Independent of other clinical indicators such as age, ST
deviation, and presence of heart failuredeviation, and presence of heart failure– Elevated troponin levels are associated with likelihood of poor Elevated troponin levels are associated with likelihood of poor
outcomes in angioplastyoutcomes in angioplasty
CK-MBCK-MB CK-MB (by mass spectrometry) is an acceptable alternative CK-MB (by mass spectrometry) is an acceptable alternative
to troponinto troponin Perform serial testingPerform serial testing
– Upon presentation to hospitalUpon presentation to hospital– At at 6-8 hoursAt at 6-8 hours– Again at 12-24 hoursAgain at 12-24 hours
1-3% of CKMB comes from skeletal muscles1-3% of CKMB comes from skeletal muscles Begins to rise between 3-6 hours post MIBegins to rise between 3-6 hours post MI Falls to normal levels at 48-72 hoursFalls to normal levels at 48-72 hours Use of the serial measurements useful in the management Use of the serial measurements useful in the management
of the MI after diagnosisof the MI after diagnosis– Release of CKMB from cardiac myocytes indicates myocardial Release of CKMB from cardiac myocytes indicates myocardial
necrosisnecrosis Use for detection of recurring MIsUse for detection of recurring MIs
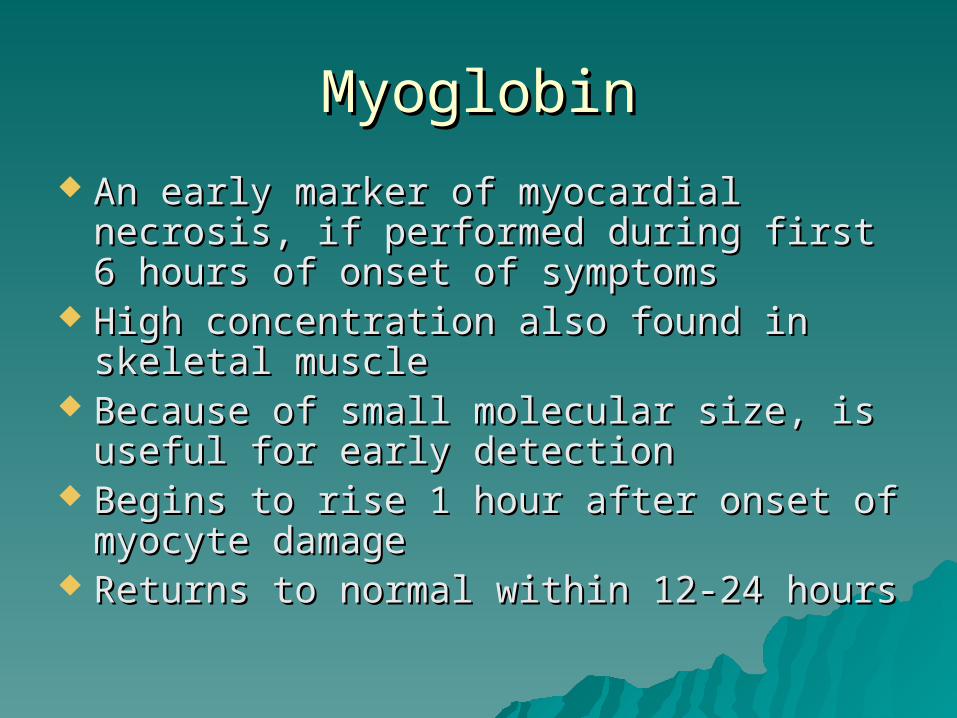
MyoglobinMyoglobin
An early marker of myocardial necrosis, if An early marker of myocardial necrosis, if performed during first 6 hours of onset of performed during first 6 hours of onset of symptomssymptoms
High concentration also found in skeletal High concentration also found in skeletal musclemuscle
Because of small molecular size, is useful Because of small molecular size, is useful for early detectionfor early detection
Begins to rise 1 hour after onset of Begins to rise 1 hour after onset of myocyte damagemyocyte damage
Returns to normal within 12-24 hoursReturns to normal within 12-24 hours
Other markersOther markers
Total CK, AST, b-hydroxybutric Total CK, AST, b-hydroxybutric dehydrogenase, or LD should not be dehydrogenase, or LD should not be used as biomarkers for MIused as biomarkers for MI– These are of low specificityThese are of low specificity
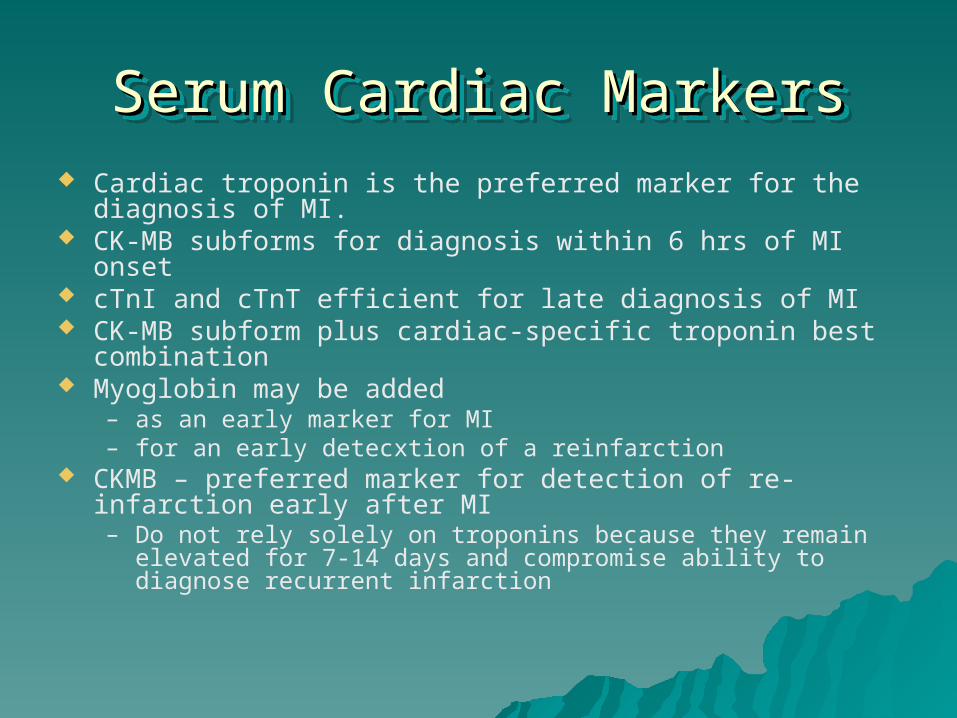
Serum Cardiac MarkersSerum Cardiac MarkersSerum Cardiac MarkersSerum Cardiac Markers Cardiac troponin is the preferred marker for the diagnosis
of MI. CK-MB subforms for diagnosis within 6 hrs of MI onset cTnI and cTnT efficient for late diagnosis of MI CK-MB subform plus cardiac-specific troponin best
combination Myoglobin may be added
– as an early marker for MI– for an early detecxtion of a reinfarction
CKMB – preferred marker for detection of re-infarction early after MI– Do not rely solely on troponins because they remain elevated
for 7-14 days and compromise ability to diagnose recurrent infarction
Markers for Risk Stratification Markers for Risk Stratification
– Troponin - the preferred markerTroponin - the preferred marker
– hsC-Reactive Protein (CRP)hsC-Reactive Protein (CRP)
– B-type natriuretic peptide (BNP) or B-type natriuretic peptide (BNP) or N-terminal prohormone BNP (NT-N-terminal prohormone BNP (NT-proBNP)proBNP)
Markers of inflammationMarkers of inflammation
hs-CRPhs-CRP
– Patients without biochemical evidence of Patients without biochemical evidence of myocardial necrosis but who have an elevated myocardial necrosis but who have an elevated hsCRP level are at an increased risk of an hsCRP level are at an increased risk of an adverse outcome, especially those whose adverse outcome, especially those whose hsCRP levels are markedly elevated hsCRP levels are markedly elevated
interleukin-6 & serum amyloid A - acute interleukin-6 & serum amyloid A - acute phase reactant proteins phase reactant proteins – Elevated levels have been shown to have a Elevated levels have been shown to have a
similar predictive value of an adverse outcome similar predictive value of an adverse outcome as CRPas CRP
BNP – (B-type natriuretic peptide)BNP – (B-type natriuretic peptide)
Neurohormone synthesized predominantly Neurohormone synthesized predominantly in ventricular myocardiumin ventricular myocardium– Released from cardiac myocytes in response to Released from cardiac myocytes in response to
ventricular wall stressventricular wall stress– Strong relationship with mortality in patients Strong relationship with mortality in patients
with unstable anginawith unstable angina– Rises after exercise in patients with coronary Rises after exercise in patients with coronary
diseasedisease– Circulating levels of BNP correlate with Circulating levels of BNP correlate with
presence and severity of congestive heart presence and severity of congestive heart failurefailure
Troponin and BNPTroponin and BNP
– a single measurement of B-type a single measurement of B-type natriuretic peptide, obtained in the first natriuretic peptide, obtained in the first few days after the onset of ischemic few days after the onset of ischemic symptoms, provides predictive symptoms, provides predictive information for use in risk stratification information for use in risk stratification across the spectrum of acute coronary across the spectrum of acute coronary syndromes (ACS)syndromes (ACS)
– Low mortality rate found for patients Low mortality rate found for patients with negative troponin results and low with negative troponin results and low BNP levelsBNP levels
ACC Guidelines (ACC)ACC Guidelines (ACC)
4 Categories4 Categories– Noncardiac diagnosisNoncardiac diagnosis– Chronic unstable anginaChronic unstable angina– Possible ACS (acute coronary syndrome)Possible ACS (acute coronary syndrome)– Definite ACSDefinite ACS
Patient Management includes:Patient Management includes:– Patient historyPatient history– 12 lead ECG12 lead ECG– Cardiac Markers - preferrably cardiac-specific Cardiac Markers - preferrably cardiac-specific
troponintroponin
ACC = American College of CardiologyACC = American College of Cardiology
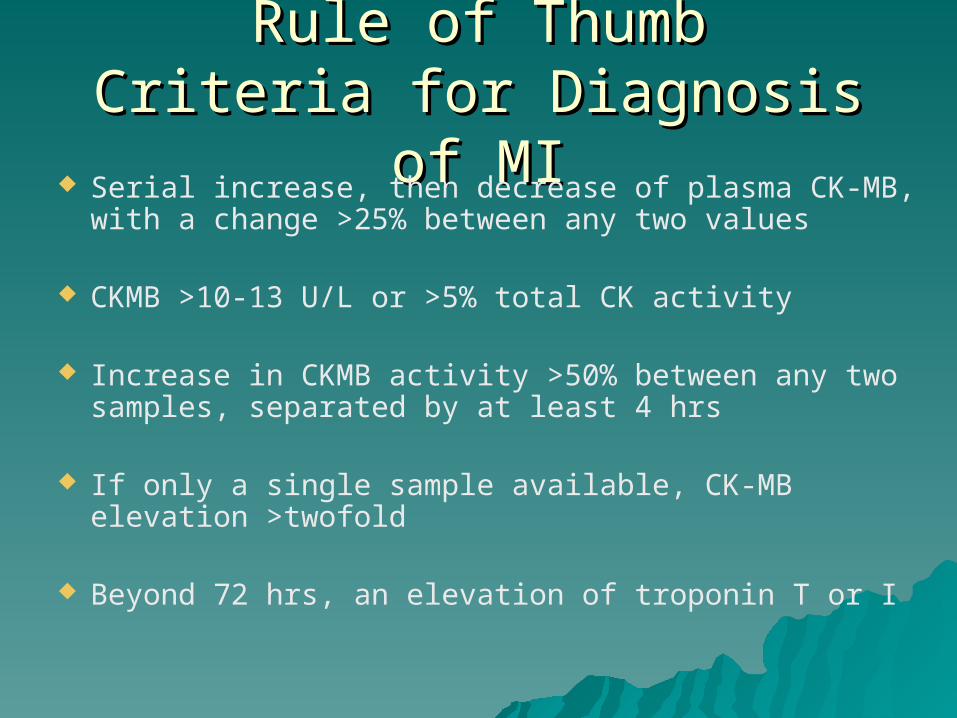
Rule of ThumbRule of ThumbCriteria for Diagnosis of MICriteria for Diagnosis of MI
Serial increase, then decrease of plasma CK-MB, with a change >25% between any two values
CKMB >10-13 U/L or >5% total CK activity
Increase in CKMB activity >50% between any two samples, separated by at least 4 hrs
If only a single sample available, CK-MB elevation >twofold
Beyond 72 hrs, an elevation of troponin T or I
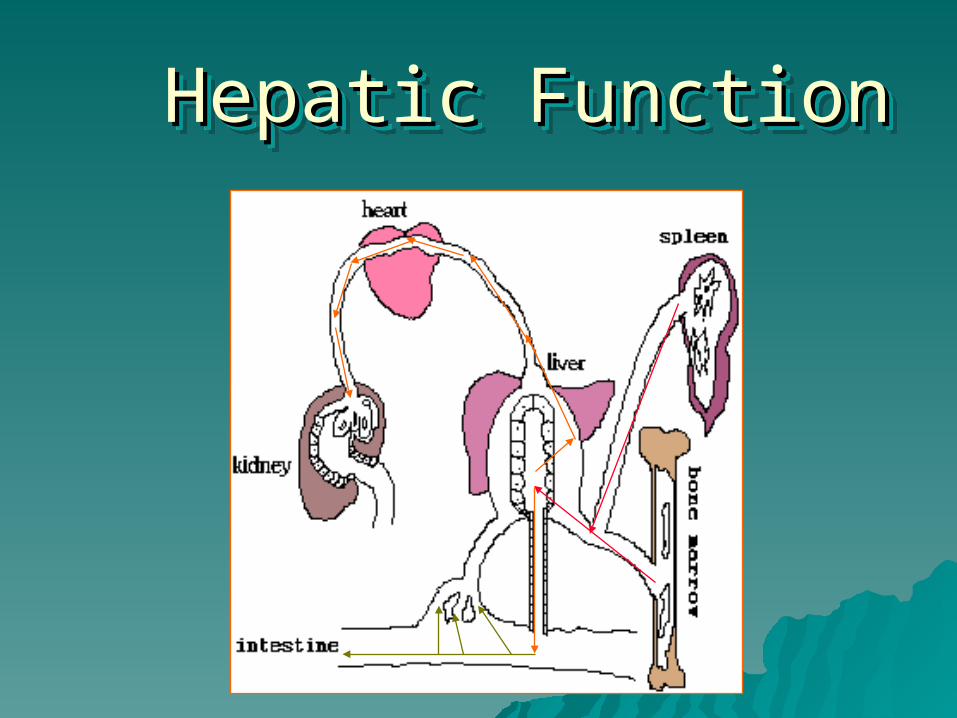
Hepatic FunctionHepatic FunctionHepatic FunctionHepatic Function
ObjectivesObjectives Identify laboratory tests commonly used to Identify laboratory tests commonly used to
diagnose liver diseasediagnose liver disease Correlate expected results in pre-hepatic Correlate expected results in pre-hepatic
(hemolytic jaundice), intrahepatic (hemolytic jaundice), intrahepatic (hepatitis and cirrhosis), and posthepatic (hepatitis and cirrhosis), and posthepatic (obstructive jaundice) related disorders for (obstructive jaundice) related disorders for the following tests:the following tests:
Serum and urine bilirubin (total, Serum and urine bilirubin (total, conjugated, unconjugated)conjugated, unconjugated)
Urine and stool urobilinogenUrine and stool urobilinogen Enzymes (AST, ALT, Alkaline Phosphatase, Enzymes (AST, ALT, Alkaline Phosphatase,
GGT)GGT)
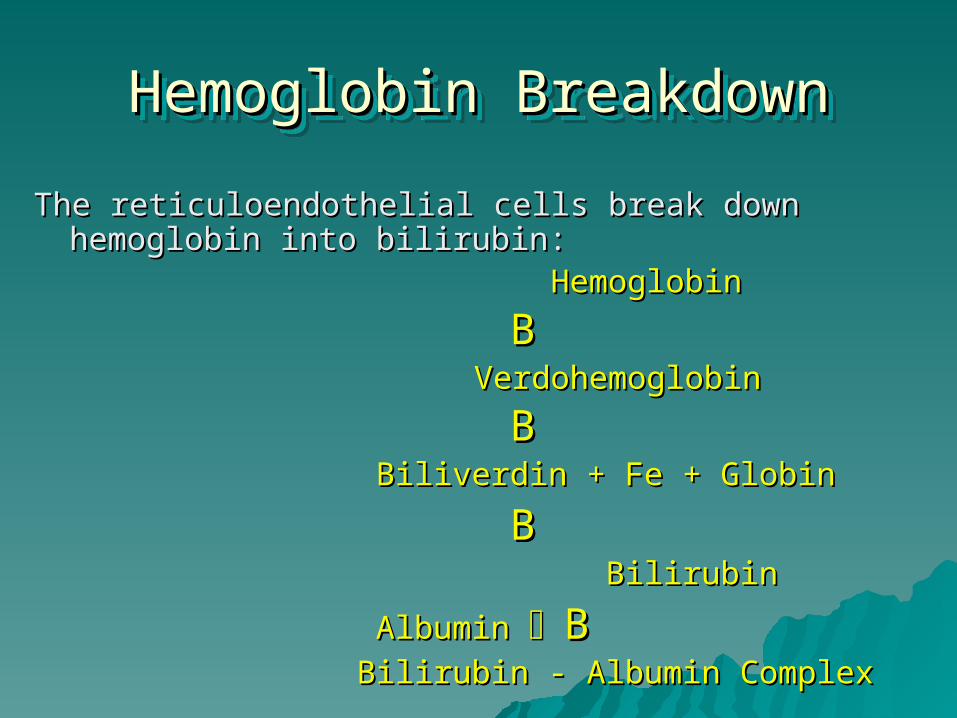
Hemoglobin BreakdownHemoglobin BreakdownHemoglobin BreakdownHemoglobin Breakdown
The reticuloendothelial cells break down hemoglobin The reticuloendothelial cells break down hemoglobin into bilirubin:into bilirubin:
HemoglobinHemoglobin
BB VerdohemoglobinVerdohemoglobin
BB Biliverdin + Fe + GlobinBiliverdin + Fe + Globin
BB BilirubinBilirubin
Albumin Albumin BB Bilirubin - Albumin ComplexBilirubin - Albumin Complex
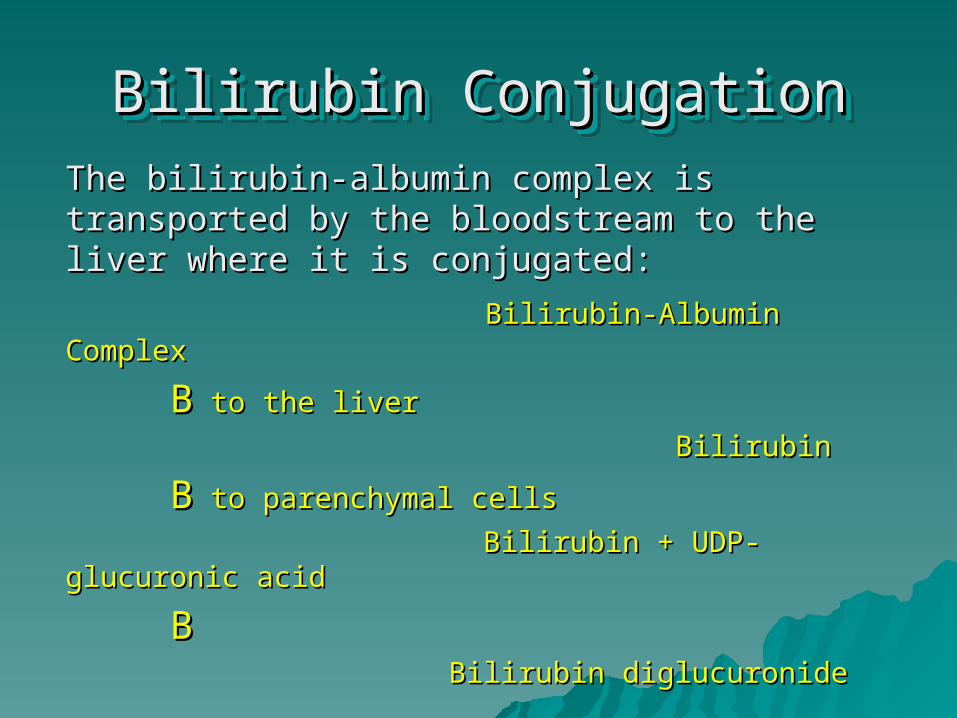
Bilirubin ConjugationBilirubin ConjugationBilirubin ConjugationBilirubin Conjugation
The bilirubin-albumin complex is transported The bilirubin-albumin complex is transported by the bloodstream to the liver where it is by the bloodstream to the liver where it is conjugated:conjugated:
Bilirubin-Albumin ComplexBilirubin-Albumin Complex
BB to the liver to the liver
BilirubinBilirubin
BB to parenchymal to parenchymal cellscells
Bilirubin + UDP-glucuronic acidBilirubin + UDP-glucuronic acid
BB
Bilirubin diglucuronideBilirubin diglucuronide
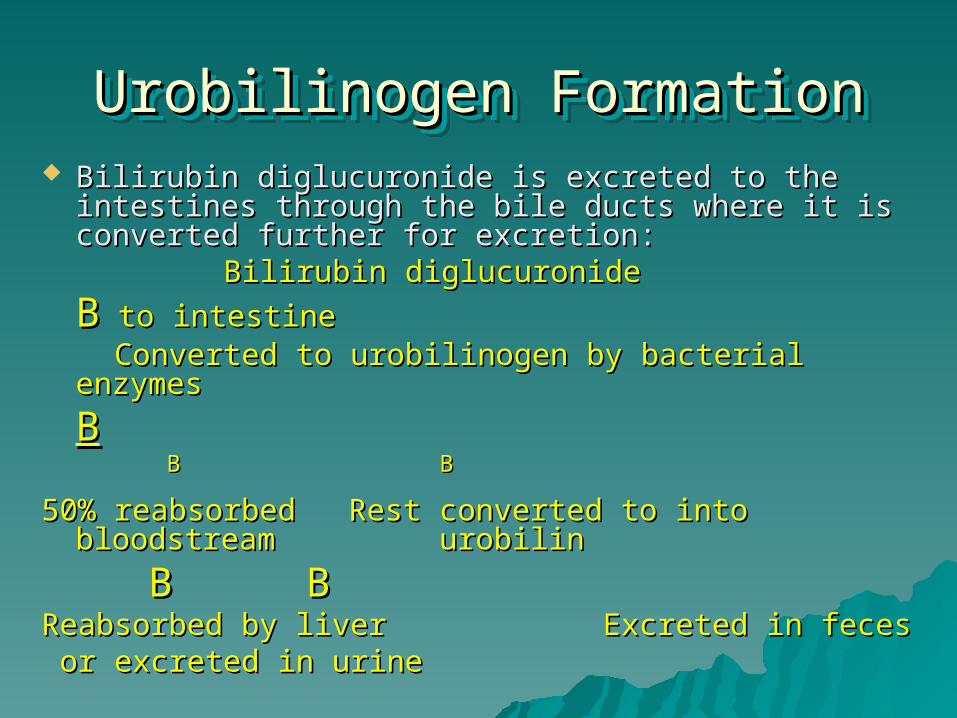
Urobilinogen FormationUrobilinogen FormationUrobilinogen FormationUrobilinogen Formation Bilirubin diglucuronide is excreted to the intestines Bilirubin diglucuronide is excreted to the intestines
through the bile ducts where it is converted further through the bile ducts where it is converted further for excretion:for excretion:
Bilirubin diglucuronideBilirubin diglucuronide
BB to intestine to intestine Converted to urobilinogen by bacterial enzymesConverted to urobilinogen by bacterial enzymes
BB BB BB
50% reabsorbed 50% reabsorbed Rest converted to into Rest converted to into bloodstream bloodstream urobilin urobilin
BB B BReabsorbed by liver Reabsorbed by liver Excreted in feces Excreted in feces or excreted in urineor excreted in urine

Hepatic FunctionHepatic FunctionHepatic FunctionHepatic Function
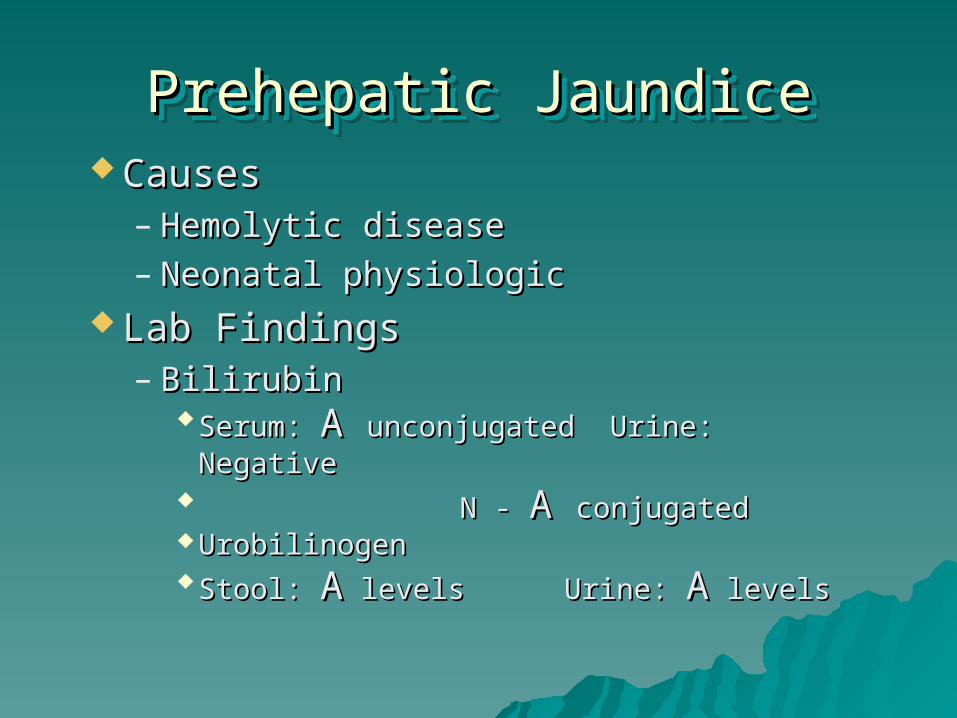
Prehepatic JaundicePrehepatic JaundicePrehepatic JaundicePrehepatic Jaundice CausesCauses
– Hemolytic diseaseHemolytic disease– Neonatal physiologicNeonatal physiologic
Lab FindingsLab Findings– Bilirubin Bilirubin
Serum: Serum: A A unconjugated Urine: Negativeunconjugated Urine: Negative N - N - A A conjugatedconjugated UrobilinogenUrobilinogen Stool: Stool: AA levels levels Urine: Urine: AA levels levels
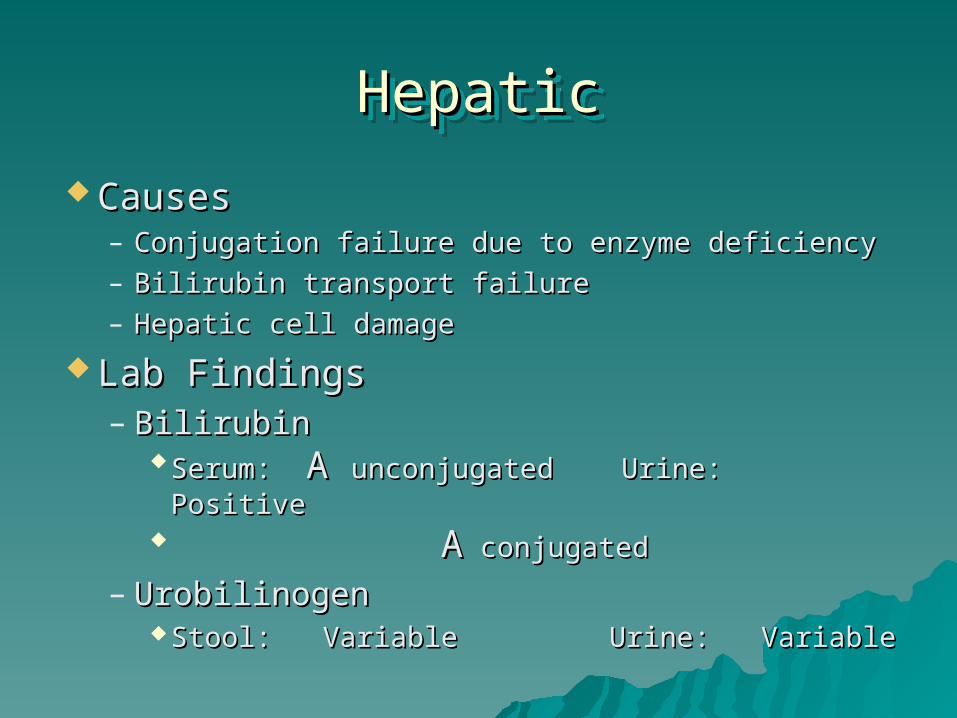
HepaticHepaticHepaticHepatic
CausesCauses– Conjugation failure due to enzyme deficiencyConjugation failure due to enzyme deficiency– Bilirubin transport failureBilirubin transport failure– Hepatic cell damageHepatic cell damage
Lab FindingsLab Findings– Bilirubin Bilirubin
Serum: Serum: A A unconjugated Urine: Positiveunconjugated Urine: Positive AA conjugated conjugated
– UrobilinogenUrobilinogen Stool: VariableStool: Variable Urine: Variable Urine: Variable
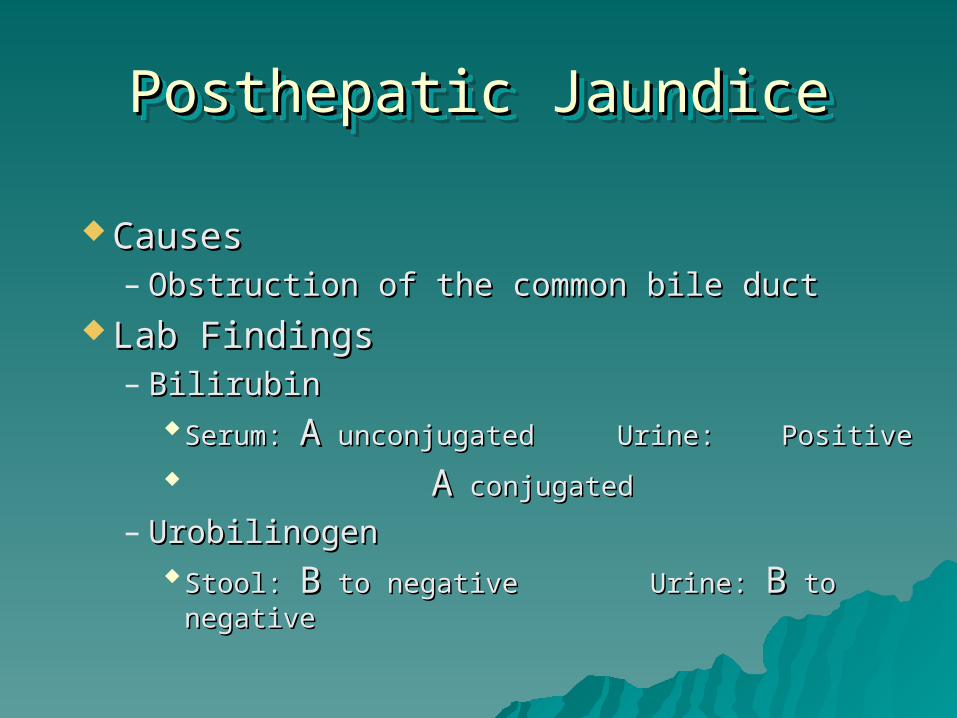
Posthepatic JaundicePosthepatic JaundicePosthepatic JaundicePosthepatic Jaundice
CausesCauses– Obstruction of the common bile ductObstruction of the common bile duct
Lab FindingsLab Findings– Bilirubin Bilirubin
Serum: Serum: AA unconjugated Urine: Positive unconjugated Urine: Positive
AA conjugated conjugated
– UrobilinogenUrobilinogen Stool: Stool: BB to negative Urine: to negative Urine: BB to negative to negative
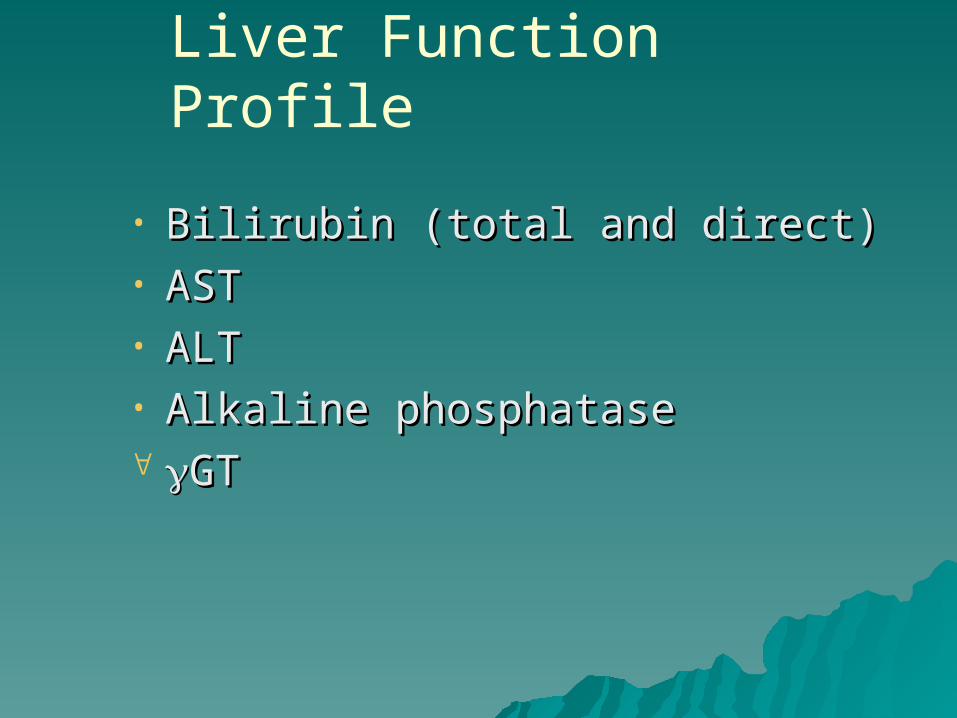
Liver Function Profile
• Bilirubin (total and direct)Bilirubin (total and direct)• ASTAST• ALT ALT • Alkaline phosphataseAlkaline phosphatase GTGT
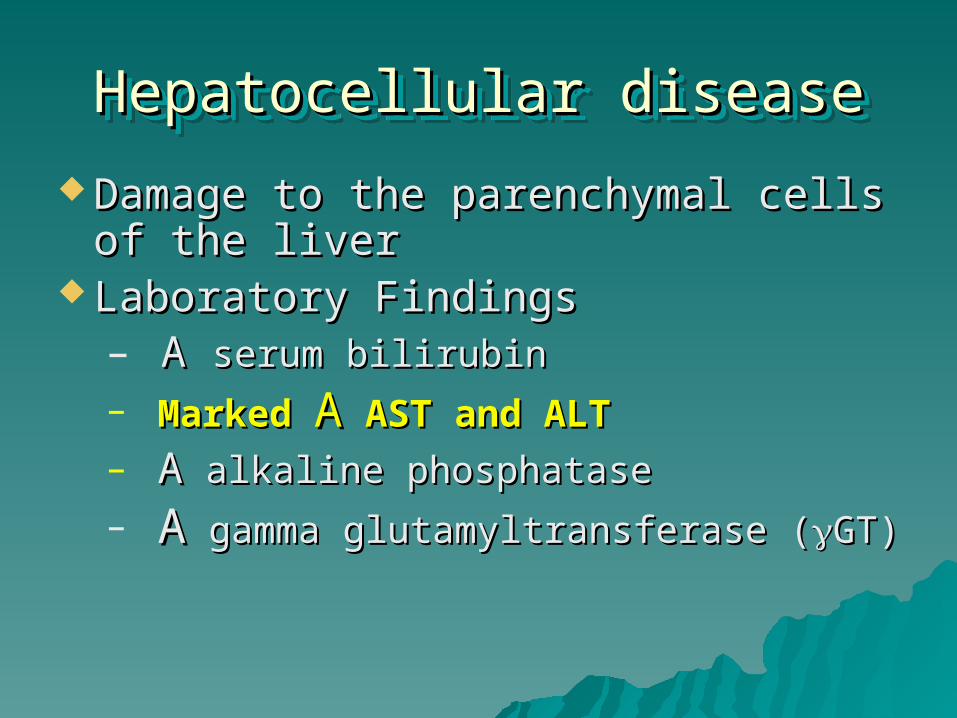
Hepatocellular diseaseHepatocellular diseaseHepatocellular diseaseHepatocellular disease
Damage to the parenchymal cells of Damage to the parenchymal cells of the liverthe liver
Laboratory FindingsLaboratory Findings– A A serum bilirubinserum bilirubin
– Marked Marked AA AST and ALT AST and ALT– AA alkaline phosphatase alkaline phosphatase
– AA gamma glutamyltransferase ( gamma glutamyltransferase (GT)GT)
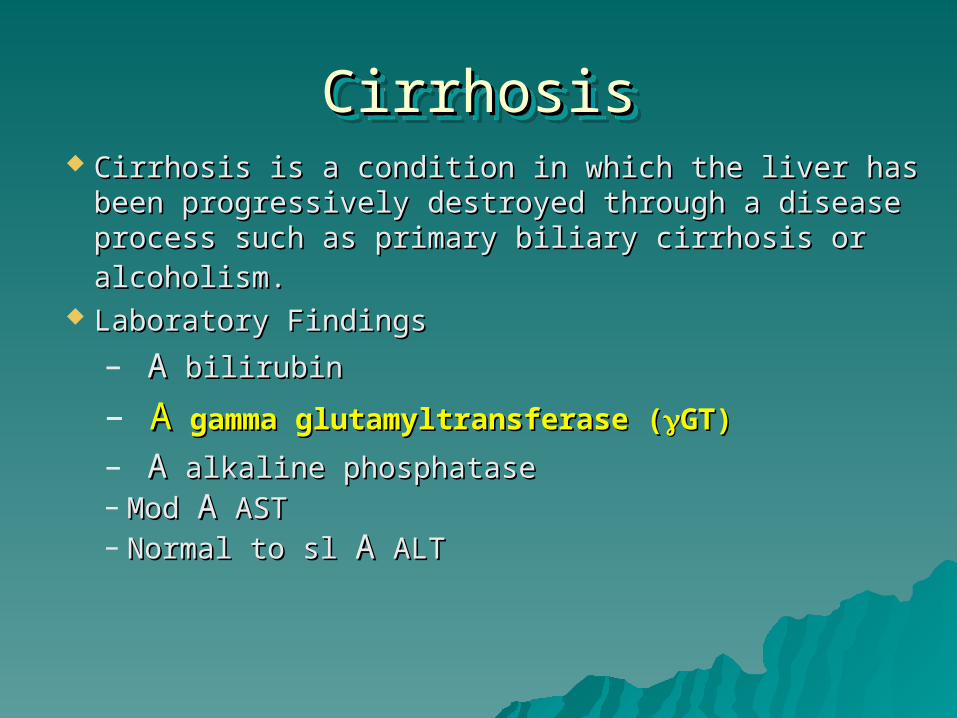
CirrhosisCirrhosisCirrhosisCirrhosis Cirrhosis is a condition in which the liver has been Cirrhosis is a condition in which the liver has been
progressively destroyed through a disease process progressively destroyed through a disease process such as primary biliary cirrhosis or alcoholism.such as primary biliary cirrhosis or alcoholism.
Laboratory FindingsLaboratory Findings
– AA bilirubin bilirubin
– AA gamma glutamyltransferase ( gamma glutamyltransferase (GT)GT)
– AA alkaline phosphatase alkaline phosphatase– Mod Mod AA AST AST– Normal to sl Normal to sl AA ALT ALT
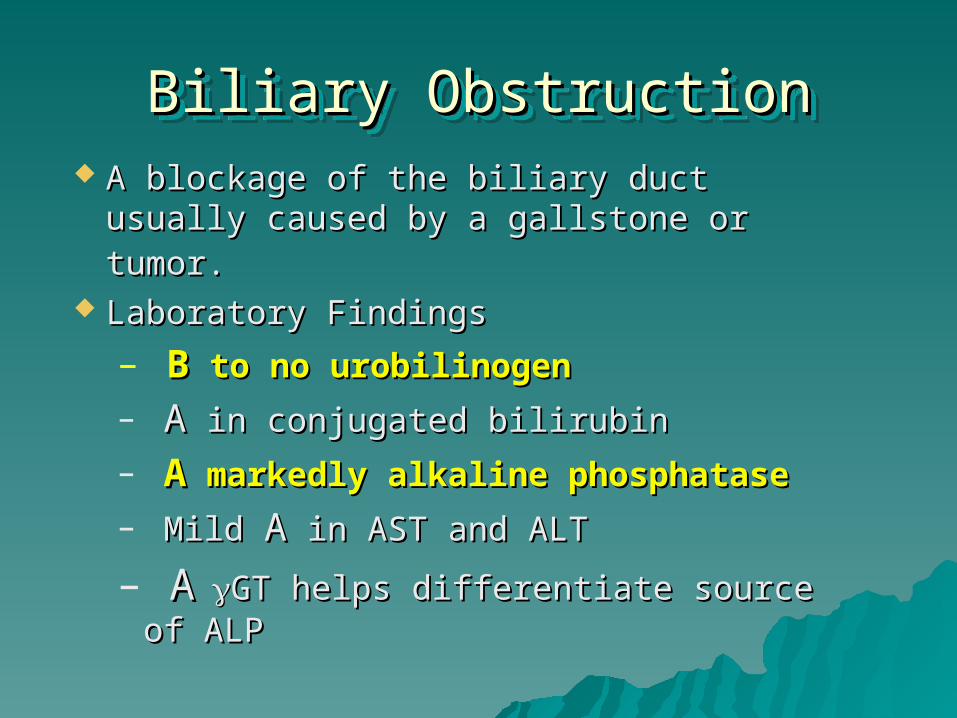
Biliary ObstructionBiliary ObstructionBiliary ObstructionBiliary Obstruction A blockage of the biliary duct usually A blockage of the biliary duct usually
caused by a gallstone or tumor.caused by a gallstone or tumor. Laboratory FindingsLaboratory Findings
– BB to no urobilinogen to no urobilinogen
– AA in conjugated bilirubin in conjugated bilirubin
– AA markedly alkaline phosphatase markedly alkaline phosphatase
– Mild Mild AA in AST and ALT in AST and ALT
– AAGT helps differentiate source of GT helps differentiate source of ALP ALP

Renal FunctionRenal FunctionRenal FunctionRenal Function

Clinical ChemistryClinical ChemistryPart 3Part 3
Vicki S. FreemanVicki S. Freeman
Renal FunctionRenal FunctionRenal FunctionRenal Function
ObjectivesObjectivesRenal FunctionRenal Function Identify laboratory tests commonly used to diagnose renal Identify laboratory tests commonly used to diagnose renal
disease:disease:– BUN (urea)BUN (urea)– CreatinineCreatinine– Creatinine Clearance Creatinine Clearance – AmmoniaAmmonia
Discuss the sensitivity and specificity of serum creatinine and BUN Discuss the sensitivity and specificity of serum creatinine and BUN as renal function tests.as renal function tests.
Correlate kidney function tests with clinical findings in:Correlate kidney function tests with clinical findings in:– GlomerulonephritisGlomerulonephritis– Nephrotic SyndromeNephrotic Syndrome– Renal tubular acidosisRenal tubular acidosis– Renal failure - acute and chronicRenal failure - acute and chronic– Renal transplantsRenal transplants
Correlate uric acid values with advanced chronic renal failure and Correlate uric acid values with advanced chronic renal failure and gout.gout.
Renal Function ProfileRenal Function ProfileRenal Function ProfileRenal Function Profile
Electrolytes (NA, K, CL,HCOElectrolytes (NA, K, CL,HCO33)) Anion gapAnion gap BUN and CreatinineBUN and Creatinine Creatinine clearanceCreatinine clearance GlucoseGlucose Ca, P, and MgCa, P, and Mg Protein and AlbuminProtein and Albumin 24 hr urine protein and creatinine24 hr urine protein and creatinine
Renal FunctionRenal FunctionRenal FunctionRenal Function
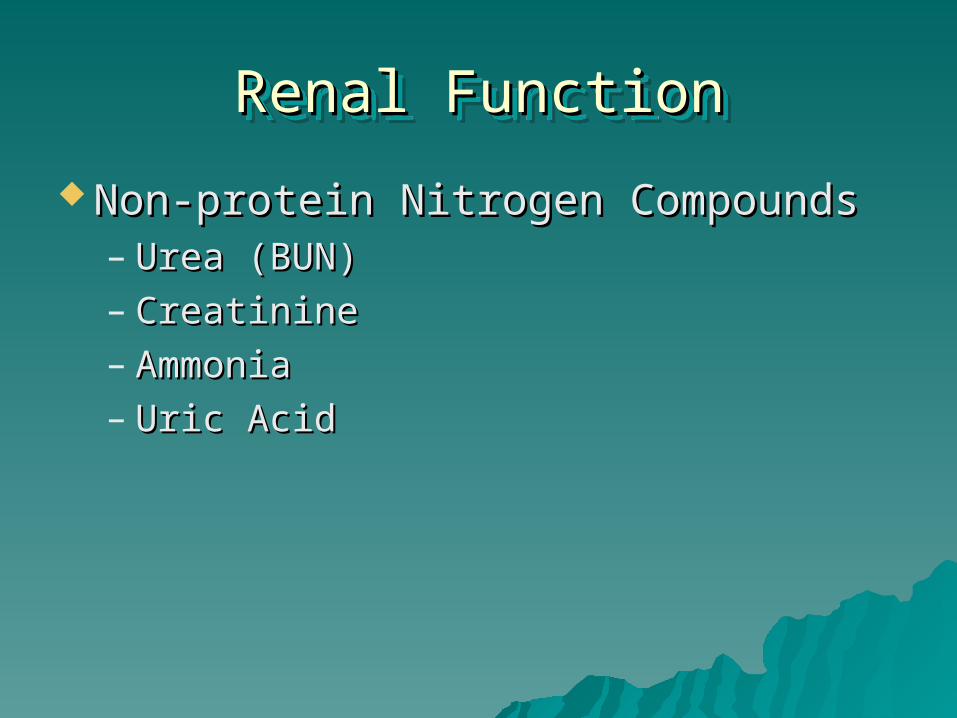
Non-protein Nitrogen CompoundsNon-protein Nitrogen Compounds– Urea (BUN)Urea (BUN)– CreatinineCreatinine– AmmoniaAmmonia– Uric AcidUric Acid
AzotemiaAzotemiaAzotemiaAzotemia
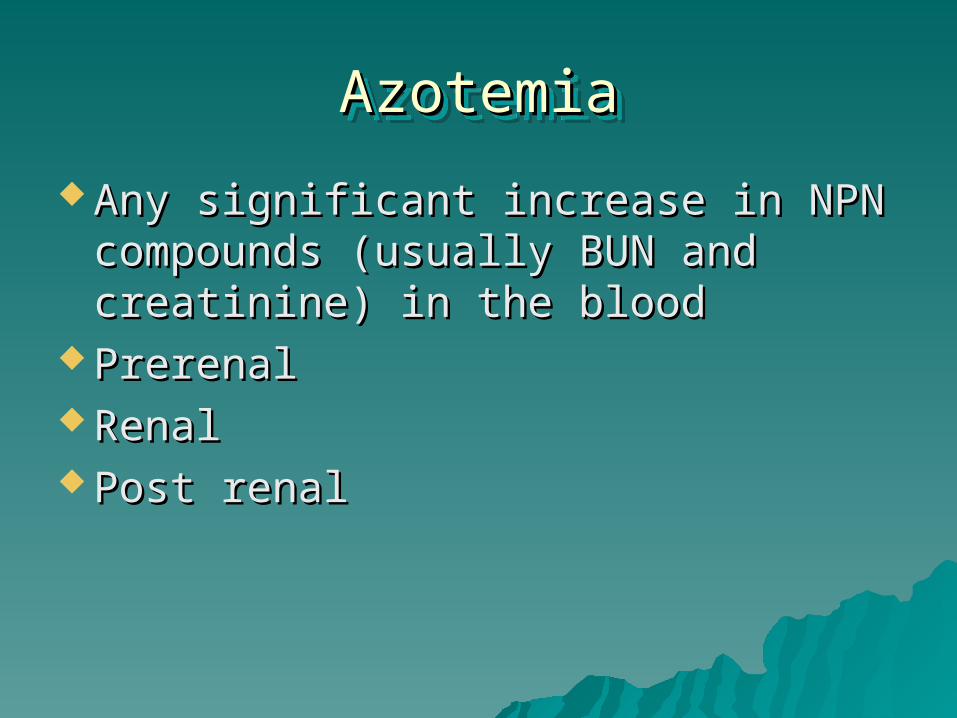
Any significant increase in NPN Any significant increase in NPN compounds (usually BUN and compounds (usually BUN and creatinine) in the bloodcreatinine) in the blood
PrerenalPrerenal RenalRenal Post renalPost renal
Blood Urea Nitrogen (BUN)Blood Urea Nitrogen (BUN)Blood Urea Nitrogen (BUN)Blood Urea Nitrogen (BUN)
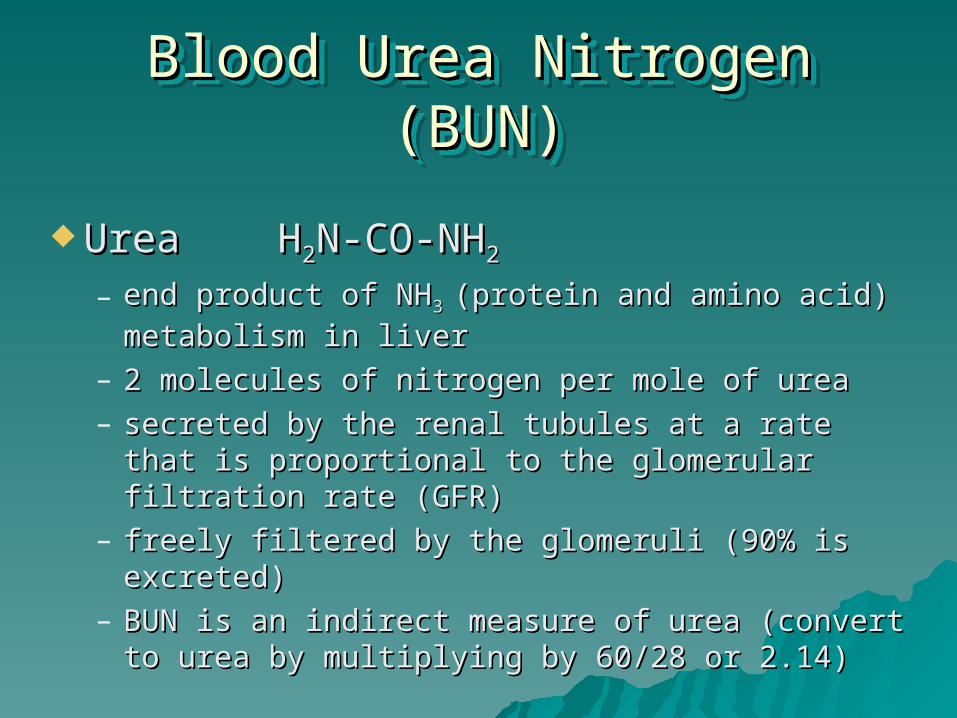
Urea HUrea H22N-CO-NHN-CO-NH22
– end product of NHend product of NH3 3 (protein and amino acid) (protein and amino acid) metabolism in livermetabolism in liver
– 2 molecules of nitrogen per mole of urea2 molecules of nitrogen per mole of urea– secreted by the renal tubules at a rate that is secreted by the renal tubules at a rate that is
proportional to the glomerular filtration rate proportional to the glomerular filtration rate (GFR)(GFR)
– freely filtered by the glomeruli (90% is excreted)freely filtered by the glomeruli (90% is excreted)– BUN is an indirect measure of urea (convert to BUN is an indirect measure of urea (convert to
urea by multiplying by 60/28 or 2.14)urea by multiplying by 60/28 or 2.14)
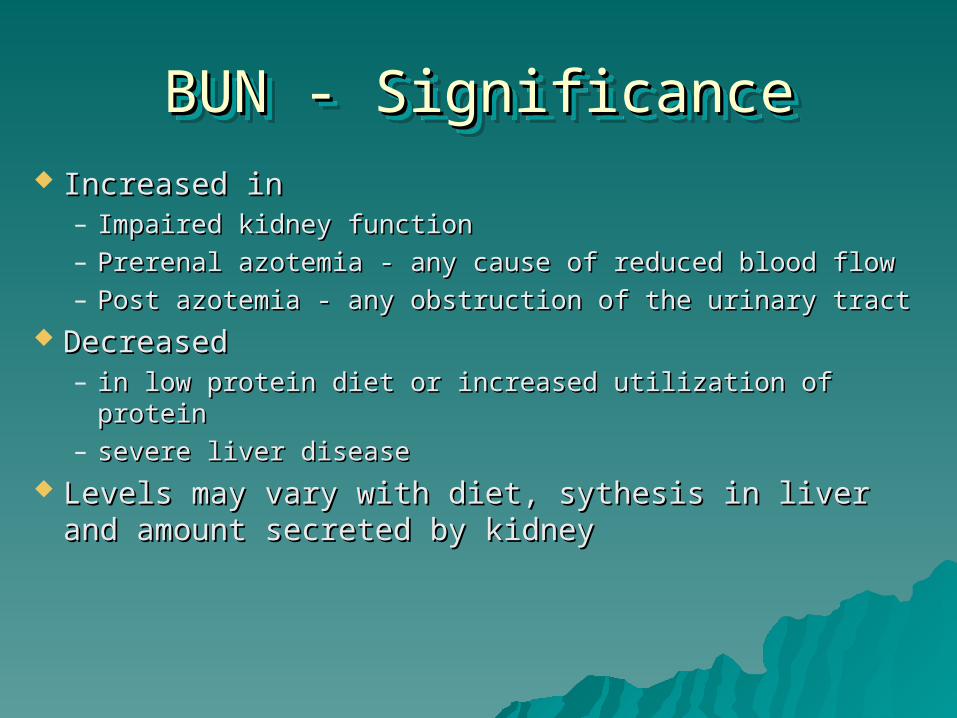
BUN - SignificanceBUN - SignificanceBUN - SignificanceBUN - Significance Increased inIncreased in
– Impaired kidney functionImpaired kidney function– Prerenal azotemia - any cause of reduced blood flowPrerenal azotemia - any cause of reduced blood flow– Post azotemia - any obstruction of the urinary tractPost azotemia - any obstruction of the urinary tract
Decreased Decreased – in low protein diet or increased utilization of proteinin low protein diet or increased utilization of protein– severe liver diseasesevere liver disease
Levels may vary with diet, sythesis in liver and Levels may vary with diet, sythesis in liver and amount secreted by kidneyamount secreted by kidney
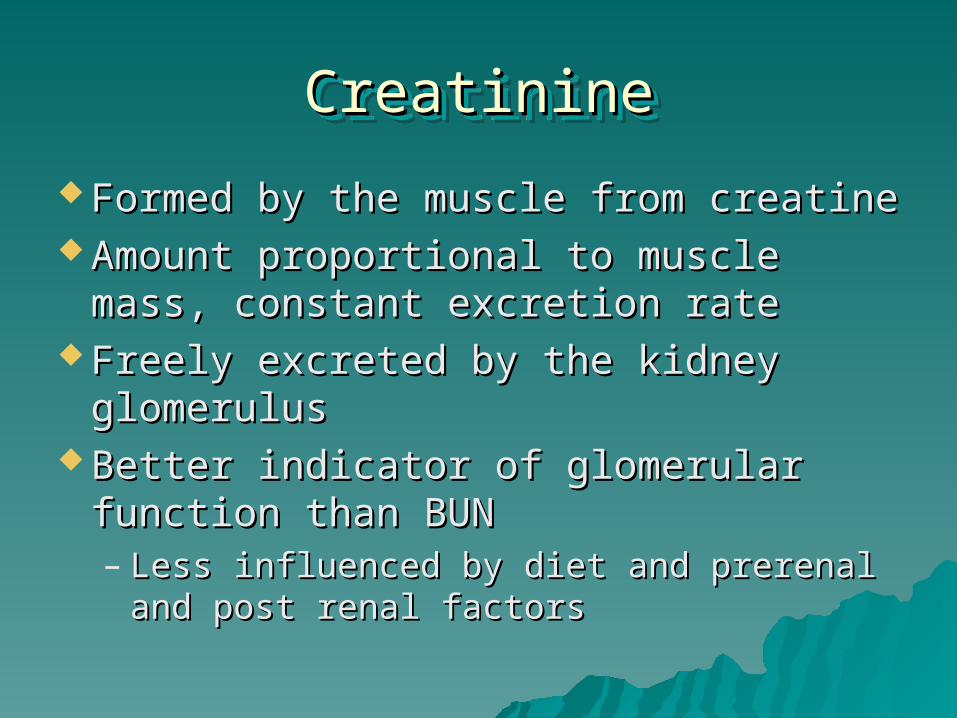
CreatinineCreatinineCreatinineCreatinine
Formed by the muscle from creatineFormed by the muscle from creatine Amount proportional to muscle mass, Amount proportional to muscle mass,
constant excretion rateconstant excretion rate Freely excreted by the kidney Freely excreted by the kidney
glomerulus glomerulus Better indicator of glomerular function Better indicator of glomerular function
than BUNthan BUN– Less influenced by diet and prerenal and Less influenced by diet and prerenal and
post renal factorspost renal factors
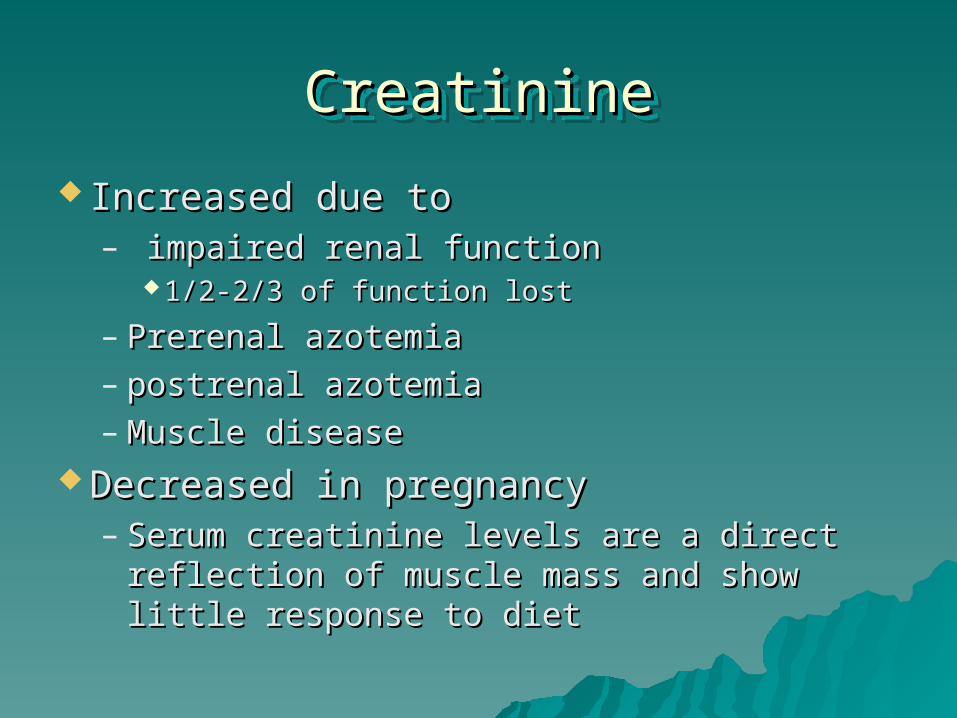
CreatinineCreatinineCreatinineCreatinine
Increased due toIncreased due to– impaired renal functionimpaired renal function
1/2-2/3 of function lost1/2-2/3 of function lost
– Prerenal azotemiaPrerenal azotemia– postrenal azotemiapostrenal azotemia– Muscle diseaseMuscle disease
Decreased in pregnancyDecreased in pregnancy– Serum creatinine levels are a direct Serum creatinine levels are a direct
reflection of muscle mass and show little reflection of muscle mass and show little response to dietresponse to diet
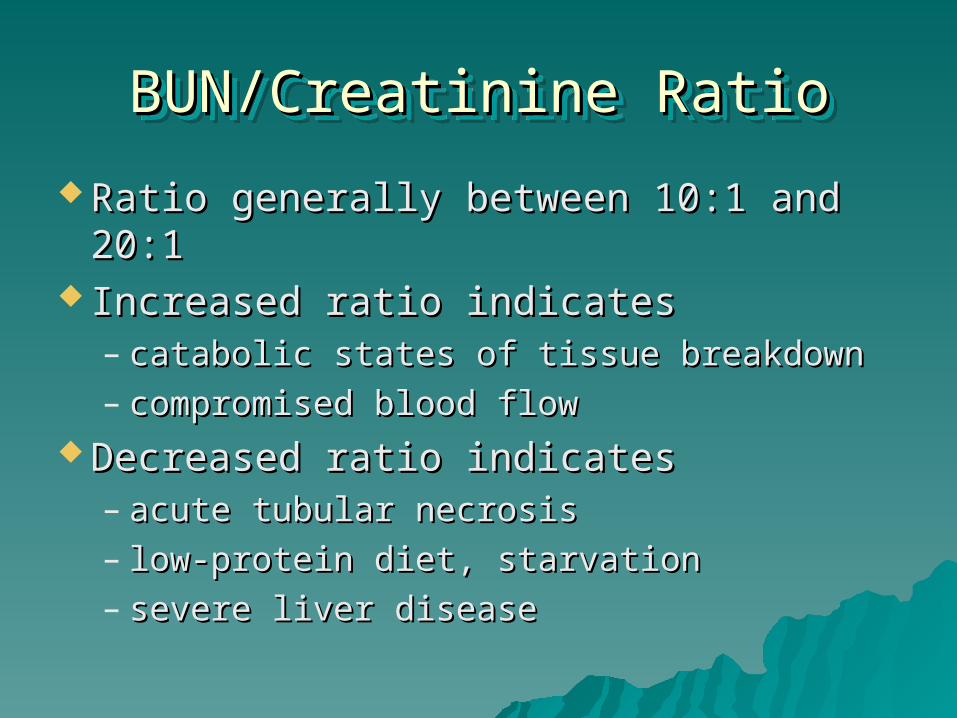
BUN/Creatinine RatioBUN/Creatinine RatioBUN/Creatinine RatioBUN/Creatinine Ratio
Ratio generally between 10:1 and 20:1Ratio generally between 10:1 and 20:1 Increased ratio indicatesIncreased ratio indicates
– catabolic states of tissue breakdowncatabolic states of tissue breakdown– compromised blood flow compromised blood flow
Decreased ratio indicatesDecreased ratio indicates– acute tubular necrosisacute tubular necrosis– low-protein diet, starvationlow-protein diet, starvation– severe liver diseasesevere liver disease
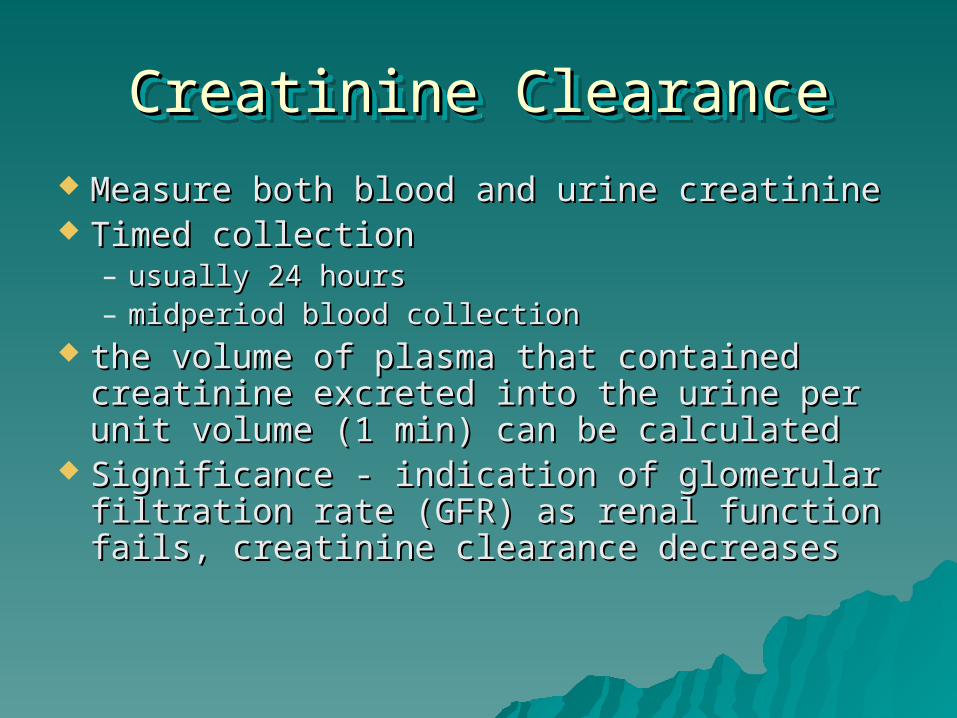
Creatinine ClearanceCreatinine ClearanceCreatinine ClearanceCreatinine Clearance
Measure both blood and urine creatinineMeasure both blood and urine creatinine Timed collectionTimed collection
– usually 24 hoursusually 24 hours– midperiod blood collectionmidperiod blood collection
the volume of plasma that contained the volume of plasma that contained creatinine excreted into the urine per unit creatinine excreted into the urine per unit volume (1 min) can be calculatedvolume (1 min) can be calculated
Significance - indication of glomerular Significance - indication of glomerular filtration rate (GFR) as renal function fails, filtration rate (GFR) as renal function fails, creatinine clearance decreasescreatinine clearance decreases
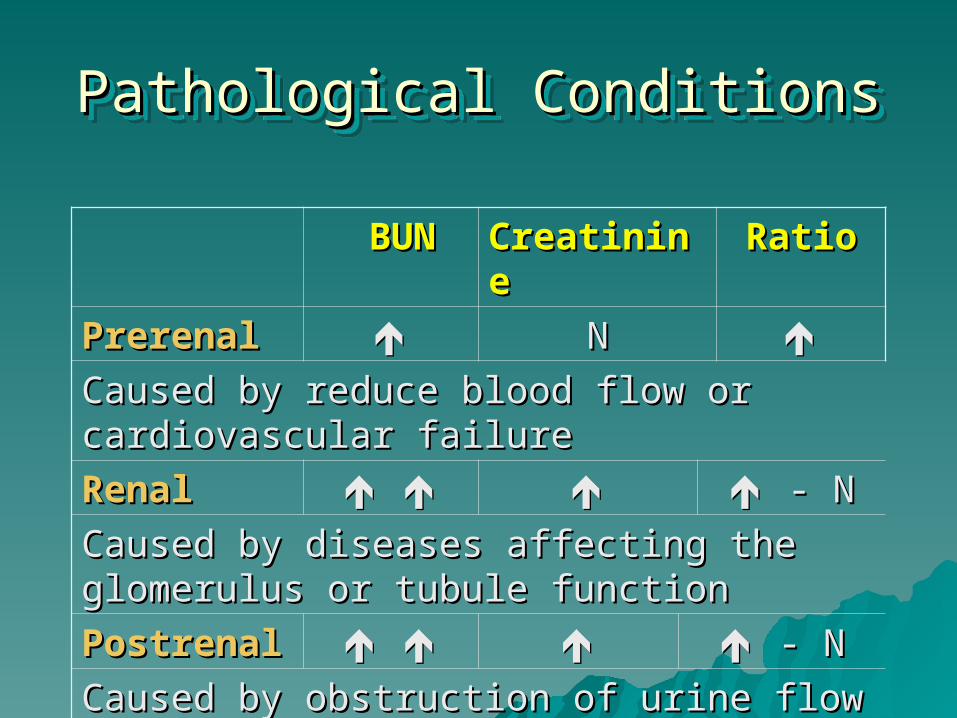
Pathological ConditionsPathological ConditionsPathological ConditionsPathological Conditions
BUNBUN CreatinineCreatinine RatioRatio
PrerenalPrerenal NN Caused by reduce blood flow or Caused by reduce blood flow or cardiovascular failurecardiovascular failure
RenalRenal - N- N
Caused by diseases affecting the Caused by diseases affecting the glomerulus or tubule functionglomerulus or tubule function
PostrenalPostrenal - N- N
Caused by obstruction of urine flow Caused by obstruction of urine flow
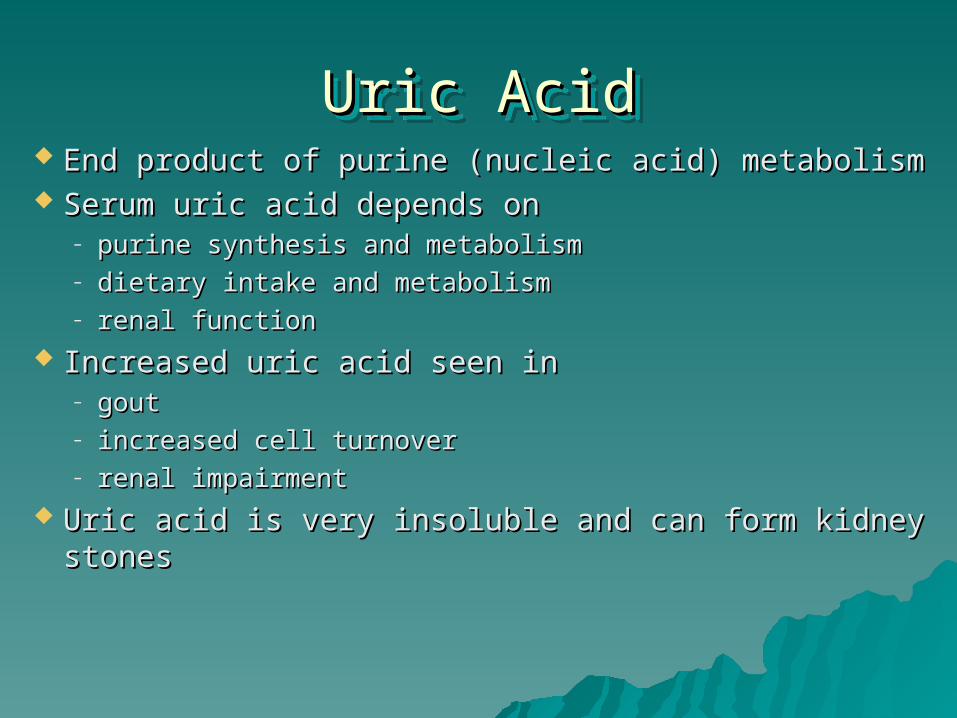
Uric AcidUric AcidUric AcidUric Acid End product of purine (nucleic acid) metabolismEnd product of purine (nucleic acid) metabolism Serum uric acid depends onSerum uric acid depends on
– purine synthesis and metabolismpurine synthesis and metabolism– dietary intake and metabolismdietary intake and metabolism– renal functionrenal function
Increased uric acid seen inIncreased uric acid seen in– goutgout– increased cell turnoverincreased cell turnover– renal impairmentrenal impairment
Uric acid is very insoluble and can form kidney Uric acid is very insoluble and can form kidney stonesstones
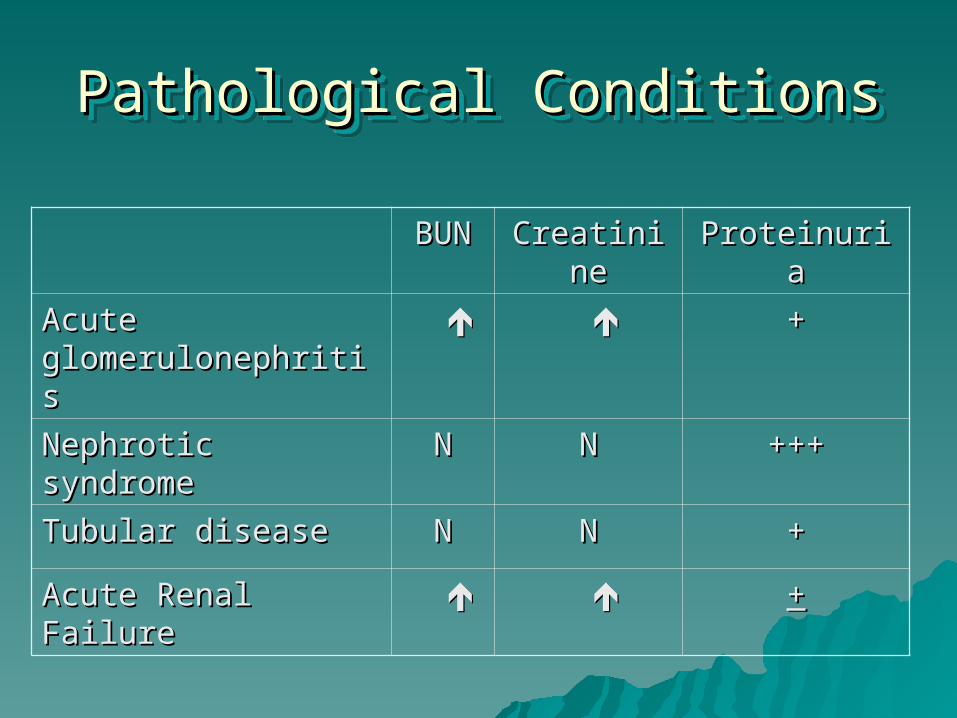
Pathological ConditionsPathological ConditionsPathological ConditionsPathological Conditions
BUNBUN CreatinineCreatinine ProteinuriaProteinuria
Acute Acute glomerulonephritisglomerulonephritis
++
Nephrotic syndromeNephrotic syndrome NN NN ++++++
Tubular diseaseTubular disease NN NN ++
Acute Renal Failure Acute Renal Failure ++
Renal Tubular Function TestsRenal Tubular Function TestsRenal Tubular Function TestsRenal Tubular Function Tests
Measures the concentrating and diluting Measures the concentrating and diluting ability of the renal tubulesability of the renal tubules
OsmolalityOsmolality– Measure of # of moles of particles/kg waterMeasure of # of moles of particles/kg water– Impairment of renal concentrating ability is Impairment of renal concentrating ability is
an early manifestation of chronic renal an early manifestation of chronic renal diseasedisease
Specific gravitySpecific gravity– ratio of weight in grams/ml of body fluid ratio of weight in grams/ml of body fluid
compared to watercompared to water
ElectrolytesElectrolytesElectrolytesElectrolytes
ObjectivesObjectives
Electrolytes and Acid-base BalanceElectrolytes and Acid-base Balance Identify the major electrolytes found in the body and the Identify the major electrolytes found in the body and the
relative distribution of each.relative distribution of each. Calculate an anion gap given a set of electrolyte values.Calculate an anion gap given a set of electrolyte values. Describe the use of a measured and calculated osmolality Describe the use of a measured and calculated osmolality
result.result. Calculate an osmolality given a set of laboratory results.Calculate an osmolality given a set of laboratory results. Identity the normal HCO3/H2CO3,Identity the normal HCO3/H2CO3, Describe the laboratory parameters (pH, pCO2, and HCO3) Describe the laboratory parameters (pH, pCO2, and HCO3)
for the following acid/base disorders:for the following acid/base disorders:– Respiratory acidosisRespiratory acidosis– Respiratory alkalosisRespiratory alkalosis– Metabolic acidosisMetabolic acidosis– Metabolic alkalosisMetabolic alkalosis
ElectrolytesElectrolytes ElectrolytesElectrolytes
Cations - Cations - – positively charged ionspositively charged ions– includes major electrolytesincludes major electrolytes
NaNa++ CaCa++
KK++ MgMg++
– Trace elementsTrace elements CuCu++ ++ FeFe++++ MnMn++++ LiLi++
ZnZn++++ CoCo++++ BrBr++++
ElectrolytesElectrolytesElectrolytesElectrolytes
AnionsAnions– Negatively charged ionsNegatively charged ions– Includes major electrolytesIncludes major electrolytes
ClCl-- HPOHPO44----
HCOHCO22-- SOSO44
----
– Trace elementsTrace elements II--
FlFl--
ElectrolytesElectrolytesElectrolytesElectrolytes
ExtracellularExtracellular– Na - Major cationNa - Major cation– Cl - Major anionCl - Major anion
IntracellularIntracellular– K - major cationK - major cation– Others - MgOthers - Mg
Sodium: Major extracellular cationSodium: Major extracellular cation
NaNa++ levels are controlled by renal tubular levels are controlled by renal tubular function and somewhat by aldosterone function and somewhat by aldosterone (adrenocortical hormone from renin-(adrenocortical hormone from renin-angiotensin system)angiotensin system)– Relates to plasma osmolality (2x NaRelates to plasma osmolality (2x Na++ ~ ~
osmolality)osmolality) Hypernatremia: hypotonic dehydration, Hypernatremia: hypotonic dehydration,
renal failure, lack of ADH, renal failure, lack of ADH, hyperaldosteronism, etc. hyperaldosteronism, etc.
Hyponatremia: over-hydration, renal Hyponatremia: over-hydration, renal tubular dysfunction, hypoaldosteronismtubular dysfunction, hypoaldosteronism
Potassium: main intracellular cationPotassium: main intracellular cation
KK++ levels controlled by renal tubular secretion/ levels controlled by renal tubular secretion/ reabsorption and affected by aldosterone reabsorption and affected by aldosterone (inversely with Na), acid-base balance and (inversely with Na), acid-base balance and glucose transport under insulin influence. glucose transport under insulin influence. – Plasma KPlasma K++ falsely increased in hemolysis. falsely increased in hemolysis. – KK++ levels fall after insulin administered to control levels fall after insulin administered to control
hyperglycemia. hyperglycemia. – KK++ and H and H++ levels often correlate. levels often correlate.
Hyperkalemia due to renal failure, ketoacidosis, Hyperkalemia due to renal failure, ketoacidosis, hypoaldosteronism. hypoaldosteronism.
Hypokalemia in renal tubular defects, Hypokalemia in renal tubular defects, hyperaldosteronism, dietary deficiencies (esp. hyperaldosteronism, dietary deficiencies (esp. when taking diuretics or laxatives), severe when taking diuretics or laxatives), severe vomitingvomiting
Chloride: main extracellular anionChloride: main extracellular anion
ClCl-- is controlled by renal function with is controlled by renal function with aldosterone influence on tubular secretion aldosterone influence on tubular secretion (Na(Na++ and Cl and Cl-- are reabsorbed as K are reabsorbed as K++ and H and H++ secreted) in response to aldosterone. secreted) in response to aldosterone.
Hyperchloremia may be due to Hyperchloremia may be due to dehydration, severe hyperaldosteronism, dehydration, severe hyperaldosteronism, renal failure, diabetes insipidus, etc. renal failure, diabetes insipidus, etc. Hypochloremia is found in overhydration, Hypochloremia is found in overhydration, severe vomiting, renal tubular dysfunction, severe vomiting, renal tubular dysfunction, severe hypoaldosteronismsevere hypoaldosteronism
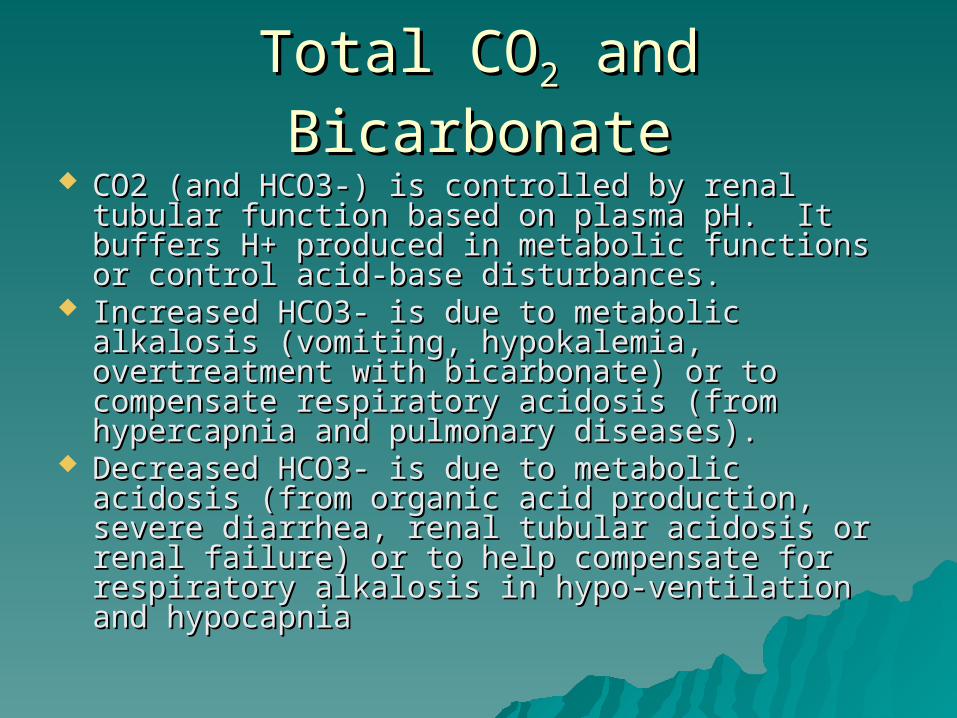
Total COTotal CO22 and Bicarbonate and Bicarbonate
CO2 (and HCO3-) is controlled by renal tubular CO2 (and HCO3-) is controlled by renal tubular function based on plasma pH. It buffers H+ function based on plasma pH. It buffers H+ produced in metabolic functions or control acid-produced in metabolic functions or control acid-base disturbances. base disturbances.
Increased HCO3- is due to metabolic alkalosis Increased HCO3- is due to metabolic alkalosis (vomiting, hypokalemia, overtreatment with (vomiting, hypokalemia, overtreatment with bicarbonate) or to compensate respiratory bicarbonate) or to compensate respiratory acidosis (from hypercapnia and pulmonary acidosis (from hypercapnia and pulmonary diseases). diseases).
Decreased HCO3- is due to metabolic acidosis Decreased HCO3- is due to metabolic acidosis (from organic acid production, severe diarrhea, (from organic acid production, severe diarrhea, renal tubular acidosis or renal failure) or to help renal tubular acidosis or renal failure) or to help compensate for respiratory alkalosis in hypo-compensate for respiratory alkalosis in hypo-ventilation and hypocapnia ventilation and hypocapnia
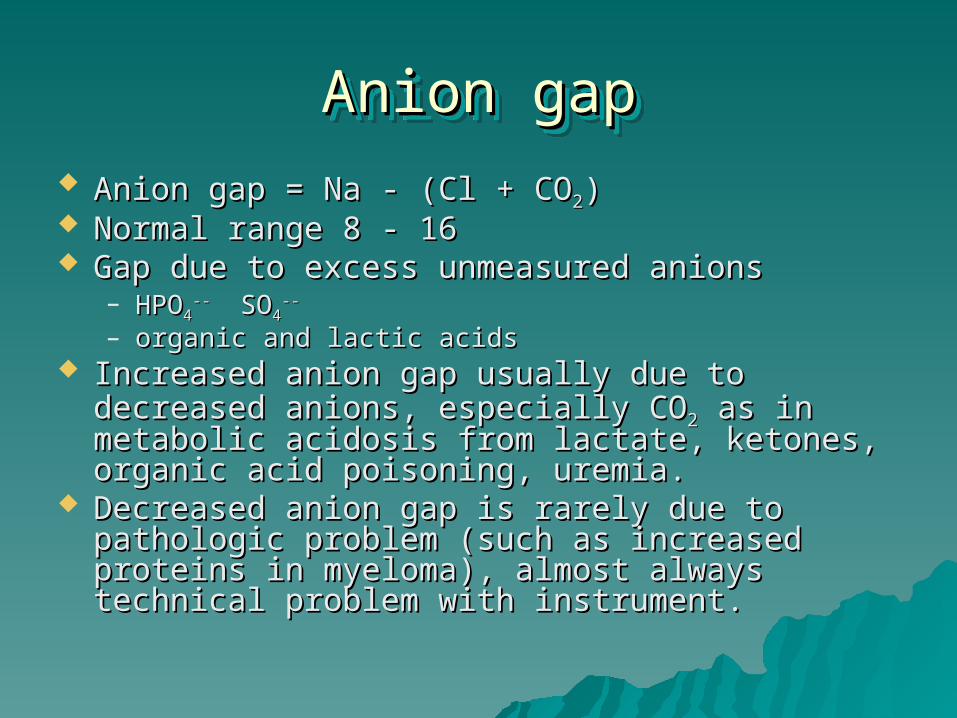
Anion gapAnion gapAnion gapAnion gap Anion gap = Na - (Cl + COAnion gap = Na - (Cl + CO22)) Normal range 8 - 16Normal range 8 - 16 Gap due to excess unmeasured anionsGap due to excess unmeasured anions
– HPOHPO44---- SOSO44
-- --
– organic and lactic acidsorganic and lactic acids Increased anion gap usually due to decreased Increased anion gap usually due to decreased
anions, especially COanions, especially CO22 as in metabolic acidosis as in metabolic acidosis from lactate, ketones, organic acid poisoning, from lactate, ketones, organic acid poisoning, uremia. uremia.
Decreased anion gap is rarely due to pathologic Decreased anion gap is rarely due to pathologic problem (such as increased proteins in myeloma), problem (such as increased proteins in myeloma), almost always technical problem with instrument.almost always technical problem with instrument.
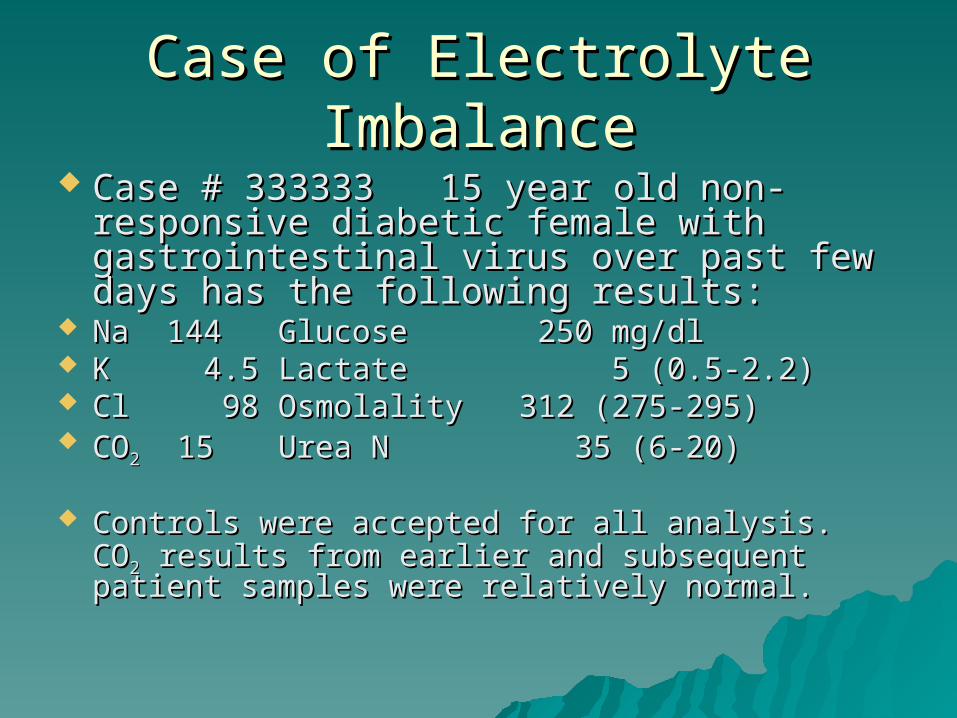
Case of Electrolyte ImbalanceCase of Electrolyte Imbalance Case # 333333 15 year old non-Case # 333333 15 year old non-
responsive diabetic female with responsive diabetic female with gastrointestinal virus over past few days gastrointestinal virus over past few days has the following results:has the following results:
Na 144Na 144 Glucose 250 mg/dlGlucose 250 mg/dl K 4.5K 4.5 Lactate 5 (0.5-2.2)Lactate 5 (0.5-2.2) Cl 98Cl 98 Osmolality 312 (275-Osmolality 312 (275-
295)295) COCO22 15 15 Urea N 35 (6-20)Urea N 35 (6-20)
Controls were accepted for all analysis. COControls were accepted for all analysis. CO22 results from earlier and subsequent patient results from earlier and subsequent patient samples were relatively normal.samples were relatively normal.
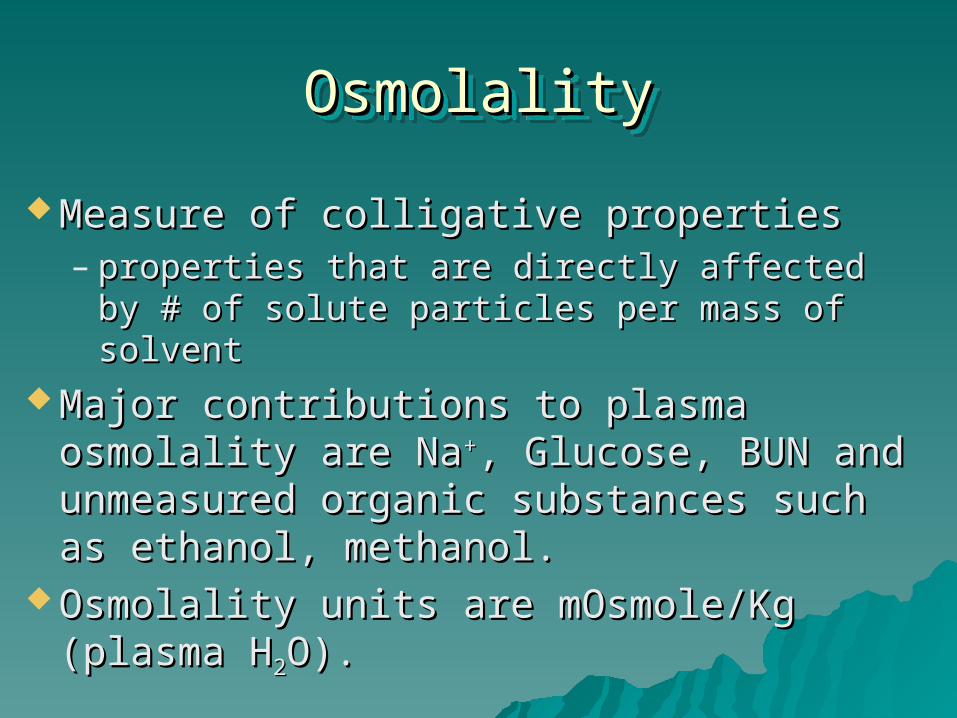
OsmolalityOsmolalityOsmolalityOsmolality
Measure of colligative propertiesMeasure of colligative properties– properties that are directly affected by # properties that are directly affected by #
of solute particles per mass of solventof solute particles per mass of solvent Major contributions to plasma Major contributions to plasma
osmolality are Naosmolality are Na++, Glucose, BUN and , Glucose, BUN and unmeasured organic substances such unmeasured organic substances such as ethanol, methanol. as ethanol, methanol.
Osmolality units are mOsmole/Kg Osmolality units are mOsmole/Kg (plasma H(plasma H22O).O).
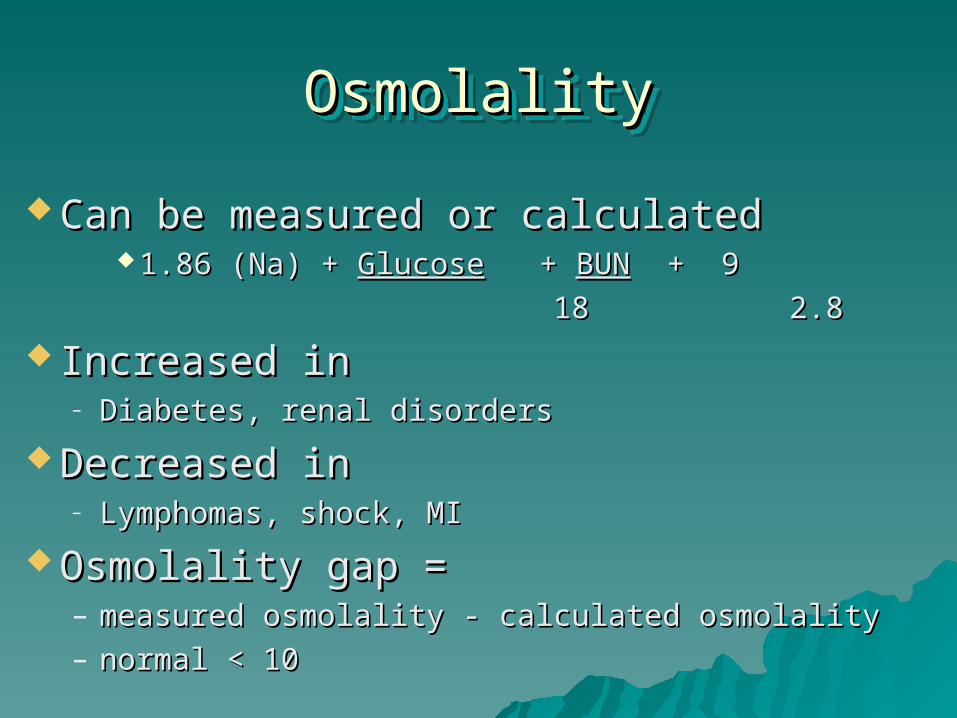
OsmolalityOsmolalityOsmolalityOsmolality
Can be measured or calculatedCan be measured or calculated 1.86 (Na) + 1.86 (Na) + GlucoseGlucose + + BUNBUN + 9 + 9
18 2.818 2.8
Increased inIncreased in– Diabetes, renal disordersDiabetes, renal disorders
Decreased inDecreased in– Lymphomas, shock, MILymphomas, shock, MI
Osmolality gap = Osmolality gap = – measured osmolality - calculated osmolality measured osmolality - calculated osmolality – normal < 10normal < 10
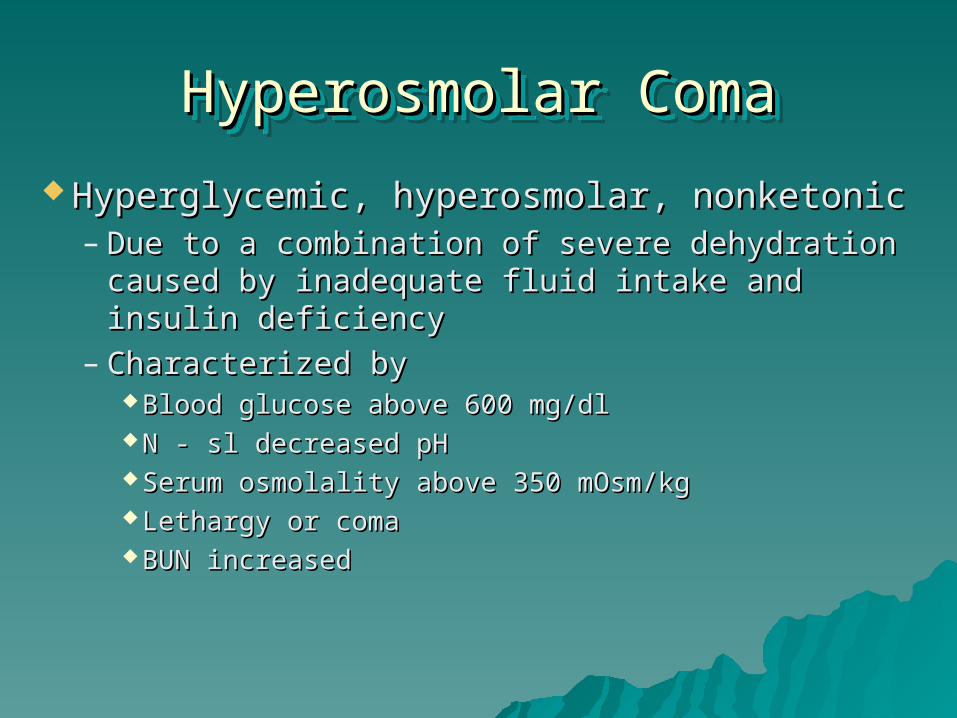
Hyperosmolar ComaHyperosmolar ComaHyperosmolar ComaHyperosmolar Coma
Hyperglycemic, hyperosmolar, nonketonicHyperglycemic, hyperosmolar, nonketonic– Due to a combination of severe dehydration Due to a combination of severe dehydration
caused by inadequate fluid intake and insulin caused by inadequate fluid intake and insulin deficiencydeficiency
– Characterized byCharacterized by Blood glucose above 600 mg/dlBlood glucose above 600 mg/dl N - sl decreased pHN - sl decreased pH Serum osmolality above 350 mOsm/kgSerum osmolality above 350 mOsm/kg Lethargy or comaLethargy or coma BUN increasedBUN increased
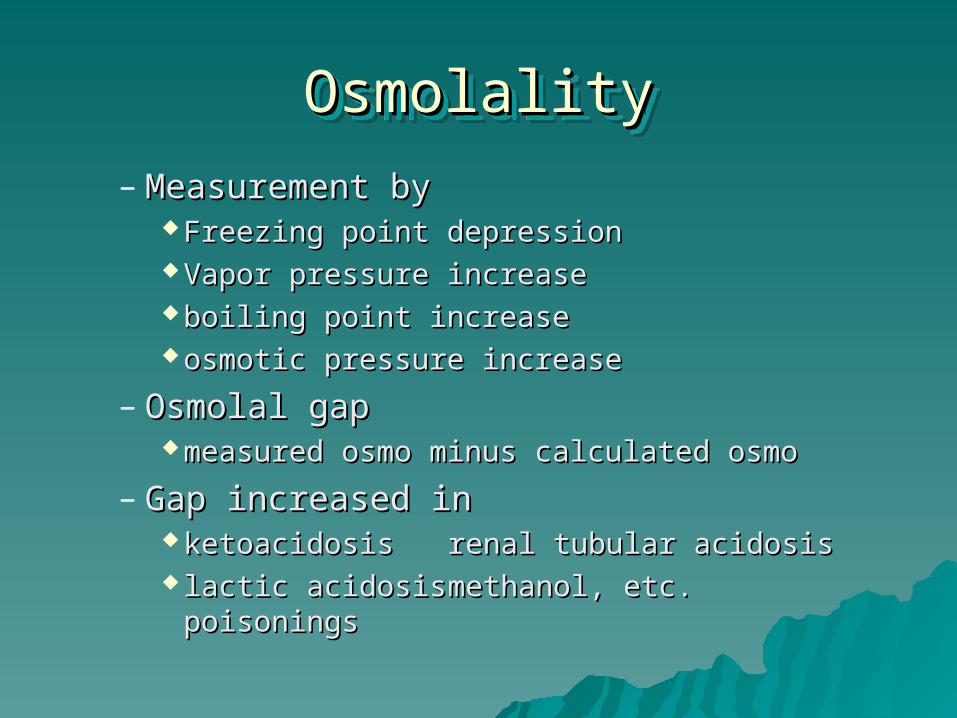
OsmolalityOsmolalityOsmolalityOsmolality
– Measurement byMeasurement by Freezing point depressionFreezing point depression Vapor pressure increaseVapor pressure increase boiling point increaseboiling point increase osmotic pressure increaseosmotic pressure increase
– Osmolal gapOsmolal gap measured osmo minus calculated osmomeasured osmo minus calculated osmo
– Gap increased inGap increased in ketoacidosisketoacidosis renal tubular acidosisrenal tubular acidosis lactic acidosislactic acidosis methanol, etc. poisoningsmethanol, etc. poisonings
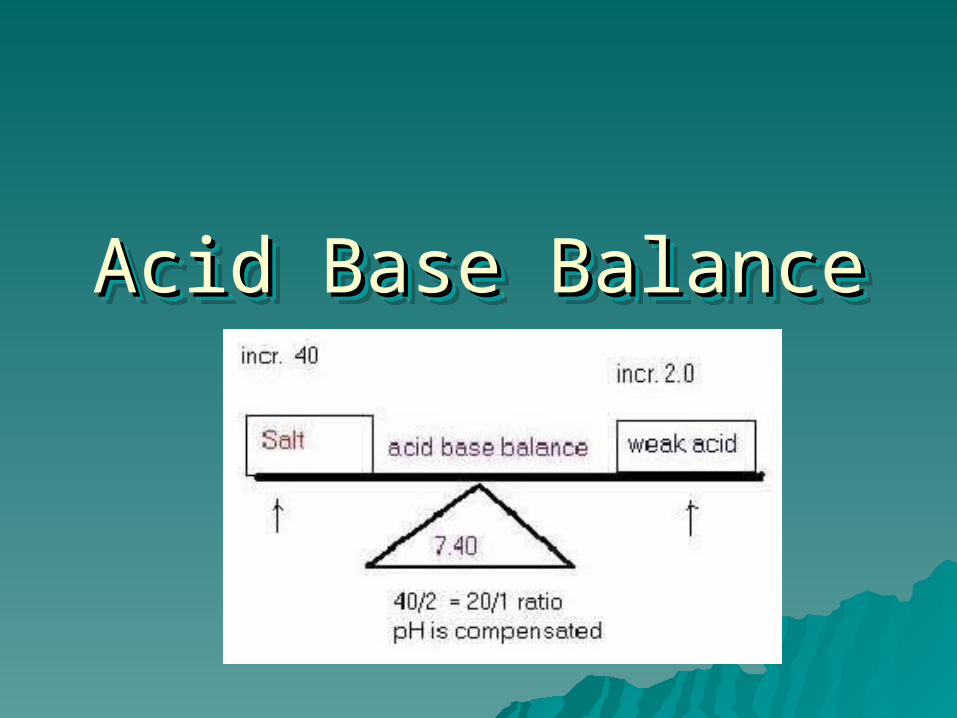
Acid Base BalanceAcid Base BalanceAcid Base BalanceAcid Base Balance
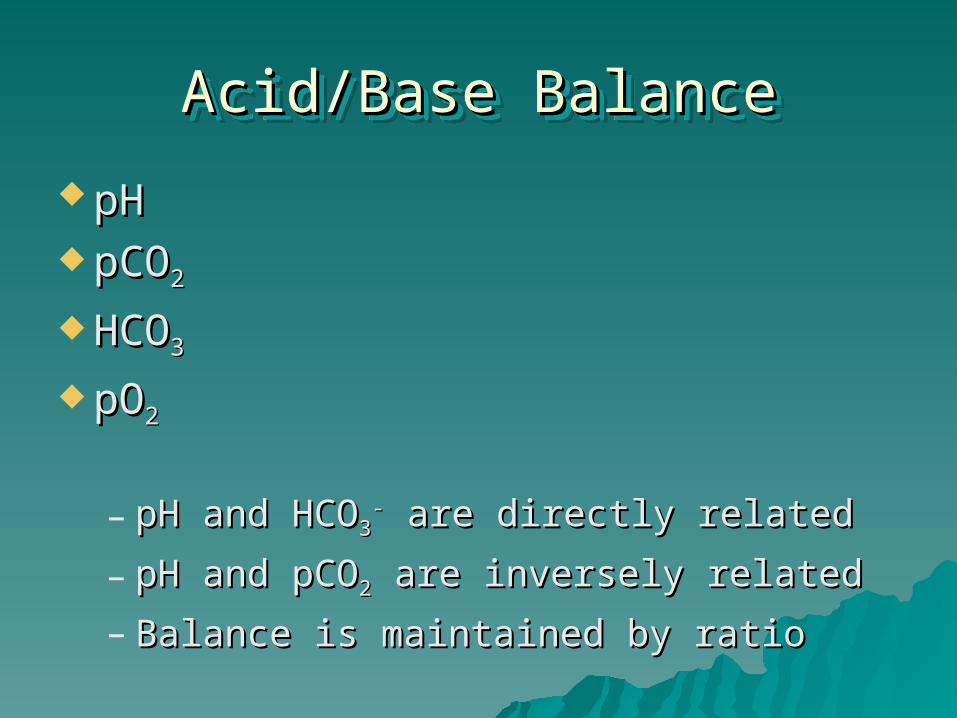
Acid/Base BalanceAcid/Base BalanceAcid/Base BalanceAcid/Base Balance
pHpH pCOpCO22
HCOHCO33
pOpO22
– pH and pH and HCOHCO33-- are directly relatedare directly related
– pH and pH and pCOpCO22 are inversely related are inversely related
– Balance is maintained by ratioBalance is maintained by ratio
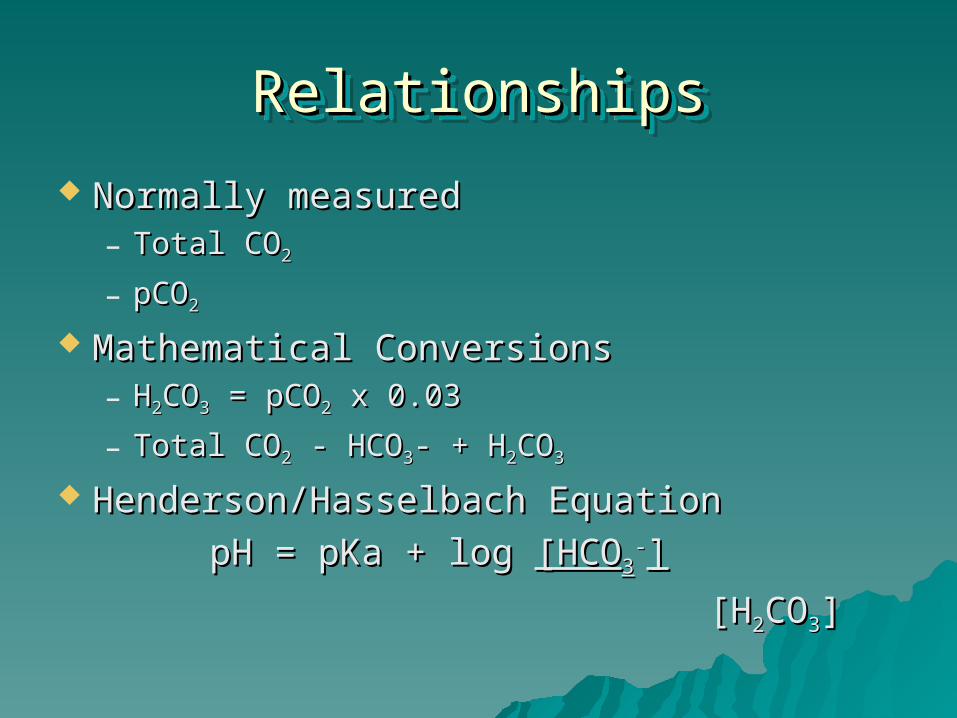
RelationshipsRelationshipsRelationshipsRelationships
Normally measuredNormally measured– Total COTotal CO22
– pCOpCO22
Mathematical ConversionsMathematical Conversions– HH22COCO33 = pCO = pCO22 x 0.03 x 0.03
– Total COTotal CO22 - HCO - HCO33- + H- + H22COCO33
Henderson/Hasselbach EquationHenderson/Hasselbach Equation
pH = pKa + log pH = pKa + log [HCO[HCO33--]]
[H[H22COCO33]]
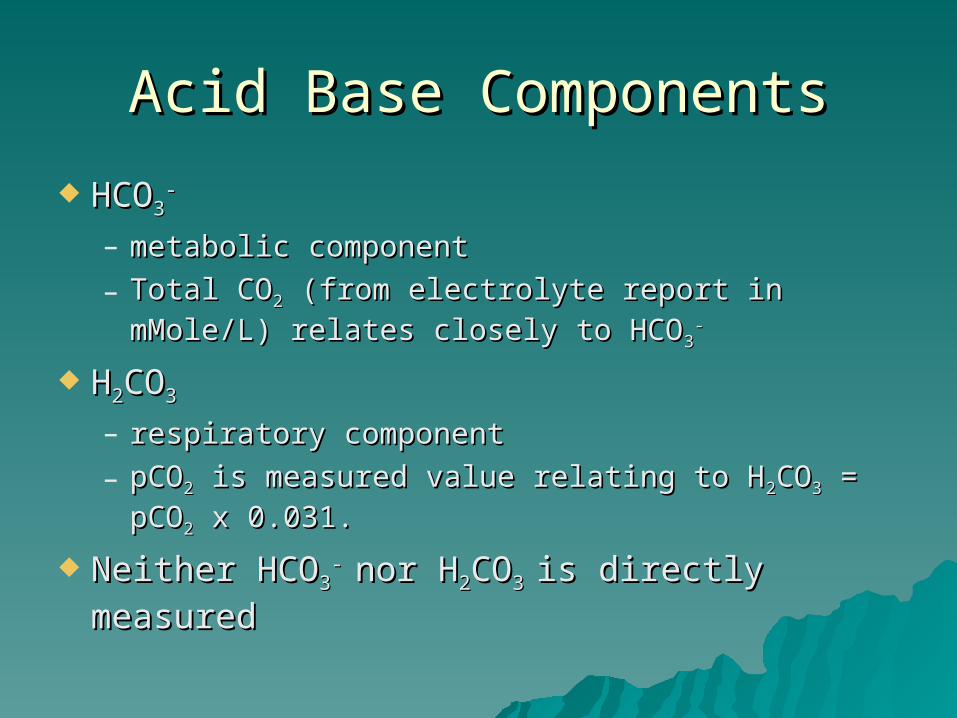
Acid Base ComponentsAcid Base Components
HCOHCO33--
– metabolic componentmetabolic component
– Total COTotal CO22 (from electrolyte report in mMole/L) (from electrolyte report in mMole/L) relates closely to HCOrelates closely to HCO33
--
HH22COCO33
– respiratory component respiratory component
– pCOpCO22 is measured value relating to H is measured value relating to H22COCO33 = pCO = pCO22 x 0.031.x 0.031.
Neither HCONeither HCO33- - nor Hnor H22COCO3 3 is directly measuredis directly measured
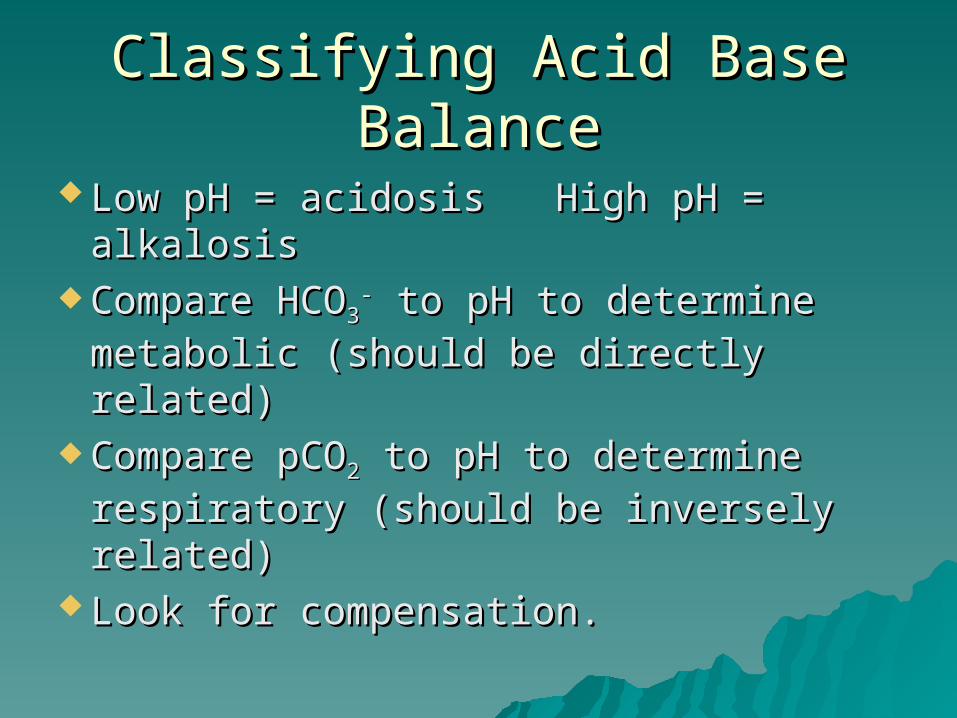
Classifying Acid Base BalanceClassifying Acid Base Balance
Low pH = acidosis High pH = Low pH = acidosis High pH = alkalosisalkalosis
Compare Compare HCOHCO33-- to pH to determine to pH to determine
metabolic (should be directly related)metabolic (should be directly related) Compare Compare pCOpCO22 to pH to determine to pH to determine
respiratory (should be inversely respiratory (should be inversely related)related)
Look for compensation.Look for compensation.
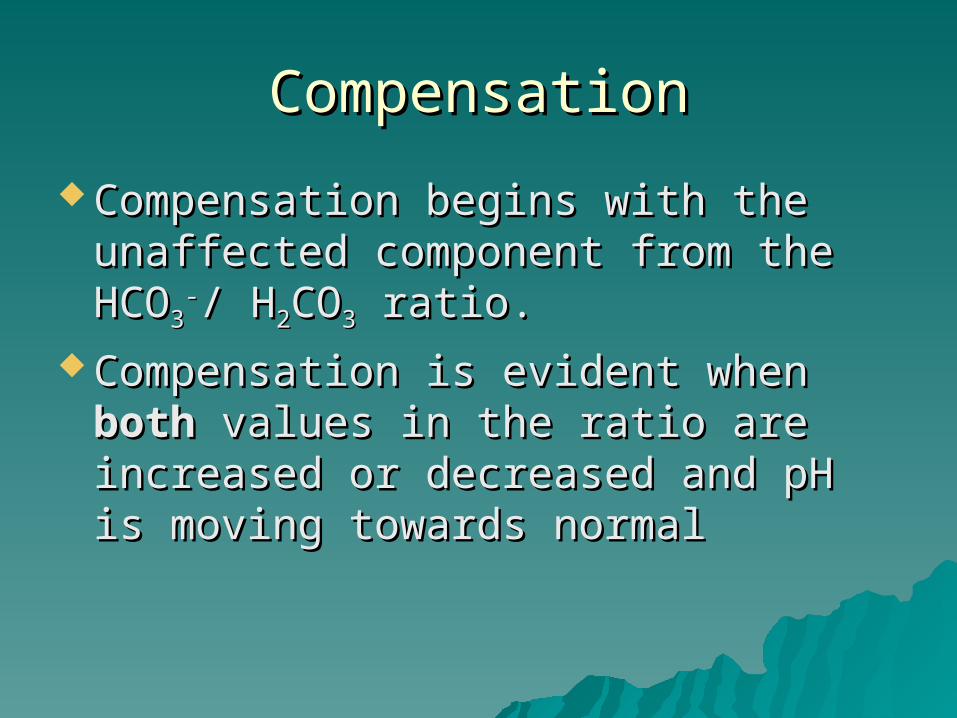
CompensationCompensation
Compensation begins with the Compensation begins with the unaffected component from the unaffected component from the HCOHCO33
--/ H/ H22COCO33 ratio. ratio. Compensation is evident when Compensation is evident when bothboth
values in the ratio are increased or values in the ratio are increased or decreased and pH is moving towards decreased and pH is moving towards normalnormal
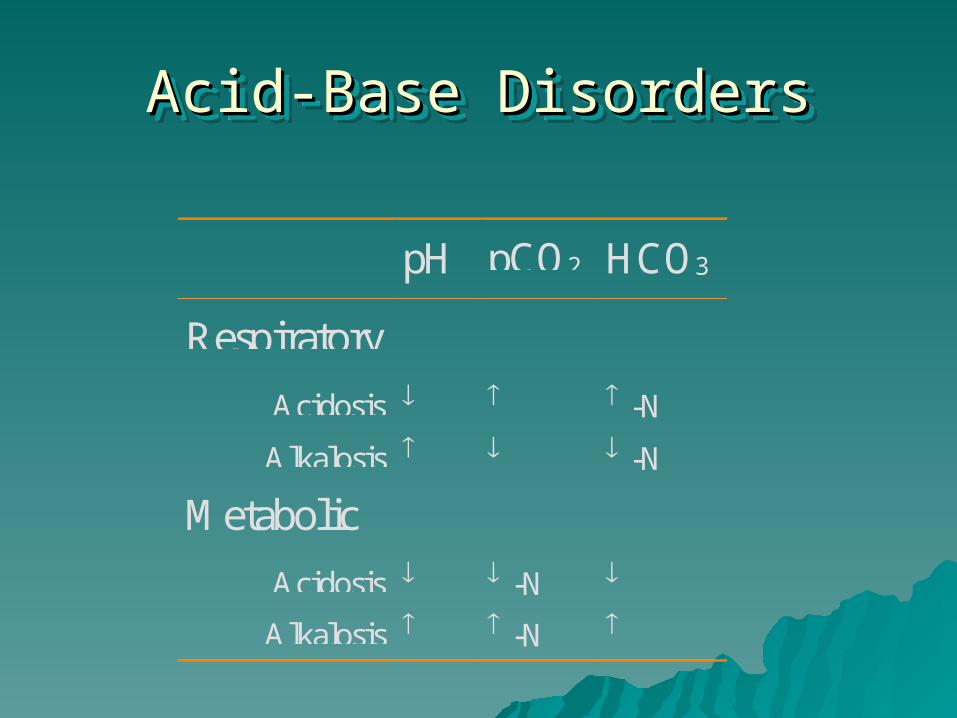
Acid-Base DisordersAcid-Base DisordersAcid-Base DisordersAcid-Base Disorders
pH pCO2 HCO3
Respiratory
Acidosis -N
Alkalosis -N
Metabolic
Acidosis -N
Alkalosis -N
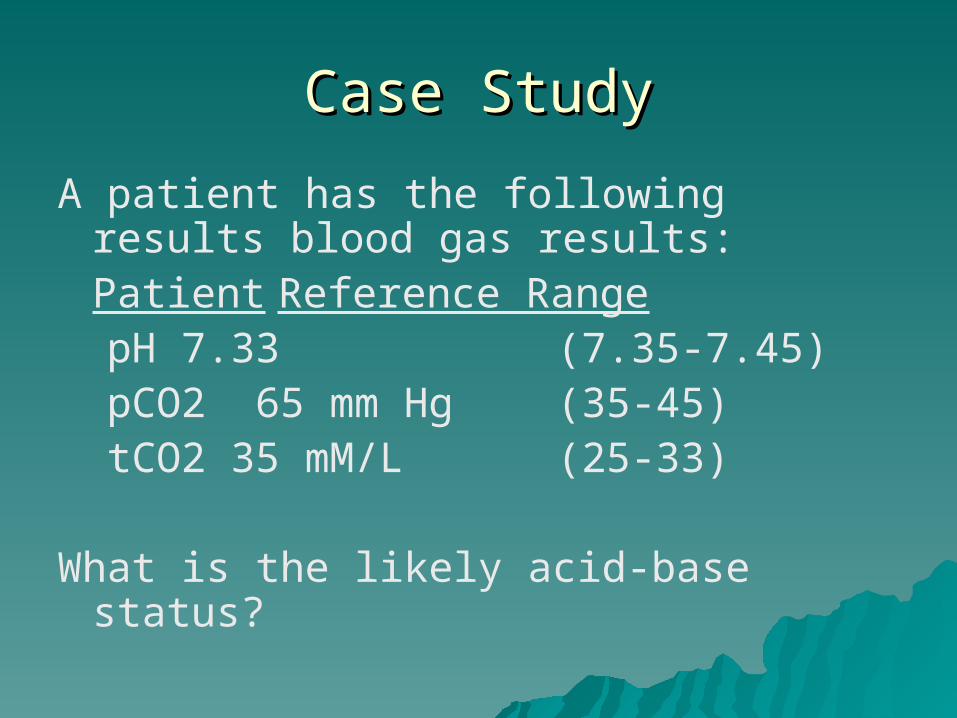
Case StudyCase Study
A patient has the following results blood gas results: Patient Reference Range
pH 7.33 (7.35-7.45) pCO2 65 mm Hg (35-45) tCO2 35 mM/L (25-33)
What is the likely acid-base status?
Parathyroid FunctionParathyroid FunctionParathyroid FunctionParathyroid Function
and Calcium Metabolismand Calcium Metabolism
ObjectivesObjectives
Parathyroid Function and Calcium MetabolismParathyroid Function and Calcium Metabolism Using PTH and calcium assay results, differentiate betweenUsing PTH and calcium assay results, differentiate between
– Hypoparathyroidism (primary vs secondary)Hypoparathyroidism (primary vs secondary)– Hyperparathyrodism (primary vs secondary)Hyperparathyrodism (primary vs secondary)– Vitamin D levelsVitamin D levels
Correlate serum alkaline phosphatase (ALP) with bone Correlate serum alkaline phosphatase (ALP) with bone disorders.disorders.
Thyroid FunctionThyroid Function Using T3, T4 and TSH levels, differentiate between:Using T3, T4 and TSH levels, differentiate between:
– Hyperthyroidism (primary, secondary and tertiary)Hyperthyroidism (primary, secondary and tertiary)– Hypothyroidism (primary, secondary and tertiary)Hypothyroidism (primary, secondary and tertiary)
Describe the factors that affect thyroid binding globulin Describe the factors that affect thyroid binding globulin levels.levels.
Minor Electrolytes/MineralsMinor Electrolytes/Minerals
Physiologic Control of Physiologic Control of Calcium and Calcium and PhosphorusPhosphorus
Parathyroid Hormone Secretion in Parathyroid Hormone Secretion in response to low plasma Caresponse to low plasma Ca++++ by 4-6 by 4-6 glands in larynx regionglands in larynx region– Maintains homeostasis but increased level will Maintains homeostasis but increased level will
increase serum calcium and urinary increase serum calcium and urinary phosphorus and decrease serum phosphorus.phosphorus and decrease serum phosphorus.
Vitamin D increases calcium levels.Vitamin D increases calcium levels. Calcitonin: counters PTH effect on bone.Calcitonin: counters PTH effect on bone.
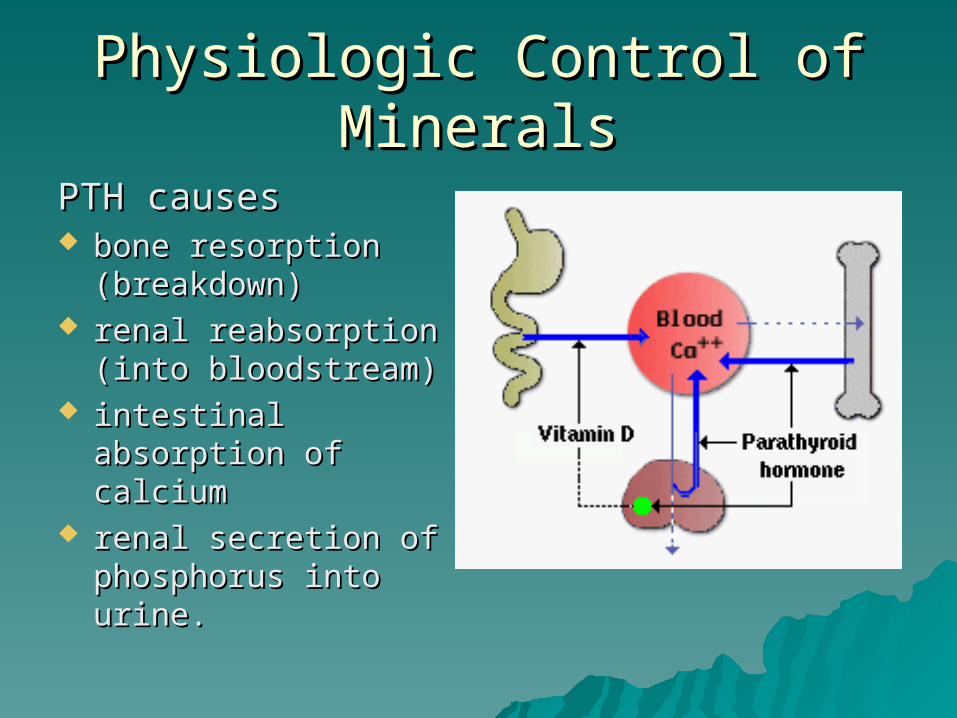
Physiologic Control of MineralsPhysiologic Control of Minerals
PTH causesPTH causes bone resorption bone resorption
(breakdown)(breakdown) renal reabsorption renal reabsorption
(into bloodstream)(into bloodstream) intestinal absorption intestinal absorption
of calciumof calcium renal secretion of renal secretion of
phosphorus into urine.phosphorus into urine.
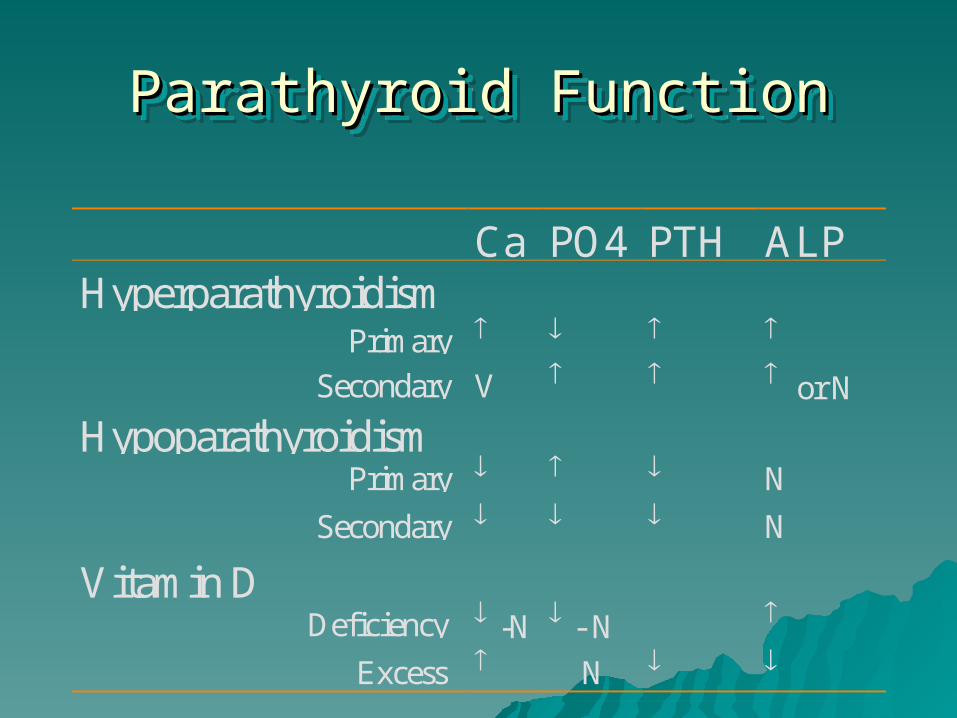
Parathyroid FunctionParathyroid FunctionParathyroid FunctionParathyroid Function
Ca PO4 PTH ALPHyperparathyroidism Primary
Secondary V or N
Hypoparathyroidism Primary N
Secondary N
Vitamin D Deficiency -N - N
Excess N
Thyroid FunctionThyroid FunctionThyroid FunctionThyroid Function
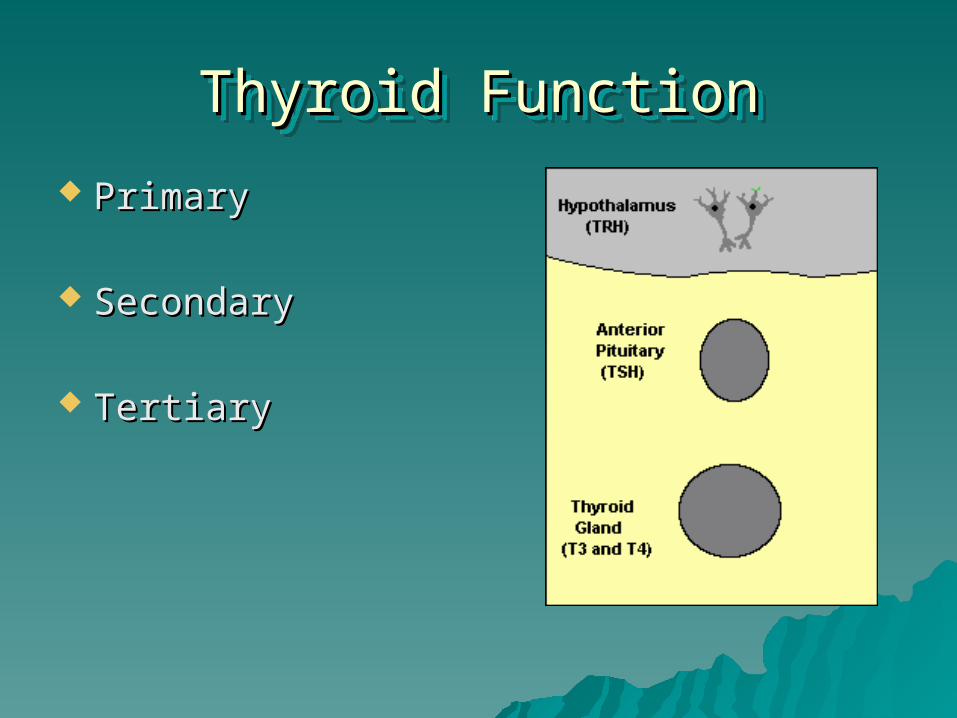
Thyroid FunctionThyroid FunctionThyroid FunctionThyroid Function
PrimaryPrimary
SecondarySecondary
TertiaryTertiary
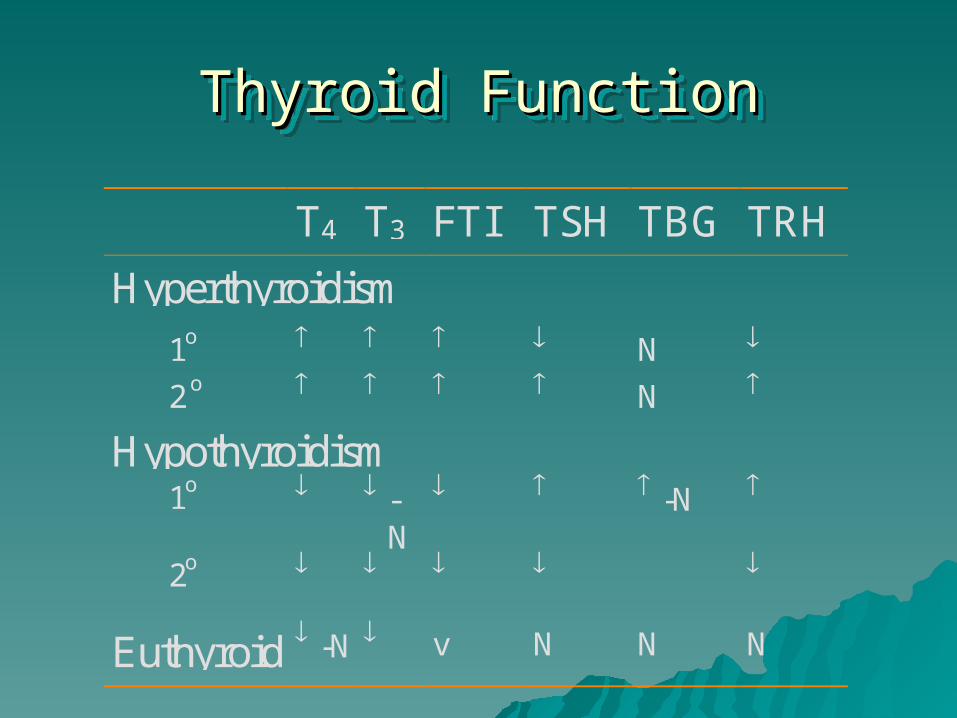
Thyroid FunctionThyroid FunctionThyroid FunctionThyroid Function
T4 T3 FTI TSH TBG TRH
Hyperthyroidism
1o N
2 o N
Hypothyroidism 1o -
N
-N
2o
Euthyroid -N v N N N
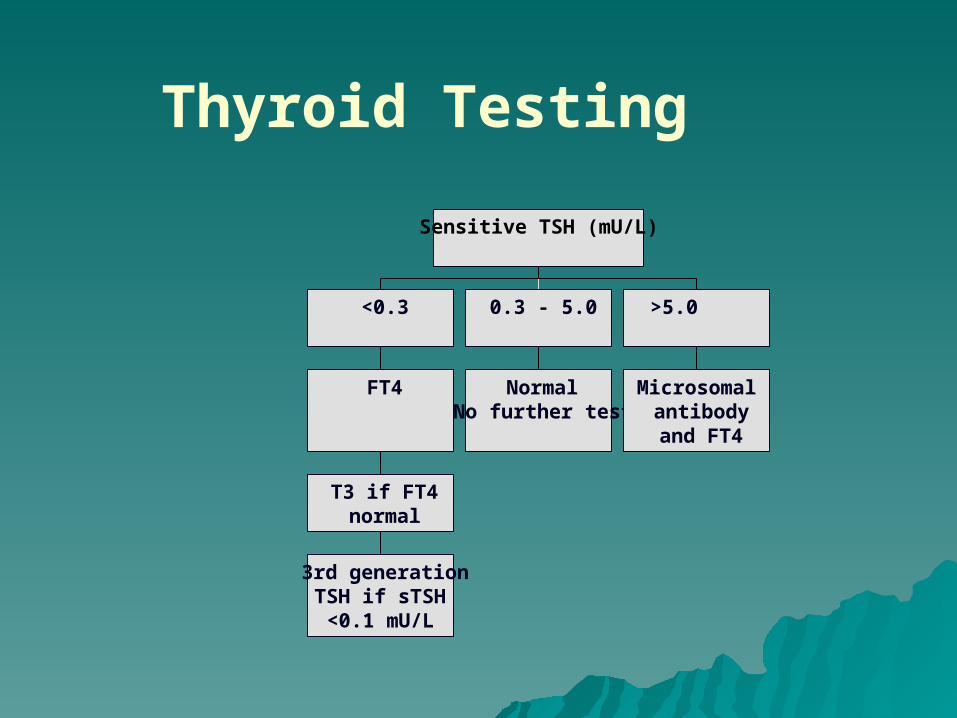
Thyroid Testing
3rd generationTSH if sTSH<0.1 mU/L
T3 if FT4normal
FT4
<0.3
NormalNo further test
0.3 - 5.0
Microsomalantibodyand FT4
>5.0
Sensitive TSH (mU/L)
Thyroid FunctionThyroid FunctionThyroid FunctionThyroid Function
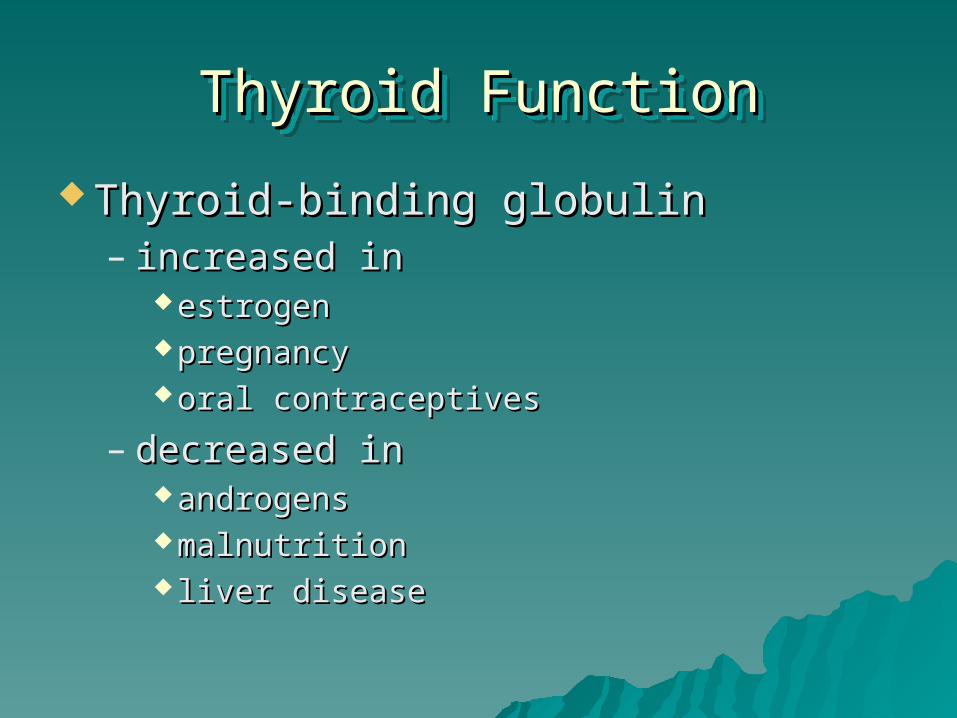
Thyroid-binding globulinThyroid-binding globulin– increased inincreased in
estrogenestrogen pregnancypregnancy oral contraceptivesoral contraceptives
– decreased indecreased in androgensandrogens malnutritionmalnutrition liver diseaseliver disease
Tumor MarkersTumor MarkersTumor MarkersTumor Markers
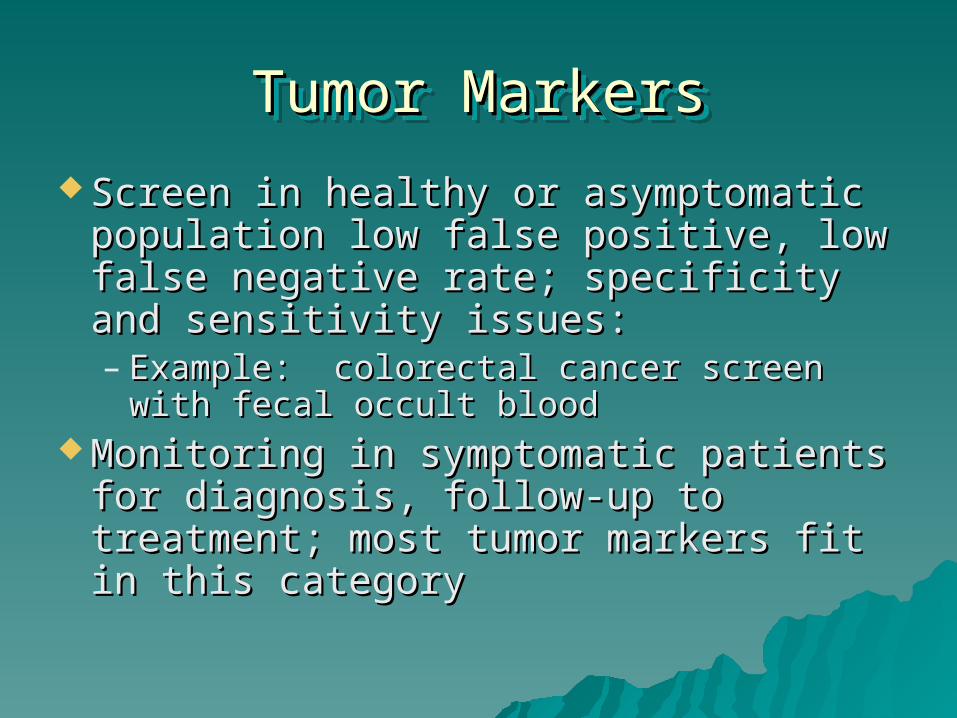
Screen in healthy or asymptomatic Screen in healthy or asymptomatic population low false positive, low population low false positive, low false negative rate; specificity and false negative rate; specificity and sensitivity issues:sensitivity issues:– Example: colorectal cancer screen with Example: colorectal cancer screen with
fecal occult bloodfecal occult blood Monitoring in symptomatic patients Monitoring in symptomatic patients
for diagnosis, follow-up to treatment; for diagnosis, follow-up to treatment; most tumor markers fit in this most tumor markers fit in this categorycategory
Diagnostic Relevance/Medical Diagnostic Relevance/Medical Decision Levels for Clinical Sig.Decision Levels for Clinical Sig.
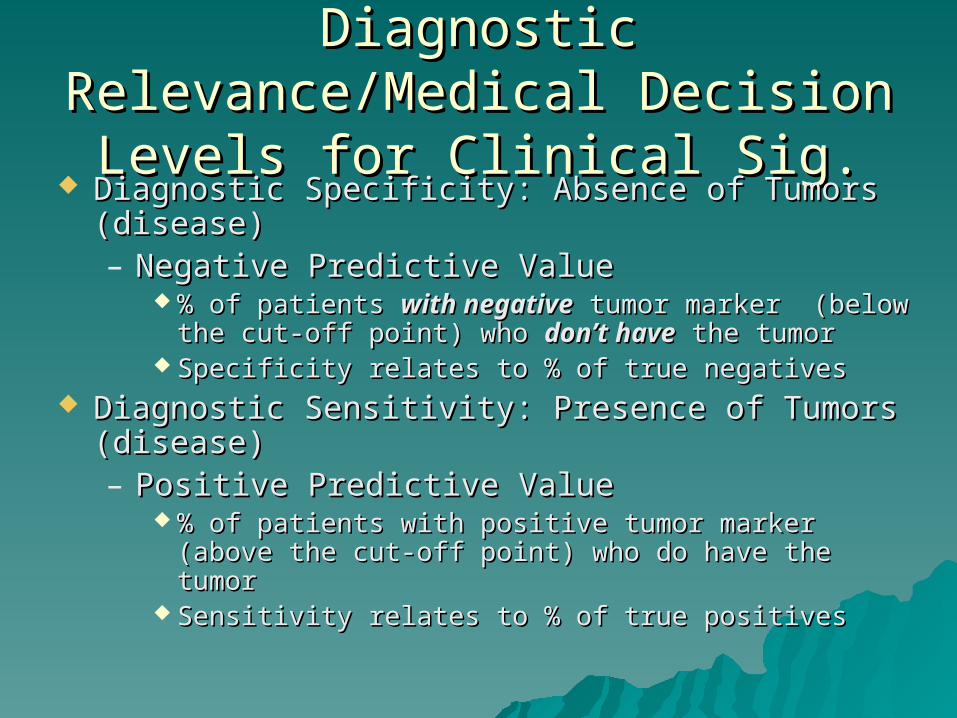
Diagnostic Specificity: Absence of Tumors (disease)Diagnostic Specificity: Absence of Tumors (disease)– Negative Predictive ValueNegative Predictive Value
% of patients % of patients with negativewith negative tumor marker (below the tumor marker (below the cut-off point) who cut-off point) who don’t havedon’t have the tumor the tumor
Specificity relates to % of true negatives Specificity relates to % of true negatives Diagnostic Sensitivity: Presence of Tumors Diagnostic Sensitivity: Presence of Tumors
(disease)(disease)– Positive Predictive ValuePositive Predictive Value
% of patients with positive tumor marker (above the % of patients with positive tumor marker (above the cut-off point) who do have the tumor cut-off point) who do have the tumor
Sensitivity relates to % of true positivesSensitivity relates to % of true positives
Tumor MarkersTumor Markers
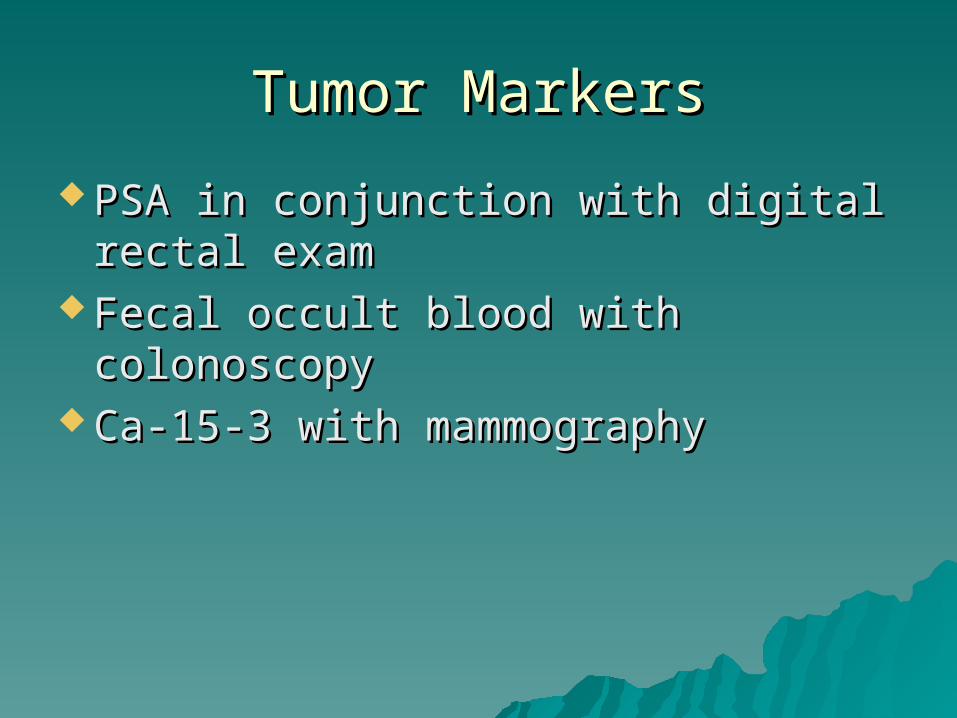
PSA in conjunction with digital rectal PSA in conjunction with digital rectal examexam
Fecal occult blood with colonoscopyFecal occult blood with colonoscopy Ca-15-3 with mammographyCa-15-3 with mammography