the characteristics of impulsive solar euv bursts
TRANSCRIPT
T H E C H A R A C T E R I S T I C S OF I M P U L S I V E S O L A R E U V
B U R S T S
A. G O R D O N E M S L I E * and R O B E R T W. N O Y E S
Harvard-Smithsonian Center for Astrophysics, 60 Garden Street, Cambridge, Mass. 02138, U.S.A.
Abstract. We examine a number of high time resolution intensity-time profiles of EUV impulsive bursts as observed by the Harvard College Observatory EUV Spectroheliometer carried aboard the Skylab Apollo Telescope Mount. These bursts are found to be synchronous (to within the instrumental time resolution of 5.5 s) in all wavelengths observed, corresponding to emissions from temperatures ranging from upper chromospheric to coronal. The distribution with temperature of a suitably defined emission measure parameter is also examined as a function of time throughout the bursts and a marked similarity in the shape of this distribution, both between different events and throughout the time history of any particular event, is noted. The significance of these observations for physical processes associated with EUV bursts is briefly discussed.
1. Introduction
The Harvard College Observatory (HCO) Spectroheliometer mounted in the Skylab Apollo Telescope Mount (ATM) (Reeves et al., 1977a) has obtained a number of observations of impulsive flashes in various regions of the EUV spec- trum. These observations possess excellent resolution, both spatially and temporally, and therefore permit a detailed study of the short-time-scale behavior of a small area of the flaring atmosphere. In this paper we examine a number of these events and investigate some of the features associated with them. After presenting the basic observational data in Section 2, we investigate (a) the relative timing of the EUV flashes in wavelengths associated with a wide range of atmos- pheric temperatures (Section 3), and (b) the time variation of the distribution with temperature of an emission-measure parameter derived from optically thin spectral lines (Section 4). Finally, in Section 5, we discuss the results obtained with a view to the significance for physical models of the processes taking place.
2. Observational Data
Since the various observational modes of the HCO instrument have been docu- mented elsewhere (e.g., Reeves et al., 1977a), only a brief discussion of the particular mode employed for our studies is given here. This mode is the 'mirror line scan' (MLS) mode, in which the instrument's diffraction grating is positioned such that seven photoelectric detectors detect radiation from specific emission lines of interest while, through motion of the imaging mirror, the instrument is made to scan a 5" by 5' strip of the solar disk in elementary (and overlapping) 5" square elements. The time resolution for the mode is 5.5 s and the data sampling time per
* On leave from Dept. of Astronomy, University of Glasgow, Glasgow G12 8QQ, Scotland, U.K.
Solar Physics 57 (1978) 373-383. All Rights Reserved Copyright (~ 1978 by D. Reidel Publishing Company, Dordrecht, Holland
374 A. G O R D O N E M S L I E A N D R O B E R T W. N O Y E S
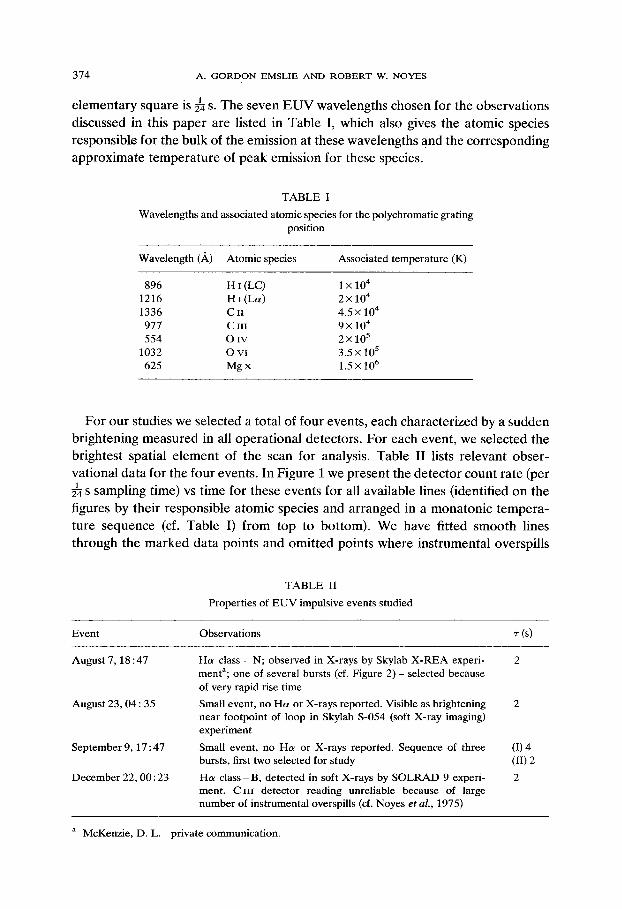
elementary square is ~4 s. The seven EUV wavelengths chosen for the observations discussed in this paper are listed in Table I, which also gives the atomic species responsible for the bulk of the emission at these wavelengths and the corresponding approximate temperature of peak emission for these species.
TABLE I
Wavelengths and associated atomic species for the polychromatic grating position
Wavelength (/~) Atomic species Associated temperature (K)
896 H 1 (LC) 1 x 10⁴ 1216 H l (La) 2 x 10⁴ 1336 C ll 4.5 x 10⁴
977 C III 9 x 10⁴ 554 0 Iv 2 x 10⁵
1032 0 vI 3 .5x 105 625 M g x 1.5x 10⁶
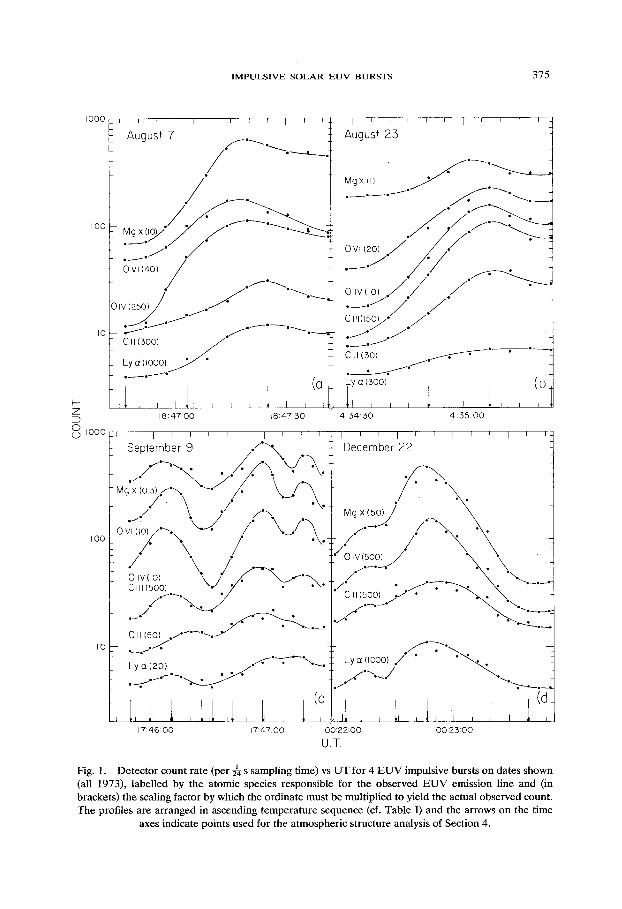
For our studies we selected a total of four events, each characterized by a sudden brightening measured in all operational detectors. For each event, we selected the brightest spatial element of the scan for analysis. Table II lists relevant obser- vational data for the four events. In Figure 1 we present the detector count rate (per
1 s sampling time) vs time for these events for all available lines (identified on the figures by their responsible atomic species and arranged in a monatonic tempera- ture sequence (cf. Table I) from top to bottom). We have fitted smooth lines through the marked data points and omitted points where instrumental overspills
TABLE II
Properties of E U V impulsive events studied
Event Observations r (s)
August 7, 18:47 H a class - N; observed in X-rays by Skylab X - R E A experi- 2 menta; one of several bursts (of. Figure 2) - selected because of very rapid rise time
Small event, no H a or X-rays reported. Visible as brightening 2 near footpoint of loop in Skylab S-054 (soft X-ray imaging) experiment
Small event, no H a or X-rays reported. Sequence of three (I) 4 bursts, first two selected for study (II) 2
H a c lass - B, detected in soft X-rays by SOLRAD 9 experi- 2 ment. C III detector reading unreliable because of large number of instrumental overspills (cf. Noyes et al., 1975)
August 23, 04 : 35
September 9, 17 : 47
December 22, 00 : 23
a McKenzie, D. L. - private communication.
I M P U L S I V E S O L A R E U V B U R S T S 375
I000
I00
10
l-- Z
S IO00
I00
I0
Augusl 7
:Z:~ . / 0 Vl (40) / ~'~*~�9
IV [ 2 5 0 ) / / . "
:________~I":.._.~, ~ "
Cii(3oo) . ..~" !
?~176176176 y"
I t i (~ 18:47:00 18:47:30
z September 9 ,./"%,
4, :o ~.-,.~.-./,Z \ ~ - / \ ;/" /." -\.
ov:,o,~.-.~'~J, i" "\J'\ ~,./" \. / "'~
o v,o, " . , / , / ~ . - . ~ . . C Ill (500) , , , . . . .
�9 ~ . / �9 . ~ - L . . 7 ~ " �9
C II (50] . I . . . . . ~ . ~ ' 4 ' ' ~ *~'--" ...<-'.
Ly~/~o)._. ~ - ' ~ " ""-.
I I i it [ [ 1~ 17:46:00
] i r t I i I i i r I
August 23
ow(.ol ./ " ../
C1i(3o) ~ , , ~ '
i'y a (3oo) (b
4:34:30 4:35:00
I i i I L i I i i I I i
December 22
. 4
/"
0 IV(500) " " "
c , , ~ o o ) ~.~" "->~.\
. / f ' - 7 " . �9 Lyct (iooo) ./ " ~ .
17:47:00 00:22:00 00:23:00
U.T.
Fig. 1. Detector count rate (per ~4 s sampling time) vs UT for 4 E U V impulsive bursts on dates shown (all 1973), labelled by the atomic species responsible for the observed E U V emission line and (in brackets) the scaling factor by which the ordinate must be multiplied to yield the actual observed count. The profiles are arranged in ascending temperature sequence (cf. Table I) and the arrows on the time
axes indicate points used for the atmospheric structure analysis of Section 4.
3 7 6 A. G O R D O N E M S L I E A N D R O B E R T W. N O Y E S
(cf. Noyes et al., 1975) render the detected count subject to large uncertainties. We now proceed to discuss the implications of these observations for conditions in the burst atmosphere.
3. Relative Timing of Intensity-Time Profiles
The close synchronism of intensity-time profiles corresponding to different wavelength ranges during solar flares has already been the subject of investigation by several authors, e.g. Rust and Hegwer (1975) and Roy (1976) (optical and hard X-ray), Emslie et al. (1978) (EUV and hard X-ray). An inspection of Figure 1 shows clear evidence for strong synchronism of EUV impulsive flare bursts over the entire wavelength range under consideration, and in the following we derive a quantitative measure of this feature.
Following Emslie et al. (1978), we derive a 'best-fit time delay' Atq between profiles i and j by minimization of the quantity
X = ~ (y,(tk+6t~j)--yj(tk)) 2 (1) k = l
with respect to 6tij, where the yi,j are normalized intensities:
I i - - lO , i
Y i = I . . . . i - - I o , i (2)
( I o , i , / m a x , i , and /,- being the pre-burst, maximum, and instantaneous intensities respectively). The range of k-summation is over the data points comprising the entire burst (i.e. from just before the flash until the intensity fails off to approxi- mately pre-burst values again), excluding the points at either the beginning or end of the burst corresponding to the time interval i~tli. Note that Atij < 0 if profile i precedes i and vice-versa.
The resulting Atij for the entire range 1 - i, ] --< m, i ~ j (where m is the number of operational detectors) may be combined by a least-squares procedure to derive the time delay of each profile from an arbitrary reference point, together with its standard error. Taking into account the 5.5 s time resolution of the instrument in the MLS mode and the observational uncertainties involved, we found that it was in general impossible to order the profiles in a definite time sequence, and that the only possible conclusive remark that can be made is that the profiles are all essentially synchronous to within an amount ~-, which is given for each event in the last column in Table II. A possible exception to this is the delay time of the optically thick Lee emission, which in the August 7th event showed delays of up to 6 s compared to emissions of transition zone and coronal lines. This delay may be attributable to t ime-dependent radiative transfer considerations. In any case, we may conclude that the energy deposition that gives rise to the enhanced emission
IMPULSIVE SOLAR EUV BURSTS 377
occurs essentially simultaneously at all atmospheric levels, to within the values of ~-
in Table II. The significance of this conclusion will be discussed in Section 5 below.
4. Distribution ot Emission Measure with Temperature in Impulsive Bursts
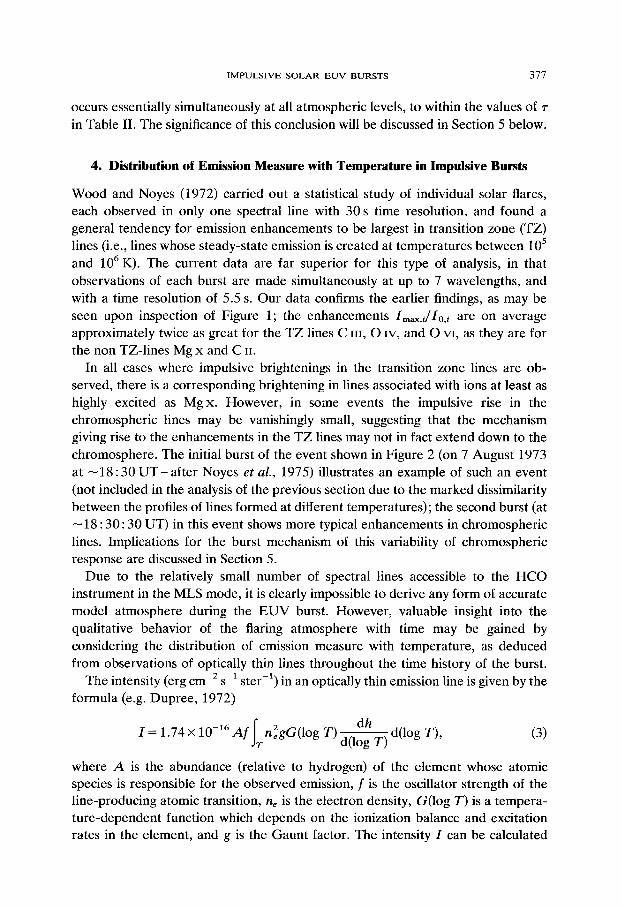
Wood and Noyes (1972) carried out a statistical study of individual solar flares, each observed in only one spectral line with 30 s time resolution, and found a general tendency for emission enhancements to be largest in transition zone (TZ) lines (i.e., lines whose steady-state emission is created at temperatures between 105 and 10 6 K). The current data are far superior for this type of analysis, in that observations of each burst are made simultaneously at up to 7 wavelengths, and with a time resolution of 5.5 s. Our data confirms the earlier findings, as may be seen upon inspection of Figure 1; the enhancements I . . . . JIo,i are on average approximately twice as great for the TZ lines C uI, O Iv, and O vi, as they are for the non TZ-lines Mg x and C ii.
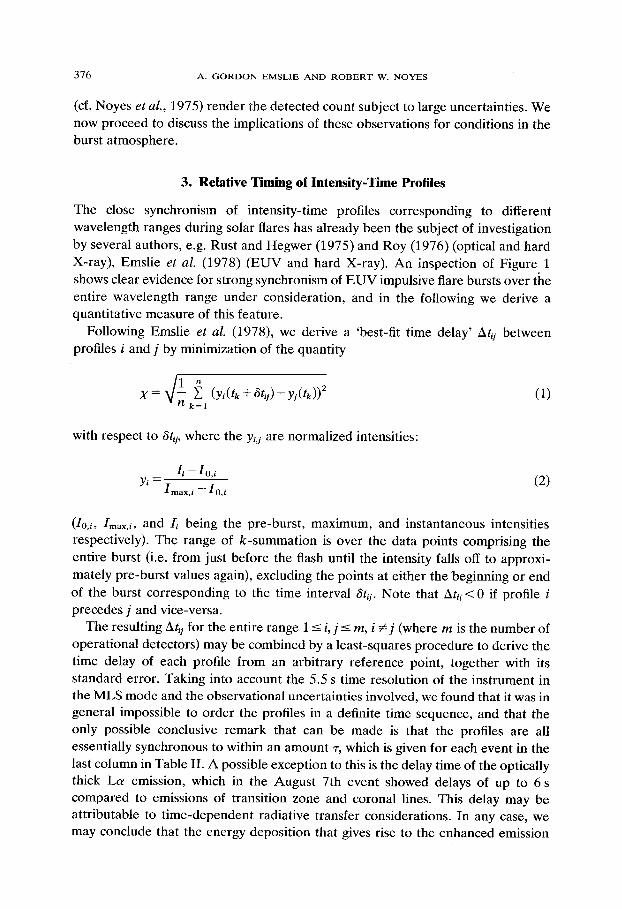
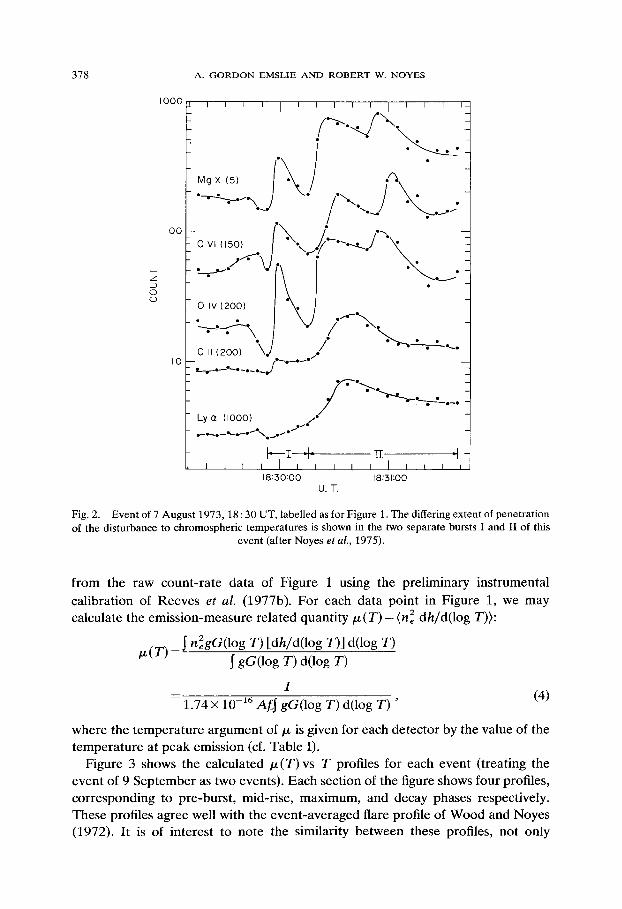
In all cases where impulsive brightenings in the transition zone lines are ob- served, there is a corresponding brightening in lines associated with ions at least as highly excited as M g x . However, in some events the impulsive rise in the chromospheric lines may be vanishingly small, suggesting that the mechanism giving rise to the enhancements in the TZ lines may not in fact extend down to the chromosphere. The initial burst of the event shown in Figure 2 (on 7 August 1973 at - -18 :30 U T - a f t e r Noyes et al., 1975) illustrates an example of such an event (not included in the analysis of the previous section due to the marked dissimilarity between the profiles of lines formed at different temperatures); the second burst (at
18 : 30 :30 UT) in this event shows more typical enhancements in chromospheric lines. Implications for the burst mechanism of this variability of chromospheric response are discussed in Section 5.
Due to the relatively small number of spectral lines accessible to the H C O instrument in the MLS mode, it is clearly impossible to derive any form of accurate model atmosphere during the EUV burst. However, valuable insight into the qualitative behavior of the flaring atmosphere with time may be gained by considering the distribution of emission measure with temperature, as deduced from observations of optically thin lines throughout the time history of the burst.
The intensity (erg cm -2 s -1 ster -1) in an optically thin emission line is given by the formula (e.g. Dupree, 1972)
IT d(log T), (3) d______~h I = 1.74 x 10 -16 mf n2gG(log T) d(log T)
where A is the abundance (relative to hydrogen) of the element whose atomic species is responsible for the observed emission, f is the oscillator strength of the line-producing atomic transition, ne is the electron density, G(log T) is a tempera- ture-dependent function which depends on the ionization balance and excitation rates in the element, and g is the Gaunt factor. The intensity I can be calculated
378 A. G O R D O N E M S L I E A N D R O B E R T W. N O Y E S
I000
I00
I ' - Z D 0 C.)
I0
i i ~ i I i t i i i l i I t i . \ / . " ~ . . f . \
./
o Jv (2ooi \. . �9
c l l ( 2 o o ) \.J - - - -
t__o._o_ o~o _o_o~o~ e ~ ~ 1 7 6 1 7 6 1 7 6
Ly a (1000) /~ ~ ~
t J i I I t , i t J I t i I 18:.30:00 18:31:00
U.T.
Fig. 2. Event of 7 Augus t 1973, 18 : 30 UT, labelled as for Figure 1. The differing extent of pene t ra t ion of the d is turbance to ch romospher ic t empera tu res is shown in the two separa te burs ts I and I I of this
event (after Noyes et al., 1975).
from the raw count-rate data of Figure 1 using the preliminary instrumental calibration of Reeves et al. (1977b). For each data point in Figure 1, we may calculate the emission-measure related quantity/z (T) = (n e 2 d h/d(log T)>:
I~( T) - I n2egG(l~ T) [dh/d(log T)] d(log T) S gG(log T) d(log T)
I (4) - 1.74 • 10 -16 Af~ gG(log T) d(log T) '
where the temperature argument of/z is given for each detector by the value of the temperature at peak emission (cf. Table I).
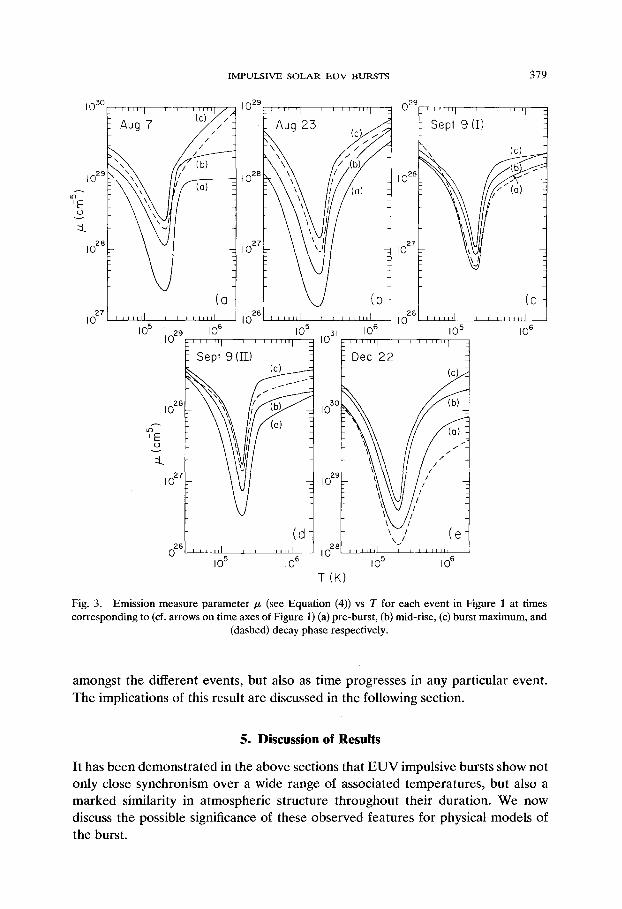
Figure 3 shows the calculated /z(T)vs T profiles for each event (treating the event of 9 September as two events). Each section of the figure shows four profiles, corresponding to pre-burst, mid-rise, maximum, and decay phases respectively. These profiles agree well with the event-averaged flare profile of Wood and Noyes (1972). It is of interest to note the similarity between these profiles, not only
I M P U L S I V E S O L A R E U V B U R S T S 3 7 9
1030
i029
I E
:::L
1028
I/I
(a Ji l l l l I I i I i i l i
I029 ~ i,i, I i
1028 \\
I 027
z6] I 0 , . . . . JI
I05 1029 106 i05 I05 l I I l l l [ I i i i i i i 1 ~
9 (E_) (c)
E <~
. . . . . . I
( d
i026 i , , , l , ~ , l
105 106
I i , i l l l I 10 29
(b I I I I IfIIi
1031 106 i i l l I i i i i l l l l I
Dec 2 2 (c)
103o (b)
1029 i/
1028 I I I I I l l
i05 106 T ( K )
l l l l i I I i I I l l l f I
Sep i 9 (I)
�9 (c)
1027
(c 26
1 0 I . . . . I I I t I I I I J I
I0 5 i06
Fig. 3. Emission measure parameter Iz (see Equation (4)) vs T for each event in Figure 1 at times corresponding to (cf. arrows on time axes of Figure 1) (a) pre-burst, (b) mid-rise, (c) burst maximum, and
(dashed) decay phase respectively.
amongs t the different events, but also as time progresses in any part icular event.
The implications of this result are discussed in the fol lowing section.
5. Discussion of Results
It has been demons t r a t ed in the above sections that E U V impulsive bursts show not only close synchronism over a wide range of associated tempera tures , but also a marked similarity in a tmospher ic s t ructure th roughou t their durat ion. We now discuss the possible significance of these observed features for physical models of
the burst.
380 A. G O R D O N E M S L I E A N D R O B E R T W. N O Y E S
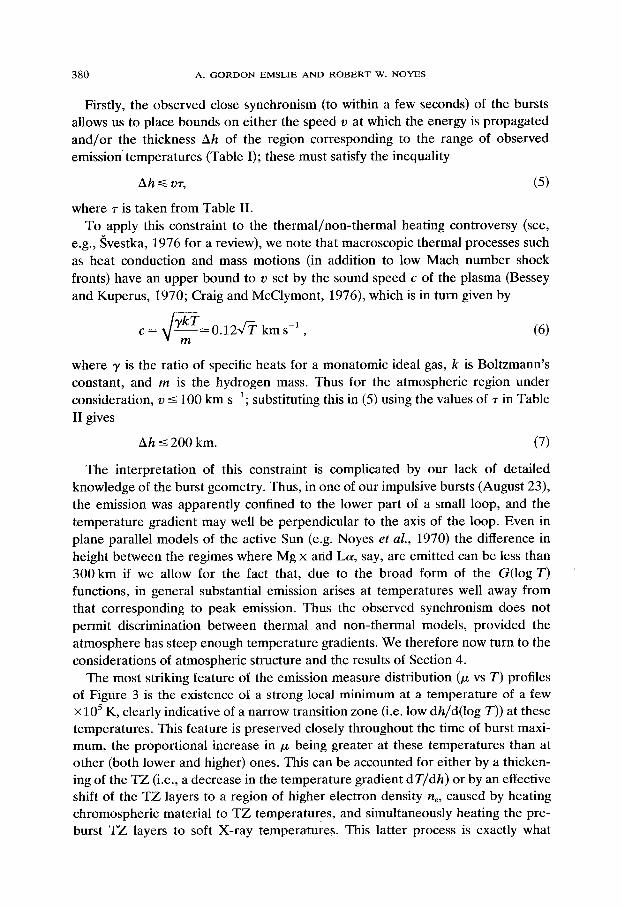
Firstly, the observed close synchronism (to within a few seconds) of the bursts allows us to place bounds on either the speed v at which the energy is propagated and/or the thickness Ah of the region corresponding to the range of observed emission" temperatures (Table I); these must satisfy the inequality
Ah <~ vz, (5)
where r is taken from Table II. To apply this constraint to the thermal/non-thermal heating controversy (see,
e.g., Svestka, 1976 for a review), we note that macroscopic thermal processes such as heat conduction and mass motions (in addition to low Mach number shock fronts) have an upper bound to v set by the sound speed c of the plasma (Bessey and Kuperus, 1970; Craig and McClymont, 1976), which is in turn given by
c = �9 m - 0 . 1 2 , ~ kms -~ (6)
where ~/is the ratio of specific heats for a monatomic ideal gas, k is Boltzmann's constant, and m is the hydrogen mass. Thus for the atmospheric region under consideration, v --< 100 km s 1; substituting this in (5) using the values of ~- in Table II gives
Ah _< 200 kin. (7)
The interpretation of this constraint is complicated by our lack of detailed knowledge of the burst geometry. Thus, in one of our impulsive bursts (August 23), the emission was apparently confined to the lower part of a small loop, and the temperature gradient may well be perpendicular to the axis of the loop. Even in plane parallel models of the active Sun (e.g. Noyes et al., 1970) the difference in height between the regimes where Mg x and La, say, are emitted can be less than 300 km if we allow for the fact that, due to the broad form of the G(log T) functions, in general substantial emission arises at temperatures well away from that corresponding to peak emission. Thus the observed synchronism does not permit discrimination between thermal and non-thermal models, provided the atmosphere has steep enough temperature gradients. We therefore now turn to the considerations of atmospheric structure and the results of Section 4.
The most striking feature of the emission measure distribution (/x vs T) profiles of Figure 3 is the existence of a strong local minimum at a temperature of a few • 105 K, clearly indicative of a narrow transition zone (i.e. low dh/d(log T)) at these temperatures. This feature is preserved closely throughout the time of burst maxi- mum, the proportional increase in ~ being greater at these temperatures than at other (both lower and higher) ones. This can be accounted for either by a thicken- ing of the TZ (i.e., a decrease in the temperature gradient d T / d h ) or by an effective shift of the TZ layers to a region of higher electron density ne, caused by heating chromospheric material to TZ temperatures, and simultaneously heating the pre- burst TZ layers to soft X-ray temperatures. This latter process is exactly what
IMPULSIVE SOLAR EUV BURSTS 381
occurs in the electron-heated models of Brown et al. (1978). From earlier work by Brown (1973) we can compute the rate of temperature increase (K s -I) at column density N(cm -2) in the atmosphere. This is given by
d T 10_3F20ke v K s -1 (8) dt \ N / '
where F20 key is the energy flux (erg c m -2 S - 1 ) due to electrons with energies above 20 keV, and we have assumed that the electron energy spectrum has a power-law representation with typical spectral index 6 = 4. Equation (8) assumes constant density and tha t increases in radiative losses are negligible compared with the electron energy input IB; thus d T / d t = IB/3nk , where n is the local electron density. (The assumption of constant density is strictly justified only if the energy release occurs in a time short compared to the dynamic response time of the atmosphere. However, allowing for the effects of dynamic expansion would not affect our conclusion.) If F20ke v > 109 erg cm 2 s-i, as is inferred from hard X-ray bursts in typical flares, then Equation (8) predicts that the temperature of the pre-burst TZ (where N - - 1019 c m -2) will increase by more than 107 K in the typical 20 s rise time of the observed bursts. Thus the burst TZ emission must arise from layers that were substantially below TZ temperatures in the pre-burst atmosphere. If this explana- tion of the enhancements is correct, then the characteristic values of ne 2 associated with the TZ lines must be very much greater than in the pre-burst atmosphere (cf. Brown et al., 1978); therefore, we should expect the enhancements to be much larger than those in Figure 3, unless the temperature gradient d T / d h also rises by a similar amount. While the lack of suitable flare models at present means that this possibility cannot be ruled out, it nevertheless would be a remarkable fact if a large
2 increase in n e were to be compensated by a decrease in dh/d(log T) of a very similar amount; certainly there exists no a priori basis for this expectation.
A far more straightforward interpretation, one that is supported by the general lack of hard X-ray bursts in our events and the lack, in some events, of enhance- ment in chromospheric lines, is that only a very small amount of heating occurs, such as that produced by a shock wave travelling along a loop or, in a plane parallel geometry, an electron flux 1:2o <. 1 0 7 erg cm -2 s -1 injected downwards. This latter process would result in an approximately constant temperature enhancement of
105 K (cf. Equation (8) with a rise time of --~ 20 s) throughout the TZ layers, thus increasing the emission throughout the TZ without destroying its basic structure. Such a temperature perturbation would also create emission enhancements that are larger in the low transition zone than in the high transition zone and low corona, in agreement with observations. This is because a constant linear temperature enhancement produces an increase in the inverse logarithmic temperature gradient dh/d(log T) that is less at higher temperatures: (dh/d(log Z))burst =
(dh/d(log T))pre-burst(1 + A T~ T) . In addition, the fractional density enhancement is less at higher temperatures under the assumption of constant pressure throughout
382 A. G O R D O N E M S L I E A N D R O B E R T W. N O Y E S
the pre-flare TZ; then nburs t (T ) = npre_burst ( T ) (T/(T-AT)). Thus,
/'L burst ( T - ~ ) 2( T +-~ AT) . (9) /1' pre-burs t
For example, for a rise of T = 5 x 10⁴K (corresponding, for a 20 s rise time, to F20 ~ 2 x 10⁶ erg cm -2 s-l), the enhancements i n / z are - 6 at 105 K, --2.2 at 2 x 10⁵ K, and --1.16 at 106 K. Thus the lines formed around the base of the TZ (e.g. C nx) are enhanced by a substantial amount while coronal lines (e.g. Mg x) are not affected to any great degree. For chromospheric lines such as C II, the associated much larger values of N would, through Equation (8), result in smaller enhance- ments, as is observed.
It may seem somewhat surprising that such small non-thermal energy fluxes are required to match the observations reported here (the value F z 0 - 2 • erg cm -2 s -1 inferred above is at least an order of magnitude less than that required to produce substantial H a emission (Brown et al., 1978)). However, the bursts studied are small, in some cases essentially at or below the threshold for detec- tability as normal H a flares, and the MLS may have missed the flare kernel in many instances. In view of the crudeness of the modelling above, we do not, therefore, feel that there is a significant discrepancy.
The lack of any comprehensive model of conductively heated atmospheres means that we cannot apply the same form of analysis to deduce bounds on the energy fluxes involved, etc. We therefore conclude that, unless there is a remarkable coupling between the temperature gradients and densities in flaring atmospheres, most observations of synchronous E U V impulsive bursts may be most simply explained by the production of relatively moderate density and temperature enhancements in the transition zone. Bombardment by a low flux of non-thermal electrons is a suitable candidate for the energy source. However, other mechanisms such as shock waves cannot be ruled out, provided the geometry of pre-burst atmosphere has temperature gradients at least as steep as in current active region models.
Acknowledgements
We thank M. E. Machado for helpful discussion throughout the progress of this work, and for drawing our attention to the December 22 event. We also thank G. L. Withbroe for useful comments. This work was supported by NASA Contract NAS 5-3949; A.G.E. also wishes to acknowledge receipt of an SRC Studentship.
References
Bessey, R. J. and Kuperus, M.: 1970, SolarPhys. 12, 216. Brown, J. C.: 1973, SolarPhys. 31, 143.
IMPULSIVE SOLAR EUV BURSTS 383
Brown, J. C., Canfield, R. C., and Robertson, M. N.: 1978, this issue, p. 399. Craig, I. J. D. and McClymont, A. N.: 1976, SolarPhys. 50, 133. Dupree, A. K.: 1972, Astrophys. J. 178, 527. Emslie, A. G., Brown, J. C., and Donnelly, R. F.: 1978, SolarPhys. 57, 175. Noyes, R. W., Withbroe, G. L., and Kirshner, R. P.: 1970, SolarPhys. U , 388. Noyes, R. W., Foukal, P. V., Huber, M. C. E., Reeves, E. M., Schmahl, E. J., Timothy, J. G., Vernazza,
J. E., and Withbroe, G. L.: 1975, in Sharad Kane (ed.), 'Solar Gamma-, X-, and EUV Radiation', IAU Symp. 68, 3.
Reeves, E. M., Huber, M, C. E., and Timothy, J. G.: 1977a, Appl. Opt. 16, 837. Reeves, E. M., Timothy, J. G., Huber, M. C. E., and Withbroe, G. L.: 1977b, Appl. Opt. 16, 849. Roy, J.-R.: 1976, SolarPhys. 48, 265. Rust, D. M. and Hegwer, F.: 1975, SolarPhys. 40, 141. Svestka, Z.: 1976, Solar Flares, D. Reidel Publ. Co., Dordrecht, Holland. Wood, A. T. and Noyes, R. W.: 1972, SolarPhys. 24, 180.