the changing collateral space - federal reserve … · the changing collateral space prepared by...
TRANSCRIPT

The Changing Collateral Space
Manmohan Singh
WP/13/25

© 2013 International Monetary Fund WP/13/25
IMF Working Paper
Research Department
The Changing Collateral Space
Prepared by Manmohan Singh1
Authorized for distribution by Stijn Claessens
January 2013
Abstract
This paper highlights the changing collateral landscape and how it may shape the global demand/supply for collateral. We first identify the key collateral pools (relative to the “old” collateral space) and associated collateral velocities. Post-Lehman and continuing into the European crisis, some aspects of unconventional monetary policies pursued by central banks are significantly altering the collateral space. Moreover, regulatory demands stemming from Basel III, Dodd Frank, EMIR etc., new net debt issuance, and collateral connectivity via custodians (e.g., Euroclear/ Clearstream/ BoNY etc) will affect collateral movements.
JEL Classification Numbers: G21; G28; F33; K22; G18; G15
Keywords: velocity/re-use of collateral; central banks and QE; LCR; CCPs, custodians; CSDs;
Author’s E-Mail Address: [email protected] 1 The author would like to thank several colleagues and market participants including Stijn Claessens, and Giovanni Dell’Ariccia and Lindsay Mollineaux at the IMF, and also Phil Prince, Matt King, David Biccaregui, James Aitken, Godfried de Vidts, Darrell Duffie, Michael Clark, Peter Stella, Cedric Gillerot, Walter Verbeke, Richard Glen, Leonard Evans, Nikolaos Panigirtzoglou, Elizabeth Klee, Matthew Mcdonald and Myles Wright. Views in this paper are of the author only and not those of the IMF; any remaining errors are mine.
This Working Paper should not be reported as representing the views of the IMF. The views expressed in this Working Paper are those of the author(s) and do not necessarily represent those of the IMF or IMF policy. Working Papers describe research in progress by the author(s) and are published to elicit comments and to further debate.

2
Contents Page
I. Introduction ............................................................................................................................3
II. The Old And The New Collateral Space ...............................................................................4
III. Factors Driving The Collateral Dynamics In The Near-Term .............................................7
IV. Price of Money and Price of Collateral .............................................................................11
V. Policy Suggestions ..............................................................................................................13 Figure 1. The Old Collateral Space. ......................................................................................................4 2. The Changing Collateral Space .............................................................................................9 3. U.S. IOER, Fed Funds, T-Bills and GC Rates; ECB Deposit Rate and GC Collateral ........ 13 Box 1. Augmenting Rate of Return on Securities by Pledging it for Re-use………………………76 Annex 1. Collateral Needs in the OTC Derivatives Market—CCPs and Non-cleared Trades ......... 15 Table 1. Under-Collateralization in the OTC Derivatives Market……………………………….... 16 References…………………………………………………………………………………… 17

3
I. INTRODUCTION
The motivation for investigating the use of collateral is its increasing importance for the functioning of the global financial system. Part of that evolution has been the greater use (and re-use) of collateral by financial markets to support transactions. In volume terms, this collateral (re-)use has over the past decade become on par with monetary aggregates like M2. However, post Lehman and amidst the European crisis, changes in the global financial system along with proposed regulatory changes may constrain the availability of collateral (and its re-use). This greater importance of collateral has been investigated in several strands in the theoretical literature, which relate to each other. One strand is the literature on collateral and default which has primarily focused on the role of margin and “haircuts” and “fire sales” (Geanakoplos, 2003; Brunnermeier and Pedersen, 2009; Gorton and Metrick, 2010; Krishnamurthy, Nagel, Orlov, 2010). Another strand is on securitization, where collateral serves to support specific asset values (Shleifer and Vishny, 2011). However, this paper is not about haircuts, fire sales, or securitization but on how collateral use underpins financial transactions. It thus builds on the analytical foundations of Adrian and Shin (2009) that shows how financial lubrication is provided via collateral chains. It also extends Singh (2011b; 2012) who examine the extent of collateral re-use using bilateral pledged collateral data from large banks-dealers.2 In this paper we focus on two types of collateral that may be available to meet the growing demand: one that is re-used in the markets (i.e., with velocity); and one without velocity (i.e., in “silos”). Although a decline in the re-use of collateral may be viewed positively from a financial stability perspective, it constraints the effective supply. Since 2007 (pre-Lehman crisis), from a monetary perspective, the lubrication in the global financial markets is now lower as the velocity of money-type instruments has declined. Price signals, given demand/supply and re-use rate, will reflect shortage of collateral (if any); however due to market segmentations such price signals may not be perfect. The paper highlights the macro-financial importance of collateral for markets and suggests further analytical work that straddles the relative prices for collateral and money. In terms of outline, Section II updates the “old” collateral space to include new participants such as: central bank balance sheets; regulatory driven buffers as CCPs and LCRs; increasing role of custodians such as Euroclear and Clearstream etc. Section III highlights the positive and negative factors that are shaping the new collateral space. Section IV highlights how the various price(s) of money and collateral behave as interest rates are close to the zero lower bound in major advanced countries. Section V concludes with some policy suggestions.
2 A third variant of the literature on collateral falls under the rubric of supply and demand of “safe assets” and has received attention recently. Empirical evidence that the (demand for) safe-asset share has been relatively stable was postulated by Gorton et. Al. (2012) using flow of funds data only. Concerns have been raised about the supply of safe assets. The IMF’s Global Financial Stability Report estimated a $74 trillion figure for safe assets (April, 2012), which would appear to be ample. However a large fraction of such safe assets is held by buy and hold investors and is not available for re-use in financial markets. Some market sources conclude that there is little evidence to support that good collateral will be in short supply (JPMorgan, 2012). Others argue that there could be such a shortage and that safe assets should be provided as a public good to avoid financial instability associated with the private supply of safe assets (Gourinchas and Jeanne, 2012; Debelle,2012). See further Claessens et al. (2012).

4
II. THE OLD AND THE NEW COLLATERAL SPACE
A great deal of short-term financing is generally extended by private agents against financial collateral. The use and re-use of pledged financial collateral facilitates financial transactions. In that way, it contributes towards the supply of credit to the real economy. Analogous to the traditional money-creation process, i.e., the lending-deposit-lending process based on central bank reserves, there is a multiplication effect. Collateral is like high-powered money where the haircut is the reserve ratio, and the number of re-pledging (the ‘length’ of the collateral chain) is the money multiplier.3 The aggregate volume of re-pledged collateral reflects both the availability of “source” collateral as well as the re-use rate of source collateral. Although collateral backed credit does not increase the money supply, it impacts real sector and monetary policy transmission (Claessens et al, 2012). In the “old” global financial system, nonbanks were the primary actors that allowed re-use of their collateral in lieu of other considerations. The key providers of pledged collateral to the ‘street’ (or large banks/dealers) are: (a) hedge funds; (b) custodians on behalf of pension, insurers, official sector accounts etc (Figure 1).4 In this nexus of nonbanks/banks, ‘supply’ of pledged collateral is typically received by the central collateral desk of the large banks/dealers that re-use the collateral to meet the ‘demand’ from the financial system.
3 The term re-pledged is a legal term and means that the dealer receiving the collateral has the right to re-use it in its own name (i.e., recipient has title transfer). Title transfer is essential to collateral velocity. In the bilateral pledged collateral market, contracts that straddle repo, securities lending, OTC derivatives and customer margin loans have title transfer. 4 Hedge funds via their prime-brokers allow for collateral reuse as a quid pro quo for the leverage/funding they receive from dealers. The other nonbank providers of collateral generally loan collateral for various tenors to optimize their asset management mandates. Commercial banks are not active in this bank (hence de minimis)

5
The center of Figure 1 depicts the “old” collateral space (in gray area) and illustrates the reduction in collateral volumes as of end-2011, relative to end-2007 (Singh, 2012). The recent crisis has resulted in elevated counterparty risk leading to incomplete markets, idle and thus stranded collateral pools. Also, some central banks purchases of good collateral have contributed to shrinkage in the pledged collateral market from $10 trillion prior to Lehman crisis (end-2007) to about $6 trillion (end-2011).
We emphasize that the pledged collateral market (in the old collateral space) is different from some ‘restricted’ collateral markets. For example, securitization based structures (SIVs etc) that has lien against specific pieces of collateral are impossible to re-pledge. Also the tri-party repo (TPR) market is a primary source of funding for banks in the U.S., standing at $1.7 trillion (end-2012). It provides banks with cash on a secured basis, with the collateral being posted to lenders – like money-market funds – through one of two clearing banks, BNY Mellon and JP Morgan. However, such pledged collateral sits with custodians and is not rehypothecable to the street.5 We ignored such restricted markets in the old collateral space since collateral was not reusable, or with restricted velocity.
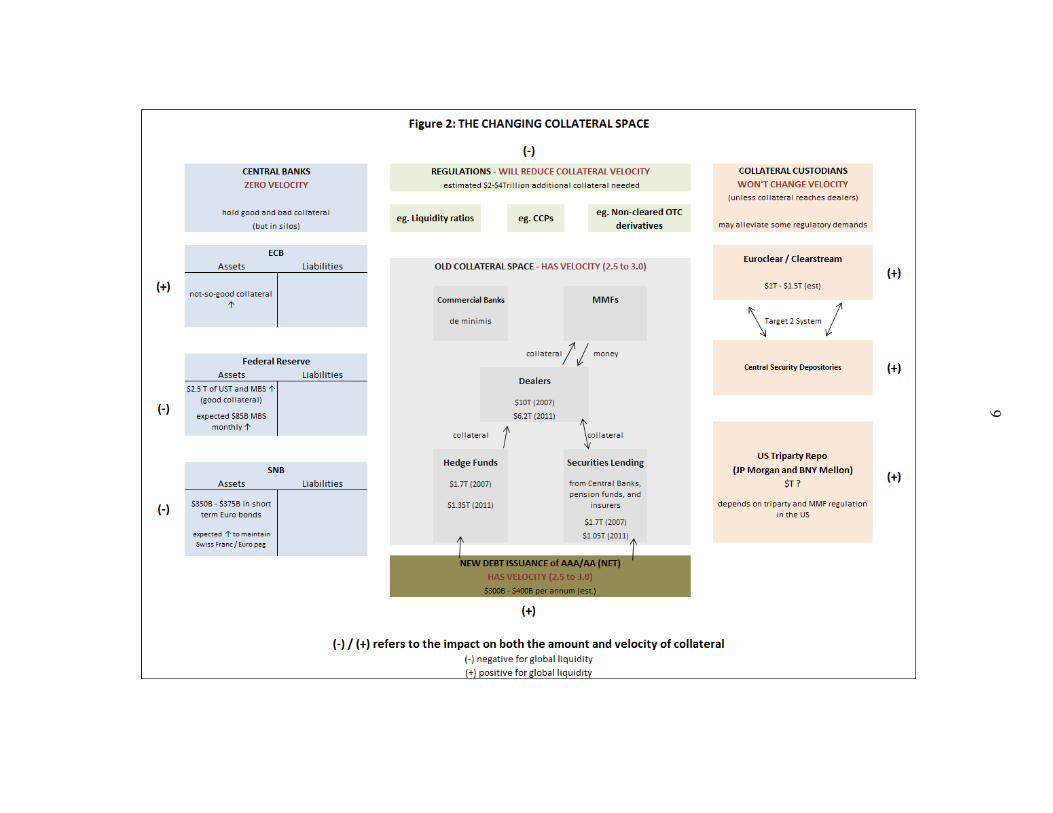
The “new” collateral space straddles not only the bank/nonbank nexus (where collateral generates a velocity), but other participants who are now significantly impacting collateral availability. The increasing role of central banks, regulations and collateral custodians is significantly changing the collateral landscape. These new dimensions involve (i) some aspects of unconventional monetary policies pursued by advanced economy central banks that remove good collateral from markets to their balance sheet where it is silo-ed; (ii) regulatory demands stemming from Basel III, Dodd Frank, EMIR etc that will entail building collateral buffers at banks, CCPs etc; (iii) collateral custodians who are striving to connect with the central security depositories (CSDs) to release collateral from silos; and (iv) net debt issuance from AAA/AA rated issuers. . Although there is a continuum between good and bad collateral, for simplicity we define C1 that is good collateral in all states of nature and can be converted to money (M) at no haircut.6 C2 is collateral that under normal market conditions is “good” but otherwise loses value. During a crisis, C1 (such as U.S. Treasuries or Bunds) and M may continue to be acceptable at par. There is a sudden split between M +C1, and everything else. Everything else ceases to be liquid. The volume of C2 is fully market determined depending on market sentiment, counterparty fears, the length of collateral chains, and market imposed haircuts. To the extent that central banks merely substitute central bank money (M) for assets that have retained their value as collateral (C1), not much liquidity relief is achieved. In order to provide effective liquidity relief for the system, central bank money and liquid collateral must be injected against illiquid or undesirable assets
5 Aside from TPR, there are open market operations trades involving collateral only between dealers and NY Fed—also a restricted market.
6 In the recent QE world, much of the M has found its way back on the balance sheet of central banks as “excess reserves”. From a collateral re-use perspective, C1 in the markets has a higher re-use rate than M (Singh, 2012 for empirical evidence for post-Lehman data where money multipliers have crashed relative to the decline in collateral re-use rate).

6
(C2); the supply of unencumbered collateral has to increase (Singh and Stella, 2012).7 Some collateral will always remain close to par or above par in value (i.e., C1). During crisis, there is a race to acquire the highest quality collateral, C1 that is then typically hoarded. The information sensitive portion of C (i.e., C2) became subject to a “lemons” problem. C2 consequently is no longer accepted at a full information market clearing price or, sometimes, at any price. Central banks became subject to a form of Gresham’s Law (i.e., "bad collateral will drive out good collateral from markets”) if they were slow or reluctant to loosen their collateral policies. Just as water finds its own level, collateral in the market domain will find its economic rent when it is pledged for reuse (Box 1). When mapping the changing collateral space in Figure 2, we assume debt/GDP of developed countries will not increase significantly (otherwise the topic of collateral shortage is moot). Also we assume that regulation and collateral standards will not become so lax that junk will be deemed as “good collateral” with only a token haircut. We focus on collateral “flows” since whatever the stock of good collateral, only a fraction flows to markets to seek “economic rent”.
Box 1. Augmenting rate of return on security by pledging it for re-use The ‘supply’ of pledged collateral comes from nonbanks. This is received by the central collateral desk of banks that re-use the collateral to meet the ‘demand’ from other intermediaries—bank or nonbank-- in the financial system. This collateral primarily moves to augment returns (i.e., return enhancement and not risk transformation). Thus a U.S. Treasury that matures in 30 years that has a coupon of 4% does not over its lifespan yield 4% to the owner. Aside from the fluctuating market pricing/yield of this security, the return due to re-use in the collateral space will typically provide an extra return to the owner of the security, over its tenor (t0 to t30). Mathematically, if x is the 30 year U.S. Treasury with 4% coupon, then total returns to
the owner if the security is not silo-ed is 4%. The source collateral may include AAA securities like US Treasuries, Bunds, or CCC bonds or equities. Thus this collateral market moves securities that may not be “safe” or AAA/AA as long as the security is liquid and has a market clearing price.
7 This requires the government or the central bank to take some risk on their balance sheets. Post Lehman crisis, the quantity and nature of securities comprising C2 changed dramatically. At the same time, there was a surge in demand for liquidity. Basically, institutions that were borrowing using C2 as collateral had to find C1 or money to avoid default as they could no longer use the securities (now distressed) that used to be in C2. Policymakers have the task to increase the volume of C1 collateral in the market domain. One way is to accept C2 collateral (which will have a zero velocity by definition as it will be parked at the central bank) in exchange for money or C1. ECB’s LTROs are in line with this theoretical description. Printing money via conventional (QE) i.e., exchanging M for C1 does not increase (M + C1); this is what U.S. Fed’s QE does but their objectives are very different than that of ECB.

7
III. FACTORS DRIVING THE COLLATERAL DYNAMICS IN THE NEAR-TERM
Although there are many new “entrants” and develpments in the collateral space, we highlight the four salient ones which in our view will have a non-trivial impact on the collateral dynamics. These are (i) central banks that remove good collateral from markets to their balance sheet where it is silo-ed; (ii) regulatory demands stemming from Basel III, Dodd Frank, EMIR etc that will entail building collateral buffers at banks, CCPs etc; (iii) collateral custodians who are striving to connect with the central security depositories (CSDs) to release collateral from silos; and (iv) net debt issuance from AAA/AA rated issuers. . Central Banks: (Figure 2, blue area on left) Despite European Central Bank's efforts to keep the ratio of good/bad collateral high in the EU financial markets, actions of SNB (and other central banks) are diluting this objective. Since the Swiss franc/€ peg in September 2011, the SNB balance sheet has quadrupled to about € 430 billion. The bulk of assets now comprise short tenor "core" € bonds (and lately UK gilts and US Treasuries). This reflects prudent asset-liability management at the SNB.8 However SNB’s bond purchases withdraw the best and most liquid collateral from the Eurozone; this reduces the collateral reuse rate since these bonds are silo-ed at SNB and not pledged in the financial markets. Silo-ed collateral has zero velocity by definition. Market sources indicate that lately long tenor € bonds also being purchased by SNB since there is limited supply of short tenor € bonds.9 The uncertainty in Europe may keep SNB balance sheet trends unchanged and this is a drag on ECB efforts to keep collateral reuse rate high. Market sources also indicate that other central banks have also been buying core € bonds as part of their reserve management strategy; this again silos good € bonds and dilutes ECB's efforts. Not surprisingly ECB's next steps have been to expand collateral eligibility that includes lowering the asset based securities threshold, and relaxing the foreign-exchange collateral requirement (i.e., non-€ collateral is eligible). The Federal Reserve in the United States is likely to continue QE3 (and beyond) until labor markets turn around. Since Lehman’s crisis and continuing with the QE efforts, the Fed is housing about $2.5 trillion of “good collateral” (largely U.S. Treasuries and MBS). Under Operation Twist (that ended last year), Fed used to take in long-tenor debt of about $45 billion per month and release short-term Treasuries. That program kept the total size of the balance sheet unchanged. The recent policy is to expand the Fed’s holdings by another $45 billion per month of long term US Treasuries (without parallel sale of short term debt). So along with QE3 buying of $40 bill MBS per month, Fed's balance sheet will now expand by $85 billion per month. At this rate Fed could silo over $1 trillion additional good collateral in 2013 (and beyond, if necessary). This is likely to have first order implications for collateral velocity and global demand/supply of collateral. Other central banks such as the Bank of England QE efforts have taken about £375 billion gilts on its balance sheet; however, looking forward, BoE is attempting
8 Alternately, SNB could use foreign exchange or other derivatives to hedge the peg; however in the event of a euro-break up the choice of a conservative ALM will likely be more robust than a derivatives hedge.
9 Data trend suggests that duration is increasing. See link http://www.snb.ch/en/iabout/assets/id/assets_reserves/pdf/assets_reserves.pdf

8
to keep good collateral in the market domain.10 Also, the Bank of Japan is expected to buy about ¥15 trillion ($180 billion) of JGBs, between its Asset Purchase Program and Rinban operations; however JGBs have very low velocity since they are not used in “upgrade” trades, and generally held by domestic investors. Regulations: (Figure 2, green area on top) Regulatory demands stemming from Basel III, Dodd Frank etc., are expected to silo $2-$4 trillion of collateral. Higher liquidity coverage ratio(s) (or LCRs) at banks, along with collateral needs for CCPs (and especially non-cleared OTC derivatives) are some of the key regulatory changes that will impact collateral markets.11 Recent proposals include provisions for sub AAA/AA assets to qualify for LCR.12 Similarly, eligible collateral at some CCPs already includes commodities (e.g., gold), corporate bonds (CME), equities, MBS (e.g., LCH Swapclear), renminbi (CME) etc. Some CCPs (especially at the request of buy side) are now seeking alternatives to title transfer that will allow clients to pledge securities as margin collateral.13 These safety buffers will silo the associated collateral and drain collateral from the financial markets.14 However, the regulatory proposals are staggered with changes that will be phased-in over the next five years. Collateral Custodians/Depositories: (Figure 2, pink area on right) In summer 2011, Eurozone had about €14 trillion in eligible collateral but much of it is either (i) locked in “depositories" and thus not easily accessible for cross border use; or, (ii) the asymmetry of demand for collateral in the ‘peripheral’ countries relative to the ‘core’ countries was at odds with the sizable availability of eligible collateral.15 Recently however, Euroclear and Clearstream (the key hubs for Eurozone collateral) are working with the local CSDs (or national/central security depositories) to alleviate collateral constraints. The interconnections to the CSDs will be via the Target 2 Securities (T2S) system that will provide a single pan-European platform for securities settlement in central bank money.
10 For example, under the FLS (Funding for Lending Scheme), UK banks can borrow UK Treasury bills for a term of up to four years in exchange for typically lower quality and less liquid collateral including bank loans.
11 See Annex 1 for details on OTC derivatives. There are some other proposals including on Solvency II, capital etc.
12Basel Committee on Banking Supervision amended the Basel Committee's rules on LCR on January 6, 2012. Regulations will allow up to 15% of LCR’s assets to include listed equities and lower rated bonds (with appropriate haircuts). http://www.bis.org/press/p130106.htm Prior to this announcement, the results of the Basel III monitoring exercise as of 31 December, 2011 indicated that the aggregate LCR shortfall may be between €700 billion to €1.8 trillion. 13 Pledged collateral without title transfer remains on the balance sheet of the client as a lien. If a member defaults, CCPs would be in an advantageous custody position with title transfer collateral than a pledge. See Standard and Poor’s (2012). 14 In a draft IOSCO study (ISDA, 2012), non-cleared OTC derivatives may require as much as $10 trillion in initial margin if banks are required to post collateral before netting such positions (and about $1 trillion if netting is allowed). 15 Since then, and especially after the LTROs, ECB’s eligible collateral criterion has expanded.
9

10
Preliminary estimates suggest that perhaps up to €1- €1.5 trillion of AAA/AA quality collateral may be unlocked in the medium term via efforts of custodians to optimize collateral and build a collateral highway or global liquidity hub. However, the internal “plumbing” (i.e., operations, workflows, technology, staff etc) that is required to process and manage trillions of collateral balances needs to be smooth.16 Even if this collateral does not reach “large banks/markets”, it allows the collateral to leave “CSD silos”, improve efficiency, and enhance accounting debt and credits and reduce the burden on markets to provide collateral for LCR or CCP related regulatory buffers. 17 In the U.S., JPMorgan and Bank of New York may also improve collateral flows from within the U.S. Tri-party repo (TPR) system; however regulatory reforms on the tri-party and money market funds may limit the size of the collateral market.18 In general, central banks, SWFs and long term asset managers (life insurance and pension funds) desire collateral that is low volatility, but not necessarily highly liquid. These entities should be net providers of liquidity, either in the form of cash or liquid collateral. But critically their “need” for collateral is relatively static (or, as providers of liquidity they can dictate that counterparties take a fixed amount). On the other side the “street” (or the grey area) has a dramatically shifting need for collateral and a large number of counterparties. Their needs are for liquid collateral. So a market for collateral upgrades—in theory—could work.19 New (net) Debt Issuance: (Figure 2, brown area at the bottom) Assuming AAA/AA countries have GDP of around $25 trillion and with a deficit of around 4-5 percent, they have supplied (on average) about $1 trillion of new (net) debt—sovereign and
16 Every institution or market is different; there is a lot of friction in the pipes. Even though legally collateral is allowed to be re-used but if a counterparty along the collateral chain hasn’t built the system to do anything with it, the collateral gets “stuck” in the plumbing. The frictions in aggregate can be quite sizeable and may be another reason why the theoretical balances may not add up mathematically. 17 In February 2013, BoNY’s dealers will be required to prefund all maturing tri-party repo transactions involving DTC-sourced collateral prior to settlement. This change will eliminate BoNY’s intraday credit exposure to DTC-eligible collateral (e.g., equities); however this is a minor proportion of the total. So still a significant amount of intra-day credit will continue. The tri-party elements in Europe (i.e., Euroclear Bank and Clearstream Banking S.A.) also have about € 900 billion of client collateral but unlike in the US, there is generally no intra-day credit to clients. J.P. Morgan Chase has stopped the daily unwind of non-maturing term repo trades, eliminating its intraday credit exposure for these transactions. http://www.marketwatch.com/story/jp-morgan-achieves-major-milestone-in-tri-party-repo-market-reforms-2012-11-19
18Money market funds are an important money artery to the US financial plumbing system and support about one-third of the TPR market. If US regulations move this industry towards variable NAV, then the money artery may shrink.
19 EU’s directive on financial collateral arrangements provides the following clear definitions: (i) Security financial collateral arrangement, which means an arrangement under which a collateral provider provides financial collateral by way of security to or in favor of a collateral taker, and where the full or qualified ownership of, or full entitlement to, the financial collateral remains with the collateral provider when the security right is established. (ii) Title transfer financial collateral arrangement, which means an arrangement, including repurchase agreements, under which a collateral provider transfers full ownership of, or full entitlement to, financial collateral to a collateral taker for the purpose of securing or otherwise covering the performance of relevant financial obligations (also see Singh, 2011b, Box 1).

11
corporate--every year, with latest data on the lower side.20 Database and market contacts suggest that on average about 30%-40% of AAA/AA collateral inventory reaches markets via custodians for re-use (on behalf of reserve managers, SWF, pension, insurers etc); however, much of the inventory stays with buy and hold investors. So if Debt/GDP remains on trend in developed countries (i.e., the ratio does not increase sizeably), new debt stemming from the “numerator” may provide up to $300-$400 billion per year to the markets assuming counterparty risk especially with European banks does not elevate. Another 5%-10% of new inventory (including equities) may come via hedge funds. With a collateral reuse rate of about 2.5 (and assuming this does not decrease due to the various silo(s) in the “new” collateral space) this may alleviate collateral shortage by about $800 billion to $1.2 trillion per year.21
IV. PRICE OF MONEY AND PRICE OF COLLATERAL
Central banks can create money by fiat; but not collateral.22 There are inherent differences between money and collateral. The difference in rates earned on each are in part a reflection of those differences. Money’s price is mapped by interest rate; general collateral (GC) price by repo rate.23 However, the two have not moved in tandem after the recent crisis (Klee and Stebunovs, 2013). The banking system in the U.S. presently cannot mobilize their deposits at central bank (in the form of “excess reserves”). If this is the “price of money” the banks hold on to it and this does not reach the financial system then the price of money is high relative to other assets. 24 As the banks are not lending “excess reserves”, the only way they will lend is against collateral with
20 Risk Management Association’s (RMA) database summarized inventory on loan to the market. See Barclays AAA/AA index and www.rmahq.org that provides data on securities lending with title transfer.
21 Estimates for collateral and collateral velocities are tentative. The dwindling number of AAA/AA entities, and above all the potential correlations between borrowers and the collateral they’re pledging, create quite sharp mismatches between what looks like plenty (e.g. Eurozone government bonds), and the extent to which anyone a wants to actually take them as collateral from a bank in the same country. Regulations remain in flux; for example, sub AAA/AA issuance may likely be considered satisfactory collateral. Also, if there is demand, collateral transformation may increase the required supply. On the other hand, debt ceiling issues in the U.S. may entail reduced collateral supply in the form of U.S. Treasuries or Bills than past trend.
22 When someone sells a U.S. Treasury bond for money, they get a bank liability. Why would investors sell interest bearing liability of the U.S. Treasury for a non-interest-bearing liability of (say) Citibank? Because there are things they can do with the non-interest-bearing liability (mainly settle payments to others immediately at par) that can't be done with the U.S. Treasury. Even U.S. Treasury bills have a degree of nominal price risk. But there are things in favor of U.S. Treasury bonds that cannot be done with bank deposits - mainly put it somewhere that it can't get caught up in anyone's bankruptcy. So if the two things share a lot of characteristics, but differ along these two, can we conclude that the interest rate on short tenor U.S. T-bills is somehow the 'value' for both money and collateral?
23 Repo rate is the rate at which cash is lent in lieu of collateral for a given tenor. Shortage of collateral results in lower repo rates and vice versa.
24 If good collateral cannot be produced by fiat like money, then why aren’t the large banks converting $1.6 trillion in excess reserves into bonds? The price of money must be very high. In other words, “for banks, reserves at the Fed are close substitutes for Treasury bills in terms of return and safety” (Williams, 2012).

12
sharp haircuts as credit quality has fallen.25 Banks with access to money created by QE are fine since they can use cash as collateral. On the other hand, insurance companies and pension funds who sell U.S. Treasuries don't need cash as collateral. In the U.S., as of end-2012, the T-bills curve was roughly the same as that at end-2011—0 basis points for 1 month; 1 basis points for 3 months; 9 basis points for 6 months, and 14 basis points for 12 months. Meanwhile the Fed is currently paying 25 bps as interest on excess reserves (IOER). Clearly, no US bank is going to bid in the T-bill auction for its own account. This takes out quite a lot of demand. So for the market to be clearing at such low rates there must be sizable demand coming from somewhere— nonbanks (e.g., mutual funds; corporate treasurers; Fannie Freddie who are not depository institutions; also the broker/dealer part of a SIFI that is not the ‘bank’). Nonbanks investors flush with liquidity prefer T-bills to long tenor bonds—so the T-bill market has remained below 25 bps since IOER came in place. Market segmentation has resulted in many “curves” below IOER (Figure 3). Freddie Fannie (and the home loan banks) surplus cash positions impact the Fed Funds rate (Bech and Klee, 2011).26 GC repo rate is largely via Triparty repo market that is influenced by money market funds and corporate cash positions (and Fed’s “operation twist” that supplied T-bills in exchange for long tenor bonds when it was in existence). Thus, there are a number of different rates earned on money, and thus, different spreads on the rates earned on money and collateral. 27 In Europe there is no IOER for banks, and also the nonbank sector is relative small compared to the U.S. However, negative rates have been prevalent in Denmark and Switzerland (some charging clients up to 50 basis points for deposits). Lately, ECB’s deposit rate cut to zero in July, 2012 has resulted in unsecured rates at around 10 bps. Lack of good collateral has resulted in the GC repo rates at around zero (as cash lenders are reluctant to lend at negative rates). Interesting to note that the the initial intent of the Fed was that IOER provides a “floor” to Fed Funds rate. In hindsight, IOER turned out to be a ceiling; so 25 bps is a relatively high price for money.28 25 In a world of managed balance sheets and capital/asset ratios, both a bank deposit and a GC repo investment sit as liabilities on the balance sheet of a bank (and banks desperately don’t want that short-term liability as it constraints their leverage ratio). When a bank takes on a new liability, its balance sheet grows—unless it can shed some other liability. However Basel III is requiring banks to term out their liabilities: a term liability cannot be shed overnight. The only overnight liability that the bank can “manage,” (i.e., take on and off at will) is overnight Triparty repo. Money market “government” funds (via 2a-7) had increasing difficulty finding balance sheets willing to provide investments yesterday, particularly on quarter-end and year-end financial statement dates. That implies that custodial banks - State Street and BNY especially – will likely grow because of their position as 'balance sheet of last resort' for the money market mutual fund industry. QE converts useful collateral to excess balance sheet at banks.
26 Freddie Mac and Fannie Mae (and home loan banks) do not have access to the IOER.
27 Until end of last year, FDIC’s TAG “pass through” around 10-15 bps is a rate for safety of principal (that banks levied their clients for deposits greater than $250,000).27 Also, BoNY is willing to provide safety of principal at minus 13 bps. There is also an “inelastic rate” for 1 month T-bill (Duffee, 1996; Gurkaynak et al. 2006) that is empirically different than T-bills of longer maturity (and closer to safe money attributes).
28 Paying interest on excess balances should help to establish a lower bound on the federal funds rate. (Federal Reserve Board, October 6th, 2008). http://www.federalreserve.gov/monetarypolicy/20081006a.htm

13
Figure 3:US IOER, Fed Funds, T-Bills and GC Rates (left); ECB Deposit Rate and GC Collateral (right)
V. POLICY SUGGESTIONS
ECB still holds good collateral (e.g., Bunds, Dutch, French bonds and other AAA/AA rated securities). Although the fraction of good collateral has dropped since end-2011, ECB’s € 3 trillion balance sheet still holds about 20 percent in good collateral (or € 600 billion). So far ECB has accepted “not so good collateral” in exchange for money (i.e., via LTROs), and thus improved the good/bad collateral ratio in the market by decreasing the denominator. ECB may want to "rent" the good collateral they hold, especially if their goal is to keep the good/bad collateral ratio high in the markets; this will prop up collateral velocity. Renting of good collateral does not lower the numerator—the collateral is on loan temporarily. A more aggressive stance would be taking Reserve Bank of Australia’s collateral transformation route.. The re-use of collateral is fundamental in understanding the divide between demand and supply, and the collateral literature is largely void in this regard. For example, Reserve Bank of Australia’s (Heath and Manning, 2012) proposals suggest coping with the upcoming structural/regulatory changes that will demand significant high quality liquid assets (HQLA, or good collateral) without issuing more debt securities. RBA’s suggested route is akin to collateral transformation but at a penalty rate (about 15 basis points plus appropriate haircut) by using good assets from their own balance sheet, but this would keep the collateral re-use rate from declining.29 In other words,
Demandcollateral = Supplycollateral *re-use factor Other EU central banks also hold good collateral and may consider renting it out to strong counterparties in the markets. Other central banks (e.g., Fed, SNB and BoE) do not have the same vested interest as ECB to buoy the collateral markets in EU. This may be another route to consider versus “more subsidized haircuts”. Bagehot (1873) suggests central banks provide the
29 http://www.rba.gov.au/publications/bulletin/2012/sep/pdf/bu-0912-6.pdf There are other central banks with significant good collateral that may go the RBA route such (for example, HKMA, MAS, RBSA etc.). Here the distinction between “stocks” and “flows” is not material; what matters is the available supply in the market—either from old stock or new flow—that can be reused.
0
0.5
1
1.5
2
2.5
Euro Repo ECB Deposit Rate

14
LOLR for good collateral (or “not so good” collateral but at market prices). Subsidized haircuts go against the Bagehot doctrine. On the regulatory front, draft proposals continue to be flux. Recently regulators are willing to accept up to 15% assets towards LCR requirements with rating as low as BBB minus; phasing out the requirements will further alleviate near-term collateral bottlenecks. Also, collateral estimates for non-cleared OTC derivatives (that will not move to CCPs) are high and stems from precluding internal bank models to net non-cleared OTC derivatives. Consistent with the past (and in line with the economics of netting as per ISDA agreements), final regulations are likely to accept internal models at banks that allow netting before estimating collateral needs. This will significantly reduce collateral demand for non-cleared trades to around $ 1 trillion.30 In summary, collateral scarcity is distinct from collateral shortage.31 Annual collateral “flows” (e.g., via new net debt issuance) may seem less relative to desired collateral “stocks” (e.g., for regulatory buffers) but that may not be the case over a five year cycle. Several competing developments have been in motion in recent years with positive and negative implications for the collateral market s: ECB’s LTROs (+), Fed and SNB actions (-); new net debt issuance (+); collateral velocity (-). In the near future, sustaining collateral velocity (i.e., collateral re-use by markets) will be important since there is an unfortunate constellation—from central bank actions and regulatory proposals—that will silo good collateral. Fine-tuning some regulatory demands will alleviate collateral scarcity in the near term. So will actions from some central banks that have vested interest to provide good collateral in the markets. In the medium term, assuming no major dislocation in financial markets, central banks are likely to unwind sizable good collateral from their balance sheet and alleviate shortages (if any).
30 From an estimated $10 trillion (IOSCO’s draft study –via ISDA--on collateral needs for the $127 trillion non-cleared OTC derivatives market, 2012). It remains unclear why the IOSCO draft study would suggest alternative to legally binding ISDA netting agreements.
31 Also see Benoît Coeuré, ECB’s speech in Amsterdam, October 1,2012 http://www.ecb.int/press/key/date/2012/html/sp121001.en.html

15
Annex 1. Collateral Needs in the OTC Derivatives Market—CCPs and Non-cleared Trades
From a collateral demand/supply framework, under-collateralization in the OTC derivatives market is the more relevant metric for policy discussions. While typically collateral— both initial and variation margin—is posted by hedge funds, asset managers, and other clients, large banks active in this space do not have a 2-way margin agreement with some clients (e.g., sovereigns, quasi-sovereigns, large pension and insurers, AAA corporations, etc); so collateral may not be forthcoming when due and, as a quid pro quo, the banks may not be posting collateral either to such clients. Interestingly, many of the above clients are exempt from central clearing and regulatory proposals may also exempt foreign-exchange swaps from moving to CCPs.32 Reforms planned will try to overcome the under-collateralization and are two-pronged: first is the move to CCPs (i.e., central clearing) that will require collateral to mark position to market and second, capital charges via higher risk-weighted assets/collateral at large banks for OTC derivatives that do not move to CCPs. However, regulations are still being drafted and there is uncertainty on how collateral requirements will differ between the bilateral and the cleared world (which impacts netting, and as a consequence collateral calculations).33 There is reported under-collateralization in recent years of about $3 to $5 trillion as per BIS Quarterly, June, 2012—see Table 1. (This may even be higher since initial margin shortfalls are not reported to the BIS semi-annual OTC surveys). Even if we consider half of the total positions (i.e., when large banks are out-of the-money) that are risks to taxpayers, these estimates are sizable. Furthermore, although BIS indicates about $1.8 trillion of collateral dedicated to this market, this collateral is fungible and includes a re-use factor of about 2.5 to 3, dedicated collateral may be only $600-$700 billion. Preliminary estimates that calculate collateral needs at CCPs for cleared trades and especially non-cleared trades (draft IOSCO study via ISDA, 2012) are daunting. Netting within the OTC derivatives market is the flip side of collateral needs. The large banks active in the OTC derivative space are reticent to unbundle “netted” positions on their books, as this results in deadweight loss and increases collateral needs. Since there is no universally accepted formal definition of a “standard” contract (or contracts that are “clearable” at CCPs), there is room for these banks to customize their derivatives (that are non-standard) despite the higher capital charge associated with keeping non-standard contracts on their books. For some banks, the netting benefits may be sizable relative to the regulatory capital charge wedge. This can be expected at large banks where risk management teams build high correlations across OTC derivative products for hedging purposes.
32 A key incentive for moving OTC derivatives to CCPs is higher multilateral netting, i.e., offsetting exposures across all OTC products on SIFIs’ books---intuitively, the margin required to cover the exposure of the portfolio would be smaller in a CCP world. However, if there are multiple CCPs that are not linked, the benefits of netting are significantly reduced, because across-product netting will not take place (since CCPs presently only offer multilateral netting in the same asset class and not across products). 33 http://isda.derivativiews.org/2012/04/24/the-bilateral-world-vs-the-cleared-world/

16
Regulations for bilaterally cleared remain in flux.34 Thus as collateral is posted on CCPs and towards bilaterally cleared OTC derivatives, the present under-collateralization figures via BIS may not fully reflect the loss of netting that will ensue; if there is a consolidation of CCPs in the medium term, or if a CCP offers multiple OTC derivative products that can cross-net, collateral requirements will reduce. International banks desire one global derivative book to minimize netting loss but may end up with more than one derivative book for non-cleared OTC derivatives. For example in the U.S., banks due to the Lincoln “push out” clause will keep safe derivatives (like interest rate swap) under the “bank” part of a bank holding company; rest of the derivatives will be in another part.
Source: BIS semi-annual OTC Derivatives Survey The status quo of this market will change (e.g., lower overall netting, no interoperability between CCPs, demand for segregated collateral, extraterritoriality and regulatory arbitrage etc,). 35 Initially, the regulatory proposal will lead to higher collateral per unit of clearing due to fragmentation of the market from netting. There are other avenues to remove OTC derivatives risk from the large banks books (with similar underlying economics and perhaps lower collateral needs).36
34 From an estimated $10 trillion (IOSCO’s draft study on collateral needs for non-cleared OTC derivatives market, 2012); however if netting is allowed (as per ISDA agreements), this may reduce this estimate to about $1 trillion. Also see http://isda.derivativiews.org/2012/04/24/the-bilateral-world-vs-the-cleared-world/ 35 Interoperability, or linking of CCPs, will increase each CCPs clearing fund in line with the net open positions between them. So CCPi may hold or have access to collateral from another CCPj that may go bankrupt in the future, so that losses involved in closing out CCPj’s obligations to CCPi can be covered. However, legal and regulatory sources indicate that cross-border margin access is subordinate to national bankruptcy laws (such as Chapter 11 in the U.S.). It is unlikely that CCPi in a country would be allowed access to collateral posted by CCPj registered in another country. Neither is it of interest to CCPs to change their business model and lose their niche market. The sheer collateral arithmetic to support interoperability is daunting (for example, every interoperating CCPs default fund will need to be augmented for the ‘net open interest position’ of other interoperating CCPs—see Singh 2011a, Box 2). 36 http://www.voxeu.org/article/fallacy-moving-over-counter-derivatives-market-central-counterparties
H2 2008 H1 2009 H2 2009 H1 2010 H2 2010 H1 2011 H2 2011 H1 2012
35,281 25,314 21,542 24,673 21,296 19,518 27,285 25,392
4,084 2,470 2,070 2,524 2,482 2,336 2,555 2,217
20,087 15,478 14,020 17,533 14,746 13,244 20,001 19113
1,112 879 708 706 648 708 679 645
955 682 545 457 526 471 487 390
5,116 2,987 1,801 1,666 1,351 1,345 1,586 1187
3,927 2,817 2,398 1,788 1,543 1,414 1,977 1840
5,005 3,744 3,521 3,578 3,480 2,971 3,912 3668
Table 1: Under-collateralization in the OTC Derivatives Market
Gross market values have been calculated as the sum of the total gross positive market value of contracts and the absolute value of the gross negative
market value of contracts with non-reporting counterparties. The values in the red circle are the gross market value after taking into account legally
enforceable bilateral netting agreements. Source: BIS surveys.
Gross Market Value
Gross Market Value After Netting
B. Interest rate contracts
C. Equity-l inked contracts
D. Commodity contracts
E. Credit default swaps
F. Unallocated
GRAND TOTAL
A. Foreign exchange contracts

17
References: Adrian, Tobias and Hyun S. Shin, 2009, “Collateral Shortage and Debt Capacity,” Princeton
University (unpublished note). Bech, Morten L., and Elizabeth Klee (2011), "The Mechanics of a Graceful Exit: Interest on
Reserves and Segmentation in the Federal Funds Market,” Journal of Monetary Economics, vol. 58, no. 5, pp. 415-431.
Brunnermeier, Markus, and Lasse Pedersen, 2009, “Market Liquidity and Funding Liquidity,”
Review of Financial Studies, Vol. 22, pp. 2201–38. Claessens, Stijn, Zoltan Pozsar, Lev Ratnovski and Manmohan Singh, 2012, “ Shadow Banking:
Economics and Policy”, IMF Staff Discussion Note, SDN 12/12, December. Copeland, A., A. Martin, and M. Walker, 2010, “The Tri-party Repo Market Before the 2010 Reforms,” Federal Reserve Bank of New York Staff Report No. 477. Debelle, Guy, 2012, Reserve Bank of Australia, Assistant Governor’s speech, “On Europe’s
Effects on Australian Financial Markets,” http://www.rba.gov.au/speeches/2012/pdf/sp-ag-140212.pdf
Duffee, Gregory R, 1996. " Idiosyncratic Variation of Treasury Bill Yields," Journal of Finance,
American Finance Association, vol. 51(2), pages 527-51, June. Geanakopolos, John, 2003, “Liquidity, Default and Crashes,” Cowles Foundation Paper No.
1074. Gorton, Gary, and Andrew Metrick, 2009, “Securitized Banking and the Run on Repo,” NBER
Working Paper No. 15223, August. –––––, 2010, “Haircuts,” Federal Reserve Bank of St. Louis Review. ______,Stefan Lewellen, and Andrew Metric, 2012, “The Safe Asset Share,” American
Economic Review: Papers and Proceedings,102, No 3, May, pp 101-106. Gourinchas, Pierre-Olivier and Olivier Jeanne, 2012, “Global Safe Assets”, BIS Working Paper
No 399. Gurkaynak, Refet, Brian Sack, and Jonathan Wright, 2006, ―The U.S. Treasury Yield Curve: 1961
to the Present, June, Federal Reserve Board Staff Working Papers. Heath, Alexandra and Mark Manning, 2012, “Financial Regulation and Australian Dollar Liquid
Assets”, Reserve Bank of Australia Bulletin, September Quarter. International Monetary Fund, Global Financial Stability Report (Annex 2.1) April, 2012

18
ISDA, 2012, “Initial Margin For Non-Centrally Cleared Swaps”, November. JP Morgan, “Flows and Liquidity- No Shortage of Collateral”, October 5, 2012. Krishnamurthy, Arvind, Stefan Nagel, and Dmitry Orlov, 2010, “Sizing up Repo,” Working Paper, Northwestern and Stanford Universities. Klee, Elizabeth and Viktors Stebunovs, 2013, “Target Practice: Monetary Policy Implementation
In A Post-Crisis Environment”, Forthcoming, Federal Reserve Board. Shleifer, Andrei, and Robert Vishny, “Fire Sales in Finance and Macroeconomics,” Journal of Economic Perspectives,Winter 2011. Singh, Manmohan, 2011a, “Making OTC Derivatives Safer—a Fresh Look”, IMF Working
Paper No.11/66 ________, 2011b, “Velocity of Pledged Collateral—Analysis and Implication, IMF Working Paper No. 11/256 _______, and Peter Stella, 2012, “Money and Collateral,” IMF Working Paper No. 12/95 _______, 2012, “The (other) Deleveraging”, IMF Working Paper No. 12/179 Standard and Poor’s, 2012 “Collateral Optimization Is Playing A Transformative Role For
Depositories, Custodians, And Clearinghouses”, Ratings Direct, December, 18. Williams, John C, 2012, Presentation to the Western Economic Association International
San Francisco, July 2.