the case for quota sampling - the...
TRANSCRIPT

Quota sampling.ppt | June 2017 | Version 1 | Public 1
SRA Summer Event
June 2017
Roger Mortimore
Director of Political Analysis, Ipsos MORI
The case for Quota Sampling
© 2017 Ipsos. All rights reserved. Contains Ipsos' Confidential and Proprietary
information and may not be disclosed or reproduced without the prior written consent
of Ipsos.
2Quota sampling.ppt | June 2017 | Version 1 | Public
Nobody doubts that
random probability samples with a high response rate
are the gold standard.
The best methodology?
Sample surveys
3Quota sampling.ppt | June 2017 | Version 1 | Public
Nobody doubts that
random probability samples with a high response rate
are the gold standard.
But if that is not possible, quota sampling may be the answer
(Ipsos MORI does a lot of quota sampling.
We also do a lot of random probability sampling.
No axe to grind: it’s about making the best choice in each case.)
The best methodology?
Sample surveys
4Quota sampling.ppt | June 2017 | Version 1 | Public
The method in any given survey will depend on its circumstances
Face-to-face surveys are different from telephone surveys are
different from online surveys
–All of these can and often do use forms of quota sampling
The method in any given survey should depend upon its purpose
Quotas are designed to control the factors that are relevant to the
particular measurements that the survey is intended to make
– Samples do not need to be fully representative so long as they are
representative with respect to what is being measured
–Measurements do not need to be perfect so long as they are
GOOD ENOUGH to serve the survey’s purpose
There is no single way of doing a quota survey
Quota-sampled surveys
5Quota sampling.ppt | June 2017 | Version 1 | Public
In one sense, there is no “theory”.
The justification for quota sampling is empirical: it has a long track
record of producing satisfactory results most of the time. It can’t be
proved that it “ought to” work; nevertheless, it generally DOES work.
The experience is of
billions of dollars’ worth of commercial MR, generally found
satisfactory by clients (at least, they carry on commissioning it)
opinion polls and other social surveys which have consistently found
broadly similar results to more rigorously conducted random polls
The theory
Quota sampling
6Quota sampling.ppt | June 2017 | Version 1 | Public
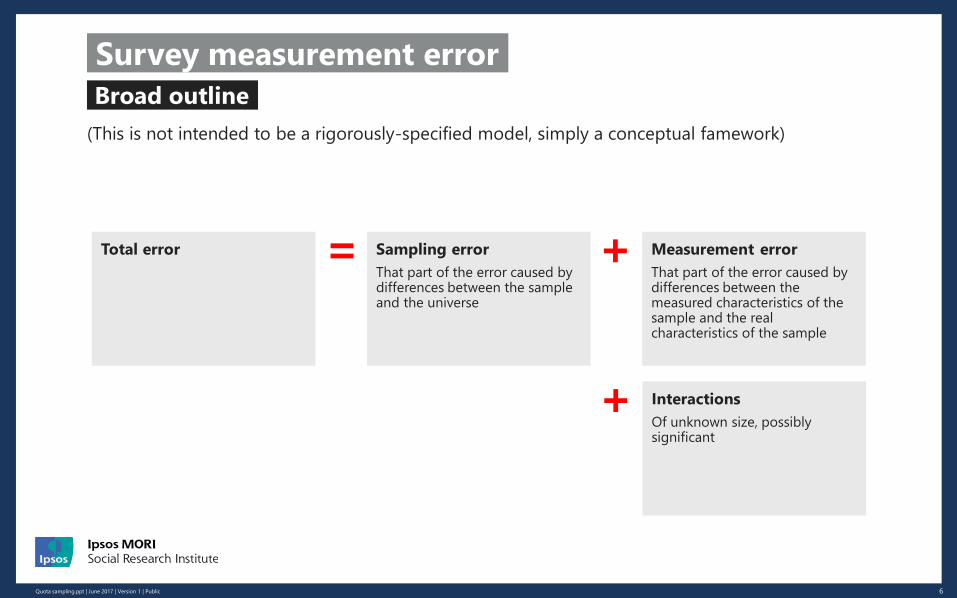
(This is not intended to be a rigorously-specified model, simply a conceptual famework)
Broad outline
Survey measurement error
Total error Sampling error
That part of the error caused by differences between the sample and the universe
Measurement error
That part of the error caused by differences between the measured characteristics of the sample and the real characteristics of the sample
= +
Interactions
Of unknown size, possibly significant
+
7Quota sampling.ppt | June 2017 | Version 1 | Public
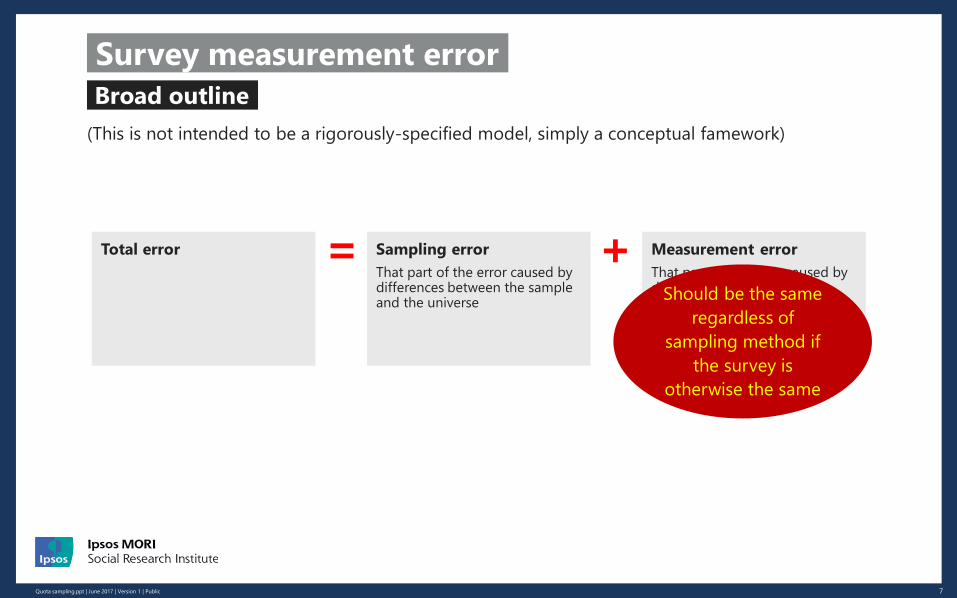
(This is not intended to be a rigorously-specified model, simply a conceptual famework)
Broad outline
Survey measurement error
Total error Sampling error
That part of the error caused by differences between the sample and the universe
Measurement error
That part of the error caused by differences between the measured characteristics of the sample and the real characteristics of the sample
= +Should be the same
regardless of
sampling method if
the survey is
otherwise the same
8Quota sampling.ppt | June 2017 | Version 1 | Public
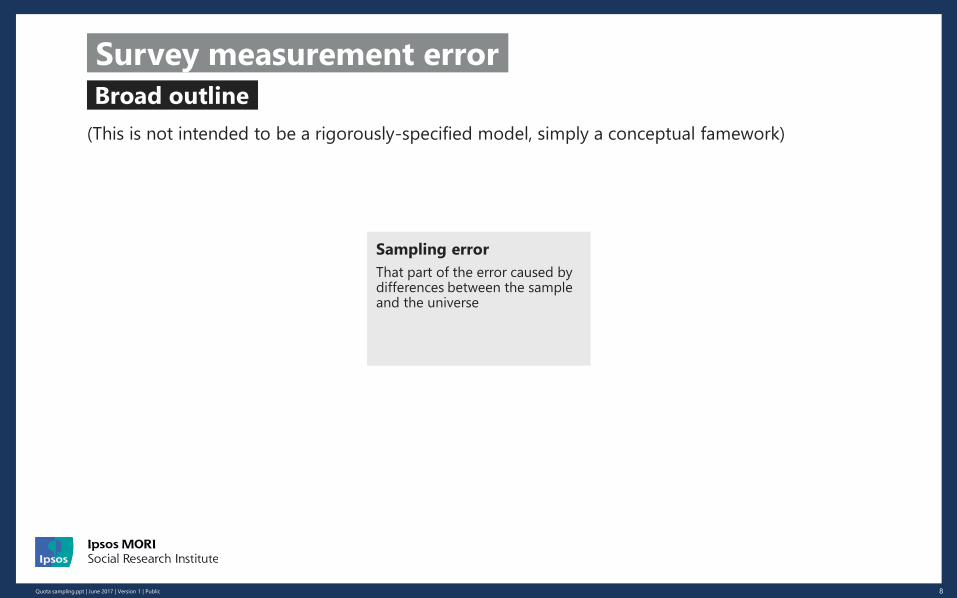
(This is not intended to be a rigorously-specified model, simply a conceptual famework)
Broad outline
Survey measurement error
Sampling error
That part of the error caused by differences between the sample and the universe
9Quota sampling.ppt | June 2017 | Version 1 | Public
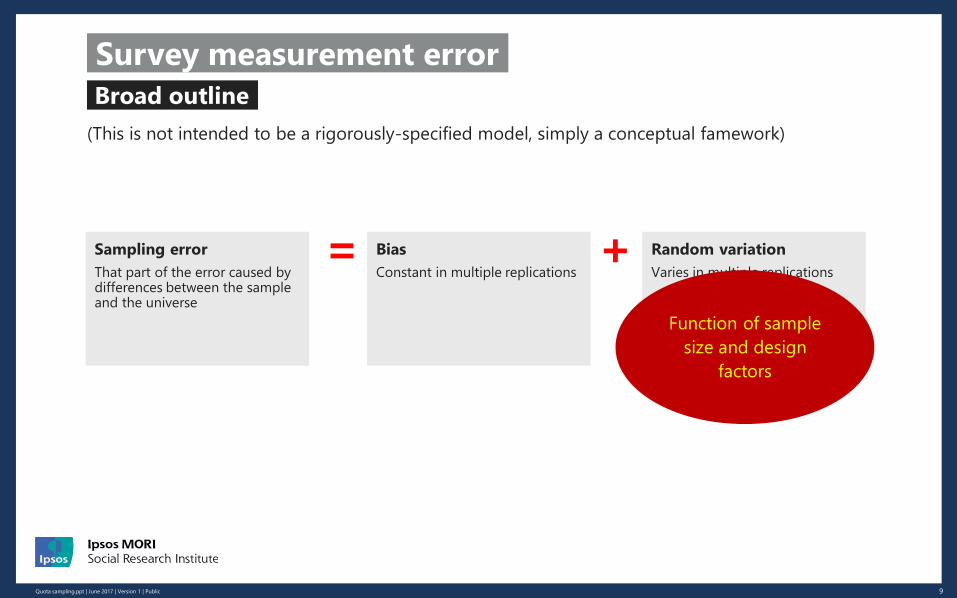
(This is not intended to be a rigorously-specified model, simply a conceptual famework)
Broad outline
Survey measurement error
Sampling error
That part of the error caused by differences between the sample and the universe
Bias
Constant in multiple replications
Random variation
Varies in multiple replications= +
Function of sample
size and design
factors
10Quota sampling.ppt | June 2017 | Version 1 | Public
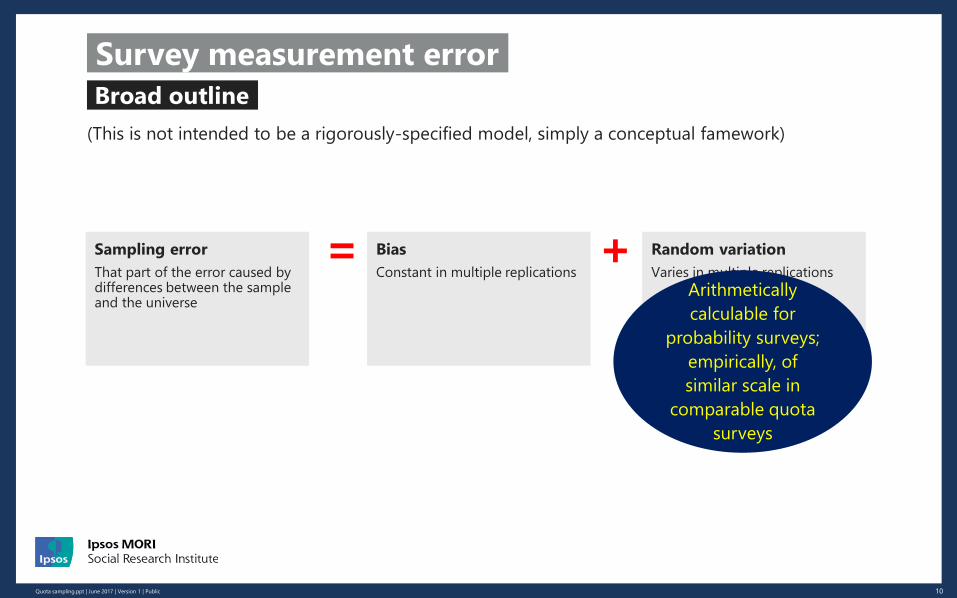
(This is not intended to be a rigorously-specified model, simply a conceptual famework)
Broad outline
Survey measurement error
Sampling error
That part of the error caused by differences between the sample and the universe
Bias
Constant in multiple replications
Random variation
Varies in multiple replications= +
Arithmetically
calculable for
probability surveys;
empirically, of
similar scale in
comparable quota
surveys

11Quota sampling.ppt | June 2017 | Version 1 | Public
(This is not intended to be a rigorously-specified model, simply a conceptual famework)
Broad outline
Survey measurement error
Bias
Constant in multiple replications
12Quota sampling.ppt | June 2017 | Version 1 | Public
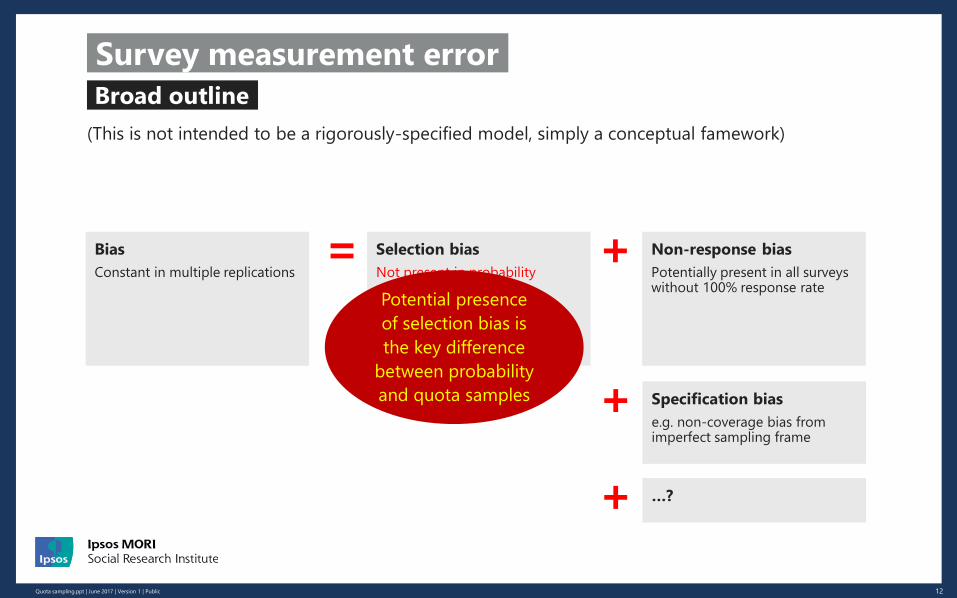
(This is not intended to be a rigorously-specified model, simply a conceptual famework)
Broad outline
Survey measurement error
Bias
Constant in multiple replications
Selection bias
Not present in probability sampled surveys
Non-response bias
Potentially present in all surveys without 100% response rate
= +
Specification bias
e.g. non-coverage bias from imperfect sampling frame
+
Potential presence
of selection bias is
the key difference
between probability
and quota samples
…?+
13Quota sampling.ppt | June 2017 | Version 1 | Public
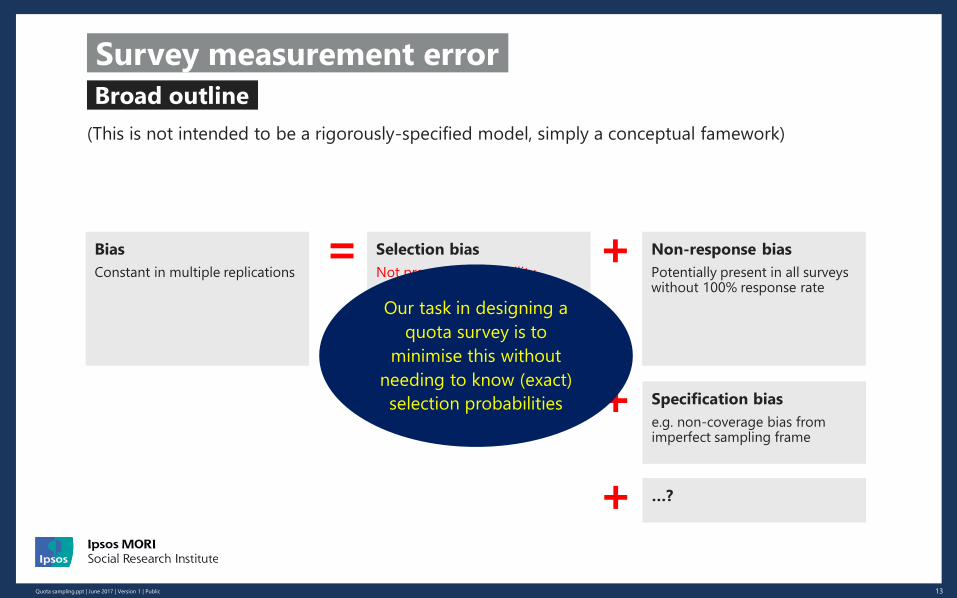
(This is not intended to be a rigorously-specified model, simply a conceptual famework)
Broad outline
Survey measurement error
Bias
Constant in multiple replications
Selection bias
Not present in probability sampled surveys
Non-response bias
Potentially present in all surveys without 100% response rate
= +
Specification bias
e.g. non-coverage bias from imperfect sampling frame
+
…?+
Our task in designing a
quota survey is to
minimise this without
needing to know (exact)
selection probabilities
14Quota sampling.ppt | June 2017 | Version 1 | Public
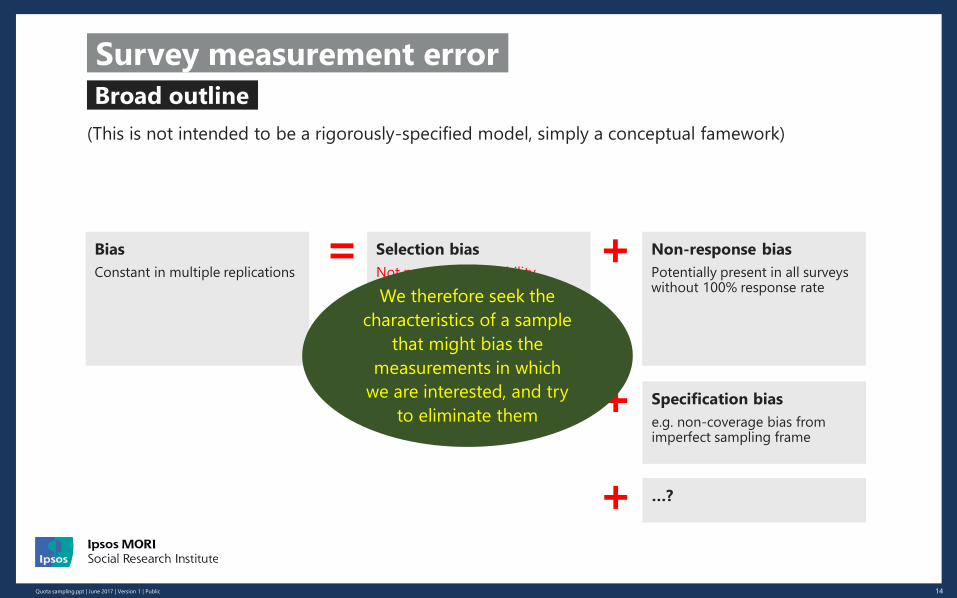
(This is not intended to be a rigorously-specified model, simply a conceptual famework)
Broad outline
Survey measurement error
Bias
Constant in multiple replications
Selection bias
Not present in probability sampled surveys
Non-response bias
Potentially present in all surveys without 100% response rate
= +
Specification bias
e.g. non-coverage bias from imperfect sampling frame
+
…?+
We therefore seek the
characteristics of a sample
that might bias the
measurements in which
we are interested, and try
to eliminate them
15Quota sampling.ppt | June 2017 | Version 1 | Public
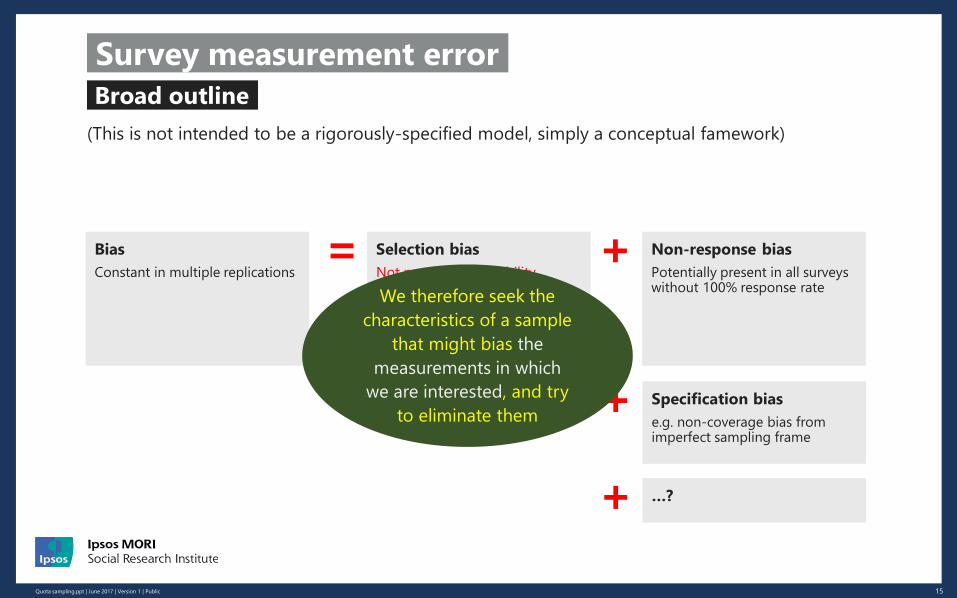
(This is not intended to be a rigorously-specified model, simply a conceptual famework)
Broad outline
Survey measurement error
Bias
Constant in multiple replications
Selection bias
Not present in probability sampled surveys
Non-response bias
Potentially present in all surveys without 100% response rate
= +
Specification bias
e.g. non-coverage bias from imperfect sampling frame
+
…?+
We therefore seek the
characteristics of a sample
that might bias the
measurements in which
we are interested, and try
to eliminate them
16Quota sampling.ppt | June 2017 | Version 1 | Public
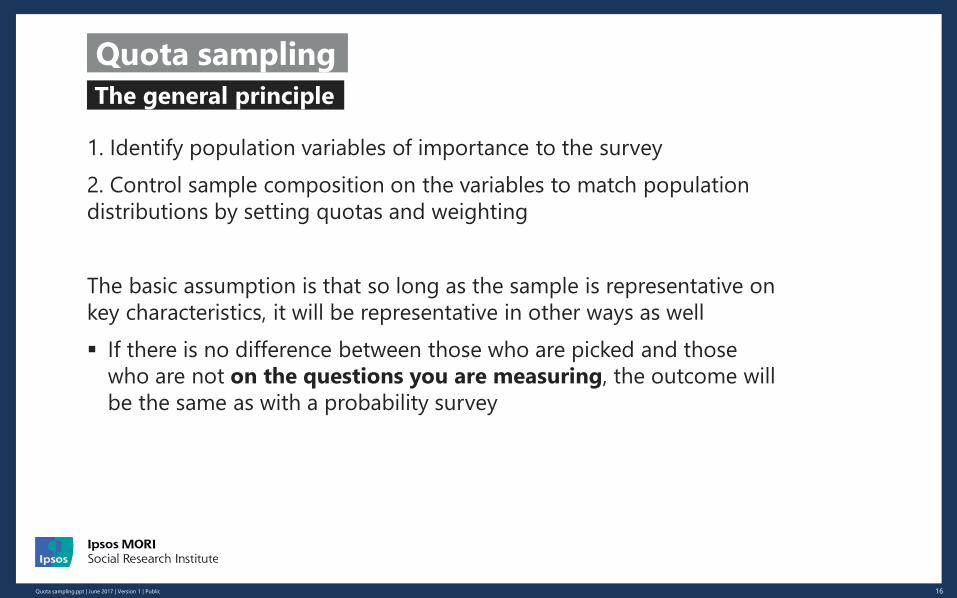
1. Identify population variables of importance to the survey
2. Control sample composition on the variables to match population
distributions by setting quotas and weighting
The basic assumption is that so long as the sample is representative on
key characteristics, it will be representative in other ways as well
If there is no difference between those who are picked and those
who are not on the questions you are measuring, the outcome will
be the same as with a probability survey
The general principle
Quota sampling
17Quota sampling.ppt | June 2017 | Version 1 | Public
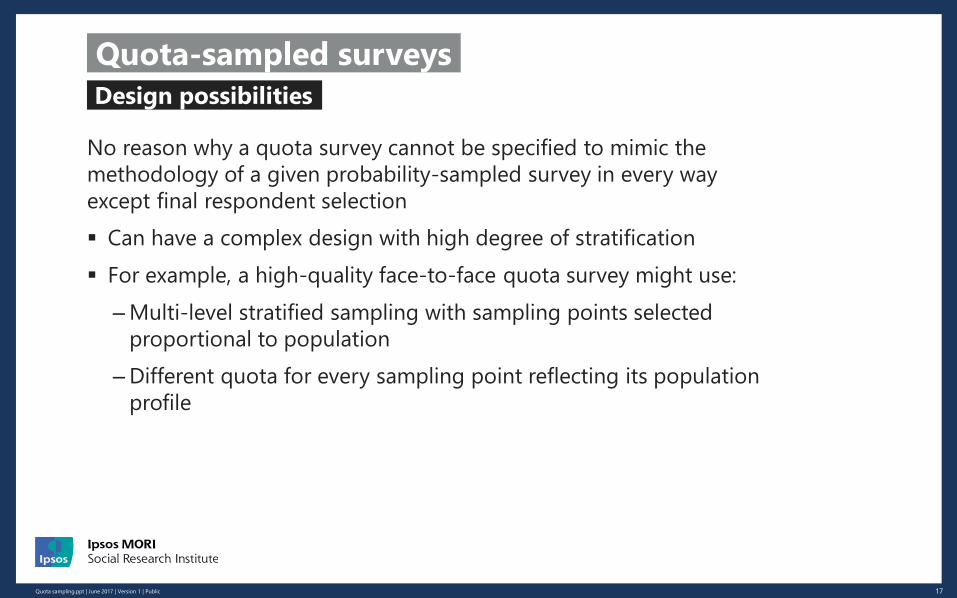
No reason why a quota survey cannot be specified to mimic the
methodology of a given probability-sampled survey in every way
except final respondent selection
Can have a complex design with high degree of stratification
For example, a high-quality face-to-face quota survey might use:
–Multi-level stratified sampling with sampling points selected
proportional to population
–Different quota for every sampling point reflecting its population
profile
Design possibilities
Quota-sampled surveys
18Quota sampling.ppt | June 2017 | Version 1 | Public
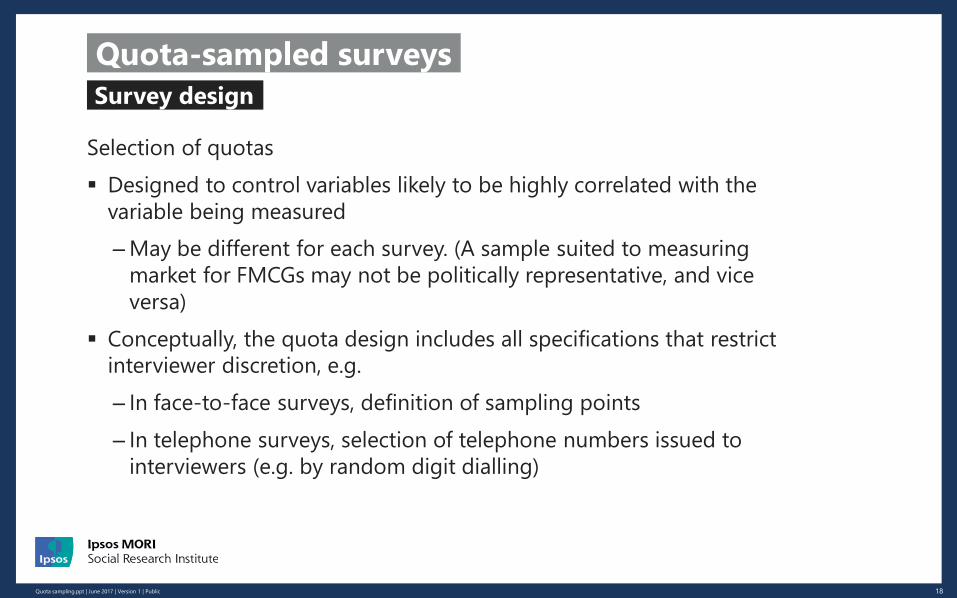
Selection of quotas
Designed to control variables likely to be highly correlated with the
variable being measured
–May be different for each survey. (A sample suited to measuring
market for FMCGs may not be politically representative, and vice
versa)
Conceptually, the quota design includes all specifications that restrict
interviewer discretion, e.g.
– In face-to-face surveys, definition of sampling points
– In telephone surveys, selection of telephone numbers issued to
interviewers (e.g. by random digit dialling)
Survey design
Quota-sampled surveys
19Quota sampling.ppt | June 2017 | Version 1 | Public
Each interviewer is given instructions on how to select respondents.
In a face-to-face quota survey, these might include:
the quota (e.g. the mix of age groups, ethnic groups and working
status that is required, usually tailored to each sampling point);
a map or street listing specifying the area where they are to find their
respondents;
extra restrictions, e.g. to leave a minimum number of doors between
interviews.
Within the bounds of these instructions the interviewer is free to
interview anybody who will take part.
It is the researcher’s job to make sure the restrictions are sufficiently
stringent that this nevertheless results in a representative sample.
Process
Quota-sampled surveys
20Quota sampling.ppt | June 2017 | Version 1 | Public
After interviewing, weighting is applied to the data
NOT an optional extra, an integral part of the sampling design
–With a probability sample, we rely on the randomness of the
selection to give us a representative sample; with a quota sample,
we rely on our specification of the respondent selection to give us
a representative sample
Weighting…
– fine-tunes the control provided by the quotas
– allows control by more variables than are practical for interviewr
quotas
–may also allow for more complex interaction between variables
Process
Quota-sampled surveys
21Quota sampling.ppt | June 2017 | Version 1 | Public
Very obviously, quota samples are highly dependent on the accuracy of
the population information used to set quotas and weighting targets
Note that this might include survey-based information from
probability-sampled surveys. (e.g. Most GB quota surveys will use data
from the Labour Force Survey, the National Readership Survey, etc.)
Caveats
Quota-sampled surveys

Quota sampling.ppt | June 2017 | Version 1 | Public 22
Example 1
Academic surveys: cultural
relations between ethnic groups
23Quota sampling.ppt | June 2017 | Version 1 | Public
Survey of c. 600 White and c. 600 Asian adults in Birmingham
Both groups sampled in high and low deprivation areas
Both groups sampled in high and low density areas for their own
ethnicity, and areas of high and low ethnic diversity
Sampling points (PSUs) were census LSOAs (average pop. 1,500)
121 PSUs selected, stratified by IMD and % of Asian residents,
skewed towards higher Asian areas
– 10 interviews in each
–Quota for each interviewer included ethnic group, over-sampling
Asians to achieve equal sample sizes
– Results in 100% coverage of both groups
Aims
Academic survey

Quota sampling.ppt | June 2017 | Version 1 | Public 24
Example 2
MORI Omnibus c. 1999
25Quota sampling.ppt | June 2017 | Version 1 | Public
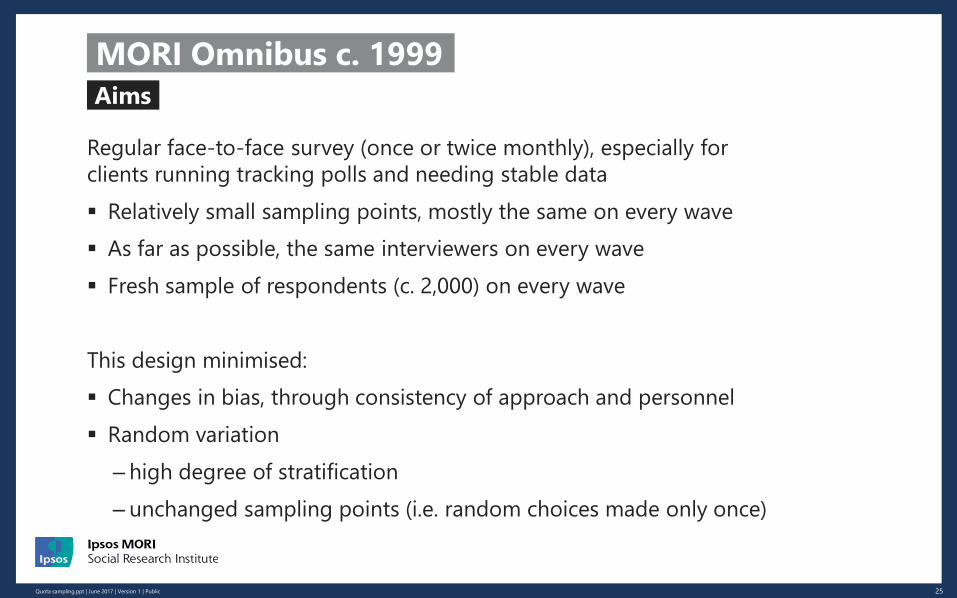
Regular face-to-face survey (once or twice monthly), especially for
clients running tracking polls and needing stable data
Relatively small sampling points, mostly the same on every wave
As far as possible, the same interviewers on every wave
Fresh sample of respondents (c. 2,000) on every wave
This design minimised:
Changes in bias, through consistency of approach and personnel
Random variation
– high degree of stratification
– unchanged sampling points (i.e. random choices made only once)
Aims
MORI Omnibus c. 1999
26Quota sampling.ppt | June 2017 | Version 1 | Public
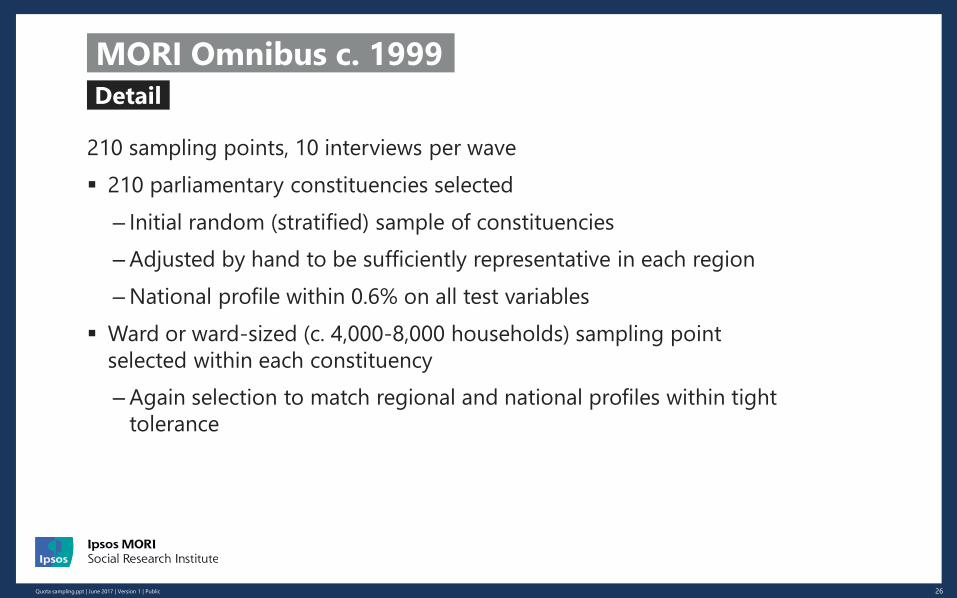
210 sampling points, 10 interviews per wave
210 parliamentary constituencies selected
– Initial random (stratified) sample of constituencies
–Adjusted by hand to be sufficiently representative in each region
–National profile within 0.6% on all test variables
Ward or ward-sized (c. 4,000-8,000 households) sampling point
selected within each constituency
–Again selection to match regional and national profiles within tight
tolerance
Detail
MORI Omnibus c. 1999
27Quota sampling.ppt | June 2017 | Version 1 | Public
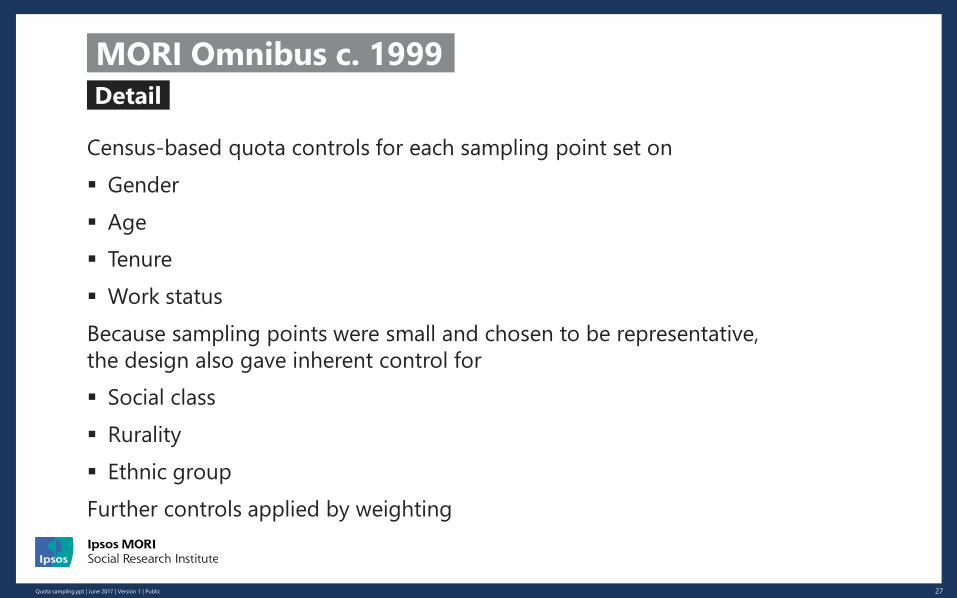
Census-based quota controls for each sampling point set on
Gender
Age
Tenure
Work status
Because sampling points were small and chosen to be representative,
the design also gave inherent control for
Social class
Rurality
Ethnic group
Further controls applied by weighting
Detail
MORI Omnibus c. 1999
28Quota sampling.ppt | June 2017 | Version 1 | Public
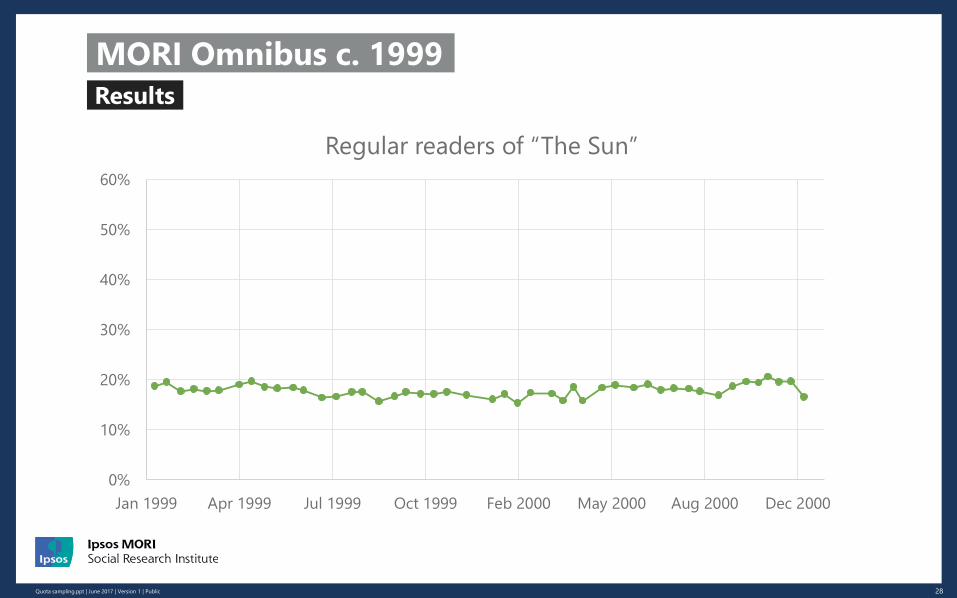
Results
MORI Omnibus c. 1999
0%
10%
20%
30%
40%
50%
60%
Jan 1999 Apr 1999 Jul 1999 Oct 1999 Feb 2000 May 2000 Aug 2000 Dec 2000
Regular readers of “The Sun”

Quota sampling.ppt | June 2017 | Version 1 | Public 29
Finally…
30Quota sampling.ppt | June 2017 | Version 1 | Public
If the difficulty with the random sample is the response rate,
remember that
the theory and justification of correcting for non-response bias in a
probability-sampled survey is
EXACTLY THE SAME
as the theory and justification of quota sampling
There is no statistical proof of either, but empirical experience shows
It is usually possible to infer with reasonable accuracy the
characteristics of those not interviewed from the characteristics of
similar people who were interviewed
The best methodology?
Sample surveys

www.ipsos-mori.com/
Doc Name | Month 2016 | Version 1 | Public | Internal Use Only | Confidential | Strictly Confidential (TO ADJUST)LETE CLASSIFICATION)Quota sampling.ppt | June 2017 | Version 1 | Public 31
Roger Mortimore
020 7347 3218
07976 063533
Thank you
you.