the british cycling economy. ‘gross cycling product’ report
DESCRIPTION
"We believe this is the first-ever attempt to chart the full extent of cycling’s contribution to the British economy. Previous studies have focused on particular sectors such as the bicycle retail trade, but never before has a study been conducted into the true ‘Gross Cycling Product’ (GCP) of UK plc – from bike sales to improved health. "The GCP report was conceived by Sky and British Cycling and has been made a reality through the London School of Economics. We commissioned the report, to act as a stake in the ground, a demonstration of where cycling is right now in the UK, and where it has the potential to go with the right support, delivering benefits that all of us can enjoy".TRANSCRIPT
Supported by:
the britishcyclingeconomy
‘gross cycling Product’ rePort
Designed and produced by Salterbaxter
This publication is printed on material certified by the Forest Stewardship Council (FSC®)
Printed by Pureprint Group in the UK

ABOUT THE AUTHOR
Dr Alexander Grous B.Ec., MBA, MComm, PhD.
Dr Alexander Grous is a productivity and innovation specialist in the Centre of Economic Performance (CEP) at the London School of Economics. He has an interest in sports and sponsorship economics including how corporate participation in sports can foster social, economic and health benefits. Dr Grous has also been engaged in leading research at the CEP in partnership with McKinsey and Company across 5,000 firms in ten countries on how managerial practices affect firm performance. He has considerable research experience in other sectors including digital media, broadcasting, banking and finance and high technology, and continues to advise FTSE 100 organisations and others in these sectors, as well as government. Dr Grous has taught in postgraduate courses within the Department of Management and currently teaches within the LSE’s Executive Programmes. He is the Academic Director for a number of innovation programmes in Europe, and has led advisory teams for digital political campaign strategies. Dr Grous has previously held industry roles internationally, permitting him to provide an applied focus to his research. He is also a keen triathlete and cyclist.
1
‘Gross Cycling Product’ Report | Introduction
Welcome
We believe this is the first-ever attempt to chart the full extent of cycling’s contribution to the British economy. Previous studies have focused on particular sectors such as the bicycle retail trade, but never before has a study been conducted into the true ‘Gross Cycling Product’ (GCP) of UK plc – from bike sales to improved health.
The GCP report was conceived by Sky and British Cycling and has been made a reality through the London School of Economics. We commissioned the report, to act as a stake in the ground, a demonstration of where cycling is right now in the UK, and where it has the potential to go with the right support, delivering benefits that all of us can enjoy.
Since 2008 we have been Principal Partner to British Cycling and we have a deep involvement in the sport that extends from mass participation grassroots events such as Sky Ride through to the professional racers of Team Sky. Together with British Cycling we are working towards a target to get 1m more Britons on their bikes and cycling regularly by 2013. It’s an objective that extends to our own workforce and through them we’re already seeing first-hand the many benefits cycling can deliver to both individuals and a business.
It’s been an exciting journey so far and it’s only going to continue.
Graham McWilliam, Group Director of Corporate Affairs, Sky
2 3
‘Gross Cycling Product’ Report | Introduction ‘Gross Cycling Product’ Report | Introduction
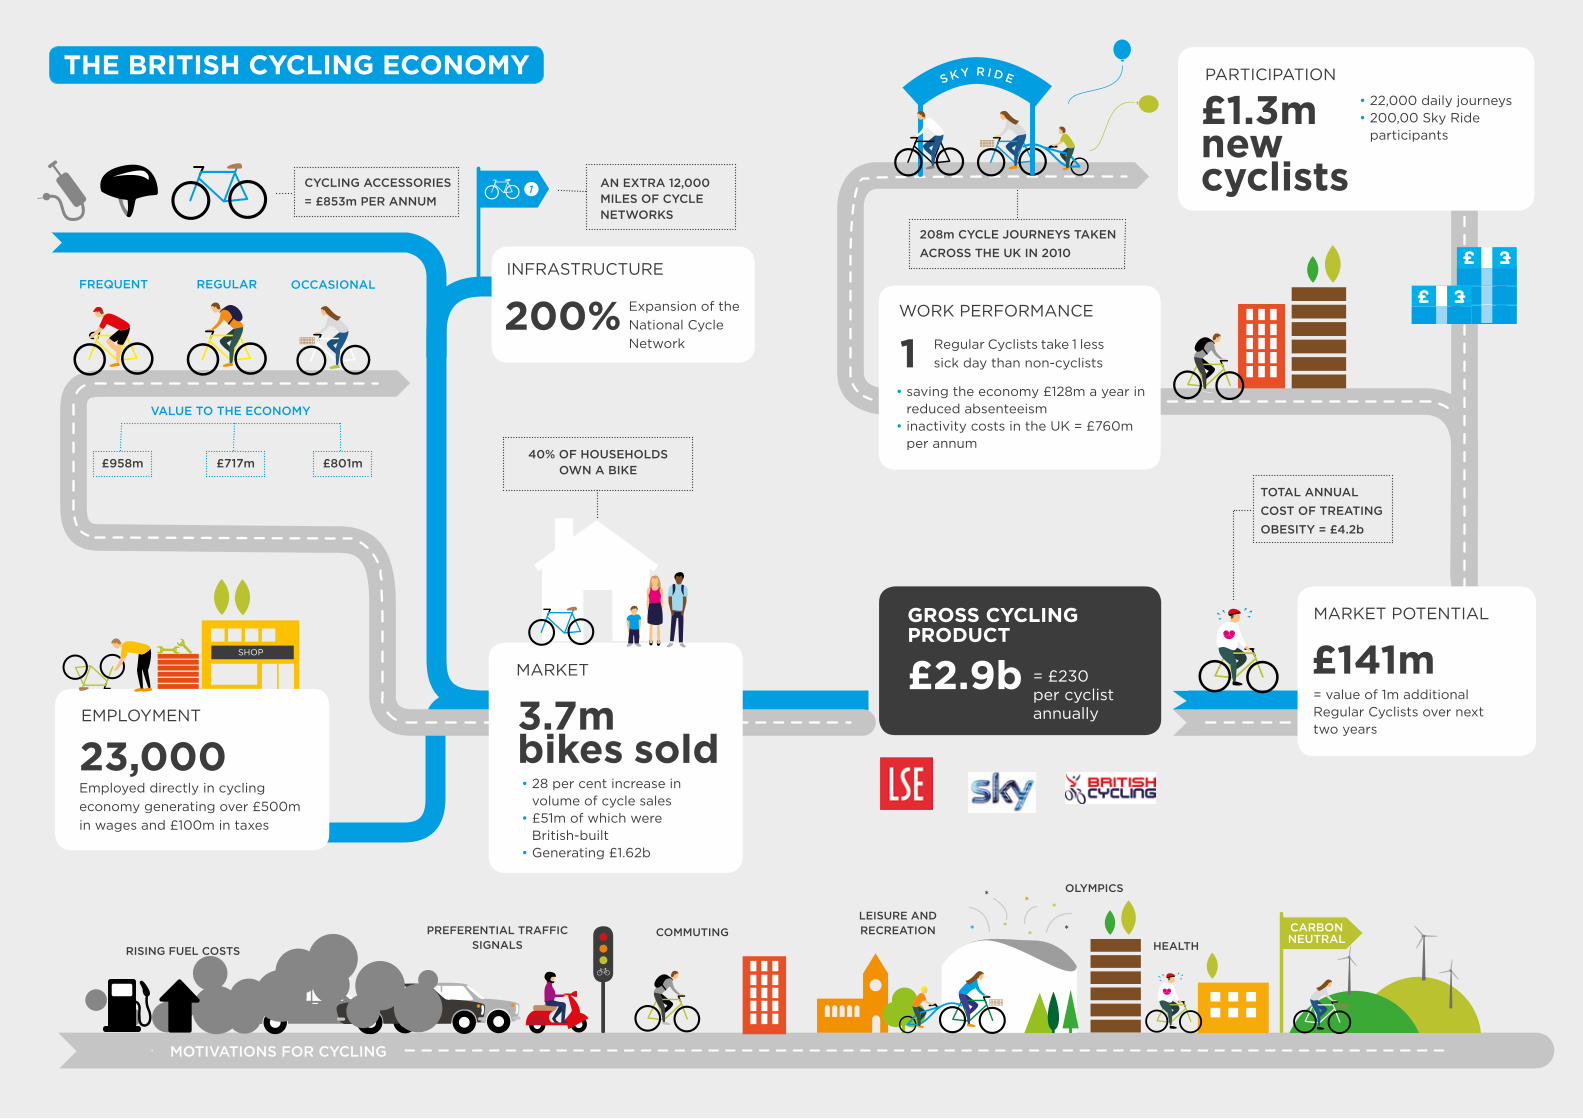
The benefits of cycling are wide, with increased participation bringing broad socio-economic benefits to the UK:
• £2.9b total contribution to UK economy• 28 per cent increase in volume of cycle sales in 2010, generating
£1.62b• £853m further contribution to the UK economy through the
purchase of cycling accessories and bicycle maintenance, resulting in total retail sector sales of £2.47b
• Over £500m generated in wages and £100m in taxes from 23,000 employed directly in bicycle sales, distribution and the maintenance of cycling infrastructure
• Health benefits save the economy £128m per year in absenteeism
Looking forward, projected gains to the UK over the next decade include:
• Frequent and Regular cyclists could further save the economy £2b over a ten-year period in terms of reduced absenteeism
• A 20 per cent increase in current cycling levels by 2015 could save the economy £207m in terms of reduced traffic congestion and £71m in terms of lower pollution levels
• Latent demand for cycling could amount to around £516m of untapped economic potential for the UK
Along with opportunities, there are some potential barriers to a further increase in cycling levels. Unlocking the hesitant cyclist could be the catalyst to wider participation rates:
• Safety, road confidence, self-belief and time available for cycling are all cited as barriers
• There has been an almost doubling of the proportion of children being driven to school over the past 20 years, despite 80 per cent owning bikes
• The proportion of GDP spent on public cycling infrastructure by the UK Government has been lower than government spending in many other countries
Although lagging behind some Northern European countries, the UK is displaying a level of positive activities across the private and public sector that are essential precursors to stimulating both a greater degree of cycling amongst existing cyclists, and in encouraging new riders. Current and supplementary activities designed to enhance participation in cycling across the social strata will result in both tangible and intangible benefits in health, congestion, the economy, and the environment. The dictum ‘On your bike’ is arguably more relevant than ever.
Dr Alexander Grous B.Ec., MBA, MComm, PhD (Author)
Cycling in the UK has undergone a renaissance over the past five years, with an increasing number of people taking to the streets of the UK by bike. Over the years there has also been an array of research into different areas of cycling and its associated benefits but no single overview of the cycling sector and its associated benefits.
This report sets out to define the ‘cycling economy’ lying behind this growth in numbers. Structural, economic, social and health factors have caused a ‘shift in the sand’ in the UK, spurring an expansion in the cycling market with indications that this will be a longer-term trend. This growth in cycling participation has had the knock-on effect of bringing economic and social benefits to the UK. In 2010 the result was a gross cycling contribution to the UK economy of £2.9b.
In addition, this report sets out to quantify the economic benefits generated by each individual cyclist, taking into account factors including bicycle manufacturing, cycle and accessory retail, and employment. In 2010, we determine that the gross cycling product (GCP) reached £230 per cyclist, per annum.
If this trend of growth in cycling participation continues, 1m additional Regular Cyclists could contribute £141m to the UK economy by 2013 whilst concurrently reducing absenteeism and improving the individual’s health, providing an incremental economic benefit.
Over the past 20 years there have been efforts by government and campaign groups to invigorate cycling as a viable alternative travel option, with these efforts being up-weighted in the past decade. The result is that there is considerable evidence of increasing participation in cycling:
• 3.7m bikes sold across the UK in 2010• 208m cycle journeys were made in 20101
• Net addition of 1.3m new cyclists in 2010 of whom 500,000 are Frequent or Regular Cyclists
• 200,000 people took part in Sky Ride events across the UK in 2010 • 22,000 people daily, sharing 5,000 hire bikes through the Barclays
Cycle Hire in London
Investigation shows there are a number of factors which have all played a part in driving this growth, including:
• 200 per cent expansion of the National Cycle Network to over 12,000 miles
• More dedicated cycling lanes in urban and city areas• Environmental concerns, with 83 per cent of people believing that
environmental questions are a priority issue2
• Health considerations, with inactivity costs in the UK estimated to be £760m per annum3 and 80 and 70 per cent of men and women respectively forecast to be overweight or obese
• British successes at elite level act as a motivator, through, for example, Olympic gold medals in Beijing and the prospect of more wins at the upcoming London 2012 Olympics and Paralympics
• Increase in the numbers of large scale organised cycling events across the UK
IntroductIon
£2.9b = £230 per cyclist annually
gross cycling product
208m cycle journeys Taken across The uk in 2010
s k y r i D e
ToTal annual cosT of TreaTing obesiTy = £4.2b
Regular Cyclists take 1 less sick day than non-cyclists
• saving the economy £128m a year in reduced absenteeism
• inactivity costs in the UK = £760m per annum
WORK PERFORMANCE
1
£1.3m new cyclists
• 22,000 daily journeys• 200,00 Sky Ride
participants
PARTICIPATION
= value of 1m additional Regular Cyclists over next two years
MARKET POTENTIAL
£141m
regular
value To The economy
occasionalfrequenT
1 an exTra 12,000 miles of cycle neTworks
3.7m bikes sold • 28 per cent increase in
volume of cycle sales• £51m of which were
British-built• Generating £1.62b
MARKET
40% of householDs own a bike£958m £717m £801m
cycling accessories = £853m per annum
olympics
leisure anD recreaTion
* *
**
*
**healTh
preferenTial Traffic signalsrising fuel cosTs
moTivaTions for cycling
carbon neuTralcommuTing
200% Expansion of the National Cycle Network
INFRASTRUCTURE
23,000Employed directly in cycling economy generating over £500m in wages and £100m in taxes
EMPLOYMENT
the British cycling economy
6 7
‘Gross Cycling Product’ Report | The UK Cycling Market‘Gross Cycling Product’ Report | The UK Cycling Market
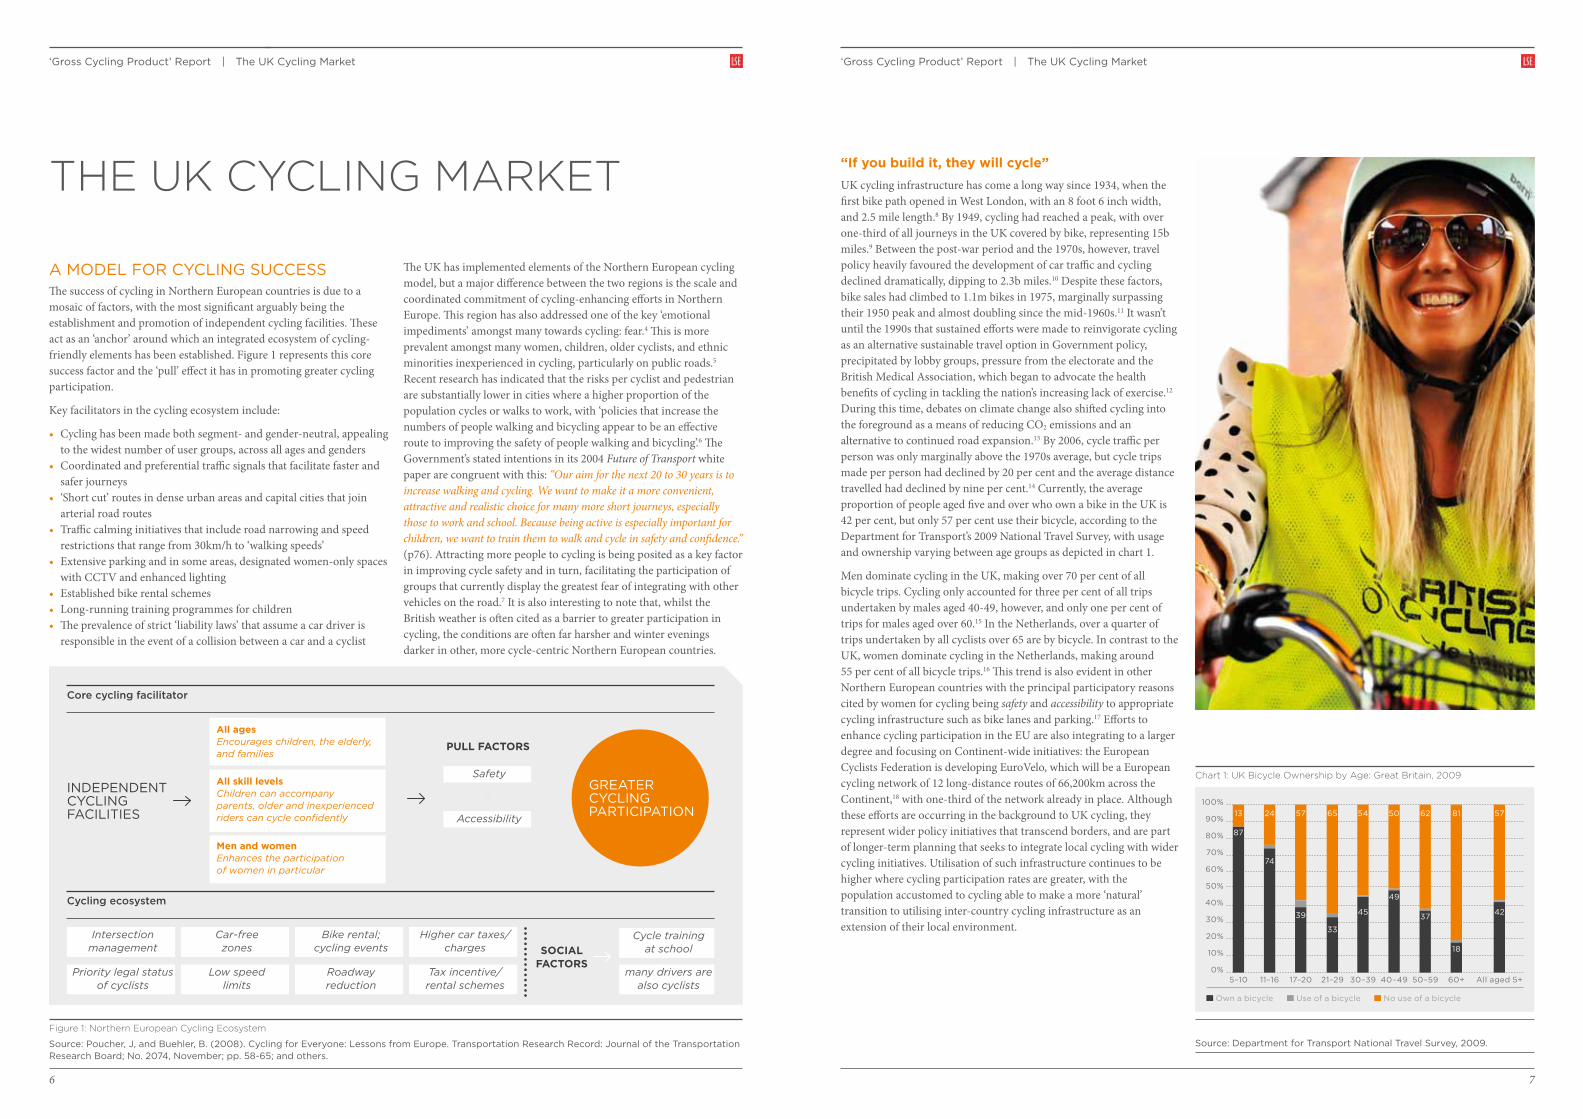
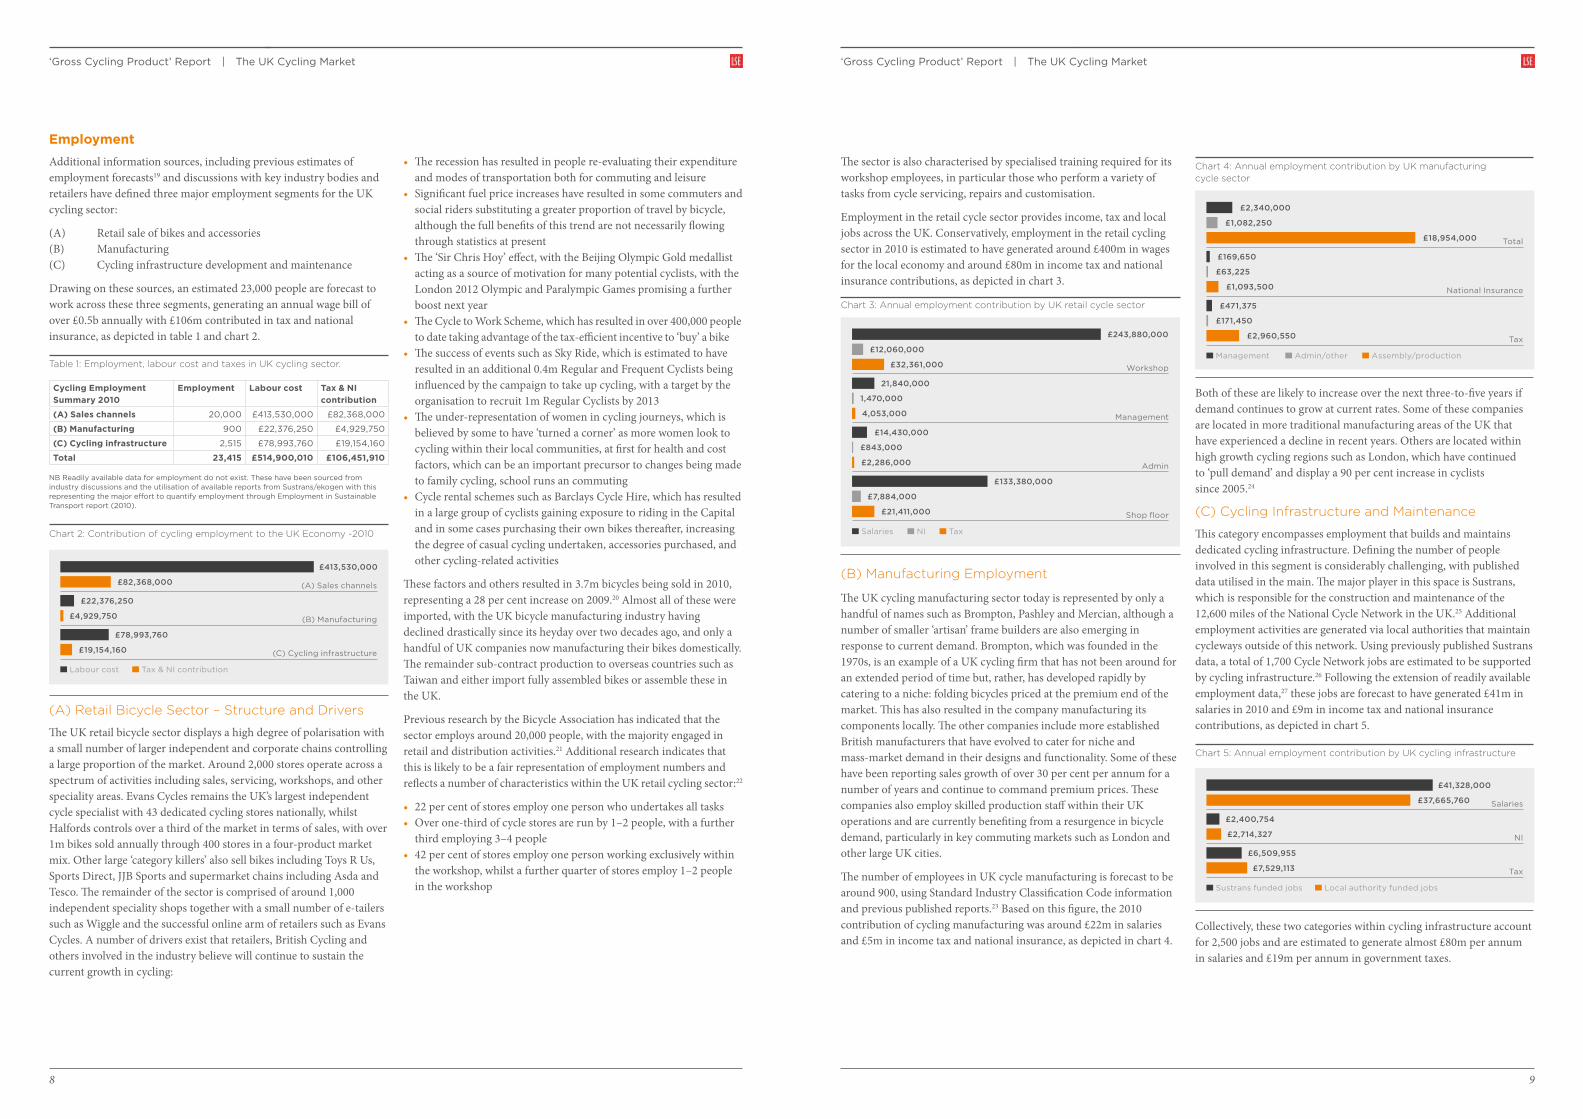
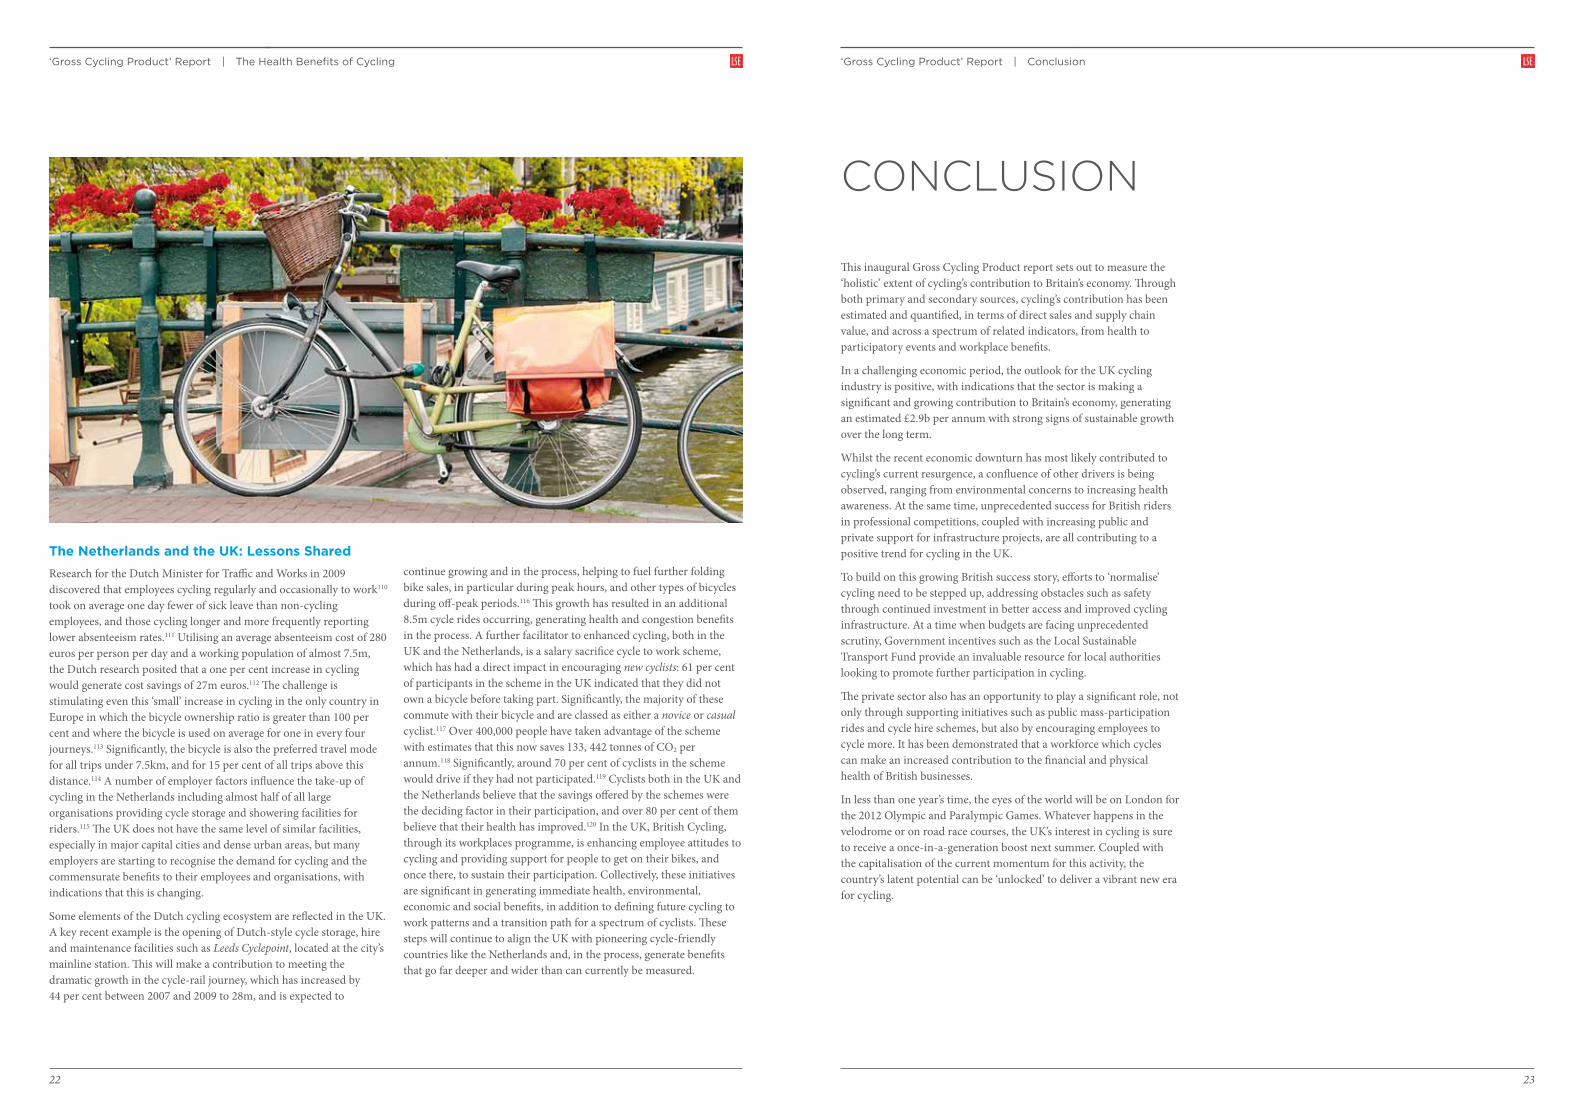
“if you build it, they will cycle”UK cycling infrastructure has come a long way since 1934, when the first bike path opened in West London, with an 8 foot 6 inch width, and 2.5 mile length.8 By 1949, cycling had reached a peak, with over one-third of all journeys in the UK covered by bike, representing 15b miles.9 Between the post-war period and the 1970s, however, travel policy heavily favoured the development of car traffic and cycling declined dramatically, dipping to 2.3b miles.10 Despite these factors, bike sales had climbed to 1.1m bikes in 1975, marginally surpassing their 1950 peak and almost doubling since the mid-1960s.11 It wasn’t until the 1990s that sustained efforts were made to reinvigorate cycling as an alternative sustainable travel option in Government policy, precipitated by lobby groups, pressure from the electorate and the British Medical Association, which began to advocate the health benefits of cycling in tackling the nation’s increasing lack of exercise.12 During this time, debates on climate change also shifted cycling into the foreground as a means of reducing CO2 emissions and an alternative to continued road expansion.13 By 2006, cycle traffic per person was only marginally above the 1970s average, but cycle trips made per person had declined by 20 per cent and the average distance travelled had declined by nine per cent.14 Currently, the average proportion of people aged five and over who own a bike in the UK is 42 per cent, but only 57 per cent use their bicycle, according to the Department for Transport’s 2009 National Travel Survey, with usage and ownership varying between age groups as depicted in chart 1.
Men dominate cycling in the UK, making over 70 per cent of all bicycle trips. Cycling only accounted for three per cent of all trips undertaken by males aged 40-49, however, and only one per cent of trips for males aged over 60.15 In the Netherlands, over a quarter of trips undertaken by all cyclists over 65 are by bicycle. In contrast to the UK, women dominate cycling in the Netherlands, making around 55 per cent of all bicycle trips.16 This trend is also evident in other Northern European countries with the principal participatory reasons cited by women for cycling being safety and accessibility to appropriate cycling infrastructure such as bike lanes and parking.17 Efforts to enhance cycling participation in the EU are also integrating to a larger degree and focusing on Continent-wide initiatives: the European Cyclists Federation is developing EuroVelo, which will be a European cycling network of 12 long-distance routes of 66,200km across the Continent,18 with one-third of the network already in place. Although these efforts are occurring in the background to UK cycling, they represent wider policy initiatives that transcend borders, and are part of longer-term planning that seeks to integrate local cycling with wider cycling initiatives. Utilisation of such infrastructure continues to be higher where cycling participation rates are greater, with the population accustomed to cycling able to make a more ‘natural’ transition to utilising inter-country cycling infrastructure as an extension of their local environment.
chart 1: uK Bicycle ownership by Age: Great Britain, 2009
100%13 24 57 65 54 50 62 81 57
87
74
39
33
45
49
37
18
42
90%
80%
70%
60%
50%
40%
30%
20%
10%
5–10 11–16 17–20 21–29 30–39 40–49 50–59 60+ All aged 5+0%
Own a bicycle Use of a bicycle No use of a bicycle
Source: Department for Transport National Travel Survey, 2009.
A MODEL FOR CYCLING SUCCESSThe success of cycling in Northern European countries is due to a mosaic of factors, with the most significant arguably being the establishment and promotion of independent cycling facilities. These act as an ‘anchor’ around which an integrated ecosystem of cycling-friendly elements has been established. Figure 1 represents this core success factor and the ‘pull’ effect it has in promoting greater cycling participation.
Key facilitators in the cycling ecosystem include:
• Cycling has been made both segment- and gender-neutral, appealing to the widest number of user groups, across all ages and genders
• Coordinated and preferential traffic signals that facilitate faster and safer journeys
• ‘Short cut’ routes in dense urban areas and capital cities that join arterial road routes
• Traffic calming initiatives that include road narrowing and speed restrictions that range from 30km/h to ‘walking speeds’
• Extensive parking and in some areas, designated women-only spaces with CCTV and enhanced lighting
• Established bike rental schemes• Long-running training programmes for children• The prevalence of strict ‘liability laws’ that assume a car driver is
responsible in the event of a collision between a car and a cyclist
The UK has implemented elements of the Northern European cycling model, but a major difference between the two regions is the scale and coordinated commitment of cycling-enhancing efforts in Northern Europe. This region has also addressed one of the key ‘emotional impediments’ amongst many towards cycling: fear.4 This is more prevalent amongst many women, children, older cyclists, and ethnic minorities inexperienced in cycling, particularly on public roads.5 Recent research has indicated that the risks per cyclist and pedestrian are substantially lower in cities where a higher proportion of the population cycles or walks to work, with ‘policies that increase the numbers of people walking and bicycling appear to be an effective route to improving the safety of people walking and bicycling’.6 The Government’s stated intentions in its 2004 Future of Transport white paper are congruent with this: “Our aim for the next 20 to 30 years is to increase walking and cycling. We want to make it a more convenient, attractive and realistic choice for many more short journeys, especially those to work and school. Because being active is especially important for children, we want to train them to walk and cycle in safety and confidence.” (p76). Attracting more people to cycling is being posited as a key factor in improving cycle safety and in turn, facilitating the participation of groups that currently display the greatest fear of integrating with other vehicles on the road.7 It is also interesting to note that, whilst the British weather is often cited as a barrier to greater participation in cycling, the conditions are often far harsher and winter evenings darker in other, more cycle-centric Northern European countries.
core cycling facilitator
cycling ecosystem
INDEPENDENT CYCLING FACILITIES
Safety
Intersection management
Priority legal status of cyclists
Car-free zones
Bike rental; cycling events
Higher car taxes/ charges
Cycle training at school
Low speed limits
Roadway reduction
Tax incentive/ rental schemes
many drivers are also cyclists
Accessibility
All agesEncourages children, the elderly, and families
All skill levelsChildren can accompany parents, older and inexperienced riders can cycle confidently
men and womenEnhances the participation of women in particular
pull fActors
sociAl fActors
+GREATER CYCLING PARTICIPATION
the uK cyclInG mArKet
Figure 1: northern european cycling ecosystem
Source: Poucher, J, and Buehler, B. (2008). Cycling for Everyone: Lessons from Europe. Transportation Research Record: Journal of the Transportation Research Board; No. 2074, November; pp. 58-65; and others.
8 9
‘Gross Cycling Product’ Report | The UK Cycling Market‘Gross Cycling Product’ Report | The UK Cycling Market
The sector is also characterised by specialised training required for its workshop employees, in particular those who perform a variety of tasks from cycle servicing, repairs and customisation.
Employment in the retail cycle sector provides income, tax and local jobs across the UK. Conservatively, employment in the retail cycling sector in 2010 is estimated to have generated around £400m in wages for the local economy and around £80m in income tax and national insurance contributions, as depicted in chart 3.
chart 3: Annual employment contribution by uK retail cycle sector
Workshop
Management
Admin
Shop floor
£243,880,000
£12,060,000
£32,361,000
21,840,000
1,470,000
4,053,000
£14,430,000
£843,000
£2,286,000
£133,380,000
£7,884,000
£21,411,000
Salaries NI Tax
(B) manufacturing employment
The UK cycling manufacturing sector today is represented by only a handful of names such as Brompton, Pashley and Mercian, although a number of smaller ‘artisan’ frame builders are also emerging in response to current demand. Brompton, which was founded in the 1970s, is an example of a UK cycling firm that has not been around for an extended period of time but, rather, has developed rapidly by catering to a niche: folding bicycles priced at the premium end of the market. This has also resulted in the company manufacturing its components locally. The other companies include more established British manufacturers that have evolved to cater for niche and mass-market demand in their designs and functionality. Some of these have been reporting sales growth of over 30 per cent per annum for a number of years and continue to command premium prices. These companies also employ skilled production staff within their UK operations and are currently benefiting from a resurgence in bicycle demand, particularly in key commuting markets such as London and other large UK cities.
The number of employees in UK cycle manufacturing is forecast to be around 900, using Standard Industry Classification Code information and previous published reports.23 Based on this figure, the 2010 contribution of cycling manufacturing was around £22m in salaries and £5m in income tax and national insurance, as depicted in chart 4.
chart 4: Annual employment contribution by uK manufacturing cycle sector
Total
National Insurance
Tax
£2,340,000
£1,082,250
£18,954,000
£169,650
£63,225
£1,093,500
£471,375
£171,450
£2,960,550
Management Admin/other Assembly/production
Both of these are likely to increase over the next three-to-five years if demand continues to grow at current rates. Some of these companies are located in more traditional manufacturing areas of the UK that have experienced a decline in recent years. Others are located within high growth cycling regions such as London, which have continued to ‘pull demand’ and display a 90 per cent increase in cyclists since 2005.24
(c) cycling Infrastructure and maintenance
This category encompasses employment that builds and maintains dedicated cycling infrastructure. Defining the number of people involved in this segment is considerably challenging, with published data utilised in the main. The major player in this space is Sustrans, which is responsible for the construction and maintenance of the 12,600 miles of the National Cycle Network in the UK.25 Additional employment activities are generated via local authorities that maintain cycleways outside of this network. Using previously published Sustrans data, a total of 1,700 Cycle Network jobs are estimated to be supported by cycling infrastructure.26 Following the extension of readily available employment data,27 these jobs are forecast to have generated £41m in salaries in 2010 and £9m in income tax and national insurance contributions, as depicted in chart 5.
chart 5: Annual employment contribution by uK cycling infrastructure
Salaries
Sustrans funded jobs Local authority funded jobs
Tax
NI
£41,328,000
£37,665,760
£2,400,754
£2,714,327
£6,509,955
£7,529,113
Collectively, these two categories within cycling infrastructure account for 2,500 jobs and are estimated to generate almost £80m per annum in salaries and £19m per annum in government taxes.
employmentAdditional information sources, including previous estimates of employment forecasts19 and discussions with key industry bodies and retailers have defined three major employment segments for the UK cycling sector:
(A) Retail sale of bikes and accessories(B) Manufacturing(C) Cycling infrastructure development and maintenance
Drawing on these sources, an estimated 23,000 people are forecast to work across these three segments, generating an annual wage bill of over £0.5b annually with £106m contributed in tax and national insurance, as depicted in table 1 and chart 2.
table 1: employment, labour cost and taxes in uK cycling sector.
cycling employment summary 2010
employment labour cost tax & ni contribution
(A) sales channels 20,000 £413,530,000 £82,368,000
(B) manufacturing 900 £22,376,250 £4,929,750
(c) cycling infrastructure 2,515 £78,993,760 £19,154,160
total 23,415 £514,900,010 £106,451,910
NB Readily available data for employment do not exist. These have been sourced from industry discussions and the utilisation of available reports from Sustrans/ekogen with this representing the major effort to quantify employment through Employment in Sustainable Transport report (2010).
chart 2: contribution of cycling employment to the uK economy -2010
(A) Sales channels
Labour cost Tax & NI contribution
(C) Cycling infrastructure
(B) Manufacturing
£413,530,000
£82,368,000
£22,376,250
£4,929,750
£78,993,760
£19,154,160
(A) retail Bicycle Sector – Structure and drivers
The UK retail bicycle sector displays a high degree of polarisation with a small number of larger independent and corporate chains controlling a large proportion of the market. Around 2,000 stores operate across a spectrum of activities including sales, servicing, workshops, and other speciality areas. Evans Cycles remains the UK’s largest independent cycle specialist with 43 dedicated cycling stores nationally, whilst Halfords controls over a third of the market in terms of sales, with over 1m bikes sold annually through 400 stores in a four-product market mix. Other large ‘category killers’ also sell bikes including Toys R Us, Sports Direct, JJB Sports and supermarket chains including Asda and Tesco. The remainder of the sector is comprised of around 1,000 independent speciality shops together with a small number of e-tailers such as Wiggle and the successful online arm of retailers such as Evans Cycles. A number of drivers exist that retailers, British Cycling and others involved in the industry believe will continue to sustain the current growth in cycling:
• The recession has resulted in people re-evaluating their expenditure and modes of transportation both for commuting and leisure
• Significant fuel price increases have resulted in some commuters and social riders substituting a greater proportion of travel by bicycle, although the full benefits of this trend are not necessarily flowing through statistics at present
• The ‘Sir Chris Hoy’ effect, with the Beijing Olympic Gold medallist acting as a source of motivation for many potential cyclists, with the London 2012 Olympic and Paralympic Games promising a further boost next year
• The Cycle to Work Scheme, which has resulted in over 400,000 people to date taking advantage of the tax-efficient incentive to ‘buy’ a bike
• The success of events such as Sky Ride, which is estimated to have resulted in an additional 0.4m Regular and Frequent Cyclists being influenced by the campaign to take up cycling, with a target by the organisation to recruit 1m Regular Cyclists by 2013
• The under-representation of women in cycling journeys, which is believed by some to have ‘turned a corner’ as more women look to cycling within their local communities, at first for health and cost factors, which can be an important precursor to changes being made to family cycling, school runs an commuting
• Cycle rental schemes such as Barclays Cycle Hire, which has resulted in a large group of cyclists gaining exposure to riding in the Capital and in some cases purchasing their own bikes thereafter, increasing the degree of casual cycling undertaken, accessories purchased, and other cycling-related activities
These factors and others resulted in 3.7m bicycles being sold in 2010, representing a 28 per cent increase on 2009.20 Almost all of these were imported, with the UK bicycle manufacturing industry having declined drastically since its heyday over two decades ago, and only a handful of UK companies now manufacturing their bikes domestically. The remainder sub-contract production to overseas countries such as Taiwan and either import fully assembled bikes or assemble these in the UK.
Previous research by the Bicycle Association has indicated that the sector employs around 20,000 people, with the majority engaged in retail and distribution activities.21 Additional research indicates that this is likely to be a fair representation of employment numbers and reflects a number of characteristics within the UK retail cycling sector:22
• 22 per cent of stores employ one person who undertakes all tasks• Over one-third of cycle stores are run by 1–2 people, with a further
third employing 3–4 people• 42 per cent of stores employ one person working exclusively within
the workshop, whilst a further quarter of stores employ 1–2 people in the workshop
10 11
‘Gross Cycling Product’ Report | The UK Cycling Market‘Gross Cycling Product’ Report | The UK Cycling Market
of the London 2012 Olympic and Paralympic Games, this area requires more attention as an economic driver in terms of jobs, infrastructure and tourism spend.
British Cycling is supporting the annual competitive events growth. Since 2007/08 the number of competitive events has grown by 15%. The growth in events has triggered a significant growth in the number of spectators and participants at major domestic and international events (British Cycling 2011).
Many cycling events also require dedicated facilities and over the past decade or so we have seen investment in more purpose-built venues including closed road circuits in a number of English regions and more indoor velodromes providing high-quality iconic facilities in London, Newport, Glasgow and Manchester. The latter has also recently introduced the world’s first large scale indoor BMX centre.
The high profile of some local cycling events act as drawcards, stimulating the migration of cyclists towards more intensive training and frequent cycling, and in the process, providing a boost to the local economy. One of the most high profile of these organised cyclosportive events is arguably the 130km Etape Caledonia event, with an ascent of 1,949m.35 This attracted 3,535 entrants in 2009, and 4,853 spectators, with 86 per cent of attendees spending a night away from home and 92 per cent indicating that they would return to the local area for a holiday.36 The total expenditure generated locally by this event has been estimated to be £1.8m, with 40 equivalent full time jobs also generated.37 Through this and other UK initiatives covering the spectrum of intensity and size, the transition of new, lapsed and Occasional Cyclists into Regular and Frequent Cyclists can occur and in the process, widen the numbers from which a Commuter and Enthusiast pool can emerge.
the olympic and paralympic legacy effectWhen the UK won the right to host the 2012 Olympic and Paralympic Games, LOCOG committed to a legacy of increased sports participation and inspiring the nation to become more physically active. Evidence from previous Olympics suggests that unless host nations plan and drive forward legacy ambitions for increased participation then the inspiration of the Games and that huge wave of public engagement and consideration to participate soon wanes. As a result, legacy potential is lost and new participation is not sustained.
Many UK stakeholders are involved in ensuring the 2012 Games’ legacy and are expecting to make a lasting difference to participation in their respective sports. The cycling economy is set to benefit considerably, should the Olympics shift attitudes and the sector gear up to capture the new participation that is predicted. It is important that we do so – especially given the fact that, according to legacy evidence from Sydney, cycling was seen as the most popular sport to take up in the wake of the 2000 Olympic and Paralympic Games.38
CYCLING SEGMENTSmajor segments and sub-segmentsUK Cycling can be divided into three major segments that are utilised by British Cycling and some other organisations involved in the sector:39
1. Occasional Cyclist: Cycles infrequently; less than other categories
2. Regular Cyclist: Cycles 12 or more times in the past year
3. Frequent Cyclist: Cycles once per week or more
Around 13m adult cyclists are estimated to exist in the UK, representing 27 per cent of the population.40 Of these, almost 4.3m (33 per cent) are classed as Regular Cyclists, 5.4m (41 per cent) are classed Occasional Cyclists and 3.5m (26 per cent) are classed as Frequent Cyclists.41 A number of sub-segments can also be defined that reside within these:42
1. Family: Parent(s)/carers and a child/children who cycle together
2. Recreational User: Cycles for enjoyment, sightseeing, and light exercise
3. Commuter: Utilises cycling as a principal or additional mode of transport for work
4. Enthusiast: Cycling is a sport or a passion
The proportion of cyclists distributed against each of these sub-segments has been derived following discussions with leading players in cycling in the UK, including British Cycling, and presented in Table 2.43
table 2: cyclist sub-segment distribution – Proportion of cyclists
sub-segment occasional cyclist
regular cyclist frequent cyclist
family 30% 15% 2%
recreational user 70% 37% 5%
commuter – 40% 43%
enthusiast – 8% 50%
Utilising the above segmentation, the 3.7m new bicycles sold in the UK in 2010 can be distributed across the sub-segments:
table 3: cyclist sub-segment distribution – cyclist numbers
sub-segment occasional cyclist
regular cyclist
frequent cyclist
total
family 454,000 181,000 19,000 654,000
recreational user 1,056,000 603,000 49,000 1,711,000
commuter – 362,000 422,000 783,000
enthusiast – 60,000 491,000 550,000
total 1,510,000 1,206,000 981,000 3,700,000
The Frequent Cycling segment is principally comprised of enthusiasts and commuters, who are estimated to account for 93 per cent of new cycles sold within this segment. Research indicates that some Frequent Cyclists choose to utilise commuting to maintain their training or
economy
3.7m BIcycleS SoldIn THE Uk THRoUgHoUT 2010
an estimated contribution from accessories of £853m in 2010, comprised of both ‘hard accessories’ (helmets, pumps, clothing, etc.) and ‘soft accessories’ such as servicing and repairs, from both new and existing cyclists.31
The third major contribution to the UK cycling economy is from cycling employment. A lack of accurate employment data has been highlighted, with the previous section defining the economic contribution from employment, which is estimated to be around £500m in 2010 with £100m generated in taxes and NI contributions, from an employment base of around 23,00032 people in retail sales, manufacturing and cycling infrastructure.33
The three areas of bicycle sales, accessories and cycling employment result in a gross cycling contribution to the UK economy of £2.9b in 2010, and a gross cycling product of £230 per cyclist, across the UK cycling population,34 as depicted in Chart 6.
It is recognised that additional economic contributions may be made to UK cycling by other direct and complementary areas of cycling activity, with the value of this dependent on how widely the cycling ecosystem is defined.
cycling eventsInternational, national and local cycling events have shown a significant growth over the past three years. At the time of preparing this report, there was insufficient information available to quantify the full extent of this growth in economic terms. However, with the recent growth in participation and events coupled with the demand potential
VALUE TO THE UK ECONOMYthe marketThe contribution of cycling to the UK economy can be segmented across three major areas. The first of these is the sale of bicycles. In 2010, 3.7m bikes were sold in the UK, representing a 28 per cent increase over 2009.28 The retail value of these was £1.62b, with only £51m of this accounted for by locally manufactured bikes,29 resulting in an average price per bike of £439. This was lower than an average bike price of £493 in 2009, when prices increased due to shortages of supplies and surging demand, and was 18 per cent higher than average bike prices in 2008.30
The second major contribution to the economy is from the sale of cycling accessories. A lack of reliable data has resulted in primary research being undertaken on the purchasing profiles of new and existing cyclists within segments, and the utilisation of this to define gross accessory spending utilising cyclist numbers. This has resulted in
chart 6: contribution of cycling to the uK economy
£514,900,010
£853,536,390
£1,624,675,000
Employment Accessories Bicycle sales
economy
£2.1b GenerAted From SAleS, SerVIce And AcceSSorIeS1.4b FRoM SALES, 0.7b FRoM SERVICES AnD ACCESSoRIES In THE Uk In 2010.
£ ££ £ £ £ £ £ £ £ £ £
£ £ £ £ £ £ £ £ £ £ £ £ £ £
£ £ £ £
£ £
£ £ £ £ £ £ £ £ £ £
12 13
‘Gross Cycling Product’ Report | The UK Cycling Market‘Gross Cycling Product’ Report | The UK Cycling Market
family and recreational users who often cycle infrequently, or are ‘dormant’ and may not have cycled for some time. Regular Cyclists display a moderately lower aggregate level of accessories than Occasional Cyclists. This group is comprised of a mix of users from across all four sub-segments, but almost two-thirds are family and recreational cyclists. The gross accessory spend masks the higher expenditure of the one-third commuter and enthusiast sub-segments that are also represented. The Frequent Cyclist segment includes cyclists from across the sub-segments and the highest accessory sales, reflecting the higher per transaction value for this segment due to expenditure by commuting cyclists and enthusiasts. The average enthusiast cyclist spends six times more overall than a family cyclist, and eight times more than a recreational cyclist. Policy and other initiatives that succeed in stimulating greater participation in cycling across segments can make an economic, health and social contribution. Although broad social participation in cycling is a more holistic goal, ‘not all sub-segments are created equal’, with some yielding greater economic and other benefits.
1.3mneW cyclIStS In 2010
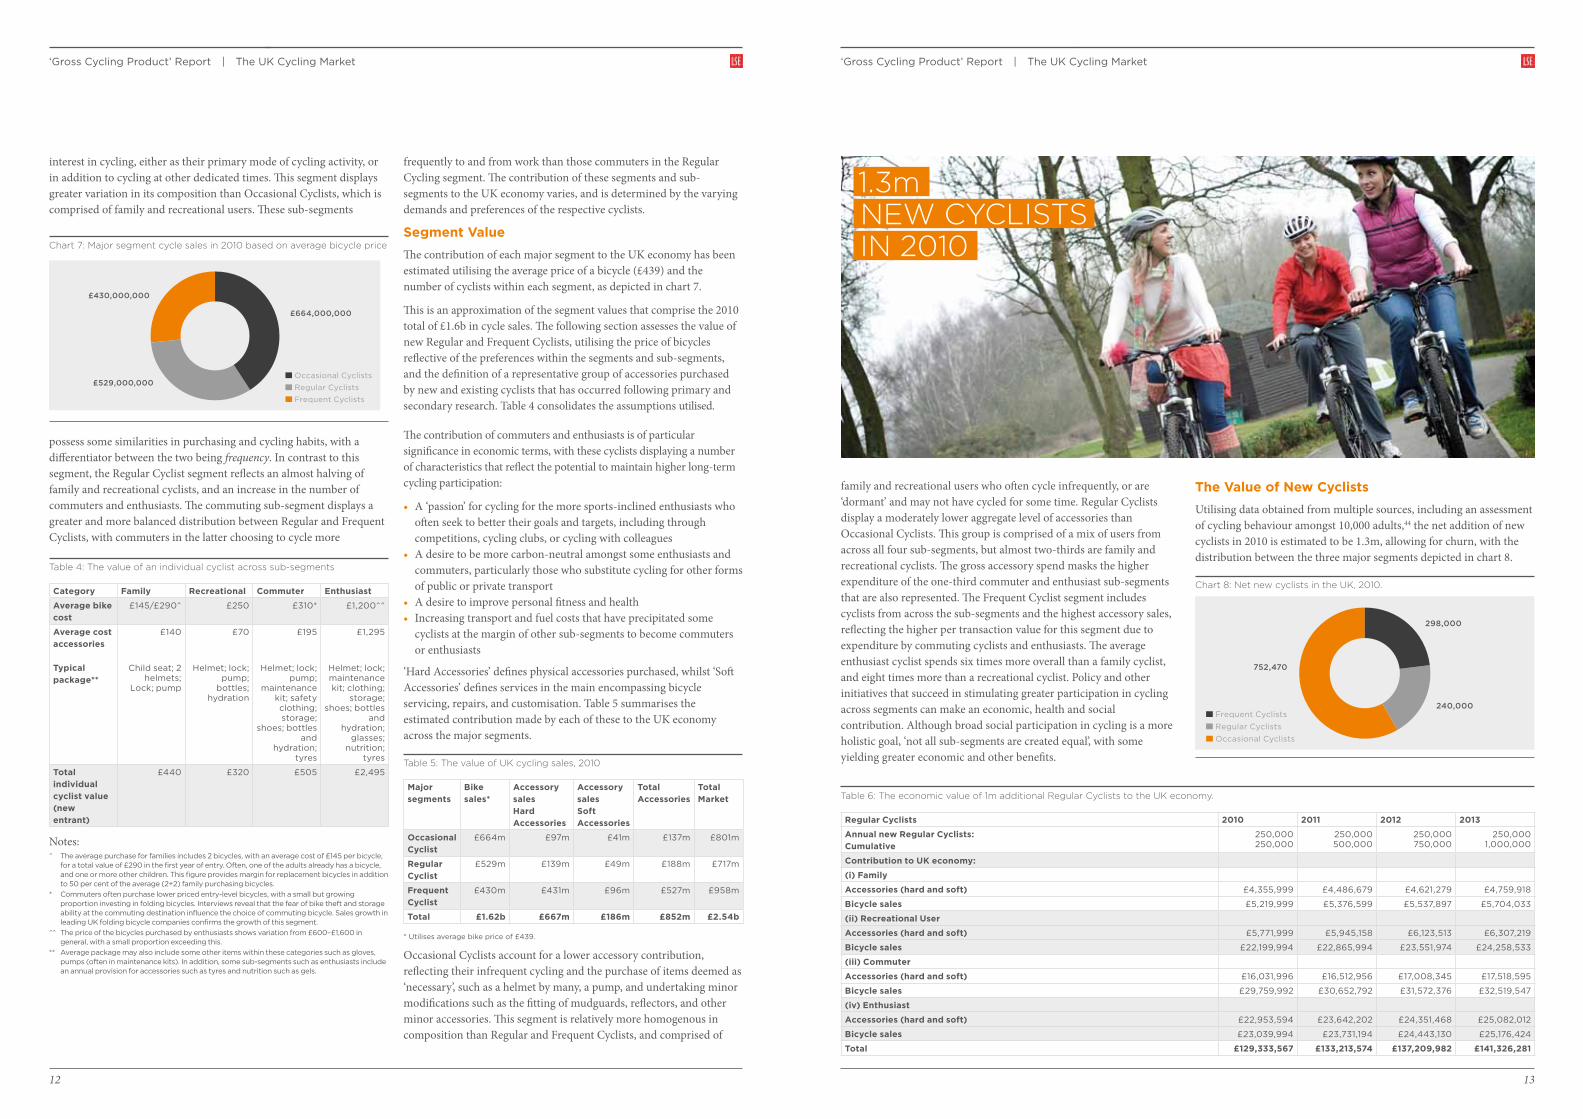
the Value of new cyclistsUtilising data obtained from multiple sources, including an assessment of cycling behaviour amongst 10,000 adults,44 the net addition of new cyclists in 2010 is estimated to be 1.3m, allowing for churn, with the distribution between the three major segments depicted in chart 8.
chart 8: net new cyclists in the uK, 2010.
298,000
240,000
752,470
Frequent CyclistsRegular CyclistsOccasional Cyclists
table 6: the economic value of 1m additional regular cyclists to the uK economy.
regular cyclists 2010 2011 2012 2013
Annual new regular cyclists: cumulative
250,000 250,000
250,000 500,000
250,000 750,000
250,000 1,000,000
contribution to uK economy:
(i) family
Accessories (hard and soft) £4,355,999 £4,486,679 £4,621,279 £4,759,918
Bicycle sales £5,219,999 £5,376,599 £5,537,897 £5,704,033
(ii) recreational user
Accessories (hard and soft) £5,771,999 £5,945,158 £6,123,513 £6,307,219
Bicycle sales £22,199,994 £22,865,994 £23,551,974 £24,258,533
(iii) commuter
Accessories (hard and soft) £16,031,996 £16,512,956 £17,008,345 £17,518,595
Bicycle sales £29,759,992 £30,652,792 £31,572,376 £32,519,547
(iv) enthusiast
Accessories (hard and soft) £22,953,594 £23,642,202 £24,351,468 £25,082,012
Bicycle sales £23,039,994 £23,731,194 £24,443,130 £25,176,424
total £129,333,567 £133,213,574 £137,209,982 £141,326,281
interest in cycling, either as their primary mode of cycling activity, or in addition to cycling at other dedicated times. This segment displays greater variation in its composition than Occasional Cyclists, which is comprised of family and recreational users. These sub-segments
possess some similarities in purchasing and cycling habits, with a differentiator between the two being frequency. In contrast to this segment, the Regular Cyclist segment reflects an almost halving of family and recreational cyclists, and an increase in the number of commuters and enthusiasts. The commuting sub-segment displays a greater and more balanced distribution between Regular and Frequent Cyclists, with commuters in the latter choosing to cycle more
chart 7: major segment cycle sales in 2010 based on average bicycle price
£664,000,000
£529,000,000
£430,000,000
Occasional CyclistsRegular CyclistsFrequent Cyclists
table 4: the value of an individual cyclist across sub-segments
category family recreational commuter enthusiast
Average bike cost
£145/£290^ £250 £310* £1,200^^
Average cost accessories
typical package**
£140
Child seat; 2 helmets;
Lock; pump
£70
Helmet; lock; pump;
bottles; hydration
£195
Helmet; lock; pump;
maintenance kit; safety clothing; storage;
shoes; bottles and
hydration; tyres
£1,295
Helmet; lock; maintenance kit; clothing;
storage; shoes; bottles
and hydration;
glasses; nutrition;
tyres
total individual cyclist value (new entrant)
£440 £320 £505 £2,495
Notes:^ The average purchase for families includes 2 bicycles, with an average cost of £145 per bicycle,
for a total value of £290 in the first year of entry. Often, one of the adults already has a bicycle, and one or more other children. This figure provides margin for replacement bicycles in addition to 50 per cent of the average (2+2) family purchasing bicycles.
* Commuters often purchase lower priced entry-level bicycles, with a small but growing proportion investing in folding bicycles. Interviews reveal that the fear of bike theft and storage ability at the commuting destination influence the choice of commuting bicycle. Sales growth in leading UK folding bicycle companies confirms the growth of this segment.
^^ The price of the bicycles purchased by enthusiasts shows variation from £600–£1,600 in general, with a small proportion exceeding this.
** Average package may also include some other items within these categories such as gloves, pumps (often in maintenance kits). In addition, some sub-segments such as enthusiasts include an annual provision for accessories such as tyres and nutrition such as gels.
frequently to and from work than those commuters in the Regular Cycling segment. The contribution of these segments and sub-segments to the UK economy varies, and is determined by the varying demands and preferences of the respective cyclists.
segment ValueThe contribution of each major segment to the UK economy has been estimated utilising the average price of a bicycle (£439) and the number of cyclists within each segment, as depicted in chart 7.
This is an approximation of the segment values that comprise the 2010 total of £1.6b in cycle sales. The following section assesses the value of new Regular and Frequent Cyclists, utilising the price of bicycles reflective of the preferences within the segments and sub-segments, and the definition of a representative group of accessories purchased by new and existing cyclists that has occurred following primary and secondary research. Table 4 consolidates the assumptions utilised.
The contribution of commuters and enthusiasts is of particular significance in economic terms, with these cyclists displaying a number of characteristics that reflect the potential to maintain higher long-term cycling participation:
• A ‘passion’ for cycling for the more sports-inclined enthusiasts who often seek to better their goals and targets, including through competitions, cycling clubs, or cycling with colleagues
• A desire to be more carbon-neutral amongst some enthusiasts and commuters, particularly those who substitute cycling for other forms of public or private transport
• A desire to improve personal fitness and health• Increasing transport and fuel costs that have precipitated some
cyclists at the margin of other sub-segments to become commuters or enthusiasts
‘Hard Accessories’ defines physical accessories purchased, whilst ‘Soft Accessories’ defines services in the main encompassing bicycle servicing, repairs, and customisation. Table 5 summarises the estimated contribution made by each of these to the UK economy across the major segments.
table 5: the value of uK cycling sales, 2010
major segments
Bike sales*
Accessory saleshard Accessories
Accessory salessoft Accessories
total Accessories
total market
occasional cyclist
£664m £97m £41m £137m £801m
regular cyclist
£529m £139m £49m £188m £717m
frequent cyclist
£430m £431m £96m £527m £958m
total £1.62b £667m £186m £852m £2.54b
* Utilises average bike price of £439.
Occasional Cyclists account for a lower accessory contribution, reflecting their infrequent cycling and the purchase of items deemed as ‘necessary’, such as a helmet by many, a pump, and undertaking minor modifications such as the fitting of mudguards, reflectors, and other minor accessories. This segment is relatively more homogenous in composition than Regular and Frequent Cyclists, and comprised of
14 15
‘Gross Cycling Product’ Report | The UK Cycling Market‘Gross Cycling Product’ Report | The UK Cycling Market
appear to be key stimuli for enhanced cycling participation at the present time, which are believed to be sustainable in the near term. This will continue to bring benefits both to cyclists and the UK economy.
latent demandAnother important factor to consider is that of latent demand. This can be defined as being a desire to get into cycling which consumers have so far been unable to satisfy, typically due to lack of information and/or lack of available funds – untapped economic potential that the cycling industry has the opportunity to unlock. Whilst this factor has not been included in the GCP figure – it is worthwhile considering the extent of this potential.
Sport England’s Active People survey provides a useful barometer. In 2009/2010, this study identified 2,215,700 ‘latent’ cyclists in England – up 6.6 per cent against the original 2007/2008 baseline of 2,078,600.50
Based on a GCP of £230 per cyclist, per year, this latent demand could therefore amount to around £516m of untapped economic potential for the UK.
As discussed elsewhere in this report (see ‘Cycling Segments’), the economic value of new recreational cyclists can be calculated as £320 per capita. New cycle-commuters, on the other hand, are estimated to contribute £505 per head in terms of typical bicycle and accessory purchases. Encouraging all 2,215,700 latent consumers to become recreational cyclists could therefore be worth over £709m to the UK economy. Whilst it is unlikely that all this latent potential can be unlocked in the short term, the scale of the opportunity is clear.
table 7: the economic value of a 1m addition by 2013 of a 50:50: distribution between regular and Frequent cyclists to the uK economy.
regular cyclists 2010 2011 2012 2013
Annual new regular cyclists: Annual new frequent cyclists:
125,000 125,000
125,000 125,000
125,000 125,000
125,000 125,000
cumulative 250,000 500,000 750,000 1,000,000
contribution to uK economy:
(i) family
Accessories (hard and soft) £5,086,098 £4,486,679 £4,621,279 £4,759,918
Bicycle sales £6,084,198 £5,376,599 £5,537,897 £5,704,033
(ii) recreational user
Accessories (hard and soft) £6,762,847 £5,945,158 £6,123,513 £6,307,219
Bicycle sales £25,924,990 £22,865,994 £23,551,974 £24,258,533
(iii) commuter
Accessories (hard and soft) £37,879,837 £16,512,956 £17,008,345 £17,518,595
Bicycle sales £69,483,341 £30,652,792 £31,572,376 £32,519,547
(iv) enthusiast
Accessories (hard and soft) £202,572,860 £23,642,202 £24,351,468 £25,082,012
Bicycle sales £201,839,761 £23,731,194 £24,443,130 £25,176,424
total £555,633,932 £133,213,574 £137,209,982 £141,326,281
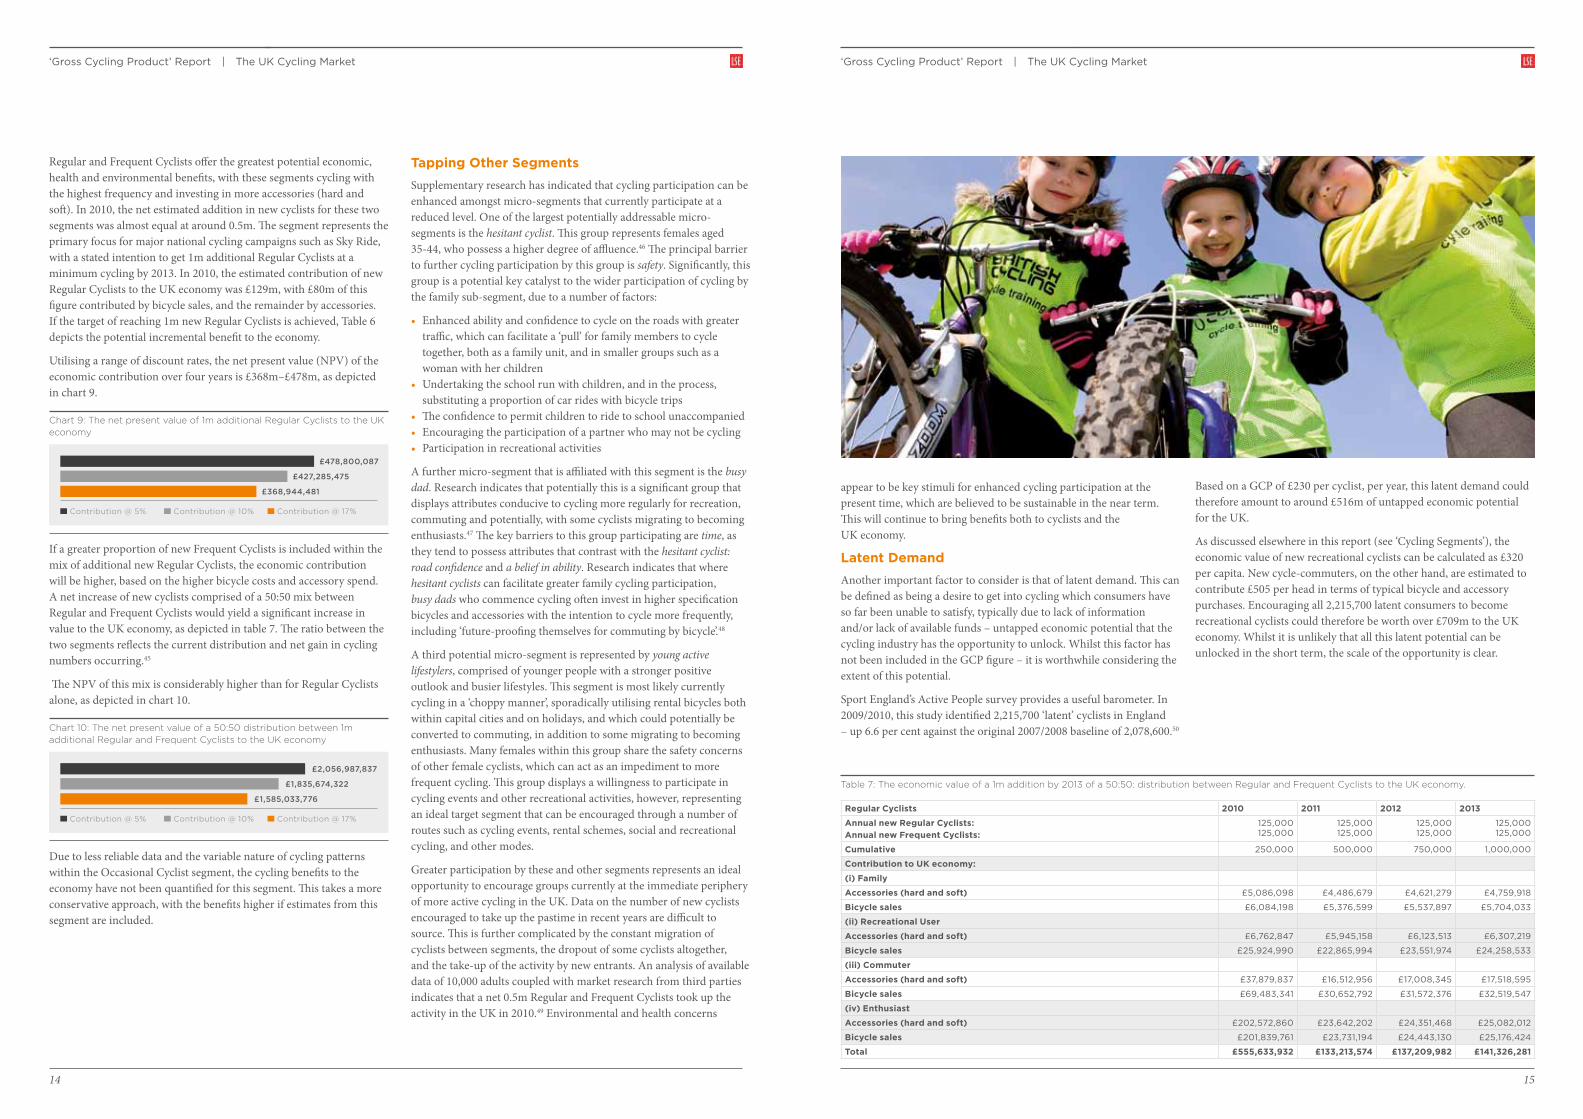
Regular and Frequent Cyclists offer the greatest potential economic, health and environmental benefits, with these segments cycling with the highest frequency and investing in more accessories (hard and soft). In 2010, the net estimated addition in new cyclists for these two segments was almost equal at around 0.5m. The segment represents the primary focus for major national cycling campaigns such as Sky Ride, with a stated intention to get 1m additional Regular Cyclists at a minimum cycling by 2013. In 2010, the estimated contribution of new Regular Cyclists to the UK economy was £129m, with £80m of this figure contributed by bicycle sales, and the remainder by accessories. If the target of reaching 1m new Regular Cyclists is achieved, Table 6 depicts the potential incremental benefit to the economy.
Utilising a range of discount rates, the net present value (NPV) of the economic contribution over four years is £368m–£478m, as depicted in chart 9.
chart 9: the net present value of 1m additional regular cyclists to the uK economy
£478,800,087
£427,285,475
£368,944,481
Contribution @ 5% Contribution @ 10% Contribution @ 17%
If a greater proportion of new Frequent Cyclists is included within the mix of additional new Regular Cyclists, the economic contribution will be higher, based on the higher bicycle costs and accessory spend. A net increase of new cyclists comprised of a 50:50 mix between Regular and Frequent Cyclists would yield a significant increase in value to the UK economy, as depicted in table 7. The ratio between the two segments reflects the current distribution and net gain in cycling numbers occurring.45
The NPV of this mix is considerably higher than for Regular Cyclists alone, as depicted in chart 10.
chart 10: the net present value of a 50:50 distribution between 1m additional regular and Frequent cyclists to the uK economy
£2,056,987,837
£1,835,674,322
£1,585,033,776
Contribution @ 5% Contribution @ 10% Contribution @ 17%
Due to less reliable data and the variable nature of cycling patterns within the Occasional Cyclist segment, the cycling benefits to the economy have not been quantified for this segment. This takes a more conservative approach, with the benefits higher if estimates from this segment are included.
tapping other segmentsSupplementary research has indicated that cycling participation can be enhanced amongst micro-segments that currently participate at a reduced level. One of the largest potentially addressable micro-segments is the hesitant cyclist. This group represents females aged 35-44, who possess a higher degree of affluence.46 The principal barrier to further cycling participation by this group is safety. Significantly, this group is a potential key catalyst to the wider participation of cycling by the family sub-segment, due to a number of factors:
• Enhanced ability and confidence to cycle on the roads with greater traffic, which can facilitate a ‘pull’ for family members to cycle together, both as a family unit, and in smaller groups such as a woman with her children
• Undertaking the school run with children, and in the process, substituting a proportion of car rides with bicycle trips
• The confidence to permit children to ride to school unaccompanied• Encouraging the participation of a partner who may not be cycling • Participation in recreational activities
A further micro-segment that is affiliated with this segment is the busy dad. Research indicates that potentially this is a significant group that displays attributes conducive to cycling more regularly for recreation, commuting and potentially, with some cyclists migrating to becoming enthusiasts.47 The key barriers to this group participating are time, as they tend to possess attributes that contrast with the hesitant cyclist: road confidence and a belief in ability. Research indicates that where hesitant cyclists can facilitate greater family cycling participation, busy dads who commence cycling often invest in higher specification bicycles and accessories with the intention to cycle more frequently, including ‘future-proofing themselves for commuting by bicycle’.48
A third potential micro-segment is represented by young active lifestylers, comprised of younger people with a stronger positive outlook and busier lifestyles. This segment is most likely currently cycling in a ‘choppy manner’, sporadically utilising rental bicycles both within capital cities and on holidays, and which could potentially be converted to commuting, in addition to some migrating to becoming enthusiasts. Many females within this group share the safety concerns of other female cyclists, which can act as an impediment to more frequent cycling. This group displays a willingness to participate in cycling events and other recreational activities, however, representing an ideal target segment that can be encouraged through a number of routes such as cycling events, rental schemes, social and recreational cycling, and other modes.
Greater participation by these and other segments represents an ideal opportunity to encourage groups currently at the immediate periphery of more active cycling in the UK. Data on the number of new cyclists encouraged to take up the pastime in recent years are difficult to source. This is further complicated by the constant migration of cyclists between segments, the dropout of some cyclists altogether, and the take-up of the activity by new entrants. An analysis of available data of 10,000 adults coupled with market research from third parties indicates that a net 0.5m Regular and Frequent Cyclists took up the activity in the UK in 2010.49 Environmental and health concerns
16 17
‘Gross Cycling Product’ Report | The Health Benefits of Cycling‘Gross Cycling Product’ Report | Cycling Investment
RIDING TOWARDS GREATER PRODUCTIVITYhealthy cyclingThe UK leads Europe in the number of sick days taken each year, with 225m days estimated to have been taken in 2010 at a cost of £17b.68 This equates to around £600 per employee per annum, and an average of 7.7 days per person.69 The cost of absence per employee appears to rise in line with the size of the organisation.70 Minor illnesses such as colds and flu are reported by 95 per cent of employees as being the cause of their short-term absence from the workforce. Cycling could be an ideal means of reducing this, with research highlighting its role in the promotion of a healthier individual and workforce: “Cycling to work is associated with less all-cause sickness absence. The more often people cycle to work and the longer the distance travelled, the lower the absenteeism. Mean absenteeism in cyclists is significantly lower than in non-cyclists.”71
the cycling ‘pounds’A scarcity of data exist on the value of cycling as an intervention mode against obesity. In contrast, a plethora of data exist that highlight the health risks of inactivity. The World Health Report (2002) estimates that physical inactivity is responsible for ten per cent of strokes in developed countries, 20 per cent of coronary heart disease, ten per cent of all non-smoker cancer deaths and three per cent of all diseases.72 The ease with which cycling can be incorporated into either a daily commuting or leisure routine reinforces its attraction however, with little debate as to its health benefits. Medical studies have shown that commuter cycling in particular can considerably reduce the risk of
cardiovascular risk,73 premature death,74 obesity,75 and in the process improve the general state of health.76 Of these, obesity has shown the most dramatic growth in recent years, with the UK ‘topping the scales’ with the largest waistlines in Europe, reflected by obesity rates doubling in the past 25 years.77 Nearly one-quarter of adults and around ten per cent of children are now classed as obese, with a further quarter of all children overweight.78 Despite obesity cutting across social strata, it appears to be more prevalent in some socio-demographic pockets, such as amongst children from deprived areas, who are eight per cent more likely to be obese than other children.79 This trend is also evident in the adult population, with over half of women in the lowest income quintile possessing an expanded waistline versus 37 per cent in the highest income quartile.80 Unless interventionist measures occur, obesity is likely to continue being normalised, with Government predictions that by 2025, 40 per cent of Britons will be obese, and by 2050, the UK could be a majority obese society.
A key measure of metabolic activity, the metabolic equivalent intensity level (MET), is a widely utilised measure that denotes the ratio of the body’s work metabolic rate to a standard resting metabolic rate of 1.0.81 Cycling less than 10 mph (16.6 kmh) has a value of 4 METs, indicating that four times as many calories are burned at this level of activity than at a resting state. This speed reflects an average cycling speed prevalent in commuting in cities and more dense urban areas.82 In contrast, more vigorous cycling at 14–15.9 mph has a METs value of 10. Across Europe, on a per capita basis, 187km are cycled annually and 382km walked, with 4 METs and 3.3 METs of energy expended respectively, resulting in an average range of 48–83 calories expended per person
the heAlth BeneFItS oF cyclInG
reGulAr AndFrequentcyclIStScould SAVe the economy£2b oVer the next ten yeArS
WHAT’S WRONG WITH DRIVING?The proportion of GDP spent on public infrastructure by the UK Government has been lower than government spending in many other countries, averaging around 1.5 per cent between 2000–2004 – around half of the investment occurring by governments in Italy and France.51 Despite rail accounting for only six per cent of total passengers in the UK, the sector received a subsidy of around £6.5b, almost equalling road investment, which carries the majority of journeys undertaken in the country.52 In addition, tax revenues from transport eclipse expenditure on transport by £14b, reflecting a net flow out of the sector from receipts.53 Cycling’s proportion of the UK transport budget is less than one per cent, whilst in the City of London, one of the UK’s larger cycling ‘hot spots’, cycling has been apportioned 0.45 per cent of the £135m transport budget, amounting to around £600,000.54 Currently, 10,000–15,000 cyclists commute into the Capital each day, which has increased by 52 per cent since 2007, and is forecast to quadruple by 2025.55 These macro and micro conditions continue to create the ideal milieu for cycling participation to increase across social strata, with significant benefits.
CYCLING: THE ALL-ROUNDERThe return on cycling investment is maximised when existing cyclists utilise it more frequently and new cyclists are stimulated to commence riding. The combination of these two elements can result in health improvements, and a reduction in congestion and pollution. A recent Government report on the return on investment of cycling and walking concluded: “All of the studies in the UK and beyond report economic benefits of walking and cycling interventions which are highly significant, and these average 13:1. For UK interventions, the average figure is higher at 19:1.”56 In addition, in its 2009 review of the costs of transport, the Cabinet Office concluded: “Results suggest that transport policy has the opportunity to contribute to a wide range of objectives. This is supported by emerging evidence on specific schemes, e.g. high benefit cost ratios for cycling interventions.”57 One of cycling’s most significant attributes is its ability to offer multiple benefits, including easing congestion, improving health, and reducing pressure on infrastructure.58 Estimates indicate that a 20 per cent increase in current cycling levels by 2015 can save £107m through the reduction of premature deaths; a £52m reduction in NHS costs; £207m benefits in congestion, and £71m benefits in pollution.59 Despite walking providing some of these benefits, it is usually undertaken for shorter distances, with cycling remaining an ‘all-rounder’ in tackling multiple objectives.
ExPANDING THE BENEFITSA long-running cycling intervention has been the Cycling Demonstration Towns programme that encompassed six towns outside of London. Between 2005–2008, an average increase in cycling of 27 per cent occurred across these, and a doubling of the number of children cycling to school.60 These benefits produced a return of 3:1 on the investment in cycling.61 Other similar interventions including Bike It, Links to School, and The London Cycling Network have been estimated to generate benefit to cost ratios of 1.36, 2.17, and 3.94 respectively.62 The Bike It programme, enabling children to ride to school by bicycle or scooter, reduced the number that had never cycled to school from 73 per cent to 56 per cent.63 These benefits have occurred against a backdrop of increasing road congestion, rising CO2 emissions and physical inactivity, which are estimated to collectively cost the UK £56b a year.64
Continued investment in the National Cycle Network has resulted in expansion to over 12,600 miles of walking and cycling routes. In 2009, the health benefits of cycling and walking routes accessed by schools along the Network produced a benefit to cost ratio of nearly 4:1.65 In addition, information campaigns targeting people to use the Network are estimated to have produced a benefit to cost ratio of 8:1 as more people were persuaded to take up cycling.66 With only 1 in 10 UK bicycle owners Regular Cyclists, initiatives such as these can stimulate greater participation and yield a greater ROI on infrastructure investment.67 Increasingly, a focus on cycling includes wider ‘ROI considerations’ across health, absenteeism, and the economic ramifications of a sedentary lifestyle.
Another notable driver in terms of encouraging investment in cycling infrastructure is the Local Sustainable Transport Fund (LSTF), announced in late 2010 as part of the Government’s Local Transport White Paper, to help build strong local economies and address the urgent challenges of climate change. It reflects the Government’s core objectives of supporting economic growth by improving the links that move goods and people and meeting its commitment to reducing greenhouse gas emissions. Many local authorities are looking towards cycling initiatives to help achieve their objectives of increasing sustainable transport, with a growing interest in the evidence that recreational bike riding is acting as the catalyst for behavioural change and cycling to work patterns. This fund, totalling £560m, is available over the four-year period to 2014–15, represents significant investment from which cycling can benefit (DFT, 2010).
cyclInG InVeStment
18 19
‘Gross Cycling Product’ Report | The Health Benefits of Cycling‘Gross Cycling Product’ Report | The Health Benefits of Cycling
infrastructure
208m cycle journeyS
200% InCREASE BY 2010
table 9: the nPV over ten years of the cost of absenteeism x saved to the uK economy for Frequent cyclists
% of cyclists employed
frequent cyclists
71% cost
year 1 3,500,000 2,476,950 £193,009,091
year 2 3,535,000 2,501,720 £204,686,141
year 3 3,570,350 2,526,737 £206,733,002
year 4 3,606,054 2,552,004 £208,800,332
year 5 3,642,114 2,577,524 £210,888,336
year 6 3,678,535 2,603,299 £212,997,219
year 7 3,715,321 2,629,332 £215,127,191
year 8 3,752,474 2,655,626 £217,278,463
year 9 3,789,998 2,682,182 £219,451,248
year 10 3,827,898 2,709,004 £221,645,760
total £2,110,616,783
nVp @ 5% £1,621,498,165
nVp @ 10% £1,284,015,411
nVp @ 17% £1,043,924,221
Assumptions:Annual growth In cycle numbers: 1%Inflation P.A: 3%
table 8: Forecast increase in costs to uK economy of a conversion of Frequent cyclists to non-cyclists.
proportion of working age adults in the uK* 70.8%
frequent cyclists: – Apply ratio to define total employed cyclists
3,500,000 2,476,950
Absenteeism increase in days if cyclists were non-cyclists (days): Absentee cost/day per person if current cyclists are non-cyclists:
1
£78
total uK cost of absenteeism: £193,009,091
sensitivity analysis:
proportion of working cyclists
Absentee increase if non-cyclists
Total UK absentee cost
70.8% 1.3 £250,911,818
70.8% 1 £193,009,091
70.8% 0.5 £96,504,545
* http://www.statistics.gov.uk/cci/nugget.asp?id=6
Assuming an annual one per cent growth in the net number of Frequent Cyclists and an annual inflation rate of three per cent for the £78 daily cost of absenteeism per person, the net present value (NPV) of cost saved to the economy over ten years from reduced absenteeism is £1.6b using a five per cent discount rate, as depicted in Table 9. Varying discount rates affect the NPV of the savings figure, with three discount rates provided for comparative purposes.
per day.83 These combined forms of active transportation oxidise approximately 5–9lbs of fat per person per annum, which is 2.5–4.5 times the level that occurs in the United States.84 The annual per capita distances cycled and walked are 75km and 355km85 respectively in the UK, lower than the European average, but higher than the 40km and 141km distances observed in the US respectively. Both the calories and fat oxidisation in the UK are lower than the European average, but above the US average of 2lb per person per annum.86 If a figure of 3lbs per annum per capita of fat oxidisation is used as a guide from a combination of cycling and walking in the UK, 186m lbs. of fat are oxidised annually due to utilisation of these two modes of active transport. Cycling’s contribution may be required in increasing frequency in order to counteract the sedentary nature of many 21st century jobs. The National Public Health Report in Sweden87 stated; “The relative importance of physical activity at work has decreased in recent decades with a corresponding increase in the relative importance of leisure time physical activity.” In this milieu, coupled with shrinking leisure time for many, cycling has few equals as the ‘all-rounder’ mode of transport that yields economic, health and environmentally favourable consequences.
counting the moneyThe total annual cost of treating obesity is estimated to be £4.2b per annum.88 This is forecast to more than double by 2050.89 These figures do not include emotional and social ‘costs’ borne by the individual and their families as a result of obesity. They do however encompass the cost of hospitalisation for over 5,000 between 2007–2008 due to obesity related health risks, with this number growing by 577 per cent from just over a decade earlier.90 The Government recently placed 20 per cent of men and 15 per cent of women at an increased health risk due to their expanding waistlines; 14 per cent of men and 17 per cent of women at high risk, and 21 per cent of men and 24 per cent of women at very high risk.91 Many individuals have ‘shot past’ a body mass index of 30, which denotes obesity92 as continued sedentary lifestyles, decreased physical activities in the workplace, altering diets and a lack of physical activities for recreation and commuting all contribute to the obesity trend. Against this backdrop, the car continues to play a significant role in facilitating obesity, with each hour spent driving or as a passenger associated with a six per cent increase in the chance of being obese.93 In contrast, every kilometre walked each day could reduce the risk of obesity by 4.8 per cent.94 The substitution of cycling for some walking trips can accelerate this, but such intervention most often begins with more ‘gentle steps’.
making a startDriving is still the most prevalent means for people to get to work each day, but in the process, is also a contributor to expanding waistlines.95 An ‘antidote’ is the use of physical activity for commuting, with a recent Swedish medical study concluding; “Walking and bicycling to work [are] significantly negatively associated with overweight+obesity and, to some extent, obesity.” 96 A further medical study from the world’s second most obese nation, Australia,97 also obtained similar results and concluded; “Those people physically active in their journey to work were the least likely to be overweight or obese after taking into account leisure-time physical
activity. Cycling, in particular, had a strong inverse association with being obese”.98 Due to the intensity of effort required to cycle, it is recommended as a more effective physical activity in combating obesity than walking.99 Research also indicates that commuter cycling considerably reduces the risk of premature death, with non-cyclists having a 39 per cent higher mortality rate than cyclists.100
The health benefits of cycling are the greatest amongst the segments that cycle the most, but ‘getting started’ is often the most difficult stage. Frequent Cyclists represent the segment, utilising their bicycles once a week or more for commuting, leisure, school-runs, shopping, or other reasons.101 It is estimated that the UK has around 4.3m Regular Cyclists who cycle at least once per month. More active cyclists usually progress through a continuum, commencing with less vigorous cycling and progressing to more active cycling, often characterised by commuting and/or cycling as a sport or as a more committed leisure activity. A key first stage in this process is the recruitment of people to commence cycling, or upgrade their participation. This can occur through a number of modes:
• Utilisation of cycle hire, which brings the benefits of cycling hand-in-hand with convenience
• Accessible infrastructure across built-up, urban and remote areas• Mass-participation events for novice-intermediate cyclists such as
Sky Ride providing an ideal opportunity for a safe, guided and structured experience
• Cycling in locations where the individual cyclist feels safe and confident
get on your Bike and Add the years – not the pounds.The National Travel Survey indicates that six trips per week were made on average in 2009, equating to two hours, and covering 17 miles.102 Utilising the Chartered Institute of Personnel and Development’s Annual Absenteeism Survey Data for 2010, the annual per employee cost due to absenteeism of £600 equates to a daily cost of £78 per employee.103 In one of the few empirical studies on cycling and absenteeism, Hendriksen et al (2010) discovered a statistically significant relationship amongst Dutch cyclists between more regular cycling and absenteeism: Regular Cyclists took 7.4 sick days per annum, compared to 8.7 sick days for non-cyclists.104 They concluded: “Compared with people who cycle a short distance three times a week, people who cycle more often and longer distances are absent on fewer days” (p134). With a lack of comparable data in the UK, if the absentee reduction in the Netherlands was scaled back marginally to one day’s difference between cyclists and non-cyclists and applied to the UK, and assuming that the ratio of cyclists employed reflected the proportion of people employed in the general population, the UK’s Frequent Cyclists could currently be saving the economy £193m in absentee costs. Table 8 below depicts a number of scenarios in absentee day differences between cyclists and non-cyclists.
20 21
‘Gross Cycling Product’ Report | The Health Benefits of Cycling‘Gross Cycling Product’ Report | The Health Benefits of Cycling
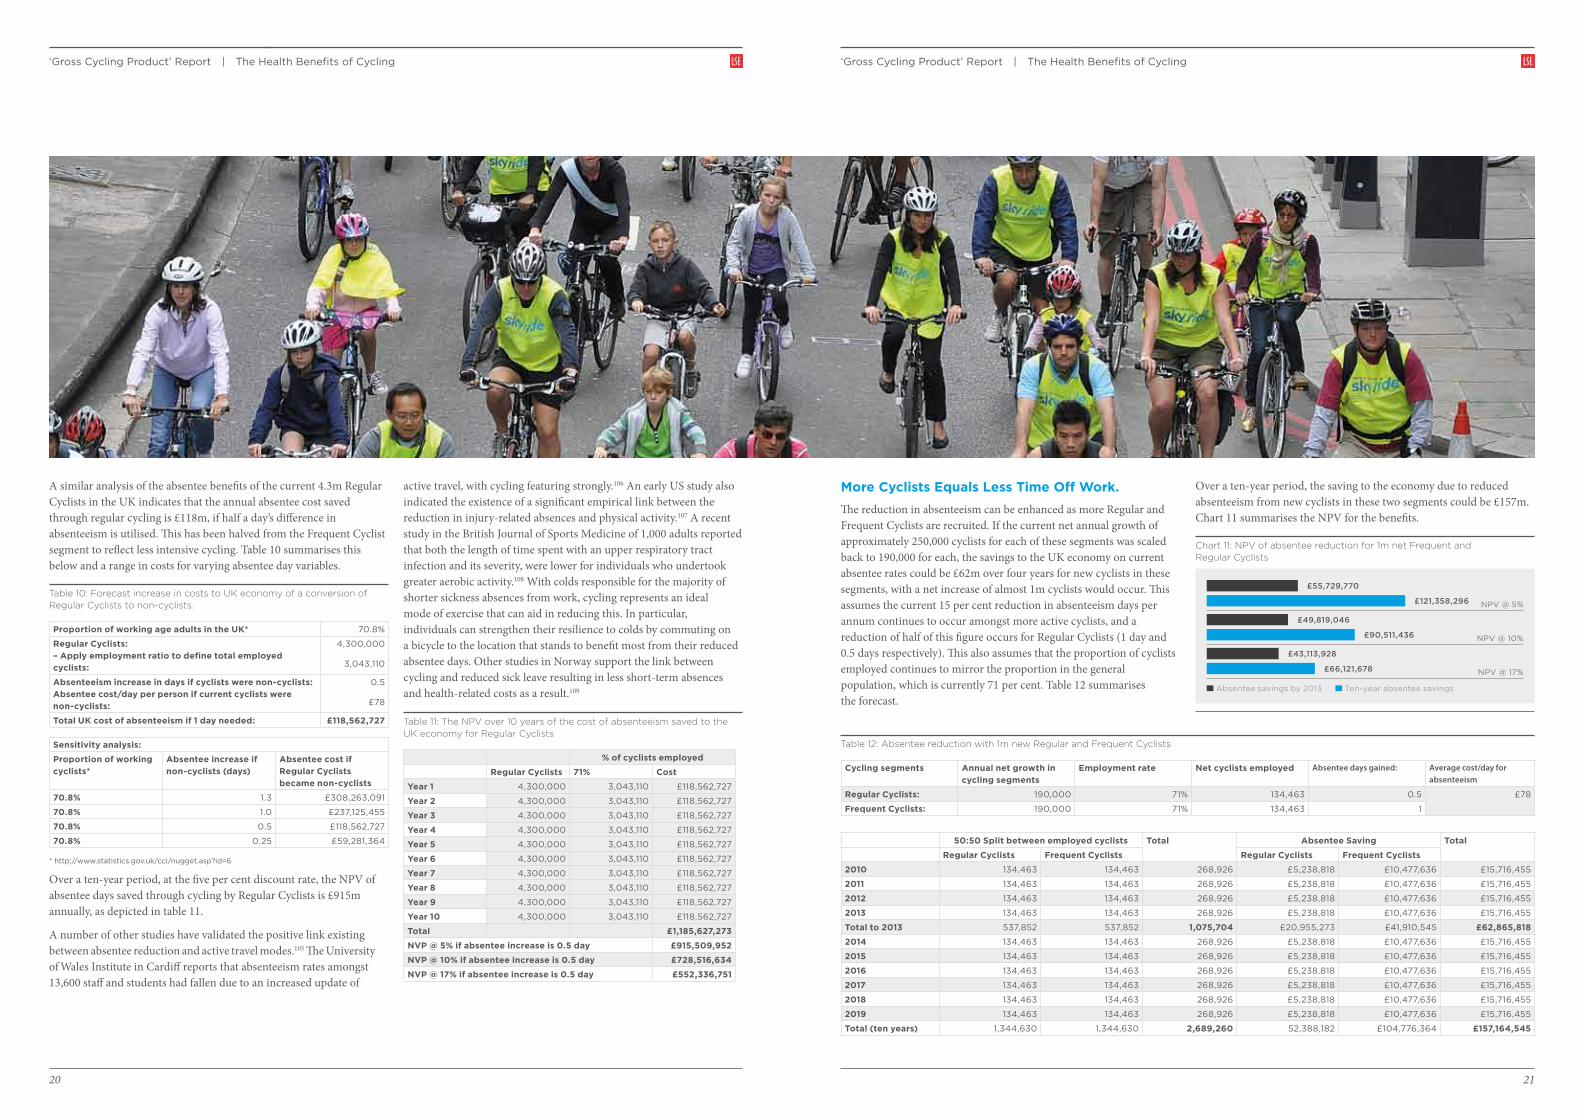
more cyclists equals less time off Work.The reduction in absenteeism can be enhanced as more Regular and Frequent Cyclists are recruited. If the current net annual growth of approximately 250,000 cyclists for each of these segments was scaled back to 190,000 for each, the savings to the UK economy on current absentee rates could be £62m over four years for new cyclists in these segments, with a net increase of almost 1m cyclists would occur. This assumes the current 15 per cent reduction in absenteeism days per annum continues to occur amongst more active cyclists, and a reduction of half of this figure occurs for Regular Cyclists (1 day and 0.5 days respectively). This also assumes that the proportion of cyclists employed continues to mirror the proportion in the general population, which is currently 71 per cent. Table 12 summarises the forecast.
Over a ten-year period, the saving to the economy due to reduced absenteeism from new cyclists in these two segments could be £157m. Chart 11 summarises the NPV for the benefits.
chart 11: nPV of absentee reduction for 1m net Frequent and regular cyclists
NPV @ 5%
Absentee savings by 2013 Ten-year absentee savings
NPV @ 17%
NPV @ 10%
£55,729,770
£121,358,296
£49,819,046
£90,511,436
£43,113,928
£66,121,678
table 12: Absentee reduction with 1m new regular and Frequent cyclists
cycling segments Annual net growth in cycling segments
employment rate net cyclists employed Absentee days gained: Average cost/day for absenteeism
regular cyclists: 190,000 71% 134,463 0.5 £78
frequent cyclists: 190,000 71% 134,463 1
50:50 split between employed cyclists total Absentee saving total
regular cyclists frequent cyclists regular cyclists frequent cyclists
2010 134,463 134,463 268,926 £5,238,818 £10,477,636 £15,716,455
2011 134,463 134,463 268,926 £5,238,818 £10,477,636 £15,716,455
2012 134,463 134,463 268,926 £5,238,818 £10,477,636 £15,716,455
2013 134,463 134,463 268,926 £5,238,818 £10,477,636 £15,716,455
total to 2013 537,852 537,852 1,075,704 £20,955,273 £41,910,545 £62,865,818
2014 134,463 134,463 268,926 £5,238,818 £10,477,636 £15,716,455
2015 134,463 134,463 268,926 £5,238,818 £10,477,636 £15,716,455
2016 134,463 134,463 268,926 £5,238,818 £10,477,636 £15,716,455
2017 134,463 134,463 268,926 £5,238,818 £10,477,636 £15,716,455
2018 134,463 134,463 268,926 £5,238,818 £10,477,636 £15,716,455
2019 134,463 134,463 268,926 £5,238,818 £10,477,636 £15,716,455
total (ten years) 1,344,630 1,344,630 2,689,260 52,388,182 £104,776,364 £157,164,545
A similar analysis of the absentee benefits of the current 4.3m Regular Cyclists in the UK indicates that the annual absentee cost saved through regular cycling is £118m, if half a day’s difference in absenteeism is utilised. This has been halved from the Frequent Cyclist segment to reflect less intensive cycling. Table 10 summarises this below and a range in costs for varying absentee day variables.
table 10: Forecast increase in costs to uK economy of a conversion of regular cyclists to non-cyclists.
proportion of working age adults in the uK* 70.8%
regular cyclists: – Apply employment ratio to define total employed cyclists:
4,300,000
3,043,110
Absenteeism increase in days if cyclists were non-cyclists: Absentee cost/day per person if current cyclists were non-cyclists:
0.5
£78
total uK cost of absenteeism if 1 day needed: £118,562,727
sensitivity analysis:
proportion of working cyclists*
Absentee increase if non-cyclists (days)
Absentee cost if regular cyclists became non-cyclists
70.8% 1.3 £308,263,091
70.8% 1.0 £237,125,455
70.8% 0.5 £118,562,727
70.8% 0.25 £59,281,364
* http://www.statistics.gov.uk/cci/nugget.asp?id=6
Over a ten-year period, at the five per cent discount rate, the NPV of absentee days saved through cycling by Regular Cyclists is £915m annually, as depicted in table 11.
A number of other studies have validated the positive link existing between absentee reduction and active travel modes.105 The University of Wales Institute in Cardiff reports that absenteeism rates amongst 13,600 staff and students had fallen due to an increased update of
table 11: the nPV over 10 years of the cost of absenteeism saved to the uK economy for regular cyclists
% of cyclists employed
regular cyclists 71% cost
year 1 4,300,000 3,043,110 £118,562,727
year 2 4,300,000 3,043,110 £118,562,727
year 3 4,300,000 3,043,110 £118,562,727
year 4 4,300,000 3,043,110 £118,562,727
year 5 4,300,000 3,043,110 £118,562,727
year 6 4,300,000 3,043,110 £118,562,727
year 7 4,300,000 3,043,110 £118,562,727
year 8 4,300,000 3,043,110 £118,562,727
year 9 4,300,000 3,043,110 £118,562,727
year 10 4,300,000 3,043,110 £118,562,727
total £1,185,627,273
nVp @ 5% if absentee increase is 0.5 day £915,509,952
nVp @ 10% if absentee increase is 0.5 day £728,516,634
nVp @ 17% if absentee increase is 0.5 day £552,336,751
active travel, with cycling featuring strongly.106 An early US study also indicated the existence of a significant empirical link between the reduction in injury-related absences and physical activity.107 A recent study in the British Journal of Sports Medicine of 1,000 adults reported that both the length of time spent with an upper respiratory tract infection and its severity, were lower for individuals who undertook greater aerobic activity.108 With colds responsible for the majority of shorter sickness absences from work, cycling represents an ideal mode of exercise that can aid in reducing this. In particular, individuals can strengthen their resilience to colds by commuting on a bicycle to the location that stands to benefit most from their reduced absentee days. Other studies in Norway support the link between cycling and reduced sick leave resulting in less short-term absences and health-related costs as a result.109
22 23
‘Gross Cycling Product’ Report | Conclusion‘Gross Cycling Product’ Report | The Health Benefits of Cycling
concluSIon
This inaugural Gross Cycling Product report sets out to measure the ‘holistic’ extent of cycling’s contribution to Britain’s economy. Through both primary and secondary sources, cycling’s contribution has been estimated and quantified, in terms of direct sales and supply chain value, and across a spectrum of related indicators, from health to participatory events and workplace benefits.
In a challenging economic period, the outlook for the UK cycling industry is positive, with indications that the sector is making a significant and growing contribution to Britain’s economy, generating an estimated £2.9b per annum with strong signs of sustainable growth over the long term.
Whilst the recent economic downturn has most likely contributed to cycling’s current resurgence, a confluence of other drivers is being observed, ranging from environmental concerns to increasing health awareness. At the same time, unprecedented success for British riders in professional competitions, coupled with increasing public and private support for infrastructure projects, are all contributing to a positive trend for cycling in the UK.
To build on this growing British success story, efforts to ‘normalise’ cycling need to be stepped up, addressing obstacles such as safety through continued investment in better access and improved cycling infrastructure. At a time when budgets are facing unprecedented scrutiny, Government incentives such as the Local Sustainable Transport Fund provide an invaluable resource for local authorities looking to promote further participation in cycling.
The private sector also has an opportunity to play a significant role, not only through supporting initiatives such as public mass-participation rides and cycle hire schemes, but also by encouraging employees to cycle more. It has been demonstrated that a workforce which cycles can make an increased contribution to the financial and physical health of British businesses.
In less than one year’s time, the eyes of the world will be on London for the 2012 Olympic and Paralympic Games. Whatever happens in the velodrome or on road race courses, the UK’s interest in cycling is sure to receive a once-in-a-generation boost next summer. Coupled with the capitalisation of the current momentum for this activity, the country’s latent potential can be ‘unlocked’ to deliver a vibrant new era for cycling.
the netherlands and the uK: lessons sharedResearch for the Dutch Minister for Traffic and Works in 2009 discovered that employees cycling regularly and occasionally to work110 took on average one day fewer of sick leave than non-cycling employees, and those cycling longer and more frequently reporting lower absenteeism rates.111 Utilising an average absenteeism cost of 280 euros per person per day and a working population of almost 7.5m, the Dutch research posited that a one per cent increase in cycling would generate cost savings of 27m euros.112 The challenge is stimulating even this ‘small’ increase in cycling in the only country in Europe in which the bicycle ownership ratio is greater than 100 per cent and where the bicycle is used on average for one in every four journeys.113 Significantly, the bicycle is also the preferred travel mode for all trips under 7.5km, and for 15 per cent of all trips above this distance.114 A number of employer factors influence the take-up of cycling in the Netherlands including almost half of all large organisations providing cycle storage and showering facilities for riders.115 The UK does not have the same level of similar facilities, especially in major capital cities and dense urban areas, but many employers are starting to recognise the demand for cycling and the commensurate benefits to their employees and organisations, with indications that this is changing.
Some elements of the Dutch cycling ecosystem are reflected in the UK. A key recent example is the opening of Dutch-style cycle storage, hire and maintenance facilities such as Leeds Cyclepoint, located at the city’s mainline station. This will make a contribution to meeting the dramatic growth in the cycle-rail journey, which has increased by 44 per cent between 2007 and 2009 to 28m, and is expected to
continue growing and in the process, helping to fuel further folding bike sales, in particular during peak hours, and other types of bicycles during off-peak periods.116 This growth has resulted in an additional 8.5m cycle rides occurring, generating health and congestion benefits in the process. A further facilitator to enhanced cycling, both in the UK and the Netherlands, is a salary sacrifice cycle to work scheme, which has had a direct impact in encouraging new cyclists: 61 per cent of participants in the scheme in the UK indicated that they did not own a bicycle before taking part. Significantly, the majority of these commute with their bicycle and are classed as either a novice or casual cyclist.117 Over 400,000 people have taken advantage of the scheme with estimates that this now saves 133, 442 tonnes of CO2 per annum.118 Significantly, around 70 per cent of cyclists in the scheme would drive if they had not participated.119 Cyclists both in the UK and the Netherlands believe that the savings offered by the schemes were the deciding factor in their participation, and over 80 per cent of them believe that their health has improved.120 In the UK, British Cycling, through its workplaces programme, is enhancing employee attitudes to cycling and providing support for people to get on their bikes, and once there, to sustain their participation. Collectively, these initiatives are significant in generating immediate health, environmental, economic and social benefits, in addition to defining future cycling to work patterns and a transition path for a spectrum of cyclists. These steps will continue to align the UK with pioneering cycle-friendly countries like the Netherlands and, in the process, generate benefits that go far deeper and wider than can currently be measured.
24
‘Gross Cycling Product’ Report | Footnotes
1. EC, 1999. The Way Ahead for Towns and Cities.2. http://www.ecf.com/4053_1 3. Poucher, J, and Buehler, B. (2008). Making Cycling Irresistible: Lessons from the
Netherlands, Denmark, and Germany,” Transport Reviews, Vol. 28, No. 4, July; pp.495-528.
4. British Medical Association. (1992). Cycling: Towards Health and Safety. Oxford: Oxford University Press.
5. http://thinkingaboutcycling.wordpress.com/article-fear-of-cycling/ 6. Jacobsen, P. (2003). Safety in Numbers: More Walkers and Bicyclists, Safer Walking and
Bicycling. Injury Prevention. Issue v9; pp: 205-9.7. http://thinkingaboutcycling.wordpress.com/article-fear-of-cycling/8. Sustainable Mobilities Research Group (2011). Cycling Policy in the UK: A historical and
thematic overview.9. Horton, D. (2007). Fear of Cycling. In Horton, D., Rosen, P., and Cox, P. Cycling and
Society. Aldershot: Ashgate; pp. 133-152.10. Ibid.11. http://www.hadland.me.uk/raleigh.htm 12. Hillman, M. (1992). Cycling: Towards Health and Safety. BMA. Oxford University Press.13. Department of the Environment (DOE). (1994). Sustainable Development: The UK
Strategy. Cmnd 2426. London: HMSO.14. http://www.visions2030.org.uk/NPPI6R114521 15. Department for Transport (2009). National Travel Survey.16. Statistics Netherlands (2005)17. LSE interviews.18. http://www.ecf.com/14_1 19. Sustrans/ekogen, (2010). Employment in Sustainable Transport.20. Interviews with industry bodies, retailers and extrapolation of 2009 data.21. Sustrans/ekogen, (2010). Employment in Sustainable Transport.22. Interviews undertaken by the Association of its 900 members, as reported in Sustrans/
ekogen (2009).23. Sustrans/ekogen, (2010). Employment in Sustainable Transport.24. http://eandt.theiet.org/magazine/2010/03/building-bikes.cfm 25. Sustrans/ekogen, op cit., and www.sustrans.org.uk 26. Ibid.27. Additional overhead from Wardens and Area Managers has been factored, and average
salaries and loading added. Differing average salaries and number of employees yield variations in tax and NI.
28. Industry interviews. In 2009, the number of bicycles sold dropped by 10% due to stock shortages and a demand surge that was unanticipated.
29. ONS, Household Final Expenditure 2010; ONS, Division 30 2010, Manufacture of other Transport Equipment.
30. Ibid.31. No reliable data exists on the value of accessory bike sales in the UK. Some categories
of accessories are included in ONS data, but these are often amalgamated with other goods. Accessory sales were established following discussions with industry participants and the definition of categories and spending within these.
32. Sustrans/ekogen (2010), op cit. Industry interviews and analysis using generally available salary and cost data.
33. Multiple sources and industry interviews utilised, that are covered in footnotes in subsequent sections.
34. This is amortised across the 13m UK cyclists.35. http://www.etapecaledonia.co.uk/ 36. http://www.cyclehighlandperthshire.com/media/14111/etape%202009%20report.pdf 37. Ibid.38. Information provided directly by British Cycling.39. 123 Veal, A. J. and K. Toohey (2004) The sporting legacy of the 2000 Sydney Olympic
Games. Presentation to the Australian Society for Sport History Conference: Beyond the Torch: Olympics and the Australian Culture, Canberra, 17-18 April)
40. Sky/GfK research on cycling behaviour amongst 10,000 adults41. Ibid and British Cycling data.42. These sub-segments are utilised by British Cycling and other cycling organisations
including Sky Ride.43. Interviews with British Cycling, retailers, Sky Ride, and other industry participants have
assisted the segmentation defined. This included access to data from 10,000 Sky Ride cyclists, the largest cycling database of its kind that polled actual cyclists participating in national events, drawing a sample from across geographic areas and demographic classes.
44. Policy Exchange, 2008. Towards Better Transport.45. Ibid.46. http://cyclelondoncity.blogspot.com/p/transport-plan-template.html 47. http://lydall.standard.co.uk/2011/02/the-latest-city-perk-secure-bike-parking.html 48. Davis, A. (2010). Value for Money: An Economic Assessment of Investment in Walking
and Cycling. Bristol City Council and NHS Bristol.49. Cabinet Office, 2009. The wider costs of transport in English urban areas in 2009.
London. Strategy Unit.50. Active People, Sport England, 2009-2010.51. SQW Consulting, 2007. Valuing the benefits of cycling. A report to Cycling England.52. Ibid.53. c areas. 54. GfK assessment of cycling behaviour amongst 10,000 adults55. GfK market research assessment of cycling behaviour amongst 10,000 adults; Sky Ride
data, supplied directly.56. GfK data supplied directly, analysing cycling behaviour amongst 10,000 adults, with
additional analysis and extrapolation undertaken to the wider UK addressable cycling market.
57. Ibid.58. Direct research undertaken.59. GfK research, analysing cycling behaviour amongst 10,000 adults60. Cycling England, 2009. Cycling Demonstration Towns Monitoring project report: 2006
to 2009.61. Ibid. 62. Ibid63. Ibid64. Ibid.
65. Sustrans, 2008. TravelSmart information sheet FF36.66. Ibid.67. DfT, 2011. Creating Growth, Cutting Carbon: Making Sustainable Local Transport Happen68. CBI, 2010. On the Path to Recovery: Absence and workplace health survey. 69. Chartered Institute of Personnel and Development. Absence Management Annual
Report, 2010.70. Ibid.71. Hendriksen, I.J., Simons, M., Garre, F, G., Hildebrandtx, V, H. (2010). The association
between commuter cycling and sickness absence. Preventive Medicine; v5; pp:132–135. 72. World Health Organisation (2002). The World Health Report 2002: Reducing risks to
health, promoting healthy life. Geneva.73. Hamer, M., Chida, Y. (2008). Active commuting and cardiovascular risk: a meta-analytic
review. Preventative Medicine. v46; pp: 9–13.74. Matthews, C.E., Jurj, A.L., Shu, x.O., Li, H.L., Yang, G., Li, Q., Gao, Y.T., Zheng, W. (2007).
Influence of exercise, walking, cycling, and overall non- exercise physical activity on mortality in Chinese women. American Journal of Epidemiology. 165; pp: 1343–1350.
75. Wen, L.M., Rissel, C., (2008). Inverse associations between cycling to work, public transport, and overweight and obesity: Findings from a population based study in Australia. Preventative Medicine. v46; pp:29–32.
76. Dill, J. (2009). Bicycling for Transportation and Health: The Role of Infrastructure. Journal of Public Health Policy.v3; S95–S110. doi:10.1057/jphp.2008.56
77. OECD, 2011. Health Data.78. Government Office for Science, 2007. Foresight. Tackling Obesities: Future Choices –
Project Report. 2nd Edition79. Audit Commission, 2010. Giving children a healthy start. Health Report.80. Government Office for Science, 2007. Op cit.81. Ainsworth et al., (2000). Compendium of Physical Activities: an update of activity codes
and MET intensities. Medicine & Science In Sports & Exercise. Compendium Of Physical Activities: Update.
82. Ibid.83. Bassett, R. D.,Pucher, J., Buehler, R., Thompson, D.L., Crouter, S.E. (2008). Walking,
Cycling, and Obesity Rates in Europe, North America, and Australia. Journal of Physical Activity and Health. v5; pp: 795-814.
84. Ibid.85. Ibid. 86. Ibid.87. National Public Health Report, 2005. National Board on Health and Welfare. Stockholm.88. Government Office for Science, 2007. Foresight. Op cit.89. Ibid.90. NHS, 2010. Statistics on obesity, physical activity and diet: England 2010.91. Ibid.92. McCormick, B. (2006). The International Association for the Study of Obesity. Obesity
Reviews; 8 (Suppl. 1); pp: 161–16493. Frank, L.D., Andresen, M.A., Schmid, T.L.(2004). Obesity Relationships with Community
Design, Physical Activity, and Time Spent in Cars American Journal of Preventive Medicine; v27(2); pp:87-96.
94. Ibid.95. Wen, L.M., Orr, N., Millett, C., Rissel, C. (2006). Driving to work and overweight and
obesity: Findings from the 2003 New South Wales Health Survey, Australia. International Journal of Obesity; v30 (5); pp:782–786.
96. Lindström, M. (2008). Means of transportation to work and overweight and obesity: A population-based study in southern Sweden. Preventive Medicine; v46; pp:22–28.
97. OECD Health Data, 2011. Utilised the most recent complete set comparative set which was for 2007.
98. Wen, L., M., and Rissel, M. (2008). Inverse associations between cycling to work, public transport, and overweight and obesity: Findings from a population based study in Australia. Preventive Medicine; v46; pp:29–32.
99. Ibid.100. Andersen, L., et al. (2000). All-cause mortality associated with physical activity during
leisure time, work, sports and cycling to work. Archives of Internal Medicine; v160; pp: 1,621–1,628.
101. British Cycling data; Sky Ride data from 10,000 cyclists provided directly; GfK assessment analysing cycling behaviour amongst 10,000 adults
102. Department for Transport. National Travel Survey, 2009.103. The total absenteeism costs include sick pay, overtime costs for other employees to
cover; replacement labour; administration, and others.104. Hendriksen, J.M.I., Simons, M., Garre, F. G., Hildebrandt, V.H. (2010). The association
between commuter cycling and sickness absence. Preventive Medicine; v51; pp: 132–135.105. SQW, 2007. Valuing the benefits of cycling. A report to Cycling England. 106. http://road.cc/content/news/26728-sustrans-cymru-highlights-reduced-absenteeism-
due-cycling 107. Shore, G., Prasad, P., Zrobak, M. (1989). Metrofit: A cost-effective fitness program.
Fitness in Business; v4; pp: 147–153.108. Nieman, D., Henson, D.A., Austin, M. D., Sha, W. (2010). Upper respiratory tract infection
is reduced in physically fit and active adults, British Journal of Sports Medicine. DOI: 10.1136/bjsm.2010.077875.
109. Sælensminde, K. (2004). Cost–benefit analyses of walking and cycling track networks taking into account insecurity, health effects and external costs of motorized traffic. Transportation Research Part A; v38; pp: 593–606.
110. http://www.tno.nl/downloads/reduced_sickness_absence_kvl_l_09_02_978Em_laag.pdf. Regular was defined as: a minimum distance of 3 km one way at least 3 times a week, or; a minimum distance of 2 km one way at least 4 times a week.
111. Ibid.112. Ibid.113. Ministerie van Verkeer en Watrstaat, 2009. Cycling in the Netherlands.114. Ibid115. Ibid.116. http://www.guardian.co.uk/environment/green-living-blog/2010/jun/17/cycling-rail-atoc 117. http://www.go-travel-solutions.com/news/index.php?cat_id=9&nid=248 118. Ibid and, Ministerie van Verkeer en Watrstaat, op cit. Cycling in the Netherlands.119. Ibid120. Cycle to Work Alliance, 2011. Behavioural Impact Analysis.

ABOUT THE AUTHOR
Dr Alexander Grous B.Ec., MBA, MComm, PhD.
Dr Alexander Grous is a productivity and innovation specialist in the Centre of Economic Performance (CEP) at the London School of Economics. He has an interest in sports and sponsorship economics including how corporate participation in sports can foster social, economic and health benefits. Dr Grous has also been engaged in leading research at the CEP in partnership with McKinsey and Company across 5,000 firms in ten countries on how managerial practices affect firm performance. He has considerable research experience in other sectors including digital media, broadcasting, banking and finance and high technology, and continues to advise FTSE 100 organisations and others in these sectors, as well as government. Dr Grous has taught in postgraduate courses within the Department of Management and currently teaches within the LSE’s Executive Programmes. He is the Academic Director for a number of innovation programmes in Europe, and has led advisory teams for digital political campaign strategies. Dr Grous has previously held industry roles internationally, permitting him to provide an applied focus to his research. He is also a keen triathlete and cyclist.

Supported by:
the britishcyclingeconomy
‘gross cycling Product’ rePort
Designed and produced by Salterbaxter
This publication is printed on material certified by the Forest Stewardship Council (FSC®)
Printed by Pureprint Group in the UK