the benefits of global leadership - annualreports.com benefits of global leadership cb richard ellis...
TRANSCRIPT

the benefits of global leadershipC
B Richard Ellis Group, Inc. 2010 A
nnual Report
the benefits of global leadership 2010 Annual Report
integrated services
market intelligence
local expertise
global reach
financial strength

1
CB Richard Ellis Group, Inc. is the world’s largest commercial real estate services firm.
We offer strategic advice and execution for property sales and leasing; corporate services; property, facilities and project management; mortgage brokerage; appraisal and valuation; development services; investment management; and research and consulting. As the worldwide leader in commercial real estate services, our size and scale provide unsurpassed benefi ts to our clients. Our global network of 400+ offi ces (including affi liates) allows us to provide seamless integrated service across continents. Our scale enables us to continually invest in the most sophisticated technology, research, market intelligence and business practices. Our powerful platform comprises the broadest
array of specialty services and, as a result, a depth of expertise that no other company can match. Our dedication to global leadership attracts the fi nest talent in the commercial real estate services industry. The CB Richard Ellis experience is one of global collaboration, collective excellence, purposeful performance and an unrivaled commitment to best-in-class service. In the following pages, we profi le our clients from London to China, New York to Australia, and demonstrate the ways our local market strength and expertise combine with our global capabilities and infrastructure to provide strategic solutions that defi ne the industry standard.
2
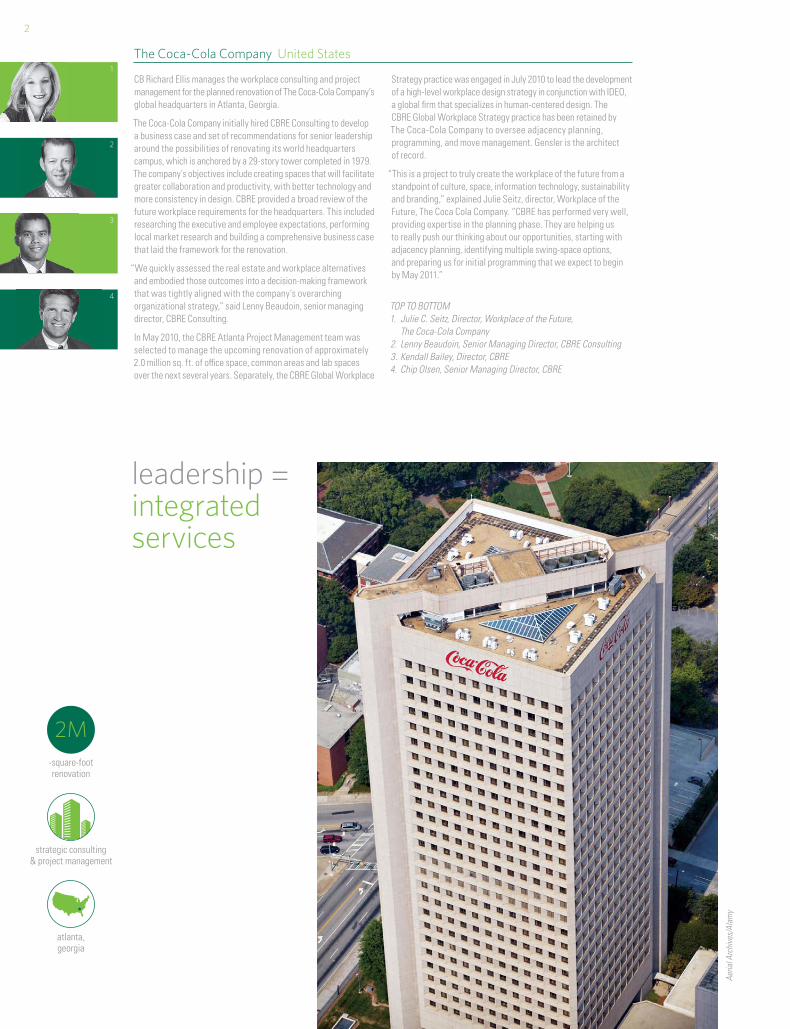
CB Richard Ellis manages the workplace consulting and project management for the planned renovation of The Coca-Cola Company’s global headquarters in Atlanta, Georgia.
The Coca-Cola Company initially hired CBRE Consulting to develop a business case and set of recommendations for senior leadership around the possibilities of renovating its world headquarters campus, which is anchored by a 29-story tower completed in 1979. The company’s objectives include creating spaces that will facilitate greater collaboration and productivity, with better technology and more consistency in design. CBRE provided a broad review of the future workplace requirements for the headquarters. This included researching the executive and employee expectations, performing local market research and building a comprehensive business case that laid the framework for the renovation.
“We quickly assessed the real estate and workplace alternatives and embodied those outcomes into a decision-making framework that was tightly aligned with the company’s overarching organizational strategy,” said Lenny Beaudoin, senior managing director, CBRE Consulting.
In May 2010, the CBRE Atlanta Project Management team was selected to manage the upcoming renovation of approximately 2.0 million sq. ft. of offi ce space, common areas and lab spaces over the next several years. Separately, the CBRE Global Workplace
Strategy practice was engaged in July 2010 to lead the development of a high-level workplace design strategy in conjunction with IDEO, a global fi rm that specializes in human-centered design. The CBRE Global Workplace Strategy practice has been retained by The Coca-Cola Company to oversee adjacency planning, programming, and move management. Gensler is the architect of record.
“This is a project to truly create the workplace of the future from a standpoint of culture, space, information technology, sustainability and branding,” explained Julie Seitz, director, Workplace of the Future, The Coca Cola Company. “CBRE has performed very well, providing expertise in the planning phase. They are helping us to really push our thinking about our opportunities, starting with adjacency planning, identifying multiple swing-space options, and preparing us for initial programming that we expect to begin by May 2011.”
TOP TO BOTTOM1. Julie C. Seitz, Director, Workplace of the Future, The Coca-Cola Company2. Lenny Beaudoin, Senior Managing Director, CBRE Consulting3. Kendall Bailey, Director, CBRE4. Chip Olsen, Senior Managing Director, CBRE
The Coca-Cola Company United States
leadership = integrated services
1
2
atlanta, georgia
strategic consulting & project management
-square-footrenovation
2M
3
4
Aeria
l Arc
hive
s/Al
amy
3
3
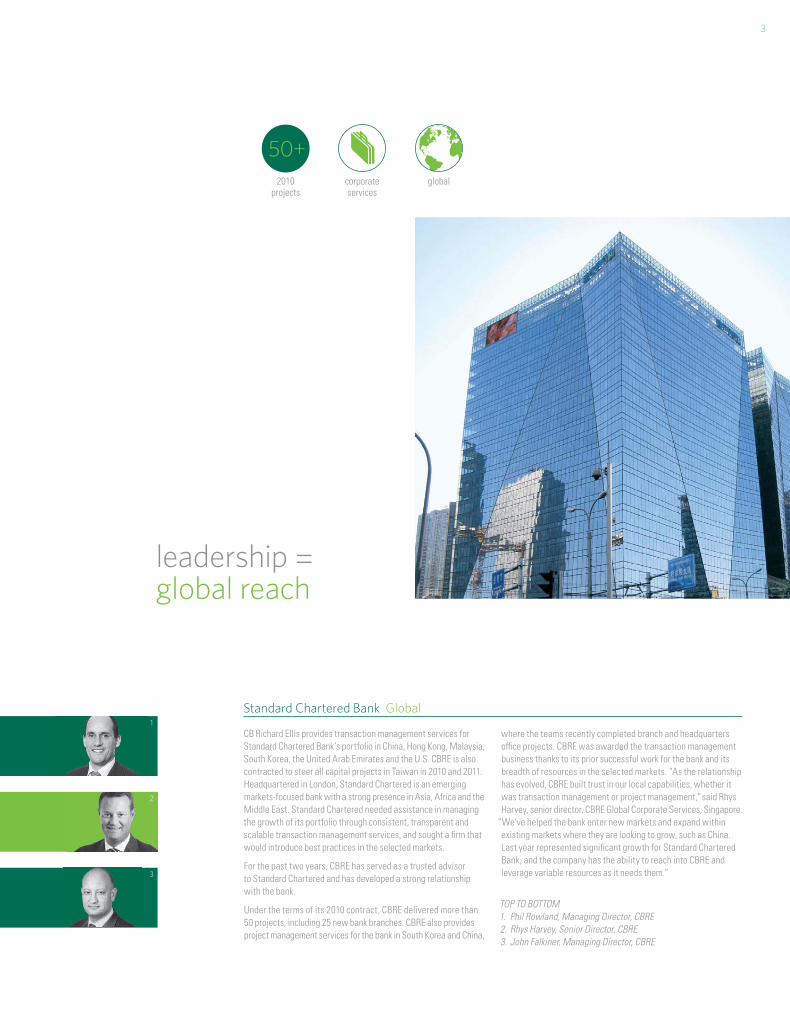
CB Richard Ellis provides transaction management services for Standard Chartered Bank’s portfolio in China, Hong Kong, Malaysia, South Korea, the United Arab Emirates and the U.S. CBRE is also contracted to steer all capital projects in Taiwan in 2010 and 2011. Headquartered in London, Standard Chartered is an emerging markets-focused bank with a strong presence in Asia, Africa and the Middle East. Standard Chartered needed assistance in managing the growth of its portfolio through consistent, transparent and scalable transaction management services, and sought a fi rm that would introduce best practices in the selected markets.
For the past two years, CBRE has served as a trusted advisor to Standard Chartered and has developed a strong relationship with the bank.
Under the terms of its 2010 contract, CBRE delivered more than 50 projects, including 25 new bank branches. CBRE also provides project management services for the bank in South Korea and China,
where the teams recently completed branch and headquarters offi ce projects. CBRE was awarded the transaction management business thanks to its prior successful work for the bank and its breadth of resources in the selected markets. “As the relationship has evolved, CBRE built trust in our local capabilities, whether it was transaction management or project management,” said Rhys Harvey, senior director, CBRE Global Corporate Services, Singapore.
“We’ve helped the bank enter new markets and expand within existing markets where they are looking to grow, such as China. Last year represented signifi cant growth for Standard Chartered Bank, and the company has the ability to reach into CBRE and leverage variable resources as it needs them.”
TOP TO BOTTOM1. Phil Rowland, Managing Director, CBRE2. Rhys Harvey, Senior Director, CBRE3. John Falkiner, Managing Director, CBRE
Standard Chartered Bank Global1
2
2010projects
50+
globalcorporate services
leadership = global reach

4
Two separate CB Richard Ellis teams completed the second-largest lease in New York City in 2010, representing the tenant and landlord in the 410,000-sq.-ft. relocation of law fi rm Proskauer Rose L.L.P.’s global headquarters to Eleven Times Square, a LEED Gold-certifi ed building on Manhattan’s West Side. Proskauer became the anchor tenant, signing a lease for 14 fl oors in the 1.1 million-sq.-ft. glass tower.
SJP Properties’ Eleven Times Square is one of the newest, most technologically advanced and environmentally friendly offi ce towers in New York City. The building offers enhanced fl exibility through its effi cient fl oor plate, reducing occupancy costs while signifi cantly improving effi ciency.
“Experience, expertise and trust are all critical elements that go hand-in-hand in concluding any transaction — especially a negotiation in which CBRE represents all parties,” said Stuart Eisenkraft, CBRE vice chairman. “Without deep, long-standing relationships and high levels of trust developed over several decades with our clients, this deal could not have been completed. We were not focused on brokering a deal, but rather on developing strategies for our clients that best suit them on both operational and fi nancial bases.”
“SJP Properties has enjoyed a long and successful relationship with CB Richard Ellis, and we have come to expect from them the same qualities we demand of ourselves as an organization,” stated Steven J. Pozycki, CEO, SJP Properties. “Just like CBRE, we pride ourselves on our professionalism, high standards of integrity and commitment to excellence. Proskauer’s lease at Eleven Times Square was the culmination of extraordinary teamwork among SJP and CBRE’s agency and tenant teams, which collaborated seamlessly to create a world-class real estate solution for this prestigious law fi rm.”
Arthur Gurwitz, Proskauer Rose chief operating offi cer, said, “As long-term clients of CBRE, we relied again on CBRE for advice, counsel and guidance through a complex and arduous lease process that culminated in our move to our new headquarters at Eleven Times Square. With CBRE’s help, we reaffi rmed our commitment to New York City and created an outstanding environment for us to continue to serve our clients in the Proskauer tradition for decades to come.”
TOP TO BOTTOM1. Allen Fagin, Partner and Past Chair, Proskauer Rose2. Arthur Gurwitz, Chief Operating Officer, Proskauer Rose3. Bruce Lieb, Managing Partner, Proskauer Rose4. Hal Plott, Chief Real Estate and Facilities Offi cer, Proskauer Rose5. Ronald Sernau, Partner and Co-Chair, Real Estate, Proskauer Rose6. Steven J. Pozycki, CEO, SJP Properties7. Stephen Siegel, Chairman of Global Brokerage, CBRE8. Stuart Eisenkraft, Vice Chairman, CBRE and Ramneek Rikhy, Senior Associate, CBRE 9. Michael Geoghegan, Vice Chairman, CBRE and Andrew Sussman, Senior Vice President, CBRE
Proskauer Rose United States
leadership = local expertise
9
7
8
1
2
3
4
5
6
leasing new york, new york
squarefeet
410K

5
leadership = integrated services
Starting in April 2011 in Brisbane, Australia, work crews will begin to transform the 54-acre RNA Showgrounds site — home to agricultural and livestock exhibitions for 134 years — into a vibrant, inner-city residential, commercial and retail mixed-use community, along with a new events arena. This massive urban renewal project, which is the largest brownfi eld development of its kind in Australia, involves a staged construction process over 15 years. This world-class project is the culmination of several years of planning by the Royal National Agricultural and Industrial Association of Queensland (RNA) and CB Richard Ellis, which was appointed lead property and fi nancial advisor and transaction manager for the site’s redevelopment.
The CBRE team worked with the RNA through the deal’s life cycle, from the critical planning stage, to fi nancing and eventually joint-venture partner selection. “The RNA Showgrounds is one of the oldest and most important cultural sites in Brisbane,” said Wayne Redman, CBRE head of the structured transactions team.
“As we progressed with the project we consulted with other CBRE development advisors in Asia and the U.S. about their experiences and challenges.”
The RNA project is a global fi rst in redeveloping an operating showgrounds/event precinct and, according to Wayne Redman,
“is one of the most complex deals executed in Australia by CBRE.”
Along with farming and livestock exhibitions, the RNA Showgrounds is home to hundreds of events a year, including trade shows, major music festivals, conventions, exhibitions and other events. But the old facility had prohibitive maintenance costs, and was losing its competitive positioning. CBRE formulated a plan to release more of the land value by disposing a portion of the site, and negotiated with the Queensland government to provide more development rights. CBRE helped to arrange a loan from the Queensland Treasury Corporation, an arm of the government,
to provide seed funding for the project. CBRE then led the RFP process to procure a major joint-venture partner to act as developer, and made sure the RNA bore minimal risk in the redevelopment program. The international fi rm Lend Lease was chosen as the partner, based on its experience, capability, master plan and commercial offer to the RNA. The plan enables major showground events, such as the annual Royal Queensland Show, to continue operating during the life of the project.
“CBRE and Wayne Redman brought the fi nancial expertise and experience in negotiating on large, complex projects with a signifi cant number of stakeholders,” said Jonathan Tunny, RNA chief executive. The RNA, a not-for-dividend member-based organization, is incorporated under a state act that prohibited it from selling land without government approval. “We needed to sell 13.5 acres to make the deal work, and that’s where CBRE was invaluable. Wayne Redman’s experience communicated credibility to the fi nancial institutions and government agencies involved.”
The fi nished development will contain 3.7 million sq. ft. of mixed-use space. An innovative design of multiple-use exhibition facilities will meet the special requirements of the annual show and a wide range of other events. A focal point of the project is a fresh-food market that will showcase high-quality, RNA-branded products. The project has a completion value of AU$2.9 billion (US$2.9 billion).
TOP TO BOTTOM1. Jonathan Tunny, Chief Executive, The Royal National Agricultural and Industrial Association of Queensland2. Wayne Redman, Regional Director, Structured Transactions & Advisory Services, CBRE3. David Hutton, Group Head of Development, Lend Lease
Royal National Agricultural and Industrial Association of Queensland Australia1
2
3
acres
54
queensland,australia
development advisory, structuring & transaction management

6
In 2010, The Crown Estate sought a partner for its iconic £1.8 billion (US$2.9 billion) Regent Street retail and offi ce portfolio. This is a unique piece of real estate, comprising a street over a mile long from Piccadilly Circus to Langham Place (headquarters of the BBC), and including 113 buildings spread over some 25 blocks in London’s West End. This is the longest street in a single ownership in the world.
The £6.6 billion (US$10.7 billion) Crown Estate belongs to the United Kingdom’s reigning monarch “in right of The Crown,” while the annual surplus of over £220 million (US$356 million) goes to the U.K. taxpayer.
CB Richard Ellis, working with the Crown Estate team, identifi ed suitable potential partners and arranged the purchase of a 25-percent stake by Norges Bank Investment Management, on behalf of the Norwegian Government Pension Fund Global (Norges), for £452 million (US$731.7 million). Norges’ stake will be held through a 150-year lease. The partnership will give Norges a 25-percent share of the properties’ net income, while The Crown Estate will retain 75 percent and maintain responsibility for managing the portfolio.
“CBRE have been advisors to The Crown Estate on Regent Street since its £1 billion (US$1.6 billion) redevelopment and repositioning program got underway in 2002 and have a deep understanding of their requirements. This, combined with a unique global offering, enabled us to identify the right partner and to develop an innovative transaction structure to meet the requirements of The Crown Estate,” said Tony Martin, CBRE senior director. “Jointly with the Crown Estate team we undertook personal presentations around the globe using the CB Richard Ellis network.” As part of the
marketing process, CBRE provided extensive fi nancial modeling for the portfolio, which is driven by approximately 1,000 leases.
Regent Street is one of London’s busiest shopping streets, with retailers including Apple, Burberry, Banana Republic and Hamleys, together with business occupiers such as Generation Investment Management, Och Ziff Management, Heidrick & Struggles and Lloyds Bank. In 2002, The Crown Estate embarked on a major redevelopment plan that has transformed Regent Street into an international destination for business and retail.
“CBRE has, over the last 10 years, delivered standout seamless service across many areas, including planning and development, retail, offi ce and hotel leasing, as well as investment advisory,” said David Shaw, head of Regent Street Portfolio, The Crown Estate.
“The award-winning transformation of Regent Street, which has led to the partnership deal with Norges, is in no small part due to the great collaboration between the CBRE and Crown Estate Regent Street teams.”
TOP TO BOTTOM1. Tony Martin, Senior Director, Real Estate Finance, CBRE2. James Simpson, Director, Real Estate Finance, CBRE3. John Engleheart, Senior Surveyor, Real Estate Finance, CBRE4. James Effi ngham, Director, Building Consultancy Dept., CBRE5. Edward Humbert, Senior Director, Central London Agency, CBRE6. Ian McCarter, Director, Central London Agency, CBRE7. Paul Nunn, Planning Consultant, G & I-Planning, CBRE8. Steven Timbs, Executive Director, Head of Building Consultancy Dept., CBRE
Regent Street /The Crown Estate United Kingdom
leadership = market intelligence
1
5
2
6
3
7
4
8
buildings over 25 blocks
113
london,united kingdom
property sale

7
leadership = integrated services
Oregon Health & Science University (OHSU) completed its Center for Health & Healing in 2006, and the 16-story facility achieved LEED Platinum certifi cation in 2007 — the highest certifi cation level provided by the U.S. Green Building Council. CB Richard Ellis came on board to manage the property seven months before it opened, ensuring OHSU could make the most of its sustainable investment under a new operating model partnering with a professional real estate services company. In 2010, OHSU renewed its agreement with CBRE to provide facilities and project management services and lease administration for the 400,000-sq.-ft. facility.
“The facility’s board of directors is dedicated to an operating model and partnership that provide high customer service and value, depth and strength of service personnel, and industry-leading best practices that align with their business mission,” said Dyann Hamilton, CBRE alliance director. “Their dedication to sustainability is taken to another level by the creation of a sustainable business model through programming synergies — the Center for Health & Healing is literally a vertical village, a one-stop location for their entire mission of healing, teaching and discovery.” The building contains outpatient clinics and a surgery center, a wellness center, research labs, areas for higher education with a large conference center, and retail services.
OHSU’s Center for Health & Healing features its own central utility plan that provides up to 35% of the utilities for the building, as well as an on-site waste treatment plant, eco-roofs, solar thermal water-heating systems, photovoltaic panels, and other unique sustainable technologies. “Our engineering team has really embraced the unique technology opportunities and continues to optimize them,” said Hamilton.
“Our strong performance, disciplined approach, and ability to intersect and deliver best practices and strategic solutions through our platform and industry-leading network of real estate professionals were key elements for the renewal.” As part of its contract renewal, CBRE also planned and presented an eight-year optimization plan for the building.
CBRE received a 95% out of 100% on its 2010 key performance indicator scorecard, which measures customer satisfaction, value delivered, fi nancial performance, strategic innovation, adherence to LEED documentation and regulatory and risk compliance. The facility has received the ENERGY STAR Award for the past three years and The Outstanding Building of the Year Award (TOBY) in the medical offi ce building category from the Building Owners and Managers Association in the 2010 international competition. The TOBY Award was the fi rst international award received for an Oregon facility.
“Partnering with CBRE to ensure a productive and sustainable working environment at The Center for Health & Healing enables us to further enhance focus on our core mission — healing, teaching and discovery,” stated Dr. Neil Swanson, RIMCO, LLC board chair, Oregon Health & Science University.
TOP TO BOTTOM1. Brian Newman, Director of Campus Planning, Development & Real Estate, OHSU2. Matilde Kamiya, Senior Director, CBRE3. Mike Denney, Senior Director, CBRE4. Dyann Hamilton, Alliance Director, CBRE
OHSU United States
1
2
3
4
portland,oregon
squarefeet
400K
facilities and project
management
Jamie Forsythe, GBD Architects

8
When a client of CB Richard Ellis decided to sell 17 bulk distribution hub facilities across the eastern half of the U.S., it turned to CBRE Industrial Group’s National Partners team to market the portfolio. The properties, which comprise 4.4 million sq. ft., were sold to an affi liate of Blackstone Real Estate Advisors (“Blackstone”) for $190 million.
“CB Richard Ellis’ National Industrial team works as a partnership that allows us to coordinate our marketing approach, and help our clients maximize sales proceeds in a timely manner,” said Michael Hines, executive vice president, CBRE Investment Properties.
“We also rely on our local leasing experts, who provide a granular understanding of the competitive landscape so we can get the best possible price for clients.”
For its part, Blackstone needed a swift and effi cient close to the transaction, and engaged a number of CBRE’s service lines to assist. “CBRE provided market intelligence, appraisal services, help in arranging debt fi nancing, and post-close property management, accounting services and leasing,” said Tim Beaudin, CEO of Blackstone’s industrial venture affi liate.
“When you are doing a large transaction in a short time frame, you look for an integrated team with a broad skill set, and CBRE’s ability to coordinate its services is a benefi t to their clients,” said Blackstone Senior Managing Director Frank Cohen. “We trusted that they could help us get to the fi nish line.” Following the closing, Blackstone became a Strategic Account for CBRE, allowing the fi rm to coordinate the delivery of a broad range of services through a single point of contact.
The properties were located in 10 major transportation and distribution hubs, including Harrisburg, PA; Central New Jersey; Atlanta, GA; and Charleston, SC, among others. The portfolio was 98 percent occupied, with an average of more than fi ve years remaining on the lease terms.
TOP TO BOTTOM1. Tim Beaudin, CEO, Blackstone’s industrial venture affi liate2. Frank Cohen, Senior Managing Director, Blackstone3. Steve Bassett, Senior Managing Director, CBRE4. Michael Hines, Executive Vice President, CBRE
The Blackstone Group United States
leadership = integrated services
1
2
purchaseprice
$190M
unitedstates
3
4
property advisory services
9
leadership = market intelligence
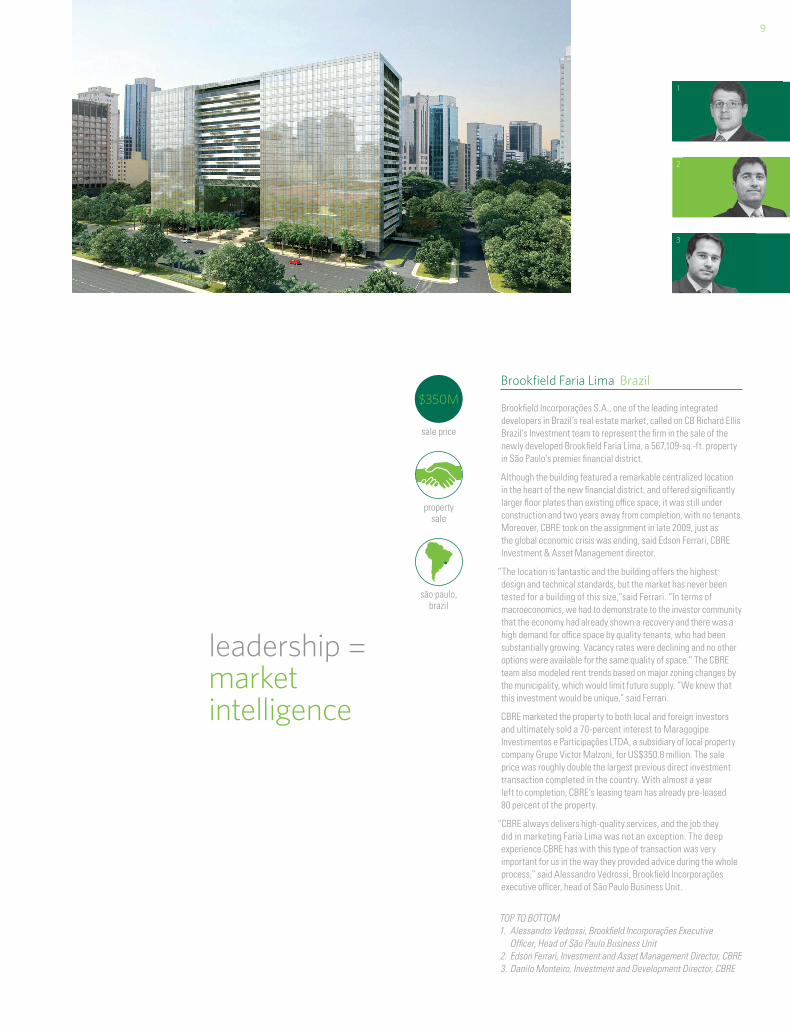
Brookfi eld Incorporações S.A., one of the leading integrated developers in Brazil’s real estate market, called on CB Richard Ellis Brazil’s Investment team to represent the fi rm in the sale of the newly developed Brookfi eld Faria Lima, a 567,109-sq.-ft. property in São Paulo’s premier fi nancial district.
Although the building featured a remarkable centralized location in the heart of the new fi nancial district, and offered signifi cantly larger fl oor plates than existing offi ce space, it was still under construction and two years away from completion, with no tenants. Moreover, CBRE took on the assignment in late 2009, just as the global economic crisis was ending, said Edson Ferrari, CBRE Investment & Asset Management director.
“The location is fantastic and the building offers the highest design and technical standards, but the market has never been tested for a building of this size,”said Ferrari. “In terms of macroeconomics, we had to demonstrate to the investor community that the economy had already shown a recovery and there was a high demand for offi ce space by quality tenants, who had been substantially growing. Vacancy rates were declining and no other options were available for the same quality of space.” The CBRE team also modeled rent trends based on major zoning changes by the municipality, which would limit future supply. “We knew that this investment would be unique,” said Ferrari.
CBRE marketed the property to both local and foreign investors and ultimately sold a 70-percent interest to Maragogipe Investimentos e Participações LTDA, a subsidiary of local property company Grupo Victor Malzoni, for US$350.8 million. The sale price was roughly double the largest previous direct investment transaction completed in the country. With almost a year left to completion, CBRE’s leasing team has already pre-leased 80 percent of the property.
“CBRE always delivers high-quality services, and the job they did in marketing Faria Lima was not an exception. The deep experience CBRE has with this type of transaction was very important for us in the way they provided advice during the whole process,” said Alessandro Vedrossi, Brookfi eld Incorporações executive offi cer, head of São Paulo Business Unit.
TOP TO BOTTOM1. Alessandro Vedrossi, Brookfi eld Incorporações Executive Offi cer, Head of São Paulo Business Unit2. Edson Ferrari, Investment and Asset Management Director, CBRE3. Danilo Monteiro, Investment and Development Director, CBRE
Brookfi eld Faria Lima Brazil
1
3
2
propertysale
são paulo,brazil
sale price
$350M

10
CB Richard Ellis serves as real estate advisor to German investment company Deka Immobilien Investment GmbH on investment strategy, property management and leasing on a global basis, a relationship that dates back to 1993. Last year, CBRE advised Deka on the acquisition and disposition of assets across the United Kingdom, Europe and Asia Pacifi c, with a total value of €650 million (US$909.5 million).
On the investment side, CBRE advised Deka on its acquisition of 14 Pier Walk in Greenwich and on its disposal of 9 South Street in Mayfair, as well as St. James House in St. James’s. All three properties are in London. CBRE also advised Deka on the sale of Die 116, a retail property in Vienna, and the purchase of South Wharf Tower in Melbourne, Australia.
In North America in 2009 and 2010, Deka acquired Bentall V, 550 Burrard Street, a 583,000-sq.-ft. premier offi ce tower in Vancouver, British Columbia; followed by 1999 K Street in Washington, DC, a newly constructed, LEED Gold-certifi ed, Helmut Jahn-designed offi ce building; and 19 West 44th Street in Midtown Manhattan. CBRE continues to act as advisor as Deka builds its global portfolio.
“For us, CBRE is the most important player on a global basis,” said Deka’s Thomas Schmengler, board member and head of acquisitions. “We need CBRE because they are worldwide and we have ambitions to grow our business on a worldwide basis.”
In addition, CBRE serves as property manager for Deka-owned assets across multiple markets in Europe. In Austria, CBRE serves as preferred partner providing all property management
services for a 12-property portfolio totaling 167,000 sq. m., including four prime offi ce and retail properties in Vienna. In France, CBRE manages 15 offi ce, retail and logistics buildings — half of Deka’s entire portfolio in that country — which cover a total of around 230,000 sq. m. located in and around Paris. In the U.K., CBRE manages six offi ce, retail and logistics buildings — half of Deka’s entire portfolio in the U.K. As real estate advisor in Belgium, CBRE was tapped to lease the Boréal building at 55 rue du Progrès in Brussels. Backed by CBRE's agency, owner representation and offi ce services groups, the team arranged a nine-year lease with BNP Paribas Fortis to occupy the Boréal building beginning in 2011. In Australia, CBRE manages all four Deka-owned assets — M4 Greystanes Industrial Park, NSW; 15 William Street, Melbourne; ATO Northbridge, Perth; and South Wharf Tower, Melbourne — in total, comprising 122,076 sq. m.
“Through our worldwide platform and network of offi ces, we provide Deka with the opportunities they need to grow their business by acquiring assets and exiting at the right time,” said Simon Barrowcliff, CBRE executive director. “Our task is to understand their motivation and the different return criteria for their funds, and ensure we effi ciently target and execute transactions for the client, as well as coordinate leasing and management services.”
TOP TO BOTTOM1. Thomas Schmengler, Managing Director, Deka2. Simon Barrowcliff, Executive Director, CBRE3. Rick Butler, Senior Managing Director, CBRE
Deka Immobilien Global
leadership = global reach
1
2
3
properties managed
global
investment advisory
49
11
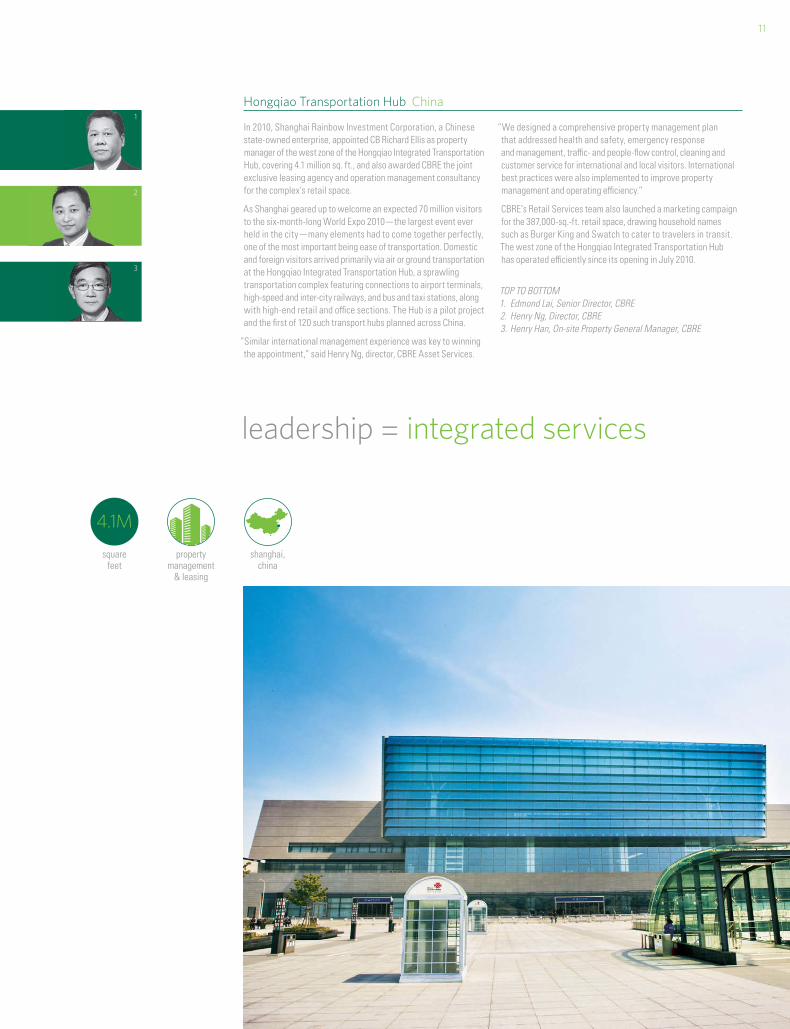
In 2010, Shanghai Rainbow Investment Corporation, a Chinese state-owned enterprise, appointed CB Richard Ellis as property manager of the west zone of the Hongqiao Integrated Transportation Hub, covering 4.1 million sq. ft., and also awarded CBRE the joint exclusive leasing agency and operation management consultancy for the complex’s retail space.
As Shanghai geared up to welcome an expected 70 million visitors to the six-month-long World Expo 2010 — the largest event ever held in the city — many elements had to come together perfectly, one of the most important being ease of transportation. Domestic and foreign visitors arrived primarily via air or ground transportation at the Hongqiao Integrated Transportation Hub, a sprawling transportation complex featuring connections to airport terminals, high-speed and inter-city railways, and bus and taxi stations, along with high-end retail and offi ce sections. The Hub is a pilot project and the fi rst of 120 such transport hubs planned across China.
“Similar international management experience was key to winning the appointment,” said Henry Ng, director, CBRE Asset Services.
“We designed a comprehensive property management plan that addressed health and safety, emergency response and management, traffi c- and people-fl ow control, cleaning and customer service for international and local visitors. International best practices were also implemented to improve property management and operating effi ciency.”
CBRE’s Retail Services team also launched a marketing campaign for the 387,000-sq.-ft. retail space, drawing household names such as Burger King and Swatch to cater to travelers in transit. The west zone of the Hongqiao Integrated Transportation Hub has operated effi ciently since its opening in July 2010.
TOP TO BOTTOM1. Edmond Lai, Senior Director, CBRE2. Henry Ng, Director, CBRE3. Henry Han, On-site Property General Manager, CBRE
Hongqiao Transportation Hub China1
2
3
leadership = integrated services
property management
& leasing
squarefeet
4.1M
shanghai,china

12
Letter to ShareholdersCBRE 2010

13
leadership = fi nancial strength
CB Richard Ellis delivered outstanding results in 2010, which was one of the most profi table years in our history. Through more than a century of operations, we have successfully navigated a range of business cycles. In the recent downturn, as with many before it, we seized opportunities to lay the groundwork for future growth and to further diversify our global portfolio of services. We made the tough decisions required to position our company to capitalize on the rebound, and emerged a stronger enterprise. Among the highlights of our 2010 fi nancial performance:
• Global revenues grew 23% to $5.1 billion.
• Diluted earnings per share, adjusted for selected items, rose 92% to $0.75.
• Net income, after adjusting for selected items, jumped 118% to $239.8 million.
• Normalized EBITDA increased 50% to $681.3 million.
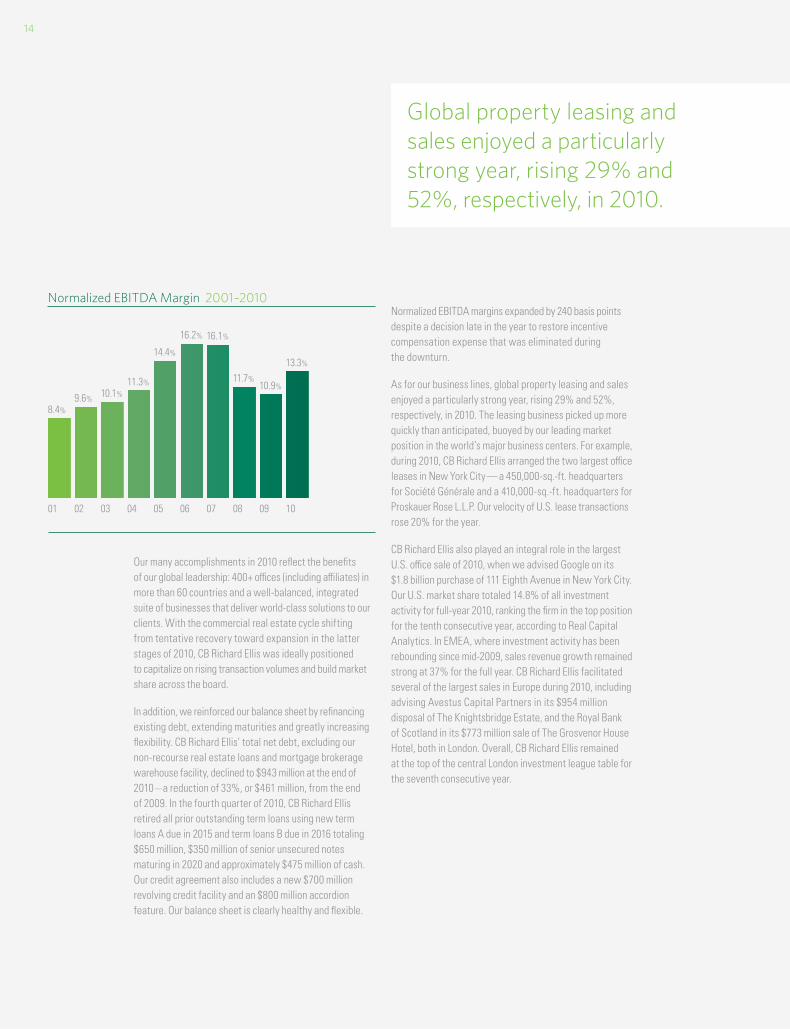
• Normalized EBITDA margin widened to 13.3% from 10.9% in 2009.
These results were particularly gratifying because the business environment was hardly robust in 2010, although it did improve from the recessionary depths of 2009. Despite the continued economic challenges, normalized EBITDA was our second-highest ever and revenue matched our second-best year.
Beyond fi nancial metrics — always a key barometer of success — CB Richard Ellis was recognized in 2010 by several third parties for superior client service, operational excellence and industry leadership. To name a few:
• The Lipsey Company named the fi rm the premier global brand in commercial real estate, based on a survey of 20,000 industry professionals, for the ninth straight year.
• Euromoney named CB Richard Ellis the top global real estate advisory and consulting fi rm for 2010, the fourth time we have achieved this honor.
• The Financial Times ranked CB Richard Ellis the best property investment advisor of 2010.
• We were identifi ed as the premier provider of outsourcing services in two in-depth research studies — one from the Black Book of Outsourcing and the other from consultants Frost & Sullivan.
• Newsweek ranked CB Richard Ellis the #1 fi rm in both commercial real estate and the broader fi nancial services sector for environmental sustainability programs, and #30 overall out of 500 major companies. A big driver for our strong position was high reputational scores, meaning more people across the business landscape recognized our leadership in sustainability.
14
Our many accomplishments in 2010 refl ect the benefi ts of our global leadership: 400+ offi ces (including affi liates) in more than 60 countries and a well-balanced, integrated suite of businesses that deliver world-class solutions to our clients. With the commercial real estate cycle shifting from tentative recovery toward expansion in the latter stages of 2010, CB Richard Ellis was ideally positioned to capitalize on rising transaction volumes and build market share across the board.
In addition, we reinforced our balance sheet by refi nancing existing debt, extending maturities and greatly increasing fl exibility. CB Richard Ellis’ total net debt, excluding our non-recourse real estate loans and mortgage brokerage warehouse facility, declined to $943 million at the end of 2010 — a reduction of 33%, or $461 million, from the end of 2009. In the fourth quarter of 2010, CB Richard Ellis retired all prior outstanding term loans using new term loans A due in 2015 and term loans B due in 2016 totaling $650 million, $350 million of senior unsecured notes maturing in 2020 and approximately $475 million of cash. Our credit agreement also includes a new $700 million revolving credit facility and an $800 million accordion feature. Our balance sheet is clearly healthy and fl exible.
Global property leasing and
sales enjoyed a particularly
strong year, rising 29% and
52%, respectively, in 2010.
Normalized EBITDA Margin 2001–2010
01 0402 0503 06 07 08 1009
8.4%9.6% 10.1%
11.3%
14.4%
16.2% 16.1%
11.7%10.9%
13.3%
Normalized EBITDA margins expanded by 240 basis points despite a decision late in the year to restore incentive compensation expense that was eliminated during the downturn.
As for our business lines, global property leasing and sales enjoyed a particularly strong year, rising 29% and 52%, respectively, in 2010. The leasing business picked up more quickly than anticipated, buoyed by our leading market position in the world’s major business centers. For example, during 2010, CB Richard Ellis arranged the two largest offi ce leases in New York City — a 450,000-sq.-ft. headquarters for Société Générale and a 410,000-sq.-ft. headquarters for Proskauer Rose L.L.P. Our velocity of U.S. lease transactions rose 20% for the year.
CB Richard Ellis also played an integral role in the largest U.S. offi ce sale of 2010, when we advised Google on its $1.8 billion purchase of 111 Eighth Avenue in New York City. Our U.S. market share totaled 14.8% of all investment activity for full-year 2010, ranking the fi rm in the top position for the tenth consecutive year, according to Real Capital Analytics. In EMEA, where investment activity has been rebounding since mid-2009, sales revenue growth remained strong at 37% for the full year. CB Richard Ellis facilitated several of the largest sales in Europe during 2010, including advising Avestus Capital Partners in its $954 million disposal of The Knightsbridge Estate, and the Royal Bank of Scotland in its $773 million sale of The Grosvenor House Hotel, both in London. Overall, CB Richard Ellis remained at the top of the central London investment league table for the seventh consecutive year.
15
CB Richard Ellis’ outsourcing businesses signed contracts with a record 62 new clients in 2010 and renewed or expanded another 59, for a total of 121 contracts, up 38% over 2009. These businesses are enjoying especially strong growth in EMEA and Asia Pacifi c, where the outsourcing of real estate services is a relatively new concept. Our global portfolio of commercial property and corporate facilities under management totaled approximately 2.9 billion sq. ft. (including affi liates) at the end of the fourth quarter, a 17% increase for the full year. Outsourcing accounted for 35 percent of global revenue, and we are optimistic about continued growth in 2011.
The company’s commercial mortgage brokerage and appraisal and valuation businesses benefi ted from increased availability of credit and lenders’ eagerness to dispose of underperforming assets. Total mortgage brokerage activity rose 123% for the full year to $14.5 billion, including $4.5 billion of loan sales — up from just $0.6 billion in 2009. The re-emergence of both traditional and CMBS lending spurred higher demand for valuations and appraisals. New valuation business globally — as measured by the number of assignments — increased 11% for the full year.
Meanwhile, our Global Investment Management subsidiary, CB Richard Ellis Investors, raised new capital of approximately $4.8 billion and had more than $2 billion of capital to deploy at year-end. Total assets under management rose 8% to $37.6 billion.
Nearly two decades ago, our former CEO, Jim Didion, declared an audacious goal: to become the preeminent, globally capable, vertically integrated commercial real estate services fi rm. Every strategic move this fi rm has made since that time has focused on that aspiration. In February 2011, we fulfi lled this goal by entering into defi nitive agreements to purchase ING Group N.V.’s
direct real estate investment management businesses in Europe and Asia and its U.S.-based global real estate listed securities business. When the transactions close later this year, the 700+ ING real estate professionals will join our existing investment management business, adding particular strength in core and core-plus funds to our current focus on value-add and opportunistic strategies. Following this acquisition, CB Richard Ellis will be number one globally in every service we provide to our clients.
Looking ahead, I have never been more excited about our prospects. We appear to be in the early stages of a cyclical recovery that is gaining momentum. Our global leadership provides an unrivaled combination of technology, research and market intelligence, arming our people with superior resources to add value for our clients. But our greatest asset is our 31,000 professionals, whose creative thinking and hard work over the last two years have made CB Richard Ellis a more effi cient, disciplined enterprise while sharpening our focus on our clients. Every day in communities around the globe, they bring to life our commitment to exceptional client service. We look forward to using all the advantages of our market position to test the limits of what is possible in 2011.
Sincerely,
Brett WhiteChief Executive Officer
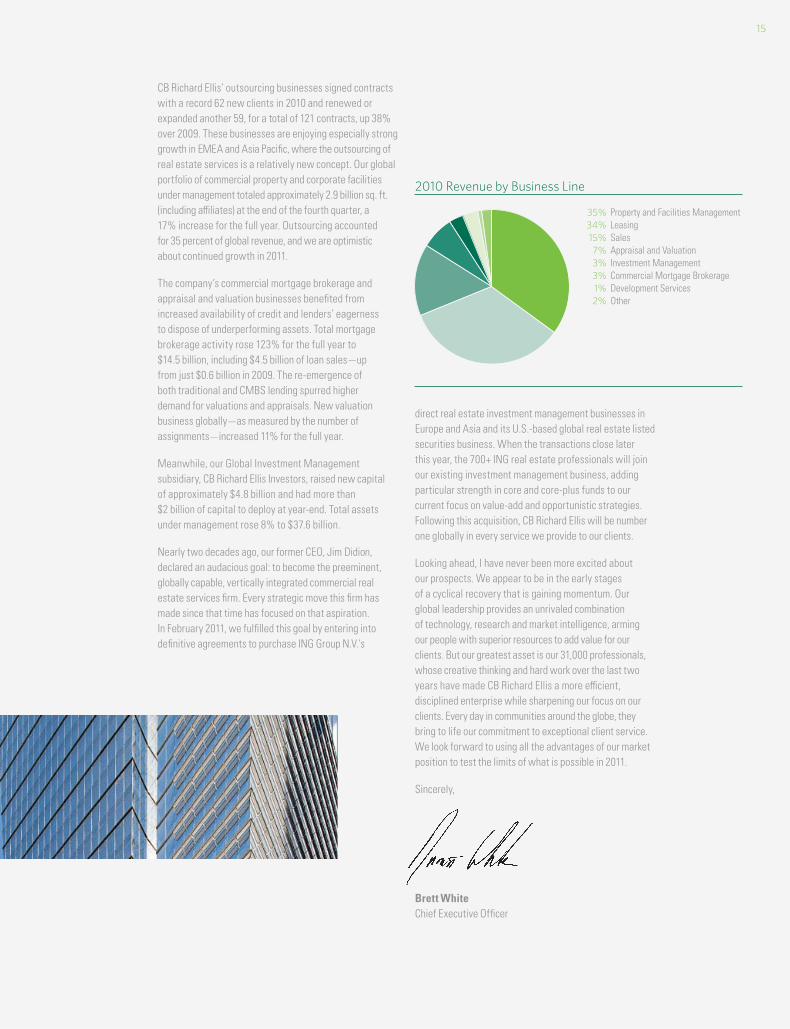
2010 Revenue by Business Line
35% Property and Facilities Management 34% Leasing 15% Sales 7% Appraisal and Valuation 3% Investment Management 3% Commercial Mortgage Brokerage 1% Development Services 2% Other

16
In thousands, except share data 2010 2009 2008
Revenue $ 5,115,316 $ 4,165,820 $ 5,128,817
Depreciation and amortization 108,381 99,473 102,817
Goodwill and other non-amortizable intangible asset impairment – – 1,159,406
Operating income (loss) 446,379 241,842 (788,469)
Equity income (loss) from unconsolidated subsidiaries 26,561 (34,095) (80,130)
Other income (loss) – 3,880 (7,686)
Interest expense, net 182,735 183,017 149,394
Write-off of fi nancing costs 18,148 29,255 –
Income (loss) from continuing operations before provision for income taxes 272,057 (645) (1,025,679)
Income (loss) from continuing operations 141,689 (27,638) (1,076,489)
Income from discontinued operations, net of income taxes 14,320 – 26,748
Net income (loss) 156,320 (27,638) (1,049,741)
Less: Net loss attributable to non-controlling interests (44,336) (60,979) (37,675)
Net income (loss) attributable to CB Richard Ellis Group, Inc. (1) $ 200,345 $ 33,341 $ (1,012,066)
Income (loss) per share attributable to CB Richard Ellis Group, Inc.
Basic
Income (loss) from continuing operations attributable to CB Richard Ellis Group, Inc. $ 0.61 $ 0.12 $ (4.86)
Income from discontinued operations attributable to CB Richard Ellis Group, Inc. 0.03 – 0.05
Net income (loss) attributable to CB Richard Ellis Group, Inc. (1) $ 0.64 $ 0.12 $ (4.81)
Diluted
Income (loss) from continuing operations attributable to CB Richard Ellis Group, Inc. $ 0.60 $ 0.12 $ (4.86)
Income from discontinued operations attributable to CB Richard Ellis Group, Inc. 0.03 – 0.05
Net income (loss) attributable to CB Richard Ellis Group, Inc. (1) $ 0.63 $ 0.12 $ (4.81)
Weighted average shares outstanding
Basic 313,873,439 277,361,783 210,539,032
Diluted 319,016,887 279,995,081 210,539,032
EBITDA (2) (3) $ 647,467 $ 372,079 $ 457,021
Selected Financial Data
Year Ended December 31,
In thousands, except share data 2010 2009 2008
Net income (loss) attributable to CB Richard Ellis Group, Inc. $ 200,345 $ 33,341 $ (1,012,066)
Write-off of fi nancing costs, net of tax 11,220 18,205 –
Cost containment expenses, net of tax 9,453 27,110 18,429
Amortization expense related to customer relationships acquired, net of tax 7,331 7,379 8,824
Write-down of impaired assets, net of tax 6,988 20,293 67,467
Integration and other costs related to acquisitions, net of tax 4,499 3,495 11,007
Goodwill and other non-amortizable intangible asset impairment, net of tax – – 1,095,986
Adjustment to tax expense as a result of decline in the value of assets in the Company’s Deferred Compensation Plan – – 19,065
Net income attributable to CB Richard Ellis Group, Inc., as adjusted $ 239,836 $ 109,823 $ 208,712
Diluted income per share attributable to CB Richard Ellis Group, Inc., as adjusted $ 0.75 $ 0.39 $ 0.97
Weighted average shares outstanding for diluted income per share, as adjusted 319,016,887 279,995,081 214,510,842
Year Ended December 31,
In thousands 2010 2009 2008
Normalized EBITDA $681,343 $453,884 $ 601,172
Less:
Cost containment expenses 15,291 43,565 27,412
Write-down of impaired assets 11,307 32,623 100,367
Integration and other costs related to acquisitions 7,278 5,617 16,372
EBITDA (2) $647,467 $372,079 $ 457,021
Add:
Interest income (i) 8,417 6,129 17,886
Less:
Depreciation and amortization (ii) 108,962 99,473 102,909
Goodwill and other non-amortizable intangible asset impairment – – 1,159,406
Interest expense (iii) 192,706 189,146 167,805
Write-off of fi nancing costs 18,148 29,255 –
Provision for income taxes (iv) 135,723 26,993 56,853
Net income (loss) attributable to CB Richard Ellis Group, Inc. $200,345 $ 33,341 $(1,012,066)
(i) Includes interest income related to discontinued operations of $0.1 million for the year ended December 31, 2008.
(ii) Includes depreciation and amortization related to discontinued operations of $0.6 million and $0.1 million for the years ended December 31, 2010 and 2008, respectively.
(iii) Includes interest expense related to discontinued operations of $1.6 million and $0.6 million for the years ended December 31, 2010 and 2008, respectively.
(iv) Includes provision for income taxes related to discontinued operations of $5.4 million and $6.0 million for the years ended December 31, 2010 and 2008, respectively.
(1) Reconciliation of Net Income (Loss) Attributable to CB Richard Ellis Group, Inc. to Net Income Attributable to CB Richard Ellis Group, Inc., as Adjusted, and Calculation of Diluted Earnings per Share Attributable to CB Richard Ellis Group, Inc., as Adjusted:
(2) Includes EBITDA related to discontinued operations of $16.4 million and $16.9 million for the years ended December 31, 2010 and 2008, respectively.
(3) Reconciliation of Normalized EBITDA to EBITDA to Net Income (Loss) Attributable to CB Richard Ellis Group, Inc.:

17
Form 10-KCBRE 2010
UNITED STATESSECURITIES AND EXCHANGE COMMISSION
Washington, D.C. 20549
FORM 10-KANNUAL REPORT PURSUANT TO SECTION 13 OR 15(d)
OF THE SECURITIES EXCHANGE ACT OF 1934For the fiscal year ended December 31, 2010
Commission File Number 001 - 32205
CB RICHARD ELLIS GROUP, INC.(Exact name of registrant as specified in its charter)
Delaware 94-3391143(State or other jurisdiction of
incorporation or organization)(I.R.S. Employer Identification Number)
11150 Santa Monica Boulevard, Suite 1600Los Angeles, California 90025
(Address of principal executive offices) (Zip Code)
(310) 405-8900(Registrant’s telephone number, including area code)
Securities registered pursuant to Section 12(b) of the Act:Title of Each Class Name of Each Exchange on Which Registered
Class A Common Stock, $0.01 par value New York Stock ExchangeSecurities registered pursuant to Section 12(g) of the Act:
N.A.
Indicate by check mark if the registrant is a well-known seasoned issuer, as defined in Rule 405 of theSecurities Act. Yes È No ‘
Indicate by check mark if the registrant is not required to file reports pursuant to Section 13 or Section 15(d)of the Act. Yes ‘ No È
Indicate by check mark whether the registrant (1) has filed all reports required to be filed by Section 13 or15(d) of the Securities Exchange Act of 1934 during the preceding 12 months (or for such shorter period that theregistrant was required to file such reports), and (2) has been subject to such filing requirements for the past 90days. Yes È No ‘
Indicate by check mark whether the registrant has submitted electronically and posted on its corporate Website, if any, every Interactive Data File required to be submitted and posted pursuant to Rule 405 of RegulationS-T during the preceding 12 months (or for such shorter period that the registrant was required to submit and postsuch files). Yes È No ‘.
Indicate by check mark if disclosure of delinquent filers pursuant to Item 405 of Regulation S-K is notcontained herein, and will not be contained, to the best of registrant’s knowledge, in definitive proxy orinformation statements incorporated by reference in Part III of this Form 10-K or any amendment to the Form10-K. È
Indicate by check mark whether the registrant is a large accelerated filer, an accelerated filer, anon-accelerated filer, or a smaller reporting company. See definition of “large accelerated filer,” “acceleratedfiler” and “smaller reporting company” in Rule 12b-2 of the Exchange Act.
Large accelerated filer È Accelerated filer ‘ Non-accelerated filer ‘ Smaller reporting company ‘
Indicate by check mark whether the registrant is a shell company (as defined in Rule 12b-2 of the ExchangeAct). Yes ‘ No È
As of June 30, 2010, the aggregate market value of Class A Common Stock held by non-affiliates of theregistrant was $4.4 billion based upon the last sales price on June 30, 2010 on the New York Stock Exchange of$13.61 for the registrant’s Class A Common Stock.
As of February 11, 2011, the number of shares of Class A Common Stock outstanding was 323,580,594.DOCUMENTS INCORPORATED BY REFERENCE
Portions of the proxy statement for the registrant’s 2011 Annual Meeting of Stockholders to be heldMay 11, 2011 are incorporated by reference in Part III of this Form 10-K Report.
CB RICHARD ELLIS GROUP, INC.
ANNUAL REPORT ON FORM 10-K
TABLE OF CONTENTS
Page
PART IItem 1. Business . . . . . . . . . . . . . . . . . . . . . . . . . . . . . . . . . . . . . . . . . . . . . . . . . . . . . . . . . . . . . . . . . . . . . 1Item 1A. Risk Factors . . . . . . . . . . . . . . . . . . . . . . . . . . . . . . . . . . . . . . . . . . . . . . . . . . . . . . . . . . . . . . . . . . 9Item 1B. Unresolved Staff Comments . . . . . . . . . . . . . . . . . . . . . . . . . . . . . . . . . . . . . . . . . . . . . . . . . . . . . 21Item 2. Properties . . . . . . . . . . . . . . . . . . . . . . . . . . . . . . . . . . . . . . . . . . . . . . . . . . . . . . . . . . . . . . . . . . . . 21Item 3. Legal Proceedings . . . . . . . . . . . . . . . . . . . . . . . . . . . . . . . . . . . . . . . . . . . . . . . . . . . . . . . . . . . . . 21Item 4. Reserved . . . . . . . . . . . . . . . . . . . . . . . . . . . . . . . . . . . . . . . . . . . . . . . . . . . . . . . . . . . . . . . . . . . . . 21
PART II
Item 5. Market for the Registrant’s Common Equity, Related Stockholder Matters and Issuer Purchasesof Equity Securities . . . . . . . . . . . . . . . . . . . . . . . . . . . . . . . . . . . . . . . . . . . . . . . . . . . . . . . . . . . . 22
Item 6. Selected Financial Data . . . . . . . . . . . . . . . . . . . . . . . . . . . . . . . . . . . . . . . . . . . . . . . . . . . . . . . . . 25Item 7. Management’s Discussion and Analysis of Financial Condition and Results of Operations . . . . 27Item 7A. Quantitative and Qualitative Disclosures About Market Risk . . . . . . . . . . . . . . . . . . . . . . . . . . . . 59Item 8. Financial Statements and Supplementary Data . . . . . . . . . . . . . . . . . . . . . . . . . . . . . . . . . . . . . . . 61Item 9. Changes in and Disagreements with Accountants on Accounting and Financial Disclosure . . . . 137Item 9A. Controls and Procedures . . . . . . . . . . . . . . . . . . . . . . . . . . . . . . . . . . . . . . . . . . . . . . . . . . . . . . . . . 137Item 9B. Other Information . . . . . . . . . . . . . . . . . . . . . . . . . . . . . . . . . . . . . . . . . . . . . . . . . . . . . . . . . . . . . . 138
PART III
Item 10. Directors, Executive Officers and Corporate Governance . . . . . . . . . . . . . . . . . . . . . . . . . . . . . . . 138Item 11. Executive Compensation . . . . . . . . . . . . . . . . . . . . . . . . . . . . . . . . . . . . . . . . . . . . . . . . . . . . . . . . 138Item 12. Security Ownership of Certain Beneficial Owners and Management and Related Stockholder
Matters . . . . . . . . . . . . . . . . . . . . . . . . . . . . . . . . . . . . . . . . . . . . . . . . . . . . . . . . . . . . . . . . . . . . . . 138Item 13. Certain Relationships and Related Transactions, and Director Independence . . . . . . . . . . . . . . . . 138Item 14. Principal Accountant Fees and Services . . . . . . . . . . . . . . . . . . . . . . . . . . . . . . . . . . . . . . . . . . . . 138
PART IV
Item 15. Exhibits and Financial Statement Schedules . . . . . . . . . . . . . . . . . . . . . . . . . . . . . . . . . . . . . . . . . 139Schedule II—Valuation and Qualifying Accounts . . . . . . . . . . . . . . . . . . . . . . . . . . . . . . . . . . . . . . . . . . . . . . 140Schedule III—Real Estate Investments and Accumulated Depreciation . . . . . . . . . . . . . . . . . . . . . . . . . . . . . 141SIGNATURES . . . . . . . . . . . . . . . . . . . . . . . . . . . . . . . . . . . . . . . . . . . . . . . . . . . . . . . . . . . . . . . . . . . . . . . . . 146
PART I
Item 1. Business
Company Overview
CB Richard Ellis Group, Inc. (which may be referred to in this Form 10-K as the “company”, “we”, “us”and “our”) is the world’s largest commercial real estate services firm, based on 2010 revenue, with leading full-service operations in major metropolitan areas throughout the world. We offer a full range of services tooccupiers, owners, lenders and investors in office, retail, industrial, multi-family and other types of commercialreal estate. As of December 31, 2010, we operated more than 300 offices worldwide, excluding affiliate offices,with approximately 31,000 employees providing commercial real estate services under the “CB Richard Ellis”and “CBRE” brand names and development services under the “Trammell Crow” brand name. Our business isfocused on several competencies, including commercial property and corporate facilities management, tenantrepresentation, property/agency leasing, property sales, valuation, real estate investment management,commercial mortgage origination and servicing, capital markets (equity and debt) solutions, developmentservices and proprietary research. We generate revenues from contractual management fees and on a per projector transactional basis. Our contractual, fee-for-services businesses, which generally involve facilitiesmanagement, property management and mortgage loan servicing, as well as asset management provided by CBRichard Ellis Investors, L.L.C. and its global affiliates, which we also refer to as CBRE Investors, representedapproximately 38% of our 2010 revenue.
During the year ended December 31, 2010, we generated revenue from a well-balanced, highly diversifiedbase of clients that includes nearly 80 of the Fortune 100 companies. We estimate that the following client typesaccounted for the highest proportion of revenue in 2010: corporations (44%), insurance companies and banks(19%) and pension funds and advisors (10%). In addition, individuals and partnerships accounted for 7% ofrevenue, government agencies accounted for 5%, real estate investment trusts, or REITs, accounted for 4% andother types of clients accounted for the remainder. Many of our clients continue to consolidate their commercialreal estate-related needs with fewer providers and, as a result, are awarding their business to providers that have astrong presence in important markets and the ability to provide a complete range of services worldwide. As aresult of this trend and our ability to deliver comprehensive integrated solutions for our clients’ needs across awide range of markets, we believe we are well positioned to capture a growing share of our clients’ commercialreal estate services needs. Since 2006, we have been the only commercial real estate services company includedin the S&P 500. In every year since 2008, we have been the only commercial real estate services firm to beincluded in the Fortune 500. Additionally, the International Association of Outsourcing Professionals hasincluded us among the top 100 global outsourcing companies across all industries for four consecutive years,including in 2010 when we ranked 13th overall. In 2010, we were named the premier real estate services providerglobally by a number of institutions, including The Financial Times, Euromoney and the International PropertyAwards, sponsored by Bloomberg.
CB Richard Ellis History
CB Richard Ellis marked its 104th year of continuous operations in 2010, tracing our origins to a companyfounded in San Francisco in the aftermath of the 1906 earthquake. From those humble beginnings, we havegrown into the largest global commercial real estate services firm (in terms of 2010 revenue) through organicgrowth and a series of strategic acquisitions in the United States and the United Kingdom. In December 2006, wecompleted the acquisition of Trammell Crow Company, our largest acquisition to date, which deepened ouroutsourcing services offerings for corporate and institutional clients, especially project and facilitiesmanagement, strengthened our ability to provide integrated account management solutions across geographies,and established resources and expertise to offer real estate development services throughout the United States.
On February 15, 2011, we announced that we had entered into definitive agreements to acquire the majorityof the real estate investment management business of Netherlands-based ING Group N.V. (ING) forapproximately $940 million in cash. The acquisitions include substantially all of the ING Real Estate Investment
1
Management operations in Europe and Asia, as well as Clarion Real Estate Securities (CRES), its U.S.-basedglobal real estate listed securities business (collectively, ING REIM). The ING REIM operations being acquiredare expected to become part of our Global Investment Management segment (whose business is conductedthrough our indirect wholly-owned subsidiary CBRE Investors), which will continue to be an independentlyoperated business segment upon completion of the acquisitions. CBRE Investors has primarily focused on value-add funds and separate accounts. ING REIM has primarily focused on core funds and global listed real estatesecurities funds, except in Asia, where ING REIM manages value-add funds and opportunity funds. There isexpected to be little overlap in the companies’ client bases, with a majority of CBRE Investors’ clients beingU.S.-based and a majority of ING REIM’s clients based in Europe. We also expect to acquire approximately $55million of CRES co-investments from ING and potentially additional interests in other funds managed by INGREIM Europe and ING REIM Asia. In addition, we expect to incur transaction costs relating to the acquisitionsof approximately $150 million (pre-tax), including financing, retention and integration costs. These acquisitions,which we refer to as the REIM Acquisitions, are expected to close in the second half of 2011 and are subject toapproval by certain stakeholders, including regulatory agencies in the United States, Europe and Asia.
As of December 31, 2010, the assets under management, or AUM, in the ING REIM portfolio we areacquiring totaled approximately $59.8 billion. CBRE Investors’ assets under management totaled $37.6 billion asof December 31, 2010. The methodologies used by the ING REIM business units and CBRE Investors todetermine their respective AUM are not the same and, accordingly, the reported AUM of ING REIM would bedifferent if calculated using a methodology consistent with that of CBRE Investors’ methodology. To the extentapplicable, ING REIM’s reported AUM was converted from Euros to U.S. dollars using an exchange rate of$1.3379 per €1. ING REIM, when combined with our existing Global Investment Management operations, willprovide us with a significantly enhanced ability to meet the needs of institutional investors across global marketswith a full spectrum of investment programs and strategies.
We have historically also supplemented our global capabilities through the acquisition of regional andspecialty-niche firms that are leaders in their areas of concentration or in their local markets, including regionalfirms with which we had previous affiliate relationships. These “in-fill” acquisitions remain an integral part ofour long-term strategy.
Our Regions of Operation and Principal Services
CB Richard Ellis Group, Inc. is a holding company that conducts all of its operations through its indirectsubsidiaries. CB Richard Ellis Services, Inc., our direct wholly-owned subsidiary, is also generally a holdingcompany and is the primary obligor or issuer with respect to most of our long-term indebtedness.
We report our operations through the following segments: (1) Americas, (2) EMEA, (3) Asia Pacific,(4) Global Investment Management and (5) Development Services.
Information regarding revenue and operating income or loss, attributable to each of our segments, isincluded in “Segment Operations” within the “Management’s Discussion and Analysis of Financial Conditionand Results of Operations” section and within Note 20 of our Notes to Consolidated Financial Statements, whichare incorporated herein by reference. Information concerning the identifiable assets of each of our businesssegments is also set forth in Note 20 of our Notes to Consolidated Financial Statements, which is incorporatedherein by reference.
The Americas
The Americas segment is our largest segment of operations and provides a comprehensive range of servicesthroughout the United States and in the largest metropolitan regions in Canada and selected parts of LatinAmerica through both wholly-owned operations as well as independent affiliated offices. Our agreements withthese independent affiliate offices include licenses to use the “CB Richard Ellis” name in the relevant territory inreturn for payments of annual royalty fees to us. In addition, these agreements also include business cross-referralarrangements between us and our affiliates.
2
Most of our advisory services and outsourcing services operations are conducted through our indirectwholly-owned subsidiary CB Richard Ellis, Inc. Our mortgage loan origination and servicing operations areconducted exclusively through our indirect wholly-owned subsidiary operating under the name CBRE CapitalMarkets and its subsidiaries. Our operations in Canada are conducted through our indirect wholly-ownedsubsidiary CB Richard Ellis Limited.
Our Americas segment accounted for 62.9% of our 2010 revenue, 62.3% of our 2009 revenue and 62.6% ofour 2008 revenue. Within our Americas segment, we organize our services into the following business areas:
Advisory Services
Our advisory services businesses offer occupier/tenant and investor/owner services that meet the fullspectrum of marketplace needs, including (1) real estate services, (2) capital markets and (3) valuation. Ouradvisory services business line accounted for 35.0% of our 2010 consolidated worldwide revenue, 30.8% of our2009 consolidated worldwide revenue and 34.6% of our 2008 consolidated worldwide revenue.
Within advisory services, our major service lines are the following:
• Real Estate Services. We provide strategic advice and execution to owners, investors and occupiers ofreal estate in connection with leasing, disposition and acquisition of property. Our years of strong localmarket presence have allowed us to develop significant repeat business from existing clients, includingapproximately 57% of our revenues from existing U.S. real estate sales and leasing clients in 2010. Thisincludes referrals associated with our contractual fee-for-services businesses, which generally involvefacilities management, property management and mortgage loan servicing, as well as asset managementprovided by CBRE Investors. Our real estate services professionals are particularly adept at aligning realestate strategies with client business objectives, serving as advisors as well as transaction executors. Webelieve we are a market leader for the provision of sales and leasing real estate services in most top U.S.metropolitan statistical areas (as defined by the U.S. Census Bureau), including Atlanta, Chicago,Dallas, Houston, Los Angeles, Miami, New York and Philadelphia.
Our real estate services professionals are compensated primarily through commission-based programs, whichare payable upon completion of an assignment. Therefore, as compensation is our largest expense, this coststructure gives us flexibility to mitigate the negative effect on our operating margins during difficult marketconditions. Due to the low barriers to entry and significant competition for quality employees, we strive toretain top professionals through an attractive compensation program tied to productivity. We also believe weinvest in greater support resources than most other firms, including professional development and training,market research and information, technology, branding and marketing. We also foster an entrepreneurialculture that emphasizes client service and rewards performance.
We further strengthen our relationships with our real estate services clients by offering proprietary research tothem through our commercial real estate market information and forecasting unit, CBRE EconometricAdvisors (CBRE-EA, formerly CBRE Torto Wheaton Research). This group provides data and analysis to itsclients in various formats, including market outlook reports for the office, industrial, hotel, retail and multi-housing sectors, covering more than 110 metropolitan areas in the United States and Canada.
• Capital Markets. In 2005, we combined our investment sales and debt/equity financing professionalsinto a single fully integrated service offering called CBRE Capital Markets. The move formalized thecollaboration between our investment sales professionals and debt/equity financing experts, which hasgrown as investors have sought comprehensive capital markets solutions, rather than separate sales andfinancing transactions. During 2010, we concluded more than $38.6 billion of capital marketstransactions in the Americas, including $24.1 billion of investment sales transactions and $14.5 billionof mortgage loan originations and sales.
We believe our Investment Properties business, which includes office, industrial, retail, multi-family andhotel properties, is the leading investment sales property advisors in the United States, with a market share of
3
approximately 15% in 2010. Our mortgage brokerage business originates, sells and services commercialmortgage loans primarily through relationships established with investment banking firms, national banks,credit companies, insurance companies, pension funds and government agencies. Our mortgage loanorigination volume in 2010 was $10.1 billion, representing an increase of approximately 68% from 2009.Approximately $4.2 billion of loans in 2010 were originated for federal government sponsored entities, mostof which were financed through revolving credit lines dedicated exclusively for this purpose. Loans financedthrough the revolving credit lines generally occur with principal risk that is substantially mitigated becausebefore the loan is originated, we obtain either a contractual purchase commitment from the governmentsponsored entity or a confirmed forward trade commitment for the issuance and purchase of a mortgagebacked security that will be secured by the loan. We advised on the sale of approximately $4.5 billion ofunder-performing mortgages on behalf of financial institutions in 2010, compared with $0.6 billion in 2009.In 2010, GEMSA Loan Services, a joint venture between CBRE Capital Markets and GE Capital Real Estate,serviced approximately $112.7 billion of mortgage loans, $54.5 billion of which related to the servicing rightsof CBRE Capital Markets.
• Valuation. We provide valuation services that include market value appraisals, litigation support,discounted cash flow analyses and feasibility and fairness opinions. Our valuation business hasdeveloped proprietary technology for preparing and delivering valuation reports to our clients, which webelieve provides us with an advantage over our competitors. We believe that our valuation business isone of the largest in the industry. During 2010, we completed over 31,000 valuation, appraisal andadvisory assignments.
Outsourcing Services
Outsourcing is a long-term trend in commercial real estate, with corporations, institutions, public sectorentities and others seeking to achieve improved efficiency, better execution and lower costs by relying on theexpertise of third-party real estate specialists. Our outsourcing services primarily include two major businesslines that seek to capitalize on this trend: (1) corporate services and (2) asset services. Agreements with ourcorporate services clients are generally long-term arrangements and although they contain different provisionsfor termination, there are usually penalties for early termination. Although our management agreements with ourasset services clients generally may be terminated with notice ranging between 30 to 90 days, we have developedlong-term relationships with many of these clients and we continue to work closely with them to implement theirspecific goals and objectives and to preserve and expand upon these relationships. As of December 31, 2010, wemanaged nearly 1.3 billion square feet of commercial space for property owners and occupiers, which we believerepresents one of the largest portfolios in the Americas. Our outsourcing services business line accounted for27.9% of our 2010 consolidated worldwide revenue, 31.5% of our 2009 consolidated worldwide revenue and28.0% of our 2008 consolidated worldwide revenue.
• Corporate Services. We provide a comprehensive suite of services to corporate users of real estate,including transaction management, project management, facilities management, strategic consulting,portfolio management and other services. Our clients are leading global corporations, health careinstitutions and public sector entities with large, geographically-diverse real estate portfolios. Projectmanagement services are typically provided on a portfolio-wide or programmatic basis. Facilitiesmanagement involves the day-to-day management of client-occupied space and includes headquarterbuildings, regional offices, administrative offices and manufacturing and distribution facilities. Weidentify best practices, implement technology solutions and leverage our resources to control clients’facilities costs and enhance the workplace environment. We seek to enter into multi-year, multi-serviceoutsourcing contracts with our clients, but also provide services on a one-off assignment or a short-termcontract basis. We enter into long-term, contractual relationships with these organizations with the goalof ensuring that our clients’ real estate strategies support their overall business strategies. Revenues forproject management include fixed management fees, variable fees, and incentive fees if certain agreed-upon performance targets are met. Revenues may also include reimbursement of payroll and relatedcosts for personnel providing the services. Contracts for facilities management services are typically
4
structured so we receive reimbursement of client-dedicated personnel costs and associated overheadexpenses plus a monthly fee, and in some cases, annual incentives if agreed-upon performance targetsare satisfied.
• Asset Services. We provide property management, construction management, marketing, leasing,accounting and financial services on a contractual basis for income-producing office, industrial andretail properties owned by local, regional and institutional investors. We provide these services throughan extensive network of real estate experts in major markets throughout the United States. These localoffice delivery teams are supported by a strategic accounts team whose function is to help ensure qualityservice and to maintain and expand relationships with large institutional clients, including buyers,sellers and landlords who need to lease, buy, sell and/or finance space. We believe our contractualrelationships with these clients put us in an advantageous position to provide other services to them,including refinancing, disposition and appraisal. We typically receive monthly management fees for theasset services we provide based upon a specified percentage of the monthly rental income or rentalreceipts generated from the property under management, or in certain cases, the greater of suchpercentage fee or a minimum agreed-upon fee. We are also normally reimbursed for our administrativeand payroll costs, as well as certain out-of-pocket expenses, directly attributable to the properties undermanagement.
Europe, Middle East and Africa (EMEA)
Our Europe, Middle East and Africa, or EMEA, segment, operates in 42 countries with operations primarilyconducted through a number of indirect wholly-owned subsidiaries. The largest operations are located in France,Germany, Italy, the Netherlands, Russia, Spain and the United Kingdom. Our operations in these countriesgenerally provide a full range of services to the commercial property sector. Additionally, we provide someresidential property services, primarily in France, Spain and the United Kingdom. Within EMEA, our servicesare organized along the same lines as in the Americas, including brokerage, investment properties, corporateservices, valuation/appraisal services, asset management services and facilities management, among others. OurEMEA segment accounted for 18.3% of our 2010 revenue, 19.6% of our 2009 revenue and 21.1% of our 2008revenue.
In France, we believe we are a market leader in Paris and also have operations in Aix in Provence, Bagnolet,Bordeaux, Lille, Lyon, Marseille, Montreuil, Montrouge, Neuilly Sur Seine, Saint Denis and Toulous. OurGerman operations are located in Berlin, Cologne, Düsseldorf, Frankfurt, Hamburg, Munich and Stuttgart. Ourpresence in Italy includes operations in Milan, Modena, Rome and Turin. Our operations in the Netherlands arelocated in Amsterdam, Almere, the Hague, Hoofddorp and Rotterdam. Our operations in Russia consist of anoffice in Moscow. In Spain, we provide full-service coverage through our offices in Barcelona, Madrid,Marbella, Palma de Mallorca and Valencia. We are one of the leading commercial real estate services companiesin the United Kingdom. We hold the leading market position in London in terms of both space acquisition anddisposition and investment sales for 2010 and provide a broad range of commercial property real estate servicesto investment, commercial and corporate clients located in London. We also have 11 regional offices inAberdeen, Birmingham, Bristol, Jersey, Leeds, Liverpool, Manchester, Sheffield and Southampton as well asoffices in Belfast, Edinburgh and Glasgow managed by our U.K. team.
We also have affiliated offices that provide commercial real estate services under our brand name in severalcountries throughout Europe, the Middle East and Africa. Our agreements with these independent offices includelicenses to use the “CB Richard Ellis” name in the relevant territory in return for payments of annual royalty feesto us. In addition, these agreements also include business cross-referral arrangements between us and ouraffiliates.
5
Asia Pacific
Our Asia Pacific segment operates in 13 countries with operations primarily conducted through a number ofindirect wholly-owned subsidiaries. We believe that we are one of only a few companies that can provide a fullrange of real estate services to large corporations throughout the region, similar to the broad range of servicesprovided by our Americas and EMEA segments. Our principal operations in Asia are located in China, HongKong, India, Japan, Singapore and South Korea. In addition, we have agreements with affiliate offices in thePhilippines, Thailand, Indonesia, Vietnam, Cambodia and Malaysia that generate royalty fees and support cross-referral arrangements similar to our EMEA segment. The Pacific region includes Australia and New Zealand,with principal offices located in Adelaide, Brisbane, Canberra, Melbourne, Sydney, Perth, Auckland, Wellingtonand Christchurch. Our Asia Pacific segment accounted for 13.1% of our 2010 revenue, 12.6% of our 2009revenue and 10.9% of our 2008 revenue.
Global Investment Management
Operations in our Global Investment Management segment are conducted through our indirect wholly-owned subsidiary CB Richard Ellis Investors, L.L.C. and its global affiliates, which we also refer to as CBREInvestors. CBRE Investors provides investment management services to clients/partners that include pensionplans, foundations, endowments and other organizations seeking to generate returns and diversification throughinvestment in real estate. It sponsors investment programs that span the risk/return spectrum across threecontinents: North America, Europe and Asia. In higher yield strategies, CBRE Investors and its investment teams“co-invest” with its limited partners. Our Global Investment Management segment accounted for 4.2% of our2010 revenue, 3.4% of our 2009 revenue and 3.1% of our 2008 revenue.
CBRE Investors is organized into four primary investment execution groups according to strategy, whichinclude direct real estate investments through the Managed Accounts Group (low risk), Strategic Partners (higheryielding strategies), Capital Partners (higher yielding debt strategies) and indirect real estate investments in realestate securities and unlisted property funds (multiple risk strategies). Operationally, a dedicated investment teamexecutes each investment strategy, with the team’s compensation being driven largely by the investmentperformance of its particular strategy/fund. This organizational structure is designed to align the interests of teammembers with those of the firm and its investor clients/partners and to enhance accountability and performance.Dedicated teams are supported by shared resources such as accounting, financial controls, informationtechnology, investor services and research. CBRE Investors has an in-house team of research professionals whofocus on investment strategy, underwriting and forecasting, based in part on research from our advisory servicesgroup.
CBRE Investors closed approximately $4.1 billion and $1.7 billion of new acquisitions in 2010 and 2009,respectively. It liquidated $2.2 billion and $0.8 billion of investments in 2010 and 2009, respectively. Assetsunder management have increased from $10.5 billion at December 31, 2000 to $37.6 billion at December 31,2010, representing an approximately 14% compound annual growth rate.
As of December 31, 2010, our portfolio of consolidated real estate held for investment consisted of oneindustrial property and eight multi-family/residential properties, all located in the United States. Rental revenues(which are included in revenue) and expenses (which are included in operating, administrative and otherexpenses) relating to these operational real estate properties were $41.6 million and $22.4 million, respectively,and were included in the accompanying consolidated statement of operations for the year ended December 31,2010.
6
Development Services
Operations in our Development Services segment are conducted through our indirect wholly-ownedsubsidiaries Trammell Crow Company, Trammell Crow Services, Inc. and certain of its subsidiaries, providingdevelopment services primarily in the United States to users of and investors in commercial real estate, as well asfor its own account. Trammell Crow Company pursues opportunistic but risk-mitigated development andinvestment in commercial real estate across a wide spectrum of property types, including industrial, office andretail properties; healthcare facilities of all types (medical office buildings, hospitals and ambulatory surgerycenters); higher education facilities (primarily student housing); and residential/mixed-use projects. OurDevelopment Services segment accounted for 1.5% of our 2010 revenue, 2.1% of our 2009 revenue and 2.3% ofour 2008 revenue.
Trammell Crow Company acts as the manager of development projects, providing services that are vital inall stages of the process, including: (i) site identification, due diligence and acquisition; (ii) evaluating projectfeasibility, budgeting, scheduling and cash flow analysis; (iii) procurement of approvals and permits, includingzoning and other entitlements; (iv) project finance advisory services; (v) coordination of project design andengineering; (vi) construction bidding and management as well as tenant finish coordination; and (vii) projectclose-out and tenant move coordination.
Trammell Crow Company may pursue development and investment activity on behalf of its user andinvestor clients (with no ownership), in partnership with its clients (through co-investment—either on anindividual project basis or through a fund or program) or for its own account (100% ownership). Developmentactivity in which Trammell Crow Company has an ownership interest is conducted through subsidiaries that areconsolidated or unconsolidated for financial reporting purposes, depending primarily on the extent and nature ofour ownership interest.
Trammell Crow Company has established several commingled investment funds to facilitate its pursuit ofopportunistic and value added development and investment projects. In addition, it seeks to channel a large partof its development and investment activity into programs with certain strategic capital partners.
As of December 31, 2010, our portfolio of consolidated real estate consisted of land, industrial, office, retailand medical properties and a mixed-use project. These projects are geographically dispersed throughout theUnited States, except for one project, which is located in Canada. Rental revenues (which are included inrevenue) and expenses (which are included in operating, administrative and other expenses) relating to theseoperational real estate properties, excluding those reported as discontinued operations, were $46.9 million and$24.6 million, respectively, and were included in the accompanying consolidated statement of operations for theyear ended December 31, 2010.
At December 31, 2010, Trammell Crow Company had $4.9 billion of development projects in process.Additionally, the inventory of pipeline deals (those projects we are pursuing, which we believe have a greaterthan 50% chance of closing or where land has been acquired and the project construction start is more thantwelve months out) was $1.2 billion at December 31, 2010.
Competition
We compete across a variety of business disciplines within the commercial real estate industry, includingcommercial property and corporate facilities management, tenant representation, property/agency leasing,property sales, valuation, real estate investment management, commercial mortgage origination and servicing,capital markets (equity and debt) solutions, development services and proprietary research. Each of the businessdisciplines in which we compete is highly competitive on an international, national, regional and local level.Although we are the largest commercial real estate services firm in the world in terms of 2010 revenue, ourrelative competitive position varies significantly across geographies, property types and services. Depending onthe geography, property type or service, we face competition from other commercial real estate service providers,including outsourcing companies that traditionally competed in limited portions of our facilities managementbusiness and have recently expanded their offerings, in-house corporate real estate departments, developers,institutional lenders, insurance companies, investment banking firms, investment managers and accounting and
7
consulting firms, some of which may have greater financial resources than we do. Despite recent consolidation,the commercial real estate services industry remains highly fragmented and competitive. Although many of ourcompetitors are local or regional firms and are substantially smaller than us, some of these competitors are largeron a local or regional basis. We are also subject to competition from other large multi-national firms that havesimilar service competencies to ours, including Cushman & Wakefield and Jones Lang LaSalle as well asnational firms such as Grubb & Ellis.
Seasonality
A significant portion of our revenue is seasonal, which can affect an investor’s ability to compare ourfinancial condition and results of operations on a quarter-by-quarter basis. Historically, this seasonality hascaused our revenue, operating income, net income and cash flows from operating activities to be lower in the firsttwo quarters and higher in the third and fourth quarters of each year. Earnings and cash flow have historicallybeen particularly concentrated in the fourth quarter due to investors and companies focusing on completingtransactions prior to calendar year-end. This has historically resulted in lower profits or a loss in the first andsecond quarters, with revenue and profitability improving in each subsequent quarter.
Employees
At December 31, 2010, we had approximately 31,000 employees worldwide, excluding affiliate offices,many of which are in our outsourcing operations and are fully reimbursed by our clients. At December 31, 2010,715 of our employees were subject to collective bargaining agreements, most of whom are on-site employees inour asset services business in New York, New Jersey, Illinois and California. We believe that relations with ouremployees are generally good.
Intellectual Property
We hold various trademarks and trade names worldwide, which include the “CB Richard Ellis” name.Although we believe our intellectual property plays a role in maintaining our competitive position in a number ofthe markets that we serve, we do not believe we would be materially, adversely affected by expiration ortermination of our trademarks or trade names or the loss of any of our other intellectual property rights other thanthe “CB Richard Ellis”, the “CBRE” and the “Trammell Crow” names. With respect to the CB Richard Ellis andCBRE names, we have processed and continuously maintain trademark registrations for these service marks inthe United States and the CB Richard Ellis and CBRE related marks are in registration or in process in mostforeign jurisdictions where we conduct significant business. We obtained our most recent U.S. trademarkregistrations for the CB Richard Ellis and CBRE related marks in 2005, and these registrations would expire in2015 if we failed to renew them.
We hold a license to use the “Trammell Crow” trade name pursuant to a license agreement with CF98, L.P.,an affiliate of Crow Realty Investors, L.P., d/b/a Crow Holdings, which may be revoked if we fail to satisfyusage and quality control covenants under the license agreement.
In addition to trade names, we have developed proprietary technologies for the provision of complexservices through our global outsourcing business and for preparing and developing valuation reports for ourclients through our valuation business. We also offer proprietary research to clients through our CBRE-EAresearch unit and we offer proprietary investment structures through CBRE Investors. While we seek to secureour rights under applicable intellectual property protection laws in these and any other proprietary assets that weuse in our business, we do not believe any of these other items of intellectual property are material to ourbusiness in the aggregate.
Environmental Matters
U.S. federal, state and local laws and regulations impose environmental liabilities, controls, disclosure rulesand zoning restrictions that impact the ownership, management, development, use, or sale of commercial real
8
estate. Certain of these laws and regulations may impose liability on current or previous real property owners oroperators for the cost of investigating, cleaning up or removing contamination caused by hazardous or toxicsubstances at a property, including contamination resulting from above-ground or underground storage tanks at aproperty. If contamination occurs or is present during our role as a property or facility manager or developer, wecould be held liable for such costs as a current “operator” of a property, regardless of the legality of the acts oromissions that caused the contamination and without regard to whether we knew of, or were responsible for, thepresence of such hazardous or toxic substances. The operator of a site also may be liable under common law tothird parties for damages and injuries resulting from exposure to hazardous substances or environmentalcontamination at a site, including liabilities arising from exposure to asbestos-containing materials. Under certainlaws and common law principles, any failure by us to disclose environmental contamination at a property couldsubject us to liability to a buyer or lessee of the property.
While we are aware of the presence or the potential presence of regulated substances in the soil orgroundwater at or near several properties owned, operated or managed by us, which may have resulted fromhistorical or ongoing activities on those properties, we are not aware of any material noncompliance with theenvironmental laws or regulations currently applicable to us, and we are not the subject of any material claim forliability with respect to contamination at any location. However, these laws and regulations may discourage salesand leasing activities and mortgage lending with respect to some properties, which may adversely affect both usand the commercial real estate services industry in general. Environmental contamination or other environmentalliabilities may also negatively affect the value of commercial real estate assets held by entities that are managedby our investment management and development services businesses, which could adversely impact the resultsof operations of these business lines.
Availability of this Report
Our internet address is www.cbre.com. On the Investor Relations page on our Web site, we post thefollowing filings as soon as reasonably practicable after they are electronically filed with or furnished to theSecurities and Exchange Commission, or SEC: our Annual Report on Form 10-K, our Quarterly Reports on Form10-Q, our Current Reports on Form 8-K, and any amendments to those reports filed or furnished pursuant toSection 13(a) or 15(d) of the Securities Exchange Act of 1934. All such filings on our Investor Relations webpage are available to be viewed on this page free of charge. Information contained on our Web site is not part ofthis Annual Report on Form 10-K or our other filings with the SEC. We assume no obligation to update or reviseany forward-looking statements in the Annual Report on Form 10-K, whether as a result of new information,future events or otherwise, unless we are required to do so by law. A copy of this Annual Report on Form 10-K isavailable without charge upon written request to: Investor Relations, CB Richard Ellis Group, Inc., 200 ParkAvenue, 17th Floor, New York, New York 10166.
Item 1A. Risk Factors
Set forth below and elsewhere in this report and in other documents we file with the SEC are risks anduncertainties that could cause our actual results to differ materially from the results contemplated by the forward-looking statements contained in this report and other public statements we make. Based on the informationcurrently known to us, we believe that the matters discussed below identify the most significant risk factorsaffecting our business. However, the risks and uncertainties we face are not limited to those described below.Additional risks and uncertainties not presently known to us or that we currently believe to be immaterial mayalso adversely affect our business.
The consummation and anticipated benefits of the REIM Acquisitions may not be realized as wecontemplated.
We are acquiring ING REIM with the expectation that the acquisition will result in various benefits,including, among others, enhanced revenues, a strengthened market position, cross-selling opportunities, cost
9
savings, certain tax benefits and operating efficiencies. Achieving the anticipated benefits of the REIMAcquisitions will be subject to a number of uncertainties, including whether we successfully close eachacquisition as contemplated, integrate the business being acquired, achieve expected synergies, and realizeaccretive benefits in the timeframe anticipated. Failure to achieve these anticipated benefits, as well as the failureto successfully implement a plan of financing in connection with the REIM Acquisitions, could result inincreased costs, decreases in the amount of expected revenues and diversion of management’s time and energy,which could materially impact our overall business, financial condition and operating results.
Completion of each of the REIM Acquisitions is conditioned upon, among other things, approval of certainregulatory authorities in the United States, Europe and Asia. In addition, the REIM Acquisitions are conditionedupon the receipt of consents from managing boards, investors or other parties necessary to transfer minimumlevels of annualized revenue for the accounts managed by ING REIM. While we and ING intend to pursuevigorously all required approvals and consents, and expect to obtain such approvals and consents by the timesuch acquisitions are expected to close in the second half of 2011, we can provide no assurance that we will do sosuccessfully or on a timely basis. In addition, the acquisitions of the U.S.-based global real estate listed securitiesbusiness, on the one hand, and the real estate investment management business in Europe and Asia, on the other,are not conditioned on each other. There can be no assurance that both or either of the components of the REIMAcquisitions will be consummated, or as to the timing of the closings of each component. Any delay in the REIMAcquisitions could diminish the anticipated benefits of such acquisitions and result in additional transactioncosts. In addition, any uncertainty over our ability to complete the REIM Acquisitions could make it moredifficult for us to pursue particular business strategies.
The success of our business is significantly related to general economic conditions and, accordingly, ourbusiness could be harmed by an economic slowdown and downturn in real estate asset values, property salesand leasing activities.
Periods of economic weakness or recession, significantly rising interest rates, declining employment levels,declining demand for real estate, declining real estate values, or the public perception that any of these eventsmay occur, may negatively affect the performance of many of our business lines. These economic conditions canresult in a general decline in acquisition, disposition and leasing activity, as well as a general decline in the valueof real estate and in rents, which in turn reduces revenue from property management fees and brokeragecommissions derived from property sales, leases and mortgage brokerage as well as revenues associated withinvestment management and/or development activities. In addition, these conditions can lead to a decline inproperty sales prices as well as a decline in funds invested in existing commercial real estate assets and propertiesplanned for development.
Our development and investment strategy often entails making relatively modest investments alongside ourinvestor clients. Our ability to conduct these activities depends in part on the supply of investment capital forcommercial real estate and related assets. During an economic downturn, investment capital is usuallyconstrained and it may take longer for us to dispose of real estate investments or selling prices may be lower thanoriginally anticipated. As a result, the value of our real estate investments may be reduced and we could realizelosses or diminished profitability. In addition, economic downturns may reduce the amount of loan originationsand related servicing by our commercial mortgage brokerage business. Further, as a result of our debt level andthe terms of our existing debt instruments (as described in other risk factors), our exposure to adverse generaleconomic conditions is heightened.
During 2008 and 2009, credit became severely constrained and prohibitively expensive and real estatemarket activity contracted sharply in most markets around the world as a result of the global financial crisis andthe deep economic recession. These adverse macro conditions impacted real estate services companies like oursby significantly hampering transaction activity and lowering real estate valuations. Similar to other commercialreal estate services firms, our transaction volumes fell during 2008 and most of 2009 and as a result our stockprice declined significantly.
10
If the economic and market conditions that prevailed in 2008 and 2009 were to return, our businessperformance and profitability could again deteriorate. If this were to occur, we could fail to comply with certainfinancial covenants in our credit agreement which would force us to seek an amendment with our lenders. Noassurance can be given that we would be able to obtain any necessary waivers or amendments on satisfactoryterms, if at all. In addition, in an extreme deterioration of our business, we could have insufficient liquidity tomeet our debt service obligations when they come due in future years.
Adverse developments in the credit markets may harm our business, results of operations and financialcondition.
Our Global Investment Management, Development Services and Capital Markets (including investmentproperty sales and debt and equity financing services) businesses are sensitive to credit cost and availability aswell as marketplace liquidity. Additionally, the revenues in all of our businesses are dependent to some extent onthe overall volume of activity (and pricing) in the commercial real estate market.
Disruptions in the credit markets may adversely affect our business of providing advisory services toowners, investors and occupiers of real estate in connection with the leasing, disposition and acquisition ofproperty. If our clients are unable to procure credit on favorable terms, there may be fewer completed leasingtransactions, dispositions and acquisitions of property. In addition, if purchasers of real estate are not able toprocure favorable financing resulting in the lack of disposition opportunities for our funds and projects, ourGlobal Investment Management and Development Services businesses will be unable to generate incentive feesand we may also experience losses of co-invested equity capital if the disruption causes a permanent decline inthe value of investments made.
In 2008 and 2009, the credit markets experienced a disruption of unprecedented magnitude. This disruptionreduced the availability and significantly increased the cost of most sources of funding. In some cases, thesesources were eliminated. While the credit market has shown signs of improving since the second half of 2009,liquidity remains constrained and it is impossible to predict when the market will return to normalcy. Thisuncertainty may lead market participants to continue to act more conservatively, which may amplify decreases indemand and pricing in the markets we serve.
Our debt instruments impose operating and financial restrictions on us and, in the event of a default, allof our borrowings would become immediately due and payable.
Our debt instruments, including our credit agreement, impose, and the terms of any future debt may impose,operating and other restrictions on us and many of our subsidiaries. These restrictions affect, and in manyrespects limit or prohibit, our ability to:
• plan for or react to market conditions;
• meet capital needs or otherwise restrict our activities or business plans; and
• adversely affect our ability to finance ongoing operations, strategic acquisitions, investments or othercapital needs or to engage in other business activities that would be in our interest, including:
• incurring or guaranteeing additional indebtedness;
• paying dividends or making distributions on or repurchases of capital stock;
• repurchasing equity interests;
• the payment of dividends or other amounts to us;
• transferring or selling assets, including the stock of subsidiaries;
• creating liens; and
• entering into sale/leaseback transactions
11
Our credit agreement currently requires us to maintain a minimum coverage ratio of EBITDA (as defined inthe credit agreement) to total interest expense of 2.25x and a maximum leverage ratio of total debt less availablecash to EBITDA (as defined in the credit agreement) of 3.75x. Our ability to meet these financial ratios can beaffected by events beyond our control, and we cannot assure that we will be able to meet those ratios whenrequired. For example, we experienced a decline in EBITDA during the economic downturn in 2008 to 2009,which negatively impacted our minimum coverage ratio and maximum leverage ratio. However, we significantlyreduced our cost structure during 2008 and 2009, and, as a result of these cost reductions as well as renewedgrowth in our business, we are well within compliance with the minimum coverage ratio and the maximumleverage ratio under our credit agreement. Our coverage ratio of EBITDA to total interest expense was 8.16x forthe year ended December 31, 2010 and our leverage ratio of total debt less available cash to EBITDA was 0.94xas of December 31, 2010. We continue to monitor our projected compliance with these financial ratios and otherterms of our credit agreement.
A breach of any of these restrictive covenants or the inability to comply with the required financial ratioscould result in a default under our debt instruments. If any such default occurs, the lenders under our creditagreement may elect to declare all outstanding borrowings, together with accrued interest and other fees, to beimmediately due and payable. The lenders under our credit agreement also have the right in these circumstancesto terminate any commitments they have to provide further borrowings. If we are unable to repay outstandingborrowings when due, the lenders under our credit agreement will have the right to proceed against the collateralgranted to them to secure the debt, which collateral is described in the immediately following risk factor. If thedebt under our credit agreement were to be accelerated, we cannot give assurance that this collateral would besufficient to repay our debt.
If we fail to meet our payment or other obligations under our credit agreement, the lenders under suchcredit agreement could foreclose on, and acquire control of, substantially all of our assets.
Our credit agreement is jointly and severally guaranteed by us and substantially all of our domesticsubsidiaries. Borrowings under our credit agreement are secured by a pledge of substantially all of the capitalstock of our U.S. subsidiaries and 65% of the capital stock of certain non-U.S. subsidiaries. In addition, inconnection with any amendment to our credit agreement, we may need to grant additional collateral to thelenders. If we are unable to repay outstanding borrowing when due, the lenders under our credit agreement willhave the right to proceed against this pledged capital stock and take control of substantially all of our assets.
Our substantial leverage and debt service obligations could harm our ability to operate our business,remain in compliance with debt covenants and make payments on our debt.
We are highly leveraged and have significant debt service obligations. As of December 31, 2010, our totaldebt, excluding notes payable on real estate and warehouse lines of credit (both of which are generallynonrecourse to us), was approximately $1.4 billion. For the year ended December 31, 2010, our interest expensewas approximately $191.2 million. In connection with the REIM Acquisitions, we also expect to incurapproximately $800 million of new term loans under our secured credit agreement to finance such acquisitions.Our level of indebtedness increases the possibility that we may be unable to generate cash sufficient to pay whendue the principal of, interest on or other amounts due in respect of our indebtedness. In addition, we may incuradditional debt from time to time to finance strategic acquisitions, investments, joint ventures or for otherpurposes, subject to the restrictions contained in the documents governing our indebtedness. If we incuradditional debt, the risks associated with our leverage, including our ability to service our debt, would increase. Ifwe are required to seek an amendment to our credit agreement, our debt service obligations may be substantiallyincreased.
Our debt could have other important consequences, which include, but are not limited to, the following:
• a substantial portion of our cash flow from operations is used to pay principal and interest on our debt;
• our interest expense could increase if interest rates increase because the loans under our creditagreement bear interest at floating rates;
12
• our leverage could increase our vulnerability to general economic downturns and adverse competitiveand industry conditions, placing us at a disadvantage compared to those of our competitors that are lessleveraged;
• our debt service obligations could limit our flexibility in planning for, or reacting to, changes in ourbusiness and in the commercial real estate services industry;
• our failure to comply with the financial and other restrictive covenants in the documents governing ourindebtedness could result in an event of default that, if not cured or waived, results in foreclosure onsubstantially all of our assets; and
• our level of debt may restrict us from raising additional financing on satisfactory terms to fund strategicacquisitions, investments, joint ventures and other general corporate requirements.
From time to time, Moody’s Investors Service, Inc. and Standard & Poor’s Ratings Services, a division ofThe McGraw-Hill Companies, Inc., rate our significant outstanding debt. These ratings and any downgradesthereof may impact our ability to borrow under any new agreements in the future, as well as the interest rates andother terms of any future borrowings, and could also cause a decline in the market price of our Class A commonstock.
We cannot be certain that our earnings will be sufficient to allow us to pay principal and interest on our debtand meet our other obligations. If we do not have sufficient earnings, we may be required to seek to refinance allor part of our existing debt, sell assets, borrow more money or sell more securities, none of which we canguarantee that we will be able to do and which, if accomplished, may adversely impact our stock price.
We have limited restrictions on the amount of additional recourse debt we are able to incur, which mayintensify the risks associated with our leverage, including our ability to service our indebtedness.
Subject to the maximum amounts of indebtedness permitted by our credit agreement covenants, we are notrestricted in the amount of additional recourse debt we are able to incur in connection with the financing of ourdevelopment activities, and we may in the future incur such indebtedness in order to decrease the amount ofequity we invest in these activities. Subject to certain covenants in our various bank credit agreements, we arealso not restricted in the amount of additional recourse debt CBRE Capital Markets may incur in connection withfunding loan originations for multi-family properties having prior purchase commitments by a governmentsponsored entity.
The deteriorating financial condition and/or results of operations of certain of our clients could adverselyaffect our business.
We could be adversely affected by the actions and deteriorating financial condition and results of operationsof certain of our clients if that led to losses or defaults by one or more of them, which in turn, could have amaterial adverse effect on our results of operations and financial condition.
Any of our clients may experience a downturn in its business that may weaken its results of operations andfinancial condition. As a result, a client may fail to make payments when due, become insolvent or declarebankruptcy. Any client bankruptcy or insolvency, or the failure of any client to make payments when due, couldresult in material losses to our company. A client bankruptcy would delay or preclude full collection of amountsowed to us. Additionally, certain corporate services and property management client agreements require that weadvance payroll and other vendor costs on behalf of clients. If such a client were to file bankruptcy or otherwisefail, we may not be able to obtain reimbursement for those costs or for the severance obligations we would incuras a result of the loss of the client.
Our goodwill and other intangible assets could become further impaired, which may require us to takesignificant non-cash charges against earnings.
Under current accounting guidelines, we must assess, at least annually and potentially more frequently,whether the value of our goodwill and other intangible assets has been impaired. Any impairment of goodwill or
13
other intangible assets as a result of such analysis would result in a non-cash charge against earnings, whichcharge could materially adversely affect our reported results of operations and our stock price. For example, dueto the severe market downturn and credit crisis, we determined in December 2008 that the negative impact of theglobal economic slowdown and resulting decline in our stock price represented an adverse change in our businessclimate, requiring us to undertake an interim evaluation of our goodwill and other intangible assets forimpairment. As a result and as described in the Financial Statements included in this Annual Report, we incurredcharges of $1.2 billion in connection with the impairment of goodwill and other non-amortizable intangibleassets during the year ended December 31, 2008. A significant and sustained decline in our future cash flows, asignificant adverse change in the economic environment, slower growth rates or if our stock price falls below ournet book value per share for a sustained period, all could result in the need to perform additional impairmentanalysis in future periods. If we were to conclude that a future write-down of goodwill or other intangible assetsis necessary, then we would record such additional charges, which could materially adversely affect our results ofoperations.
Our success depends upon the retention of our senior management, as well as our ability to attract andretain qualified and experienced employees (including those acquired through acquisitions).
Our continued success is highly dependent upon the efforts of our executive officers and other keyemployees, including Brett White, our Chief Executive Officer. Mr. White and certain other key employees arenot parties to employment agreements with us. We also are highly dependent upon the retention of our propertysales and leasing professionals, who generate a significant majority of our revenues, as well as other revenueproducing professionals. The departure of any of our key employees (including those acquired throughacquisitions), or the loss of a significant number of key revenue producers, if we are unable to quickly hire andintegrate qualified replacements, could cause our business, financial condition and results of operations to suffer.In addition, the growth of our business is largely dependent upon our ability to attract and retain qualified supportpersonnel in all areas of our business, including brokerage and property management personnel. Competition forthese personnel is intense and we may not be able to successfully recruit, integrate or retain sufficiently qualifiedpersonnel. We use equity incentives to help retain and incentivize our key personnel. Any significant decline in,or failure to grow, our stock price may result in an increased risk of loss of these key personnel. If we are unableto attract and retain these qualified personnel, our growth may be limited and our business and operating resultscould suffer.
Our international operations subject us to social, political and economic risks of doing business inforeign countries.
We conduct a significant portion of our business and employ a substantial number of people outside of theUnited States and as a result, we are subject to risks associated with doing business globally. During 2010, wegenerated approximately 40% of our revenue from operations outside the United States. Additionalcircumstances and developments related to international operations that could negatively affect our business,financial condition or results of operations include, but are not limited to, the following factors:
• difficulties and costs of staffing and managing international operations among diverse geographies,languages and cultures;
• currency restrictions, transfer pricing regulations and adverse tax consequences, which may impact ourability to transfer capital and profits to the United States;
• arbitrary adverse changes in regulatory or tax requirements;
• the responsibility of complying with multiple and potentially conflicting laws, e.g., with respect tocorrupt practices, employment and licensing;
• the impact of regional or country-specific business cycles and economic instability;
• greater difficulty in collecting accounts receivable in some geographic regions such as Asia, wheremany countries have underdeveloped insolvency laws;
• a tendency for clients to delay payments in some European and Asian countries;
14
• political and economic instability in certain countries; and
• foreign ownership restrictions with respect to operations in countries such as China.
Although we maintain an anti-corruption compliance program throughout the company, violations of ourcompliance program may result in criminal or civil sanctions, including material monetary fines, penalties,equitable remedies (including disgorgement), and other costs against us or our employees, and may have amaterial adverse effect on our reputation and business.
We have committed additional resources to expand our worldwide sales and marketing activities, toglobalize our service offerings and products in selected markets and to develop local sales and support channels.If we are unable to successfully implement these plans, maintain adequate long-term strategies that successfullymanage the risks associated with our global business or adequately manage operational fluctuations, ourbusiness, financial condition or results of operations could be harmed.
Our revenue and earnings may be adversely affected by foreign currency fluctuations.
Our revenue from non-U.S. operations is denominated primarily in the local currency where the associatedrevenue was earned. During 2010, approximately 40% of our revenue was transacted in foreign currencies, themajority of which included the Euro, the British pound sterling, the Canadian dollar, the Hong Kong dollar, theJapanese yen, the Singapore dollar, the Australian dollar and the Indian rupee. Fluctuations in foreign currencyexchange rates may result in corresponding fluctuations in our revenue and earnings.
Over time fluctuations in the value of the U.S. dollar relative to the other currencies in which we maygenerate earnings could adversely affect our business, financial condition and operating results. Due to theconstantly changing currency exposures to which we are subject and the volatility of currency exchange rates, wecannot predict the effect of exchange rate fluctuations upon future operating results. In addition, fluctuations incurrencies relative to the U.S. dollar may make it more difficult to perform period-to-period comparisons of ourreported results of operations.
From time to time, our management uses currency hedging instruments, including foreign currency forwardand option contracts and borrows in foreign currencies. Economic risks associated with these hedginginstruments include unexpected fluctuations in inflation rates, which impact cash flow and unexpected changes inthe underlying net asset position.
Our growth has benefited significantly from acquisitions, which may not be available in the future orperform as expected.
A significant component of our growth has occurred through acquisitions, including our acquisition of theTrammell Crow Company in December 2006. We have also entered into definitive agreements to acquire INGREIM’s operations in Europe and Asia and its CRES business in the United States, as well as certain related co-investments. Any future growth through acquisitions will be partially dependent upon the continued availabilityof suitable acquisition candidates at favorable prices and upon advantageous terms and conditions, which maynot be available to us, as well as sufficient liquidity and credit to fund these acquisitions. We may incursignificant additional debt from time to time to finance any such acquisitions, subject to the restrictions containedin the documents governing our then-existing indebtedness. If we incur additional debt, the risks associated withour leverage, including our ability to service our then-existing debt, would increase. In addition, acquisitionsinvolve risks that business judgments concerning the value, strengths and weaknesses of businesses acquired willprove incorrect. Future acquisitions and any necessary related financings also may involve significanttransaction-related expenses, which include severance, lease termination, transaction, deferred financing andmerger-related costs, among others.
We have had, and may continue to experience, difficulties in integrating operations and accounting systemsacquired from other companies. These challenges include the diversion of management’s attention from otherbusiness concerns and the potential loss of our key employees or those of the acquired operations. Theintegration process itself may be disruptive to our business as it requires coordination of geographically diverseorganizations and implementation of new accounting and information technology systems. We believe that mostacquisitions will initially have an adverse impact on operating and net income. Acquisitions also frequently
15
involve significant costs related to integrating information technology, accounting and management services andrationalizing personnel levels. As with prior material transactions, we expect to incur significant integrationexpenses associated with the expected REIM Acquisitions in 2011 and beyond.
If the properties that we manage fail to perform, then our financial condition and results of operationscould be harmed.
The revenue we generate from our asset services line of business is generally a percentage of aggregate rentcollections from properties, although many management agreements provide for a specified minimummanagement fee. Accordingly, our success partially depends upon the performance of the properties we manage.The performance of these properties will depend upon the following factors, among others, many of which arepartially or completely outside of our control:
• the real estate markets and financial conditions prevailing generally and in the areas in which theseproperties are located;
• our ability to attract and retain creditworthy tenants;
• the magnitude of defaults by tenants under their respective leases;
• our ability to control operating expenses; and
• governmental regulations, local rent control or stabilization ordinances which are in, or may be put into,effect
Our real estate investment and co-investment activities subject us to real estate investment risks whichcould cause fluctuations in earnings and cash flow.
An important part of the strategy for our Global Investment Management business involves investing ourcapital in certain real estate investments with our clients and there is an inherent risk of loss of our investments.As of December 31, 2010, we had committed $11.5 million to fund future co-investments, all of which isexpected to be funded during 2011. In addition to required future capital contributions, some of theco-investment entities may request additional capital from us and our subsidiaries holding investments in thoseassets. The failure to provide these contributions could have adverse consequences to our interests in theseinvestments, including damage to our reputation with our co-investment partners and clients, as well as thenecessity of obtaining alternative funding from other sources that may be on disadvantageous terms for us andthe other co-investors. Participating as a co-investor is a very important part of our Global InvestmentManagement business, which would suffer if we were unable to make these investments. Although our debtinstruments contain restrictions that limit our ability to provide capital to the entities holding direct or indirectinterests in co-investments, we may provide this capital in many instances.
Selective investment in real estate projects is an important part of our Development Services businessstrategy and there is an inherent risk of loss of our investment. As of December 31, 2010, we had approximately50 consolidated real estate projects with invested equity of $30.9 million and $3.7 million of notes payable onreal estate that are recourse to us (in addition to being recourse to the single-purpose entity that holds the realestate asset and is the primary obligor on the note payable). In addition, at December 31, 2010, we were involvedas a principal (in most cases, co-investing with our clients) in approximately 45 unconsolidated real estatesubsidiaries with invested equity of $31.2 million and had committed additional capital to these unconsolidatedsubsidiaries of $22.0 million. We also guaranteed notes payable of these unconsolidated subsidiaries of $1.7million, excluding guarantees for which we have outstanding liabilities accrued on our consolidated balancesheet.
During the ordinary course of our Development Services business, we provide numerous completion andbudget guarantees requiring us to complete the relevant project within a specified timeframe and/or within aspecified budget, with us potentially being liable for costs to complete in excess of such timeframe or budget.While we generally have “guaranteed maximum price” contracts with reputable general contractors with respectto projects for which we provide these guarantees (which are intended to pass most of the risk to suchcontractors), there can be no assurance that we will not have to perform under any such guarantees. If we are
16
required to perform under a significant number of such guarantees, it could harm our business, results ofoperations and financial condition.
Because the disposition of a single significant investment can impact our financial performance in anyperiod, our real estate investment activities could increase fluctuations in our net earnings and cash flow. In manycases, we have limited control over the timing of the disposition of these investments and the recognition of anyrelated gain or loss, or incentive participation fee.
Poor performance of the investment programs that our Global Investment Management businessmanages would cause a decline in our revenue, net income and cash flow and could adversely affect ourability to raise capital for future programs.
In the event that any of the investment programs that our Global Investment Management business manageswere to perform poorly, our revenue, net income and cash flow could decline because the value of the assets wemanage would decrease, which would result in a reduction in some of our management fees, and our investmentreturns would decrease, resulting in a reduction in the incentive compensation we earn. Moreover, we couldexperience losses on co-investments of our own capital in such programs as a result of poor performance.Investors and potential investors in our programs continually assess our performance, and our ability to raisecapital for existing and future programs and maintain our current fee structure will depend on our continuedsatisfactory performance.
We are subject to substantial litigation risks and may face significant liabilities and damage to ourprofessional reputation as a result of litigation allegations and negative publicity.
The investment decisions we make in our Global Investment Management business and the activities of ourinvestment professionals on behalf of our clients may subject them and us to the risk of third-party litigationarising from investor dissatisfaction with the performance of our programs and a variety of other litigationclaims, including allegations that we improperly exercised judgment, discretion, control or influence over clientinvestments or that we breached fiduciary duties to clients.
To the extent investors in our programs suffer losses resulting from fraud, gross negligence, willfulmisconduct or other similar misconduct, investors may have remedies against us, our investment programs orfunds or our employees under the federal securities law and state law. Moreover, we are exposed to risks oflitigation or investigation by investors and regulators relating to allegations of our having engaged in transactionsinvolving conflicts of interest that were not properly addressed.
We depend on our business relationships and our reputation for integrity and high-caliber professionalservices to attract and retain clients across our overall business, as well as investors for our Global InvestmentManagement business. As a result, allegations by private litigants or regulators of improper conduct by us,whether the ultimate outcome is favorable or unfavorable to us, as well as negative publicity and pressspeculation about us or our investment activities, whether or not valid, may harm our reputation and damage ourbusiness prospects both in our Global Investment Management business and our other global businesses. Inaddition, if any lawsuits were brought against us and resulted in a finding of substantial legal liability, it couldmaterially, adversely affect our business, financial condition or results of operations or cause significantreputational harm to us, which could materially impact our business.
Our joint venture activities involve unique risks that are often outside of our control which, if realized,could harm our business.
We have utilized joint ventures for commercial investments and local brokerage and other affiliations bothin the United States and internationally, and although we currently have no specific plans to do so, we mayacquire minority interests in other joint ventures in the future. In many of these joint ventures, we may not havethe right or power to direct the management and policies of the joint ventures and other participants may takeaction contrary to our instructions or requests and against our policies and objectives. In addition, the other
17
participants may become bankrupt or have economic or other business interests or goals that are inconsistent withours. If a joint venture participant acts contrary to our interest, it could harm our brand, business, results ofoperations and financial condition.
We have numerous significant competitors and potential future competitors, some of which may havegreater financial and operational resources than we do.
We compete across a variety of business disciplines within the commercial real estate services industry,including commercial property and corporate facilities management, tenant representation, property/agencyleasing, property sales, valuation, real estate investment management, commercial mortgage origination andservicing, capital markets (equity and debt) solutions, development services and proprietary research. Althoughwe are the largest commercial real estate services firm in the world in terms of 2010 revenue, our relativecompetitive position varies significantly across product and service categories and geographic areas. Dependingon the product or service, we face competition from other real estate service providers, including outsourcingcompanies that traditionally competed in limited portions of our facilities management business and haverecently expanded their offerings, in-house corporate real estate departments, developers, institutional lenders,insurance companies, investment banking firms, investment managers, and accounting and consulting firms,some of which may have greater financial resources than we do. In addition, future changes in laws could lead tothe entry of other competitors, such as financial institutions. Many of our competitors are local or regional firms.Although substantially smaller than us, some of these competitors are larger on a local or regional basis. We arealso subject to competition from other large national and multi-national firms that have similar servicecompetencies to ours. There has been a significant increase in recent years in real estate ownership by REITs,many of which self-manage most of their real estate assets. Continuation of this trend could shrink the asset baseavailable to be managed by third-party service providers and thereby decrease the demand for our services. Ingeneral, there can be no assurance that we will be able to compete effectively, to maintain current fee levels ormargins, or maintain or increase our market share.
A significant portion of our operations are concentrated in California and our business could be harmeddue to the ongoing economic downturn in the California real estate markets.
During 2010 and 2009, approximately 10% of our revenue was generated from transactions originating inCalifornia. As a result of the geographic concentration in California, the economic downturns in the Californiacommercial real estate market and particularly in the local economies in San Diego, Los Angeles and OrangeCounty could harm our results of operations and disproportionately affect our business as compared tocompetitors who have less or different geographic concentrations.
If we fail to maintain and protect our intellectual property, or infringe the intellectual property rights ofthird parties, our business could be harmed and we could incur financial penalties.
Our business depends, in part, on our ability to identify and protect proprietary information and otherintellectual property (such as our service marks, client lists and information, business methods and research).Existing laws, or the application of those laws, of some countries in which we operate may offer only limitedprotections for our intellectual property rights. We rely on a combination of trade secrets, confidentiality policies,non-disclosure and other contractual arrangements, and on patent, copyright and trademark laws to protect ourintellectual property rights. Our inability to detect unauthorized use or take appropriate or timely steps to enforceour rights may have an adverse effect on our business.
We cannot be sure that the intellectual property that we may use in the course of operating our business orthe services we offer to clients do not infringe on the rights of third parties, and we may have infringementclaims asserted against us or against our clients. These claims may harm our reputation, cost us money andprevent us from offering some services.
Confidential intellectual property is increasingly stored or carried on mobile devices, such as laptopcomputers, which makes inadvertent disclosure more of a risk in the event the mobile devices are lost or stolenand the information has not been adequately safeguarded or encrypted.
18
If we fail to comply with laws and regulations applicable to us in our role as a real estate broker,mortgage broker, property/facility manager or developer, we may incur significant financial penalties.
We are subject to numerous federal, state, local and non-U.S. laws and regulations specific to the serviceswe perform in our business, as well as laws of broader applicability, such as tax, securities and employment laws.Brokerage of real estate sales and leasing transactions and the provision of property management and valuationservices require us to maintain applicable licenses in each U.S. state and certain non-U.S. jurisdictions in whichwe perform these services. If we fail to maintain our licenses or conduct these activities without a license, orviolate any of the regulations covering our licenses, we may be required to pay fines (including treble damages incertain states) or return commissions received or have our licenses suspended or revoked. In addition, ourindirect wholly-owned subsidiary, CBRE Investors, is subject to laws and regulations as a registered investmentadvisor and compliance failures or regulatory action could adversely affect our business. As the size and scope ofcommercial real estate transactions have increased significantly during the past several years, both the difficultyof ensuring compliance with numerous licensing regimes and the possible loss resulting from non-compliancehave increased. Furthermore, the laws and regulations applicable to our business, both within and outside of theUnited States, also may change in ways that increase the costs of compliance or prevent us from providingcertain types of services in connection with certain transactions or clients.
We may have liabilities in connection with real estate brokerage and property management activities.
As a licensed real estate broker, we and our licensed employees are subject to regulatory due diligence,disclosure and standard-of-care obligations. Failure to fulfill these obligations could subject us or our employeesto litigation from parties who purchased, sold or leased properties that we or they brokered or managed. Wecould become subject to claims by participants in real estate sales, as well as building owners and companies forwhom we provide management services, alleging that we did not fulfill our regulatory and fiduciary obligations.
In addition, in our property management business, we hire and supervise third-party contractors to provideconstruction services for our managed properties. While our role is limited to that of an agent for the owner, wemay be subject to claims for construction defects or other similar actions. Adverse outcomes of real estatebrokerage or property management litigation could negatively impact our business, financial condition or resultsof operations.
We may be subject to environmental liability as a result of our role as a property or facility manager ordeveloper of real estate.
Various laws and regulations impose liability on real property owners or operators for the cost ofinvestigating, cleaning up or removing contamination caused by hazardous or toxic substances at a property. Inour role as a property or facility manager or developer, we could be held liable as an operator for such costs. Thisliability may be imposed without regard to the legality of the original actions and without regard to whether weknew of, or were responsible for, the presence of the hazardous or toxic substances. If we fail to discloseenvironmental issues, we could also be liable to a buyer or lessee of a property. If we incur any such liability, ourbusiness could suffer significantly as it could be difficult for us to develop or sell such properties, or borrowfunds using such properties as collateral. Additionally, liabilities incurred to comply with more stringent futureenvironmental requirements could adversely affect any or all of our lines of business.
Forward-Looking Statements
This Annual Report on Form 10-K includes forward-looking statements within the meaning of Section 27Aof the Securities Act of 1933 and Section 21E of the Securities Exchange Act of 1934. The words “anticipate,”“believe,” “could,” “should,” “propose,” “continue,” “estimate,” “expect,” “intend,” “may,” “plan,” “predict,”“project,” “will” and similar terms and phrases are used in this Annual Report on Form 10-K to identify forward-looking statements. These statements relate to analyses and other information based on forecasts of future resultsand estimates of amounts not yet determinable. These statements also relate to our future prospects,developments and business strategies.
19
These forward-looking statements are made based on our management’s expectations and beliefsconcerning future events affecting us and are subject to uncertainties and factors relating to our operations andbusiness environment, all of which are difficult to predict and many of which are beyond our control. Theseuncertainties and factors could cause our actual results to differ materially from those matters expressed in orimplied by these forward-looking statements.
The following factors are among those, but are not only those, that may cause actual results to differmaterially from the forward-looking statements:
• our ability to close the REIM Acquisitions;
• integration issues arising out of the REIM Acquisitions and other companies we may acquire;
• costs relating to the REIM Acquisitions and other businesses we may acquire;
• the sustainability of the recovery in our investment sales and leasing business from the recessionarylevels in 2008 and 2009;
• disruptions in general economic and business conditions, particularly in geographies where our businessmay be concentrated;
• volatility and disruption of the capital and credit markets, interest rate increases, the cost and availabilityof capital for investment in real estate, clients’ willingness to make real estate or long-term contractualcommitments and other factors impacting the value of real estate assets;
• continued high levels of, or increases in, unemployment and general slowdowns in commercial activity;
• the impairment or weakened financial condition of certain of our clients;
• client actions to restrain project spending and reduce outsourced staffing levels as well as the potentialloss of clients in our outsourcing business due to consolidation or bankruptcies;
• our ability to diversify our revenue model to offset cyclical economic trends in the commercial realestate industry;
• foreign currency fluctuations;
• our ability to attract new user and investor clients;
• our ability to retain major clients and renew related contracts;
• a reduction by companies in their reliance on outsourcing for their commercial real estate needs, whichwould impact our revenues and operating performance;
• trends in pricing for commercial real estate services;
• changes in tax laws in the United States or in other jurisdictions in which our business may beconcentrated that reduce or eliminate deductions or other tax benefits we receive;
• our ability to compete globally, or in specific geographic markets or business segments that are materialto us;
• our ability to manage fluctuations in net earnings and cash flow, which could result from poorperformance in our investment programs, including our participation as a principal in real estateinvestments;
• our ability to leverage our global services platform to maximize and sustain long-term cash flow;
• our exposure to liabilities in connection with real estate brokerage and property management activities;
• the ability of our Global Investment Management segment to realize values in investment fundssufficient to offset incentive compensation expense related thereto;
• liabilities under guarantees, or for construction defects, that we incur in our Development Servicesbusiness;
20
• the ability of CBRE Capital Markets to periodically amend, or replace, on satisfactory terms theagreements for its warehouse lines of credit;
• the effect of implementation of new accounting rules and standards; and
• the other factors described elsewhere in our current report on Form 10-K, included under the headings“Management’s Discussion and Analysis of Financial Condition and Results of Operations—CriticalAccounting Policies” and “Quantitative and Qualitative Disclosures About Market Risk.”
Forward-looking statements speak only as of the date the statements are made. You should not put unduereliance on any forward-looking statements. We assume no obligation to update forward-looking statements toreflect actual results, changes in assumptions or changes in other factors affecting forward-looking information,except to the extent required by applicable securities laws. If we do update one or more forward-lookingstatements, no inference should be drawn that we will make additional updates with respect to those or otherforward-looking statements. Additional information concerning these and other risks and uncertainties iscontained in our other periodic filings with the SEC.
Item 1B. Unresolved Staff Comments
Not applicable.
Item 2. Properties
We occupied the following offices, excluding affiliates, as of December 31, 2010:Location Sales Offices Corporate Offices Total
Americas . . . . . . . . . . . . . . . . . . . . . . . . . . . . . . . . . . . . . . . . . 151 2 153Europe, Middle East and Africa (EMEA) . . . . . . . . . . . . . . . . 86 1 87Asia Pacific . . . . . . . . . . . . . . . . . . . . . . . . . . . . . . . . . . . . . . . 79 1 80
Total . . . . . . . . . . . . . . . . . . . . . . . . . . . . . . . . . . . . . . . . . 316 4 320
Some of our offices that contain employees of our Global Investment Management or our DevelopmentServices segments also contain employees of our other business segments. Often, the employees of thesesegments occupy separate suites in the same building in order to operate the businesses independently withstandalone offices. We have provided above office totals by geographic region and not listed all of our GlobalInvestment Management and Development Services offices to avoid double counting.
In general, these leased offices are fully utilized. The most significant terms of the leasing arrangements forour offices are the length of the lease and the rent. Our leases have terms varying in duration. The rent payableunder our office leases varies significantly from location to location as a result of differences in prevailingcommercial real estate rates in different geographic locations. Our management believes that no single officelease is material to our business, results of operations or financial condition. In addition, we believe there isadequate alternative office space available at acceptable rental rates to meet our needs, although adversemovements in rental rates in some markets may negatively affect our profits in those markets when we enter intonew leases. We do not own any offices, which is consistent with our strategy to lease instead of own.
Item 3. Legal Proceedings
We are a party to a number of pending or threatened lawsuits arising out of, or incident to, our ordinarycourse of business. Our management believes that any liability imposed on us that may result from disposition ofthese lawsuits will not have a material effect on our business, consolidated financial position, cash flows orresults of operations.
We have concluded our previously disclosed internal investigation relating to activities by some of ouremployees in certain of our offices in China that raised issues with respect to the U.S. Foreign Corrupt PracticesAct. The U.S. Department of Justice and the U.S. Securities and Exchange Commission have also closed theirreview of such matters without any action.
Item 4. Reserved
21
PART II
Item 5. Market for Registrant’s Common Equity, Related Stockholder Matters and Issuer Purchases ofEquity Securities
Stock Price Information
Our Class A common stock has traded on the New York Stock Exchange under the symbol “CBG” sinceJune 10, 2004. The applicable high and low prices of our Class A common stock for the last two fiscal years, asreported by the New York Stock Exchange, are set forth below for the periods indicated.
Price Range
Fiscal Year 2010 High Low
Quarter ending March 31, 2010 . . . . . . . . . . . . . . . . . . . . . . . . . . . . . . . . . . . . . . . . . . . . . . . . . . . . . . . $16.22 $12.05Quarter ending June 30, 2010 . . . . . . . . . . . . . . . . . . . . . . . . . . . . . . . . . . . . . . . . . . . . . . . . . . . . . . . . . $17.98 $13.52Quarter ending September 30, 2010 . . . . . . . . . . . . . . . . . . . . . . . . . . . . . . . . . . . . . . . . . . . . . . . . . . . . $19.00 $12.81Quarter ending December 31, 2010 . . . . . . . . . . . . . . . . . . . . . . . . . . . . . . . . . . . . . . . . . . . . . . . . . . . . $21.53 $17.14Fiscal Year 2009
Quarter ending March 31, 2009 . . . . . . . . . . . . . . . . . . . . . . . . . . . . . . . . . . . . . . . . . . . . . . . . . . . . . . . $ 5.40 $ 2.34Quarter ending June 30, 2009 . . . . . . . . . . . . . . . . . . . . . . . . . . . . . . . . . . . . . . . . . . . . . . . . . . . . . . . . . $ 9.87 $ 3.75Quarter ending September 30, 2009 . . . . . . . . . . . . . . . . . . . . . . . . . . . . . . . . . . . . . . . . . . . . . . . . . . . . $13.14 $ 7.61Quarter ending December 31, 2009 . . . . . . . . . . . . . . . . . . . . . . . . . . . . . . . . . . . . . . . . . . . . . . . . . . . . $14.14 $ 9.98
The closing share price for our Class A common stock on December 31, 2010, as reported by the New YorkStock Exchange, was $20.48. As of February 11, 2011, there were 335 stockholders of record of our Class Acommon stock.
Dividend Policy
We have not declared or paid any cash dividends on any class of our common stock since our inception onFebruary 20, 2001, and we do not anticipate declaring or paying any cash dividends on our common stock for theforeseeable future. We currently intend to retain any future earnings to reduce debt and finance future growth.Any future determination to pay cash dividends will be at the discretion of our board of directors and will dependon our financial condition, results of operations, capital requirements and other factors that the board of directorsdeems relevant. In addition, our ability to declare and pay cash dividends is restricted by the credit agreementgoverning our revolving credit facility and senior secured term loan facilities.
Recent Sales of Unregistered Securities
None.
Equity Compensation Plan Information
The following table summarizes information about our equity compensation plans as of December 31, 2010.All outstanding awards relate to our Class A common stock.
Plan category
Number of Securitiesto be Issued upon
Exercise ofOutstanding Options,
Warrants andRights
(a)
Weighted-averageExercise Price of
OutstandingOptions,
Warrants andRights
(b)
Number of SecuritiesRemaining Available forFuture Issuance under
Equity Compensation Plans(Excluding Securities
Reflected in Column (a)) (2)(c)
Equity compensation plans approved by securityholders (1) . . . . . . . . . . . . . . . . . . . . . . . . . . . . . 8,601,091 $5.83 5,183,250
Equity compensation plans not approved bysecurity holders . . . . . . . . . . . . . . . . . . . . . . . . . — — —
Total . . . . . . . . . . . . . . . . . . . . . . . . . . . . . . . . . . . 8,601,091 $5.83 5,183,250
22
(1) Consists of stock options and restricted stock units in our Second Amended and Restated 2004 Stock IncentivePlan (the “2004 Stock Incentive Plan”) and our 2001 Stock Incentive Plan (no further awards may be issued underour 2001 Stock Incentive Plan, which was terminated in June 2004 in connection with the adoption of the 2004Stock Incentive Plan). Includes 1,964,611 restricted stock units, the majority of which vest in 2015 and 2016 andare exercisable for no consideration. Excluding these restricted stock units, the weighted average exercise price ofoutstanding options, warrants and rights increases to $7.55.
(2) Under the 2004 Stock Incentive Plan, we may issue stock awards, including but not limited to restricted stockbonuses and restricted stock units, as those terms are defined in the 2004 Stock Incentive Plan. For awards grantedprior to June 2, 2008 under this plan, each stock award other than a stock option or stock appreciation right,reduced the number of shares reserved for issuance under the 2004 Stock Incentive Plan by 2.25. For awardsgranted on or after June 2, 2008 under this plan, this share reserve is reduced by one share upon grant of eachaward.
Issuer Purchases of Equity Securities
None.
Stock Performance Graph
The following graph shows our cumulative total stockholder return for the period beginning December 31,2005 and ending on December 31, 2010. The graph also shows the cumulative total returns of the Standard &Poor’s 500 Stock Index, or S&P 500 Index, in which we are included, and an industry peer group.
The comparison below assumes $100 was invested on December 31, 2005 in our Class A common stock andin each of the indices shown and assumes that all dividends were reinvested. Our stock price performance shownin the following graph is not indicative of future stock price performance. The peer group is comprised of thefollowing publicly traded commercial real estate services companies: Grubb & Ellis Company and Jones LangLaSalle Incorporated. These two companies represent our primary competitors that are publicly traded withbusiness lines reasonably comparable to ours.
23
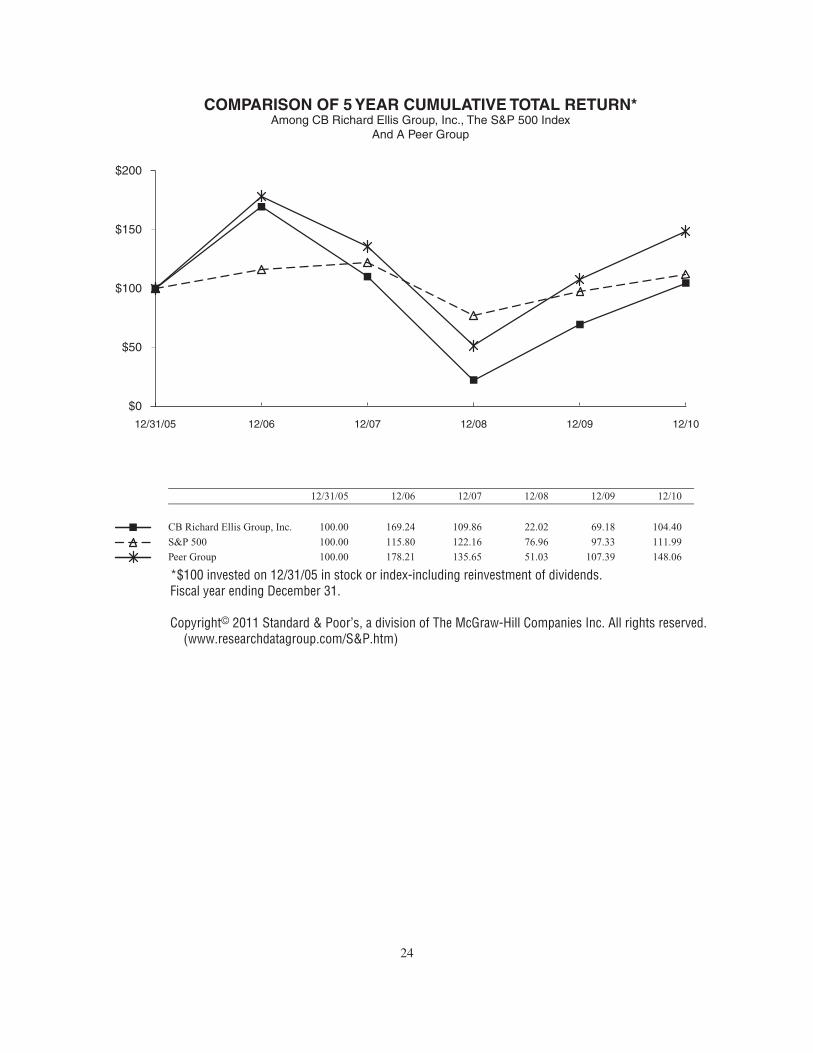
$0
$50
$100
$150
$200
12/31/05 12/06 12/07 12/1012/0912/08
Among CB Richard Ellis Group, Inc., The S&P 500 IndexAnd A Peer Group
COMPARISON OF 5 YEAR CUMULATIVE TOTAL RETURN*
12/31/05 12/06 12/07 12/08 12/1012/09
CB Richard Ellis Group, Inc. 100.00
100.00
100.00
22.02
111.9997.3376.96122.16115.80S&P 500
148.06107.3951.03135.65178.21Peer Group
169.24 109.86 69.18 104.40
*$100 invested on 12/31/05 in stock or index-including reinvestment of dividends.Fiscal year ending December 31.
Copyright© 2011 Standard & Poor’s, a division of The McGraw-Hill Companies Inc. All rights reserved.(www.researchdatagroup.com/S&P.htm)
24
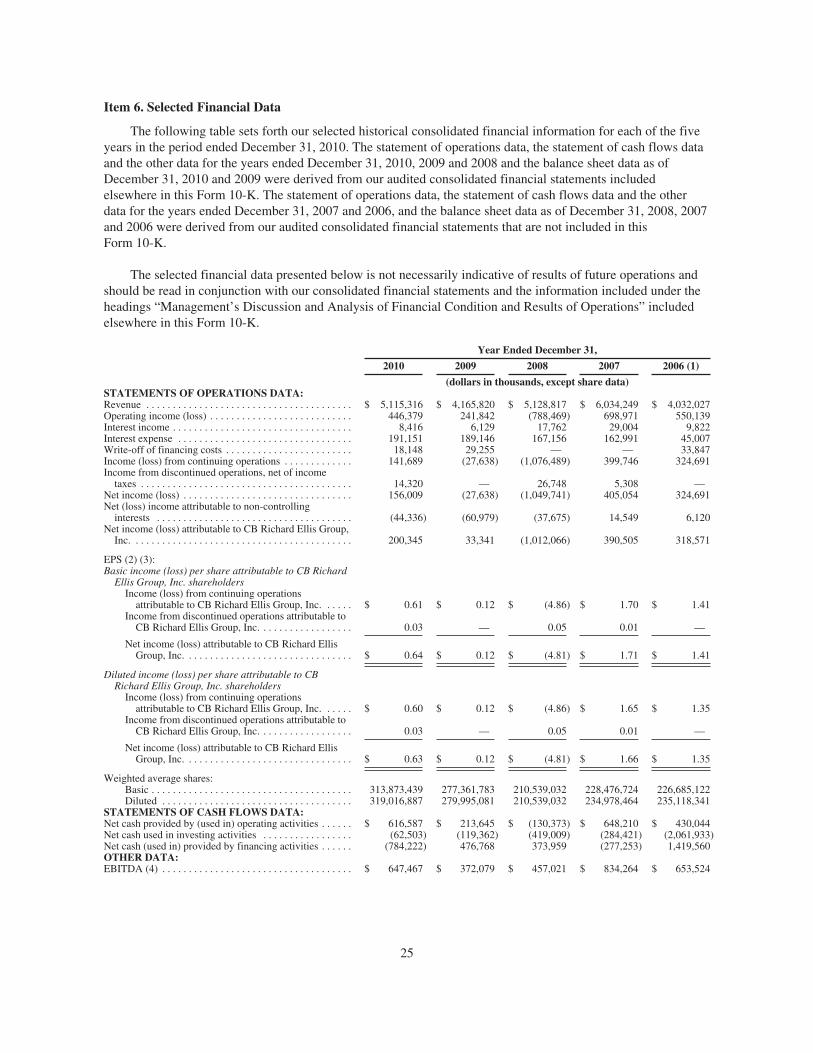
Item 6. Selected Financial Data
The following table sets forth our selected historical consolidated financial information for each of the fiveyears in the period ended December 31, 2010. The statement of operations data, the statement of cash flows dataand the other data for the years ended December 31, 2010, 2009 and 2008 and the balance sheet data as ofDecember 31, 2010 and 2009 were derived from our audited consolidated financial statements includedelsewhere in this Form 10-K. The statement of operations data, the statement of cash flows data and the otherdata for the years ended December 31, 2007 and 2006, and the balance sheet data as of December 31, 2008, 2007and 2006 were derived from our audited consolidated financial statements that are not included in thisForm 10-K.
The selected financial data presented below is not necessarily indicative of results of future operations andshould be read in conjunction with our consolidated financial statements and the information included under theheadings “Management’s Discussion and Analysis of Financial Condition and Results of Operations” includedelsewhere in this Form 10-K.
Year Ended December 31,
2010 2009 2008 2007 2006 (1)
(dollars in thousands, except share data)STATEMENTS OF OPERATIONS DATA:Revenue . . . . . . . . . . . . . . . . . . . . . . . . . . . . . . . . . . . . . . . $ 5,115,316 $ 4,165,820 $ 5,128,817 $ 6,034,249 $ 4,032,027Operating income (loss) . . . . . . . . . . . . . . . . . . . . . . . . . . . 446,379 241,842 (788,469) 698,971 550,139Interest income . . . . . . . . . . . . . . . . . . . . . . . . . . . . . . . . . . 8,416 6,129 17,762 29,004 9,822Interest expense . . . . . . . . . . . . . . . . . . . . . . . . . . . . . . . . . 191,151 189,146 167,156 162,991 45,007Write-off of financing costs . . . . . . . . . . . . . . . . . . . . . . . . 18,148 29,255 — — 33,847Income (loss) from continuing operations . . . . . . . . . . . . . 141,689 (27,638) (1,076,489) 399,746 324,691Income from discontinued operations, net of income
taxes . . . . . . . . . . . . . . . . . . . . . . . . . . . . . . . . . . . . . . . . 14,320 — 26,748 5,308 —Net income (loss) . . . . . . . . . . . . . . . . . . . . . . . . . . . . . . . . 156,009 (27,638) (1,049,741) 405,054 324,691Net (loss) income attributable to non-controlling
interests . . . . . . . . . . . . . . . . . . . . . . . . . . . . . . . . . . . . . (44,336) (60,979) (37,675) 14,549 6,120Net income (loss) attributable to CB Richard Ellis Group,
Inc. . . . . . . . . . . . . . . . . . . . . . . . . . . . . . . . . . . . . . . . . . 200,345 33,341 (1,012,066) 390,505 318,571
EPS (2) (3):Basic income (loss) per share attributable to CB Richard
Ellis Group, Inc. shareholdersIncome (loss) from continuing operations
attributable to CB Richard Ellis Group, Inc. . . . . . $ 0.61 $ 0.12 $ (4.86) $ 1.70 $ 1.41Income from discontinued operations attributable to
CB Richard Ellis Group, Inc. . . . . . . . . . . . . . . . . . 0.03 — 0.05 0.01 —
Net income (loss) attributable to CB Richard EllisGroup, Inc. . . . . . . . . . . . . . . . . . . . . . . . . . . . . . . . $ 0.64 $ 0.12 $ (4.81) $ 1.71 $ 1.41
Diluted income (loss) per share attributable to CBRichard Ellis Group, Inc. shareholders
Income (loss) from continuing operationsattributable to CB Richard Ellis Group, Inc. . . . . . $ 0.60 $ 0.12 $ (4.86) $ 1.65 $ 1.35
Income from discontinued operations attributable toCB Richard Ellis Group, Inc. . . . . . . . . . . . . . . . . . 0.03 — 0.05 0.01 —
Net income (loss) attributable to CB Richard EllisGroup, Inc. . . . . . . . . . . . . . . . . . . . . . . . . . . . . . . . $ 0.63 $ 0.12 $ (4.81) $ 1.66 $ 1.35
Weighted average shares:Basic . . . . . . . . . . . . . . . . . . . . . . . . . . . . . . . . . . . . . . 313,873,439 277,361,783 210,539,032 228,476,724 226,685,122Diluted . . . . . . . . . . . . . . . . . . . . . . . . . . . . . . . . . . . . 319,016,887 279,995,081 210,539,032 234,978,464 235,118,341
STATEMENTS OF CASH FLOWS DATA:Net cash provided by (used in) operating activities . . . . . . $ 616,587 $ 213,645 $ (130,373) $ 648,210 $ 430,044Net cash used in investing activities . . . . . . . . . . . . . . . . . (62,503) (119,362) (419,009) (284,421) (2,061,933)Net cash (used in) provided by financing activities . . . . . . (784,222) 476,768 373,959 (277,253) 1,419,560OTHER DATA:EBITDA (4) . . . . . . . . . . . . . . . . . . . . . . . . . . . . . . . . . . . . $ 647,467 $ 372,079 $ 457,021 $ 834,264 $ 653,524
25
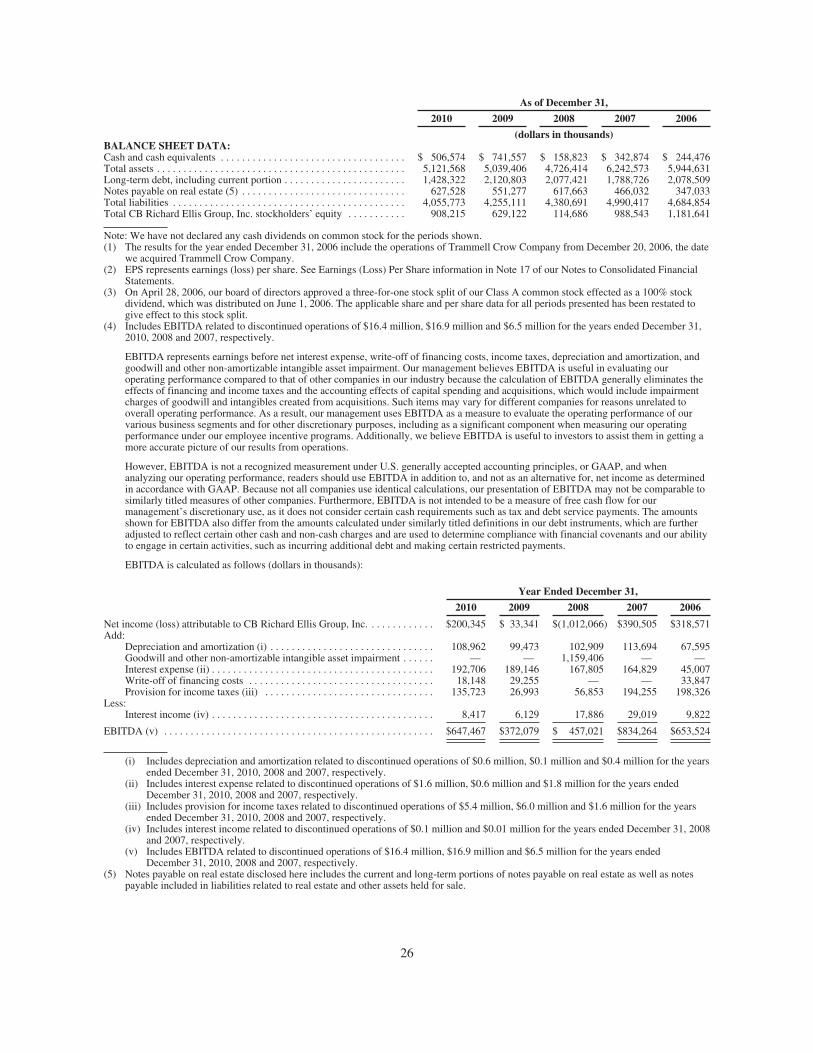
As of December 31,
2010 2009 2008 2007 2006
(dollars in thousands)BALANCE SHEET DATA:Cash and cash equivalents . . . . . . . . . . . . . . . . . . . . . . . . . . . . . . . . . . . $ 506,574 $ 741,557 $ 158,823 $ 342,874 $ 244,476Total assets . . . . . . . . . . . . . . . . . . . . . . . . . . . . . . . . . . . . . . . . . . . . . . . 5,121,568 5,039,406 4,726,414 6,242,573 5,944,631Long-term debt, including current portion . . . . . . . . . . . . . . . . . . . . . . . 1,428,322 2,120,803 2,077,421 1,788,726 2,078,509Notes payable on real estate (5) . . . . . . . . . . . . . . . . . . . . . . . . . . . . . . . 627,528 551,277 617,663 466,032 347,033Total liabilities . . . . . . . . . . . . . . . . . . . . . . . . . . . . . . . . . . . . . . . . . . . . 4,055,773 4,255,111 4,380,691 4,990,417 4,684,854Total CB Richard Ellis Group, Inc. stockholders’ equity . . . . . . . . . . . 908,215 629,122 114,686 988,543 1,181,641
Note: We have not declared any cash dividends on common stock for the periods shown.(1) The results for the year ended December 31, 2006 include the operations of Trammell Crow Company from December 20, 2006, the date
we acquired Trammell Crow Company.(2) EPS represents earnings (loss) per share. See Earnings (Loss) Per Share information in Note 17 of our Notes to Consolidated Financial
Statements.(3) On April 28, 2006, our board of directors approved a three-for-one stock split of our Class A common stock effected as a 100% stock
dividend, which was distributed on June 1, 2006. The applicable share and per share data for all periods presented has been restated togive effect to this stock split.
(4) Includes EBITDA related to discontinued operations of $16.4 million, $16.9 million and $6.5 million for the years ended December 31,2010, 2008 and 2007, respectively.
EBITDA represents earnings before net interest expense, write-off of financing costs, income taxes, depreciation and amortization, andgoodwill and other non-amortizable intangible asset impairment. Our management believes EBITDA is useful in evaluating ouroperating performance compared to that of other companies in our industry because the calculation of EBITDA generally eliminates theeffects of financing and income taxes and the accounting effects of capital spending and acquisitions, which would include impairmentcharges of goodwill and intangibles created from acquisitions. Such items may vary for different companies for reasons unrelated tooverall operating performance. As a result, our management uses EBITDA as a measure to evaluate the operating performance of ourvarious business segments and for other discretionary purposes, including as a significant component when measuring our operatingperformance under our employee incentive programs. Additionally, we believe EBITDA is useful to investors to assist them in getting amore accurate picture of our results from operations.
However, EBITDA is not a recognized measurement under U.S. generally accepted accounting principles, or GAAP, and whenanalyzing our operating performance, readers should use EBITDA in addition to, and not as an alternative for, net income as determinedin accordance with GAAP. Because not all companies use identical calculations, our presentation of EBITDA may not be comparable tosimilarly titled measures of other companies. Furthermore, EBITDA is not intended to be a measure of free cash flow for ourmanagement’s discretionary use, as it does not consider certain cash requirements such as tax and debt service payments. The amountsshown for EBITDA also differ from the amounts calculated under similarly titled definitions in our debt instruments, which are furtheradjusted to reflect certain other cash and non-cash charges and are used to determine compliance with financial covenants and our abilityto engage in certain activities, such as incurring additional debt and making certain restricted payments.
EBITDA is calculated as follows (dollars in thousands):
Year Ended December 31,
2010 2009 2008 2007 2006
Net income (loss) attributable to CB Richard Ellis Group, Inc. . . . . . . . . . . . . $200,345 $ 33,341 $(1,012,066) $390,505 $318,571Add:
Depreciation and amortization (i) . . . . . . . . . . . . . . . . . . . . . . . . . . . . . . . 108,962 99,473 102,909 113,694 67,595Goodwill and other non-amortizable intangible asset impairment . . . . . . — — 1,159,406 — —Interest expense (ii) . . . . . . . . . . . . . . . . . . . . . . . . . . . . . . . . . . . . . . . . . . 192,706 189,146 167,805 164,829 45,007Write-off of financing costs . . . . . . . . . . . . . . . . . . . . . . . . . . . . . . . . . . . 18,148 29,255 — — 33,847Provision for income taxes (iii) . . . . . . . . . . . . . . . . . . . . . . . . . . . . . . . . 135,723 26,993 56,853 194,255 198,326
Less:Interest income (iv) . . . . . . . . . . . . . . . . . . . . . . . . . . . . . . . . . . . . . . . . . . 8,417 6,129 17,886 29,019 9,822
EBITDA (v) . . . . . . . . . . . . . . . . . . . . . . . . . . . . . . . . . . . . . . . . . . . . . . . . . . . $647,467 $372,079 $ 457,021 $834,264 $653,524
(i) Includes depreciation and amortization related to discontinued operations of $0.6 million, $0.1 million and $0.4 million for the yearsended December 31, 2010, 2008 and 2007, respectively.
(ii) Includes interest expense related to discontinued operations of $1.6 million, $0.6 million and $1.8 million for the years endedDecember 31, 2010, 2008 and 2007, respectively.
(iii) Includes provision for income taxes related to discontinued operations of $5.4 million, $6.0 million and $1.6 million for the yearsended December 31, 2010, 2008 and 2007, respectively.
(iv) Includes interest income related to discontinued operations of $0.1 million and $0.01 million for the years ended December 31, 2008and 2007, respectively.
(v) Includes EBITDA related to discontinued operations of $16.4 million, $16.9 million and $6.5 million for the years endedDecember 31, 2010, 2008 and 2007, respectively.
(5) Notes payable on real estate disclosed here includes the current and long-term portions of notes payable on real estate as well as notespayable included in liabilities related to real estate and other assets held for sale.
26
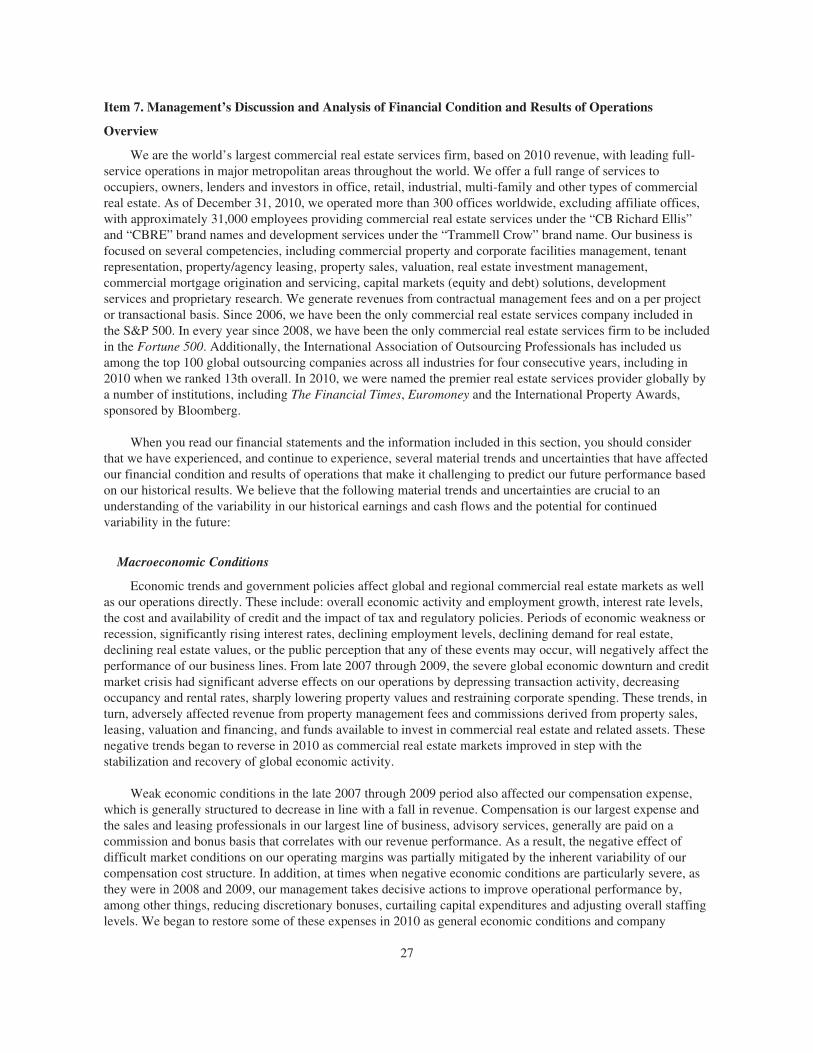
Item 7. Management’s Discussion and Analysis of Financial Condition and Results of Operations
Overview
We are the world’s largest commercial real estate services firm, based on 2010 revenue, with leading full-service operations in major metropolitan areas throughout the world. We offer a full range of services tooccupiers, owners, lenders and investors in office, retail, industrial, multi-family and other types of commercialreal estate. As of December 31, 2010, we operated more than 300 offices worldwide, excluding affiliate offices,with approximately 31,000 employees providing commercial real estate services under the “CB Richard Ellis”and “CBRE” brand names and development services under the “Trammell Crow” brand name. Our business isfocused on several competencies, including commercial property and corporate facilities management, tenantrepresentation, property/agency leasing, property sales, valuation, real estate investment management,commercial mortgage origination and servicing, capital markets (equity and debt) solutions, developmentservices and proprietary research. We generate revenues from contractual management fees and on a per projector transactional basis. Since 2006, we have been the only commercial real estate services company included inthe S&P 500. In every year since 2008, we have been the only commercial real estate services firm to be includedin the Fortune 500. Additionally, the International Association of Outsourcing Professionals has included usamong the top 100 global outsourcing companies across all industries for four consecutive years, including in2010 when we ranked 13th overall. In 2010, we were named the premier real estate services provider globally bya number of institutions, including The Financial Times, Euromoney and the International Property Awards,sponsored by Bloomberg.
When you read our financial statements and the information included in this section, you should considerthat we have experienced, and continue to experience, several material trends and uncertainties that have affectedour financial condition and results of operations that make it challenging to predict our future performance basedon our historical results. We believe that the following material trends and uncertainties are crucial to anunderstanding of the variability in our historical earnings and cash flows and the potential for continuedvariability in the future:
Macroeconomic Conditions
Economic trends and government policies affect global and regional commercial real estate markets as wellas our operations directly. These include: overall economic activity and employment growth, interest rate levels,the cost and availability of credit and the impact of tax and regulatory policies. Periods of economic weakness orrecession, significantly rising interest rates, declining employment levels, declining demand for real estate,declining real estate values, or the public perception that any of these events may occur, will negatively affect theperformance of our business lines. From late 2007 through 2009, the severe global economic downturn and creditmarket crisis had significant adverse effects on our operations by depressing transaction activity, decreasingoccupancy and rental rates, sharply lowering property values and restraining corporate spending. These trends, inturn, adversely affected revenue from property management fees and commissions derived from property sales,leasing, valuation and financing, and funds available to invest in commercial real estate and related assets. Thesenegative trends began to reverse in 2010 as commercial real estate markets improved in step with thestabilization and recovery of global economic activity.
Weak economic conditions in the late 2007 through 2009 period also affected our compensation expense,which is generally structured to decrease in line with a fall in revenue. Compensation is our largest expense andthe sales and leasing professionals in our largest line of business, advisory services, generally are paid on acommission and bonus basis that correlates with our revenue performance. As a result, the negative effect ofdifficult market conditions on our operating margins was partially mitigated by the inherent variability of ourcompensation cost structure. In addition, at times when negative economic conditions are particularly severe, asthey were in 2008 and 2009, our management takes decisive actions to improve operational performance by,among other things, reducing discretionary bonuses, curtailing capital expenditures and adjusting overall staffinglevels. We began to restore some of these expenses in 2010 as general economic conditions and company
27
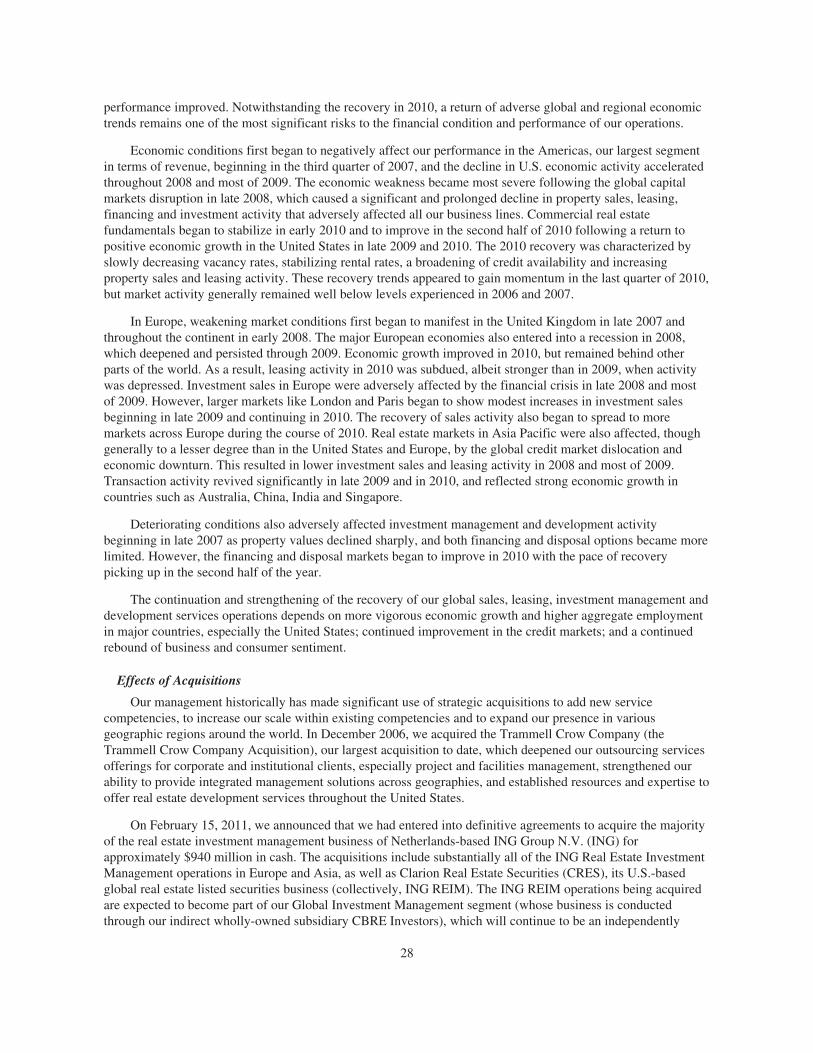
performance improved. Notwithstanding the recovery in 2010, a return of adverse global and regional economictrends remains one of the most significant risks to the financial condition and performance of our operations.
Economic conditions first began to negatively affect our performance in the Americas, our largest segmentin terms of revenue, beginning in the third quarter of 2007, and the decline in U.S. economic activity acceleratedthroughout 2008 and most of 2009. The economic weakness became most severe following the global capitalmarkets disruption in late 2008, which caused a significant and prolonged decline in property sales, leasing,financing and investment activity that adversely affected all our business lines. Commercial real estatefundamentals began to stabilize in early 2010 and to improve in the second half of 2010 following a return topositive economic growth in the United States in late 2009 and 2010. The 2010 recovery was characterized byslowly decreasing vacancy rates, stabilizing rental rates, a broadening of credit availability and increasingproperty sales and leasing activity. These recovery trends appeared to gain momentum in the last quarter of 2010,but market activity generally remained well below levels experienced in 2006 and 2007.
In Europe, weakening market conditions first began to manifest in the United Kingdom in late 2007 andthroughout the continent in early 2008. The major European economies also entered into a recession in 2008,which deepened and persisted through 2009. Economic growth improved in 2010, but remained behind otherparts of the world. As a result, leasing activity in 2010 was subdued, albeit stronger than in 2009, when activitywas depressed. Investment sales in Europe were adversely affected by the financial crisis in late 2008 and mostof 2009. However, larger markets like London and Paris began to show modest increases in investment salesbeginning in late 2009 and continuing in 2010. The recovery of sales activity also began to spread to moremarkets across Europe during the course of 2010. Real estate markets in Asia Pacific were also affected, thoughgenerally to a lesser degree than in the United States and Europe, by the global credit market dislocation andeconomic downturn. This resulted in lower investment sales and leasing activity in 2008 and most of 2009.Transaction activity revived significantly in late 2009 and in 2010, and reflected strong economic growth incountries such as Australia, China, India and Singapore.
Deteriorating conditions also adversely affected investment management and development activitybeginning in late 2007 as property values declined sharply, and both financing and disposal options became morelimited. However, the financing and disposal markets began to improve in 2010 with the pace of recoverypicking up in the second half of the year.
The continuation and strengthening of the recovery of our global sales, leasing, investment management anddevelopment services operations depends on more vigorous economic growth and higher aggregate employmentin major countries, especially the United States; continued improvement in the credit markets; and a continuedrebound of business and consumer sentiment.
Effects of Acquisitions
Our management historically has made significant use of strategic acquisitions to add new servicecompetencies, to increase our scale within existing competencies and to expand our presence in variousgeographic regions around the world. In December 2006, we acquired the Trammell Crow Company (theTrammell Crow Company Acquisition), our largest acquisition to date, which deepened our outsourcing servicesofferings for corporate and institutional clients, especially project and facilities management, strengthened ourability to provide integrated management solutions across geographies, and established resources and expertise tooffer real estate development services throughout the United States.
On February 15, 2011, we announced that we had entered into definitive agreements to acquire the majorityof the real estate investment management business of Netherlands-based ING Group N.V. (ING) forapproximately $940 million in cash. The acquisitions include substantially all of the ING Real Estate InvestmentManagement operations in Europe and Asia, as well as Clarion Real Estate Securities (CRES), its U.S.-basedglobal real estate listed securities business (collectively, ING REIM). The ING REIM operations being acquiredare expected to become part of our Global Investment Management segment (whose business is conductedthrough our indirect wholly-owned subsidiary CBRE Investors), which will continue to be an independently
28
operated business segment upon completion of the acquisitions. CBRE Investors has primarily focused on value-add funds and separate accounts. ING REIM has primarily focused on core funds and global listed real estatesecurities funds, except in Asia, where ING REIM manages value-add funds and opportunity funds. There isexpected to be little overlap in the companies’ client bases, with a majority of CBRE Investors’ clients beingU.S.-based and a majority of ING REIM’s clients based in Europe. We also expect to acquire approximately $55million of CRES co-investments from ING and potentially additional interests in other funds managed by INGREIM Europe and ING REIM Asia. In addition, we expect to incur transaction costs relating to the acquisitionsof approximately $150 million (pre-tax), including financing, retention and integration costs. These acquisitions,which we refer to as the REIM Acquisitions, are expected to close in the second half of 2011 and are subject toapproval by certain stakeholders, including regulatory agencies in the United States, Europe and Asia.
As of December 31, 2010, the assets under management, or AUM, in the ING REIM portfolio we areacquiring totaled approximately $59.8 billion. CBRE Investors’ assets under management totaled $37.6 billion asof December 31, 2010. ING REIM, when combined with our existing Global Investment Managementoperations, will provide us with a significantly enhanced ability to meet the needs of institutional investors acrossglobal markets with a full spectrum of investment programs and strategies.
AUM generally refers to the properties and other assets with respect to which we provide (or participate in)oversight, investment management services and other advice, and which generally consist of real estateproperties or loans, securities portfolios and investments in operating companies and joint ventures. Our AUM isintended principally to reflect the extent of our presence in the real estate market, not the basis for determiningour management fees. Our material assets under management consist of:
a) the total fair market value of the real estate properties and other assets either wholly-owned or held byjoint ventures and other entities in which our sponsored funds or investment vehicles and clientaccounts have invested or to which they have provided financing. Committed (but unfunded) capitalfrom investors in our sponsored funds is not included in this component of our AUM. The value ofdevelopment properties is included at estimated completion cost. In the case of real estate operatingcompanies, the total value of real properties controlled by the companies, generally through jointventures, is included in AUM; and
b) the net asset value of our managed securities portfolios, including investments (which may becomprised of committed but uncalled capital) in private real estate funds under our fund of fundsprogram.
Our calculation of AUM may differ from the calculations of other asset managers (including ING REIM, asdescribed below), and as a result this measure may not be comparable to similar measures presented by otherasset managers. Our definition of AUM is not based on any definition of assets under management that is setforth in the agreements governing the investment funds that we manage. The methodologies used by the INGREIM business units and CBRE Investors to determine their respective AUM are not the same and, accordingly,the reported AUM of ING REIM would be different if calculated using a methodology consistent with that ofCBRE Investors’ methodology. To the extent applicable, ING REIM’s reported AUM was converted from Eurosto U.S. dollars using an exchange rate of $1.3379 per €1.
Strategic in-fill acquisitions have also played a key role in expanding our geographic coverage andbroadening and strengthening our service offerings. From 2005 to 2008, we completed 58 in-fill acquisitions foran aggregate purchase price of approximately $592 million. In light of the recent economic environment, noacquisitions were completed in 2009 and 2010, with the exception of a small niche industrial practice in theUnited Kingdom that we acquired in the second quarter of 2010 and a small commercial property assetmanagement and consultancy services firm in Hong Kong that we acquired in the fourth quarter of 2010. Thecompanies we acquired have generally been quality regional firms or niche specialty firms that complement ourexisting platform within a region, or affiliates in which, in some cases, we held an equity interest. As marketconditions continue to improve, we believe acquisitions will once again serve as a growth engine, supplementingour organic growth.
29
Although our management believes that strategic acquisitions can significantly decrease the cost, time andcommitment of management resources necessary to attain a meaningful competitive position within targetedmarkets or to expand our presence within our current markets, our management also believes that mostacquisitions will initially have an adverse impact on our operating and net income, both as a result of transaction-related expenditures, which include severance, lease termination, transaction, deferred financing and merger-related costs, among others, and the charges and costs of integrating the acquired business and its financial andaccounting systems into our own. For example, we incurred $196.6 million of transaction-related expenditures inconnection with our acquisition of Trammell Crow Company in 2006 and $3.5 million of transaction-relatedexpenditures in connection with the expected REIM Acquisitions through December 31, 2010. In addition,through December 31, 2010, we have incurred expenses of $62.3 million related to Trammell Crow Company inconnection with the integration of its business lines, as well as accounting and other systems, into our own.During the year ended December 31, 2010, we incurred $3.8 million of integration expenses, most of which wererelated to the acquisition of Trammell Crow Company. As with prior material transactions, we expect to incursignificant integration expenses associated with the expected REIM Acquisitions in 2011 and beyond.
International Operations
We have made significant acquisitions of non-U.S. companies and we may acquire additional internationalcompanies in the future. As we increase our international operations through either acquisitions or organicgrowth, fluctuations in the value of the U.S. dollar relative to the other currencies in which we may generateearnings could adversely affect our business, financial condition and operating results. Our management teamgenerally seeks to mitigate our exposure by balancing assets and liabilities that are denominated in the samecurrency and by maintaining cash positions outside the United States only at levels necessary for operatingpurposes. In addition, from time to time we enter into foreign currency exchange contracts to mitigate ourexposure to exchange rate changes related to particular transactions and to hedge risks associated with thetranslation of foreign currencies into U.S. dollars. Due to the constantly changing currency exposures to whichwe are subject and the volatility of currency exchange rates, we cannot predict the effect of exchange ratefluctuations upon future operating results. In addition, fluctuations in currencies relative to the U.S. dollar maymake it more difficult to perform period-to-period comparisons of our reported results of operations.
Our international operations also are subject to, among other things, political instability and changingregulatory environments, which may adversely affect our future financial condition and results of operations. Ourmanagement routinely monitors these risks and related costs and evaluates the appropriate amount of resources toallocate towards business activities in foreign countries where such risks and costs are particularly significant.
Leverage
We are highly leveraged and have significant debt service obligations. As of December 31, 2010, our totaldebt, excluding our notes payable on real estate and warehouse lines of credit (both of which are generallynonrecourse to us), was approximately $1.4 billion. In connection with the REIM Acquisitions, we also expect toincur approximately $800 million of new term loans under our secured credit agreement to finance suchacquisitions. Our level of indebtedness and the operating and financial restrictions in our debt agreements placeconstraints on the operation of our business. Although our management believes that the incurrence of long-termindebtedness has been important in the development of our business, including facilitating our acquisition ofTrammell Crow Company, the cash flow necessary to service this debt is not available for other generalcorporate purposes, which may limit our flexibility in planning for, or reacting to, changes in our business and inthe commercial real estate services industry. Our management seeks to mitigate this exposure both through therefinancing of debt when available on attractive terms and through selective repayment and retirement ofindebtedness.
For example, on October 8, 2010, CB Richard Ellis Services, Inc., or CBRE, our wholly-owned subsidiary,issued $350.0 million in aggregate principal amount of 6.625% senior notes due October 15, 2020. Shortlythereafter, we repaid approximately $357.4 million of various tranches of our term A loans under our previouscredit agreement using net proceeds from the new $350.0 million senior notes as well as cash on hand. In
30
addition, on November 10, 2010, we entered into a new credit agreement that provided for the refinancing of$650.0 million in senior secured term loans, established a new $700.0 million revolving credit facility with anextended maturity date to 2015 and included an accordion provision, which provides the ability to borrow anadditional $800.0 million, which can be further expanded, subject to the satisfaction of customary conditions. Allof these actions give us increased flexibility and have significantly extended the weighted average maturity ofour outstanding debt.
Critical Accounting Policies
Our consolidated financial statements have been prepared in accordance with accounting principlesgenerally accepted in the United States, which require management to make estimates and assumptions thataffect reported amounts. The estimates and assumptions are based on historical experience and on other factorsthat management believes to be reasonable. Actual results may differ from those estimates. We believe that thefollowing critical accounting policies represent the areas where more significant judgments and estimates areused in the preparation of our consolidated financial statements:
Revenue Recognition
In order for us to recognize revenue, there are four basic criteria that must be met:
• existence of persuasive evidence that an arrangement exists;
• delivery has occurred or services have been rendered;
• the seller’s price to the buyer is fixed and determinable; and
• collectability is reasonably assured.
Our revenue recognition policies are consistent with these criteria. The judgments involved in revenuerecognition include understanding the complex terms of agreements and determining the appropriate time torecognize revenue for each transaction based on such terms. Each transaction is evaluated to determine: (i) atwhat point in time revenue is earned, (ii) whether contingencies exist that impact the timing of recognition ofrevenue and (iii) how and when such contingencies will be resolved. The timing of revenue recognition couldvary if different judgments were made. Our revenues subject to the most judgment are brokerage commissionrevenue and incentive-based management and development fees.
We record commission revenue on real estate sales generally upon close of escrow or transfer of title, exceptwhen future contingencies exist. Real estate commissions on leases are generally recorded in revenue when allobligations under the commission agreement are satisfied. Terms and conditions of a commission agreement mayinclude, but are not limited to, execution of a signed lease agreement and future contingencies including tenantoccupancy, payment of a deposit or payment of a first month’s rent (or a combination thereof). As some of theseconditions are outside of our control and are often not clearly defined, judgment must be exercised indetermining when such required events have occurred in order to recognize revenue.
A typical commission agreement provides that we earn a portion of a lease commission upon the executionof the lease agreement by the tenant and landlord, with the remaining portion(s) of the lease commission earnedat a later date, usually upon tenant occupancy or payment of rent. The existence of any significant futurecontingencies results in the delay of recognition of corresponding revenue until such contingencies are satisfied.For example, if we do not earn all or a portion of the lease commission until the tenant pays its first month’s rent,and the lease agreement provides the tenant with a free rent period, we delay revenue recognition until rent ispaid by the tenant.
Property management revenues are generally based upon percentages of the revenue or base rent generatedby the entities managed or the square footage managed. These fees are recognized when earned under theprovisions of the related management agreements.
31
Investment management fees are based predominantly upon a percentage of the equity deployed on behalfof our limited partners. Fees related to our indirect investment management programs are based upon apercentage of the fair value of those investments. These fees are recognized when earned under the provisions ofthe related investment management agreements. Our Global Investment Management segment also earnsperformance-based incentive fees with regard to many of its investments. Such revenue is recognized at the endof the measurement periods when the conditions of the applicable incentive fee arrangements have been satisfiedand following the expiration of any potential claw back provision. With many of these investments, our GlobalInvestment Management team has participation interests in such incentive fees, which are commonly referred toas carried interest. This carried interest expense is generally accrued for based upon the probability of suchperformance-based incentive fees being earned over the related vesting period. In addition, our GlobalInvestment Management segment also earns success-based transaction fees with regard to buying or sellingproperties on certain funds and separate accounts. Such revenue is recognized at the completion of a successfultransaction and is not subject to any claw back provision.
We earn incentive development fees in our Development Services segment. These fees are recognized whenquantitative criteria have been met (such as specified leasing or budget targets) or, for those incentive fees basedon qualitative criteria, upon approval of the fee by our clients. Certain incentive development fees allow us toshare in the fair value of the developed real estate asset above cost. This sharing creates additional revenuepotential to us with no exposure to loss other than opportunity cost. Our incentive development fee revenue is notrecognized to the extent that such revenue is subject to future performance contingencies, but rather once thecontingency has been resolved. The unique nature and complexity of each incentive fee requires us to usevarying levels of judgment in determining the timing of revenue recognition.
In establishing the appropriate provisions for trade receivables, we make assumptions with respect to futurecollectability. Our assumptions are based on an assessment of a customer’s credit quality as well as subjectivefactors and trends, including the aging of receivables balances. In addition to these assessments, in general,outstanding trade accounts receivable amounts that are more than 180 days overdue are evaluated forcollectability and fully provided for if deemed uncollectible. Historically, our credit losses have generally beeninsignificant. However, estimating losses requires significant judgment, and conditions may change or newinformation may become known after any periodic evaluation. As a result, actual credit losses may differ fromour estimates.
Principles of Consolidation
The accompanying consolidated financial statements include our accounts and those of our majority-ownedsubsidiaries, as well as variable interest entities, or VIEs, in which we are the primary beneficiary. The equityattributable to non-controlling interests in subsidiaries is shown separately in our consolidated balance sheetsincluded elsewhere in this filing. All significant intercompany accounts and transactions have been eliminated inconsolidation.
Variable Interest Entities
Our determination of the appropriate accounting method with respect to our VIEs, including co-investmentswith our clients, is based on Accounting Standards Update, or ASU, 2009-17, “Consolidations (Topic 810):Improvements to Financial Reporting by Enterprises Involved with Variable Interest Entities.” This ASUincorporates Statement of Financial Accounting Standards No. 167, “Amendments to FASB InterpretationNo. 46(R),” issued by the Financial Accounting Standards Board, or FASB, in June 2009. The amendments inthis ASU replace the quantitative-based risks and rewards calculation for determining which reporting entity, ifany, has a controlling financial interest in a variable interest entity with a primarily qualitative approach focusedon identifying which reporting entity has both (1) the power to direct the activities of a variable interest entitythat most significantly impact such entity’s economic performance and (2) the obligation to absorb losses or theright to receive benefits from such entity that could potentially be significant to such entity. The entity whichsatisfies these criteria is deemed to be the primary beneficiary of the VIE.
32
We determine if an entity is a VIE based on several factors, including whether the entity’s total equityinvestment at risk upon inception is sufficient to finance the entity’s activities without additional subordinatedfinancial support. We make judgments regarding the sufficiency of the equity at risk based first on a qualitativeanalysis, then a quantitative analysis, if necessary.
We analyze any investments in VIEs to determine if we are the primary beneficiary. We consider a varietyof factors in identifying the entity that holds the power to direct matters that most significantly impact the VIE’seconomic performance including, but not limited to, the ability to direct financing, leasing, construction andother operating decisions and activities. In addition, we also consider the rights of other investors to participate inpolicy making decisions, to replace the manager and to sell or liquidate the entity.
We also have several co-investments in real estate investment funds which qualify for a deferral of thenewer qualitative approach for analyzing potential VIEs. We continue to analyze these investments under theformer quantitative method incorporating various estimates, including estimated future cash flows, asset holdperiods and discount rates, as well as estimates of the probabilities of various scenarios occurring. If the entity isa VIE, we then determine whether we consolidate the entity as the primary beneficiary. This determination ofwhether we are the primary beneficiary includes any impact of an “upside economic interest” in the form of a“promote” that we may have. A promote is an interest built into the distribution structure of the entity based onthe entity’s achievement of certain return hurdles.
We consolidate any VIE of which we are the primary beneficiary (see Note 3 of the Notes to ConsolidatedFinancial Statements) and disclose significant VIEs of which we are not the primary beneficiary, if any. Wedetermine whether an entity is a VIE and, if so, whether it should be consolidated by utilizing judgments andestimates that are inherently subjective. If we made different judgments or utilized different estimates in theseevaluations, it could result in differing conclusions as to whether or not an entity is a VIE and whether or not toconsolidate such entity.
Limited Partnerships, Limited Liability Companies and Other Subsidiaries
If an entity is not a VIE, our determination of the appropriate accounting method with respect to ourinvestments in limited partnerships, limited liability companies and other subsidiaries is based on voting control.For our general partner interests, we are presumed to control (and therefore consolidate) the entity, unless theother limited partners have substantive rights that overcome this presumption of control. These substantive rightsallow the limited partners to participate in significant decisions made in the ordinary course of the entity’sbusiness. We account for our non-controlling general partner investments in these entities under the equitymethod. This treatment also applies to our managing member interests in limited liability companies.
Our investments in unconsolidated subsidiaries in which we have the ability to exercise significant influenceover operating and financial policies, but do not control, or entities which are variable interest entities in whichwe are not the primary beneficiary are accounted for under the equity method. Accordingly, our share of theearnings from these equity-method basis companies is included in consolidated net income. All other investmentsheld on a long-term basis are valued at cost less any impairment in value.
Our determination of the appropriate accounting treatment for an investment in a subsidiary requiresjudgment of several factors, including the size and nature of our ownership interest and the other owners’substantive rights to make decisions for the entity. If we were to make different judgments or conclusions as tothe level of our control or influence, it could result in a different accounting treatment. Accounting for aninvestment as either consolidated or using the equity method generally would have no impact on our net incomeor stockholders’ equity in any accounting period, but a different treatment would impact individual incomestatement and balance sheet items, as consolidation would effectively “gross up” our income statement andbalance sheet. If our evaluation of an investment accounted for using the cost method was different, it couldresult in our being required to account for an investment by consolidation or by the equity method. Under the
33
cost method, the investor only records its share of the underlying entity’s earnings to the extent that it receivesdividends from the investee; when the dividends received by the investor exceed the investor’s share of theinvestee’s earnings subsequent to the date of the investor’s investment, the investor records a reduction in thebasis of its investment. Under the cost method, the investor does not record its share of losses of the investee.Conversely, under either consolidation or equity method accounting, the investor effectively records its share ofthe underlying entity’s net income or loss, or its guarantees of the underlying entity’s debt.
Under either the equity or cost method, impairment losses are recognized upon evidence of other-than-temporary losses of value. When testing for impairment on investments that are not actively traded on a publicmarket, we generally use a discounted cash flow approach to estimate the fair value of our investments and/orlook to comparable activities in the marketplace. Management judgment is required in developing theassumptions for the discounted cash flow approach. These assumptions include net asset values, internal rates ofreturn, discount and capitalization rates, interest rates and financing terms, rental rates, timing of leasing activity,estimates of lease terms and related concessions, etc. When determining if impairment is other-than-temporary,we also look to the length of time and the extent to which fair value has been less than cost as well as thefinancial condition and near-term prospects of each investment.
Goodwill and Other Intangible Assets
Our acquisitions require the application of purchase accounting, which results in tangible and identifiableintangible assets and liabilities of the acquired entity being recorded at fair value. The difference between thepurchase price and the fair value of net assets acquired is recorded as goodwill. In determining the fair values ofassets and liabilities acquired in a business combination, we use a variety of valuation methods including presentvalue, depreciated replacement cost, market values (where available) and selling prices less costs to dispose. Weare responsible for determining the valuation of assets and liabilities and for the allocation of purchase price toassets acquired and liabilities assumed.
Assumptions must often be made in determining fair values, particularly where observable market values donot exist. Assumptions may include discount rates, growth rates, cost of capital, royalty rates, tax rates andremaining useful lives. These assumptions can have a significant impact on the value of identifiable assets andaccordingly can impact the value of goodwill recorded. Different assumptions could result in different valuesbeing attributed to assets and liabilities. Since these values impact the amount of annual depreciation andamortization expense, different assumptions could also impact our statement of operations and could impact theresults of future impairment reviews.
The majority of our goodwill balance has resulted from our acquisition of CBRE, in 2001, our acquisition ofInsignia Financial Group, Inc., or Insignia, in 2003 (the Insignia Acquisition) and from the Trammell CrowCompany Acquisition. Other intangible assets include a trademark, which was separately identified as a result ofthe 2001 acquisition, as well as a trade name separately identified as a result of the Insignia Acquisitionrepresenting the Richard Ellis trade name in the United Kingdom that was owned by Insignia prior to the InsigniaAcquisition. Both the trademark and the trade name are not being amortized and have indefinite estimated usefullives. The remaining other intangible assets primarily include customer relationships, management contracts,loan servicing rights and transition costs, which are all being amortized over estimated useful lives ranging up to20 years.
We are required to test goodwill and other intangible assets deemed to have indefinite useful lives forimpairment annually or more often if circumstances or events indicate a change in the impairment status. Thegoodwill impairment analysis is a two-step process. The first step used to identify potential impairment involvescomparing each reporting unit’s estimated fair value to its carrying value, including goodwill. We use adiscounted cash flow approach to estimate the fair value of our reporting units. Management judgment isrequired in developing the assumptions for the discounted cash flow model. These assumptions include revenuegrowth rates, profit margin percentages, discount rates, etc. If the estimated fair value of a reporting unit exceeds
34
its carrying value, goodwill is considered to not be impaired. If the carrying value exceeds estimated fair value,there is an indication of potential impairment and the second step is performed to measure the amount ofimpairment. The second step of the process involves the calculation of an implied fair value of goodwill for eachreporting unit for which step one indicated impairment. The implied fair value of goodwill is determined similarto how goodwill is calculated in a business combination, by measuring the excess of the estimated fair value ofthe reporting unit as calculated in step one, over the estimated fair values of the individual assets, liabilities andidentifiable intangibles as if the reporting unit was being acquired in a business combination. Due to the manyvariables inherent in the estimation of a business’s fair value and the relative size of our goodwill, if differentassumptions and estimates were used, it could have an adverse effect on our impairment analysis.
Our annual assessment of goodwill and other intangible assets deemed to have indefinite lives hashistorically been completed as of the beginning of the fourth quarter of each year. We performed the 2010, 2009,and 2008 annual assessments as of October 1. However, we were required to re-perform the 2008 assessment asof December 31, 2008 because economic conditions worsened, the capital markets became distressed and ourstock price dropped significantly in the fourth quarter of 2008. This was evidenced in our 2008 results by weaksales and leasing activity in our Americas and EMEA segments caused by the credit crunch and significantcapital market turmoil, which adversely affected incentive-based revenue within our Global InvestmentManagement segment as well as reduced real estate sales volume and values in our Development Servicessegment. Based on our assessments of goodwill in 2008, we determined that we had impairment in severalreporting units, which was driven by these adverse economic conditions causing a decline in the estimated futurediscounted cash flows expected for such units. The amount of the pre-tax goodwill impairment charges includedin our statement of operations for the year ended December 31, 2008 was $1.1 billion. We also determined thattwo of our intangible assets with indefinite useful lives, $84.0 million representing the Trammell Crow tradename identified in the Trammell Crow Company Acquisition and $6.9 million representing the CBRE Melodytrademark identified as a result of the 2001 acquisition, were also fully impaired. The impairment of theTrammell Crow trade name was driven by the adverse economic conditions causing a significant decline in theestimated future discounted cash flows of the Development Services segment such that we could not substantiatethis trade name having any book value. The impairment of the CBRE Melody trademark was driven by ourmortgage brokerage business’s plans to discontinue use of the Melody trademark and exclusively use the CBREtrademark. The amount of the pre-tax other non-amortizable intangible asset impairment charges included in ourstatement of operations for the year ended December 31, 2008 was $90.9 million.
When we performed our required annual goodwill impairment review as of October 1, 2010 and 2009, wedetermined that no impairment existed as the estimated fair value of our reporting units was in excess of theircarrying value. Although economic conditions remained weak for most of 2009 and our full year revenues for2009 declined when compared to 2008, we did note early signs of an economic recovery taking place in the latterpart of 2009, which continued throughout 2010. This was evidenced by several indicators, including our stockprice ($18.13 per share on October 1, 2010 and $10.94 per share on October 1, 2009 versus $4.32 per share atDecember 31, 2008), a return to positive economic growth in the United States in the second half of 2009 and aneconomic rebound in the Asia Pacific region with transaction activity beginning to revive in late 2009. Theseindicators, as well as the benefit of cost reduction measures implemented in the second half of 2008 and in 2009,led to a significant increase in the estimated fair value of the Company’s reporting units as of October 1, 2010and 2009 as compared to the estimated fair value at December 31, 2008. In addition, the overall size of ourgoodwill and other non-amortizable assets being tested were sharply reduced as a result of the $1.2 billionimpairment charge recorded during the year ended December 31, 2008. This impairment charge included thewrite-off of goodwill in its entirety in two reporting units that were most severely impacted by the weakeconomic conditions at that time (i.e. Global Investment Management and Development Services).
If we experience a significant or sustained decline in our future cash flows and/or if the current economicconditions significantly worsen, we may need to perform additional impairment analysis in the future.
35
Real Estate
As of December 31, 2010, the carrying value of our total real estate assets was $754.6 million (14.7% oftotal assets). The significant accounting policies and estimates with regard to our real estate assets relate toclassification and impairment evaluation, cost capitalization and allocation, disposition of real estate anddiscontinued operations.
Classification and Impairment Evaluation
With respect to our real estate assets, the “Property, Plant and Equipment,” Topic of FASB AccountingStandards Codification, or ASC, or Topic 360, establishes criteria to classify an asset as “held for sale.” Assetsincluded in real estate held for sale include only completed assets or land for sale in its present condition thatmeet all of Topic 360’s “held for sale” criteria. All other real estate assets are classified in one of the followingline items in our consolidated balance sheet: (i) real estate under development (current), which includes realestate that we are in the process of developing that is expected to be completed and disposed of within one yearof the balance sheet date; (ii) real estate under development (non-current), which includes real estate that we arein the process of developing that is expected to be completed and disposed of more than one year from thebalance sheet date; or (iii) real estate held for investment, which consists of land on which development activitieshave not yet commenced and completed assets or land held for disposition that do not meet the “held for sale”criteria.
Real estate held for sale is recorded at the lower of cost or estimated fair value less cost to sell. If an asset’sfair value less cost to sell, based on discounted future cash flows, management estimates or market comparisons,is less than its carrying amount, an allowance is recorded against the asset. Determining an asset’s fair value andthe related allowance to record requires us to utilize judgment and estimates.
Real estate under development and real estate held for investment are carried at cost less depreciation, asapplicable. Buildings and improvements included in real estate held for investment are depreciated using thestraight-line method over estimated useful lives, generally up to 39 years. Tenant improvements included in realestate held for investment are amortized using the straight-line method over the shorter of their estimated usefullife or the terms of the respective leases. Land improvements included in real estate held for investment aredepreciated over their estimated useful lives, up to 15 years.
When indicators of impairment are present, real estate under development and real estate held forinvestment are evaluated for impairment and losses are recorded when undiscounted cash flows estimated to begenerated by an asset or market comparisons are less than the asset’s carrying amount. The amount of theimpairment loss is calculated as the excess of the asset’s carrying value over its fair value, which is determinedusing a discounted cash flow analysis, management estimates or market comparisons. Impairment charges of$24.6 million, $28.8 million and $48.7 million were recorded for the years ended December 31, 2010, 2009 and2008, respectively. In addition, during the years ended December 31, 2010 and 2009, we also recorded provisionsfor loss on real estate held for sale of $2.3 million and $3.9 million, respectively.
We evaluate each of our real estate assets on a quarterly basis in order to determine the classification of eachasset in our consolidated balance sheet. This evaluation requires judgment by us in considering certain criteriathat must be evaluated under Topic 360, such as the estimated time to complete assets that are underdevelopment and the timeframe in which we expect to sell our real estate assets. The classification of real estateassets determines which real estate assets are to be depreciated as well as what method is used to evaluate andmeasure impairment. Had we evaluated our assets differently, the balance sheet classification of such assets,depreciation expense and impairment losses could have been different.
Cost Capitalization and Allocation
When acquiring, developing and constructing real estate assets, we capitalize costs. Capitalization beginswhen we determine that activities related to development have begun and ceases when activities are substantially
36
complete and the asset is available for occupancy, which are timing decisions that require judgment. Costscapitalized include pursuit costs, or pre-acquisition/pre-construction costs, taxes and insurance, interest,development and construction costs and costs of incidental operations. We expense transaction costs foracquisitions that qualify as a business in accordance with the “Business Combinations” Topic of the FASB ASC,or Topic 805. Pursuit costs capitalized in connection with a potential development project that we havedetermined based on our judgment not to pursue are written off in the period that such determination is made. Adifference in the timing of when this determination is made could cause the pursuit costs to be expensed in adifferent period.
At times, we purchase bulk land that we intend to sell or develop in phases. The land basis allocated to eachphase is based on the relative estimated fair value of the phases before construction. We allocate constructioncosts incurred relating to more than one phase between the various phases; if the costs cannot be specificallyattributed to a certain phase or the improvements benefit more than one phase, we allocate the costs between thephases based on their relative estimated sales values, where practicable, or other value methods as appropriateunder the circumstances. Relative allocations of the costs are revised as the sales value estimates are revised.
When acquiring real estate with existing buildings, we allocate the purchase price between land, landimprovements, building and intangibles related to in-place leases, if any, based on their relative fair values. Thefair values of acquired land and buildings are determined based on an estimated discounted future cash flowmodel with lease-up assumptions as if the building was vacant upon acquisition. The fair value of in-place leasesincludes the value of lease intangibles for above or below-market rents and tenant origination costs, determinedon a lease by lease basis using assumptions for market rates, absorption periods, lease commissions and tenantimprovements. The capitalized values for both lease intangibles and tenant origination costs are amortized overthe term of the underlying leases. Amortization related to lease intangibles is recorded as either an increase to ora reduction of rental income and amortization for tenant origination costs is recorded to amortization expense. Ifwe use different estimates in these valuations, the allocation of purchase price to each component could differ,which could cause the amount of amortization related to lease intangibles and tenant origination costs to bedifferent, as well as depreciation of the related building and land improvements.
Disposition of Real Estate
Gains on disposition of real estate are recognized upon sale of the underlying project. We evaluate each realestate sale transaction to determine if it qualifies for gain recognition under the full accrual method. Thisevaluation requires us to make judgments and estimates in assessing whether a sale has been consummated, theadequacy of the buyer’s investment, the subordination or collectability of any receivable related to the purchase,and whether we have transferred the usual risks and rewards of ownership to the buyer, with no substantialcontinuing involvement by us. If the transaction does not meet the criteria for the full accrual method of profitrecognition based on our assessment, we account for the sale based on an appropriate deferral method determinedby the nature and extent of the buyer’s investment and our continuing involvement. In some cases, a deferralmethod could require the real estate asset and its related liabilities to remain on our balance sheet until the salequalifies for a different deferral method or full accrual profit recognition.
Discontinued Operations
Topic 360 extends the reporting of a discontinued operation to a “component of an entity,” and furtherrequires that a component be classified as a discontinued operation if the operations and cash flows of thecomponent have been or will be eliminated from the ongoing operations of the entity in the disposal transactionand the entity will not have any significant continuing involvement in the operations of the component after thedisposal transaction. As defined in Topic 360, a “component of an entity” comprises operations and cash flowsthat can be clearly distinguished, operationally and for financial reporting purposes, from the rest of the entity.Because each of our real estate assets is generally accounted for in a discrete subsidiary, many constitute acomponent of an entity under Topic 360, increasing the likelihood that the disposition of assets are required to berecognized and reported as operating profits and losses on discontinued operations in the periods in which they
37
occur. The evaluation of whether the component’s cash flows have been eliminated and the level of ourcontinuing involvement require judgment by us and a different assessment could result in items not beingreported as discontinued operations.
Income Taxes
Income taxes are accounted for under the asset and liability method in accordance with the “Accounting forIncome Taxes,” Topic of the FASB ASC, or Topic 740. Deferred tax assets and liabilities are determined basedon temporary differences between the financial reporting and the tax basis of assets and liabilities and operatingloss and tax credit carry forwards. Deferred tax assets and liabilities are measured by applying enacted tax ratesand laws and are released in the years in which the temporary differences are expected to be recovered or settled.The effect on deferred tax assets and liabilities of a change in tax rates is recognized in income in the period thatincludes the enactment date. Valuation allowances are provided against deferred tax assets when it is more likelythan not that some portion or all of the deferred tax asset will not be realized.
Accounting for tax positions requires judgments, including estimating reserves for potential uncertainties.We also assess our ability to utilize tax attributes, including those in the form of carryforwards, for which thebenefits have already been reflected in the financial statements. We do not record valuation allowances fordeferred tax assets that we believe will be realized in future periods. While we believe the resulting tax balancesas of December 31, 2010 and 2009 are appropriately accounted for in accordance with Topic 740, as applicable,the ultimate outcome of such matters could result in favorable or unfavorable adjustments to our consolidatedfinancial statements and such adjustments could be material. See Note 15 of the Notes to Consolidated FinancialStatements for further information regarding income taxes.
38
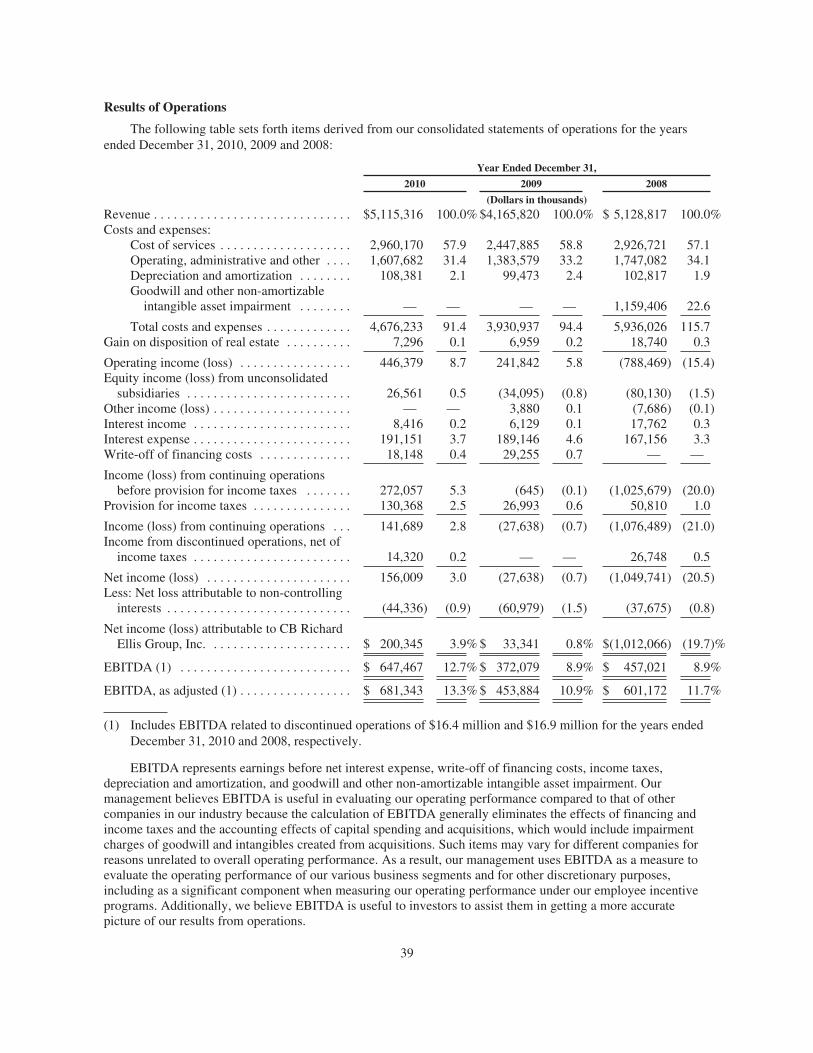
Results of Operations
The following table sets forth items derived from our consolidated statements of operations for the yearsended December 31, 2010, 2009 and 2008:
Year Ended December 31,
2010 2009 2008
(Dollars in thousands)Revenue . . . . . . . . . . . . . . . . . . . . . . . . . . . . . . $5,115,316 100.0% $4,165,820 100.0% $ 5,128,817 100.0%Costs and expenses:
Cost of services . . . . . . . . . . . . . . . . . . . . 2,960,170 57.9 2,447,885 58.8 2,926,721 57.1Operating, administrative and other . . . . 1,607,682 31.4 1,383,579 33.2 1,747,082 34.1Depreciation and amortization . . . . . . . . 108,381 2.1 99,473 2.4 102,817 1.9Goodwill and other non-amortizable
intangible asset impairment . . . . . . . . — — — — 1,159,406 22.6
Total costs and expenses . . . . . . . . . . . . . 4,676,233 91.4 3,930,937 94.4 5,936,026 115.7Gain on disposition of real estate . . . . . . . . . . 7,296 0.1 6,959 0.2 18,740 0.3
Operating income (loss) . . . . . . . . . . . . . . . . . 446,379 8.7 241,842 5.8 (788,469) (15.4)Equity income (loss) from unconsolidated
subsidiaries . . . . . . . . . . . . . . . . . . . . . . . . . 26,561 0.5 (34,095) (0.8) (80,130) (1.5)Other income (loss) . . . . . . . . . . . . . . . . . . . . . — — 3,880 0.1 (7,686) (0.1)Interest income . . . . . . . . . . . . . . . . . . . . . . . . 8,416 0.2 6,129 0.1 17,762 0.3Interest expense . . . . . . . . . . . . . . . . . . . . . . . . 191,151 3.7 189,146 4.6 167,156 3.3Write-off of financing costs . . . . . . . . . . . . . . 18,148 0.4 29,255 0.7 — —
Income (loss) from continuing operationsbefore provision for income taxes . . . . . . . 272,057 5.3 (645) (0.1) (1,025,679) (20.0)
Provision for income taxes . . . . . . . . . . . . . . . 130,368 2.5 26,993 0.6 50,810 1.0
Income (loss) from continuing operations . . . 141,689 2.8 (27,638) (0.7) (1,076,489) (21.0)Income from discontinued operations, net of
income taxes . . . . . . . . . . . . . . . . . . . . . . . . 14,320 0.2 — — 26,748 0.5
Net income (loss) . . . . . . . . . . . . . . . . . . . . . . 156,009 3.0 (27,638) (0.7) (1,049,741) (20.5)Less: Net loss attributable to non-controlling
interests . . . . . . . . . . . . . . . . . . . . . . . . . . . . (44,336) (0.9) (60,979) (1.5) (37,675) (0.8)
Net income (loss) attributable to CB RichardEllis Group, Inc. . . . . . . . . . . . . . . . . . . . . . $ 200,345 3.9% $ 33,341 0.8% $(1,012,066) (19.7)%
EBITDA (1) . . . . . . . . . . . . . . . . . . . . . . . . . . $ 647,467 12.7% $ 372,079 8.9% $ 457,021 8.9%
EBITDA, as adjusted (1) . . . . . . . . . . . . . . . . . $ 681,343 13.3% $ 453,884 10.9% $ 601,172 11.7%
(1) Includes EBITDA related to discontinued operations of $16.4 million and $16.9 million for the years endedDecember 31, 2010 and 2008, respectively.
EBITDA represents earnings before net interest expense, write-off of financing costs, income taxes,depreciation and amortization, and goodwill and other non-amortizable intangible asset impairment. Ourmanagement believes EBITDA is useful in evaluating our operating performance compared to that of othercompanies in our industry because the calculation of EBITDA generally eliminates the effects of financing andincome taxes and the accounting effects of capital spending and acquisitions, which would include impairmentcharges of goodwill and intangibles created from acquisitions. Such items may vary for different companies forreasons unrelated to overall operating performance. As a result, our management uses EBITDA as a measure toevaluate the operating performance of our various business segments and for other discretionary purposes,including as a significant component when measuring our operating performance under our employee incentiveprograms. Additionally, we believe EBITDA is useful to investors to assist them in getting a more accuratepicture of our results from operations.
39
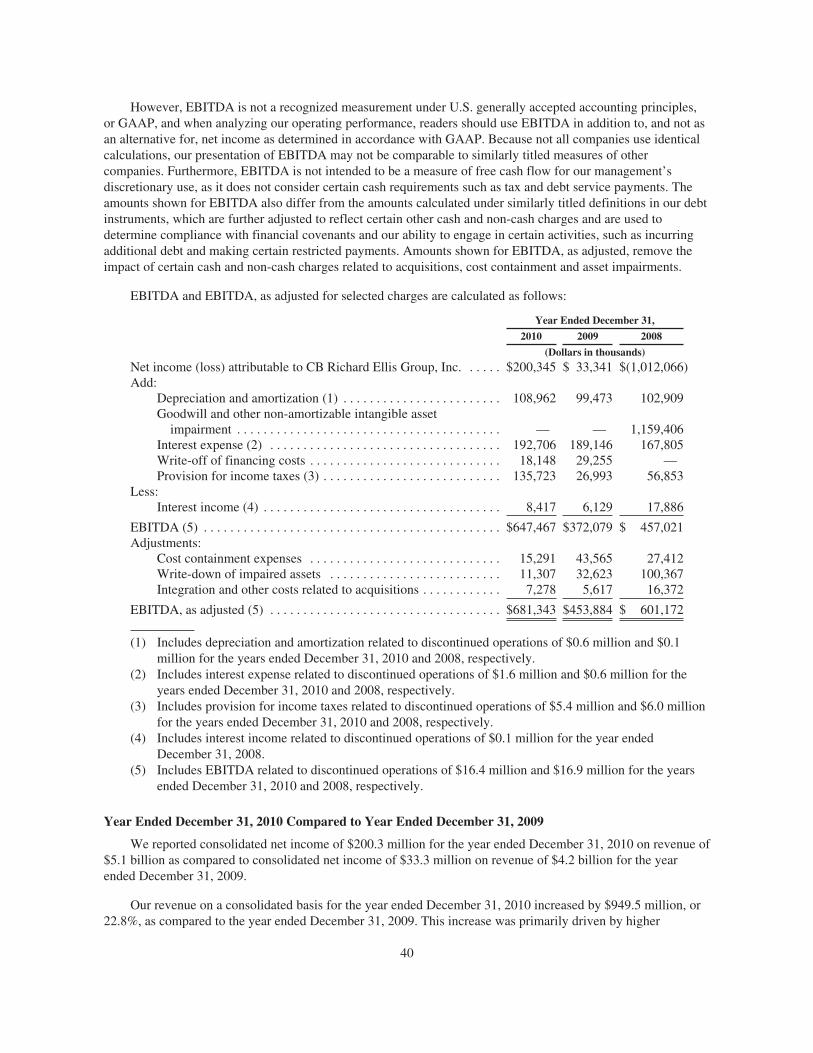
However, EBITDA is not a recognized measurement under U.S. generally accepted accounting principles,or GAAP, and when analyzing our operating performance, readers should use EBITDA in addition to, and not asan alternative for, net income as determined in accordance with GAAP. Because not all companies use identicalcalculations, our presentation of EBITDA may not be comparable to similarly titled measures of othercompanies. Furthermore, EBITDA is not intended to be a measure of free cash flow for our management’sdiscretionary use, as it does not consider certain cash requirements such as tax and debt service payments. Theamounts shown for EBITDA also differ from the amounts calculated under similarly titled definitions in our debtinstruments, which are further adjusted to reflect certain other cash and non-cash charges and are used todetermine compliance with financial covenants and our ability to engage in certain activities, such as incurringadditional debt and making certain restricted payments. Amounts shown for EBITDA, as adjusted, remove theimpact of certain cash and non-cash charges related to acquisitions, cost containment and asset impairments.
EBITDA and EBITDA, as adjusted for selected charges are calculated as follows:
Year Ended December 31,
2010 2009 2008
(Dollars in thousands)
Net income (loss) attributable to CB Richard Ellis Group, Inc. . . . . . $200,345 $ 33,341 $(1,012,066)Add:
Depreciation and amortization (1) . . . . . . . . . . . . . . . . . . . . . . . . 108,962 99,473 102,909Goodwill and other non-amortizable intangible asset
impairment . . . . . . . . . . . . . . . . . . . . . . . . . . . . . . . . . . . . . . . . — — 1,159,406Interest expense (2) . . . . . . . . . . . . . . . . . . . . . . . . . . . . . . . . . . . 192,706 189,146 167,805Write-off of financing costs . . . . . . . . . . . . . . . . . . . . . . . . . . . . . 18,148 29,255 —Provision for income taxes (3) . . . . . . . . . . . . . . . . . . . . . . . . . . . 135,723 26,993 56,853
Less:Interest income (4) . . . . . . . . . . . . . . . . . . . . . . . . . . . . . . . . . . . . 8,417 6,129 17,886
EBITDA (5) . . . . . . . . . . . . . . . . . . . . . . . . . . . . . . . . . . . . . . . . . . . . . $647,467 $372,079 $ 457,021Adjustments:
Cost containment expenses . . . . . . . . . . . . . . . . . . . . . . . . . . . . . 15,291 43,565 27,412Write-down of impaired assets . . . . . . . . . . . . . . . . . . . . . . . . . . 11,307 32,623 100,367Integration and other costs related to acquisitions . . . . . . . . . . . . 7,278 5,617 16,372
EBITDA, as adjusted (5) . . . . . . . . . . . . . . . . . . . . . . . . . . . . . . . . . . . $681,343 $453,884 $ 601,172
(1) Includes depreciation and amortization related to discontinued operations of $0.6 million and $0.1million for the years ended December 31, 2010 and 2008, respectively.
(2) Includes interest expense related to discontinued operations of $1.6 million and $0.6 million for theyears ended December 31, 2010 and 2008, respectively.
(3) Includes provision for income taxes related to discontinued operations of $5.4 million and $6.0 millionfor the years ended December 31, 2010 and 2008, respectively.
(4) Includes interest income related to discontinued operations of $0.1 million for the year endedDecember 31, 2008.
(5) Includes EBITDA related to discontinued operations of $16.4 million and $16.9 million for the yearsended December 31, 2010 and 2008, respectively.
Year Ended December 31, 2010 Compared to Year Ended December 31, 2009
We reported consolidated net income of $200.3 million for the year ended December 31, 2010 on revenue of$5.1 billion as compared to consolidated net income of $33.3 million on revenue of $4.2 billion for the yearended December 31, 2009.
Our revenue on a consolidated basis for the year ended December 31, 2010 increased by $949.5 million, or22.8%, as compared to the year ended December 31, 2009. This increase was primarily driven by higher
40
worldwide sales (up 51.5%), leasing (up 29.3%) and outsourcing (up 8.5%) activity. Foreign currency translationhad a $44.1 million positive impact on total revenue during the year ended December 31, 2010.
Our cost of services on a consolidated basis increased by $512.3 million, or 20.9%, during the year endedDecember 31, 2010 as compared to the year ended December 31, 2009. Our sales and leasing professionalsgenerally are paid on a commission and bonus basis, which substantially correlates with our revenueperformance. Accordingly, the increase in revenue led to a corresponding increase in commission and bonusaccruals. In addition, commission reinstatements contributed to the increase. Higher salaries and related costsassociated with our property and facilities management contracts also contributed to an increase in cost ofservices in the current year. Foreign currency translation had a $31.0 million negative impact on cost of servicesduring the year ended December 31, 2010. Cost of services as a percentage of revenue decreased from 58.8% forthe year ended December 31, 2009 to 57.9% for the year ended December 31, 2010. This decrease was primarilythe result of the strong improvement in overall revenue and a shift in the mix of revenue, with transactionrevenue comprising a greater portion of the total than in the prior year.
Our operating, administrative and other expenses on a consolidated basis increased by $224.1 million, or16.2%, during the year ended December 31, 2010 as compared to the year ended December 31, 2009. Theincrease was primarily driven by higher payroll-related costs, including bonuses, which resulted from ourimproved operating performance as well as the restoration of salaries to pre-recession levels in the third quarterof 2010 and substantially restored bonus target levels in the fourth quarter of 2010. Also contributing to theincrease was higher carried interest incentive compensation expense accruals and increased marketing and travelcosts in support of our growing revenue in the current year. Foreign currency translation had a $10.8 millionnegative impact on total operating expenses during the year ended December 31, 2010. Operating expenses as apercentage of revenue decreased to 31.4% for the year ended December 31, 2010 from 33.2% for the year endedDecember 31, 2009, reflective of our cost containment efforts during the recessionary period of 2008 and 2009 aswell as the strong improvement in overall revenue.
Our depreciation and amortization expense on a consolidated basis increased by $8.9 million, or 9.0%, forthe year ended December 31, 2010 as compared to the year ended December 31, 2009. This increase wasprimarily attributable to higher depreciation expense within our Global Investment Management segment drivenby the consolidation of several assets due to the adoption of ASU 2009-17 in the current year.
Our gain on disposition of real estate on a consolidated basis was $7.3 million and $7.0 million for the yearsended December 31, 2010 and 2009, respectively. These gains resulted from activity within our DevelopmentServices segment.
Our equity income from unconsolidated subsidiaries on a consolidated basis was $26.6 million for the yearended December 31, 2010 as compared to an equity loss from unconsolidated subsidiaries of $34.1 million forthe year ended December 31, 2009. The increase in equity income in the current year was primarily driven byhigher equity earnings associated with gains on property sales within our Development Services segment andhigher equity earnings in our Global Investment Management segment largely resulting from a fund liquidation.Also contributing to the variance were lower impairment charges associated with equity investments in ourDevelopment Services and Global Investment Management segments in the current year.
Our consolidated interest income was $8.4 million for the year ended December 31, 2010, an increase of $2.3million, or 37.3%, as compared to the year ended December 31, 2009. This increase was mainly driven by higherinterest income reported in our Asia Pacific segment, which resulted from the final measurement of a deferredpurchase obligation related to the purchase of remaining non-controlling interests in our subsidiary in India.
Our consolidated interest expense increased by $2.0 million, or 1.1%, during the year ended December 31,2010 as compared to the year ended December 31, 2009. The increase was primarily due to higher interestexpense associated with the $450.0 million of 11.625% senior subordinated notes issued in June 2009 andincreased interest expense reported by our Global Investment Management segment mainly resulting from the
41
consolidation of several assets due to the adoption of ASU 2009-17 in the current year. These increases werelargely offset by lower interest expense associated with our credit agreement.
We wrote off $18.1 million and $29.3 million of financing costs during the years ended December 31, 2010and 2009, respectively. In connection with the new credit agreement we entered into on November 10, 2010, wewrote off financing costs of $16.7 million during the year ended December 31, 2010. In addition, in October2010, we wrote off $1.4 million of unamortized deferred financing costs in connection with debt repaymentsmade. In connection with the March 24, 2009 amendment and restatement of our previous credit agreement, wewrote off financing costs of $29.3 million during the year ended December 31, 2009.
Our provision for income taxes on a consolidated basis was $130.4 million for the year ended December 31,2010 as compared to $27.0 million for the year ended December 31, 2009. Our effective tax rate from continuingoperations, after adjusting pre-tax income (loss) to remove the portion attributable to non-controlling interests,decreased to 40.5% for the year ended December 31, 2010 as compared to 44.7% for the year endedDecember 31, 2009. The changes in our provision for income taxes and our effective tax rate were primarily theresult of a significant increase in income reported in the current year as well as a change in our mix of domesticand foreign earnings (losses).
Our consolidated income from discontinued operations, net of income taxes, was $14.3 million for the yearended December 31, 2010. This income was reported in our Development Services segment and mostly related togains from asset dispositions.
Our net loss attributable to non-controlling interests on a consolidated basis was $44.3 million for the yearended December 31, 2010 as compared to $61.0 million for the year ended December 31, 2009. This activityprimarily reflects our non-controlling interests’ share of losses within our Global Investment Management andDevelopment Services segments.
Year Ended December 31, 2009 Compared to Year Ended December 31, 2008
We reported consolidated net income of $33.3 million for the year ended December 31, 2009 on revenue of$4.2 billion as compared to a consolidated net loss of $1.0 billion on revenue of $5.1 billion for the year endedDecember 31, 2008.
Our revenue on a consolidated basis for the year ended December 31, 2009 decreased by $963.0 million, or18.8%, as compared to the year ended December 31, 2008. This decrease was primarily driven by weakworldwide sales and leasing activity as well as lower appraisal revenue, all resulting from the continuation ofchallenging global economic conditions. While our outsourcing business continued to add new clients andexpand existing relationships, its revenue also declined slightly in 2009 as a result of reduced client spending, arise in vacancy rates of properties we manage as well as the effect of client consolidations and distress during2008 and 2009. Foreign currency translation had a $129.2 million negative impact on total revenue during theyear ended December 31, 2009.
Our cost of services on a consolidated basis decreased by $478.8 million, or 16.4%, during the year endedDecember 31, 2009 as compared to the year ended December 31, 2008. As previously mentioned, our sales andleasing professionals generally are paid on a commission and bonus basis, which substantially correlates with ourrevenue performance. Accordingly, the decrease in revenue led to a corresponding decrease in commissions andbonuses. Foreign currency translation had an $83.9 million positive impact on cost of services during the yearended December 31, 2009. Cost of services as a percentage of revenue increased from 57.1% for the year endedDecember 31, 2008 to 58.8% for the year ended December 31, 2009. This increase was primarily driven by thelarge decrease in overall revenue and a shift in the mix of revenues with outsourcing, including reimbursables,comprising a materially greater portion of the total than in 2008.
Our operating, administrative and other expenses on a consolidated basis decreased by $363.5 million, or20.8%, during the year ended December 31, 2009 as compared to the year ended December 31, 2008. Thisdecrease was driven by cost reduction measures that started in 2008 and continued through 2009, which led to
42
lower operating costs, particularly payroll-related, travel and marketing costs. The decrease was also driven byreduced bonus expense resulting from lower business performance. Foreign currency translation had a $40.9million positive impact on total operating expenses during the year ended December 31, 2009. As a result of ouraggressive cost cutting measures, operating expenses as a percentage of revenue decreased to 33.2% for the yearended December 31, 2009 from 34.1% for the year ended December 31, 2008.
Our depreciation and amortization expense on a consolidated basis decreased by $3.3 million, or 3.3%, forthe year ended December 31, 2009 as compared to the year ended December 31, 2008. This decline was mainlydriven by lower depreciation expense resulting from decreased capital expenditures.
Our goodwill and other non-amortizable intangible asset impairment on a consolidated basis was $1.2 billionfor the year ended December 31, 2008. These impairment charges were primarily driven by adverse economicconditions causing a decline in the estimated future discounted cash flows for several of our reporting units.
Our gain on disposition of real estate on a consolidated basis was $7.0 million and $18.7 million for theyears ended December 31, 2009 and 2008, respectively. These gains resulted from activity within ourDevelopment Services segment.
Our equity loss from unconsolidated subsidiaries on a consolidated basis decreased by $46.0 million, or57.5%, for the year ended December 31, 2009 as compared to the year ended December 31, 2008. This decreasewas primarily driven by lower non-cash write-downs resulting from declines in value of investments in ourDevelopment Services and Global Investment Management segments in 2009. Also contributing to this variancewas a $14.7 million non-cash write-down of our investment in Realty Finance Corporation, a mortgage REIT,within our Americas segment attributable to a decline in its market valuation in 2008, which did not recur in 2009.
Our consolidated interest income was $6.1 million for the year ended December 31, 2009, a decrease of$11.6 million, or 65.5%, as compared to the year ended December 31, 2008. This decrease was mainly driven bylower interest income earned in our Development Services segment due to a decrease in notes receivable in 2009and in our Americas and EMEA segments as a result of lower interest rates in 2009.
Our consolidated interest expense increased by $22.0 million during the year ended December 31, 2009, or13.2%, as compared to the year ended December 31, 2008. The increase was primarily due to higher interestexpense associated with the $450.0 million of 11.625% senior subordinated notes issued in June 2009, partiallyoffset by lower interest expense associated with our previous credit agreement, mainly due to lower averageoutstanding debt balances in 2009.
We wrote off $29.3 million of financing costs during the year ended December 31, 2009 in connection withthe amendment of our previous credit agreement on March 24, 2009.
Our provision for income taxes on a consolidated basis was $27.0 million for the year ended December 31,2009 as compared to $50.8 million for the year ended December 31, 2008. Our effective tax rate from continuingoperations, after adjusting pre-tax loss to remove the portion attributable to non-controlling interests, increased to44.7% for the year ended December 31, 2009 as compared to negative 5.2% for the year ended December 31,2008. The changes in our provision for income taxes and our effective tax rate were primarily the result of asizeable loss reported in 2008 versus income in 2009, a change in our mix of domestic and foreign earnings(losses) as well as a large portion of the goodwill impairment charges incurred in 2008 being non-deductible forU.S. income tax purposes.
Our consolidated income from discontinued operations, net of income taxes, was $26.7 million for the yearended December 31, 2008. This income was reported in our Development Services segment and mostly related togains from asset dispositions.
Our net loss attributable to non-controlling interests on a consolidated basis was $61.0 million for the yearended December 31, 2009 as compared to $37.7 million for the year ended December 31, 2008. This activityprimarily reflects our non-controlling interests’ share of losses within our Development Services segment.
43
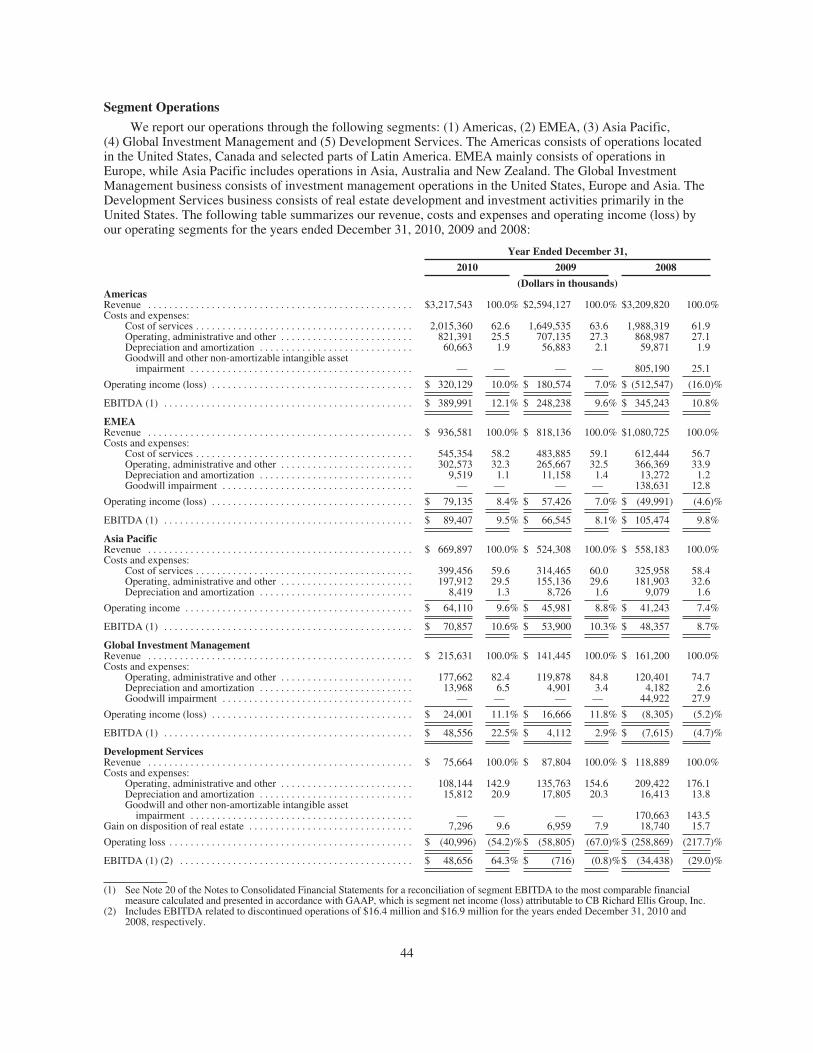
Segment Operations
We report our operations through the following segments: (1) Americas, (2) EMEA, (3) Asia Pacific,(4) Global Investment Management and (5) Development Services. The Americas consists of operations locatedin the United States, Canada and selected parts of Latin America. EMEA mainly consists of operations inEurope, while Asia Pacific includes operations in Asia, Australia and New Zealand. The Global InvestmentManagement business consists of investment management operations in the United States, Europe and Asia. TheDevelopment Services business consists of real estate development and investment activities primarily in theUnited States. The following table summarizes our revenue, costs and expenses and operating income (loss) byour operating segments for the years ended December 31, 2010, 2009 and 2008:
Year Ended December 31,
2010 2009 2008
(Dollars in thousands)AmericasRevenue . . . . . . . . . . . . . . . . . . . . . . . . . . . . . . . . . . . . . . . . . . . . . . . . . . $3,217,543 100.0% $2,594,127 100.0% $3,209,820 100.0%Costs and expenses:
Cost of services . . . . . . . . . . . . . . . . . . . . . . . . . . . . . . . . . . . . . . . . . 2,015,360 62.6 1,649,535 63.6 1,988,319 61.9Operating, administrative and other . . . . . . . . . . . . . . . . . . . . . . . . . 821,391 25.5 707,135 27.3 868,987 27.1Depreciation and amortization . . . . . . . . . . . . . . . . . . . . . . . . . . . . . 60,663 1.9 56,883 2.1 59,871 1.9Goodwill and other non-amortizable intangible asset
impairment . . . . . . . . . . . . . . . . . . . . . . . . . . . . . . . . . . . . . . . . . . — — — — 805,190 25.1
Operating income (loss) . . . . . . . . . . . . . . . . . . . . . . . . . . . . . . . . . . . . . . $ 320,129 10.0% $ 180,574 7.0% $ (512,547) (16.0)%
EBITDA (1) . . . . . . . . . . . . . . . . . . . . . . . . . . . . . . . . . . . . . . . . . . . . . . . $ 389,991 12.1% $ 248,238 9.6% $ 345,243 10.8%
EMEARevenue . . . . . . . . . . . . . . . . . . . . . . . . . . . . . . . . . . . . . . . . . . . . . . . . . . $ 936,581 100.0% $ 818,136 100.0% $1,080,725 100.0%Costs and expenses:
Cost of services . . . . . . . . . . . . . . . . . . . . . . . . . . . . . . . . . . . . . . . . . 545,354 58.2 483,885 59.1 612,444 56.7Operating, administrative and other . . . . . . . . . . . . . . . . . . . . . . . . . 302,573 32.3 265,667 32.5 366,369 33.9Depreciation and amortization . . . . . . . . . . . . . . . . . . . . . . . . . . . . . 9,519 1.1 11,158 1.4 13,272 1.2Goodwill impairment . . . . . . . . . . . . . . . . . . . . . . . . . . . . . . . . . . . . — — — — 138,631 12.8
Operating income (loss) . . . . . . . . . . . . . . . . . . . . . . . . . . . . . . . . . . . . . . $ 79,135 8.4% $ 57,426 7.0% $ (49,991) (4.6)%
EBITDA (1) . . . . . . . . . . . . . . . . . . . . . . . . . . . . . . . . . . . . . . . . . . . . . . . $ 89,407 9.5% $ 66,545 8.1% $ 105,474 9.8%
Asia PacificRevenue . . . . . . . . . . . . . . . . . . . . . . . . . . . . . . . . . . . . . . . . . . . . . . . . . . $ 669,897 100.0% $ 524,308 100.0% $ 558,183 100.0%Costs and expenses:
Cost of services . . . . . . . . . . . . . . . . . . . . . . . . . . . . . . . . . . . . . . . . . 399,456 59.6 314,465 60.0 325,958 58.4Operating, administrative and other . . . . . . . . . . . . . . . . . . . . . . . . . 197,912 29.5 155,136 29.6 181,903 32.6Depreciation and amortization . . . . . . . . . . . . . . . . . . . . . . . . . . . . . 8,419 1.3 8,726 1.6 9,079 1.6
Operating income . . . . . . . . . . . . . . . . . . . . . . . . . . . . . . . . . . . . . . . . . . . $ 64,110 9.6% $ 45,981 8.8% $ 41,243 7.4%
EBITDA (1) . . . . . . . . . . . . . . . . . . . . . . . . . . . . . . . . . . . . . . . . . . . . . . . $ 70,857 10.6% $ 53,900 10.3% $ 48,357 8.7%
Global Investment ManagementRevenue . . . . . . . . . . . . . . . . . . . . . . . . . . . . . . . . . . . . . . . . . . . . . . . . . . $ 215,631 100.0% $ 141,445 100.0% $ 161,200 100.0%Costs and expenses:
Operating, administrative and other . . . . . . . . . . . . . . . . . . . . . . . . . 177,662 82.4 119,878 84.8 120,401 74.7Depreciation and amortization . . . . . . . . . . . . . . . . . . . . . . . . . . . . . 13,968 6.5 4,901 3.4 4,182 2.6Goodwill impairment . . . . . . . . . . . . . . . . . . . . . . . . . . . . . . . . . . . . — — — — 44,922 27.9
Operating income (loss) . . . . . . . . . . . . . . . . . . . . . . . . . . . . . . . . . . . . . . $ 24,001 11.1% $ 16,666 11.8% $ (8,305) (5.2)%
EBITDA (1) . . . . . . . . . . . . . . . . . . . . . . . . . . . . . . . . . . . . . . . . . . . . . . . $ 48,556 22.5% $ 4,112 2.9% $ (7,615) (4.7)%
Development ServicesRevenue . . . . . . . . . . . . . . . . . . . . . . . . . . . . . . . . . . . . . . . . . . . . . . . . . . $ 75,664 100.0% $ 87,804 100.0% $ 118,889 100.0%Costs and expenses:
Operating, administrative and other . . . . . . . . . . . . . . . . . . . . . . . . . 108,144 142.9 135,763 154.6 209,422 176.1Depreciation and amortization . . . . . . . . . . . . . . . . . . . . . . . . . . . . . 15,812 20.9 17,805 20.3 16,413 13.8Goodwill and other non-amortizable intangible asset
impairment . . . . . . . . . . . . . . . . . . . . . . . . . . . . . . . . . . . . . . . . . . — — — — 170,663 143.5Gain on disposition of real estate . . . . . . . . . . . . . . . . . . . . . . . . . . . . . . . 7,296 9.6 6,959 7.9 18,740 15.7
Operating loss . . . . . . . . . . . . . . . . . . . . . . . . . . . . . . . . . . . . . . . . . . . . . . $ (40,996) (54.2)%$ (58,805) (67.0)%$ (258,869) (217.7)%
EBITDA (1) (2) . . . . . . . . . . . . . . . . . . . . . . . . . . . . . . . . . . . . . . . . . . . . $ 48,656 64.3% $ (716) (0.8)%$ (34,438) (29.0)%
(1) See Note 20 of the Notes to Consolidated Financial Statements for a reconciliation of segment EBITDA to the most comparable financialmeasure calculated and presented in accordance with GAAP, which is segment net income (loss) attributable to CB Richard Ellis Group, Inc.
(2) Includes EBITDA related to discontinued operations of $16.4 million and $16.9 million for the years ended December 31, 2010 and2008, respectively.
44
Year Ended December 31, 2010 Compared to Year Ended December 31, 2009
Americas
Revenue increased by $623.4 million, or 24.0%, for the year ended December 31, 2010 as compared to theyear ended December 31, 2009. This improvement was primarily driven by higher sales and leasing activity aswell as increased commercial mortgage brokerage and outsourcing activity. Foreign currency translation had a$30.1 million positive impact on total revenue during the year ended December 31, 2010.
Cost of services increased by $365.8 million, or 22.2%, for the year ended December 31, 2010 as comparedto the year ended December 31, 2009, primarily due to increased commission expense resulting from higher salesand lease transaction revenue. In addition, commission reinstatements contributed to the increase. Higher salariesand related costs associated with our property and facilities management contracts also contributed to an increasein cost of services in the current year. Foreign currency translation had an $18.3 million negative impact on costof services during the year ended December 31, 2010. Cost of services as a percentage of revenue decreased to62.6% for the year ended December 31, 2010 from 63.6% for the year ended December 31, 2009 primarily due tothe increase in overall revenue and a shift in the mix of revenue, with transaction revenue comprising a greaterportion of the total than in the prior year.
Operating, administrative and other expenses increased by $114.3 million, or 16.2%. The increase wasprimarily driven by higher payroll-related costs, including bonuses, which resulted from our improved operatingperformance as well as the restoration of salaries to pre-recession levels in the third quarter of 2010 andsubstantially restored bonus target levels in the fourth quarter of 2010. Also contributing to the increase werehigher marketing and travel costs in support of our growing revenue. Foreign currency translation had a $7.8million negative impact on total operating expenses during the year ended December 31, 2010.
EMEA
Revenue increased by $118.4 million, or 14.5%, for the year ended December 31, 2010 as compared to theyear ended December 31, 2009. This increase was primarily attributable to higher sales, leasing and outsourcingactivities, particularly in France, Germany, Spain and the United Kingdom. Foreign currency translation had a$37.1 million negative impact on total revenue during the year ended December 31, 2010.
Cost of services increased by $61.5 million, or 12.7%, for the year ended December 31, 2010 as comparedto the year ended December 31, 2009. This increase was primarily driven by higher salaries and related costsassociated with our property and facilities management contracts. Also contributing to the increase was highercommission and bonus expense resulting from increased transaction revenue. Foreign currency translation had an$18.8 million positive impact on cost of services during the year ended December 31, 2010. Cost of services as apercentage of revenue decreased to 58.2% for the year ended December 31, 2010 from 59.1% for the year endedDecember 31, 2009, primarily driven by the increase in overall revenue and a shift in the mix of revenue, withtransaction revenue comprising a greater portion of the total than in the prior year.
Operating, administrative and other expenses increased by $36.9 million, or 13.9%, for the year endedDecember 31, 2010 as compared to the year ended December 31, 2009. This increase was primarily driven byhigher bonus accruals, which resulted from our improved operating performance, and higher marketing andtravel costs in support of our growing revenue. Higher bad debt provisions in the current year also contributed tothe variance. Foreign currency translation had a $10.2 million positive impact on total operating expenses duringthe year ended December 31, 2010.
Asia Pacific
Revenue increased by $145.6 million, or 27.8%, for the year ended December 31, 2010 as compared to theyear ended December 31, 2009. This revenue increase was primarily driven by higher sales, leasing andoutsourcing activity, particularly in Australia, China, India and Singapore. Foreign currency translation had a$52.6 million positive impact on total revenue during the year ended December 31, 2010.
45
Cost of services increased by $85.0 million, or 27.0%, for the year ended December 31, 2010 as comparedto the year ended December 31, 2009. This increase was primarily driven by higher salaries and related costsassociated with our property and facilities management contracts. Also contributing to the increase was highercommission expense resulting from increased transaction revenue. Foreign currency translation had a $31.5million negative impact on cost of services during the year ended December 31, 2010. Cost of services as apercentage of revenue was relatively consistent at 59.6% for the year ended December 31, 2010 versus 60.0% forthe year ended December 31, 2009.
Operating, administrative and other expenses increased by $42.8 million, or 27.6%, for the year endedDecember 31, 2010 as compared to the year ended December 31, 2009. This increase was primarily due to higheroperating costs, including payroll-related, travel and marketing costs, which were driven by revenue increasesand our continuing efforts to grow our business in this region. Also contributing to the increase was higher bonusexpense, which resulted from our improved operating performance. Foreign currency translation had a $13.7million negative impact on total operating expenses during the year ended December 31, 2010.
Global Investment Management
Revenue increased by $74.2 million, or 52.4%, for the year ended December 31, 2010 as compared to theyear ended December 31, 2009. This was largely due to an increase in rental revenue driven by the consolidationof several assets due to the adoption of ASU 2009-17 in the current year. Excluding the impact of this adoption,revenue increased by $39.7 million, primarily due to $19.9 million of carried interest revenue from a fundliquidation in the current year and higher acquisition fees resulting from increased capital deployment. Foreigncurrency translation had a $1.5 million negative impact on total revenue during the year ended December 31,2010.
Operating, administrative and other expenses increased by $57.8 million, or 48.2%, for the year endedDecember 31, 2010 as compared to the year ended December 31, 2009. This increase was primarily driven byhigher carried interest incentive compensation expense accruals for dedicated Global Investment Managementexecutives and team leaders with participation interests in certain real estate investments under management,which totaled $19.0 million for the year ended December 31, 2010 versus a net reversal of $9.6 million in theprior year. Also contributing to the increase in total operating expenses was a $20.9 million impact from theadoption of ASU 2009-17 and higher bonus expense resulting from our improved operating performance.Foreign currency translation had a $0.5 million positive impact on total operating expenses during the year endedDecember 31, 2010.
Total AUM as of December 31, 2010 amounted to $37.6 billion, up 8% from year-end 2009.
Development Services
Revenue decreased by $12.1 million, or 13.8%, for the year ended December 31, 2010 as compared to theyear ended December 31, 2009 primarily due to lower construction revenue and development fees, both drivenby the continuation of weak market conditions.
Operating, administrative and other expenses decreased by $27.6 million, or 20.3%, for the year endedDecember 31, 2010 as compared to the year ended December 31, 2009. This decrease was primarily driven bylower impairment charges related to real estate assets and notes receivable in the current year. Also contributingto the decrease in the current year was a reduction in payroll-related costs largely resulting from cost containmentefforts, lower property operating expenses as a result of property dispositions, and lower job construction costs,which correlated with the above-mentioned construction revenue decrease. These decreases were partially offsetby higher bonus accruals resulting from improved business performance primarily from gains on property salesin the current year.
Development projects in process as of December 31, 2010 totaled $4.9 billion, up $0.2 billion from year-end2009. The inventory of pipeline deals as of December 31, 2010 stood at $1.2 billion, up $0.3 billion fromyear-end 2009.
46
Year Ended December 31, 2009 Compared to Year Ended December 31, 2008
Americas
Revenue decreased by $615.7 million, or 19.2%, for the year ended December 31, 2009 as compared to theyear ended December 31, 2008. This decrease was primarily driven by lower sales and leasing activity due toweak global economic conditions. Foreign currency translation had a $26.7 million negative impact on totalrevenue during the year ended December 31, 2009.
Cost of services decreased by $338.8 million, or 17.0%, for the year ended December 31, 2009 as comparedto the year ended December 31, 2008, primarily due to lower commission expense resulting from lower sales andlease transaction revenue. Foreign currency translation had a $19.2 million positive impact on cost of servicesduring the year ended December 31, 2009. Cost of services as a percentage of revenue increased to 63.6% for theyear ended December 31, 2009 from 61.9% for the year ended December 31, 2008 primarily due to the largedecrease in overall revenue and a shift in our business mix more towards outsourcing services.
Operating, administrative and other expenses decreased by $161.9 million, or 18.6%, mainly driven by costcontainment measures put in place in 2008 and 2009, which led to a reduction in operating costs, particularlylower payroll-related, travel and marketing costs. Foreign currency translation had a $7.2 million positive impacton total operating expenses during the year ended December 31, 2009.
EMEA
Revenue decreased by $262.6 million, or 24.3%, for the year ended December 31, 2009 as compared to theyear ended December 31, 2008. This decline was primarily attributable to lower sales, leasing and appraisalactivities throughout the region. Foreign currency translation had an $80.0 million negative impact on totalrevenue during the year ended December 31, 2009.
Cost of services decreased by $128.6 million, or 21.0%, for the year ended December 31, 2009 as comparedto the year ended December 31, 2008. This decrease was driven by foreign currency translation, which had a$53.8 million positive impact on cost of services during the year ended December 31, 2009. Lower bonuses andcommission expense resulting from lower revenue also contributed to the variance. Cost of services as apercentage of revenue increased from 56.7% for the year ended December 31, 2008 to 59.1% for the year endedDecember 31, 2009, primarily driven by the sharp decline in revenue.
Operating, administrative and other expenses decreased by $100.7 million, or 27.5%, mainly due toaggressive actions taken to cut costs, which led to a reduction in operating costs, particularly lower payroll-related, travel and marketing costs. A reduction in bonuses resulting from the lower business performance alsocontributed to the variance. Foreign currency translation had a $26.7 million positive impact on total operatingexpenses during the year ended December 31, 2009.
Asia Pacific
Revenue decreased by $33.9 million, or 6.1%, for the year ended December 31, 2009 as compared to theyear ended December 31, 2008. This revenue decrease was primarily driven by lower sales and leasing activitythroughout the region. Foreign currency translation had a $14.0 million negative impact on total revenue duringthe year ended December 31, 2009.
Cost of services decreased by $11.5 million, or 3.5%, mainly due to foreign currency translation, which hada $10.9 million positive impact on cost of services for the year ended December 31, 2009. Cost of services as apercentage of revenue increased from 58.4% for the year ended December 31, 2008 to 60.0% for the year endedDecember 31, 2009, primarily driven by the significant decline in overall revenue as well as a shift in ourbusiness mix more towards outsourcing services.
47
Operating, administrative and other expenses decreased by $26.8 million, or 14.7%, for the year endedDecember 31, 2009 as compared to the year ended December 31, 2008. This decrease was primarily due to loweroperating costs, including payroll-related, travel and marketing costs, which were driven by cost containmentmeasures put in place during 2008 and 2009. Foreign currency translation had a $1.9 million positive impact ontotal operating expenses during the year ended December 31, 2009.
Global Investment Management
Revenue decreased by $19.8 million, or 12.3%, for the year ended December 31, 2009 as compared to theyear ended December 31, 2008 due to lower asset management, acquisition, disposition and incentive fees in2009 resulting from the continuation of constraints in the capital markets. Foreign currency translation had an$8.5 million negative impact on total revenue during the year ended December 31, 2009.
Operating, administrative and other expenses were relatively consistent at $119.9 million for the year endedDecember 31, 2009 as compared to $120.4 million for the year ended December 31, 2008. This slight declinewas primarily due to a reduction in bonuses, which resulted from the lower business performance, and loweroperating costs, particularly travel, driven by cost containment measures put in place in 2008 and 2009. Thesedecreases were mostly offset by a lower net reversal of carried interest incentive compensation expense in 2009for dedicated Global Investment Management executives and team leaders with participation interests in certainreal estate investments under management. Excluding the impact of reversing net carried interest incentivecompensation expense accruals, which totaled $9.6 million and $33.1 million for the years ended December 31,2009 and 2008, respectively, operating expenses decreased by 15.7% compared with 2008. Foreign currencytranslation had a $5.1 million positive impact on total operating expenses during the year ended December 31,2009.
Total AUM as of December 31, 2009 amounted to $34.7 billion, down 10% from year-end 2008.
Development Services
Revenue decreased by $31.1 million, or 26.1%, for the year ended December 31, 2009 as compared to theyear ended December 31, 2008 primarily due to lower construction revenue and development fees driven byweak market conditions.
Operating, administrative and other expenses decreased by $73.7 million, or 35.2%, for the year endedDecember 31, 2009 as compared to the year ended December 31, 2008. The decrease was primarily driven bylower impairment charges related to real estate assets, which totaled $38.6 million and $59.3 million for the yearsended December 31, 2009 and 2008, respectively. Also contributing to the decrease in 2009 were lowerconstruction costs and a decrease in payroll-related costs, including bonuses, as a result of lower businessperformance in 2009 as well as cost containment efforts in 2008 through 2009.
Development projects in process as of December 31, 2009 totaled $4.7 billion, down 16% from year-end2008. The inventory of pipeline deals as of December 31, 2009 stood at $0.9 billion, down 64% from year-end2008 as a result of the weak market conditions.
Liquidity and Capital Resources
We believe that we can satisfy our working capital requirements and funding of investments with internallygenerated cash flow and, as necessary, borrowings under our revolving credit facility. Our expected capitalrequirements for 2011 include up to $100 million of anticipated net capital expenditures. As of December 31,2010, we had committed to fund $22.0 million of additional capital to unconsolidated subsidiaries within ourDevelopment Services business, which we may be required to fund at any time. Additionally, as of December 31,2010, we had aggregate commitments of $11.5 million to fund future co-investments in our Global Investment
48
Management business, all of which is expected to be funded in 2011. In recent years, the global credit marketshave experienced unprecedented tightening, which could affect both the availability and cost of our fundingsources in the future.
On February 15, 2011, we announced that we had entered into definitive agreements to acquire the majorityof the real estate investment management business of Netherlands-based ING for approximately $940 million incash. The acquisitions include substantially all of the ING REIM operations in Europe and Asia, as well asCRES, its U.S.-based global real estate listed securities business. We also expect to acquire approximately $55million of CRES co-investments from ING and potentially additional interests in other funds managed by INGREIM Europe and ING REIM Asia. In addition, we expect to incur transaction costs relating to the acquisitionsof approximately $150 million (pre-tax), including financing, retention and integration costs. The acquisitions areexpected to close in the second half of 2011 and are subject to approval by certain stakeholders, includingregulatory agencies in the United States, Europe and Asia. We plan to finance the acquisitions with cash on handand borrowings under our credit agreement.
During 2003 and 2006, we required substantial amounts of equity and debt financing to fund ouracquisitions of Insignia and Trammell Crow Company. In the past two years, we also conducted two debtofferings. The first, in 2009, was part of a capital restructuring in response to the global economic recession, andthe second, in 2010, was to take advantage of low interest rates and term availability. Absent extraordinarytransactions such as these and the equity offerings we completed during the unprecedented recent global capitalmarkets disruption in 2008 and 2009, we historically have not sought external sources of financing and haverelied on our internally generated cash flow and our revolving credit facility to fund our working capital, capitalexpenditure and investment requirements. In the absence of such extraordinary events, our managementanticipates that our cash flow from operations and our revolving credit facility would be sufficient to meet ouranticipated cash requirements for the foreseeable future, but at a minimum for the next 12 months.
As evidenced above, from time to time, we consider potential strategic acquisitions. Our managementbelieves that any future significant acquisitions that we make most likely would require us to obtain additionaldebt or equity financing. In the past, we have been able to obtain such financing for material transactions onterms that our management believed to be reasonable. However, it is possible that we may not be able to findacquisition financing on favorable terms in the future if we decide to make any further material acquisitions.
Our long-term liquidity needs, other than those related to ordinary course obligations and commitments suchas operating leases, generally are comprised of three elements. The first is the repayment of the outstanding andanticipated principal amounts of our long-term indebtedness. Our management is unable to project with certaintywhether our long-term cash flow from operations will be sufficient to repay our long-term debt when it comesdue. If this cash flow is insufficient, then our management expects that we would need to refinance suchindebtedness or otherwise amend its terms to extend the maturity dates. Our management cannot make anyassurances that such refinancings or amendments would be available on attractive terms, if at all.
The second long-term liquidity need is the repayment of obligations under our pension plans in the UnitedKingdom. Our subsidiaries based in the United Kingdom maintain two contributory defined benefit pension plansto provide retirement benefits to existing and former employees participating in the plans. With respect to theseplans, our historical policy has been to contribute annually, an amount to fund pension cost as actuariallydetermined and as required by applicable laws and regulations. Our contributions to these plans are invested and,if these investments do not perform in the future as well as we expect, we will be required to provide additionalfunding to cover any shortfall. During 2007, we reached agreements with the active members of these plans tofreeze future pension plan benefits. In return, the active members became eligible to enroll in the CBRE GroupPersonal Pension Plan, a defined contribution plan in the United Kingdom. The underfunded status of our definedbenefit pension plans included in pension liability in the accompanying consolidated balance sheets was $40.0million and $64.9 million at December 31, 2010 and 2009, respectively. We expect to contribute a total of $3.6million to fund our pension plans for the year ending December 31, 2011.
49
The third long-term liquidity need is the repayment of obligations related to acquisitions. For example, inconnection with our acquisitions of CB Richard Ellis KK (Japan) in 2006 and CB Richard Ellis South Asia PteLtd (India) in 2007, we incurred obligations with respect to the future purchase of non-controlling interests insuch entities. As of December 31, 2009, we had $58.5 million of these deferred purchase obligations outstanding,which were included in accounts payable and accrued expenses in the accompanying consolidated balance sheets.During the year ended December 31, 2010, we purchased the remaining non-controlling interests in Japan andIndia. As of December 31, 2010, there were no deferred purchase obligations outstanding.
On June 10, 2009, we completed the sale of 13,440,860 shares of our Class A common stock through adirect placement to Paulson & Co. Inc., which raised approximately $97.6 million of net proceeds. On June 11,2009, we completed the sale of 5,682,684 shares of our Class A common stock through an at-the-market offeringprogram, which raised approximately $48.8 million of net proceeds. The net proceeds from these offerings wereused for general corporate purposes, including the repayment of some of our outstanding indebtedness under ourprevious credit agreement.
In November 2009, we completed the sale of 28,289,960 shares of our Class A common stock pursuant toan at-the-market offering program, which raised approximately $293.8 million of net proceeds. We used theproceeds from the offering for general corporate purposes, including the repayment of debt.
Historical Cash Flows
Operating Activities
Net cash provided by operating activities totaled $616.6 million for the year ended December 31, 2010, anincrease of $402.9 million as compared to the year ended December 31, 2009. The increase was primarily due toimproved operating performance, higher net payments to vendors and to employees under our deferredcompensation plan in the prior year and an increase in commission, bonus and income tax accruals in the currentyear. These items were partially offset by a greater increase in receivables and higher bonuses paid in the currentyear.
Net cash provided by operating activities totaled $213.6 million for the year ended December 31, 2009 ascompared to net cash used in operating activities of $130.4 million for the year ended December 31, 2008. Thesharp increase in cash provided by operating activities during the year ended December 31, 2009 versus 2008was primarily due to significantly lower bonus payments, income taxes and payments to vendors made in 2009.These decreases were partially offset by lower results in 2009 (excluding the impact of non-cash impairmentcharges) as well as the impact of a significant decrease in receivables in 2008 versus a slight increase in 2009.
Investing Activities
Net cash used in investing activities totaled $62.5 million for the year ended December 31, 2010, a decreaseof $56.9 million as compared to the year ended December 31, 2009. The decrease was primarily driven by highernet proceeds received in the current year from the disposition of real estate held for investment and from the saleof servicing rights and other assets. A decrease in restricted cash and lower contributions to investments inunconsolidated subsidiaries along with higher distributions received from investments in unconsolidatedsubsidiaries in the current year also contributed to the decrease. These decreases were partially offset by the useof more cash in the current year for capital expenditures and earn out payments associated with in-fillacquisitions.
Net cash used in investing activities totaled $119.4 million for the year ended December 31, 2009, adecrease of $299.6 million as compared to the year ended December 31, 2008. The decrease was primarily drivenby the use of more cash in 2008 for in-fill acquisitions and purchases of real estate held for investment.
50
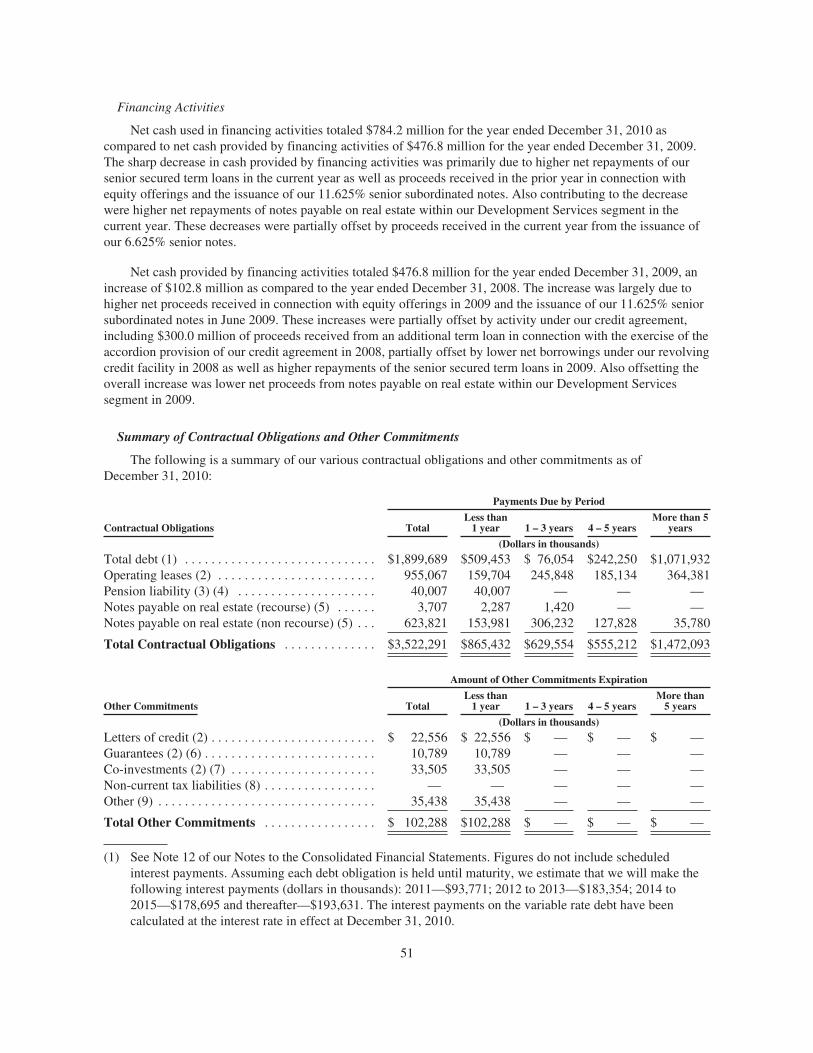
Financing Activities
Net cash used in financing activities totaled $784.2 million for the year ended December 31, 2010 ascompared to net cash provided by financing activities of $476.8 million for the year ended December 31, 2009.The sharp decrease in cash provided by financing activities was primarily due to higher net repayments of oursenior secured term loans in the current year as well as proceeds received in the prior year in connection withequity offerings and the issuance of our 11.625% senior subordinated notes. Also contributing to the decreasewere higher net repayments of notes payable on real estate within our Development Services segment in thecurrent year. These decreases were partially offset by proceeds received in the current year from the issuance ofour 6.625% senior notes.
Net cash provided by financing activities totaled $476.8 million for the year ended December 31, 2009, anincrease of $102.8 million as compared to the year ended December 31, 2008. The increase was largely due tohigher net proceeds received in connection with equity offerings in 2009 and the issuance of our 11.625% seniorsubordinated notes in June 2009. These increases were partially offset by activity under our credit agreement,including $300.0 million of proceeds received from an additional term loan in connection with the exercise of theaccordion provision of our credit agreement in 2008, partially offset by lower net borrowings under our revolvingcredit facility in 2008 as well as higher repayments of the senior secured term loans in 2009. Also offsetting theoverall increase was lower net proceeds from notes payable on real estate within our Development Servicessegment in 2009.
Summary of Contractual Obligations and Other Commitments
The following is a summary of our various contractual obligations and other commitments as ofDecember 31, 2010:
Payments Due by Period
Contractual Obligations TotalLess than
1 year 1 – 3 years 4 – 5 yearsMore than 5
years
(Dollars in thousands)
Total debt (1) . . . . . . . . . . . . . . . . . . . . . . . . . . . . . $1,899,689 $509,453 $ 76,054 $242,250 $1,071,932Operating leases (2) . . . . . . . . . . . . . . . . . . . . . . . . 955,067 159,704 245,848 185,134 364,381Pension liability (3) (4) . . . . . . . . . . . . . . . . . . . . . 40,007 40,007 — — —Notes payable on real estate (recourse) (5) . . . . . . 3,707 2,287 1,420 — —Notes payable on real estate (non recourse) (5) . . . 623,821 153,981 306,232 127,828 35,780
Total Contractual Obligations . . . . . . . . . . . . . . $3,522,291 $865,432 $629,554 $555,212 $1,472,093
Amount of Other Commitments Expiration
Other Commitments TotalLess than
1 year 1 – 3 years 4 – 5 yearsMore than
5 years
(Dollars in thousands)
Letters of credit (2) . . . . . . . . . . . . . . . . . . . . . . . . . $ 22,556 $ 22,556 $ — $ — $ —Guarantees (2) (6) . . . . . . . . . . . . . . . . . . . . . . . . . . 10,789 10,789 — — —Co-investments (2) (7) . . . . . . . . . . . . . . . . . . . . . . 33,505 33,505 — — —Non-current tax liabilities (8) . . . . . . . . . . . . . . . . . — — — — —Other (9) . . . . . . . . . . . . . . . . . . . . . . . . . . . . . . . . . 35,438 35,438 — — —
Total Other Commitments . . . . . . . . . . . . . . . . . $ 102,288 $102,288 $ — $ — $ —
(1) See Note 12 of our Notes to the Consolidated Financial Statements. Figures do not include scheduledinterest payments. Assuming each debt obligation is held until maturity, we estimate that we will make thefollowing interest payments (dollars in thousands): 2011—$93,771; 2012 to 2013—$183,354; 2014 to2015—$178,695 and thereafter—$193,631. The interest payments on the variable rate debt have beencalculated at the interest rate in effect at December 31, 2010.
51
(2) See Note 13 of our Notes to the Consolidated Financial Statements.(3) See Note 14 of our Notes to the Consolidated Financial Statements.(4) Because these obligations are related, either wholly or partially, to the future retirement of our employees
and such retirement dates are not predictable, an undeterminable portion of this amount will be paid in yearsone through five.
(5) See Note 11 of our Notes to the Consolidated Financial Statements. Figures do not include scheduledinterest payments. The notes (primarily construction loans) have either fixed or variable interest rates,ranging from 1.85% to 13.0% at December 31, 2010. In general, interest is drawn on the underlying loanand subsequently paid with proceeds received upon the sale of the real estate project.
(6) Due to the nature of guarantees, payments could be due at any time upon the occurrence of certain triggeringevents including default. Accordingly, all guarantees are reflected as expiring in less than one year.
(7) Includes $11.5 million related to our Global Investment Management segment, all of which is expected tobe funded in 2011 and $22.0 million related to our Development Services segment (callable at any time).
(8) As of December 31, 2010, our non-current tax liabilities, including interest and penalties, was $78.3 million.We are unable to reasonably estimate the timing of the effective settlement of tax positions.
(9) Represents outstanding reserves for claims under certain insurance programs, which are included in othercurrent and other long-term liabilities in the accompanying consolidated balance sheets at December 31,2010. Due to the nature of this item, payments could be due at any time upon the occurrence of certainevents. Accordingly, the entire balance has been reflected as expiring in less than one year.
Significant Indebtedness
Our level of indebtedness increases the possibility that we may be unable to generate cash sufficient to paywhen due the principal of, interest on or other amounts due in respect of our indebtedness and other obligations.In addition, we may incur additional debt from time to time to finance strategic acquisitions, investments, jointventures or for other purposes, subject to the restrictions contained in the documents governing our indebtedness.If we incur additional debt, the risks associated with our leverage, including our ability to service our debt, wouldincrease.
Since 2001, we have maintained a credit agreement with Credit Suisse Group AG, or CS, and other lendersto fund strategic acquisitions and to provide for our working capital needs. On March 24, 2009, we entered into asecond amendment and restatement to our credit agreement with a syndicate of banks led by CS, asadministrative and collateral agent, amending and restating our amended and restated credit agreement datedDecember 20, 2006. In connection with this amendment and restatement, we wrote off financing costs of $29.3million during the year ended December 31, 2009, which included the write-off of $18.1 million of unamortizeddeferred financing costs and $11.2 million of credit agreement amendment fees paid in March 2009. OnAugust 24, 2009, we entered into a loan modification agreement to our credit agreement, which included theconversion of $41.9 million of amounts outstanding under our revolving credit facility to term loans. On bothFebruary 5, 2010 and March 29, 2010, we entered into additional loan modification agreements to our creditagreement to further extend debt maturities and amortization schedules. On November 10, 2010, we entered intoa new credit agreement (Credit Agreement), with a syndicate of banks led by CS, as administrative and collateralagent, which completely replaced our previous credit agreement. In connection with the establishment of the newCredit Agreement, we wrote off financing costs of $16.7 million during the year ended December 31, 2010,including $12.1 million of credit agreement amendment fees paid in November 2010 and $4.6 million ofunamortized deferred financing costs associated with our prior credit agreement. In addition, in October 2010, wewrote off $1.4 million of unamortized deferred financing costs in connection with debt repayments made.
Our Credit Agreement currently includes the following: (1) a $700.0 million revolving credit facility,including revolving credit loans, letters of credit and a swingline loan facility, maturing on May 10, 2015; (2) a$350.0 million tranche A term loan facility requiring quarterly principal payments beginning December 31, 2010and continuing through September 30, 2015, with the balance payable on November 10, 2015, (3) a $300.0million tranche B term loan facility requiring quarterly principal payments beginning December 31, 2010 andcontinuing through September 30, 2016, with the balance payable on November 10, 2016; and (4) an accordion
52
provision which provides the ability to borrow an additional $800.0 million, which can be further expanded,subject to the satisfaction of customary conditions. During the year ended December 31, 2010, we repaid $1.7billion of our senior secured term loans under our previous credit agreement. In addition, we also made requiredprincipal payments of $9.5 million in December 2010 relative to senior secured term loans under our currentCredit Agreement.
The revolving credit facility allows for borrowings outside of the U.S., with sub-facilities of $5.0 millionavailable to one of our Canadian subsidiaries, $35.0 million in aggregate available to one of our Australian andone of our New Zealand subsidiaries and $50.0 million available to one of our U.K. subsidiaries. Additionally,outstanding borrowings under these sub-facilities may be up to 5.0% higher as allowed under the currencyfluctuation provision in the Credit Agreement. Borrowings under the revolving credit facility as of December 31,2010 bear interest at varying rates, based at our option, on either the applicable fixed rate plus 1.65% to 3.15% orthe daily rate plus 0.65% to 2.15% as determined by reference to our ratio of total debt less available cash toEBITDA (as defined in the Credit Agreement). As of December 31, 2010 and 2009, we had $17.5 million and$21.1 million, respectively, of revolving credit facility principal outstanding with related weighted averageinterest rates of 3.5% and 5.3%, respectively, which are included in short-term borrowings in the accompanyingconsolidated balance sheets. As of December 31, 2010, letters of credit totaling $20.0 million were outstandingunder the revolving credit facility. These letters of credit were primarily issued in the normal course of businessas well as in connection with certain insurance programs and reduce the amount we may borrow under therevolving credit facility.
Borrowings under the term loan facilities as of December 31, 2010 bear interest, based at our option, on thefollowing: for the tranche A term loan facility, on either the applicable fixed rate plus 2.00% to 3.75% or thedaily rate plus 1.00% to 2.75%, as determined by reference to our ratio of total debt less available cash toEBITDA (as defined in the Credit Agreement), and for the tranche B term loan facility, on either the applicablefixed rate plus 3.25% or the daily rate plus 2.25%. As of December 31, 2010, we had $341.3 million of tranche Aterm loan facility principal outstanding and $299.2 million of tranche B term loan facility principal outstanding,which are included in the accompanying consolidated balance sheets. As of December 31, 2009, we had $326.3million of tranche A term loan facility principal outstanding, $48.6 million of tranche A-1 term loan facilityprincipal outstanding, $203.2 million of tranche A-2 term loan facility principal outstanding, $167.5 million oftranche A-3 term loan facility principal outstanding, $642.8 million of tranche B term loan facility principaloutstanding and $295.2 million of tranche B-1 term loan facility principal outstanding, which are also included inthe accompanying consolidated balance sheets.
The Credit Agreement is jointly and severally guaranteed by us and substantially all of our domesticsubsidiaries. Borrowings under our Credit Agreement are secured by a pledge of substantially all of the capitalstock of our U.S. subsidiaries and 65% of the capital stock of certain non-U.S. subsidiaries. Also, the CreditAgreement requires us to pay a fee based on the total amount of the revolving credit facility commitment.
On February 17, 2011, we announced that we are embarking on the process of seeking commitments to fundup to an aggregate of $500.0 million of delayed draw, seven year senior secured term loans under a new TrancheC facility and up to an aggregate of $300.0 million of delayed draw, eight (or more) year senior secured termloans under a new Tranche D facility (together, the New Term Loans), the proceeds of which would be used tofinance our recently announced REIM Acquisitions. Additionally, we are embarking on the process of seeking anamendment to our Credit Agreement that, among other things, would (1) permit additional wholly-ownedsubsidiaries of the Company to be borrowers of the New Term Loans, (2) add an exception to the investmentcovenant relating to the REIM Acquisitions, (3) maintain the availability of the $800.0 million accordionprovision under the Credit Agreement and (4) provide certain other ancillary amendments related thereto. Theterms of the New Term Loans and the proposed amendment are preliminary and subject to review and approvalby us as well as the requisite lenders and, therefore, subject to further revision.
On October 8, 2010, CBRE issued $350.0 million in aggregate principal amount of 6.625% senior notes dueOctober 15, 2020. The 6.625% senior notes are unsecured obligations of CBRE, senior to all of its current and
53
future subordinated indebtedness, but effectively subordinated to all of its current and future securedindebtedness. The 6.625% senior notes are jointly and severally guaranteed on a senior basis by us and eachsubsidiary of CBRE that guarantees our Credit Agreement. Interest accrues at a rate of 6.625% per year and ispayable semi-annually in arrears on April 15 and October 15, commencing on April 15, 2011. The 6.625% seniornotes are redeemable at our option, in whole or in part, on or after October 15, 2014 at a redemption price of104.969% of the principal amount on that date and at declining prices thereafter. At any time prior to October 15,2014, the 6.625% senior notes may be redeemed by us, in whole or in part, at a redemption price equal to 100%of the principal amount, plus accrued and unpaid interest and an applicable premium (as defined in the indenturegoverning these notes), which is based on the present value of the October 15, 2014 redemption price plus allremaining interest payments through October 15, 2014. In addition, prior to October 15, 2013, up to 35.0% of theoriginal issued amount of the 6.625% senior notes may be redeemed at a redemption price of 106.625% of theprincipal amount, plus accrued and unpaid interest, solely with the net cash proceeds from public equityofferings. If a change of control triggering event (as defined in the indenture governing our 6.625% senior notes)occurs, we are obligated to make an offer to purchase the remaining 6.625% senior notes at a redemption price of101.0% of the principal amount, plus accrued and unpaid interest. The amount of the 6.625% senior notesincluded in the accompanying consolidated balance sheets was $350.0 million at December 31, 2010.
On June 18, 2009, CBRE issued $450.0 million in aggregate principal amount of 11.625% seniorsubordinated notes due June 15, 2017 for approximately $435.9 million, net of discount. The 11.625% seniorsubordinated notes are unsecured senior subordinated obligations of CBRE and are jointly and severallyguaranteed on a senior subordinated basis by us and our domestic subsidiaries that guarantee our CreditAgreement. Interest accrues at a rate of 11.625% per year and is payable semi-annually in arrears on June 15 andDecember 15. The 11.625% senior subordinated notes are redeemable at our option, in whole or in part, on orafter June 15, 2013 at 105.813% of par on that date and at declining prices thereafter. At any time prior toJune 15, 2013, the 11.625% senior subordinated notes may be redeemed by us, in whole or in part, at a priceequal to 100% of the principal amount, plus accrued and unpaid interest and an applicable premium (as definedin the indenture governing these notes), which is based on the present value of the June 15, 2013 redemptionprice plus all remaining interest payments through June 15, 2013. In addition, prior to June 15, 2012, up to 35.0%of the original issued amount of the 11.625% senior subordinated notes may be redeemed at 111.625% of par,plus accrued and unpaid interest, solely with the net cash proceeds from public equity offerings. In the event of achange of control (as defined in the indenture governing our 11.625% senior subordinated notes), we areobligated to make an offer to purchase the remaining 11.625% senior subordinated notes at a redemption price of101.0% of the principal amount, plus accrued and unpaid interest. The amount of the 11.625% seniorsubordinated notes included in the accompanying consolidated balance sheets, net of unamortized discount, was$437.7 million and $436.5 million at December 31, 2010 and 2009, respectively.
Our Credit Agreement and the indentures governing our 6.625% senior notes and 11.625% seniorsubordinated notes contain numerous restrictive covenants that, among other things, limit our ability to incuradditional indebtedness, pay dividends or make distributions to stockholders, repurchase capital stock or debt,make investments, sell assets or subsidiary stock, create or permit liens on assets, engage in transactions withaffiliates, enter into sale/leaseback transactions, issue subsidiary equity and enter into consolidations or mergers.Our Credit Agreement also currently requires us to maintain a minimum coverage ratio of EBITDA (as definedin the Credit Agreement) to total interest expense of 2.25x and a maximum leverage ratio of total debt lessavailable cash to EBITDA (as defined in the Credit Agreement) of 3.75x. Our coverage ratio of EBITDA to totalinterest expense was 8.16x for the year ended December 31, 2010 and our leverage ratio of total debt lessavailable cash to EBITDA was 0.94x as of December 31, 2010. We may from time to time, in our sole discretion,look for opportunities to reduce our outstanding debt under our Credit Agreement and under our 6.625% seniornotes and 11.625% senior subordinated notes.
From time to time, Moody’s Investor Service, Inc., or Moody’s, and Standard & Poor’s Ratings Services, orStandard & Poor’s, rate our senior debt. On October 5, 2010, Standard & Poor’s revised our outlook to stablefrom negative and affirmed our BB long-term counterparty credit rating. Additionally, a BB debt rating and arecovery rating of 3 was assigned to the $1.35 billion credit facility, and a B+ senior unsecured debt rating and a
54
recovery rating of 6 was assigned to the 6.625% senior notes. Moody’s assigned a (P)Ba1 rating to the $1.35billion credit facility and a Ba1 rating to the 6.625% senior notes, and placed the 11.625% senior subordinatednotes on review for upgrade. The rating outlook was revised to stable from negative. The (P) for the creditfacility rating was removed on November 10, 2010 upon the closing of the new Credit Agreement, and the ratingof the 11.625% senior subordinated notes was upgraded to Ba2. On February 16, 2011, Moody’s affirmed itsratings on our existing senior debt. On February 17, 2011, Standard & Poor’s also affirmed its ratings on ourexisting senior debt as well as assigned a BB issue-level rating and a recovery rating of 4 to our planned $800million in incremental credit facility borrowings. Neither the Moody’s nor the Standard & Poor’s ratings impactour ability to borrow under our Credit Agreement. However, these ratings may impact our ability to borrowunder new agreements in the future and the interest rates of any such future borrowings.
We had short-term borrowings of $471.4 million and $339.8 million with related average interest rates of2.8% and 2.4% as of December 31, 2010 and 2009, respectively.
On March 2, 2007, we entered into a $50.0 million credit note with Wells Fargo Bank for the purpose ofpurchasing eligible investments, which include cash equivalents, agency securities, A1/P1 commercial paper andeligible money market funds. The proceeds of this note are not made generally available to us, but insteaddeposited in an investment account maintained by Wells Fargo Bank and used and applied solely to purchaseeligible investment securities. This agreement has been amended several times and currently provides for a $40.0million revolving credit note, bears interest at 0.25% and has a maturity date of December 1, 2011. As ofDecember 31, 2010 and 2009, there were no amounts outstanding under this revolving credit note.
On March 4, 2008, we entered into a $35.0 million credit and security agreement with Bank of America, orBofA, for the purpose of purchasing eligible financial instruments, which include A1/P1 commercial paper, U.S.Treasury securities, GSE discount notes (as defined in the credit and security agreement) and money marketfunds. The proceeds of this note are not made generally available to us, but instead deposited in an investmentaccount maintained by BofA and used and applied solely to purchase eligible financial instruments. Thisagreement has been amended several times and currently provides for a $5.0 million credit line, bears interest at1% and has a maturity date of February 28, 2012. As of December 31, 2010 and 2009, there were no amountsoutstanding under this revolving note.
On August 19, 2008, we entered into a $15.0 million uncommitted facility with First Tennessee Bank for thepurpose of purchasing investments, which include cash equivalents, agency securities, A1/P1 commercial paper andeligible money market funds. The proceeds of this facility are not made generally available to us, but instead areheld in a collateral account maintained by First Tennessee Bank. This agreement has been amended several timesand currently provides for a $4.0 million credit line, bears interest at 0.25% and has a maturity date of August 4,2011. As of December 31, 2010 and 2009, there were no amounts outstanding under this facility.
On April 19, 2010, we entered into a Receivables Purchase Agreement, or RPA, which allows us to transferan undivided interest in a designated pool of U.S. accounts receivable, on an ongoing basis, to provide collateralfor borrowings up to a maximum of $55.0 million. Borrowings under this arrangement generally bear interest atthe commercial paper rate plus 2.75% and this agreement expires on April 18, 2011. As of December 31, 2010,there were no amounts outstanding under this agreement.
Our wholly-owned subsidiary CBRE Capital Markets has the following warehouse lines of credit: creditagreements with JP Morgan Chase Bank, N.A., or JP Morgan, BofA, TD Bank, N.A., or TD Bank, and KempsLanding Capital Company, LLC, or Kemps Landing, for the purpose of funding mortgage loans that will beresold and a funding arrangement with Fannie Mae for the purpose of selling a percentage of certain closedmulti-family loans.
On November 15, 2005, CBRE Capital Markets entered into a secured credit agreement with JP Morgan toestablish a warehouse line of credit. Effective October 12, 2010 through January 10, 2011, the warehouse line ofcredit was temporarily increased from $210.0 million to $250.0 million. Effective November 22, 2010 through
55
February 1, 2011, the warehouse line of credit was temporarily increased further from $250.0 million to $300.0million. This agreement has been amended several times and effective February 1, 2011, provides for a $210.0million senior secured revolving line of credit, bears interest at the daily Chase-London LIBOR plus 2.50% andhas a maturity date of September 28, 2011.
On April 16, 2008, CBRE Capital Markets entered into a secured credit agreement with BofA to establish awarehouse line of credit. This agreement has been amended several times and currently provides for a $125.0million senior secured revolving line of credit, bears interest at the daily one-month LIBOR plus 2.50% with amaturity date of May 31, 2011.
In August 2009, CBRE Capital Markets entered into a funding arrangement with Fannie Mae under itsMultifamily As Soon As Pooled Plus Agreement and its Multifamily As Soon As Pooled Sale Agreement, orASAP Program. Under the ASAP Program, CBRE Capital Markets may elect, on a transaction by transactionbasis, to sell a percentage of certain closed multifamily loans to Fannie Mae on an expedited basis. After allcontingencies are satisfied, the ASAP Program requires that CBRE Capital Markets repurchase the interest in themultifamily loan previously sold to Fannie Mae followed by either a full delivery back to Fannie Mae via wholeloan execution or a securitization into a mortgage backed security. Under this agreement, the maximumoutstanding balance under the ASAP Program cannot exceed $150.0 million and, between the sale date to FannieMae and the repurchase date by CBRE Capital Markets, the outstanding balance bears interest and is payable toFannie Mae at the daily LIBOR rate plus 1.35% with a LIBOR floor of 0.35%. Effective December 1, 2009through January 15, 2010, the maximum outstanding balance under the ASAP Program was temporarilyincreased from $150.0 million to $225.0 million.
On December 21, 2010, CBRE Capital Markets entered into a secured credit agreement with TD Bank toestablish a warehouse line of credit. This agreement provides for a $75.0 million senior secured revolving line ofcredit, bears interest at the daily one-month LIBOR plus 2.00% with a maturity date of December 31, 2011.
On December 21, 2010, CBRE Capital Markets entered into an uncommitted funding arrangement withKemps Landing providing CBRE Capital Markets with the ability to fund Freddie Mac multi-family loans. Underthe agreement, the maximum outstanding balance cannot exceed $200.0 million, outstanding borrowings bearinterest at LIBOR plus 2.75% with a LIBOR floor of 0.25% and the agreement expires on December 20, 2011.
During the year ended December 31, 2010, we had a maximum of $453.8 million of warehouse lines ofcredit principal outstanding. As of December 31, 2010 and 2009, we had $453.8 million and $312.9 million ofwarehouse lines of credit principal outstanding, respectively, which are included in short-term borrowings in theaccompanying consolidated balance sheets. Additionally, we had $485.4 million and $315.0 million of mortgageloans held for sale (warehouse receivables), which substantially represented mortgage loans funded through thelines of credit that, while committed to be purchased, had not yet been purchased as of December 31, 2010 and2009, respectively, and which are also included in the accompanying consolidated balance sheets.
On July 31, 2006, CBRE Capital Markets entered into a revolving credit note with JP Morgan for thepurpose of purchasing qualified investment securities, which include but are not limited to U.S. Treasury andAgency securities. This agreement was amended several times and provided for a $25.0 million revolving creditnote, bore interest at 0.50% and had a maturity date of January 28, 2011. Effective September 29, 2010, thisagreement was terminated. As of December 31, 2009, there were no amounts outstanding under this revolvingcredit note.
On April 30, 2007, Trammell Crow Company Acquisitions II, L.P., or Acquisitions II, a consolidatedlimited partnership within our Development Services segment, entered into a $100.0 million revolving creditagreement, or the WestLB Credit Agreement, with WestLB AG, as administrative agent for a lender group. InApril 2010, Acquisitions II opted to reduce the amount available under the WestLB Credit Agreement to $20.0million and in October 2010, repaid the outstanding balance and the credit agreement expired. Borrowings underthis credit agreement were used to fund investments in real estate prior to receipt of capital contributions from
56
Acquisitions II investors and permanent project financing, and were limited to a portion of unfunded capitalcommitments of certain Acquisitions II investors. Borrowings under this agreement bore interest at the dailyBritish Bankers Association LIBOR plus 0.65%. Borrowings under the line were nonrecourse to us and weresecured by the capital commitments of the investors in Acquisitions II. As of December 31, 2009, there was $5.5million outstanding under the WestLB Credit Agreement included in short-term borrowings in the accompanyingconsolidated balance sheets.
Pension Liability
Our subsidiaries based in the United Kingdom maintain two contributory defined benefit pension plans toprovide retirement benefits to existing and former employees participating in the plans. The underfunded statusof our defined benefit pension plans included in pension liability in the accompanying consolidated balancesheets was $40.0 million and $64.9 million at December 31, 2010 and 2009, respectively. We expect tocontribute a total of $3.6 million to fund our pension plans for the year ending December 31, 2011.
Off-Balance Sheet Arrangements
We had outstanding letters of credit totaling $22.6 million as of December 31, 2010, excluding letters ofcredit for which we have outstanding liabilities already accrued on our consolidated balance sheet related to oursubsidiaries’ outstanding reserves for claims under certain insurance programs as well as letters of credit relatedto operating leases. These letters of credit are primarily executed by us in the normal course of business as wellas in connection with certain insurance programs. The letters of credit expire at varying dates through December2011.
We had guarantees totaling $10.8 million as of December 31, 2010, excluding guarantees related to pensionliabilities, consolidated indebtedness and other obligations for which we have outstanding liabilities alreadyaccrued on our consolidated balance sheet as well as operating leases. The $10.8 million primarily consists ofguarantees of obligations of unconsolidated subsidiaries, which expire at varying dates through November 2013.
In addition, as of December 31, 2010, we had numerous completion and budget guarantees relating todevelopment projects. These guarantees are made by us in the normal course of our Development Servicesbusiness. Each of these guarantees requires us to complete construction of the relevant project within a specifiedtimeframe and/or within a specified budget, with us potentially being liable for costs to complete in excess ofsuch timeframe or budget. However, we generally have “guaranteed maximum price” contracts with reputablegeneral contractors with respect to projects for which we provide these guarantees. These contracts are intendedto pass the risk to such contractors. While there can be no assurance, we do not expect to incur any materiallosses under these guarantees.
From time to time, we act as a general contractor with respect to construction projects. We do not considerthese activities to be a material part of our business. In connection with these activities, we seek to subcontractconstruction work for certain projects to reputable subcontractors. Should construction defects arise relating tothe underlying projects, we could potentially be liable to the client for the costs to repair such defects, althoughwe would generally look to the subcontractor that performed the work to remedy the defect and also look toinsurance policies that cover this work. While there can be no assurance, we do not expect to incur materiallosses with respect to construction defects.
In January 2008, CBRE Multifamily Capital, Inc., or CBRE MCI, a wholly-owned subsidiary of CBRECapital Markets, Inc., entered into an agreement with Fannie Mae, under Fannie Mae’s Delegated Underwritingand Servicing Lender Program, or DUS Program, to provide financing for multifamily housing with five or moreunits. Under the DUS Program, CBRE MCI originates, underwrites, closes and services loans without priorapproval by Fannie Mae, and in selected cases, is subject to sharing up to one-third of any losses on loansoriginated under the DUS Program. CBRE MCI has funded loans subject to such loss sharing arrangements withunpaid principal balances of $2.1 billion at December 31, 2010. Additionally, CBRE MCI has funded loans
57
under the DUS Program that are not subject to loss sharing arrangements with unpaid principal balances ofapproximately $435.3 million at December 31, 2010. CBRE MCI, under its agreement with Fannie Mae, mustpost cash reserves under formulas established by Fannie Mae to provide for sufficient capital in the event lossesoccur. As of December 31, 2010 and 2009, CBRE MCI had $2.2 million and $1.2 million, respectively, of cashdeposited under this reserve arrangement, and had provided approximately $4.0 million and $2.0 million,respectively, of loan loss accruals. Fannie Mae’s recourse under the DUS Program is limited to the assets ofCBRE MCI, which totaled approximately $169.0 million (including $127.1 million of warehouse receivables) atDecember 31, 2010.
An important part of the strategy for our Global Investment Management business involves investing ourcapital in certain real estate investments with our clients. These co-investments typically range from 2% to 5% ofthe equity in a particular fund. As of December 31, 2010, we had aggregate commitments of $11.5 million tofund future co-investments, all of which is expected to be funded in 2011. In addition to required future capitalcontributions, some of the co-investment entities may request additional capital from us and our subsidiariesholding investments in those assets and the failure to provide these contributions could have adverseconsequences to our interests in these investments.
Additionally, an important part of our Development Services business strategy is to invest in unconsolidatedreal estate subsidiaries as a principal (in most cases co-investing with our clients). As of December 31, 2010, wehad committed to fund $22.0 million of additional capital to these unconsolidated subsidiaries, which may becalled at any time.
Seasonality
A significant portion of our revenue is seasonal, which can affect an investor’s ability to compare ourfinancial condition and results of operations on a quarter-by-quarter basis. Historically, this seasonality hascaused our revenue, operating income, net income and cash flow from operating activities to be lower in the firsttwo quarters and higher in the third and fourth quarters of each year. Earnings and cash flow have historicallybeen particularly concentrated in the fourth quarter due to investors and companies focusing on completingtransactions prior to calendar year-end. This has historically resulted in lower profits or a loss in the first quarter,with revenue and profitability improving in each subsequent quarter.
Inflation
Our commissions and other variable costs related to revenue are primarily affected by real estate marketsupply and demand, which may be affected by general economic conditions including inflation. However, todate, we do not believe that general inflation has had a material impact upon our operations.
New Accounting Pronouncements
In January 2010, the FASB issued ASU 2010-06, “Improving Disclosures about Fair Value Measurements,”which provides amendments to the FASB ASC Subtopic 820-10 that require new disclosures regarding(i) transfers in and out of Level 1 and Level 2 fair value measurements and (ii) activity in Level 3 fair valuemeasurements. ASU 2010-06 also clarifies existing disclosures regarding (i) the level of asset and liabilitydisaggregation and (ii) fair value measurement inputs and valuation techniques. As required, we adopted the newdisclosures and clarifications of existing disclosure requirements, except for the disclosures about purchases,sales, issuances and settlements in the roll forward of activity in Level 3 fair value measurements. Thosedisclosures are effective for fiscal years beginning after December 15, 2010, and for interim periods within thosefiscal years. We are currently evaluating the disclosure impact of adoption on our consolidated financialstatements, but do not expect it to have a material impact.
58
Item 7A. Quantitative and Qualitative Disclosures About Market Risk
Our exposure to market risk consists of foreign currency exchange rate fluctuations related to ourinternational operations and changes in interest rates on debt obligations.
Exchange Rates
During the year ended December 31, 2010, approximately 40% of our business was transacted in localcurrencies of foreign countries, the majority of which includes the Euro, the British pound sterling, the Canadiandollar, the Hong Kong dollar, the Japanese yen, the Singapore dollar, the Australian dollar and the Indian rupee.We attempt to manage our exposure primarily by balancing assets and liabilities and maintaining cash positionsin foreign currencies only at levels necessary for operating purposes. Fluctuations in foreign currency exchangerates affect reported amounts of our total assets and liabilities, which are reflected in our financial statements astranslated into U.S. dollars for each financial reporting period at the exchange rate in effect on the respectivebalance sheet dates, and our total revenue and expenses, which are reflected in our financial statements astranslated into U.S. dollars for each financial reporting period at the monthly average exchange rate. During theyear ended December 31, 2010, foreign currency translation had a $44.1 million positive impact on our totalrevenue and a $41.8 million negative impact on our total costs of services and operating, administrative and otherexpenses.
We routinely monitor our exposure to currency exchange rate changes in connection with transactions andsometimes enter into foreign currency exchange swap, option and forward contracts to limit our exposure to suchtransactions, as appropriate. In the normal course of business, we also sometimes utilize derivative financialinstruments in the form of foreign currency exchange contracts to mitigate foreign currency exchange exposureresulting from inter-company loans, expected cash flow and earnings. We apply the “Derivatives and Hedging”Topic of the Financial Accounting Standards Board (FASB) Accounting Standards Codification (ASC) (Topic815) when accounting for any such contracts. In all cases, we view derivative financial instruments as a riskmanagement tool and, accordingly, do not engage in any speculative activities with respect to foreign currency.On December 22, 2008, we entered into a foreign currency exchange swap contract with an aggregate notionalamount of 39.5 million British pounds sterling, which expired on February 18, 2009, at which time we enteredinto another contract with similar terms that was settled on April 6, 2009. On May 12, 2009, we entered into anoption agreement to sell a notional amount of 25.0 million of Euros, which expired on December 29, 2009. OnJune 26, 2009, we entered into two option agreements, including one to sell a notional amount of 5.5 million ofBritish pounds sterling, which was exercised on September 28, 2009, and one to sell 10.0 million of Britishpounds sterling, which was sold on December 18, 2009. On April 6, 2010, we entered into three optionagreements, including one to sell a notional amount of 4.0 million British pounds sterling, which was exercisedon June 28, 2010, one to sell a notional amount of 4.0 million British pounds sterling, which expired onSeptember 28, 2010 and one to sell a notional amount of 7.6 million British pounds sterling, which expired onDecember 29, 2010. On April 12, 2010, we entered into three additional option agreements, including one to sella notional amount of 2.7 million Euros, which was exercised on June 28, 2010, one to sell a notional amount of2.4 million Euros, which was exercised on September 28, 2010 and one to sell a notional amount of 11.0 millionEuros, which was exercised on December 29, 2010. Included in the consolidated statement of operations werecharges of $1.0 million and $3.7 million for the years ended December 31, 2010 and 2009, respectively, resultingfrom net losses on foreign currency exchange option agreements.
We also enter into loan commitments that relate to the origination or acquisition of commercial mortgageloans that will be held for resale. FASB ASC Topic 815 requires that these commitments be recorded at their fairvalues as derivatives. The net impact on our financial position and earnings resulting from these derivativescontracts has not been significant.
59
Interest Rates
We manage our interest expense by using a combination of fixed and variable rate debt. Excluding notespayable on real estate, our fixed and variable rate long-term debt at December 31, 2010 consisted of thefollowing (dollars in thousands):
Year of MaturityFixedRate
DailyLIBOR+ 1.35%with a
LIBORfloor of0.35%
DailyOne-Month
LIBOR+2.50%
DailyChase-
LondonLIBOR+2.50%
DailyLIBOR+ 2.75%with a
LIBORfloor of0.25%
LIBOR+ 2.25%
(1)
LIBOR+ 3.25%
(1) (2) Total
2011 . . . . . . . . . . . . . . . . . $ 102 $26,881 $73,383 $153,571 $200,000 $ 35,000 $ 3,000 $17,516 $ 509,4532012 . . . . . . . . . . . . . . . . . 41 — — — — 35,000 3,000 — 38,0412013 . . . . . . . . . . . . . . . . . 13 — — — — 35,000 3,000 — 38,0132014 . . . . . . . . . . . . . . . . . — — — — — 35,000 3,000 — 38,0002015 . . . . . . . . . . . . . . . . . — — — — — 201,250 3,000 — 204,250Thereafter . . . . . . . . . . . . . 787,682 — — — — — 284,250 — 1,071,932
Total . . . . . . . . . . . . . . . $787,838 $26,881 $73,383 $153,571 $200,000 $341,250 $299,250 $17,516 $1,899,689
Weighted AverageInterest Rate . . . . . . . . . 9.4% 1.7% 2.8% 2.8% 3.0% 2.5% 3.5% 3.5% 5.6%
(1) Consists of amounts due under our senior secured term loan facilities.(2) Consists of amounts due under our revolving credit facility as follows (dollars in thousands): $10,120 at LIBOR + 1.85%; $7,396 at Bank
Bill Rate + 1.85%.
We utilize sensitivity analyses to assess the potential effect of our variable rate debt. If interest rates were toincrease by 10% on our outstanding variable rate debt, excluding notes payable on real estate, at December 31,2010, the net impact of the additional interest cost would be a decrease of $3.2 million on pre-tax income andcash provided by operating activities for the year ended December 31, 2010.
Based upon information from third-party banks, the estimated fair value of our senior secured term loanswas approximately $641.8 million at December 31, 2010. Based on dealers’ quotes, the estimated fair values ofour 6.625% and 11.625% senior subordinated notes was $347.8 million and $508.3 million, respectively, atDecember 31, 2010.
We also have $627.5 million of notes payable on real estate as of December 31, 2010. These notes haveinterest rates ranging from 1.85% to 13.0% with maturity dates extending through 2023. Interest costs relating tonotes payable on real estate include both interest that is expensed and interest that is capitalized as part of the costof real estate. If interest rates were to increase by 10%, our total estimated interest cost related to notes payablewould increase by approximately $3.6 million for the year ended December 31, 2010. From time to time, weenter into interest rate swap and cap agreements in order to limit our interest expense related to our notes payableon real estate. If any of these agreements are not designated as effective hedges, then they are marked to marketeach period with the change in fair value recognized in current period earnings. The net impact on our earningsresulting from gains and/or losses on interest rate swap and cap agreements associated with notes payable on realestate has not been significant.
60
Item 8. Financial Statements and Supplementary Data
INDEX TO CONSOLIDATED FINANCIAL STATEMENTSAND FINANCIAL STATEMENT SCHEDULES
Page
Report of Independent Registered Public Accounting Firm . . . . . . . . . . . . . . . . . . . . . . . . . . . . . . . . . . . . . . 62
Consolidated Balance Sheets at December 31, 2010 and 2009 . . . . . . . . . . . . . . . . . . . . . . . . . . . . . . . . . . . . 64
Consolidated Statements of Operations for the years ended December 31, 2010, 2009 and 2008 . . . . . . . . . 65
Consolidated Statements of Cash Flows for the years ended December 31, 2010, 2009 and 2008 . . . . . . . . . 66
Consolidated Statements of Equity for the years ended December 31, 2010, 2009 and 2008 . . . . . . . . . . . . . 67
Consolidated Statements of Comprehensive Income (Loss) for the years ended December 31, 2010, 2009and 2008 . . . . . . . . . . . . . . . . . . . . . . . . . . . . . . . . . . . . . . . . . . . . . . . . . . . . . . . . . . . . . . . . . . . . . . . . . . . . 68
Notes to Consolidated Financial Statements . . . . . . . . . . . . . . . . . . . . . . . . . . . . . . . . . . . . . . . . . . . . . . . . . . 69
Quarterly Results of Operations (Unaudited) . . . . . . . . . . . . . . . . . . . . . . . . . . . . . . . . . . . . . . . . . . . . . . . . . . 136
FINANCIAL STATEMENT SCHEDULES:
Schedule II—Valuation and Qualifying Accounts . . . . . . . . . . . . . . . . . . . . . . . . . . . . . . . . . . . . . . . . . . . . . . 140
Schedule III—Real Estate Investments and Accumulated Depreciation . . . . . . . . . . . . . . . . . . . . . . . . . . . . . 141
All other schedules are omitted because they are either not applicable, not required or the information required isincluded in the Consolidated Financial Statements, including the notes thereto.
61
REPORT OF INDEPENDENT REGISTERED PUBLIC ACCOUNTING FIRM
The Board of Directors and StockholdersCB Richard Ellis Group, Inc.:
We have audited the accompanying consolidated balance sheets of CB Richard Ellis Group, Inc. (the Company)and subsidiaries as of December 31, 2010 and 2009, and the related consolidated statements of operations, cashflows, equity and comprehensive income (loss) for each of the years in the three-year period ended December 31,2010. In connection with our audits of the consolidated financial statements, we also have audited the relatedfinancial statement schedules. We also have audited the Company’s internal control over financial reporting as ofDecember 31, 2010, based on criteria established in Internal Control—Integrated Framework issued by theCommittee of Sponsoring Organizations of the Treadway Commission (COSO). The Company’s management isresponsible for these consolidated financial statements and financial statement schedules, for maintainingeffective internal control over financial reporting, and for its assessment of the effectiveness of internal controlover financial reporting, included in the accompanying Management’s Report on Internal Control OverFinancial Reporting. Our responsibility is to express an opinion on these consolidated financial statements andfinancial statement schedules and an opinion on the Company’s internal control over financial reporting based onour audits.
We conducted our audits in accordance with the standards of the Public Company Accounting Oversight Board(United States). Those standards require that we plan and perform the audit to obtain reasonable assurance aboutwhether the financial statements are free of material misstatement and whether effective internal control overfinancial reporting was maintained in all material respects. Our audits of the consolidated financial statementsincluded examining, on a test basis, evidence supporting the amounts and disclosures in the financial statements,assessing the accounting principles used and significant estimates made by management, and evaluating theoverall financial statement presentation. Our audit of internal control over financial reporting included obtainingan understanding of internal control over financial reporting, assessing the risk that a material weakness exists,and testing and evaluating the design and operating effectiveness of internal control based on the assessed risk.Our audits also included performing such other procedures as we considered necessary in the circumstances. Webelieve that our audits provide a reasonable basis for our opinions.
A company’s internal control over financial reporting is a process designed to provide reasonable assuranceregarding the reliability of financial reporting and the preparation of financial statements for external purposes inaccordance with generally accepted accounting principles. A company’s internal control over financial reportingincludes those policies and procedures that (1) pertain to the maintenance of records that, in reasonable detail,accurately and fairly reflect the transactions and dispositions of the assets of the company; (2) provide reasonableassurance that transactions are recorded as necessary to permit preparation of financial statements in accordancewith generally accepted accounting principles, and that receipts and expenditures of the company are being madeonly in accordance with authorizations of management and directors of the company; and (3) provide reasonableassurance regarding prevention or timely detection of unauthorized acquisition, use, or disposition of thecompany’s assets that could have a material effect on the financial statements.
Because of its inherent limitations, internal control over financial reporting may not prevent or detectmisstatements. Also, projections of any evaluation of effectiveness to future periods are subject to the risk thatcontrols may become inadequate because of changes in conditions, or that the degree of compliance with thepolicies or procedures may deteriorate.
In our opinion, the consolidated financial statements referred to above present fairly, in all material respects, thefinancial position of CB Richard Ellis Group, Inc. and subsidiaries as of December 31, 2010 and 2009, and theresults of their operations and their cash flows for each of the years in the three-year period ended December 31,2010, in conformity with U.S. generally accepted accounting principles. Also in our opinion, the related financialstatement schedules, when considered in relation to the basic consolidated financial statements taken as a whole,
62

present fairly, in all material respects, the information set forth therein. Also in our opinion, CB Richard EllisGroup, Inc. maintained, in all material respects, effective internal control over financial reporting as ofDecember 31, 2010, based on criteria established in Internal Control—Integrated Framework issued by theCommittee of Sponsoring Organizations of the Treadway Commission.
/s/ KPMG LLP
Los Angeles, CaliforniaMarch 1, 2011
63
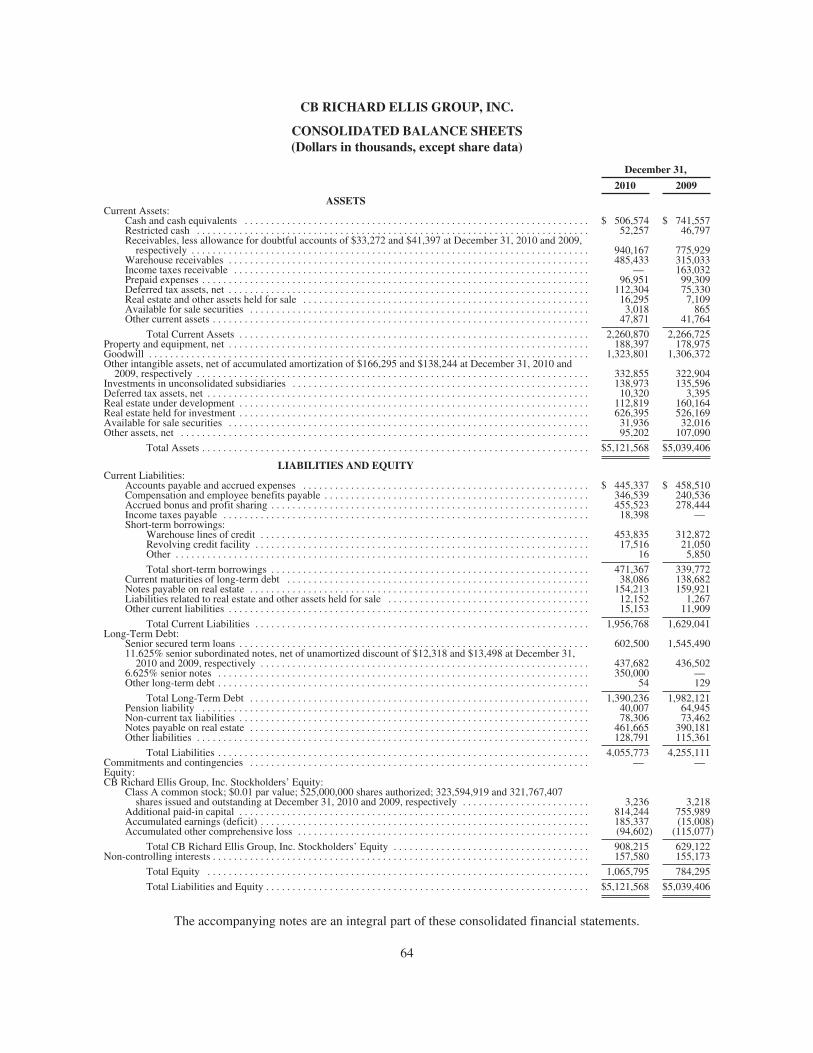
CB RICHARD ELLIS GROUP, INC.
CONSOLIDATED BALANCE SHEETS(Dollars in thousands, except share data)
December 31,
2010 2009ASSETS
Current Assets:Cash and cash equivalents . . . . . . . . . . . . . . . . . . . . . . . . . . . . . . . . . . . . . . . . . . . . . . . . . . . . . . . . . . . . . . . . . $ 506,574 $ 741,557Restricted cash . . . . . . . . . . . . . . . . . . . . . . . . . . . . . . . . . . . . . . . . . . . . . . . . . . . . . . . . . . . . . . . . . . . . . . . . . . 52,257 46,797Receivables, less allowance for doubtful accounts of $33,272 and $41,397 at December 31, 2010 and 2009,
respectively . . . . . . . . . . . . . . . . . . . . . . . . . . . . . . . . . . . . . . . . . . . . . . . . . . . . . . . . . . . . . . . . . . . . . . . . . . . 940,167 775,929Warehouse receivables . . . . . . . . . . . . . . . . . . . . . . . . . . . . . . . . . . . . . . . . . . . . . . . . . . . . . . . . . . . . . . . . . . . . 485,433 315,033Income taxes receivable . . . . . . . . . . . . . . . . . . . . . . . . . . . . . . . . . . . . . . . . . . . . . . . . . . . . . . . . . . . . . . . . . . . — 163,032Prepaid expenses . . . . . . . . . . . . . . . . . . . . . . . . . . . . . . . . . . . . . . . . . . . . . . . . . . . . . . . . . . . . . . . . . . . . . . . . . 96,951 99,309Deferred tax assets, net . . . . . . . . . . . . . . . . . . . . . . . . . . . . . . . . . . . . . . . . . . . . . . . . . . . . . . . . . . . . . . . . . . . . 112,304 75,330Real estate and other assets held for sale . . . . . . . . . . . . . . . . . . . . . . . . . . . . . . . . . . . . . . . . . . . . . . . . . . . . . . 16,295 7,109Available for sale securities . . . . . . . . . . . . . . . . . . . . . . . . . . . . . . . . . . . . . . . . . . . . . . . . . . . . . . . . . . . . . . . . 3,018 865Other current assets . . . . . . . . . . . . . . . . . . . . . . . . . . . . . . . . . . . . . . . . . . . . . . . . . . . . . . . . . . . . . . . . . . . . . . . 47,871 41,764
Total Current Assets . . . . . . . . . . . . . . . . . . . . . . . . . . . . . . . . . . . . . . . . . . . . . . . . . . . . . . . . . . . . . . . . . . 2,260,870 2,266,725Property and equipment, net . . . . . . . . . . . . . . . . . . . . . . . . . . . . . . . . . . . . . . . . . . . . . . . . . . . . . . . . . . . . . . . . . . . . 188,397 178,975Goodwill . . . . . . . . . . . . . . . . . . . . . . . . . . . . . . . . . . . . . . . . . . . . . . . . . . . . . . . . . . . . . . . . . . . . . . . . . . . . . . . . . . . 1,323,801 1,306,372Other intangible assets, net of accumulated amortization of $166,295 and $138,244 at December 31, 2010 and
2009, respectively . . . . . . . . . . . . . . . . . . . . . . . . . . . . . . . . . . . . . . . . . . . . . . . . . . . . . . . . . . . . . . . . . . . . . . . . . . 332,855 322,904Investments in unconsolidated subsidiaries . . . . . . . . . . . . . . . . . . . . . . . . . . . . . . . . . . . . . . . . . . . . . . . . . . . . . . . . 138,973 135,596Deferred tax assets, net . . . . . . . . . . . . . . . . . . . . . . . . . . . . . . . . . . . . . . . . . . . . . . . . . . . . . . . . . . . . . . . . . . . . . . . . 10,320 3,395Real estate under development . . . . . . . . . . . . . . . . . . . . . . . . . . . . . . . . . . . . . . . . . . . . . . . . . . . . . . . . . . . . . . . . . . 112,819 160,164Real estate held for investment . . . . . . . . . . . . . . . . . . . . . . . . . . . . . . . . . . . . . . . . . . . . . . . . . . . . . . . . . . . . . . . . . . 626,395 526,169Available for sale securities . . . . . . . . . . . . . . . . . . . . . . . . . . . . . . . . . . . . . . . . . . . . . . . . . . . . . . . . . . . . . . . . . . . . 31,936 32,016Other assets, net . . . . . . . . . . . . . . . . . . . . . . . . . . . . . . . . . . . . . . . . . . . . . . . . . . . . . . . . . . . . . . . . . . . . . . . . . . . . . 95,202 107,090
Total Assets . . . . . . . . . . . . . . . . . . . . . . . . . . . . . . . . . . . . . . . . . . . . . . . . . . . . . . . . . . . . . . . . . . . . . . . . . $5,121,568 $5,039,406
LIABILITIES AND EQUITYCurrent Liabilities:
Accounts payable and accrued expenses . . . . . . . . . . . . . . . . . . . . . . . . . . . . . . . . . . . . . . . . . . . . . . . . . . . . . . $ 445,337 $ 458,510Compensation and employee benefits payable . . . . . . . . . . . . . . . . . . . . . . . . . . . . . . . . . . . . . . . . . . . . . . . . . . 346,539 240,536Accrued bonus and profit sharing . . . . . . . . . . . . . . . . . . . . . . . . . . . . . . . . . . . . . . . . . . . . . . . . . . . . . . . . . . . . 455,523 278,444Income taxes payable . . . . . . . . . . . . . . . . . . . . . . . . . . . . . . . . . . . . . . . . . . . . . . . . . . . . . . . . . . . . . . . . . . . . . 18,398 —Short-term borrowings:
Warehouse lines of credit . . . . . . . . . . . . . . . . . . . . . . . . . . . . . . . . . . . . . . . . . . . . . . . . . . . . . . . . . . . . . . 453,835 312,872Revolving credit facility . . . . . . . . . . . . . . . . . . . . . . . . . . . . . . . . . . . . . . . . . . . . . . . . . . . . . . . . . . . . . . . 17,516 21,050Other . . . . . . . . . . . . . . . . . . . . . . . . . . . . . . . . . . . . . . . . . . . . . . . . . . . . . . . . . . . . . . . . . . . . . . . . . . . . . . 16 5,850
Total short-term borrowings . . . . . . . . . . . . . . . . . . . . . . . . . . . . . . . . . . . . . . . . . . . . . . . . . . . . . . . . . . . . 471,367 339,772Current maturities of long-term debt . . . . . . . . . . . . . . . . . . . . . . . . . . . . . . . . . . . . . . . . . . . . . . . . . . . . . . . . . 38,086 138,682Notes payable on real estate . . . . . . . . . . . . . . . . . . . . . . . . . . . . . . . . . . . . . . . . . . . . . . . . . . . . . . . . . . . . . . . . 154,213 159,921Liabilities related to real estate and other assets held for sale . . . . . . . . . . . . . . . . . . . . . . . . . . . . . . . . . . . . . . 12,152 1,267Other current liabilities . . . . . . . . . . . . . . . . . . . . . . . . . . . . . . . . . . . . . . . . . . . . . . . . . . . . . . . . . . . . . . . . . . . . 15,153 11,909
Total Current Liabilities . . . . . . . . . . . . . . . . . . . . . . . . . . . . . . . . . . . . . . . . . . . . . . . . . . . . . . . . . . . . . . . 1,956,768 1,629,041Long-Term Debt:
Senior secured term loans . . . . . . . . . . . . . . . . . . . . . . . . . . . . . . . . . . . . . . . . . . . . . . . . . . . . . . . . . . . . . . . . . . 602,500 1,545,49011.625% senior subordinated notes, net of unamortized discount of $12,318 and $13,498 at December 31,
2010 and 2009, respectively . . . . . . . . . . . . . . . . . . . . . . . . . . . . . . . . . . . . . . . . . . . . . . . . . . . . . . . . . . . . . . 437,682 436,5026.625% senior notes . . . . . . . . . . . . . . . . . . . . . . . . . . . . . . . . . . . . . . . . . . . . . . . . . . . . . . . . . . . . . . . . . . . . . . 350,000 —Other long-term debt . . . . . . . . . . . . . . . . . . . . . . . . . . . . . . . . . . . . . . . . . . . . . . . . . . . . . . . . . . . . . . . . . . . . . . 54 129
Total Long-Term Debt . . . . . . . . . . . . . . . . . . . . . . . . . . . . . . . . . . . . . . . . . . . . . . . . . . . . . . . . . . . . . . . . 1,390,236 1,982,121Pension liability . . . . . . . . . . . . . . . . . . . . . . . . . . . . . . . . . . . . . . . . . . . . . . . . . . . . . . . . . . . . . . . . . . . . . . . . . 40,007 64,945Non-current tax liabilities . . . . . . . . . . . . . . . . . . . . . . . . . . . . . . . . . . . . . . . . . . . . . . . . . . . . . . . . . . . . . . . . . . 78,306 73,462Notes payable on real estate . . . . . . . . . . . . . . . . . . . . . . . . . . . . . . . . . . . . . . . . . . . . . . . . . . . . . . . . . . . . . . . . 461,665 390,181Other liabilities . . . . . . . . . . . . . . . . . . . . . . . . . . . . . . . . . . . . . . . . . . . . . . . . . . . . . . . . . . . . . . . . . . . . . . . . . . 128,791 115,361
Total Liabilities . . . . . . . . . . . . . . . . . . . . . . . . . . . . . . . . . . . . . . . . . . . . . . . . . . . . . . . . . . . . . . . . . . . . . . 4,055,773 4,255,111Commitments and contingencies . . . . . . . . . . . . . . . . . . . . . . . . . . . . . . . . . . . . . . . . . . . . . . . . . . . . . . . . . . . . . . . . — —Equity:CB Richard Ellis Group, Inc. Stockholders’ Equity:
Class A common stock; $0.01 par value; 525,000,000 shares authorized; 323,594,919 and 321,767,407shares issued and outstanding at December 31, 2010 and 2009, respectively . . . . . . . . . . . . . . . . . . . . . . . . 3,236 3,218
Additional paid-in capital . . . . . . . . . . . . . . . . . . . . . . . . . . . . . . . . . . . . . . . . . . . . . . . . . . . . . . . . . . . . . . . . . . 814,244 755,989Accumulated earnings (deficit) . . . . . . . . . . . . . . . . . . . . . . . . . . . . . . . . . . . . . . . . . . . . . . . . . . . . . . . . . . . . . . 185,337 (15,008)Accumulated other comprehensive loss . . . . . . . . . . . . . . . . . . . . . . . . . . . . . . . . . . . . . . . . . . . . . . . . . . . . . . . (94,602) (115,077)
Total CB Richard Ellis Group, Inc. Stockholders’ Equity . . . . . . . . . . . . . . . . . . . . . . . . . . . . . . . . . . . . . 908,215 629,122Non-controlling interests . . . . . . . . . . . . . . . . . . . . . . . . . . . . . . . . . . . . . . . . . . . . . . . . . . . . . . . . . . . . . . . . . . . . . . . 157,580 155,173
Total Equity . . . . . . . . . . . . . . . . . . . . . . . . . . . . . . . . . . . . . . . . . . . . . . . . . . . . . . . . . . . . . . . . . . . . . . . . 1,065,795 784,295
Total Liabilities and Equity . . . . . . . . . . . . . . . . . . . . . . . . . . . . . . . . . . . . . . . . . . . . . . . . . . . . . . . . . . . . . $5,121,568 $5,039,406
The accompanying notes are an integral part of these consolidated financial statements.
64
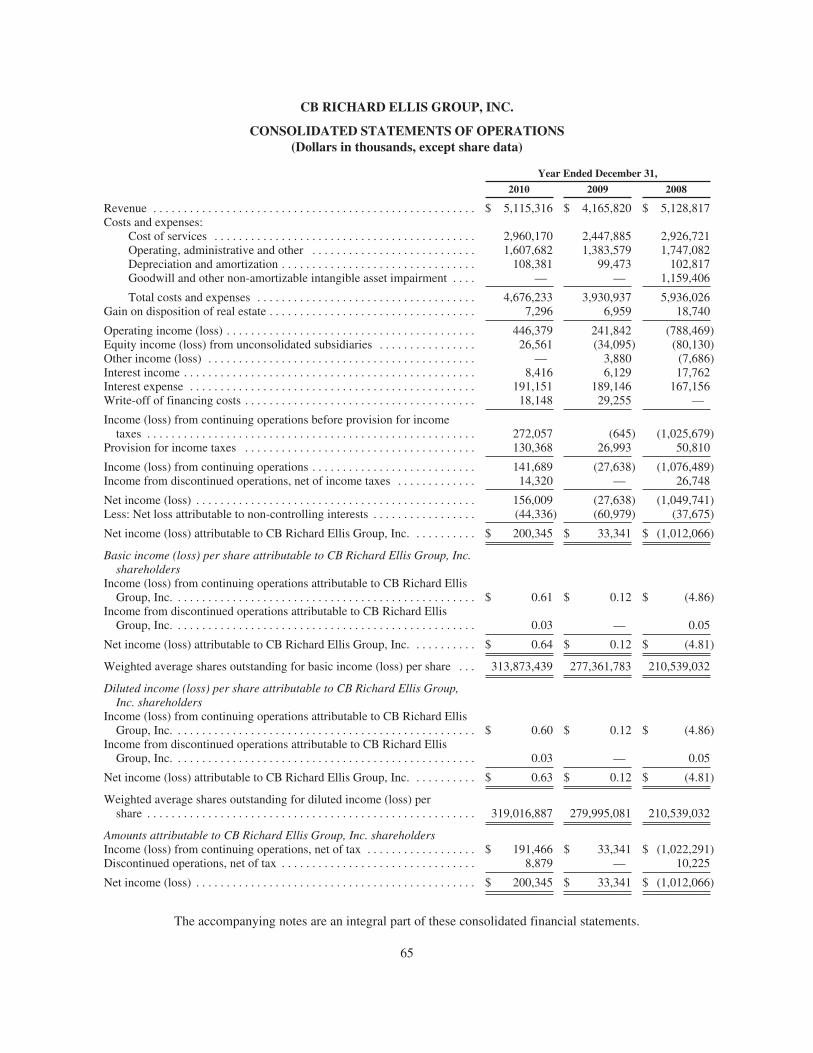
CB RICHARD ELLIS GROUP, INC.
CONSOLIDATED STATEMENTS OF OPERATIONS(Dollars in thousands, except share data)
Year Ended December 31,
2010 2009 2008
Revenue . . . . . . . . . . . . . . . . . . . . . . . . . . . . . . . . . . . . . . . . . . . . . . . . . . . . . $ 5,115,316 $ 4,165,820 $ 5,128,817Costs and expenses:
Cost of services . . . . . . . . . . . . . . . . . . . . . . . . . . . . . . . . . . . . . . . . . . . 2,960,170 2,447,885 2,926,721Operating, administrative and other . . . . . . . . . . . . . . . . . . . . . . . . . . . 1,607,682 1,383,579 1,747,082Depreciation and amortization . . . . . . . . . . . . . . . . . . . . . . . . . . . . . . . . 108,381 99,473 102,817Goodwill and other non-amortizable intangible asset impairment . . . . — — 1,159,406
Total costs and expenses . . . . . . . . . . . . . . . . . . . . . . . . . . . . . . . . . . . . 4,676,233 3,930,937 5,936,026Gain on disposition of real estate . . . . . . . . . . . . . . . . . . . . . . . . . . . . . . . . . . 7,296 6,959 18,740
Operating income (loss) . . . . . . . . . . . . . . . . . . . . . . . . . . . . . . . . . . . . . . . . . 446,379 241,842 (788,469)Equity income (loss) from unconsolidated subsidiaries . . . . . . . . . . . . . . . . 26,561 (34,095) (80,130)Other income (loss) . . . . . . . . . . . . . . . . . . . . . . . . . . . . . . . . . . . . . . . . . . . . — 3,880 (7,686)Interest income . . . . . . . . . . . . . . . . . . . . . . . . . . . . . . . . . . . . . . . . . . . . . . . . 8,416 6,129 17,762Interest expense . . . . . . . . . . . . . . . . . . . . . . . . . . . . . . . . . . . . . . . . . . . . . . . 191,151 189,146 167,156Write-off of financing costs . . . . . . . . . . . . . . . . . . . . . . . . . . . . . . . . . . . . . . 18,148 29,255 —
Income (loss) from continuing operations before provision for incometaxes . . . . . . . . . . . . . . . . . . . . . . . . . . . . . . . . . . . . . . . . . . . . . . . . . . . . . . 272,057 (645) (1,025,679)
Provision for income taxes . . . . . . . . . . . . . . . . . . . . . . . . . . . . . . . . . . . . . . 130,368 26,993 50,810
Income (loss) from continuing operations . . . . . . . . . . . . . . . . . . . . . . . . . . . 141,689 (27,638) (1,076,489)Income from discontinued operations, net of income taxes . . . . . . . . . . . . . 14,320 — 26,748
Net income (loss) . . . . . . . . . . . . . . . . . . . . . . . . . . . . . . . . . . . . . . . . . . . . . . 156,009 (27,638) (1,049,741)Less: Net loss attributable to non-controlling interests . . . . . . . . . . . . . . . . . (44,336) (60,979) (37,675)
Net income (loss) attributable to CB Richard Ellis Group, Inc. . . . . . . . . . . $ 200,345 $ 33,341 $ (1,012,066)
Basic income (loss) per share attributable to CB Richard Ellis Group, Inc.shareholders
Income (loss) from continuing operations attributable to CB Richard EllisGroup, Inc. . . . . . . . . . . . . . . . . . . . . . . . . . . . . . . . . . . . . . . . . . . . . . . . . . $ 0.61 $ 0.12 $ (4.86)
Income from discontinued operations attributable to CB Richard EllisGroup, Inc. . . . . . . . . . . . . . . . . . . . . . . . . . . . . . . . . . . . . . . . . . . . . . . . . . 0.03 — 0.05
Net income (loss) attributable to CB Richard Ellis Group, Inc. . . . . . . . . . . $ 0.64 $ 0.12 $ (4.81)
Weighted average shares outstanding for basic income (loss) per share . . . 313,873,439 277,361,783 210,539,032
Diluted income (loss) per share attributable to CB Richard Ellis Group,Inc. shareholders
Income (loss) from continuing operations attributable to CB Richard EllisGroup, Inc. . . . . . . . . . . . . . . . . . . . . . . . . . . . . . . . . . . . . . . . . . . . . . . . . . $ 0.60 $ 0.12 $ (4.86)
Income from discontinued operations attributable to CB Richard EllisGroup, Inc. . . . . . . . . . . . . . . . . . . . . . . . . . . . . . . . . . . . . . . . . . . . . . . . . . 0.03 — 0.05
Net income (loss) attributable to CB Richard Ellis Group, Inc. . . . . . . . . . . $ 0.63 $ 0.12 $ (4.81)
Weighted average shares outstanding for diluted income (loss) pershare . . . . . . . . . . . . . . . . . . . . . . . . . . . . . . . . . . . . . . . . . . . . . . . . . . . . . . 319,016,887 279,995,081 210,539,032
Amounts attributable to CB Richard Ellis Group, Inc. shareholdersIncome (loss) from continuing operations, net of tax . . . . . . . . . . . . . . . . . . $ 191,466 $ 33,341 $ (1,022,291)Discontinued operations, net of tax . . . . . . . . . . . . . . . . . . . . . . . . . . . . . . . . 8,879 — 10,225
Net income (loss) . . . . . . . . . . . . . . . . . . . . . . . . . . . . . . . . . . . . . . . . . . . . . . $ 200,345 $ 33,341 $ (1,012,066)
The accompanying notes are an integral part of these consolidated financial statements.
65
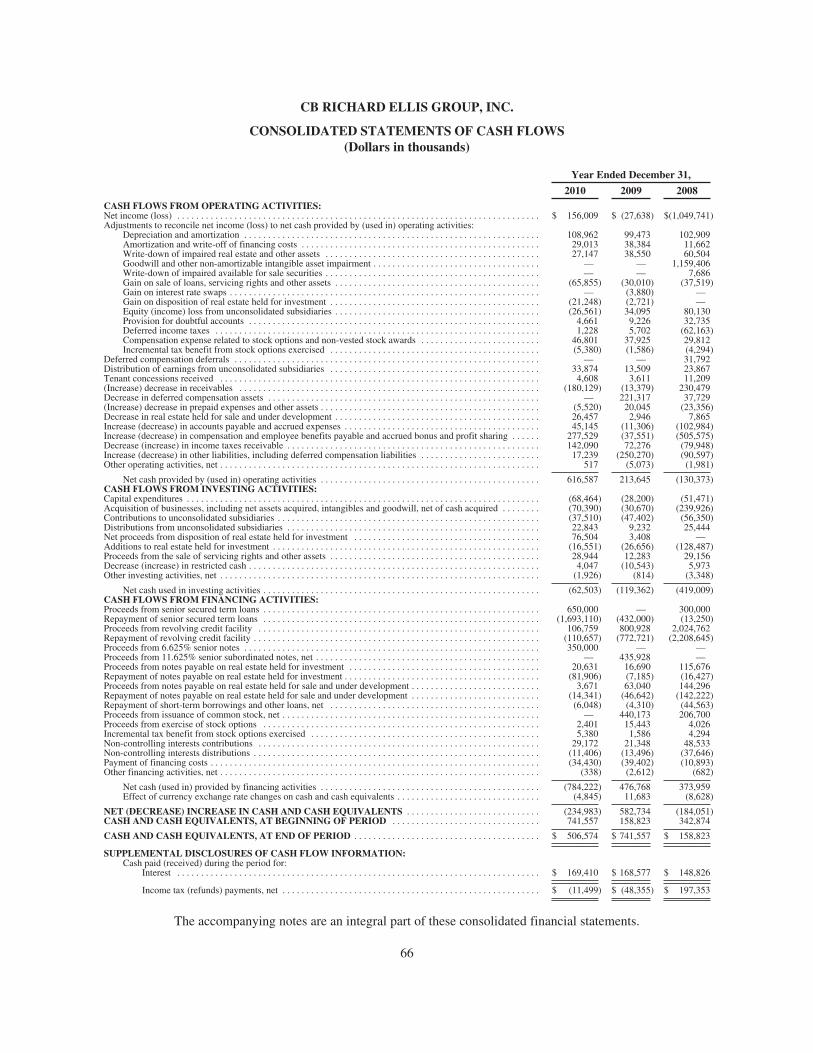
CB RICHARD ELLIS GROUP, INC.
CONSOLIDATED STATEMENTS OF CASH FLOWS(Dollars in thousands)
Year Ended December 31,
2010 2009 2008CASH FLOWS FROM OPERATING ACTIVITIES:Net income (loss) . . . . . . . . . . . . . . . . . . . . . . . . . . . . . . . . . . . . . . . . . . . . . . . . . . . . . . . . . . . . . . . . . . . . . . . . . . . . $ 156,009 $ (27,638) $(1,049,741)Adjustments to reconcile net income (loss) to net cash provided by (used in) operating activities:
Depreciation and amortization . . . . . . . . . . . . . . . . . . . . . . . . . . . . . . . . . . . . . . . . . . . . . . . . . . . . . . . . . . . . . . 108,962 99,473 102,909Amortization and write-off of financing costs . . . . . . . . . . . . . . . . . . . . . . . . . . . . . . . . . . . . . . . . . . . . . . . . . . 29,013 38,384 11,662Write-down of impaired real estate and other assets . . . . . . . . . . . . . . . . . . . . . . . . . . . . . . . . . . . . . . . . . . . . . 27,147 38,550 60,504Goodwill and other non-amortizable intangible asset impairment . . . . . . . . . . . . . . . . . . . . . . . . . . . . . . . . . . . — — 1,159,406Write-down of impaired available for sale securities . . . . . . . . . . . . . . . . . . . . . . . . . . . . . . . . . . . . . . . . . . . . . — — 7,686Gain on sale of loans, servicing rights and other assets . . . . . . . . . . . . . . . . . . . . . . . . . . . . . . . . . . . . . . . . . . . (65,855) (30,010) (37,519)Gain on interest rate swaps . . . . . . . . . . . . . . . . . . . . . . . . . . . . . . . . . . . . . . . . . . . . . . . . . . . . . . . . . . . . . . . . . — (3,880) —Gain on disposition of real estate held for investment . . . . . . . . . . . . . . . . . . . . . . . . . . . . . . . . . . . . . . . . . . . . (21,248) (2,721) —Equity (income) loss from unconsolidated subsidiaries . . . . . . . . . . . . . . . . . . . . . . . . . . . . . . . . . . . . . . . . . . . (26,561) 34,095 80,130Provision for doubtful accounts . . . . . . . . . . . . . . . . . . . . . . . . . . . . . . . . . . . . . . . . . . . . . . . . . . . . . . . . . . . . . 4,661 9,226 32,735Deferred income taxes . . . . . . . . . . . . . . . . . . . . . . . . . . . . . . . . . . . . . . . . . . . . . . . . . . . . . . . . . . . . . . . . . . . . 1,228 5,702 (62,163)Compensation expense related to stock options and non-vested stock awards . . . . . . . . . . . . . . . . . . . . . . . . . 46,801 37,925 29,812Incremental tax benefit from stock options exercised . . . . . . . . . . . . . . . . . . . . . . . . . . . . . . . . . . . . . . . . . . . . (5,380) (1,586) (4,294)
Deferred compensation deferrals . . . . . . . . . . . . . . . . . . . . . . . . . . . . . . . . . . . . . . . . . . . . . . . . . . . . . . . . . . . . . . . . — — 31,792Distribution of earnings from unconsolidated subsidiaries . . . . . . . . . . . . . . . . . . . . . . . . . . . . . . . . . . . . . . . . . . . . 33,874 13,509 23,867Tenant concessions received . . . . . . . . . . . . . . . . . . . . . . . . . . . . . . . . . . . . . . . . . . . . . . . . . . . . . . . . . . . . . . . . . . . 4,608 3,611 11,209(Increase) decrease in receivables . . . . . . . . . . . . . . . . . . . . . . . . . . . . . . . . . . . . . . . . . . . . . . . . . . . . . . . . . . . . . . . (180,129) (13,379) 230,479Decrease in deferred compensation assets . . . . . . . . . . . . . . . . . . . . . . . . . . . . . . . . . . . . . . . . . . . . . . . . . . . . . . . . . — 221,317 37,729(Increase) decrease in prepaid expenses and other assets . . . . . . . . . . . . . . . . . . . . . . . . . . . . . . . . . . . . . . . . . . . . . . (5,520) 20,045 (23,356)Decrease in real estate held for sale and under development . . . . . . . . . . . . . . . . . . . . . . . . . . . . . . . . . . . . . . . . . . . 26,457 2,946 7,865Increase (decrease) in accounts payable and accrued expenses . . . . . . . . . . . . . . . . . . . . . . . . . . . . . . . . . . . . . . . . . 45,145 (11,306) (102,984)Increase (decrease) in compensation and employee benefits payable and accrued bonus and profit sharing . . . . . . 277,529 (37,551) (505,575)Decrease (increase) in income taxes receivable . . . . . . . . . . . . . . . . . . . . . . . . . . . . . . . . . . . . . . . . . . . . . . . . . . . . . 142,090 72,276 (79,948)Increase (decrease) in other liabilities, including deferred compensation liabilities . . . . . . . . . . . . . . . . . . . . . . . . . 17,239 (250,270) (90,597)Other operating activities, net . . . . . . . . . . . . . . . . . . . . . . . . . . . . . . . . . . . . . . . . . . . . . . . . . . . . . . . . . . . . . . . . . . . 517 (5,073) (1,981)
Net cash provided by (used in) operating activities . . . . . . . . . . . . . . . . . . . . . . . . . . . . . . . . . . . . . . . . . . . . . . 616,587 213,645 (130,373)CASH FLOWS FROM INVESTING ACTIVITIES:Capital expenditures . . . . . . . . . . . . . . . . . . . . . . . . . . . . . . . . . . . . . . . . . . . . . . . . . . . . . . . . . . . . . . . . . . . . . . . . . . (68,464) (28,200) (51,471)Acquisition of businesses, including net assets acquired, intangibles and goodwill, net of cash acquired . . . . . . . . (70,390) (30,670) (239,926)Contributions to unconsolidated subsidiaries . . . . . . . . . . . . . . . . . . . . . . . . . . . . . . . . . . . . . . . . . . . . . . . . . . . . . . . (37,510) (47,402) (56,350)Distributions from unconsolidated subsidiaries . . . . . . . . . . . . . . . . . . . . . . . . . . . . . . . . . . . . . . . . . . . . . . . . . . . . . 22,843 9,232 25,444Net proceeds from disposition of real estate held for investment . . . . . . . . . . . . . . . . . . . . . . . . . . . . . . . . . . . . . . . 76,504 3,408 —Additions to real estate held for investment . . . . . . . . . . . . . . . . . . . . . . . . . . . . . . . . . . . . . . . . . . . . . . . . . . . . . . . . (16,551) (26,656) (128,487)Proceeds from the sale of servicing rights and other assets . . . . . . . . . . . . . . . . . . . . . . . . . . . . . . . . . . . . . . . . . . . . 28,944 12,283 29,156Decrease (increase) in restricted cash . . . . . . . . . . . . . . . . . . . . . . . . . . . . . . . . . . . . . . . . . . . . . . . . . . . . . . . . . . . . . 4,047 (10,543) 5,973Other investing activities, net . . . . . . . . . . . . . . . . . . . . . . . . . . . . . . . . . . . . . . . . . . . . . . . . . . . . . . . . . . . . . . . . . . . (1,926) (814) (3,348)
Net cash used in investing activities . . . . . . . . . . . . . . . . . . . . . . . . . . . . . . . . . . . . . . . . . . . . . . . . . . . . . . . . . . (62,503) (119,362) (419,009)CASH FLOWS FROM FINANCING ACTIVITIES:Proceeds from senior secured term loans . . . . . . . . . . . . . . . . . . . . . . . . . . . . . . . . . . . . . . . . . . . . . . . . . . . . . . . . . . 650,000 — 300,000Repayment of senior secured term loans . . . . . . . . . . . . . . . . . . . . . . . . . . . . . . . . . . . . . . . . . . . . . . . . . . . . . . . . . . (1,693,110) (432,000) (13,250)Proceeds from revolving credit facility . . . . . . . . . . . . . . . . . . . . . . . . . . . . . . . . . . . . . . . . . . . . . . . . . . . . . . . . . . . 106,759 800,928 2,024,762Repayment of revolving credit facility . . . . . . . . . . . . . . . . . . . . . . . . . . . . . . . . . . . . . . . . . . . . . . . . . . . . . . . . . . . . (110,657) (772,721) (2,208,645)Proceeds from 6.625% senior notes . . . . . . . . . . . . . . . . . . . . . . . . . . . . . . . . . . . . . . . . . . . . . . . . . . . . . . . . . . . . . . 350,000 — —Proceeds from 11.625% senior subordinated notes, net . . . . . . . . . . . . . . . . . . . . . . . . . . . . . . . . . . . . . . . . . . . . . . . — 435,928 —Proceeds from notes payable on real estate held for investment . . . . . . . . . . . . . . . . . . . . . . . . . . . . . . . . . . . . . . . . 20,631 16,690 115,676Repayment of notes payable on real estate held for investment . . . . . . . . . . . . . . . . . . . . . . . . . . . . . . . . . . . . . . . . . (81,906) (7,185) (16,427)Proceeds from notes payable on real estate held for sale and under development . . . . . . . . . . . . . . . . . . . . . . . . . . . 3,671 63,040 144,296Repayment of notes payable on real estate held for sale and under development . . . . . . . . . . . . . . . . . . . . . . . . . . . (14,341) (46,642) (142,222)Repayment of short-term borrowings and other loans, net . . . . . . . . . . . . . . . . . . . . . . . . . . . . . . . . . . . . . . . . . . . . (6,048) (4,310) (44,563)Proceeds from issuance of common stock, net . . . . . . . . . . . . . . . . . . . . . . . . . . . . . . . . . . . . . . . . . . . . . . . . . . . . . . — 440,173 206,700Proceeds from exercise of stock options . . . . . . . . . . . . . . . . . . . . . . . . . . . . . . . . . . . . . . . . . . . . . . . . . . . . . . . . . . 2,401 15,443 4,026Incremental tax benefit from stock options exercised . . . . . . . . . . . . . . . . . . . . . . . . . . . . . . . . . . . . . . . . . . . . . . . . 5,380 1,586 4,294Non-controlling interests contributions . . . . . . . . . . . . . . . . . . . . . . . . . . . . . . . . . . . . . . . . . . . . . . . . . . . . . . . . . . . 29,172 21,348 48,533Non-controlling interests distributions . . . . . . . . . . . . . . . . . . . . . . . . . . . . . . . . . . . . . . . . . . . . . . . . . . . . . . . . . . . . (11,406) (13,496) (37,646)Payment of financing costs . . . . . . . . . . . . . . . . . . . . . . . . . . . . . . . . . . . . . . . . . . . . . . . . . . . . . . . . . . . . . . . . . . . . . (34,430) (39,402) (10,893)Other financing activities, net . . . . . . . . . . . . . . . . . . . . . . . . . . . . . . . . . . . . . . . . . . . . . . . . . . . . . . . . . . . . . . . . . . . (338) (2,612) (682)
Net cash (used in) provided by financing activities . . . . . . . . . . . . . . . . . . . . . . . . . . . . . . . . . . . . . . . . . . . . . . (784,222) 476,768 373,959Effect of currency exchange rate changes on cash and cash equivalents . . . . . . . . . . . . . . . . . . . . . . . . . . . . . . (4,845) 11,683 (8,628)
NET (DECREASE) INCREASE IN CASH AND CASH EQUIVALENTS . . . . . . . . . . . . . . . . . . . . . . . . . . . . (234,983) 582,734 (184,051)CASH AND CASH EQUIVALENTS, AT BEGINNING OF PERIOD . . . . . . . . . . . . . . . . . . . . . . . . . . . . . . . 741,557 158,823 342,874
CASH AND CASH EQUIVALENTS, AT END OF PERIOD . . . . . . . . . . . . . . . . . . . . . . . . . . . . . . . . . . . . . . . $ 506,574 $ 741,557 $ 158,823
SUPPLEMENTAL DISCLOSURES OF CASH FLOW INFORMATION:Cash paid (received) during the period for:
Interest . . . . . . . . . . . . . . . . . . . . . . . . . . . . . . . . . . . . . . . . . . . . . . . . . . . . . . . . . . . . . . . . . . . . . . . . . . . . $ 169,410 $ 168,577 $ 148,826
Income tax (refunds) payments, net . . . . . . . . . . . . . . . . . . . . . . . . . . . . . . . . . . . . . . . . . . . . . . . . . . . . . . $ (11,499) $ (48,355) $ 197,353
The accompanying notes are an integral part of these consolidated financial statements.
66
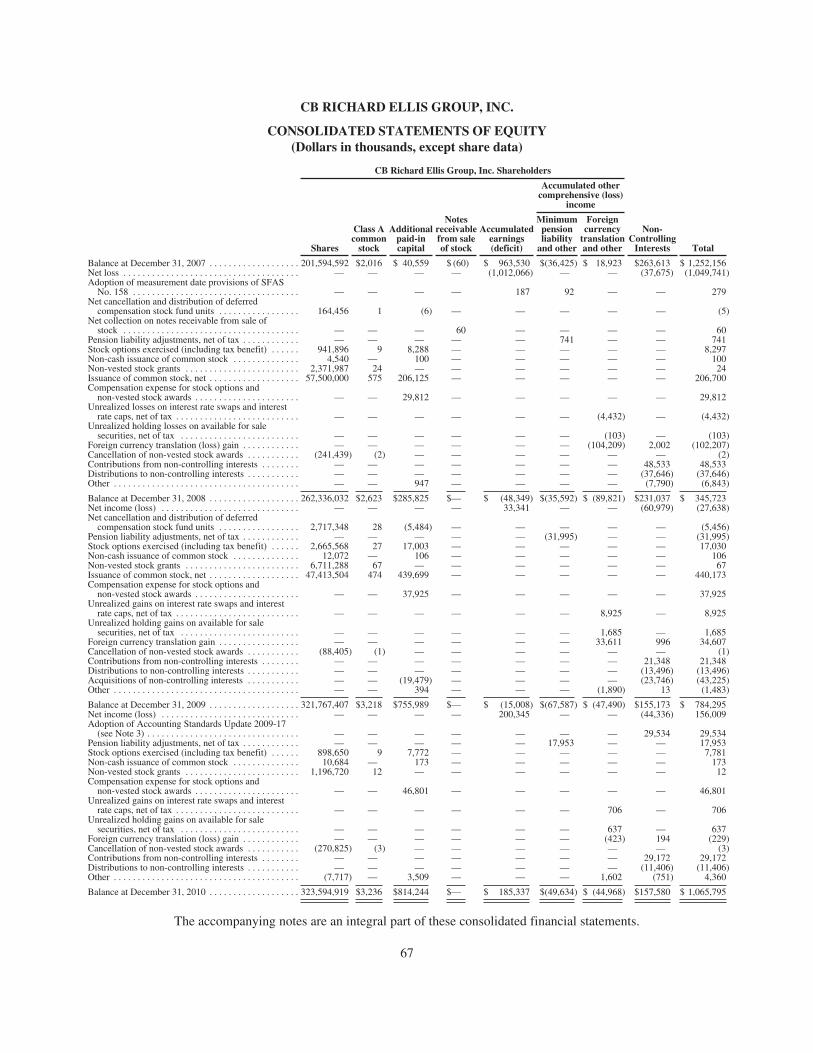
CB RICHARD ELLIS GROUP, INC.
CONSOLIDATED STATEMENTS OF EQUITY(Dollars in thousands, except share data)
CB Richard Ellis Group, Inc. Shareholders
Accumulated othercomprehensive (loss)
income
Shares
Class Acommon
stock
Additionalpaid-incapital
Notesreceivablefrom saleof stock
Accumulatedearnings(deficit)
Minimumpensionliability
and other
Foreigncurrency
translationand other
Non-Controlling
Interests Total
Balance at December 31, 2007 . . . . . . . . . . . . . . . . . . . 201,594,592 $2,016 $ 40,559 $ (60) $ 963,530 $(36,425) $ 18,923 $263,613 $ 1,252,156Net loss . . . . . . . . . . . . . . . . . . . . . . . . . . . . . . . . . . . . . — — — — (1,012,066) — — (37,675) (1,049,741)Adoption of measurement date provisions of SFAS
No. 158 . . . . . . . . . . . . . . . . . . . . . . . . . . . . . . . . . . . — — — — 187 92 — — 279Net cancellation and distribution of deferred
compensation stock fund units . . . . . . . . . . . . . . . . . 164,456 1 (6) — — — — — (5)Net collection on notes receivable from sale of
stock . . . . . . . . . . . . . . . . . . . . . . . . . . . . . . . . . . . . . — — — 60 — — — — 60Pension liability adjustments, net of tax . . . . . . . . . . . . — — — — — 741 — — 741Stock options exercised (including tax benefit) . . . . . . 941,896 9 8,288 — — — — — 8,297Non-cash issuance of common stock . . . . . . . . . . . . . . 4,540 — 100 — — — — — 100Non-vested stock grants . . . . . . . . . . . . . . . . . . . . . . . . 2,371,987 24 — — — — — — 24Issuance of common stock, net . . . . . . . . . . . . . . . . . . . 57,500,000 575 206,125 — — — — — 206,700Compensation expense for stock options and
non-vested stock awards . . . . . . . . . . . . . . . . . . . . . . — — 29,812 — — — — — 29,812Unrealized losses on interest rate swaps and interest
rate caps, net of tax . . . . . . . . . . . . . . . . . . . . . . . . . . — — — — — — (4,432) — (4,432)Unrealized holding losses on available for sale
securities, net of tax . . . . . . . . . . . . . . . . . . . . . . . . . — — — — — — (103) — (103)Foreign currency translation (loss) gain . . . . . . . . . . . . — — — — — — (104,209) 2,002 (102,207)Cancellation of non-vested stock awards . . . . . . . . . . . (241,439) (2) — — — — — — (2)Contributions from non-controlling interests . . . . . . . . — — — — — — — 48,533 48,533Distributions to non-controlling interests . . . . . . . . . . . — — — — — — — (37,646) (37,646)Other . . . . . . . . . . . . . . . . . . . . . . . . . . . . . . . . . . . . . . . — — 947 — — — — (7,790) (6,843)
Balance at December 31, 2008 . . . . . . . . . . . . . . . . . . . 262,336,032 $2,623 $285,825 $— $ (48,349) $(35,592) $ (89,821) $231,037 $ 345,723Net income (loss) . . . . . . . . . . . . . . . . . . . . . . . . . . . . . — — — — 33,341 — — (60,979) (27,638)Net cancellation and distribution of deferred
compensation stock fund units . . . . . . . . . . . . . . . . . 2,717,348 28 (5,484) — — — — — (5,456)Pension liability adjustments, net of tax . . . . . . . . . . . . — — — — — (31,995) — — (31,995)Stock options exercised (including tax benefit) . . . . . . 2,665,568 27 17,003 — — — — — 17,030Non-cash issuance of common stock . . . . . . . . . . . . . . 12,072 — 106 — — — — — 106Non-vested stock grants . . . . . . . . . . . . . . . . . . . . . . . . 6,711,288 67 — — — — — — 67Issuance of common stock, net . . . . . . . . . . . . . . . . . . . 47,413,504 474 439,699 — — — — — 440,173Compensation expense for stock options and
non-vested stock awards . . . . . . . . . . . . . . . . . . . . . . — — 37,925 — — — — — 37,925Unrealized gains on interest rate swaps and interest
rate caps, net of tax . . . . . . . . . . . . . . . . . . . . . . . . . . — — — — — — 8,925 — 8,925Unrealized holding gains on available for sale
securities, net of tax . . . . . . . . . . . . . . . . . . . . . . . . . — — — — — — 1,685 — 1,685Foreign currency translation gain . . . . . . . . . . . . . . . . . — — — — — — 33,611 996 34,607Cancellation of non-vested stock awards . . . . . . . . . . . (88,405) (1) — — — — — — (1)Contributions from non-controlling interests . . . . . . . . — — — — — — — 21,348 21,348Distributions to non-controlling interests . . . . . . . . . . . — — — — — — — (13,496) (13,496)Acquisitions of non-controlling interests . . . . . . . . . . . — — (19,479) — — — — (23,746) (43,225)Other . . . . . . . . . . . . . . . . . . . . . . . . . . . . . . . . . . . . . . . — — 394 — — — (1,890) 13 (1,483)
Balance at December 31, 2009 . . . . . . . . . . . . . . . . . . . 321,767,407 $3,218 $755,989 $— $ (15,008) $(67,587) $ (47,490) $155,173 $ 784,295Net income (loss) . . . . . . . . . . . . . . . . . . . . . . . . . . . . . — — — — 200,345 — — (44,336) 156,009Adoption of Accounting Standards Update 2009-17
(see Note 3) . . . . . . . . . . . . . . . . . . . . . . . . . . . . . . . . — — — — — — — 29,534 29,534Pension liability adjustments, net of tax . . . . . . . . . . . . — — — — — 17,953 — — 17,953Stock options exercised (including tax benefit) . . . . . . 898,650 9 7,772 — — — — — 7,781Non-cash issuance of common stock . . . . . . . . . . . . . . 10,684 — 173 — — — — — 173Non-vested stock grants . . . . . . . . . . . . . . . . . . . . . . . . 1,196,720 12 — — — — — — 12Compensation expense for stock options and
non-vested stock awards . . . . . . . . . . . . . . . . . . . . . . — — 46,801 — — — — — 46,801Unrealized gains on interest rate swaps and interest
rate caps, net of tax . . . . . . . . . . . . . . . . . . . . . . . . . . — — — — — — 706 — 706Unrealized holding gains on available for sale
securities, net of tax . . . . . . . . . . . . . . . . . . . . . . . . . — — — — — — 637 — 637Foreign currency translation (loss) gain . . . . . . . . . . . . — — — — — — (423) 194 (229)Cancellation of non-vested stock awards . . . . . . . . . . . (270,825) (3) — — — — — — (3)Contributions from non-controlling interests . . . . . . . . — — — — — — — 29,172 29,172Distributions to non-controlling interests . . . . . . . . . . . — — — — — — — (11,406) (11,406)Other . . . . . . . . . . . . . . . . . . . . . . . . . . . . . . . . . . . . . . . (7,717) — 3,509 — — — 1,602 (751) 4,360
Balance at December 31, 2010 . . . . . . . . . . . . . . . . . . . 323,594,919 $3,236 $814,244 $— $ 185,337 $(49,634) $ (44,968) $157,580 $ 1,065,795
The accompanying notes are an integral part of these consolidated financial statements.
67
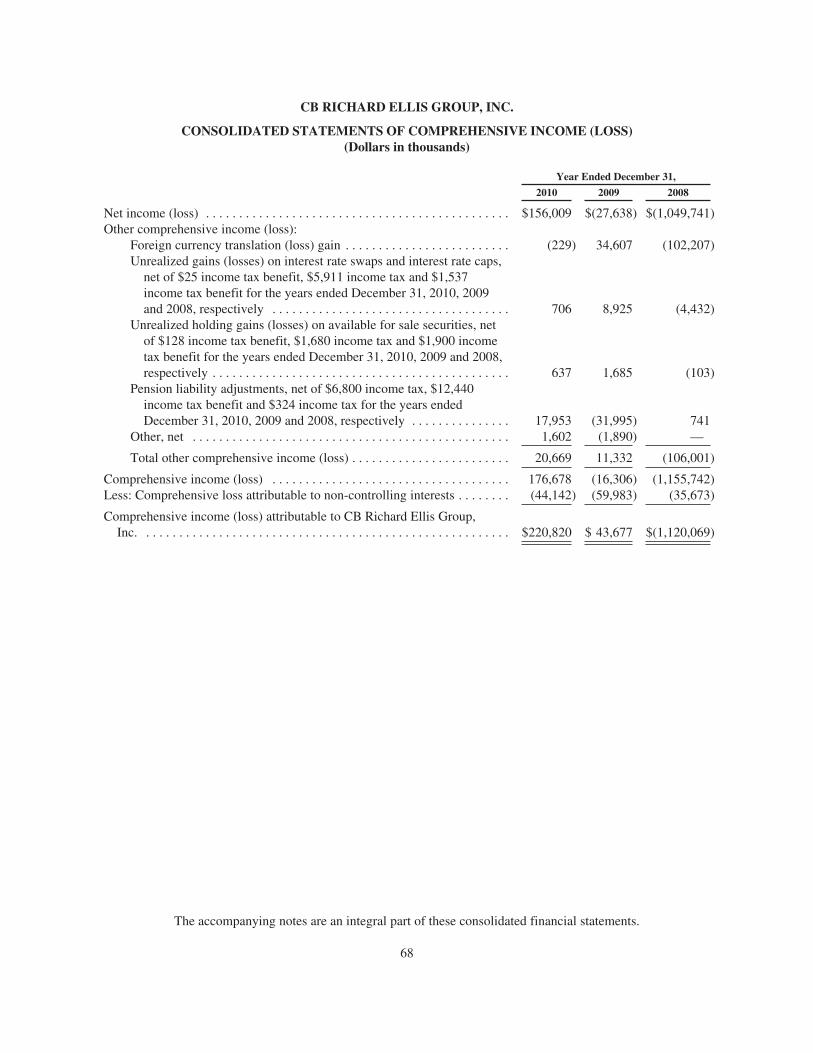
CB RICHARD ELLIS GROUP, INC.
CONSOLIDATED STATEMENTS OF COMPREHENSIVE INCOME (LOSS)(Dollars in thousands)
Year Ended December 31,
2010 2009 2008
Net income (loss) . . . . . . . . . . . . . . . . . . . . . . . . . . . . . . . . . . . . . . . . . . . . . . $156,009 $(27,638) $(1,049,741)Other comprehensive income (loss):
Foreign currency translation (loss) gain . . . . . . . . . . . . . . . . . . . . . . . . . (229) 34,607 (102,207)Unrealized gains (losses) on interest rate swaps and interest rate caps,
net of $25 income tax benefit, $5,911 income tax and $1,537income tax benefit for the years ended December 31, 2010, 2009and 2008, respectively . . . . . . . . . . . . . . . . . . . . . . . . . . . . . . . . . . . . 706 8,925 (4,432)
Unrealized holding gains (losses) on available for sale securities, netof $128 income tax benefit, $1,680 income tax and $1,900 incometax benefit for the years ended December 31, 2010, 2009 and 2008,respectively . . . . . . . . . . . . . . . . . . . . . . . . . . . . . . . . . . . . . . . . . . . . . 637 1,685 (103)
Pension liability adjustments, net of $6,800 income tax, $12,440income tax benefit and $324 income tax for the years endedDecember 31, 2010, 2009 and 2008, respectively . . . . . . . . . . . . . . . 17,953 (31,995) 741
Other, net . . . . . . . . . . . . . . . . . . . . . . . . . . . . . . . . . . . . . . . . . . . . . . . . 1,602 (1,890) —
Total other comprehensive income (loss) . . . . . . . . . . . . . . . . . . . . . . . . 20,669 11,332 (106,001)
Comprehensive income (loss) . . . . . . . . . . . . . . . . . . . . . . . . . . . . . . . . . . . . 176,678 (16,306) (1,155,742)Less: Comprehensive loss attributable to non-controlling interests . . . . . . . . (44,142) (59,983) (35,673)
Comprehensive income (loss) attributable to CB Richard Ellis Group,Inc. . . . . . . . . . . . . . . . . . . . . . . . . . . . . . . . . . . . . . . . . . . . . . . . . . . . . . . . $220,820 $ 43,677 $(1,120,069)
The accompanying notes are an integral part of these consolidated financial statements.
68
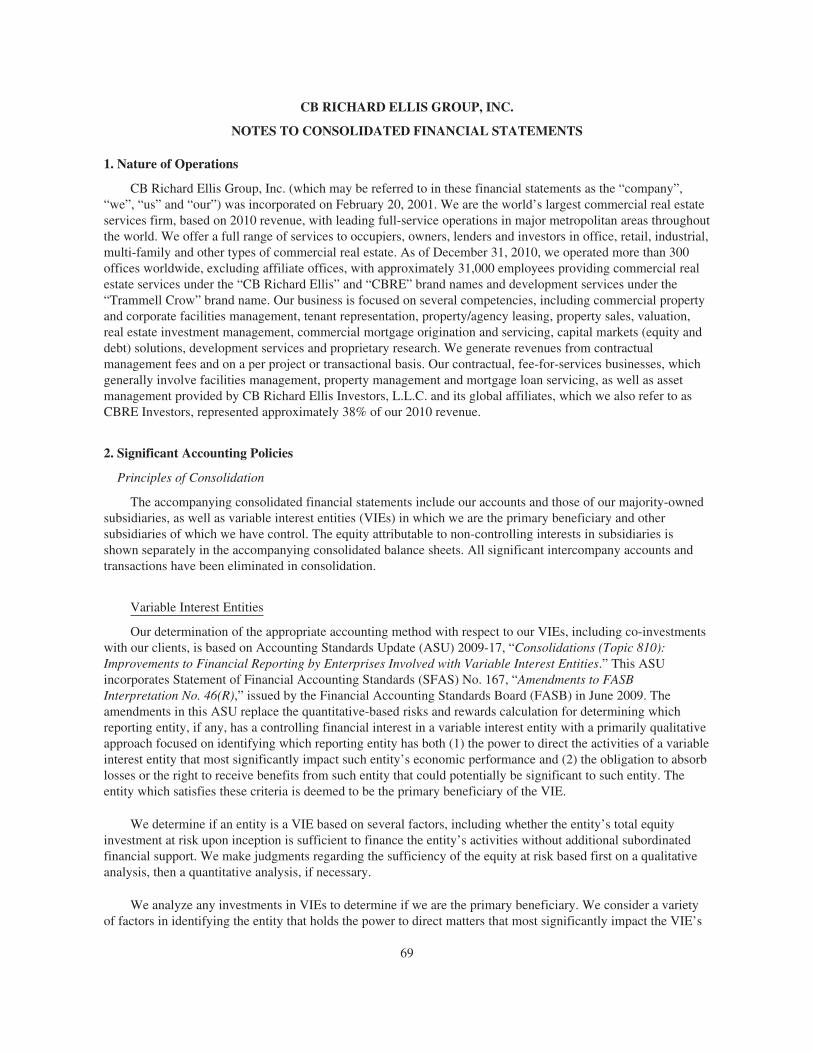
CB RICHARD ELLIS GROUP, INC.
NOTES TO CONSOLIDATED FINANCIAL STATEMENTS
1. Nature of Operations
CB Richard Ellis Group, Inc. (which may be referred to in these financial statements as the “company”,“we”, “us” and “our”) was incorporated on February 20, 2001. We are the world’s largest commercial real estateservices firm, based on 2010 revenue, with leading full-service operations in major metropolitan areas throughoutthe world. We offer a full range of services to occupiers, owners, lenders and investors in office, retail, industrial,multi-family and other types of commercial real estate. As of December 31, 2010, we operated more than 300offices worldwide, excluding affiliate offices, with approximately 31,000 employees providing commercial realestate services under the “CB Richard Ellis” and “CBRE” brand names and development services under the“Trammell Crow” brand name. Our business is focused on several competencies, including commercial propertyand corporate facilities management, tenant representation, property/agency leasing, property sales, valuation,real estate investment management, commercial mortgage origination and servicing, capital markets (equity anddebt) solutions, development services and proprietary research. We generate revenues from contractualmanagement fees and on a per project or transactional basis. Our contractual, fee-for-services businesses, whichgenerally involve facilities management, property management and mortgage loan servicing, as well as assetmanagement provided by CB Richard Ellis Investors, L.L.C. and its global affiliates, which we also refer to asCBRE Investors, represented approximately 38% of our 2010 revenue.
2. Significant Accounting Policies
Principles of Consolidation
The accompanying consolidated financial statements include our accounts and those of our majority-ownedsubsidiaries, as well as variable interest entities (VIEs) in which we are the primary beneficiary and othersubsidiaries of which we have control. The equity attributable to non-controlling interests in subsidiaries isshown separately in the accompanying consolidated balance sheets. All significant intercompany accounts andtransactions have been eliminated in consolidation.
Variable Interest Entities
Our determination of the appropriate accounting method with respect to our VIEs, including co-investmentswith our clients, is based on Accounting Standards Update (ASU) 2009-17, “Consolidations (Topic 810):Improvements to Financial Reporting by Enterprises Involved with Variable Interest Entities.” This ASUincorporates Statement of Financial Accounting Standards (SFAS) No. 167, “Amendments to FASBInterpretation No. 46(R),” issued by the Financial Accounting Standards Board (FASB) in June 2009. Theamendments in this ASU replace the quantitative-based risks and rewards calculation for determining whichreporting entity, if any, has a controlling financial interest in a variable interest entity with a primarily qualitativeapproach focused on identifying which reporting entity has both (1) the power to direct the activities of a variableinterest entity that most significantly impact such entity’s economic performance and (2) the obligation to absorblosses or the right to receive benefits from such entity that could potentially be significant to such entity. Theentity which satisfies these criteria is deemed to be the primary beneficiary of the VIE.
We determine if an entity is a VIE based on several factors, including whether the entity’s total equityinvestment at risk upon inception is sufficient to finance the entity’s activities without additional subordinatedfinancial support. We make judgments regarding the sufficiency of the equity at risk based first on a qualitativeanalysis, then a quantitative analysis, if necessary.
We analyze any investments in VIEs to determine if we are the primary beneficiary. We consider a varietyof factors in identifying the entity that holds the power to direct matters that most significantly impact the VIE’s
69

CB RICHARD ELLIS GROUP, INC.
NOTES TO CONSOLIDATED FINANCIAL STATEMENTS—(Continued)
economic performance including, but not limited to, the ability to direct financing, leasing, construction andother operating decisions and activities. In addition, we also consider the rights of other investors to participate inpolicy making decisions, to replace the manager and to sell or liquidate the entity.
We also have several co-investments in real estate investment funds which qualify for a deferral of thenewer qualitative approach for analyzing potential VIEs. We continue to analyze these investments under theformer quantitative method incorporating various estimates, including estimated future cash flows, asset holdperiods and discount rates, as well as estimates of the probabilities of various scenarios occurring. If the entity isa VIE, we then determine whether we consolidate the entity as the primary beneficiary. This determination ofwhether we are the primary beneficiary includes any impact of an “upside economic interest” in the form of a“promote” that we may have. A promote is an interest built into the distribution structure of the entity based onthe entity’s achievement of certain return hurdles.
We consolidate any VIE of which we are the primary beneficiary (see Note 3) and disclose significant VIEsof which we are not the primary beneficiary, if any. We determine whether an entity is a VIE and, if so, whetherit should be consolidated by utilizing judgments and estimates that are inherently subjective. If we made differentjudgments or utilized different estimates in these evaluations, it could result in differing conclusions as towhether or not an entity is a VIE and whether or not to consolidate such entity.
Limited Partnerships, Limited Liability Companies and Other Subsidiaries
If an entity is not a VIE, our determination of the appropriate accounting method with respect to ourinvestments in limited partnerships, limited liability companies and other subsidiaries is based on voting control.For our general partner interests, we are presumed to control (and therefore consolidate) the entity, unless theother limited partners have substantive rights that overcome this presumption of control. These substantive rightsallow the limited partners to participate in significant decisions made in the ordinary course of the entity’sbusiness. We account for our non-controlling general partner investments in these entities under the equitymethod. This treatment also applies to our managing member interests in limited liability companies.
Our determination of the appropriate accounting method for all other investments in subsidiaries is based onthe amount of influence we have (including our ownership interest) in the underlying entity. Those otherinvestments where we have the ability to exercise significant influence (but not control) over operating andfinancial policies of such subsidiaries (including certain subsidiaries where we have less than 20% ownership)are accounted for using the equity method. We eliminate transactions with such equity method subsidiaries to theextent of our ownership in such subsidiaries. Accordingly, our share of the earnings or losses of these equitymethod subsidiaries is included in consolidated net income. All of our remaining investments are carried at cost.
Under either the equity or cost method, impairment losses are recognized upon evidence of other-than-temporary losses of value. When testing for impairment on investments that are not actively traded on a publicmarket, we generally use a discounted cash flow approach to estimate the fair value of our investments and/orlook to comparable activities in the marketplace. Management judgment is required in developing theassumptions for the discounted cash flow approach. These assumptions include net asset values, internal rates ofreturn, discount and capitalization rates, interest rates and financing terms, rental rates, timing of leasing activity,estimates of lease terms and related concessions, etc. When determining if impairment is other-than-temporary,we also look to the length of time and the extent to which fair value has been less than cost as well as thefinancial condition and near-term prospects of each investment.
70
CB RICHARD ELLIS GROUP, INC.
NOTES TO CONSOLIDATED FINANCIAL STATEMENTS—(Continued)
Estimates, Risks and Uncertainties
Our consolidated financial statements have been prepared in accordance with accounting principlesgenerally accepted in the United States (U.S.), which require management to make estimates and assumptionsabout future events. These estimates and the underlying assumptions affect the amounts of assets and liabilitiesreported, and reported amounts of revenue and expenses. Such estimates include the value of goodwill,intangibles and other long-lived assets, accounts receivable, investments in unconsolidated subsidiaries andassumptions used in the calculation of income taxes, retirement and other post-employment benefits, amongothers. These estimates and assumptions are based on management’s best estimates and judgment. Managementevaluates its estimates and assumptions on an ongoing basis using historical experience and other factors,including consideration of the current economic environment, and adjusts such estimates and assumptions whenfacts and circumstances dictate. Illiquid credit markets, volatile equity, foreign currency, among other things,have combined to increase the uncertainty inherent in such estimates and assumptions. As future events and theireffects cannot be determined with precision, actual results could differ significantly from these estimates.Changes in those estimates resulting from continuing changes in the economic environment will be reflected inthe financial statements in future periods.
The fair value of our goodwill and non-amortizable intangible assets is impacted by economic conditions,the capital markets and our stock price. Sales and leasing activity is affected by general economic activity andemployment growth, credit availability and pricing, business and consumer sentiment, inflation levels and thehealth of the capital markets generally. Adverse trends involving any or all of these factors could reduceincentive-based revenue as well as real estate sales volume and values. Such adverse economic conditions couldcause declines in the estimated future discounted cash flows expected for our reporting units. A major orsustained decline in our future cash flows and/or the current economic conditions could result in additionalimpairment charges.
The recoverability of our investments in unconsolidated subsidiaries has been impacted by the significantcapital market turmoil that began in the fourth quarter of 2008. Following the global financial crisis, commercialreal estate fundamentals weakened significantly, reflecting the overall downturn in the economy. Throughout2009, transactions were sharply reduced by the illiquidity in the capital markets as many lenders sharply curtailedlending for commercial real estate. As liquidity improved during 2010, transaction volume began to revive,though remained well below levels experienced in 2006 and 2007. However, the effects of the 2008-2009 capitalmarkets turmoil continued to take a toll on property values. The assumptions utilized in our recoverabilityanalysis reflected our belief that the recovery from the severe downturn would be slow and that challengingconditions could persist for some time, resulting in the potential for additional write-downs, especially if turmoilre-emerges in the capital markets.
The recoverability of the carrying value of our investments in real estate is impacted by general conditionsin the U.S. economy and commercial real estate market. Beginning in the fourth quarter of 2008, marketfundamentals in the primary product types which we develop/own weakened significantly. The highunemployment rate negatively impacted office markets as companies deferred occupancy decisions and placedspace on the market for sublease. Weak industrial production adversely affected warehouse and distributionmarkets. The retail sector was negatively affected by declining sales and retailers experiencing financialdifficulty. These trends began to abate in 2010 as real estate market conditions improved, and transactions beganto revive from the depressed levels of 2009. Capitalization rates have stabilized and begun to contract modestlyas potential buyers and liquidity returned to the commercial real estate market. However, if conditions in thebroader economy, capital markets, commercial real estate industry, specific markets or product types in which weoperate once again decline, we could have additional impairment charges.
71
CB RICHARD ELLIS GROUP, INC.
NOTES TO CONSOLIDATED FINANCIAL STATEMENTS—(Continued)
Cash and Cash Equivalents
Cash and cash equivalents generally consist of cash and highly liquid investments with an original maturityof less than three months. We manage certain cash and cash equivalents as an agent for our investment andproperty management clients. These amounts are not included in the accompanying consolidated balance sheets(see Note 18).
Restricted Cash
Included in the accompanying consolidated balance sheets as of December 31, 2010 and 2009 is restrictedcash of $52.3 million and $46.8 million, respectively. The balances primarily include restricted cash set aside tocover funding obligations as required by contracts executed by us in the normal course of business, includingescrow accounts held in our Development Services segment.
Concentration of Credit Risk
Financial instruments that potentially subject us to credit risk consist principally of trade receivables andinterest-bearing investments. Users of real estate services account for a substantial portion of trade receivablesand collateral is generally not required. The risk associated with this concentration is limited due to the largenumber of users and their geographic dispersion.
We place substantially all of our interest-bearing investments with major financial institutions and limit theamount of credit exposure with any one financial institution.
Property and Equipment
Property and equipment is stated at cost, net of accumulated depreciation. Depreciation and amortization ofproperty and equipment is computed primarily using the straight-line method over estimated useful lives rangingup to 15 years. Leasehold improvements are amortized over the term of their associated leases, excluding optionsto renew, since such leases generally do not carry prohibitive penalties for non-renewal. We capitalizeexpenditures that materially increase the life of our assets and expense the costs of maintenance and repairs.
We review property and equipment for impairment whenever events or changes in circumstances indicatethat the carrying amount of an asset may not be recoverable. If this review indicates that such assets areconsidered to be impaired, the impairment is recognized in the period the changes occur and represents theamount by which the carrying value exceeds the fair value of the asset. We did not recognize an impairment lossrelated to property and equipment in 2010, 2009 or 2008.
Computer Software Costs
Certain costs related to the development or purchase of internal-use software are capitalized. Internalcomputer software costs that are incurred in the preliminary project stage are expensed as incurred. Directconsulting costs as well as payroll and related costs, which are incurred during the development stage of a projectare capitalized and amortized over a three-year period when placed into production.
Goodwill and Other Intangible Assets
Our acquisitions require the application of purchase accounting, which results in tangible and identifiableintangible assets and liabilities of the acquired entity being recorded at fair value. The difference between the
72
CB RICHARD ELLIS GROUP, INC.
NOTES TO CONSOLIDATED FINANCIAL STATEMENTS—(Continued)
purchase price and the fair value of net assets acquired is recorded as goodwill. The majority of our goodwillbalance has resulted from our acquisition of CB Richard Ellis Services, Inc. (CBRE) in 2001 (the 2001Acquisition), our acquisition of Insignia Financial Group, Inc. (Insignia) in 2003 (the Insignia Acquisition) andour acquisition of the Trammell Crow Company in 2006 (the Trammell Crow Company Acquisition). Otherintangible assets include a trademark, which was separately identified as a result of the 2001 Acquisition, as wellas a trade name separately identified as a result of the Insignia Acquisition representing the Richard Ellis tradename in the United Kingdom (U.K.) that was owned by Insignia prior to the Insignia Acquisition. Both thetrademark and the trade name are not being amortized and have indefinite estimated useful lives. The remainingother intangible assets primarily include customer relationships, management contracts, loan servicing rights andfranchise agreements, which are all being amortized over estimated useful lives ranging up to 20 years.
We are required to test goodwill and other intangible assets deemed to have indefinite useful lives forimpairment annually or more often if circumstances or events indicate a change in the impairment status. Thegoodwill impairment analysis is a two-step process. The first step used to identify potential impairment involvescomparing each reporting unit’s estimated fair value to its carrying value, including goodwill. We use adiscounted cash flow approach to estimate the fair value of our reporting units. Management judgment isrequired in developing the assumptions for the discounted cash flow model. These assumptions include revenuegrowth rates, profit margin percentages, discount rates, etc. If the estimated fair value of a reporting unit exceedsits carrying value, goodwill is considered to not be impaired. If the carrying value exceeds estimated fair value,there is an indication of potential impairment and the second step is performed to measure the amount ofimpairment. The second step of the process involves the calculation of an implied fair value of goodwill for eachreporting unit for which step one indicated impairment. The implied fair value of goodwill is determined similarto how goodwill is calculated in a business combination, by measuring the excess of the estimated fair value ofthe reporting unit as calculated in step one, over the estimated fair values of the individual assets, liabilities andidentifiable intangibles as if the reporting unit was being acquired in a business combination. Due to the manyvariables inherent in the estimation of a business’s fair value and the relative size of our goodwill, if differentassumptions and estimates were used, it could have an adverse effect on our impairment analysis.
Deferred Financing Costs
Costs incurred in connection with financing activities are generally deferred and amortized over the terms ofthe related debt agreements ranging up to ten years. Amortization of these costs is charged to interest expense inthe accompanying consolidated statements of operations. Total deferred financing costs, net of accumulatedamortization, included in other assets in the accompanying consolidated balance sheets were $34.1 million and$29.2 million, as of December 31, 2010 and 2009, respectively.
In connection with the new credit agreement we entered into on November 10, 2010, we wrote off financingcosts of $16.7 million during the year ended December 31, 2010, including $12.1 million of credit agreementamendment fees paid in November 2010 and $4.6 million of unamortized deferred financing costs associatedwith our prior credit agreement. In addition, in October 2010, we wrote off $1.4 million of unamortized deferredfinancing costs in connection with debt repayments made. In connection with the March 24, 2009 amendmentand restatement to our prior credit agreement, we wrote off financing costs of $29.3 million during the yearended December 31, 2009, which included the write-off of $18.1 million of unamortized deferred financing costsand $11.2 million of credit agreement amendment fees paid in March 2009. All of these write-offs were includedin write-off of financing costs in the accompanying consolidated statements of operations. See Note 12 foradditional information on activities associated with our debt.
73
CB RICHARD ELLIS GROUP, INC.
NOTES TO CONSOLIDATED FINANCIAL STATEMENTS—(Continued)
Revenue Recognition
We record commission revenue on real estate sales generally upon close of escrow or transfer of title, exceptwhen future contingencies exist. Real estate commissions on leases are generally recorded in revenue when allobligations under the commission agreement are satisfied. Terms and conditions of a commission agreement mayinclude, but are not limited to, execution of a signed lease agreement and future contingencies including tenantoccupancy, payment of a deposit or payment of a first month’s rent (or a combination thereof). As some of theseconditions are outside of our control and are often not clearly defined, judgment must be exercised indetermining when such required events have occurred in order to recognize revenue.
A typical commission agreement provides that we earn a portion of a lease commission upon the executionof the lease agreement by the tenant and landlord, with the remaining portion(s) of the lease commission earnedat a later date, usually upon tenant occupancy or payment of rent. The existence of any significant futurecontingencies results in the delay of recognition of corresponding revenue until such contingencies are satisfied.For example, if we do not earn all or a portion of the lease commission until the tenant pays its first month’s rent,and the lease agreement provides the tenant with a free rent period, we delay revenue recognition until rent ispaid by the tenant.
Property management revenues are generally based upon percentages of the revenue or base rent generatedby the entities managed or the square footage managed. These fees are recognized when earned under theprovisions of the related management agreements.
Investment management fees are based predominantly upon a percentage of the equity deployed on behalfof our limited partners. Fees related to our indirect investment management programs are based upon apercentage of the fair value of those investments. These fees are recognized when earned under the provisions ofthe related investment management agreements. Our Global Investment Management segment earnsperformance-based incentive fees with regard to many of its investments. Such revenue is recognized at the endof the measurement periods when the conditions of the applicable incentive fee arrangements have been satisfiedand following the expiration of any potential claw back provision. With many of these investments, our GlobalInvestment Management team has participation interests in such incentive fees, which are commonly referred toas carried interest. This carried interest expense is generally accrued for based upon the probability of suchperformance-based incentive fees being earned over the related vesting period. In addition, our GlobalInvestment Management segment also earns success-based transaction fees with regard to buying or sellingproperties on certain funds and separate accounts. Such revenue is recognized at the completion of a successfultransaction and is not subject to any claw back provision.
Appraisal fees are recorded after services have been rendered. Loan origination fees are recognized at thetime a loan closes and we have no significant remaining obligations for performance in connection with thetransaction, while loan servicing fees are recorded in revenue as monthly principal and interest payments arecollected from mortgagors. Other commissions, consulting fees and referral fees are recorded as revenue at thetime the related services have been performed, unless significant future contingencies exist.
Development services and project management services generate fees from development and constructionmanagement projects. For projects where we operate as a general contractor, fees are generally recognized usingthe percentage-of-completion method based on costs incurred as a percentage of total expected costs. Somedevelopment and construction management and project management assignments are subject to agreements thatdescribe the calculation of fees and when we earn such fees. The earnings terms of these agreements dictate whenwe recognize the related revenue. We may earn incentive fees for project management services based uponachievement of certain performance criteria as set forth in the project management services agreement. We may
74
CB RICHARD ELLIS GROUP, INC.
NOTES TO CONSOLIDATED FINANCIAL STATEMENTS—(Continued)
earn incentive development fees by reaching specified time table, leasing, budget or value creation targets, asdefined in the relevant development services agreement. Certain incentive development fees allow us to share inthe fair value of the developed real estate asset above cost. This sharing creates additional revenue potential to uswith no exposure to loss other than opportunity cost. We recognize such fees when the specified target is attainedand fees are deemed collectible.
We record deferred income to the extent that cash payments have been received in accordance with theterms of underlying agreements, but such amounts have not yet met the criteria for revenue recognition inaccordance with generally accepted accounting principles. We recognize such revenues when the appropriatecriteria are met.
We account for certain reimbursements (primarily salaries and related charges) mainly related to ourfacilities and property management operations as revenue. Reimbursement revenue is recognized when theunderlying reimbursable costs are incurred.
In establishing the appropriate provisions for trade receivables, we make assumptions with respect to futurecollectability. Our assumptions are based on an assessment of a customer’s credit quality as well as subjectivefactors and trends, including the aging of receivables balances. In addition to these assessments, in general,outstanding trade accounts receivable amounts that are more than 180 days overdue are evaluated forcollectability and fully provided for if deemed uncollectible. Historically, our credit losses have generally beeninsignificant. However, estimating losses requires significant judgment, and conditions may change or newinformation may become known after any periodic evaluation. As a result, actual credit losses may differ fromour estimates.
Real Estate
Classification and Impairment Evaluation
We classify real estate in accordance with the criteria of the “Property, Plant and Equipment” Topic of theFASB Accounting Standards Codification (ASC) (Topic 360) as follows: (i) real estate held for sale, whichincludes completed assets or land for sale in its present condition that meet all of Topic 360’s “held for sale”criteria, (ii) real estate under development (current), which includes real estate that we are in the process ofdeveloping that is expected to be completed and disposed of within one year of the balance sheet date; (iii) realestate under development (non-current), which includes real estate that we are in the process of developing that isexpected to be completed and disposed of more than one year from the balance sheet date; or (iv) real estate heldfor investment, which consists of land on which development activities have not yet commenced and completedassets or land held for disposition that do not meet the “held for sale” criteria. Any asset reclassified from realestate held for sale to real estate under development (current or non-current) or real estate held for investment isrecorded individually at the lower of its fair value at the date of the reclassification or its carrying amount beforeit was classified as “held for sale,” adjusted (in the case of real estate held for investment) for any depreciationthat would have been recognized had the asset been continuously classified as real estate held for investment.
Real estate held for sale is recorded at the lower of cost or fair value less cost to sell. If an asset’s fair valueless cost to sell, based on discounted future cash flows, management estimates or market comparisons, is lessthan its carrying amount, an allowance is recorded against the asset.
Real estate under development and real estate held for investment are carried at cost less depreciation, asapplicable. Buildings and improvements included in real estate held for investment are depreciated using thestraight-line method over estimated useful lives, generally up to 39 years. Tenant improvements included in real
75
CB RICHARD ELLIS GROUP, INC.
NOTES TO CONSOLIDATED FINANCIAL STATEMENTS—(Continued)
estate held for investment are amortized using the straight-line method over the shorter of their estimated usefullives or terms of the respective leases. Land improvements included in real estate held for investment aredepreciated over their estimated useful lives, up to 15 years.
When indicators of impairment are present, real estate under development and real estate held forinvestment are evaluated for impairment and losses are recorded when undiscounted cash flows estimated to begenerated by an asset or market comparisons are less than the asset’s carrying amount. The amount of theimpairment loss is calculated as the excess of the asset’s carrying value over its fair value, which is determinedusing a discounted cash flow analysis, management estimates or market comparisons.
Cost Capitalization and Allocation
When acquiring, developing and constructing real estate assets, we capitalize costs. Capitalization beginswhen the activities related to development have begun and ceases when activities are substantially complete andthe asset is available for occupancy. Costs capitalized include pursuit costs, or pre-acquisition/pre-constructioncosts, taxes and insurance, interest, development and construction costs and costs of incidental operations. Weexpense transaction costs for acquisitions that qualify as a business in accordance with the “BusinessCombinations” Topic of the FASB ASC (Topic 805). Pursuit costs capitalized in connection with a potentialdevelopment project that we have determined not to pursue are written off in the period that determination ismade.
At times, we purchase bulk land that we intend to sell or develop in phases. The land basis allocated to eachphase is based on the relative estimated fair value of the phases before construction. We allocate constructioncosts incurred relating to more than one phase between the various phases; if the costs cannot be specificallyattributed to a certain phase or the improvements benefit more than one phase, we allocate the costs between thephases based on their relative estimated sales values, where practicable, or other value methods as appropriateunder the circumstances. Relative allocations of the costs are revised as the sales value estimates are revised.
When acquiring real estate with existing buildings, we allocate the purchase price between land, landimprovements, building and intangibles related to in-place leases, if any, based on their relative fair values. Thefair values of acquired land and buildings are determined based on an estimated discounted future cash flowmodel with lease-up assumptions as if the building was vacant upon acquisition. The fair value of in-place leasesincludes the value of lease intangibles for above or below-market rents and tenant origination costs, determinedon a lease by lease basis. The capitalized values for both lease intangibles and tenant origination costs areamortized over the term of the underlying leases. Amortization related to lease intangibles is recorded as eitheran increase to or a reduction of rental income and amortization for tenant origination costs is recorded toamortization expense.
Disposition of Real Estate
Gains on disposition of real estate are recognized upon sale of the underlying project. We evaluate each realestate sale transaction to determine if it qualifies for gain recognition under the full accrual method. If thetransaction does not meet the criteria for the full accrual method of profit recognition based on our assessment,we account for a sale based on an appropriate deferral method determined by the nature and extent of the buyer’sinvestment and our continuing involvement.
Discontinued Operations
Topic 360 extends the reporting of a discontinued operation to a “component of an entity,” and furtherrequires that a component be classified as a discontinued operation if the operations and cash flows of the
76
CB RICHARD ELLIS GROUP, INC.
NOTES TO CONSOLIDATED FINANCIAL STATEMENTS—(Continued)
component have been or will be eliminated from the ongoing operations of the entity in the disposal transactionand the entity will not have any significant continuing involvement in the operations of the component after thedisposal transaction. As defined in Topic 360, a “component of an entity” comprises operations and cash flowsthat can be clearly distinguished, operationally and for financial reporting purposes, from the rest of the entity.Because each of our real estate assets is generally accounted for in a discrete subsidiary, many constitute acomponent of an entity under Topic 360, increasing the likelihood that the disposition of assets that we hold forsale in the ordinary course of business must be reported as a discontinued operation unless we have significantcontinuing involvement in the operations of the asset after its disposition. Furthermore, operating profits andlosses on such assets are required to be recognized and reported as operating profits and losses on discontinuedoperations in the periods in which they occur.
Business Promotion and Advertising Costs
The costs of business promotion and advertising are expensed as incurred. Business promotion andadvertising costs of $37.5 million, $27.5 million and $55.1 million were included in operating, administrative andother expenses for the years ended December 31, 2010, 2009 and 2008, respectively.
Foreign Currencies
The financial statements of subsidiaries located outside the U.S. are generally measured using the localcurrency as the functional currency. The assets and liabilities of these subsidiaries are translated at the rates ofexchange at the balance sheet date, and income and expenses are translated at the average monthly rate. Theresulting translation adjustments are included in the accumulated other comprehensive loss component of equity.Gains and losses resulting from foreign currency transactions are included in the results of operations. Theaggregate transaction losses (gains) included in the accompanying consolidated statements of operations for theyears ended December 31, 2010, 2009 and 2008 were $4.0 million, $0.6 million and ($6.4) million, respectively.
Derivative Financial Instruments
We routinely monitor our exposure to currency exchange rate changes in connection with transactions andsometimes enter into foreign currency exchange swap, option and forward contracts to limit our exposure to suchtransactions, as appropriate. In the normal course of business, we also sometimes utilize derivative financialinstruments in the form of foreign currency exchange contracts to mitigate foreign currency exchange exposureresulting from intercompany loans, expected cash flow and earnings. We apply the “Derivatives and Hedging”Topic of the FASB ASC (Topic 815) when accounting for any such contracts. Topic 815 requires us to recognizeall qualifying derivative instruments as assets or liabilities on our balance sheet and measure them at fair value.This literature requires that changes in the fair value of derivatives be recognized in earnings unless specifichedge accounting criteria are met. In all cases, we view derivative financial instruments as a risk managementtool and, accordingly, do not engage in any speculative activities with respect to foreign currency.
On December 22, 2008, we entered into a foreign currency exchange swap contract with an aggregatenotional amount of 39.5 million British pounds sterling, which expired on February 18, 2009, at which time weentered into another contract with similar terms that was settled on April 6, 2009. On May 12, 2009, we enteredinto an option agreement to sell a notional amount of 25.0 million of Euros, which expired on December 29,2009. On June 26, 2009, we entered into two option agreements, including one to sell a notional amount of5.5 million of British pounds sterling, which was exercised on September 28, 2009, and one to sell 10.0 millionof British pounds sterling, which was sold on December 18, 2009. On April 6, 2010, we entered into three optionagreements, including one to sell a notional amount of 4.0 million British pounds sterling, which was exercised
77
CB RICHARD ELLIS GROUP, INC.
NOTES TO CONSOLIDATED FINANCIAL STATEMENTS—(Continued)
on June 28, 2010, one to sell a notional amount of 4.0 million British pounds sterling, which expired onSeptember 28, 2010 and one to sell a notional amount of 7.6 million British pounds sterling, which expired onDecember 29, 2010. On April 12, 2010, we entered into three additional option agreements, including one to sella notional amount of 2.7 million Euros, which was exercised on June 28, 2010, one to sell a notional amount of2.4 million Euros, which was exercised on September 28, 2010 and one to sell a notional amount of 11.0 millionEuros, which was exercised on December 29, 2010. Included in the consolidated statements of operations werenet losses of $1.0 million, net losses of $3.7 million and net gains of $1.6 million for the years endedDecember 31, 2010, 2009 and 2008, respectively, resulting from net losses and gains on foreign currencyexchange swap, option and forward contracts.
We also enter into loan commitments that relate to the origination or acquisition of commercial mortgageloans that will be held for resale. Topic 815 requires that these commitments be recorded at their fair values asderivatives. The net impact on our financial position and earnings resulting from these derivatives contracts hasnot been significant.
From time to time, we enter into interest rate swap and cap agreements in order to limit our interest expenserelated to our notes payable on real estate. If any of these agreements are not designated as effective hedges, thenthey are marked to market each period with the change in fair value recognized in current period earnings. Thenet impact on our earnings resulting from gains and/or losses on interest rate swap and cap agreements associatedwith notes payable on real estate has not been significant.
Comprehensive Income (Loss)
Comprehensive income (loss) consists of net income (loss) and other comprehensive income (loss). In theaccompanying consolidated balance sheets, accumulated other comprehensive loss consists of foreign currencytranslation adjustments, unrealized gains (losses) on interest rate swaps and interest rate caps, unrealized holdinggains (losses) on available for sale securities and other pension liability adjustments. Foreign currency translationadjustments exclude any income tax effect given that earnings of non-U.S. subsidiaries are deemed to bereinvested for an indefinite period of time (see Note 15).
Marketable Securities
We account for investments in marketable debt and equity securities in accordance with the “Investments—Debt and Equity Securities” Topic of the FASB ASC (Topic 320). We determine the appropriate classification ofdebt and equity securities at the time of purchase and reevaluate such designation as of each balance sheet date.Marketable securities we acquire with the intent to generate a profit from short-term movements in market priceswould be classified as trading securities. Debt securities are classified as held to maturity when we have thepositive intent and ability to hold the securities to maturity. Marketable equity and debt securities not classifiedas trading or held to maturity are classified as available for sale.
Trading securities are carried at their fair value with realized and unrealized gains and losses included in netincome. Available for sale securities are carried at their fair value and any difference between cost and fair valueis recorded as unrealized gain or loss, net of income taxes, and is reported as accumulated other comprehensiveloss in the consolidated statement of equity. Premiums and discounts are recognized in interest income using theeffective interest method. Realized gains and losses and declines in value expected to be other-than-temporary onavailable for sale securities have not been significant. The cost of securities sold is based on the specificidentification method. Interest and dividends on securities classified as available for sale are included in interestincome.
78
CB RICHARD ELLIS GROUP, INC.
NOTES TO CONSOLIDATED FINANCIAL STATEMENTS—(Continued)
Warehouse Receivables
Our wholly-owned subsidiary CBRE Capital Markets is a Federal Home Loan Mortgage Corporation(Freddie Mac) approved Multifamily Program Plus Seller/Servicer and an approved Federal National MortgageAssociation (Fannie Mae) Aggregation and Negotiated Transaction Seller/Servicer. In addition, CBRE CapitalMarkets wholly-owned subsidiary Multifamily Capital is an approved Fannie Mae Delegated Underwriting andServicing (DUS) Seller/Servicer and CBRE Capital Markets wholly-owned subsidiary CBRE HMF is a U.S.Department of Housing and Urban Development (HUD) approved Non-Supervised Federal Housing Authority(FHA) Title II Mortgagee, an approved Multifamily Accelerated Processing (MAP) lender and an approvedGovernment National Mortgage Association (Ginnie Mae) issuer of mortgage-backed securities (MBS). Underthese arrangements, before loans are originated through proceeds from warehouse lines of credit, we obtain eithera contractual loan purchase commitment from either Freddie Mac or Fannie Mae or a confirmed forward tradecommitment for the issuance and purchase of a Fannie Mae or Ginnie Mae MBS that will be secured by theloans. The warehouse lines of credit are generally repaid within a one-month period when Freddie Mac or FannieMae buys the loans or upon settlement of the Fannie Mae or Ginnie Mae MBS, while we retain the servicingrights. Loans are funded at the prevailing market rates. We elect the fair value option for all warehousereceivables. At December 31, 2010 and 2009, all of the warehouse receivables included in the accompanyingconsolidated balance sheets were either under commitment to be purchased by Freddie Mac or had confirmedforward trade commitments for the issuance and purchase of Fannie Mae or Ginnie Mae mortgage backedsecurities that will be secured by the underlying loans.
Mortgage Servicing Rights
In connection with the origination and sale of mortgage loans with servicing rights retained, we recordservicing assets or liabilities based on the fair value of the mortgage servicing rights on the date the loans aresold. We also assume or purchase certain servicing assets. Servicing assets are carried at the lower of amortizedcost or fair value in other intangible assets in the accompanying consolidated balance sheets and are amortized inproportion to and over the estimated period that net servicing income is expected to be received based onprojections and timing of estimated future net cash flows.
Our recording of loan servicing rights at their fair value resulted in net gains, which have been reflected inthe accompanying consolidated statements of operations. The amount of loan servicing rights recognized duringthe years ended December 31, 2010 and 2009 was as follows (dollars in thousands):
Year EndedDecember 31,
2010 2009
Beginning balance, loan servicing rights . . . . . . . . . . . . . . . . . . . . . . . . . . . . . . . . . . . . . . . . . $40,579 $19,655Loan servicing rights recognized under Topic 860 . . . . . . . . . . . . . . . . . . . . . . . . . . . . . . . . . . 41,153 27,622Loan servicing rights sold . . . . . . . . . . . . . . . . . . . . . . . . . . . . . . . . . . . . . . . . . . . . . . . . . . . . . (7,391) (1,416)Amortization expense . . . . . . . . . . . . . . . . . . . . . . . . . . . . . . . . . . . . . . . . . . . . . . . . . . . . . . . . (9,022) (5,282)
Ending balance, loan servicing rights . . . . . . . . . . . . . . . . . . . . . . . . . . . . . . . . . . . . . . . . . . . . $65,319 $40,579
Management evaluates its mortgage servicing assets for impairment on an annual basis or more often ifcircumstances or events indicate a change in the impairment status. Mortgage servicing rights do not activelytrade in an open market with readily available observable prices; therefore, fair value is determined based oncertain assumptions and judgments, including the estimation of the present value of future cash flows realizedfrom servicing the underlying mortgage loans. Management’s assumptions include the benefits of servicing
79
CB RICHARD ELLIS GROUP, INC.
NOTES TO CONSOLIDATED FINANCIAL STATEMENTS—(Continued)
(servicing fee income and interest on escrow deposits), inflation, the cost of servicing, prepayment rates,delinquencies, discount rate and the estimated life of servicing cash flows. The assumptions used are subject tochange based on management’s judgments and estimates of changes in future cash flows and interest rates,among other things. We did not incur any impairment charges related to our servicing rights during the yearsended December 31, 2010, 2009 or 2008.
Accounting for Broker Draws
As part of our recruitment efforts relative to new U.S. brokers, we offer a transitional broker drawarrangement. Our broker draw arrangements generally last until such time as a broker’s pipeline of business issufficient to allow him or her to earn sustainable commissions. This program is intended to provide the brokerwith a minimal amount of cash flow to allow adequate time for his or her training as well as time for him or herto develop business relationships. Similar to traditional salaries, the broker draws are paid irrespective of theactual revenues generated by the broker. Often these broker draws represent the only form of compensationreceived by the broker. Furthermore, it is not our general policy to pursue collection of unearned broker drawspaid under this arrangement. As a result, we have concluded that broker draws are economically equivalent tosalaries paid and accordingly charge them to compensation as incurred. The broker is also entitled to earn acommission on completed revenue transactions. This amount is calculated as the commission that would havebeen payable under our full commission program, less any amounts previously paid to the broker in the form of adraw.
Stock-Based Compensation
We account for all employee awards under the fair value recognition provisions of the “Compensation—Stock Compensation” Topic of the FASB ASC (Topic 718). Topic 718 requires the measurement ofcompensation cost at the grant date, based upon the estimated fair value of the award, and requires amortizationof the related expense over the employee’s requisite service period.
See Note 14 for additional information on our stock-based compensation plans.
Income (Loss) Per Share
Basic income (loss) per share attributable to CB Richard Ellis Group, Inc. is computed by dividing netincome (loss) attributable to CB Richard Ellis Group, Inc. shareholders by the weighted average number ofcommon shares outstanding during each period. The computation of diluted income per share attributable to CBRichard Ellis Group, Inc. generally further assumes the dilutive effect of potential common shares, which includestock options and certain contingently issuable shares. Contingently issuable shares consist of non-vested stockawards. For the year ended December 31, 2008, all stock options and contingently issuable shares were anti-dilutive since we reported a net loss for the period. As a result, basic and diluted loss per share was the same forthe year ended December 31, 2008 (see Note 17).
Income Taxes
Income taxes are accounted for under the asset and liability method in accordance with the “Accounting forIncome Taxes” Topic of the FASB ASC (Topic 740). Deferred tax assets and liabilities are determined based ontemporary differences between the financial reporting and the tax basis of assets and liabilities and operating lossand tax credit carry forwards. Deferred tax assets and liabilities are measured by applying enacted tax rates andlaws and are released in the years in which the temporary differences are expected to be recovered or settled. The
80
CB RICHARD ELLIS GROUP, INC.
NOTES TO CONSOLIDATED FINANCIAL STATEMENTS—(Continued)
effect on deferred tax assets and liabilities of a change in tax rates is recognized in income in the period thatincludes the enactment date. Valuation allowances are provided against deferred tax assets when it is more likelythan not that some portion or all of the deferred tax asset will not be realized.
Self-Insurance
Our wholly-owned captive insurance companies, which are subject to applicable insurance rules andregulations, insures our exposure related to workers’ compensation benefits provided to employees and purchasesexcess coverage from an unrelated insurance carrier. We purchase general liability and automotive insurancethrough an unrelated insurance carrier. The captive insurance companies reinsure the related deductibles. Thecaptive insurance companies also insure deductibles relating to other coverages. Given the nature of these typesof claims, it may take several years for resolution and determination of the cost of these claims. We are requiredto estimate the cost of these claims in our financial statements. We are responsible for estimating our exposure toworkers’ compensation, general liability, automotive claims and professional indemnity claims.
The estimates that we utilize to record our potential losses on claims are inherently subjective, and actualclaims could differ from amounts recorded, which could result in increased or decreased expense in futureperiods. As of December 31, 2010 and 2009, our reserve for claims under these insurance programs were $35.4million and $27.1 million, respectively, which were included in other current and other long-term liabilities in theaccompanying consolidated balance sheets. Of these amounts, $8.2 million and $6.3 million, respectively,represented our estimated current liabilities as of December 31, 2010 and 2009.
Non-Controlling Interests in Consolidated Limited Life Subsidiaries
As of December 31, 2010, the estimated settlement value of non-controlling interests in our consolidatedlimited life subsidiaries was $110.1 million, as compared to the carrying value of $107.1 million, which wasincluded in non-controlling interests in the accompanying consolidated balance sheets. As of December 31, 2009,the carrying value of non-controlling interests in our consolidated limited life subsidiaries, which was included innon-controlling interests in the accompanying consolidated balance sheets, was $113.3 million, whichapproximated its settlement value.
New Accounting Pronouncements
In January 2010, the FASB issued ASU 2010-06, “Improving Disclosures about Fair Value Measurements,”which provides amendments to the FASB ASC Subtopic 820-10 that require new disclosures regarding(i) transfers in and out of Level 1 and Level 2 fair value measurements and (ii) activity in Level 3 fair valuemeasurements. ASU 2010-06 also clarifies existing disclosures regarding (i) the level of asset and liabilitydisaggregation and (ii) fair value measurement inputs and valuation techniques. As required, we adopted the newdisclosures and clarifications of existing disclosure requirements, except for the disclosures about purchases,sales, issuances and settlements in the roll forward of activity in Level 3 fair value measurements. Thosedisclosures are effective for fiscal years beginning after December 15, 2010, and for interim periods within thosefiscal years. We are currently evaluating the disclosure impact of adoption on our consolidated financialstatements, but do not expect it to have a material impact.
3. Consolidated Variable Interest Entities
We adopted ASU 2009-17 effective January 1, 2010 and as a result, we began consolidating certain variableinterest entities that were not previously consolidated by us.
81
CB RICHARD ELLIS GROUP, INC.
NOTES TO CONSOLIDATED FINANCIAL STATEMENTS—(Continued)
A consolidated subsidiary (the Venture) sponsored investments by third-party investors in eight commercialproperties through the formation of tenant-in-common limited liability companies and Delaware Statutory Trusts(collectively referred to as “the Entities”) that are owned by the third-party investors. The Venture also formedand is a member of a limited liability company for each property that serves as master tenant (Master Tenant).Each Master Tenant leases the property from the Entities through a master lease agreement. Pursuant to themaster lease agreements, the Master Tenant has the power to direct the day-to-day asset management activitiesthat most significantly impact the economic performance of the Entities. As a result, the Entities were deemed tobe variable interest entities since the third-party investors holding the equity investment at risk in the Entities donot direct the day-to-day activities that most significantly impact the economic performance of the propertiesheld by the Entities.
The Venture has made and may continue to make voluntary contributions to each of these properties tosupport their operations beyond the cash flow generated by the properties themselves. As of the most recentreconsideration date, such financial support has been significant enough that the Venture was deemed to be theprimary beneficiary of each entity. During the year ended December 31, 2010, the Venture funded $1.2 millionof financial support to the Entities.
The Entities were initially consolidated by the Venture upon adoption of ASU 2009-17 on January 1, 2010.The Entities’ assets and associated mortgage notes payable aggregated $251.0 million and $221.5 million,respectively, and were recorded based on their fair value at adoption. We did not recognize a gain or loss on theinitial consolidation of these Entities. The assets of the Entities are the sole collateral for the mortgage notespayable and other liabilities of the Entities and as such, the creditors and equity investors of these Entities haveno recourse to our assets held outside of these Entities.
For the year ended December 31, 2010, aggregate revenue of $34.5 million and operating expenses of $20.9million relating to the operating activities of the Entities are included in the accompanying consolidatedstatements of operations. The aggregate losses of the Entities for the year ended December 31, 2010 are $13.2million and are all attributable to non-controlling interests.
Investments in real estate of $243.0 million and nonrecourse mortgage notes payable of $223.1 million($34.9 million of which is current) are included in real estate assets held for investment and notes payable on realestate, respectively, in the accompanying consolidated balance sheets as of December 31, 2010. In addition,non-controlling interests of $20.6 million in the accompanying consolidated balance sheets as of December 31,2010 are attributable to the Entities.
4. Fair Value Measurements
The “Fair Value Measurements and Disclosures” Topic of the FASB ASC (Topic 820) defines fair value asthe exchange price that would be received for an asset or paid to transfer a liability (an exit price) in the principalor most advantageous market for the asset or liability in an orderly transaction between market participants at themeasurement date. Topic 820 also establishes a three-level fair value hierarchy that prioritizes the inputs used tomeasure fair value. This hierarchy requires entities to maximize the use of observable inputs and minimize theuse of unobservable inputs. The three levels of inputs used to measure fair value are as follows:
• Level 1—Quoted prices in active markets for identical assets or liabilities.
• Level 2—Observable inputs other than quoted prices included in Level 1, such as quoted prices forsimilar assets and liabilities in active markets; quoted prices for identical or similar assets and liabilitiesin markets that are not active; or other inputs that are observable or can be corroborated by observablemarket data.
82
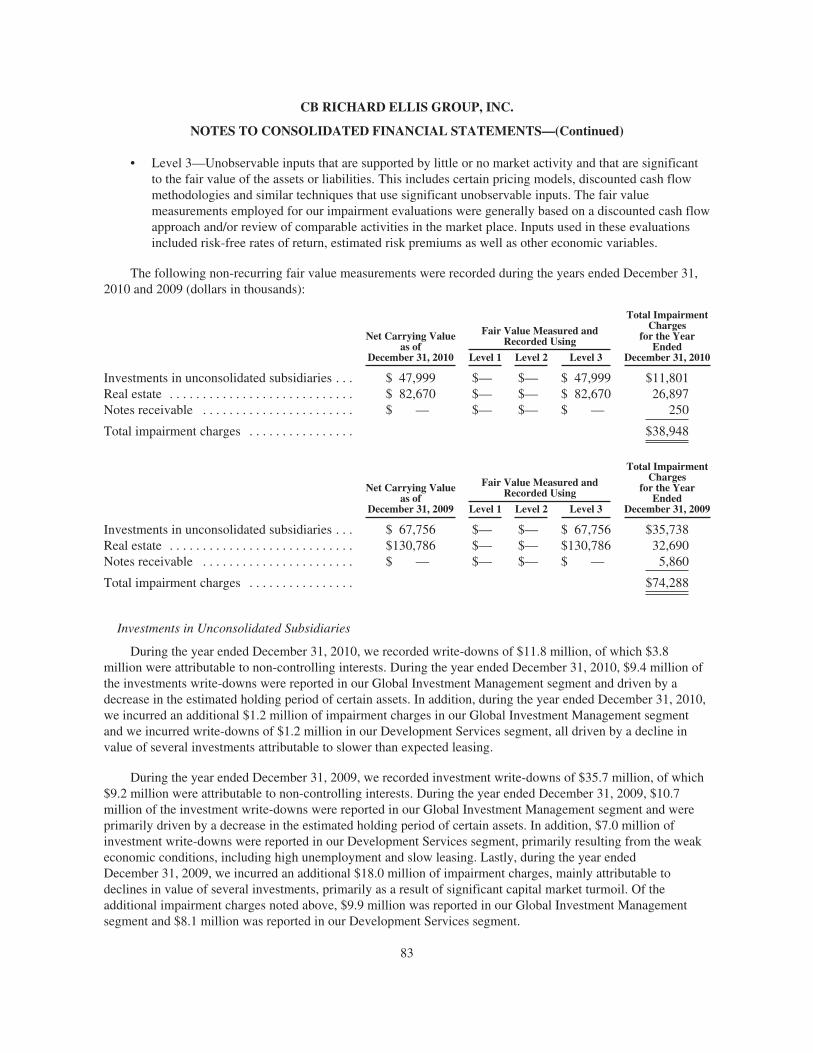
CB RICHARD ELLIS GROUP, INC.
NOTES TO CONSOLIDATED FINANCIAL STATEMENTS—(Continued)
• Level 3—Unobservable inputs that are supported by little or no market activity and that are significantto the fair value of the assets or liabilities. This includes certain pricing models, discounted cash flowmethodologies and similar techniques that use significant unobservable inputs. The fair valuemeasurements employed for our impairment evaluations were generally based on a discounted cash flowapproach and/or review of comparable activities in the market place. Inputs used in these evaluationsincluded risk-free rates of return, estimated risk premiums as well as other economic variables.
The following non-recurring fair value measurements were recorded during the years ended December 31,2010 and 2009 (dollars in thousands):
Net Carrying Valueas of
December 31, 2010
Fair Value Measured andRecorded Using
Total ImpairmentCharges
for the YearEnded
December 31, 2010Level 1 Level 2 Level 3
Investments in unconsolidated subsidiaries . . . $ 47,999 $— $— $ 47,999 $11,801Real estate . . . . . . . . . . . . . . . . . . . . . . . . . . . . $ 82,670 $— $— $ 82,670 26,897Notes receivable . . . . . . . . . . . . . . . . . . . . . . . $ — $— $— $ — 250
Total impairment charges . . . . . . . . . . . . . . . . $38,948
Net Carrying Valueas of
December 31, 2009
Fair Value Measured andRecorded Using
Total ImpairmentCharges
for the YearEnded
December 31, 2009Level 1 Level 2 Level 3
Investments in unconsolidated subsidiaries . . . $ 67,756 $— $— $ 67,756 $35,738Real estate . . . . . . . . . . . . . . . . . . . . . . . . . . . . $130,786 $— $— $130,786 32,690Notes receivable . . . . . . . . . . . . . . . . . . . . . . . $ — $— $— $ — 5,860
Total impairment charges . . . . . . . . . . . . . . . . $74,288
Investments in Unconsolidated Subsidiaries
During the year ended December 31, 2010, we recorded write-downs of $11.8 million, of which $3.8million were attributable to non-controlling interests. During the year ended December 31, 2010, $9.4 million ofthe investments write-downs were reported in our Global Investment Management segment and driven by adecrease in the estimated holding period of certain assets. In addition, during the year ended December 31, 2010,we incurred an additional $1.2 million of impairment charges in our Global Investment Management segmentand we incurred write-downs of $1.2 million in our Development Services segment, all driven by a decline invalue of several investments attributable to slower than expected leasing.
During the year ended December 31, 2009, we recorded investment write-downs of $35.7 million, of which$9.2 million were attributable to non-controlling interests. During the year ended December 31, 2009, $10.7million of the investment write-downs were reported in our Global Investment Management segment and wereprimarily driven by a decrease in the estimated holding period of certain assets. In addition, $7.0 million ofinvestment write-downs were reported in our Development Services segment, primarily resulting from the weakeconomic conditions, including high unemployment and slow leasing. Lastly, during the year endedDecember 31, 2009, we incurred an additional $18.0 million of impairment charges, mainly attributable todeclines in value of several investments, primarily as a result of significant capital market turmoil. Of theadditional impairment charges noted above, $9.9 million was reported in our Global Investment Managementsegment and $8.1 million was reported in our Development Services segment.
83
CB RICHARD ELLIS GROUP, INC.
NOTES TO CONSOLIDATED FINANCIAL STATEMENTS—(Continued)
All of our impairment charges related to investments in unconsolidated subsidiaries were included in equityincome (loss) from unconsolidated subsidiaries in the accompanying consolidated statements of operations.When we performed our impairment analysis, the assumptions utilized reflected our outlook for the commercialreal estate industry and the impact on our business. This outlook incorporated our belief that market conditionsdeteriorated and that these challenging conditions could persist for some time.
Real Estate
During the year ended December 31, 2010, we recorded charges of $26.9 million, including impairmentcharges on real estate held for investment and provisions for losses on real estate held for sale. Of this amount,$23.8 million was attributable to non-controlling interests. During the year ended December 31, 2010, werecorded impairment charges of $24.6 million related to nine real estate projects primarily due to a decrease inthe estimated holding period of several of the projects and continued capital market disruption. Additionally,during the year ended December 31, 2010, we recorded provisions for losses on real estate held for sale of $2.3million to reduce the carrying values of two office buildings, an operating hotel and a land parcel to their fairvalue less cost to sell, primarily due to reduced expected selling prices resulting from continued challengingmarket conditions.
During the year ended December 31, 2009, we recorded charges of $32.7 million, including impairmentcharges on real estate held for investment and provision for losses on real estate held for sale. Of this amount,$27.0 million was attributable to non-controlling interests. During the year ended December 31, 2009, werecorded impairment charges of $28.8 million related to 13 projects where the carrying value was not recoverableprimarily due to a decrease in the estimated holding periods of the projects. Additionally, during the year endedDecember 31, 2009, we recorded provision for losses on real estate held for sale of $3.9 million to reduce thecarrying values of a condominium project and two pieces of land to their fair value less cost to sell, primarily dueto reduced selling prices resulting from market conditions.
All of the above-mentioned charges were included in operating, administrative and other expenses in theaccompanying consolidated statements of operations within our Development Services segment. If conditions inthe broader economy, commercial real estate industry, specific markets or product types in which we operateworsen and/or markets remain illiquid, we may be required to evaluate additional projects or re-evaluatepreviously impaired projects for potential impairment. These evaluations could result in additional impairmentcharges, which may be material.
Notes Receivable
During the year ended December 31, 2010 we recorded a $0.3 million impairment charge on a notereceivable secured by real estate, due to a decrease in value of the borrower’s real estate project, the proceedsfrom the sale of which would be used to repay the note receivable.
During the year ended December 31, 2009, we recorded a $5.9 million impairment charge on two notesreceivable secured by real estate as a result of the borrower defaulting on the notes. Of this amount, $5.4 millionwas attributable to non-controlling interests. These defaults resulted from the borrowers’ noncompliance withcertain terms of the note agreements. As a result, we accepted assignment of the underlying real estate assets inlieu of foreclosing under our security deeds. The impairment charge we recorded represents the differencebetween the carrying amounts of the notes and the fair value of the real estate assets acquired. This transactionalso resulted in a non-cash reclassification of $17.3 million from notes receivable to real estate held forinvestment during the year ended December 31, 2009.
84
CB RICHARD ELLIS GROUP, INC.
NOTES TO CONSOLIDATED FINANCIAL STATEMENTS—(Continued)
All of our impairment charges associated with notes receivable were included in operating, administrativeand other expenses in the accompanying consolidated statement of operations within our Development Servicessegment.
We do not have any material assets or liabilities that are required to be recorded at fair value on a recurringbasis.
Topic 820 also requires disclosure of fair value information about financial instruments, whether or notrecognized in the accompanying consolidated balance sheets, as follows:
Cash and Cash Equivalents and Restricted Cash: These balances include cash and cash equivalents as wellas restricted cash with maturities of less than three months. The carrying amount approximates fair value due tothe short-term maturities of these instruments.
Receivables, less Allowance for Doubtful Accounts: Due to their short-term nature, fair value approximatescarrying value.
Warehouse Receivables: Due to their short-term nature, fair value approximates carrying value. Fair value isdetermined based on the terms and conditions of funded mortgage loans and generally reflects the values of thewarehouse lines of credit outstanding for our wholly-owned subsidiary, CBRE Capital Markets (see Note 12).
Available for Sale Securities: These investments are carried at their fair value (see Note 8).
Short-Term Borrowings: The majority of this balance represents our warehouse lines of credit outstandingfor CBRE Capital Markets and our revolving credit facility. Due to the short-term nature and variable interestrates of these instruments, fair value approximates carrying value (see Note 12).
Senior Secured Term Loans: Based upon information from third-party banks, the estimated fair value of oursenior secured term loans was approximately $641.8 million at December 31, 2010. Their actual carrying valuetotaled $640.5 million at December 31, 2010 (see Note 12).
11.625% Senior Subordinated Notes: Based on dealers’ quotes, the estimated fair value of our 11.625%senior subordinated notes was $508.3 million at December 31, 2010. Their actual carrying value totaled $437.7million at December 31, 2010 (see Note 12).
6.625% Senior Notes: Based on dealers’ quotes, the estimated fair value of our 6.625% senior notes was$347.8 million at December 31, 2010. Their actual carrying value totaled $350.0 million at December 31, 2010(see Note 12).
Notes Payable on Real Estate: As of December 31, 2010, the carrying value of our notes payable on realestate was $627.5 million (see Note 11). These borrowings mostly have floating interest rates at spreads over amarket rate index. It is likely that some portion of our notes payable on real estate have fair values lower thanactual carrying values. Given our volume of notes payable and the cost involved in estimating their fair value, wedetermined it was not practicable to do so. Additionally, only $3.7 million of these notes payable are recourse tous as of December 31, 2010.
85
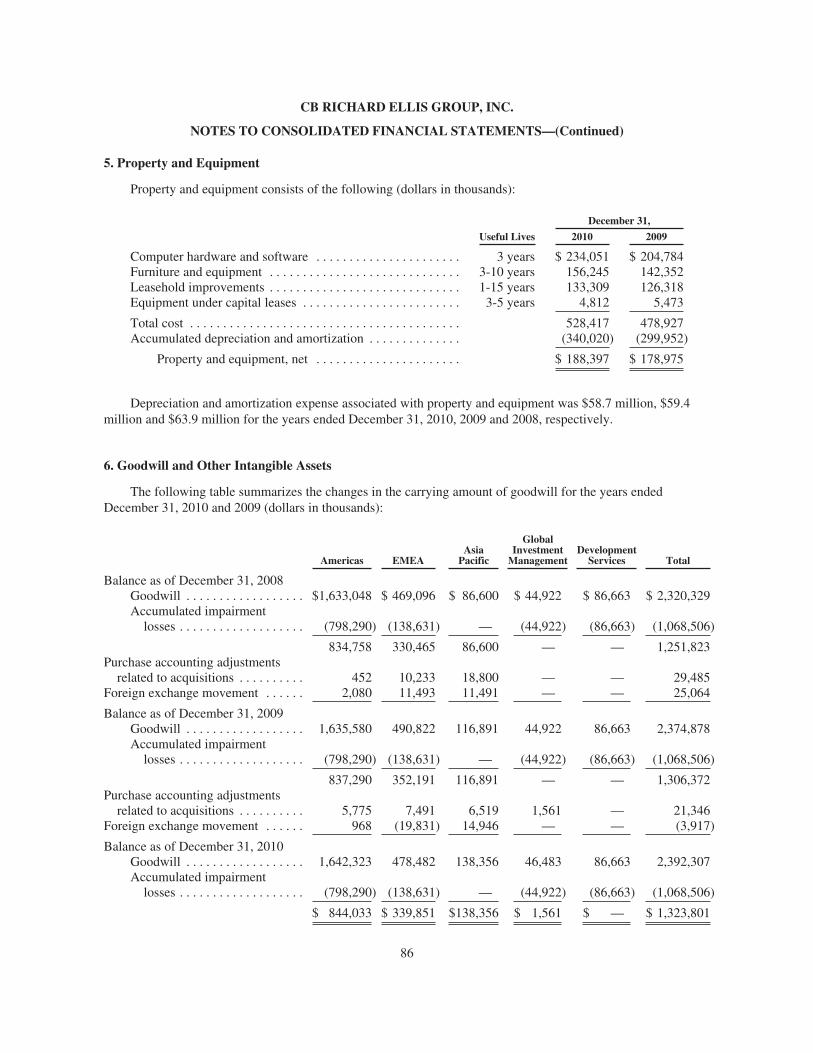
CB RICHARD ELLIS GROUP, INC.
NOTES TO CONSOLIDATED FINANCIAL STATEMENTS—(Continued)
5. Property and Equipment
Property and equipment consists of the following (dollars in thousands):
December 31,
Useful Lives 2010 2009
Computer hardware and software . . . . . . . . . . . . . . . . . . . . . . 3 years $ 234,051 $ 204,784Furniture and equipment . . . . . . . . . . . . . . . . . . . . . . . . . . . . . 3-10 years 156,245 142,352Leasehold improvements . . . . . . . . . . . . . . . . . . . . . . . . . . . . . 1-15 years 133,309 126,318Equipment under capital leases . . . . . . . . . . . . . . . . . . . . . . . . 3-5 years 4,812 5,473
Total cost . . . . . . . . . . . . . . . . . . . . . . . . . . . . . . . . . . . . . . . . . 528,417 478,927Accumulated depreciation and amortization . . . . . . . . . . . . . . (340,020) (299,952)
Property and equipment, net . . . . . . . . . . . . . . . . . . . . . . $ 188,397 $ 178,975
Depreciation and amortization expense associated with property and equipment was $58.7 million, $59.4million and $63.9 million for the years ended December 31, 2010, 2009 and 2008, respectively.
6. Goodwill and Other Intangible Assets
The following table summarizes the changes in the carrying amount of goodwill for the years endedDecember 31, 2010 and 2009 (dollars in thousands):
Americas EMEAAsia
Pacific
GlobalInvestment
ManagementDevelopment
Services Total
Balance as of December 31, 2008Goodwill . . . . . . . . . . . . . . . . . . $1,633,048 $ 469,096 $ 86,600 $ 44,922 $ 86,663 $ 2,320,329Accumulated impairment
losses . . . . . . . . . . . . . . . . . . . (798,290) (138,631) — (44,922) (86,663) (1,068,506)
834,758 330,465 86,600 — — 1,251,823Purchase accounting adjustments
related to acquisitions . . . . . . . . . . 452 10,233 18,800 — — 29,485Foreign exchange movement . . . . . . 2,080 11,493 11,491 — — 25,064
Balance as of December 31, 2009Goodwill . . . . . . . . . . . . . . . . . . 1,635,580 490,822 116,891 44,922 86,663 2,374,878Accumulated impairment
losses . . . . . . . . . . . . . . . . . . . (798,290) (138,631) — (44,922) (86,663) (1,068,506)
837,290 352,191 116,891 — — 1,306,372Purchase accounting adjustments
related to acquisitions . . . . . . . . . . 5,775 7,491 6,519 1,561 — 21,346Foreign exchange movement . . . . . . 968 (19,831) 14,946 — — (3,917)
Balance as of December 31, 2010Goodwill . . . . . . . . . . . . . . . . . . 1,642,323 478,482 138,356 46,483 86,663 2,392,307Accumulated impairment
losses . . . . . . . . . . . . . . . . . . . (798,290) (138,631) — (44,922) (86,663) (1,068,506)
$ 844,033 $ 339,851 $138,356 $ 1,561 $ — $ 1,323,801
86
CB RICHARD ELLIS GROUP, INC.
NOTES TO CONSOLIDATED FINANCIAL STATEMENTS—(Continued)
We completed 16 acquisitions with an aggregate purchase price of approximately $181 million during theyear ended December 31, 2008, primarily in the first half of the year. The companies we acquired were generallyquality regional firms, niche specialty firms that complemented our existing platform within a region, or affiliatesin which, in some cases, we held an equity interest. These included three notable acquisitions within our EMEAsegment: the acquisition of Eurisko Consulting SRL, the largest independent commercial real estate servicescompany in Romania, which extends our ability to deliver the premier commercial real estate services offeringacross Central and Eastern Europe; the acquisition of CB Richard Ellis Cederholm A/S, an affiliate company inDenmark, which significantly strengthens our platform in Scandinavia by giving us a wholly-owned position inone of the region’s most active property markets; and the acquisition of Espansione Commerciale, the marketleader in shopping centre leasing and property management in Italy, which extends our international retailservices capability in that region.
In light of the recent economic environment, no acquisitions were completed in 2009 and 2010, with theexception of a small niche industrial practice in the U.K. that we acquired in the second quarter of 2010 and asmall commercial property asset management and consultancy services firm in Hong Kong in the fourth quarterof 2010.
Our annual assessment of goodwill and other intangible assets deemed to have indefinite lives hashistorically been completed as of the beginning of the fourth quarter of each year. We performed the 2010, 2009,and 2008 annual assessments as of October 1. However, we were required to re-perform the 2008 assessment asof December 31, 2008 because economic conditions worsened, the capital markets became distressed and ourstock price dropped significantly in the fourth quarter of 2008. This was evidenced in our 2008 results by weaksales and leasing activity in our Americas and EMEA segments caused by the credit crunch and significantcapital market turmoil, which adversely affected incentive-based revenue within our Global InvestmentManagement segment as well as reduced real estate sales volume and values in our Development Servicessegment. Based on our assessments of goodwill in 2008, we determined that we had impairment in severalreporting units, which was driven by these adverse economic conditions causing a decline in the estimated futurediscounted cash flows expected for such units. The amount of the pre-tax goodwill impairment charges includedin our statement of operations for the year ended December 31, 2008 was $1.1 billion.
When we performed our required annual goodwill impairment review as of October 1, 2010 and 2009, wedetermined that no impairment existed as the estimated fair value of our reporting units was in excess of theircarrying value. Although economic conditions remained weak for most of 2009 and our full year revenues for2009 declined when compared to 2008, we did note early signs of an economic recovery taking place in the latterpart of 2009, which continued throughout 2010. This was evidenced by several indicators, including our stockprice ($18.13 per share on October 1, 2010 and $10.94 per share on October 1, 2009 versus $4.32 per share atDecember 31, 2008), a return to positive economic growth in the U.S. in the second half of 2009 and aneconomic rebound in the Asia Pacific region with transaction activity beginning to revive in late 2009. Theseindicators, as well as the benefit of cost reduction measures implemented in the second half of 2008 and in 2009,led to a significant increase in the estimated fair value of the Company’s reporting units as of October 1, 2010and 2009 as compared to the estimated fair value at December 31, 2008. In addition, the overall size of ourgoodwill being tested was sharply reduced as a result of the $1.1 billion impairment charge recorded during theyear ended December 31, 2008. This impairment charge included the write-off of goodwill in its entirety in tworeporting units that were most severely impacted by the weak economic conditions at that time (i.e. GlobalInvestment Management and Development Services).
If we experience a significant or sustained decline in our future cash flows and/or if the current economicconditions significantly worsen, we may need to perform additional impairment analysis in the future.
87
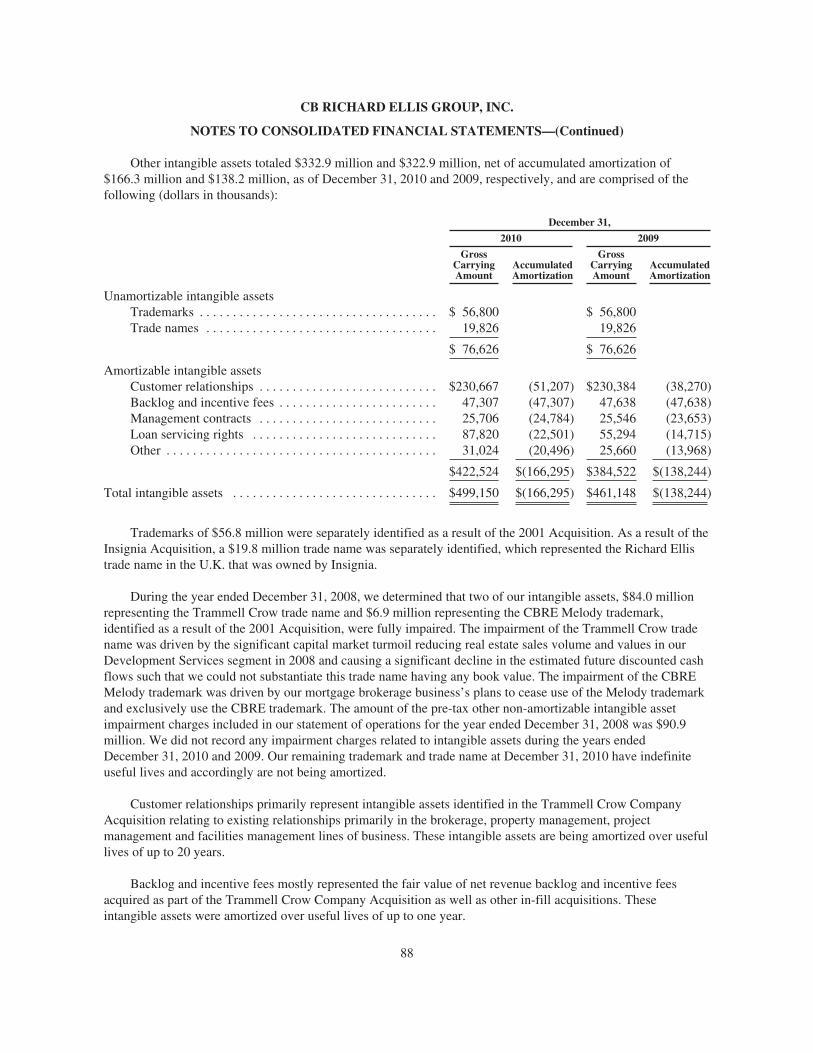
CB RICHARD ELLIS GROUP, INC.
NOTES TO CONSOLIDATED FINANCIAL STATEMENTS—(Continued)
Other intangible assets totaled $332.9 million and $322.9 million, net of accumulated amortization of$166.3 million and $138.2 million, as of December 31, 2010 and 2009, respectively, and are comprised of thefollowing (dollars in thousands):
December 31,
2010 2009
GrossCarryingAmount
AccumulatedAmortization
GrossCarryingAmount
AccumulatedAmortization
Unamortizable intangible assetsTrademarks . . . . . . . . . . . . . . . . . . . . . . . . . . . . . . . . . . . . $ 56,800 $ 56,800Trade names . . . . . . . . . . . . . . . . . . . . . . . . . . . . . . . . . . . 19,826 19,826
$ 76,626 $ 76,626
Amortizable intangible assetsCustomer relationships . . . . . . . . . . . . . . . . . . . . . . . . . . . $230,667 (51,207) $230,384 (38,270)Backlog and incentive fees . . . . . . . . . . . . . . . . . . . . . . . . 47,307 (47,307) 47,638 (47,638)Management contracts . . . . . . . . . . . . . . . . . . . . . . . . . . . 25,706 (24,784) 25,546 (23,653)Loan servicing rights . . . . . . . . . . . . . . . . . . . . . . . . . . . . 87,820 (22,501) 55,294 (14,715)Other . . . . . . . . . . . . . . . . . . . . . . . . . . . . . . . . . . . . . . . . . 31,024 (20,496) 25,660 (13,968)
$422,524 $(166,295) $384,522 $(138,244)
Total intangible assets . . . . . . . . . . . . . . . . . . . . . . . . . . . . . . . $499,150 $(166,295) $461,148 $(138,244)
Trademarks of $56.8 million were separately identified as a result of the 2001 Acquisition. As a result of theInsignia Acquisition, a $19.8 million trade name was separately identified, which represented the Richard Ellistrade name in the U.K. that was owned by Insignia.
During the year ended December 31, 2008, we determined that two of our intangible assets, $84.0 millionrepresenting the Trammell Crow trade name and $6.9 million representing the CBRE Melody trademark,identified as a result of the 2001 Acquisition, were fully impaired. The impairment of the Trammell Crow tradename was driven by the significant capital market turmoil reducing real estate sales volume and values in ourDevelopment Services segment in 2008 and causing a significant decline in the estimated future discounted cashflows such that we could not substantiate this trade name having any book value. The impairment of the CBREMelody trademark was driven by our mortgage brokerage business’s plans to cease use of the Melody trademarkand exclusively use the CBRE trademark. The amount of the pre-tax other non-amortizable intangible assetimpairment charges included in our statement of operations for the year ended December 31, 2008 was $90.9million. We did not record any impairment charges related to intangible assets during the years endedDecember 31, 2010 and 2009. Our remaining trademark and trade name at December 31, 2010 have indefiniteuseful lives and accordingly are not being amortized.
Customer relationships primarily represent intangible assets identified in the Trammell Crow CompanyAcquisition relating to existing relationships primarily in the brokerage, property management, projectmanagement and facilities management lines of business. These intangible assets are being amortized over usefullives of up to 20 years.
Backlog and incentive fees mostly represented the fair value of net revenue backlog and incentive feesacquired as part of the Trammell Crow Company Acquisition as well as other in-fill acquisitions. Theseintangible assets were amortized over useful lives of up to one year.
88
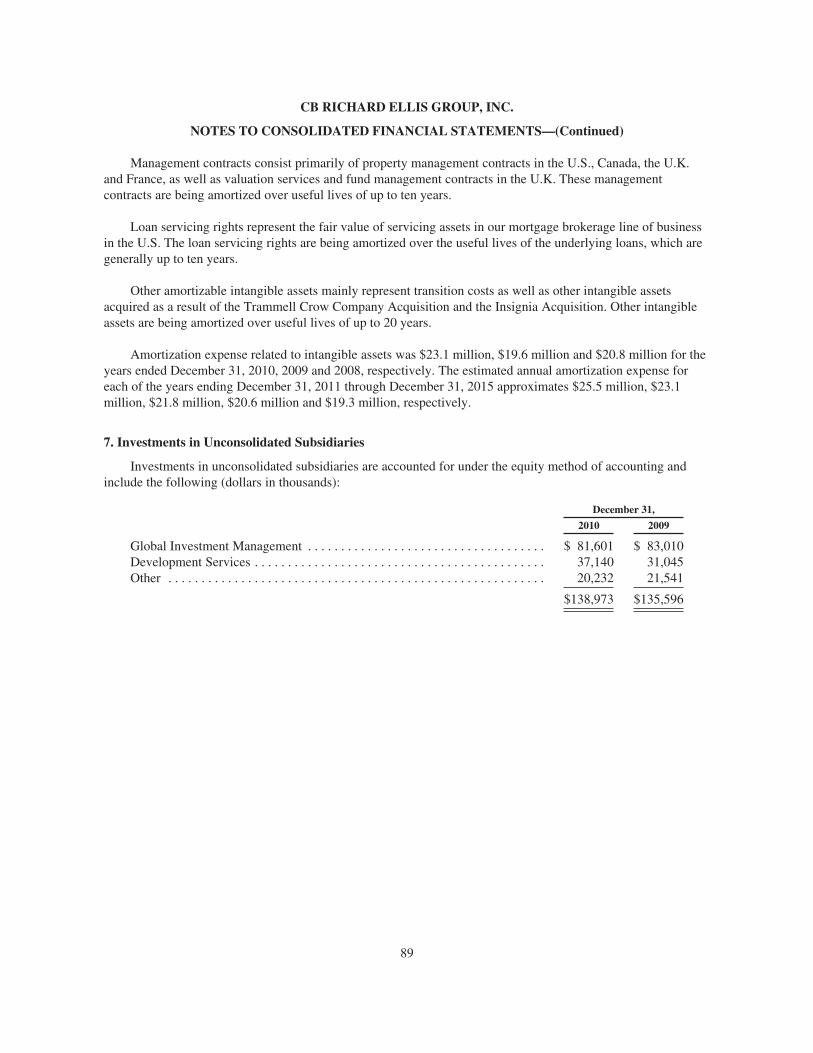
CB RICHARD ELLIS GROUP, INC.
NOTES TO CONSOLIDATED FINANCIAL STATEMENTS—(Continued)
Management contracts consist primarily of property management contracts in the U.S., Canada, the U.K.and France, as well as valuation services and fund management contracts in the U.K. These managementcontracts are being amortized over useful lives of up to ten years.
Loan servicing rights represent the fair value of servicing assets in our mortgage brokerage line of businessin the U.S. The loan servicing rights are being amortized over the useful lives of the underlying loans, which aregenerally up to ten years.
Other amortizable intangible assets mainly represent transition costs as well as other intangible assetsacquired as a result of the Trammell Crow Company Acquisition and the Insignia Acquisition. Other intangibleassets are being amortized over useful lives of up to 20 years.
Amortization expense related to intangible assets was $23.1 million, $19.6 million and $20.8 million for theyears ended December 31, 2010, 2009 and 2008, respectively. The estimated annual amortization expense foreach of the years ending December 31, 2011 through December 31, 2015 approximates $25.5 million, $23.1million, $21.8 million, $20.6 million and $19.3 million, respectively.
7. Investments in Unconsolidated Subsidiaries
Investments in unconsolidated subsidiaries are accounted for under the equity method of accounting andinclude the following (dollars in thousands):
December 31,
2010 2009
Global Investment Management . . . . . . . . . . . . . . . . . . . . . . . . . . . . . . . . . . . . $ 81,601 $ 83,010Development Services . . . . . . . . . . . . . . . . . . . . . . . . . . . . . . . . . . . . . . . . . . . . 37,140 31,045Other . . . . . . . . . . . . . . . . . . . . . . . . . . . . . . . . . . . . . . . . . . . . . . . . . . . . . . . . . 20,232 21,541
$138,973 $135,596
89
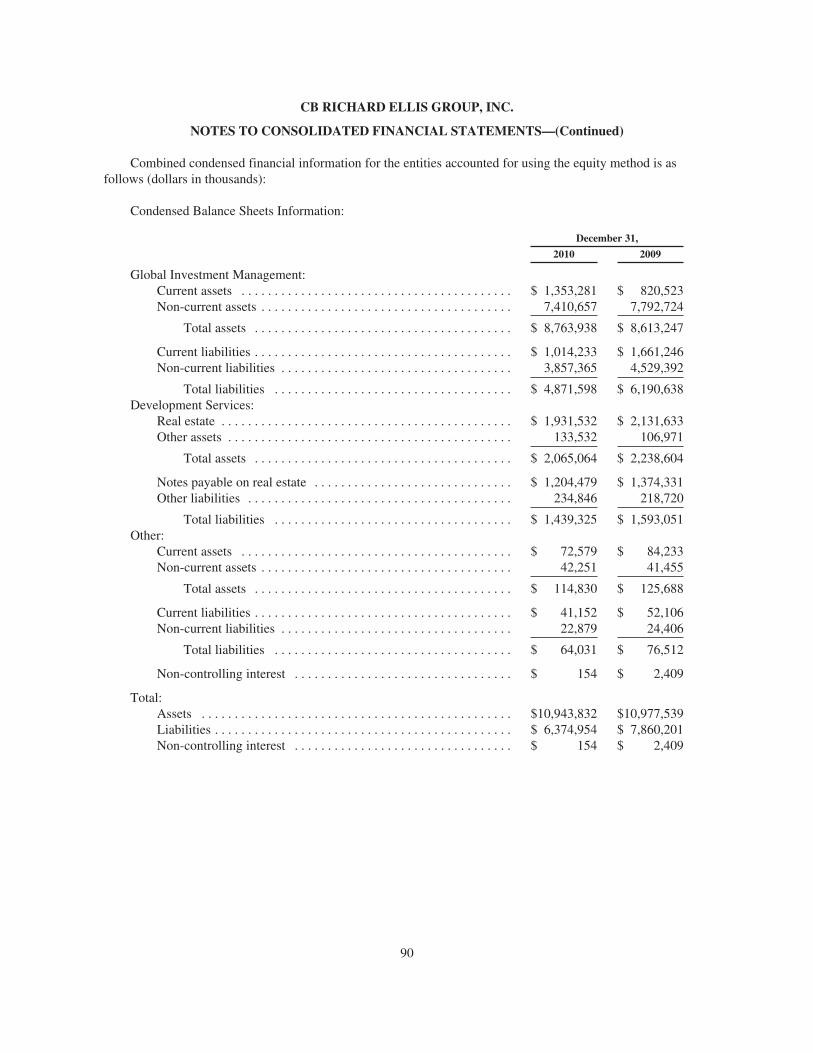
CB RICHARD ELLIS GROUP, INC.
NOTES TO CONSOLIDATED FINANCIAL STATEMENTS—(Continued)
Combined condensed financial information for the entities accounted for using the equity method is asfollows (dollars in thousands):
Condensed Balance Sheets Information:
December 31,
2010 2009
Global Investment Management:Current assets . . . . . . . . . . . . . . . . . . . . . . . . . . . . . . . . . . . . . . . . . $ 1,353,281 $ 820,523Non-current assets . . . . . . . . . . . . . . . . . . . . . . . . . . . . . . . . . . . . . . 7,410,657 7,792,724
Total assets . . . . . . . . . . . . . . . . . . . . . . . . . . . . . . . . . . . . . . . $ 8,763,938 $ 8,613,247
Current liabilities . . . . . . . . . . . . . . . . . . . . . . . . . . . . . . . . . . . . . . . $ 1,014,233 $ 1,661,246Non-current liabilities . . . . . . . . . . . . . . . . . . . . . . . . . . . . . . . . . . . 3,857,365 4,529,392
Total liabilities . . . . . . . . . . . . . . . . . . . . . . . . . . . . . . . . . . . . $ 4,871,598 $ 6,190,638Development Services:
Real estate . . . . . . . . . . . . . . . . . . . . . . . . . . . . . . . . . . . . . . . . . . . . $ 1,931,532 $ 2,131,633Other assets . . . . . . . . . . . . . . . . . . . . . . . . . . . . . . . . . . . . . . . . . . . 133,532 106,971
Total assets . . . . . . . . . . . . . . . . . . . . . . . . . . . . . . . . . . . . . . . $ 2,065,064 $ 2,238,604
Notes payable on real estate . . . . . . . . . . . . . . . . . . . . . . . . . . . . . . $ 1,204,479 $ 1,374,331Other liabilities . . . . . . . . . . . . . . . . . . . . . . . . . . . . . . . . . . . . . . . . 234,846 218,720
Total liabilities . . . . . . . . . . . . . . . . . . . . . . . . . . . . . . . . . . . . $ 1,439,325 $ 1,593,051Other:
Current assets . . . . . . . . . . . . . . . . . . . . . . . . . . . . . . . . . . . . . . . . . $ 72,579 $ 84,233Non-current assets . . . . . . . . . . . . . . . . . . . . . . . . . . . . . . . . . . . . . . 42,251 41,455
Total assets . . . . . . . . . . . . . . . . . . . . . . . . . . . . . . . . . . . . . . . $ 114,830 $ 125,688
Current liabilities . . . . . . . . . . . . . . . . . . . . . . . . . . . . . . . . . . . . . . . $ 41,152 $ 52,106Non-current liabilities . . . . . . . . . . . . . . . . . . . . . . . . . . . . . . . . . . . 22,879 24,406
Total liabilities . . . . . . . . . . . . . . . . . . . . . . . . . . . . . . . . . . . . $ 64,031 $ 76,512
Non-controlling interest . . . . . . . . . . . . . . . . . . . . . . . . . . . . . . . . . $ 154 $ 2,409
Total:Assets . . . . . . . . . . . . . . . . . . . . . . . . . . . . . . . . . . . . . . . . . . . . . . . $10,943,832 $10,977,539Liabilities . . . . . . . . . . . . . . . . . . . . . . . . . . . . . . . . . . . . . . . . . . . . . $ 6,374,954 $ 7,860,201Non-controlling interest . . . . . . . . . . . . . . . . . . . . . . . . . . . . . . . . . $ 154 $ 2,409
90
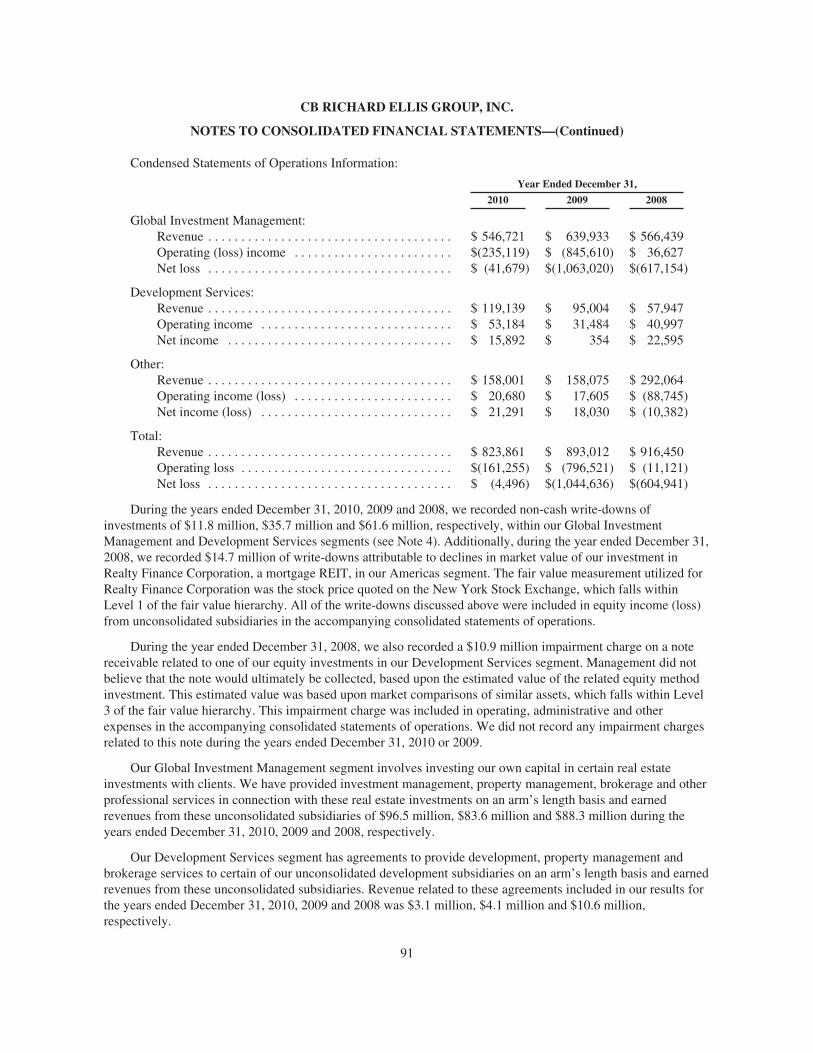
CB RICHARD ELLIS GROUP, INC.
NOTES TO CONSOLIDATED FINANCIAL STATEMENTS—(Continued)
Condensed Statements of Operations Information:
Year Ended December 31,
2010 2009 2008
Global Investment Management:Revenue . . . . . . . . . . . . . . . . . . . . . . . . . . . . . . . . . . . . . $ 546,721 $ 639,933 $ 566,439Operating (loss) income . . . . . . . . . . . . . . . . . . . . . . . . $(235,119) $ (845,610) $ 36,627Net loss . . . . . . . . . . . . . . . . . . . . . . . . . . . . . . . . . . . . . $ (41,679) $(1,063,020) $(617,154)
Development Services:Revenue . . . . . . . . . . . . . . . . . . . . . . . . . . . . . . . . . . . . . $ 119,139 $ 95,004 $ 57,947Operating income . . . . . . . . . . . . . . . . . . . . . . . . . . . . . $ 53,184 $ 31,484 $ 40,997Net income . . . . . . . . . . . . . . . . . . . . . . . . . . . . . . . . . . $ 15,892 $ 354 $ 22,595
Other:Revenue . . . . . . . . . . . . . . . . . . . . . . . . . . . . . . . . . . . . . $ 158,001 $ 158,075 $ 292,064Operating income (loss) . . . . . . . . . . . . . . . . . . . . . . . . $ 20,680 $ 17,605 $ (88,745)Net income (loss) . . . . . . . . . . . . . . . . . . . . . . . . . . . . . $ 21,291 $ 18,030 $ (10,382)
Total:Revenue . . . . . . . . . . . . . . . . . . . . . . . . . . . . . . . . . . . . . $ 823,861 $ 893,012 $ 916,450Operating loss . . . . . . . . . . . . . . . . . . . . . . . . . . . . . . . . $(161,255) $ (796,521) $ (11,121)Net loss . . . . . . . . . . . . . . . . . . . . . . . . . . . . . . . . . . . . . $ (4,496) $(1,044,636) $(604,941)
During the years ended December 31, 2010, 2009 and 2008, we recorded non-cash write-downs ofinvestments of $11.8 million, $35.7 million and $61.6 million, respectively, within our Global InvestmentManagement and Development Services segments (see Note 4). Additionally, during the year ended December 31,2008, we recorded $14.7 million of write-downs attributable to declines in market value of our investment inRealty Finance Corporation, a mortgage REIT, in our Americas segment. The fair value measurement utilized forRealty Finance Corporation was the stock price quoted on the New York Stock Exchange, which falls withinLevel 1 of the fair value hierarchy. All of the write-downs discussed above were included in equity income (loss)from unconsolidated subsidiaries in the accompanying consolidated statements of operations.
During the year ended December 31, 2008, we also recorded a $10.9 million impairment charge on a notereceivable related to one of our equity investments in our Development Services segment. Management did notbelieve that the note would ultimately be collected, based upon the estimated value of the related equity methodinvestment. This estimated value was based upon market comparisons of similar assets, which falls within Level3 of the fair value hierarchy. This impairment charge was included in operating, administrative and otherexpenses in the accompanying consolidated statements of operations. We did not record any impairment chargesrelated to this note during the years ended December 31, 2010 or 2009.
Our Global Investment Management segment involves investing our own capital in certain real estateinvestments with clients. We have provided investment management, property management, brokerage and otherprofessional services in connection with these real estate investments on an arm’s length basis and earnedrevenues from these unconsolidated subsidiaries of $96.5 million, $83.6 million and $88.3 million during theyears ended December 31, 2010, 2009 and 2008, respectively.
Our Development Services segment has agreements to provide development, property management andbrokerage services to certain of our unconsolidated development subsidiaries on an arm’s length basis and earnedrevenues from these unconsolidated subsidiaries. Revenue related to these agreements included in our results forthe years ended December 31, 2010, 2009 and 2008 was $3.1 million, $4.1 million and $10.6 million,respectively.
91
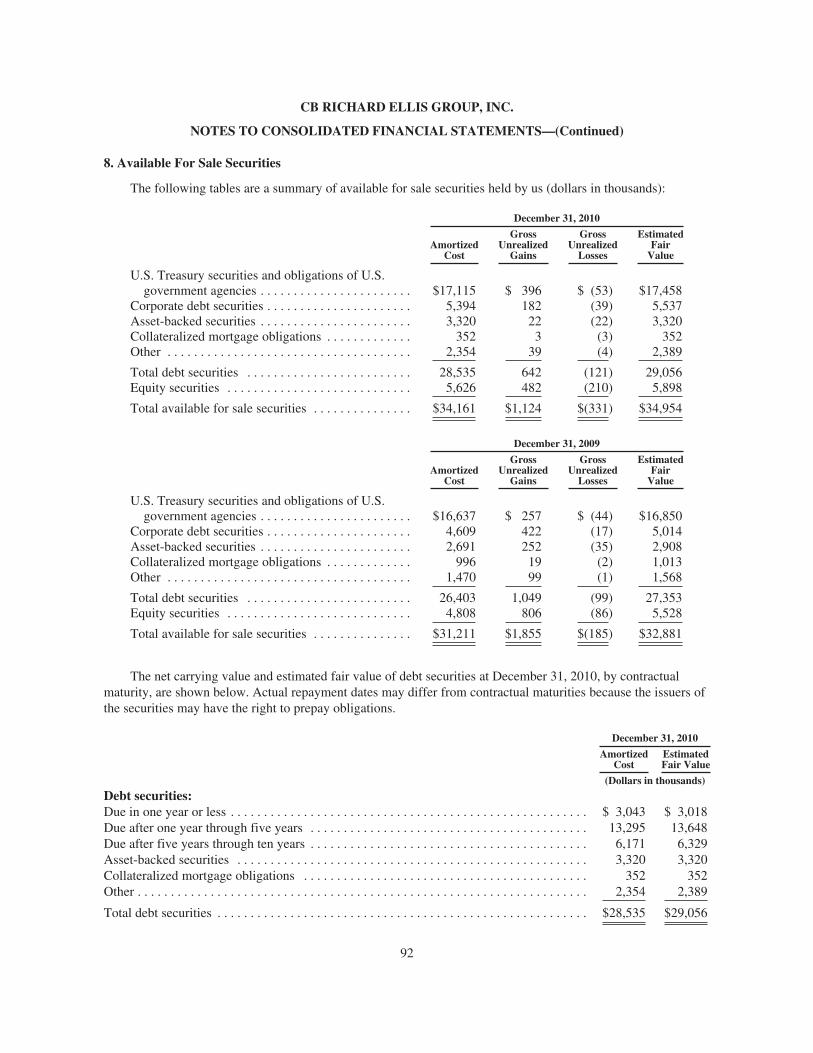
CB RICHARD ELLIS GROUP, INC.
NOTES TO CONSOLIDATED FINANCIAL STATEMENTS—(Continued)
8. Available For Sale Securities
The following tables are a summary of available for sale securities held by us (dollars in thousands):
December 31, 2010
AmortizedCost
GrossUnrealized
Gains
GrossUnrealized
Losses
EstimatedFair
Value
U.S. Treasury securities and obligations of U.S.government agencies . . . . . . . . . . . . . . . . . . . . . . . $17,115 $ 396 $ (53) $17,458
Corporate debt securities . . . . . . . . . . . . . . . . . . . . . . 5,394 182 (39) 5,537Asset-backed securities . . . . . . . . . . . . . . . . . . . . . . . 3,320 22 (22) 3,320Collateralized mortgage obligations . . . . . . . . . . . . . 352 3 (3) 352Other . . . . . . . . . . . . . . . . . . . . . . . . . . . . . . . . . . . . . 2,354 39 (4) 2,389
Total debt securities . . . . . . . . . . . . . . . . . . . . . . . . . 28,535 642 (121) 29,056Equity securities . . . . . . . . . . . . . . . . . . . . . . . . . . . . 5,626 482 (210) 5,898
Total available for sale securities . . . . . . . . . . . . . . . $34,161 $1,124 $(331) $34,954
December 31, 2009
AmortizedCost
GrossUnrealized
Gains
GrossUnrealized
Losses
EstimatedFair
Value
U.S. Treasury securities and obligations of U.S.government agencies . . . . . . . . . . . . . . . . . . . . . . . $16,637 $ 257 $ (44) $16,850
Corporate debt securities . . . . . . . . . . . . . . . . . . . . . . 4,609 422 (17) 5,014Asset-backed securities . . . . . . . . . . . . . . . . . . . . . . . 2,691 252 (35) 2,908Collateralized mortgage obligations . . . . . . . . . . . . . 996 19 (2) 1,013Other . . . . . . . . . . . . . . . . . . . . . . . . . . . . . . . . . . . . . 1,470 99 (1) 1,568
Total debt securities . . . . . . . . . . . . . . . . . . . . . . . . . 26,403 1,049 (99) 27,353Equity securities . . . . . . . . . . . . . . . . . . . . . . . . . . . . 4,808 806 (86) 5,528
Total available for sale securities . . . . . . . . . . . . . . . $31,211 $1,855 $(185) $32,881
The net carrying value and estimated fair value of debt securities at December 31, 2010, by contractualmaturity, are shown below. Actual repayment dates may differ from contractual maturities because the issuers ofthe securities may have the right to prepay obligations.
December 31, 2010
AmortizedCost
EstimatedFair Value
(Dollars in thousands)
Debt securities:Due in one year or less . . . . . . . . . . . . . . . . . . . . . . . . . . . . . . . . . . . . . . . . . . . . . . . . . . . . . . $ 3,043 $ 3,018Due after one year through five years . . . . . . . . . . . . . . . . . . . . . . . . . . . . . . . . . . . . . . . . . . 13,295 13,648Due after five years through ten years . . . . . . . . . . . . . . . . . . . . . . . . . . . . . . . . . . . . . . . . . . 6,171 6,329Asset-backed securities . . . . . . . . . . . . . . . . . . . . . . . . . . . . . . . . . . . . . . . . . . . . . . . . . . . . . 3,320 3,320Collateralized mortgage obligations . . . . . . . . . . . . . . . . . . . . . . . . . . . . . . . . . . . . . . . . . . . 352 352Other . . . . . . . . . . . . . . . . . . . . . . . . . . . . . . . . . . . . . . . . . . . . . . . . . . . . . . . . . . . . . . . . . . . . 2,354 2,389
Total debt securities . . . . . . . . . . . . . . . . . . . . . . . . . . . . . . . . . . . . . . . . . . . . . . . . . . . . . . . . $28,535 $29,056
92
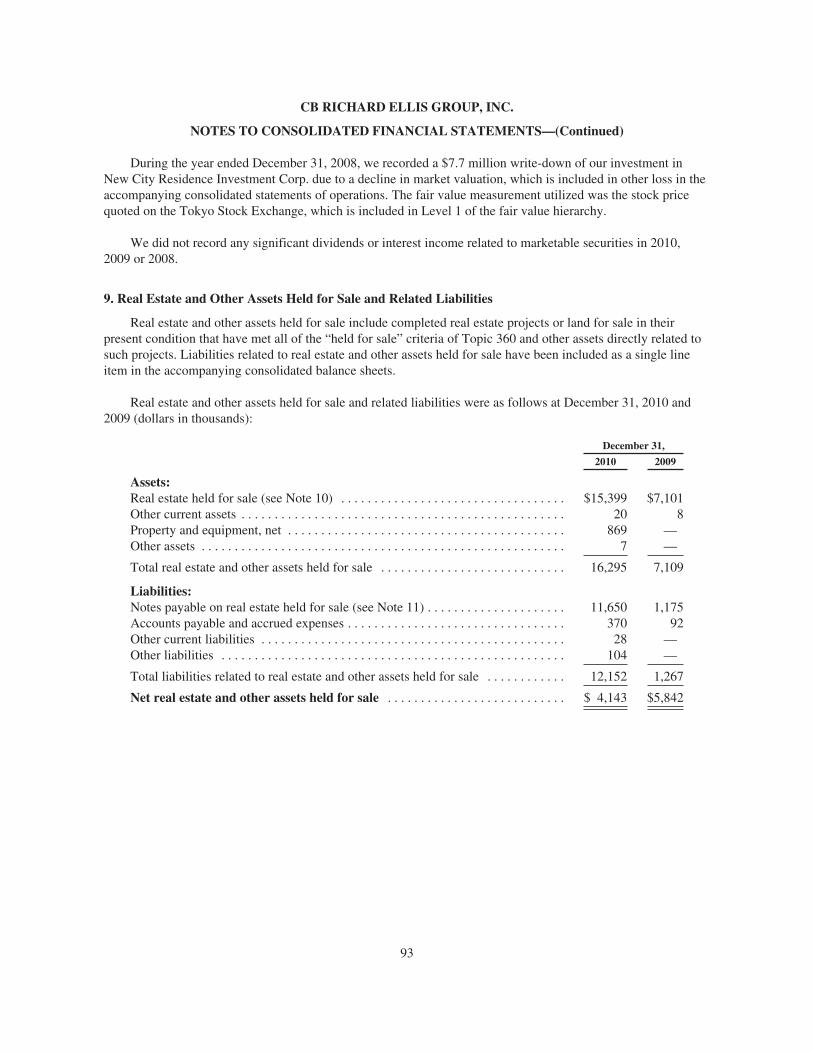
CB RICHARD ELLIS GROUP, INC.
NOTES TO CONSOLIDATED FINANCIAL STATEMENTS—(Continued)
During the year ended December 31, 2008, we recorded a $7.7 million write-down of our investment inNew City Residence Investment Corp. due to a decline in market valuation, which is included in other loss in theaccompanying consolidated statements of operations. The fair value measurement utilized was the stock pricequoted on the Tokyo Stock Exchange, which is included in Level 1 of the fair value hierarchy.
We did not record any significant dividends or interest income related to marketable securities in 2010,2009 or 2008.
9. Real Estate and Other Assets Held for Sale and Related Liabilities
Real estate and other assets held for sale include completed real estate projects or land for sale in theirpresent condition that have met all of the “held for sale” criteria of Topic 360 and other assets directly related tosuch projects. Liabilities related to real estate and other assets held for sale have been included as a single lineitem in the accompanying consolidated balance sheets.
Real estate and other assets held for sale and related liabilities were as follows at December 31, 2010 and2009 (dollars in thousands):
December 31,
2010 2009
Assets:Real estate held for sale (see Note 10) . . . . . . . . . . . . . . . . . . . . . . . . . . . . . . . . . . $15,399 $7,101Other current assets . . . . . . . . . . . . . . . . . . . . . . . . . . . . . . . . . . . . . . . . . . . . . . . . . 20 8Property and equipment, net . . . . . . . . . . . . . . . . . . . . . . . . . . . . . . . . . . . . . . . . . . 869 —Other assets . . . . . . . . . . . . . . . . . . . . . . . . . . . . . . . . . . . . . . . . . . . . . . . . . . . . . . . 7 —
Total real estate and other assets held for sale . . . . . . . . . . . . . . . . . . . . . . . . . . . . 16,295 7,109
Liabilities:Notes payable on real estate held for sale (see Note 11) . . . . . . . . . . . . . . . . . . . . . 11,650 1,175Accounts payable and accrued expenses . . . . . . . . . . . . . . . . . . . . . . . . . . . . . . . . . 370 92Other current liabilities . . . . . . . . . . . . . . . . . . . . . . . . . . . . . . . . . . . . . . . . . . . . . . 28 —Other liabilities . . . . . . . . . . . . . . . . . . . . . . . . . . . . . . . . . . . . . . . . . . . . . . . . . . . . 104 —
Total liabilities related to real estate and other assets held for sale . . . . . . . . . . . . 12,152 1,267
Net real estate and other assets held for sale . . . . . . . . . . . . . . . . . . . . . . . . . . . $ 4,143 $5,842
93
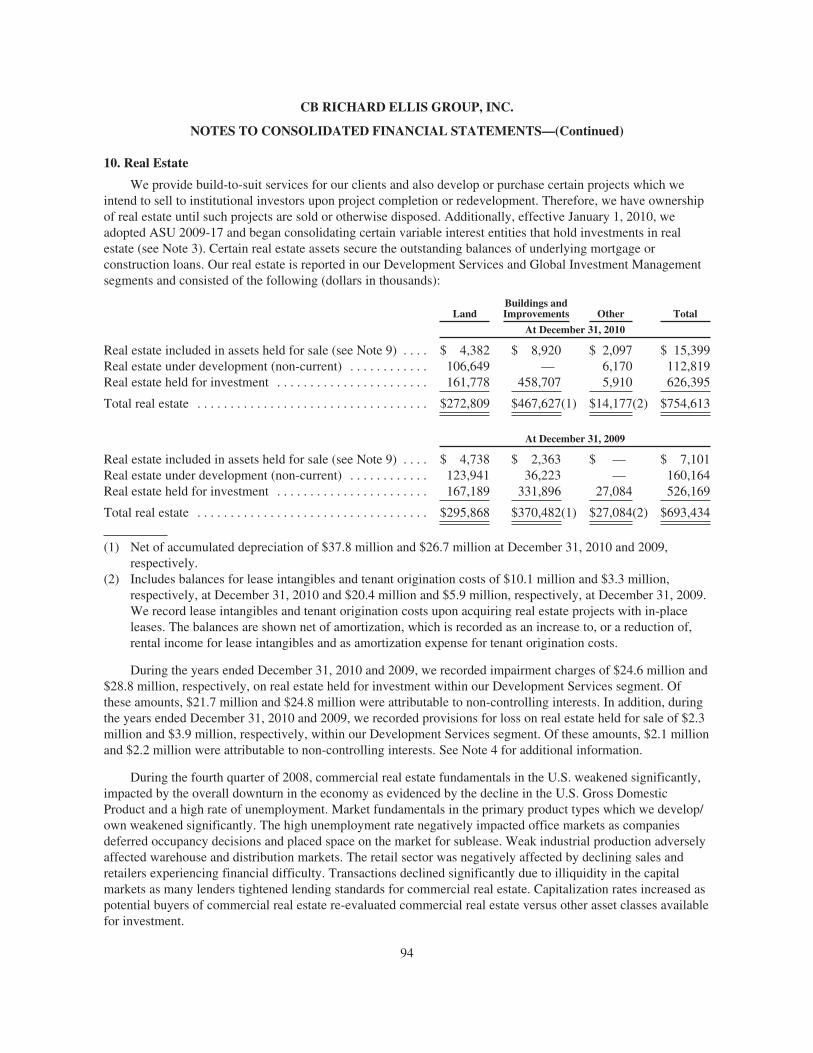
CB RICHARD ELLIS GROUP, INC.
NOTES TO CONSOLIDATED FINANCIAL STATEMENTS—(Continued)
10. Real Estate
We provide build-to-suit services for our clients and also develop or purchase certain projects which weintend to sell to institutional investors upon project completion or redevelopment. Therefore, we have ownershipof real estate until such projects are sold or otherwise disposed. Additionally, effective January 1, 2010, weadopted ASU 2009-17 and began consolidating certain variable interest entities that hold investments in realestate (see Note 3). Certain real estate assets secure the outstanding balances of underlying mortgage orconstruction loans. Our real estate is reported in our Development Services and Global Investment Managementsegments and consisted of the following (dollars in thousands):
LandBuildings andImprovements Other Total
At December 31, 2010
Real estate included in assets held for sale (see Note 9) . . . . $ 4,382 $ 8,920 $ 2,097 $ 15,399Real estate under development (non-current) . . . . . . . . . . . . 106,649 — 6,170 112,819Real estate held for investment . . . . . . . . . . . . . . . . . . . . . . . 161,778 458,707 5,910 626,395
Total real estate . . . . . . . . . . . . . . . . . . . . . . . . . . . . . . . . . . . $272,809 $467,627(1) $14,177(2) $754,613
At December 31, 2009
Real estate included in assets held for sale (see Note 9) . . . . $ 4,738 $ 2,363 $ — $ 7,101Real estate under development (non-current) . . . . . . . . . . . . 123,941 36,223 — 160,164Real estate held for investment . . . . . . . . . . . . . . . . . . . . . . . 167,189 331,896 27,084 526,169
Total real estate . . . . . . . . . . . . . . . . . . . . . . . . . . . . . . . . . . . $295,868 $370,482(1) $27,084(2) $693,434
(1) Net of accumulated depreciation of $37.8 million and $26.7 million at December 31, 2010 and 2009,respectively.
(2) Includes balances for lease intangibles and tenant origination costs of $10.1 million and $3.3 million,respectively, at December 31, 2010 and $20.4 million and $5.9 million, respectively, at December 31, 2009.We record lease intangibles and tenant origination costs upon acquiring real estate projects with in-placeleases. The balances are shown net of amortization, which is recorded as an increase to, or a reduction of,rental income for lease intangibles and as amortization expense for tenant origination costs.
During the years ended December 31, 2010 and 2009, we recorded impairment charges of $24.6 million and$28.8 million, respectively, on real estate held for investment within our Development Services segment. Ofthese amounts, $21.7 million and $24.8 million were attributable to non-controlling interests. In addition, duringthe years ended December 31, 2010 and 2009, we recorded provisions for loss on real estate held for sale of $2.3million and $3.9 million, respectively, within our Development Services segment. Of these amounts, $2.1 millionand $2.2 million were attributable to non-controlling interests. See Note 4 for additional information.
During the fourth quarter of 2008, commercial real estate fundamentals in the U.S. weakened significantly,impacted by the overall downturn in the economy as evidenced by the decline in the U.S. Gross DomesticProduct and a high rate of unemployment. Market fundamentals in the primary product types which we develop/own weakened significantly. The high unemployment rate negatively impacted office markets as companiesdeferred occupancy decisions and placed space on the market for sublease. Weak industrial production adverselyaffected warehouse and distribution markets. The retail sector was negatively affected by declining sales andretailers experiencing financial difficulty. Transactions declined significantly due to illiquidity in the capitalmarkets as many lenders tightened lending standards for commercial real estate. Capitalization rates increased aspotential buyers of commercial real estate re-evaluated commercial real estate versus other asset classes availablefor investment.
94
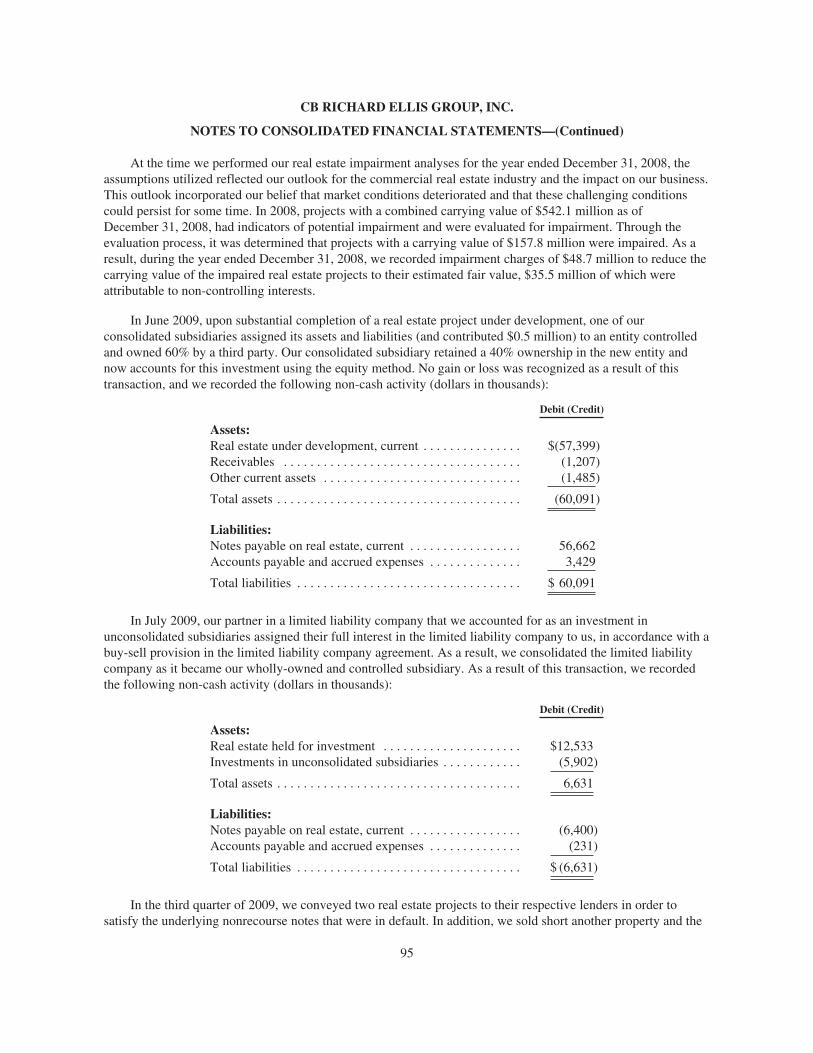
CB RICHARD ELLIS GROUP, INC.
NOTES TO CONSOLIDATED FINANCIAL STATEMENTS—(Continued)
At the time we performed our real estate impairment analyses for the year ended December 31, 2008, theassumptions utilized reflected our outlook for the commercial real estate industry and the impact on our business.This outlook incorporated our belief that market conditions deteriorated and that these challenging conditionscould persist for some time. In 2008, projects with a combined carrying value of $542.1 million as ofDecember 31, 2008, had indicators of potential impairment and were evaluated for impairment. Through theevaluation process, it was determined that projects with a carrying value of $157.8 million were impaired. As aresult, during the year ended December 31, 2008, we recorded impairment charges of $48.7 million to reduce thecarrying value of the impaired real estate projects to their estimated fair value, $35.5 million of which wereattributable to non-controlling interests.
In June 2009, upon substantial completion of a real estate project under development, one of ourconsolidated subsidiaries assigned its assets and liabilities (and contributed $0.5 million) to an entity controlledand owned 60% by a third party. Our consolidated subsidiary retained a 40% ownership in the new entity andnow accounts for this investment using the equity method. No gain or loss was recognized as a result of thistransaction, and we recorded the following non-cash activity (dollars in thousands):
Debit (Credit)
Assets:Real estate under development, current . . . . . . . . . . . . . . . $(57,399)Receivables . . . . . . . . . . . . . . . . . . . . . . . . . . . . . . . . . . . . (1,207)Other current assets . . . . . . . . . . . . . . . . . . . . . . . . . . . . . . (1,485)
Total assets . . . . . . . . . . . . . . . . . . . . . . . . . . . . . . . . . . . . . (60,091)
Liabilities:Notes payable on real estate, current . . . . . . . . . . . . . . . . . 56,662Accounts payable and accrued expenses . . . . . . . . . . . . . . 3,429
Total liabilities . . . . . . . . . . . . . . . . . . . . . . . . . . . . . . . . . . $ 60,091
In July 2009, our partner in a limited liability company that we accounted for as an investment inunconsolidated subsidiaries assigned their full interest in the limited liability company to us, in accordance with abuy-sell provision in the limited liability company agreement. As a result, we consolidated the limited liabilitycompany as it became our wholly-owned and controlled subsidiary. As a result of this transaction, we recordedthe following non-cash activity (dollars in thousands):
Debit (Credit)
Assets:Real estate held for investment . . . . . . . . . . . . . . . . . . . . . $12,533Investments in unconsolidated subsidiaries . . . . . . . . . . . . (5,902)
Total assets . . . . . . . . . . . . . . . . . . . . . . . . . . . . . . . . . . . . . 6,631
Liabilities:Notes payable on real estate, current . . . . . . . . . . . . . . . . . (6,400)Accounts payable and accrued expenses . . . . . . . . . . . . . . (231)
Total liabilities . . . . . . . . . . . . . . . . . . . . . . . . . . . . . . . . . . $ (6,631)
In the third quarter of 2009, we conveyed two real estate projects to their respective lenders in order tosatisfy the underlying nonrecourse notes that were in default. In addition, we sold short another property and the
95
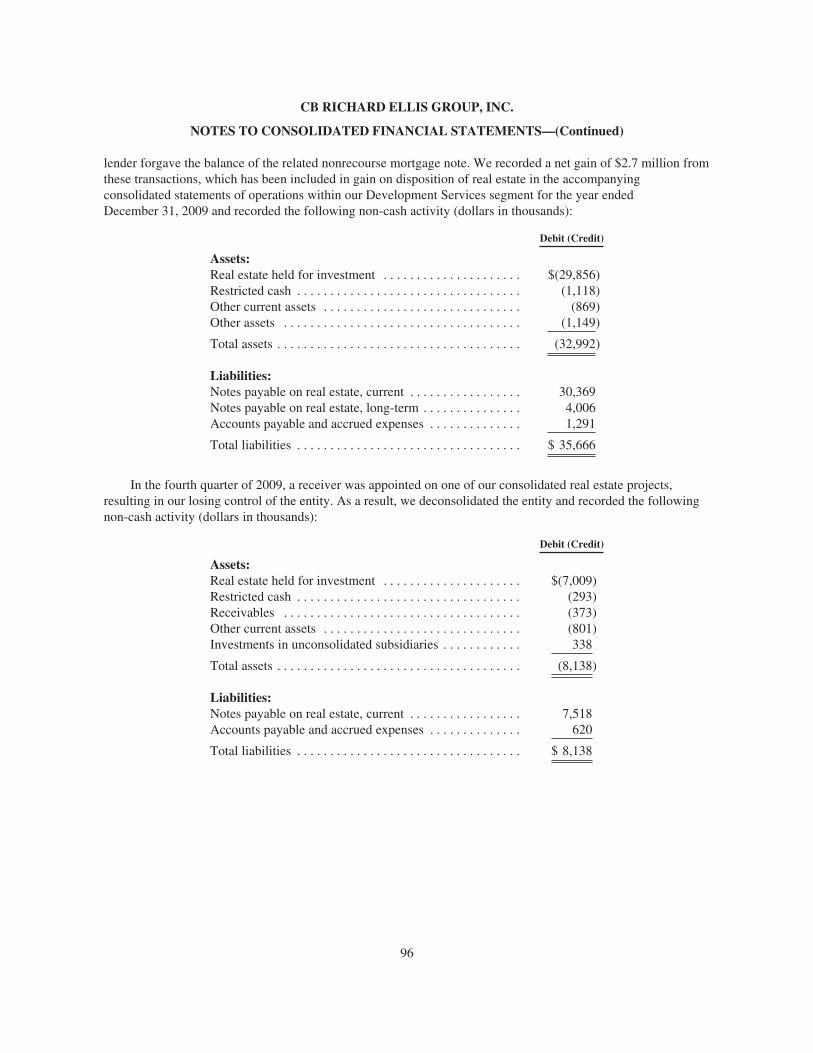
CB RICHARD ELLIS GROUP, INC.
NOTES TO CONSOLIDATED FINANCIAL STATEMENTS—(Continued)
lender forgave the balance of the related nonrecourse mortgage note. We recorded a net gain of $2.7 million fromthese transactions, which has been included in gain on disposition of real estate in the accompanyingconsolidated statements of operations within our Development Services segment for the year endedDecember 31, 2009 and recorded the following non-cash activity (dollars in thousands):
Debit (Credit)
Assets:Real estate held for investment . . . . . . . . . . . . . . . . . . . . . $(29,856)Restricted cash . . . . . . . . . . . . . . . . . . . . . . . . . . . . . . . . . . (1,118)Other current assets . . . . . . . . . . . . . . . . . . . . . . . . . . . . . . (869)Other assets . . . . . . . . . . . . . . . . . . . . . . . . . . . . . . . . . . . . (1,149)
Total assets . . . . . . . . . . . . . . . . . . . . . . . . . . . . . . . . . . . . . (32,992)
Liabilities:Notes payable on real estate, current . . . . . . . . . . . . . . . . . 30,369Notes payable on real estate, long-term . . . . . . . . . . . . . . . 4,006Accounts payable and accrued expenses . . . . . . . . . . . . . . 1,291
Total liabilities . . . . . . . . . . . . . . . . . . . . . . . . . . . . . . . . . . $ 35,666
In the fourth quarter of 2009, a receiver was appointed on one of our consolidated real estate projects,resulting in our losing control of the entity. As a result, we deconsolidated the entity and recorded the followingnon-cash activity (dollars in thousands):
Debit (Credit)
Assets:Real estate held for investment . . . . . . . . . . . . . . . . . . . . . $(7,009)Restricted cash . . . . . . . . . . . . . . . . . . . . . . . . . . . . . . . . . . (293)Receivables . . . . . . . . . . . . . . . . . . . . . . . . . . . . . . . . . . . . (373)Other current assets . . . . . . . . . . . . . . . . . . . . . . . . . . . . . . (801)Investments in unconsolidated subsidiaries . . . . . . . . . . . . 338
Total assets . . . . . . . . . . . . . . . . . . . . . . . . . . . . . . . . . . . . . (8,138)
Liabilities:Notes payable on real estate, current . . . . . . . . . . . . . . . . . 7,518Accounts payable and accrued expenses . . . . . . . . . . . . . . 620
Total liabilities . . . . . . . . . . . . . . . . . . . . . . . . . . . . . . . . . . $ 8,138
96
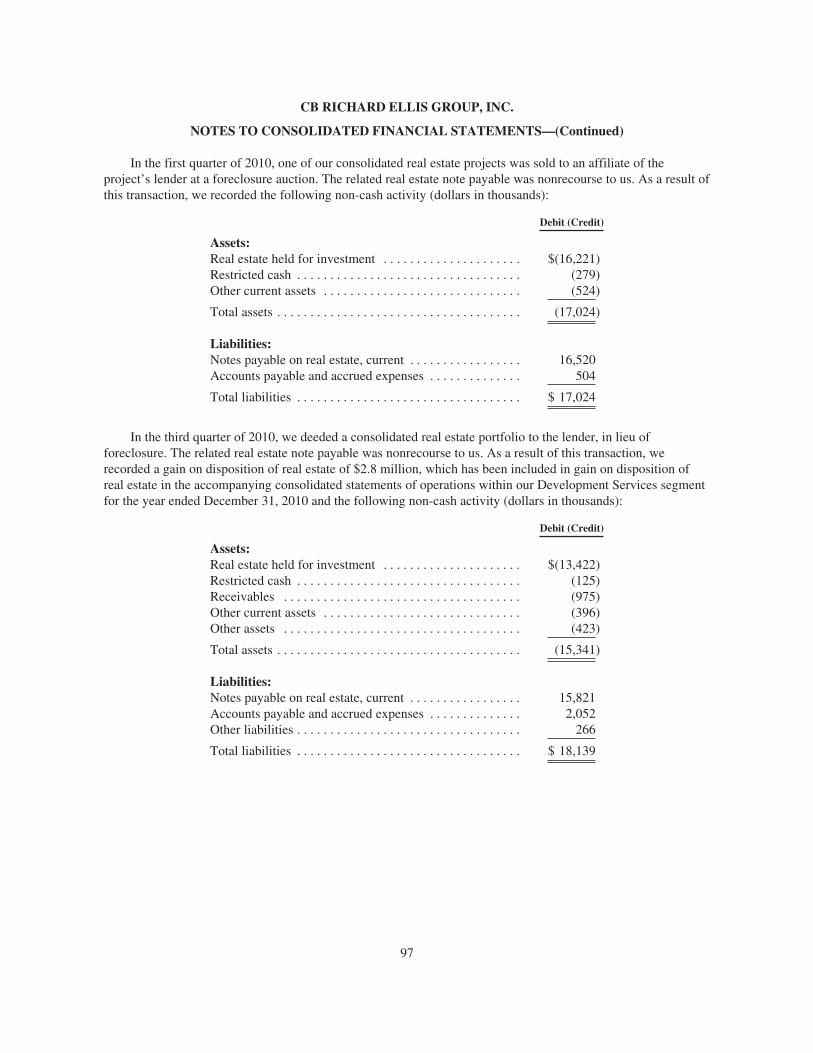
CB RICHARD ELLIS GROUP, INC.
NOTES TO CONSOLIDATED FINANCIAL STATEMENTS—(Continued)
In the first quarter of 2010, one of our consolidated real estate projects was sold to an affiliate of theproject’s lender at a foreclosure auction. The related real estate note payable was nonrecourse to us. As a result ofthis transaction, we recorded the following non-cash activity (dollars in thousands):
Debit (Credit)
Assets:Real estate held for investment . . . . . . . . . . . . . . . . . . . . . $(16,221)Restricted cash . . . . . . . . . . . . . . . . . . . . . . . . . . . . . . . . . . (279)Other current assets . . . . . . . . . . . . . . . . . . . . . . . . . . . . . . (524)
Total assets . . . . . . . . . . . . . . . . . . . . . . . . . . . . . . . . . . . . . (17,024)
Liabilities:Notes payable on real estate, current . . . . . . . . . . . . . . . . . 16,520Accounts payable and accrued expenses . . . . . . . . . . . . . . 504
Total liabilities . . . . . . . . . . . . . . . . . . . . . . . . . . . . . . . . . . $ 17,024
In the third quarter of 2010, we deeded a consolidated real estate portfolio to the lender, in lieu offoreclosure. The related real estate note payable was nonrecourse to us. As a result of this transaction, werecorded a gain on disposition of real estate of $2.8 million, which has been included in gain on disposition ofreal estate in the accompanying consolidated statements of operations within our Development Services segmentfor the year ended December 31, 2010 and the following non-cash activity (dollars in thousands):
Debit (Credit)
Assets:Real estate held for investment . . . . . . . . . . . . . . . . . . . . . $(13,422)Restricted cash . . . . . . . . . . . . . . . . . . . . . . . . . . . . . . . . . . (125)Receivables . . . . . . . . . . . . . . . . . . . . . . . . . . . . . . . . . . . . (975)Other current assets . . . . . . . . . . . . . . . . . . . . . . . . . . . . . . (396)Other assets . . . . . . . . . . . . . . . . . . . . . . . . . . . . . . . . . . . . (423)
Total assets . . . . . . . . . . . . . . . . . . . . . . . . . . . . . . . . . . . . . (15,341)
Liabilities:Notes payable on real estate, current . . . . . . . . . . . . . . . . . 15,821Accounts payable and accrued expenses . . . . . . . . . . . . . . 2,052Other liabilities . . . . . . . . . . . . . . . . . . . . . . . . . . . . . . . . . . 266
Total liabilities . . . . . . . . . . . . . . . . . . . . . . . . . . . . . . . . . . $ 18,139
97
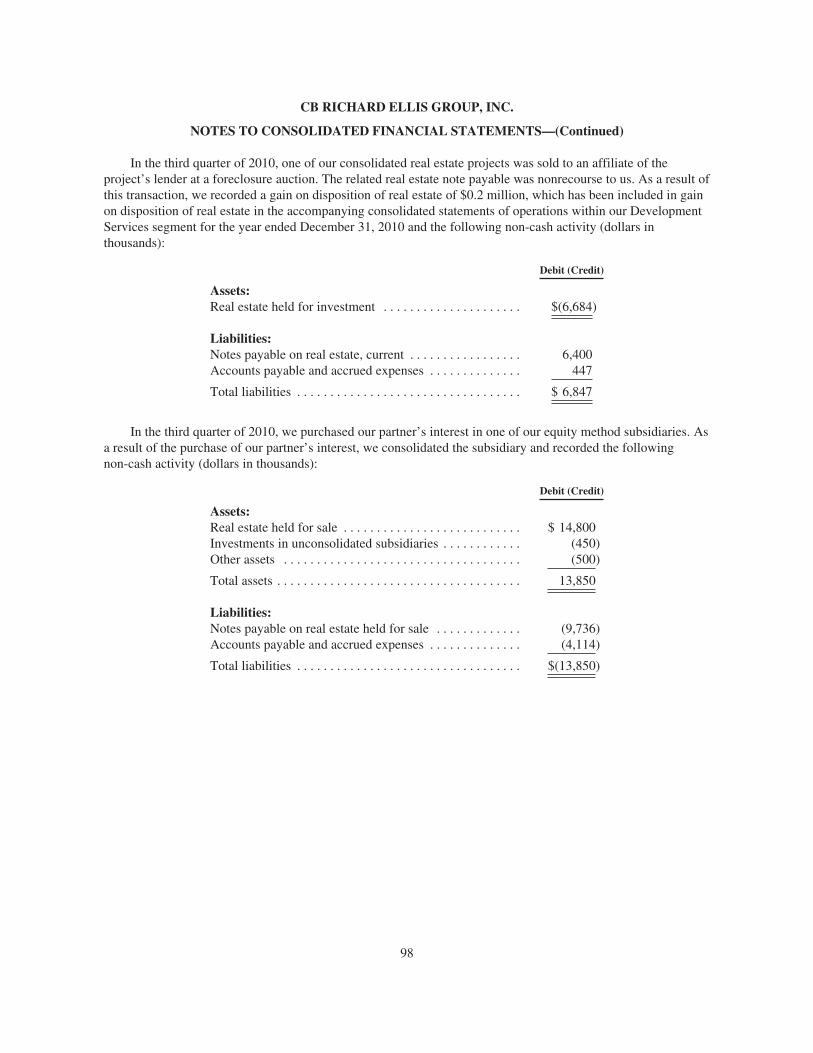
CB RICHARD ELLIS GROUP, INC.
NOTES TO CONSOLIDATED FINANCIAL STATEMENTS—(Continued)
In the third quarter of 2010, one of our consolidated real estate projects was sold to an affiliate of theproject’s lender at a foreclosure auction. The related real estate note payable was nonrecourse to us. As a result ofthis transaction, we recorded a gain on disposition of real estate of $0.2 million, which has been included in gainon disposition of real estate in the accompanying consolidated statements of operations within our DevelopmentServices segment for the year ended December 31, 2010 and the following non-cash activity (dollars inthousands):
Debit (Credit)
Assets:Real estate held for investment . . . . . . . . . . . . . . . . . . . . . $(6,684)
Liabilities:Notes payable on real estate, current . . . . . . . . . . . . . . . . . 6,400Accounts payable and accrued expenses . . . . . . . . . . . . . . 447
Total liabilities . . . . . . . . . . . . . . . . . . . . . . . . . . . . . . . . . . $ 6,847
In the third quarter of 2010, we purchased our partner’s interest in one of our equity method subsidiaries. Asa result of the purchase of our partner’s interest, we consolidated the subsidiary and recorded the followingnon-cash activity (dollars in thousands):
Debit (Credit)
Assets:Real estate held for sale . . . . . . . . . . . . . . . . . . . . . . . . . . . $ 14,800Investments in unconsolidated subsidiaries . . . . . . . . . . . . (450)Other assets . . . . . . . . . . . . . . . . . . . . . . . . . . . . . . . . . . . . (500)
Total assets . . . . . . . . . . . . . . . . . . . . . . . . . . . . . . . . . . . . . 13,850
Liabilities:Notes payable on real estate held for sale . . . . . . . . . . . . . (9,736)Accounts payable and accrued expenses . . . . . . . . . . . . . . (4,114)
Total liabilities . . . . . . . . . . . . . . . . . . . . . . . . . . . . . . . . . . $(13,850)
98
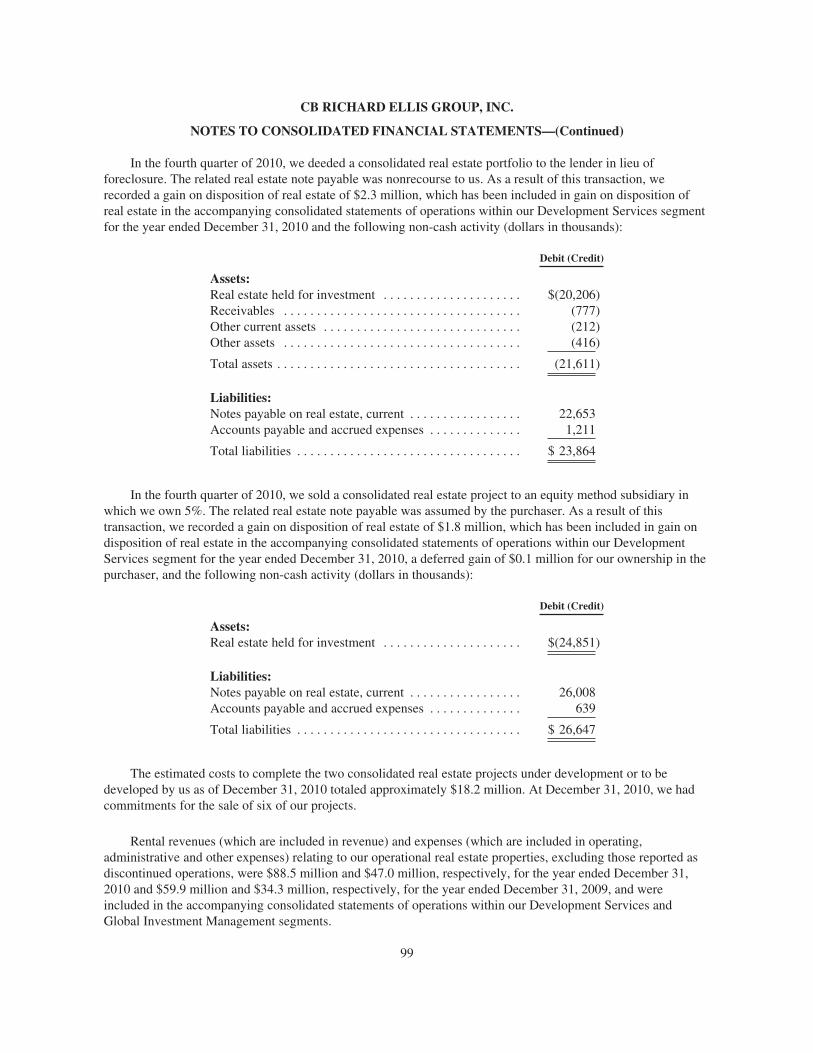
CB RICHARD ELLIS GROUP, INC.
NOTES TO CONSOLIDATED FINANCIAL STATEMENTS—(Continued)
In the fourth quarter of 2010, we deeded a consolidated real estate portfolio to the lender in lieu offoreclosure. The related real estate note payable was nonrecourse to us. As a result of this transaction, werecorded a gain on disposition of real estate of $2.3 million, which has been included in gain on disposition ofreal estate in the accompanying consolidated statements of operations within our Development Services segmentfor the year ended December 31, 2010 and the following non-cash activity (dollars in thousands):
Debit (Credit)
Assets:Real estate held for investment . . . . . . . . . . . . . . . . . . . . . $(20,206)Receivables . . . . . . . . . . . . . . . . . . . . . . . . . . . . . . . . . . . . (777)Other current assets . . . . . . . . . . . . . . . . . . . . . . . . . . . . . . (212)Other assets . . . . . . . . . . . . . . . . . . . . . . . . . . . . . . . . . . . . (416)
Total assets . . . . . . . . . . . . . . . . . . . . . . . . . . . . . . . . . . . . . (21,611)
Liabilities:Notes payable on real estate, current . . . . . . . . . . . . . . . . . 22,653Accounts payable and accrued expenses . . . . . . . . . . . . . . 1,211
Total liabilities . . . . . . . . . . . . . . . . . . . . . . . . . . . . . . . . . . $ 23,864
In the fourth quarter of 2010, we sold a consolidated real estate project to an equity method subsidiary inwhich we own 5%. The related real estate note payable was assumed by the purchaser. As a result of thistransaction, we recorded a gain on disposition of real estate of $1.8 million, which has been included in gain ondisposition of real estate in the accompanying consolidated statements of operations within our DevelopmentServices segment for the year ended December 31, 2010, a deferred gain of $0.1 million for our ownership in thepurchaser, and the following non-cash activity (dollars in thousands):
Debit (Credit)
Assets:Real estate held for investment . . . . . . . . . . . . . . . . . . . . . $(24,851)
Liabilities:Notes payable on real estate, current . . . . . . . . . . . . . . . . . 26,008Accounts payable and accrued expenses . . . . . . . . . . . . . . 639
Total liabilities . . . . . . . . . . . . . . . . . . . . . . . . . . . . . . . . . . $ 26,647
The estimated costs to complete the two consolidated real estate projects under development or to bedeveloped by us as of December 31, 2010 totaled approximately $18.2 million. At December 31, 2010, we hadcommitments for the sale of six of our projects.
Rental revenues (which are included in revenue) and expenses (which are included in operating,administrative and other expenses) relating to our operational real estate properties, excluding those reported asdiscontinued operations, were $88.5 million and $47.0 million, respectively, for the year ended December 31,2010 and $59.9 million and $34.3 million, respectively, for the year ended December 31, 2009, and wereincluded in the accompanying consolidated statements of operations within our Development Services andGlobal Investment Management segments.
99
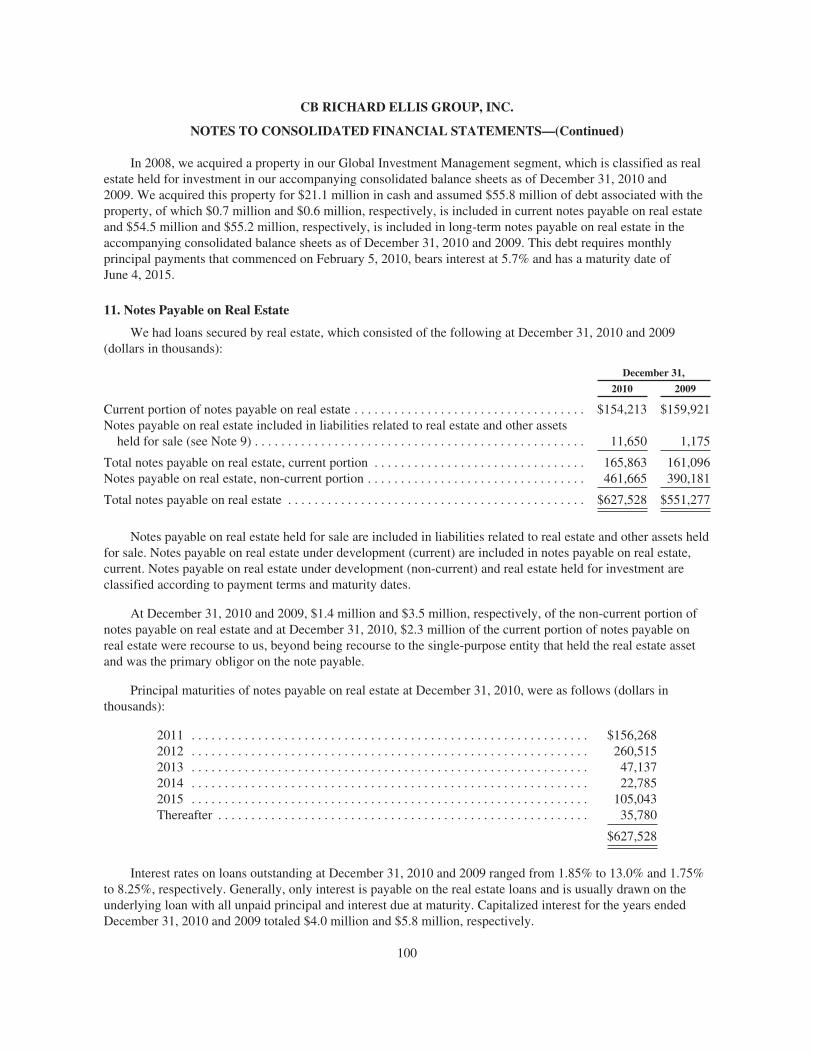
CB RICHARD ELLIS GROUP, INC.
NOTES TO CONSOLIDATED FINANCIAL STATEMENTS—(Continued)
In 2008, we acquired a property in our Global Investment Management segment, which is classified as realestate held for investment in our accompanying consolidated balance sheets as of December 31, 2010 and2009. We acquired this property for $21.1 million in cash and assumed $55.8 million of debt associated with theproperty, of which $0.7 million and $0.6 million, respectively, is included in current notes payable on real estateand $54.5 million and $55.2 million, respectively, is included in long-term notes payable on real estate in theaccompanying consolidated balance sheets as of December 31, 2010 and 2009. This debt requires monthlyprincipal payments that commenced on February 5, 2010, bears interest at 5.7% and has a maturity date ofJune 4, 2015.
11. Notes Payable on Real Estate
We had loans secured by real estate, which consisted of the following at December 31, 2010 and 2009(dollars in thousands):
December 31,
2010 2009
Current portion of notes payable on real estate . . . . . . . . . . . . . . . . . . . . . . . . . . . . . . . . . . . $154,213 $159,921Notes payable on real estate included in liabilities related to real estate and other assets
held for sale (see Note 9) . . . . . . . . . . . . . . . . . . . . . . . . . . . . . . . . . . . . . . . . . . . . . . . . . . 11,650 1,175
Total notes payable on real estate, current portion . . . . . . . . . . . . . . . . . . . . . . . . . . . . . . . . 165,863 161,096Notes payable on real estate, non-current portion . . . . . . . . . . . . . . . . . . . . . . . . . . . . . . . . . 461,665 390,181
Total notes payable on real estate . . . . . . . . . . . . . . . . . . . . . . . . . . . . . . . . . . . . . . . . . . . . . $627,528 $551,277
Notes payable on real estate held for sale are included in liabilities related to real estate and other assets heldfor sale. Notes payable on real estate under development (current) are included in notes payable on real estate,current. Notes payable on real estate under development (non-current) and real estate held for investment areclassified according to payment terms and maturity dates.
At December 31, 2010 and 2009, $1.4 million and $3.5 million, respectively, of the non-current portion ofnotes payable on real estate and at December 31, 2010, $2.3 million of the current portion of notes payable onreal estate were recourse to us, beyond being recourse to the single-purpose entity that held the real estate assetand was the primary obligor on the note payable.
Principal maturities of notes payable on real estate at December 31, 2010, were as follows (dollars inthousands):
2011 . . . . . . . . . . . . . . . . . . . . . . . . . . . . . . . . . . . . . . . . . . . . . . . . . . . . . . . . . . . . $156,2682012 . . . . . . . . . . . . . . . . . . . . . . . . . . . . . . . . . . . . . . . . . . . . . . . . . . . . . . . . . . . . 260,5152013 . . . . . . . . . . . . . . . . . . . . . . . . . . . . . . . . . . . . . . . . . . . . . . . . . . . . . . . . . . . . 47,1372014 . . . . . . . . . . . . . . . . . . . . . . . . . . . . . . . . . . . . . . . . . . . . . . . . . . . . . . . . . . . . 22,7852015 . . . . . . . . . . . . . . . . . . . . . . . . . . . . . . . . . . . . . . . . . . . . . . . . . . . . . . . . . . . . 105,043Thereafter . . . . . . . . . . . . . . . . . . . . . . . . . . . . . . . . . . . . . . . . . . . . . . . . . . . . . . . . 35,780
$627,528
Interest rates on loans outstanding at December 31, 2010 and 2009 ranged from 1.85% to 13.0% and 1.75%to 8.25%, respectively. Generally, only interest is payable on the real estate loans and is usually drawn on theunderlying loan with all unpaid principal and interest due at maturity. Capitalized interest for the years endedDecember 31, 2010 and 2009 totaled $4.0 million and $5.8 million, respectively.
100
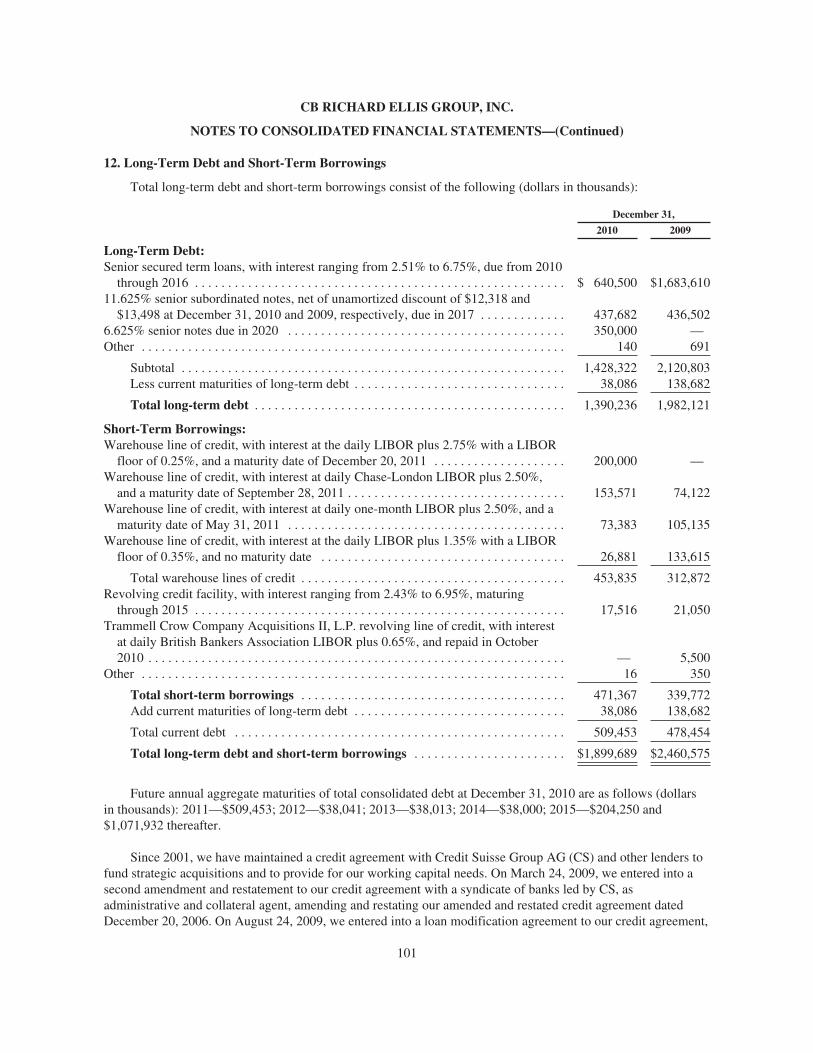
CB RICHARD ELLIS GROUP, INC.
NOTES TO CONSOLIDATED FINANCIAL STATEMENTS—(Continued)
12. Long-Term Debt and Short-Term Borrowings
Total long-term debt and short-term borrowings consist of the following (dollars in thousands):
December 31,
2010 2009
Long-Term Debt:Senior secured term loans, with interest ranging from 2.51% to 6.75%, due from 2010
through 2016 . . . . . . . . . . . . . . . . . . . . . . . . . . . . . . . . . . . . . . . . . . . . . . . . . . . . . . . . $ 640,500 $1,683,61011.625% senior subordinated notes, net of unamortized discount of $12,318 and
$13,498 at December 31, 2010 and 2009, respectively, due in 2017 . . . . . . . . . . . . . 437,682 436,5026.625% senior notes due in 2020 . . . . . . . . . . . . . . . . . . . . . . . . . . . . . . . . . . . . . . . . . . 350,000 —Other . . . . . . . . . . . . . . . . . . . . . . . . . . . . . . . . . . . . . . . . . . . . . . . . . . . . . . . . . . . . . . . . 140 691
Subtotal . . . . . . . . . . . . . . . . . . . . . . . . . . . . . . . . . . . . . . . . . . . . . . . . . . . . . . . . . . 1,428,322 2,120,803Less current maturities of long-term debt . . . . . . . . . . . . . . . . . . . . . . . . . . . . . . . . 38,086 138,682
Total long-term debt . . . . . . . . . . . . . . . . . . . . . . . . . . . . . . . . . . . . . . . . . . . . . . . 1,390,236 1,982,121
Short-Term Borrowings:Warehouse line of credit, with interest at the daily LIBOR plus 2.75% with a LIBOR
floor of 0.25%, and a maturity date of December 20, 2011 . . . . . . . . . . . . . . . . . . . . 200,000 —Warehouse line of credit, with interest at daily Chase-London LIBOR plus 2.50%,
and a maturity date of September 28, 2011 . . . . . . . . . . . . . . . . . . . . . . . . . . . . . . . . . 153,571 74,122Warehouse line of credit, with interest at daily one-month LIBOR plus 2.50%, and a
maturity date of May 31, 2011 . . . . . . . . . . . . . . . . . . . . . . . . . . . . . . . . . . . . . . . . . . 73,383 105,135Warehouse line of credit, with interest at the daily LIBOR plus 1.35% with a LIBOR
floor of 0.35%, and no maturity date . . . . . . . . . . . . . . . . . . . . . . . . . . . . . . . . . . . . . 26,881 133,615
Total warehouse lines of credit . . . . . . . . . . . . . . . . . . . . . . . . . . . . . . . . . . . . . . . . 453,835 312,872Revolving credit facility, with interest ranging from 2.43% to 6.95%, maturing
through 2015 . . . . . . . . . . . . . . . . . . . . . . . . . . . . . . . . . . . . . . . . . . . . . . . . . . . . . . . . 17,516 21,050Trammell Crow Company Acquisitions II, L.P. revolving line of credit, with interest
at daily British Bankers Association LIBOR plus 0.65%, and repaid in October2010 . . . . . . . . . . . . . . . . . . . . . . . . . . . . . . . . . . . . . . . . . . . . . . . . . . . . . . . . . . . . . . . — 5,500
Other . . . . . . . . . . . . . . . . . . . . . . . . . . . . . . . . . . . . . . . . . . . . . . . . . . . . . . . . . . . . . . . . 16 350
Total short-term borrowings . . . . . . . . . . . . . . . . . . . . . . . . . . . . . . . . . . . . . . . . 471,367 339,772Add current maturities of long-term debt . . . . . . . . . . . . . . . . . . . . . . . . . . . . . . . . 38,086 138,682
Total current debt . . . . . . . . . . . . . . . . . . . . . . . . . . . . . . . . . . . . . . . . . . . . . . . . . . 509,453 478,454
Total long-term debt and short-term borrowings . . . . . . . . . . . . . . . . . . . . . . . $1,899,689 $2,460,575
Future annual aggregate maturities of total consolidated debt at December 31, 2010 are as follows (dollarsin thousands): 2011—$509,453; 2012—$38,041; 2013—$38,013; 2014—$38,000; 2015—$204,250 and$1,071,932 thereafter.
Since 2001, we have maintained a credit agreement with Credit Suisse Group AG (CS) and other lenders tofund strategic acquisitions and to provide for our working capital needs. On March 24, 2009, we entered into asecond amendment and restatement to our credit agreement with a syndicate of banks led by CS, asadministrative and collateral agent, amending and restating our amended and restated credit agreement datedDecember 20, 2006. On August 24, 2009, we entered into a loan modification agreement to our credit agreement,
101
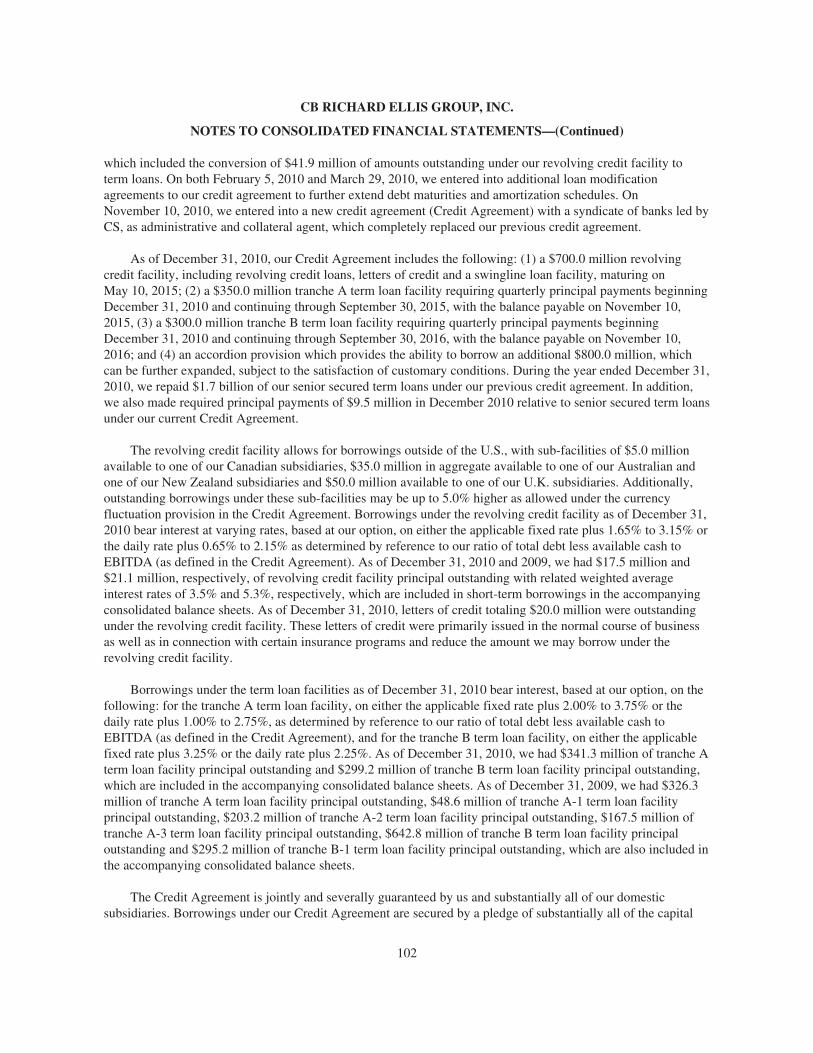
CB RICHARD ELLIS GROUP, INC.
NOTES TO CONSOLIDATED FINANCIAL STATEMENTS—(Continued)
which included the conversion of $41.9 million of amounts outstanding under our revolving credit facility toterm loans. On both February 5, 2010 and March 29, 2010, we entered into additional loan modificationagreements to our credit agreement to further extend debt maturities and amortization schedules. OnNovember 10, 2010, we entered into a new credit agreement (Credit Agreement) with a syndicate of banks led byCS, as administrative and collateral agent, which completely replaced our previous credit agreement.
As of December 31, 2010, our Credit Agreement includes the following: (1) a $700.0 million revolvingcredit facility, including revolving credit loans, letters of credit and a swingline loan facility, maturing onMay 10, 2015; (2) a $350.0 million tranche A term loan facility requiring quarterly principal payments beginningDecember 31, 2010 and continuing through September 30, 2015, with the balance payable on November 10,2015, (3) a $300.0 million tranche B term loan facility requiring quarterly principal payments beginningDecember 31, 2010 and continuing through September 30, 2016, with the balance payable on November 10,2016; and (4) an accordion provision which provides the ability to borrow an additional $800.0 million, whichcan be further expanded, subject to the satisfaction of customary conditions. During the year ended December 31,2010, we repaid $1.7 billion of our senior secured term loans under our previous credit agreement. In addition,we also made required principal payments of $9.5 million in December 2010 relative to senior secured term loansunder our current Credit Agreement.
The revolving credit facility allows for borrowings outside of the U.S., with sub-facilities of $5.0 millionavailable to one of our Canadian subsidiaries, $35.0 million in aggregate available to one of our Australian andone of our New Zealand subsidiaries and $50.0 million available to one of our U.K. subsidiaries. Additionally,outstanding borrowings under these sub-facilities may be up to 5.0% higher as allowed under the currencyfluctuation provision in the Credit Agreement. Borrowings under the revolving credit facility as of December 31,2010 bear interest at varying rates, based at our option, on either the applicable fixed rate plus 1.65% to 3.15% orthe daily rate plus 0.65% to 2.15% as determined by reference to our ratio of total debt less available cash toEBITDA (as defined in the Credit Agreement). As of December 31, 2010 and 2009, we had $17.5 million and$21.1 million, respectively, of revolving credit facility principal outstanding with related weighted averageinterest rates of 3.5% and 5.3%, respectively, which are included in short-term borrowings in the accompanyingconsolidated balance sheets. As of December 31, 2010, letters of credit totaling $20.0 million were outstandingunder the revolving credit facility. These letters of credit were primarily issued in the normal course of businessas well as in connection with certain insurance programs and reduce the amount we may borrow under therevolving credit facility.
Borrowings under the term loan facilities as of December 31, 2010 bear interest, based at our option, on thefollowing: for the tranche A term loan facility, on either the applicable fixed rate plus 2.00% to 3.75% or thedaily rate plus 1.00% to 2.75%, as determined by reference to our ratio of total debt less available cash toEBITDA (as defined in the Credit Agreement), and for the tranche B term loan facility, on either the applicablefixed rate plus 3.25% or the daily rate plus 2.25%. As of December 31, 2010, we had $341.3 million of tranche Aterm loan facility principal outstanding and $299.2 million of tranche B term loan facility principal outstanding,which are included in the accompanying consolidated balance sheets. As of December 31, 2009, we had $326.3million of tranche A term loan facility principal outstanding, $48.6 million of tranche A-1 term loan facilityprincipal outstanding, $203.2 million of tranche A-2 term loan facility principal outstanding, $167.5 million oftranche A-3 term loan facility principal outstanding, $642.8 million of tranche B term loan facility principaloutstanding and $295.2 million of tranche B-1 term loan facility principal outstanding, which are also included inthe accompanying consolidated balance sheets.
The Credit Agreement is jointly and severally guaranteed by us and substantially all of our domesticsubsidiaries. Borrowings under our Credit Agreement are secured by a pledge of substantially all of the capital
102
CB RICHARD ELLIS GROUP, INC.
NOTES TO CONSOLIDATED FINANCIAL STATEMENTS—(Continued)
stock of our U.S. subsidiaries and 65% of the capital stock of certain non-U.S. subsidiaries. Also, the CreditAgreement requires us to pay a fee based on the total amount of the revolving credit facility commitment.
On October 8, 2010, CBRE issued $350.0 million in aggregate principal amount of 6.625% senior notes dueOctober 15, 2020. The 6.625% senior notes are unsecured obligations of CBRE, senior to all of its current andfuture subordinated indebtedness, but effectively subordinated to all of its current and future securedindebtedness. The 6.625% senior notes are jointly and severally guaranteed on a senior basis by us and eachsubsidiary of CBRE that guarantees our Credit Agreement. Interest accrues at a rate of 6.625% per year and ispayable semi-annually in arrears on April 15 and October 15, commencing on April 15, 2011. The 6.625% seniornotes are redeemable at our option, in whole or in part, on or after October 15, 2014 at a redemption price of104.969% of the principal amount on that date and at declining prices thereafter. At any time prior to October 15,2014, the 6.625% senior notes may be redeemed by us, in whole or in part, at a redemption price equal to 100%of the principal amount, plus accrued and unpaid interest and an applicable premium (as defined in the indenturegoverning these notes), which is based on the present value of the October 15, 2014 redemption price plus allremaining interest payments through October 15, 2014. In addition, prior to October 15, 2013, up to 35.0% of theoriginal issued amount of the 6.625% senior notes may be redeemed at a redemption price of 106.625% of theprincipal amount, plus accrued and unpaid interest, solely with the net cash proceeds from public equityofferings. If a change of control triggering event (as defined in the indenture governing our 6.625% senior notes)occurs, we are obligated to make an offer to purchase the remaining 6.625% senior notes at a redemption price of101.0% of the principal amount, plus accrued and unpaid interest. The amount of the 6.625% senior notesincluded in the accompanying consolidated balance sheets was $350.0 million at December 31, 2010.
On June 18, 2009, CBRE issued $450.0 million in aggregate principal amount of 11.625% seniorsubordinated notes due June 15, 2017 for approximately $435.9 million, net of discount. The 11.625% seniorsubordinated notes are unsecured senior subordinated obligations of CBRE and are jointly and severallyguaranteed on a senior subordinated basis by us and our domestic subsidiaries that guarantee our CreditAgreement. Interest accrues at a rate of 11.625% per year and is payable semi-annually in arrears on June 15 andDecember 15. The 11.625% senior subordinated notes are redeemable at our option, in whole or in part, on orafter June 15, 2013 at 105.813% of par on that date and at declining prices thereafter. At any time prior toJune 15, 2013, the 11.625% senior subordinated notes may be redeemed by us, in whole or in part, at a priceequal to 100% of the principal amount, plus accrued and unpaid interest and an applicable premium (as definedin the indenture governing these notes), which is based on the present value of the June 15, 2013 redemptionprice plus all remaining interest payments through June 15, 2013. In addition, prior to June 15, 2012, up to 35.0%of the original issued amount of the 11.625% senior subordinated notes may be redeemed at 111.625% of par,plus accrued and unpaid interest, solely with the net cash proceeds from public equity offerings. In the event of achange of control (as defined in the indenture governing our 11.625% senior subordinated notes), we areobligated to make an offer to purchase the remaining 11.625% senior subordinated notes at a redemption price of101.0% of the principal amount, plus accrued and unpaid interest. The amount of the 11.625% seniorsubordinated notes included in the accompanying consolidated balance sheets, net of unamortized discount, was$437.7 million and $436.5 million at December 31, 2010 and 2009, respectively.
Our Credit Agreement and the indentures governing our 6.625% senior notes and 11.625% seniorsubordinated notes contain numerous restrictive covenants that, among other things, limit our ability to incuradditional indebtedness, pay dividends or make distributions to stockholders, repurchase capital stock or debt,make investments, sell assets or subsidiary stock, create or permit liens on assets, engage in transactions withaffiliates, enter into sale/leaseback transactions, issue subsidiary equity and enter into consolidations or mergers.Our Credit Agreement also currently requires us to maintain a minimum coverage ratio of EBITDA (as definedin the Credit Agreement) to total interest expense of 2.25x and a maximum leverage ratio of total debt lessavailable cash to EBITDA (as defined in the Credit Agreement) of 3.75x. Our coverage ratio of EBITDA to total
103
CB RICHARD ELLIS GROUP, INC.
NOTES TO CONSOLIDATED FINANCIAL STATEMENTS—(Continued)
interest expense was 8.16x for the year ended December 31, 2010 and our leverage ratio of total debt lessavailable cash to EBITDA was 0.94x as of December 31, 2010.
We had short-term borrowings of $471.4 million and $339.8 million with related average interest rates of2.8% and 2.4% as of December 31, 2010 and 2009, respectively.
On March 2, 2007, we entered into a $50.0 million credit note with Wells Fargo Bank for the purpose ofpurchasing eligible investments, which include cash equivalents, agency securities, A1/P1 commercial paper andeligible money market funds. The proceeds of this note are not made generally available to us, but insteaddeposited in an investment account maintained by Wells Fargo Bank and used and applied solely to purchaseeligible investment securities. This agreement has been amended several times and as of December 31, 2010,provides for a $40.0 million revolving credit note, bears interest at 0.25% and has a maturity date of December 1,2011. As of December 31, 2010 and 2009, there were no amounts outstanding under this revolving credit note.
On March 4, 2008, we entered into a $35.0 million credit and security agreement with Bank of America(BofA) for the purpose of purchasing eligible financial instruments, which include A1/P1 commercial paper, U.S.Treasury securities, GSE discount notes (as defined in the credit and security agreement) and money marketfunds. The proceeds of this note are not made generally available to us, but instead deposited in an investmentaccount maintained by BofA and used and applied solely to purchase eligible financial instruments. Thisagreement has been amended several times and as of December 31, 2010, provides for a $5.0 million credit line,bears interest at 1% and has a maturity date of February 28, 2011. As of December 31, 2010 and 2009, there wereno amounts outstanding under this revolving note.
On August 19, 2008, we entered into a $15.0 million uncommitted facility with First Tennessee Bank for thepurpose of purchasing investments, which include cash equivalents, agency securities, A1/P1 commercial paperand eligible money market funds. The proceeds of this facility are not made generally available to us, but insteadare held in a collateral account maintained by First Tennessee Bank. This agreement has been amended severaltimes and as of December 31, 2010, provides for a $4.0 million credit line, bears interest at 0.25% and has amaturity date of August 4, 2011. As of December 31, 2010 and 2009, there were no amounts outstanding underthis facility.
On April 19, 2010, we entered into a Receivables Purchase Agreement (RPA) which allows us to transfer anundivided interest in a designated pool of U.S. accounts receivable, on an ongoing basis, to provide collateral forborrowings up to a maximum of $55.0 million. Borrowings under this arrangement generally bear interest at thecommercial paper rate plus 2.75% and this agreement expires on April 18, 2011. As of December 31, 2010, therewere no amounts outstanding under this agreement.
Our wholly-owned subsidiary CBRE Capital Markets has the following warehouse lines of credit: creditagreements with JP Morgan Chase Bank, N.A. (JP Morgan), BofA, TD Bank, N.A. (TD Bank) and KempsLanding Capital Company, LLC (Kemps Landing) for the purpose of funding mortgage loans that will be resoldand a funding arrangement with Fannie Mae for the purpose of selling a percentage of certain closed multi-family loans.
On November 15, 2005, CBRE Capital Markets entered into a secured credit agreement with JP Morgan toestablish a warehouse line of credit. Effective October 12, 2010 through January 10, 2011, the warehouse line ofcredit was temporarily increased from $210.0 million to $250.0 million. Effective November 22, 2010 throughFebruary 1, 2011, the warehouse line of credit was temporarily increased further from $250.0 million to $300.0million. This agreement has been amended several times and as of December 31, 2010, provides for a $300.0million senior secured revolving line of credit, bears interest at the daily Chase-London LIBOR plus 2.50% andhas a maturity date of September 28, 2011.
104
CB RICHARD ELLIS GROUP, INC.
NOTES TO CONSOLIDATED FINANCIAL STATEMENTS—(Continued)
On April 16, 2008, CBRE Capital Markets entered into a secured credit agreement with BofA to establish awarehouse line of credit. This agreement has been amended several times and as of December 31, 2010, providesfor a $125.0 million senior secured revolving line of credit, bears interest at the daily one-month LIBOR plus2.50% with a maturity date of May 31, 2011.
In August 2009, CBRE Capital Markets entered into a funding arrangement with Fannie Mae under itsMultifamily As Soon As Pooled Plus Agreement and its Multifamily As Soon As Pooled Sale Agreement (ASAPProgram). Under the ASAP Program, CBRE Capital Markets may elect, on a transaction by transaction basis, tosell a percentage of certain closed multifamily loans to Fannie Mae on an expedited basis. After all contingenciesare satisfied, the ASAP Program requires that CBRE Capital Markets repurchase the interest in the multifamilyloan previously sold to Fannie Mae followed by either a full delivery back to Fannie Mae via whole loanexecution or a securitization into a mortgage backed security. Under this agreement, the maximum outstandingbalance under the ASAP Program cannot exceed $150.0 million and, between the sale date to Fannie Mae andthe repurchase date by CBRE Capital Markets, the outstanding balance bears interest and is payable to FannieMae at the daily LIBOR rate plus 1.35% with a LIBOR floor of 0.35%. Effective December 1, 2009 throughJanuary 15, 2010, the maximum outstanding balance under the ASAP Program was temporarily increased from$150.0 million to $225.0 million.
On December 21, 2010, CBRE Capital Markets entered into a secured credit agreement with TD Bank toestablish a warehouse line of credit. This agreement provides for a $75.0 million senior secured revolving line ofcredit, bears interest at the daily one-month LIBOR plus 2.00% with a maturity date of December 31, 2011.
On December 21, 2010, CBRE Capital Markets entered into an uncommitted funding arrangement withKemps Landing providing CBRE Capital Markets with the ability to fund Freddie Mac multi-family loans. Underthe agreement, the maximum outstanding balance cannot exceed $200.0 million, outstanding borrowings bearinterest at LIBOR plus 2.75% with a LIBOR floor of 0.25% and the agreement expires on December 20, 2011.
During the year ended December 31, 2010, we had a maximum of $453.8 million of warehouse lines ofcredit principal outstanding. As of December 31, 2010 and 2009, we had $453.8 million and $312.9 million ofwarehouse lines of credit principal outstanding, respectively, which are included in short-term borrowings in theaccompanying consolidated balance sheets. Non-cash activity totaling $141.0 million and $102.4 million,increased the warehouse lines of credit during the years ended December 31, 2010 and 2009, respectively, andnon-cash activity totaling $45.3 million reduced the warehouse lines of credit during the year endedDecember 31, 2008. Additionally, we had $485.4 million and $315.0 million of mortgage loans held for sale(warehouse receivables), which substantially represented mortgage loans funded through the lines of credit that,while committed to be purchased, had not yet been purchased as of December 31, 2010 and 2009, respectively,and which are also included in the accompanying consolidated balance sheets. Non-cash activity totaling $141.0million and $102.4 million, increased the warehouse receivables during the years ended December 31, 2010 and2009, respectively, and non-cash activity totaling $45.3 million reduced the warehouse receivables during theyear ended December 31, 2008.
On July 31, 2006, CBRE Capital Markets entered into a revolving credit note with JP Morgan for thepurpose of purchasing qualified investment securities, which include but are not limited to U.S. Treasury andAgency securities. This agreement was amended several times and provided for a $25.0 million revolving creditnote, bore interest at 0.50% and had a maturity date of January 28, 2011. Effective September 29, 2010, thisagreement was terminated. As of December 31, 2009, there were no amounts outstanding under this revolvingcredit note.
105
CB RICHARD ELLIS GROUP, INC.
NOTES TO CONSOLIDATED FINANCIAL STATEMENTS—(Continued)
On April 30, 2007, Trammell Crow Company Acquisitions II, L.P. (Acquisitions II), a consolidated limitedpartnership within our Development Services segment, entered into a $100.0 million revolving credit agreement(WestLB Credit Agreement) with WestLB AG, as administrative agent for a lender group. In April 2010,Acquisitions II opted to reduce the amount available under the WestLB Credit Agreement to $20.0 million and inOctober 2010, repaid the outstanding balance and the credit agreement expired. Borrowings under this creditagreement were used to fund investments in real estate prior to receipt of capital contributions from AcquisitionsII investors and permanent project financing, and were limited to a portion of unfunded capital commitments ofcertain Acquisitions II investors. Borrowings under this agreement bore interest at the daily British BankersAssociation LIBOR plus 0.65%. Borrowings under the line were nonrecourse to us and were secured by thecapital commitments of the investors in Acquisitions II. As of December 31, 2009, there was $5.5 millionoutstanding under the WestLB Credit Agreement included in short-term borrowings in the accompanyingconsolidated balance sheets.
13. Commitments and Contingencies
We are a party to a number of pending or threatened lawsuits arising out of, or incident to, our ordinarycourse of business. Our management believes that any liability imposed on us that may result from disposition ofthese lawsuits will not have a material effect on our business, consolidated financial position, cash flows orresults of operations.
We have concluded our previously disclosed internal investigation relating to activities by some of ouremployees in certain of our offices in China that raised issues with respect to the U.S. Foreign Corrupt PracticesAct. The U.S. Department of Justice and the U.S. Securities and Exchange Commission have also closed theirreview of such matters without any action.
Our leases generally relate to office space that we occupy, have varying terms and expire through 2030. Thefollowing is a schedule by year of future minimum lease payments for noncancellable operating leases as ofDecember 31, 2010 (dollars in thousands):
Operating leases
2011 . . . . . . . . . . . . . . . . . . . . . . . . . . . . . . . . . . . . . . . . . . . . . . . . . . . . . . . . $159,7042012 . . . . . . . . . . . . . . . . . . . . . . . . . . . . . . . . . . . . . . . . . . . . . . . . . . . . . . . . 132,5892013 . . . . . . . . . . . . . . . . . . . . . . . . . . . . . . . . . . . . . . . . . . . . . . . . . . . . . . . . 113,2592014 . . . . . . . . . . . . . . . . . . . . . . . . . . . . . . . . . . . . . . . . . . . . . . . . . . . . . . . . 100,0912015 . . . . . . . . . . . . . . . . . . . . . . . . . . . . . . . . . . . . . . . . . . . . . . . . . . . . . . . . 85,043Thereafter . . . . . . . . . . . . . . . . . . . . . . . . . . . . . . . . . . . . . . . . . . . . . . . . . . . . 364,381
Total minimum payment required . . . . . . . . . . . . . . . . . . . . . . . . . . . . . . . . . $955,067
Total minimum payments for noncancellable operating leases were not reduced by the minimum subleaserental income of $13.5 million due in the future under noncancellable subleases.
Substantially all leases require us to pay maintenance costs, insurance and property taxes. The compositionof total rental expense under noncancellable operating leases consisted of the following (dollars in thousands):
Year Ended December 31,
2010 2009 2008
Minimum rentals . . . . . . . . . . . . . . . . . . . . . . . . . . . . . $189,190 $180,378 $208,359Less sublease rentals . . . . . . . . . . . . . . . . . . . . . . . . . . (184) (444) (229)
$189,006 $179,934 $208,130
We had outstanding letters of credit totaling $22.6 million as of December 31, 2010, excluding letters ofcredit for which we have outstanding liabilities already accrued on our consolidated balance sheet related to our
106
CB RICHARD ELLIS GROUP, INC.
NOTES TO CONSOLIDATED FINANCIAL STATEMENTS—(Continued)
subsidiaries’ outstanding reserves for claims under certain insurance programs as well as letters of credit relatedto operating leases. These letters of credit are primarily executed by us in the normal course of business as wellas in connection with certain insurance programs. The letters of credit expire at varying dates through December2011.
We had guarantees totaling $10.8 million as of December 31, 2010, excluding guarantees related to pensionliabilities, consolidated indebtedness and other obligations for which we have outstanding liabilities alreadyaccrued on our consolidated balance sheet as well as operating leases. The $10.8 million primarily consists ofguarantees of obligations of unconsolidated subsidiaries, which expire at varying dates through November 2013.
In addition, as of December 31, 2010, we had numerous completion and budget guarantees relating todevelopment projects. These guarantees are made by us in the normal course of our Development Servicesbusiness. Each of these guarantees requires us to complete construction of the relevant project within a specifiedtimeframe and/or within a specified budget, with us potentially being liable for costs to complete in excess ofsuch timeframe or budget. However, we generally have “guaranteed maximum price” contracts with reputablegeneral contractors with respect to projects for which we provide these guarantees. These contracts are intendedto pass the risk to such contractors. While there can be no assurance, we do not expect to incur any materiallosses under these guarantees.
From time to time, we act as a general contractor with respect to construction projects. We do not considerthese activities to be a material part of our business. In connection with these activities, we seek to subcontractconstruction work for certain projects to reputable subcontractors. Should construction defects arise relating tothe underlying projects, we could potentially be liable to the client for the costs to repair such defects, althoughwe would generally look to the subcontractor that performed the work to remedy the defect and also look toinsurance policies that cover this work. While there can be no assurance, we do not expect to incur materiallosses with respect to construction defects.
In January 2008, CBRE Multifamily Capital, Inc. (CBRE MCI), a wholly-owned subsidiary of CBRECapital Markets, Inc., entered into an agreement with Fannie Mae, under Fannie Mae’s DUS Lender Program(DUS Program), to provide financing for multifamily housing with five or more units. Under the DUS Program,CBRE MCI originates, underwrites, closes and services loans without prior approval by Fannie Mae, and inselected cases, is subject to sharing up to one-third of any losses on loans originated under the DUS Program.CBRE MCI has funded loans subject to such loss sharing arrangements with unpaid principal balances of $2.1billion at December 31, 2010. Additionally, CBRE MCI has funded loans under the DUS Program that are notsubject to loss sharing arrangements with unpaid principal balances of approximately $435.3 million atDecember 31, 2010. CBRE MCI, under its agreement with Fannie Mae, must post cash reserves under formulasestablished by Fannie Mae to provide for sufficient capital in the event losses occur. As of December 31, 2010and 2009, CBRE MCI had $2.2 million and $1.2 million, respectively, of cash deposited under this reservearrangement, and had provided approximately $4.0 million and $2.0 million, respectively, of loan loss accruals.Fannie Mae’s recourse under the DUS Program is limited to the assets of CBRE MCI, which totaledapproximately $169.0 million at December 31, 2010.
An important part of the strategy for our Global Investment Management business involves investing ourcapital in certain real estate investments with our clients. These co-investments typically range from 2% to 5% ofthe equity in a particular fund. As of December 31, 2010, we had aggregate commitments of $11.5 million tofund future co-investments.
Additionally, an important part of our Development Services business strategy is to invest in unconsolidatedreal estate subsidiaries as a principal (in most cases co-investing with our clients). As of December 31, 2010, wehad committed to fund $22.0 million of additional capital to these unconsolidated subsidiaries.
107
CB RICHARD ELLIS GROUP, INC.
NOTES TO CONSOLIDATED FINANCIAL STATEMENTS—(Continued)
14. Employee Benefit Plans
Stock Incentive Plans
2001 Stock Incentive Plan. Our 2001 stock incentive plan was adopted by our board of directors andapproved by our stockholders on June 7, 2001. However, our 2001 stock incentive plan was terminated in June2004 in connection with the adoption of our 2004 stock incentive plan, which is described below. The 2001 stockincentive plan permitted the grant of nonqualified stock options, incentive stock options, stock appreciationrights, restricted stock, restricted stock units and other stock-based awards to our employees, directors orindependent contractors. Since our 2001 stock incentive plan has been terminated, no shares remain available forissuance under it. However, as of December 31, 2010, outstanding stock options granted under the 2001 stockincentive plan to acquire 3,517,947 shares of our Class A common stock remain outstanding according to theirterms, and we will continue to issue shares to the extent required under the terms of such outstanding awards.Options granted under this plan have an exercise price of $1.92. As of December 31, 2009, all options grantedunder this plan were fully vested and exercisable. Options granted under the 2001 stock incentive plan are subjectto a maximum term of ten years from the date of grant. The number of shares issued pursuant to the 2001 stockincentive plan, or pursuant to outstanding awards, is subject to adjustment on account of stock splits, stockdividends and other dilutive changes in our Class A common stock.
Second Amended and Restated 2004 Stock Incentive Plan. Our 2004 stock incentive plan was adopted byour board of directors and approved by our stockholders on April 21, 2004, and has been amended several timessubsequently, including an amendment and restatement on June 2, 2008 and an amendment on December 3,2008. The 2004 stock incentive plan authorizes the grant of stock-based awards to our employees, directors orindependent contractors. A total of 20,785,218 shares of our Class A common stock initially were reserved forissuance under the 2004 stock incentive plan, which increased by 10,000,000 shares to a total of 30,785,218shares in connection with the June 2, 2008 amendment and restatement. For awards granted prior to June 2, 2008under this plan, this share reserve was reduced by one share upon grant of an option or stock appreciation right,and was reduced by 2.25 shares upon issuance of stock pursuant to other stock-based awards. For awards grantedon or after June 2, 2008 under this plan, this share reserve is reduced by one share upon grant of all awards. Inaddition, full value awards, i.e., awards other than stock options and stock appreciation rights, are limited to nomore than 75% of the total share reserve. Awards that expire, terminate or lapse will again be available for grantunder this plan. No person is eligible to be granted awards in the aggregate covering more than 2,000,000 sharesduring any fiscal year. The number of shares issued or reserved pursuant to the 2004 stock incentive plan, orpursuant to outstanding awards, is subject to adjustment on account of mergers, consolidations, reorganizations,stock splits, stock dividends and other dilutive changes in our common stock. In addition, our board of directorsmay adjust outstanding awards to preserve the awards’ benefits or potential benefits.
Stock Option Exchange
On July 9, 2009, we completed a stock option exchange program (Exchange Offer) under which eligibleemployees tendered, and we accepted for cancellation, eligible options to purchase 2,599,307 shares of ourClass A common stock. We granted new options to eligible employees to purchase 103,361 shares of our Class Acommon stock and issued 819,672 restricted shares of our Class A common stock in exchange for thecancellation of the tendered eligible options. The exercise price per share of the new options granted in theExchange Offer was $8.09, the closing price of our common stock on July 9, 2009. The new options andrestricted shares issued will vest and are exercisable in equal annual increments over four years from the date ofgrant. This Exchange Offer did not result in any incremental compensation expense as the estimated fair value ofthe new awards did not exceed the estimated fair value of the exchanged stock options immediately prior to theexchange.
108
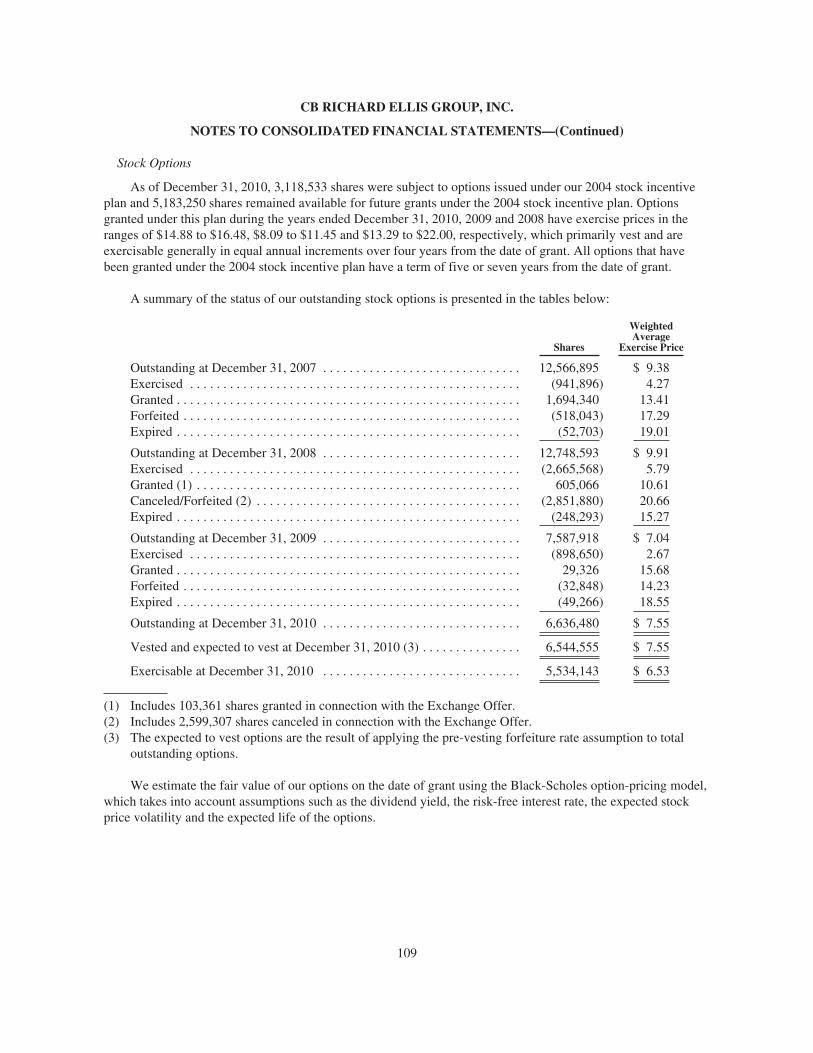
CB RICHARD ELLIS GROUP, INC.
NOTES TO CONSOLIDATED FINANCIAL STATEMENTS—(Continued)
Stock Options
As of December 31, 2010, 3,118,533 shares were subject to options issued under our 2004 stock incentiveplan and 5,183,250 shares remained available for future grants under the 2004 stock incentive plan. Optionsgranted under this plan during the years ended December 31, 2010, 2009 and 2008 have exercise prices in theranges of $14.88 to $16.48, $8.09 to $11.45 and $13.29 to $22.00, respectively, which primarily vest and areexercisable generally in equal annual increments over four years from the date of grant. All options that havebeen granted under the 2004 stock incentive plan have a term of five or seven years from the date of grant.
A summary of the status of our outstanding stock options is presented in the tables below:
Shares
WeightedAverage
Exercise Price
Outstanding at December 31, 2007 . . . . . . . . . . . . . . . . . . . . . . . . . . . . . . 12,566,895 $ 9.38Exercised . . . . . . . . . . . . . . . . . . . . . . . . . . . . . . . . . . . . . . . . . . . . . . . . . . (941,896) 4.27Granted . . . . . . . . . . . . . . . . . . . . . . . . . . . . . . . . . . . . . . . . . . . . . . . . . . . . 1,694,340 13.41Forfeited . . . . . . . . . . . . . . . . . . . . . . . . . . . . . . . . . . . . . . . . . . . . . . . . . . . (518,043) 17.29Expired . . . . . . . . . . . . . . . . . . . . . . . . . . . . . . . . . . . . . . . . . . . . . . . . . . . . (52,703) 19.01
Outstanding at December 31, 2008 . . . . . . . . . . . . . . . . . . . . . . . . . . . . . . 12,748,593 $ 9.91Exercised . . . . . . . . . . . . . . . . . . . . . . . . . . . . . . . . . . . . . . . . . . . . . . . . . . (2,665,568) 5.79Granted (1) . . . . . . . . . . . . . . . . . . . . . . . . . . . . . . . . . . . . . . . . . . . . . . . . . 605,066 10.61Canceled/Forfeited (2) . . . . . . . . . . . . . . . . . . . . . . . . . . . . . . . . . . . . . . . . (2,851,880) 20.66Expired . . . . . . . . . . . . . . . . . . . . . . . . . . . . . . . . . . . . . . . . . . . . . . . . . . . . (248,293) 15.27
Outstanding at December 31, 2009 . . . . . . . . . . . . . . . . . . . . . . . . . . . . . . 7,587,918 $ 7.04Exercised . . . . . . . . . . . . . . . . . . . . . . . . . . . . . . . . . . . . . . . . . . . . . . . . . . (898,650) 2.67Granted . . . . . . . . . . . . . . . . . . . . . . . . . . . . . . . . . . . . . . . . . . . . . . . . . . . . 29,326 15.68Forfeited . . . . . . . . . . . . . . . . . . . . . . . . . . . . . . . . . . . . . . . . . . . . . . . . . . . (32,848) 14.23Expired . . . . . . . . . . . . . . . . . . . . . . . . . . . . . . . . . . . . . . . . . . . . . . . . . . . . (49,266) 18.55
Outstanding at December 31, 2010 . . . . . . . . . . . . . . . . . . . . . . . . . . . . . . 6,636,480 $ 7.55
Vested and expected to vest at December 31, 2010 (3) . . . . . . . . . . . . . . . 6,544,555 $ 7.55
Exercisable at December 31, 2010 . . . . . . . . . . . . . . . . . . . . . . . . . . . . . . 5,534,143 $ 6.53
(1) Includes 103,361 shares granted in connection with the Exchange Offer.(2) Includes 2,599,307 shares canceled in connection with the Exchange Offer.(3) The expected to vest options are the result of applying the pre-vesting forfeiture rate assumption to total
outstanding options.
We estimate the fair value of our options on the date of grant using the Black-Scholes option-pricing model,which takes into account assumptions such as the dividend yield, the risk-free interest rate, the expected stockprice volatility and the expected life of the options.
109
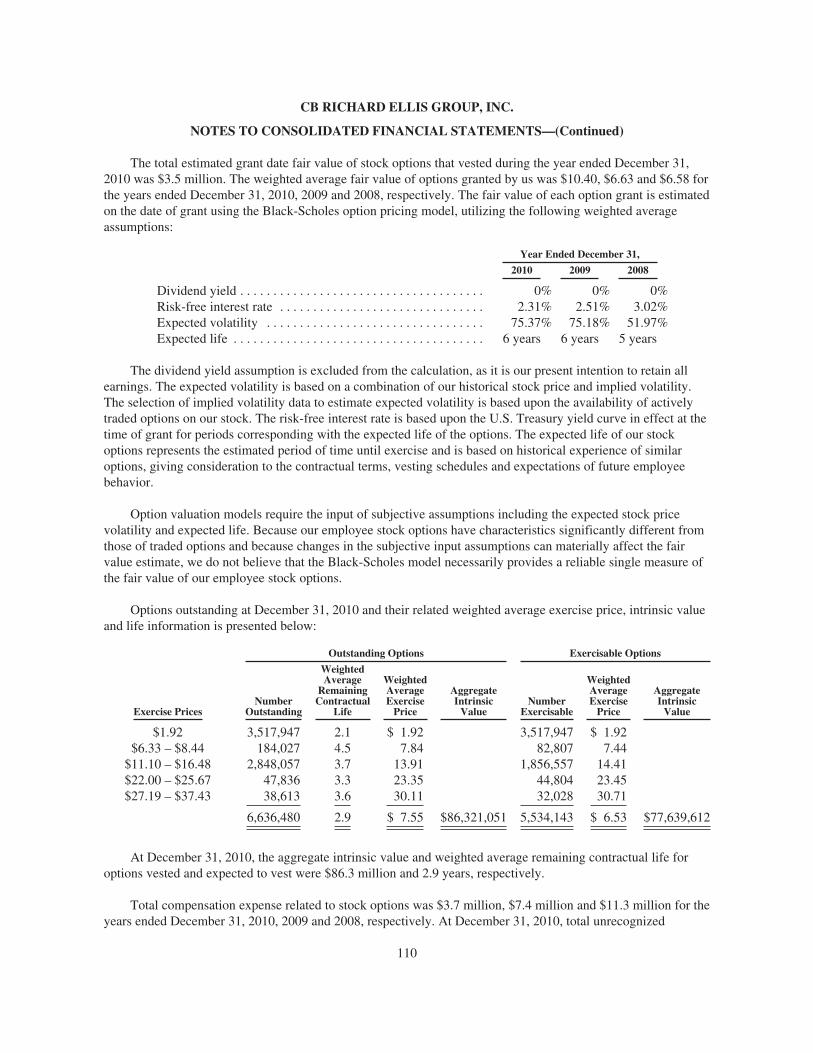
CB RICHARD ELLIS GROUP, INC.
NOTES TO CONSOLIDATED FINANCIAL STATEMENTS—(Continued)
The total estimated grant date fair value of stock options that vested during the year ended December 31,2010 was $3.5 million. The weighted average fair value of options granted by us was $10.40, $6.63 and $6.58 forthe years ended December 31, 2010, 2009 and 2008, respectively. The fair value of each option grant is estimatedon the date of grant using the Black-Scholes option pricing model, utilizing the following weighted averageassumptions:
Year Ended December 31,
2010 2009 2008
Dividend yield . . . . . . . . . . . . . . . . . . . . . . . . . . . . . . . . . . . . . 0% 0% 0%Risk-free interest rate . . . . . . . . . . . . . . . . . . . . . . . . . . . . . . . 2.31% 2.51% 3.02%Expected volatility . . . . . . . . . . . . . . . . . . . . . . . . . . . . . . . . . 75.37% 75.18% 51.97%Expected life . . . . . . . . . . . . . . . . . . . . . . . . . . . . . . . . . . . . . . 6 years 6 years 5 years
The dividend yield assumption is excluded from the calculation, as it is our present intention to retain allearnings. The expected volatility is based on a combination of our historical stock price and implied volatility.The selection of implied volatility data to estimate expected volatility is based upon the availability of activelytraded options on our stock. The risk-free interest rate is based upon the U.S. Treasury yield curve in effect at thetime of grant for periods corresponding with the expected life of the options. The expected life of our stockoptions represents the estimated period of time until exercise and is based on historical experience of similaroptions, giving consideration to the contractual terms, vesting schedules and expectations of future employeebehavior.
Option valuation models require the input of subjective assumptions including the expected stock pricevolatility and expected life. Because our employee stock options have characteristics significantly different fromthose of traded options and because changes in the subjective input assumptions can materially affect the fairvalue estimate, we do not believe that the Black-Scholes model necessarily provides a reliable single measure ofthe fair value of our employee stock options.
Options outstanding at December 31, 2010 and their related weighted average exercise price, intrinsic valueand life information is presented below:
Outstanding Options Exercisable Options
Exercise PricesNumber
Outstanding
WeightedAverage
RemainingContractual
Life
WeightedAverageExercise
Price
AggregateIntrinsic
ValueNumber
Exercisable
WeightedAverageExercise
Price
AggregateIntrinsic
Value
$1.92 3,517,947 2.1 $ 1.92 3,517,947 $ 1.92$6.33 – $8.44 184,027 4.5 7.84 82,807 7.44
$11.10 – $16.48 2,848,057 3.7 13.91 1,856,557 14.41$22.00 – $25.67 47,836 3.3 23.35 44,804 23.45$27.19 – $37.43 38,613 3.6 30.11 32,028 30.71
6,636,480 2.9 $ 7.55 $86,321,051 5,534,143 $ 6.53 $77,639,612
At December 31, 2010, the aggregate intrinsic value and weighted average remaining contractual life foroptions vested and expected to vest were $86.3 million and 2.9 years, respectively.
Total compensation expense related to stock options was $3.7 million, $7.4 million and $11.3 million for theyears ended December 31, 2010, 2009 and 2008, respectively. At December 31, 2010, total unrecognized
110

CB RICHARD ELLIS GROUP, INC.
NOTES TO CONSOLIDATED FINANCIAL STATEMENTS—(Continued)
estimated compensation cost related to non-vested stock options was approximately $6.3 million, which isexpected to be recognized over a weighted average period of approximately 1.9 years.
The total intrinsic value of stock options exercised during the years ended December 31, 2010, 2009 and2008 was $14.5 million, $11.4 million and $12.4 million, respectively. We recorded cash received from stockoption exercises of $2.4 million, $15.4 million and $4.0 million and related tax benefit of $5.4 million, $1.6million and $4.3 million during the years ended December 31, 2010, 2009 and 2008, respectively. Upon optionexercise, we issue new shares of stock. Excess tax benefits exist when the tax deduction resulting from theexercise of options exceeds the compensation cost recorded.
Non-Vested Stock Awards
We have issued non-vested stock awards, including shares and stock units, in our Class A common stock tocertain of our employees and members of our board of directors. During the years ended December 31, 2010,2009 and 2008, we granted non-vested stock awards of 1,196,720 shares, 6,711,288 shares and 2,371,987 shares,respectively, which primarily vest and are exercisable generally in equal annual increments over four years fromthe date of grant. We also granted 759,992, 54,344 and 529,907 of non-vested stock units to certain of ouremployees during the years ended December 31, 2010, 2009 and 2008, respectively. These non-vested stockunits primarily vest in 2015 and 2016. A summary of the status of our non-vested stock awards is presented in thetable below:
Shares /Units
WeightedAverage MarketValue Per Share
Balance at December 31, 2007 . . . . . . . . . . . . . . . . . . . . . . . . 2,493,581 $26.52Granted . . . . . . . . . . . . . . . . . . . . . . . . . . . . . . . . . . . . . . . . . . 2,901,894 14.40Vested . . . . . . . . . . . . . . . . . . . . . . . . . . . . . . . . . . . . . . . . . . . (504,736) 24.83Forfeited . . . . . . . . . . . . . . . . . . . . . . . . . . . . . . . . . . . . . . . . . (252,196) 21.49
Balance at December 31, 2008 . . . . . . . . . . . . . . . . . . . . . . . . 4,638,543 $19.39Granted (1) . . . . . . . . . . . . . . . . . . . . . . . . . . . . . . . . . . . . . . . 6,765,632 10.98Vested . . . . . . . . . . . . . . . . . . . . . . . . . . . . . . . . . . . . . . . . . . . (1,077,906) 19.29Forfeited . . . . . . . . . . . . . . . . . . . . . . . . . . . . . . . . . . . . . . . . . (116,824) 19.96
Balance at December 31, 2009 . . . . . . . . . . . . . . . . . . . . . . . . 10,209,445 $13.82Granted . . . . . . . . . . . . . . . . . . . . . . . . . . . . . . . . . . . . . . . . . . 1,956,712 16.87Vested . . . . . . . . . . . . . . . . . . . . . . . . . . . . . . . . . . . . . . . . . . . (2,557,721) 13.98Forfeited . . . . . . . . . . . . . . . . . . . . . . . . . . . . . . . . . . . . . . . . . (339,528) 14.45
Balance at December 31, 2010 . . . . . . . . . . . . . . . . . . . . . . . . 9,268,908 $14.40
(1) Includes 819,672 shares granted in connection with the Exchange Offer.
Total compensation expense related to non-vested stock awards was $43.1 million, $30.5 million and $18.5million for the years ended December 31, 2010, 2009 and 2008, respectively. At December 31, 2010, totalunrecognized estimated compensation cost related to non-vested stock awards was approximately $106.6 million,which is expected to be recognized over a weighted average period of approximately 3.0 years.
Bonuses. We have bonus programs covering select employees, including senior management. Awards arebased on the position and performance of the employee and the achievement of pre-established financial,operating and strategic objectives. The amounts charged to expense for bonuses were $135.0 million, $60.6million and $66.7 million for the years ended December 31, 2010, 2009 and 2008, respectively.
111
CB RICHARD ELLIS GROUP, INC.
NOTES TO CONSOLIDATED FINANCIAL STATEMENTS—(Continued)
401(k) Plan. Our CB Richard Ellis 401(k) Plan (401(k) Plan) is a defined contribution profit sharing planthat allows participant deferrals under Section 401(k) of the Internal Revenue Code. Most of our non-union U.S.employees, other than qualified real estate agents having the status of independent contractors under section 3508of the Internal Revenue Code, are eligible to participate in the plan. The 401(k) Plan provides for participantcontributions as well as a Company match. A participant is allowed to contribute to the 401(k) Plan from 1% to75% of his or her compensation, subject to limits imposed by applicable law. Effective January 1, 2007, allparticipants hired post January 1, 2007 vest in company match contributions 20% per year for each plan year theywork 1,000 hours. All participants hired before January 1, 2007 are immediately vested in company matchcontributions. For 2008, we contributed a 50% match on the first 3% of annual compensation (up to $150,000 ofcompensation) deferred by each participant. Effective January 1, 2009, the company match was suspended.However, we will be making a partial retroactive match for 2010 401(k) participants who were employed atDecember 31, 2010, which is included in the $2.7 million expense for the year ended December 31, 2010. Inconnection with the 401(k) Plan, we charged to expense $2.7 million, $0.7 million and $9.0 million for the yearsended December 31, 2010, 2009 and 2008, respectively.
Participants are entitled to invest up to 25% of their 401(k) account balance in shares of our common stock.As of December 31, 2010, approximately 1.1 million shares of our common stock were held as investments byparticipants in our 401(k) Plan.
Pension Plans. We have two contributory defined benefit pension plans in the U.K. The London-based firmof Hillier Parker May & Rowden, which we acquired in 1998, had a contributory defined benefit pension plan. Asubsidiary of Insignia, which we acquired in connection with the Insignia Acquisition in 2003, also had acontributory defined benefit pension plan in the U.K. Our subsidiaries based in the U.K. maintain the plans toprovide retirement benefits to existing and former employees participating in these plans. With respect to theseplans, our historical policy has been to contribute annually an amount to fund pension cost as actuariallydetermined and as required by applicable laws and regulations. Effective July 1, 2007, we reached agreementswith the active members of these plans to freeze future pension plan benefits. In return, the active membersbecame eligible to enroll in a defined contribution plan.
We previously used a measurement date of September 30 for both of our defined benefit pension plans. Forthe year ended December 31, 2008, as required by the “Compensation – Retirement Benefits” Topic of the FASBASC (Topic 715), we adopted the measurement date provisions, which required us to measure the funded statusof our plans as of the date of our fiscal year-end statement of financial position. We used the “alternative”method of adoption for both of our plans. In connection with this adoption, during the year ended December 31,2008, we recorded an increase in retained earnings of $0.2 million and a decrease in accumulated othercomprehensive loss of $0.1 million, net of tax, representing the estimated periodic pension benefit for the periodfrom October 1, 2007 through December 31, 2007. The following table sets forth a reconciliation of the benefit
112
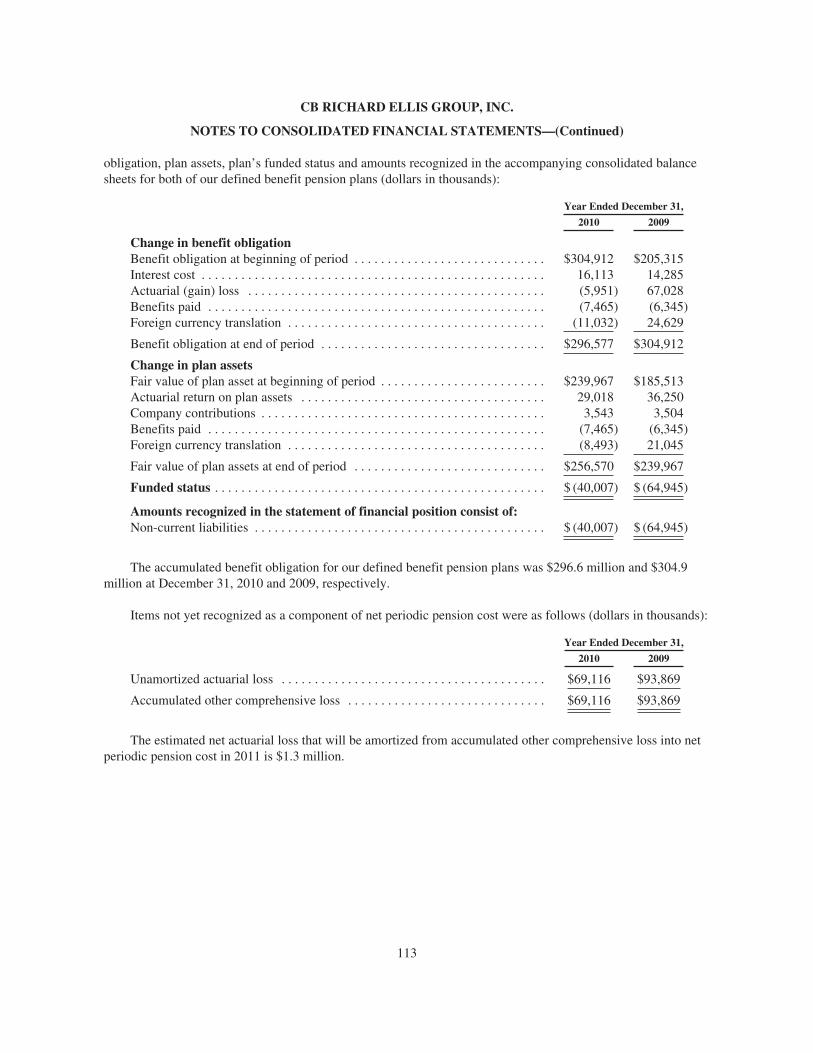
CB RICHARD ELLIS GROUP, INC.
NOTES TO CONSOLIDATED FINANCIAL STATEMENTS—(Continued)
obligation, plan assets, plan’s funded status and amounts recognized in the accompanying consolidated balancesheets for both of our defined benefit pension plans (dollars in thousands):
Year Ended December 31,
2010 2009
Change in benefit obligationBenefit obligation at beginning of period . . . . . . . . . . . . . . . . . . . . . . . . . . . . . $304,912 $205,315Interest cost . . . . . . . . . . . . . . . . . . . . . . . . . . . . . . . . . . . . . . . . . . . . . . . . . . . . 16,113 14,285Actuarial (gain) loss . . . . . . . . . . . . . . . . . . . . . . . . . . . . . . . . . . . . . . . . . . . . . (5,951) 67,028Benefits paid . . . . . . . . . . . . . . . . . . . . . . . . . . . . . . . . . . . . . . . . . . . . . . . . . . . (7,465) (6,345)Foreign currency translation . . . . . . . . . . . . . . . . . . . . . . . . . . . . . . . . . . . . . . . (11,032) 24,629
Benefit obligation at end of period . . . . . . . . . . . . . . . . . . . . . . . . . . . . . . . . . . $296,577 $304,912
Change in plan assetsFair value of plan asset at beginning of period . . . . . . . . . . . . . . . . . . . . . . . . . $239,967 $185,513Actuarial return on plan assets . . . . . . . . . . . . . . . . . . . . . . . . . . . . . . . . . . . . . 29,018 36,250Company contributions . . . . . . . . . . . . . . . . . . . . . . . . . . . . . . . . . . . . . . . . . . . 3,543 3,504Benefits paid . . . . . . . . . . . . . . . . . . . . . . . . . . . . . . . . . . . . . . . . . . . . . . . . . . . (7,465) (6,345)Foreign currency translation . . . . . . . . . . . . . . . . . . . . . . . . . . . . . . . . . . . . . . . (8,493) 21,045
Fair value of plan assets at end of period . . . . . . . . . . . . . . . . . . . . . . . . . . . . . $256,570 $239,967
Funded status . . . . . . . . . . . . . . . . . . . . . . . . . . . . . . . . . . . . . . . . . . . . . . . . . . $ (40,007) $ (64,945)
Amounts recognized in the statement of financial position consist of:Non-current liabilities . . . . . . . . . . . . . . . . . . . . . . . . . . . . . . . . . . . . . . . . . . . . $ (40,007) $ (64,945)
The accumulated benefit obligation for our defined benefit pension plans was $296.6 million and $304.9million at December 31, 2010 and 2009, respectively.
Items not yet recognized as a component of net periodic pension cost were as follows (dollars in thousands):
Year Ended December 31,
2010 2009
Unamortized actuarial loss . . . . . . . . . . . . . . . . . . . . . . . . . . . . . . . . . . . . . . . . $69,116 $93,869
Accumulated other comprehensive loss . . . . . . . . . . . . . . . . . . . . . . . . . . . . . . $69,116 $93,869
The estimated net actuarial loss that will be amortized from accumulated other comprehensive loss into netperiodic pension cost in 2011 is $1.3 million.
113
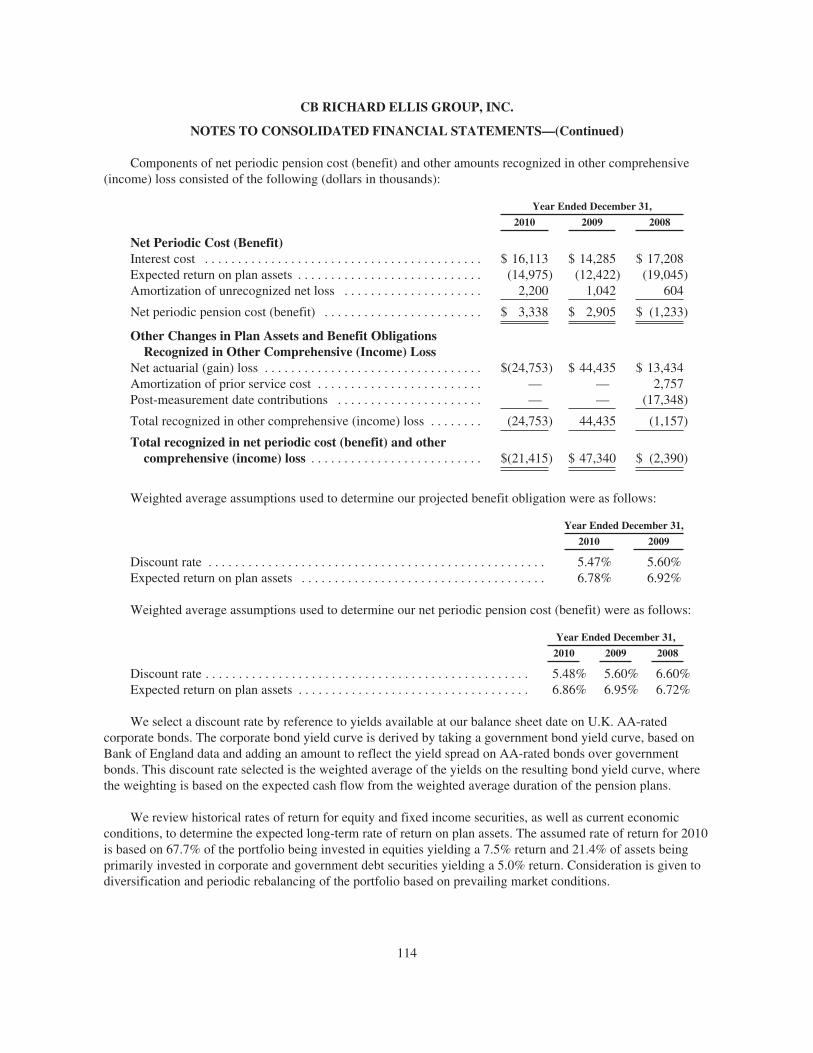
CB RICHARD ELLIS GROUP, INC.
NOTES TO CONSOLIDATED FINANCIAL STATEMENTS—(Continued)
Components of net periodic pension cost (benefit) and other amounts recognized in other comprehensive(income) loss consisted of the following (dollars in thousands):
Year Ended December 31,
2010 2009 2008
Net Periodic Cost (Benefit)Interest cost . . . . . . . . . . . . . . . . . . . . . . . . . . . . . . . . . . . . . . . . . . $ 16,113 $ 14,285 $ 17,208Expected return on plan assets . . . . . . . . . . . . . . . . . . . . . . . . . . . . (14,975) (12,422) (19,045)Amortization of unrecognized net loss . . . . . . . . . . . . . . . . . . . . . 2,200 1,042 604
Net periodic pension cost (benefit) . . . . . . . . . . . . . . . . . . . . . . . . $ 3,338 $ 2,905 $ (1,233)
Other Changes in Plan Assets and Benefit ObligationsRecognized in Other Comprehensive (Income) Loss
Net actuarial (gain) loss . . . . . . . . . . . . . . . . . . . . . . . . . . . . . . . . . $(24,753) $ 44,435 $ 13,434Amortization of prior service cost . . . . . . . . . . . . . . . . . . . . . . . . . — — 2,757Post-measurement date contributions . . . . . . . . . . . . . . . . . . . . . . — — (17,348)
Total recognized in other comprehensive (income) loss . . . . . . . . (24,753) 44,435 (1,157)
Total recognized in net periodic cost (benefit) and othercomprehensive (income) loss . . . . . . . . . . . . . . . . . . . . . . . . . . $(21,415) $ 47,340 $ (2,390)
Weighted average assumptions used to determine our projected benefit obligation were as follows:
Year Ended December 31,
2010 2009
Discount rate . . . . . . . . . . . . . . . . . . . . . . . . . . . . . . . . . . . . . . . . . . . . . . . . . . . 5.47% 5.60%Expected return on plan assets . . . . . . . . . . . . . . . . . . . . . . . . . . . . . . . . . . . . . 6.78% 6.92%
Weighted average assumptions used to determine our net periodic pension cost (benefit) were as follows:
Year Ended December 31,
2010 2009 2008
Discount rate . . . . . . . . . . . . . . . . . . . . . . . . . . . . . . . . . . . . . . . . . . . . . . . . . 5.48% 5.60% 6.60%Expected return on plan assets . . . . . . . . . . . . . . . . . . . . . . . . . . . . . . . . . . . 6.86% 6.95% 6.72%
We select a discount rate by reference to yields available at our balance sheet date on U.K. AA-ratedcorporate bonds. The corporate bond yield curve is derived by taking a government bond yield curve, based onBank of England data and adding an amount to reflect the yield spread on AA-rated bonds over governmentbonds. This discount rate selected is the weighted average of the yields on the resulting bond yield curve, wherethe weighting is based on the expected cash flow from the weighted average duration of the pension plans.
We review historical rates of return for equity and fixed income securities, as well as current economicconditions, to determine the expected long-term rate of return on plan assets. The assumed rate of return for 2010is based on 67.7% of the portfolio being invested in equities yielding a 7.5% return and 21.4% of assets beingprimarily invested in corporate and government debt securities yielding a 5.0% return. Consideration is given todiversification and periodic rebalancing of the portfolio based on prevailing market conditions.
114
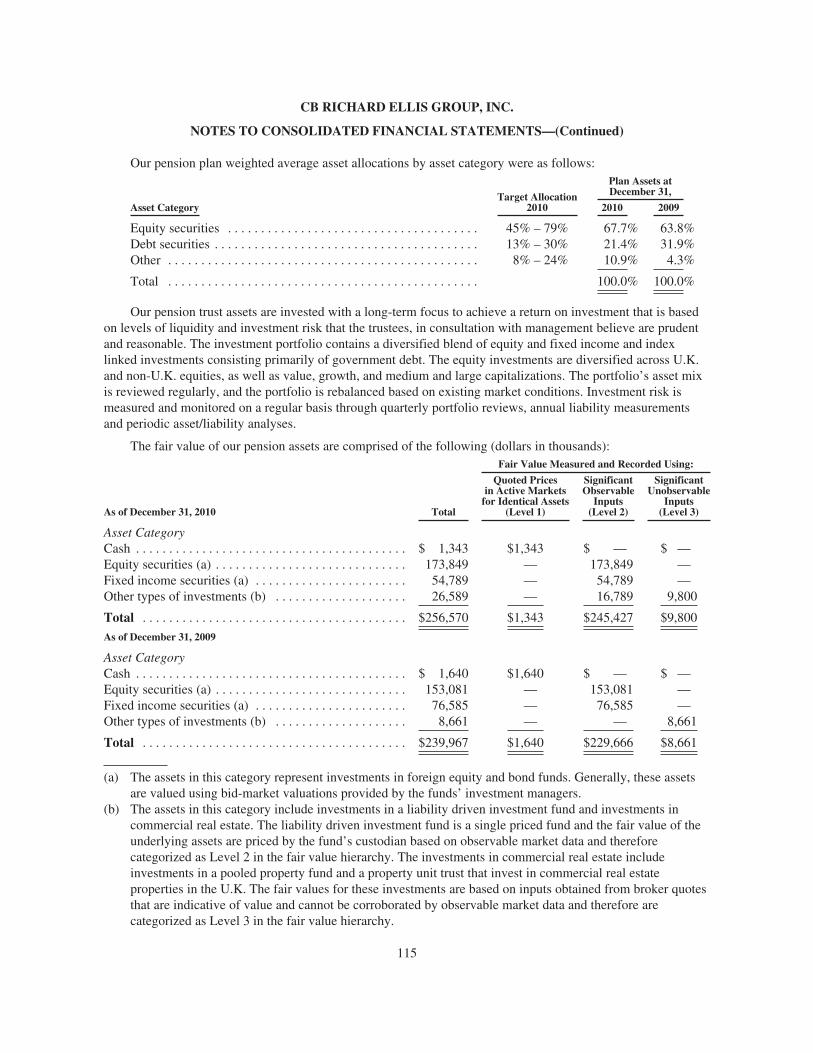
CB RICHARD ELLIS GROUP, INC.
NOTES TO CONSOLIDATED FINANCIAL STATEMENTS—(Continued)
Our pension plan weighted average asset allocations by asset category were as follows:
Asset CategoryTarget Allocation
2010
Plan Assets atDecember 31,
2010 2009
Equity securities . . . . . . . . . . . . . . . . . . . . . . . . . . . . . . . . . . . . . . 45% – 79% 67.7% 63.8%Debt securities . . . . . . . . . . . . . . . . . . . . . . . . . . . . . . . . . . . . . . . . 13% – 30% 21.4% 31.9%Other . . . . . . . . . . . . . . . . . . . . . . . . . . . . . . . . . . . . . . . . . . . . . . . 8% – 24% 10.9% 4.3%
Total . . . . . . . . . . . . . . . . . . . . . . . . . . . . . . . . . . . . . . . . . . . . . . . 100.0% 100.0%
Our pension trust assets are invested with a long-term focus to achieve a return on investment that is basedon levels of liquidity and investment risk that the trustees, in consultation with management believe are prudentand reasonable. The investment portfolio contains a diversified blend of equity and fixed income and indexlinked investments consisting primarily of government debt. The equity investments are diversified across U.K.and non-U.K. equities, as well as value, growth, and medium and large capitalizations. The portfolio’s asset mixis reviewed regularly, and the portfolio is rebalanced based on existing market conditions. Investment risk ismeasured and monitored on a regular basis through quarterly portfolio reviews, annual liability measurementsand periodic asset/liability analyses.
The fair value of our pension assets are comprised of the following (dollars in thousands):Fair Value Measured and Recorded Using:
As of December 31, 2010 Total
Quoted Pricesin Active Markets
for Identical Assets(Level 1)
SignificantObservable
Inputs(Level 2)
SignificantUnobservable
Inputs(Level 3)
Asset CategoryCash . . . . . . . . . . . . . . . . . . . . . . . . . . . . . . . . . . . . . . . . . $ 1,343 $1,343 $ — $ —Equity securities (a) . . . . . . . . . . . . . . . . . . . . . . . . . . . . . 173,849 — 173,849 —Fixed income securities (a) . . . . . . . . . . . . . . . . . . . . . . . 54,789 — 54,789 —Other types of investments (b) . . . . . . . . . . . . . . . . . . . . 26,589 — 16,789 9,800
Total . . . . . . . . . . . . . . . . . . . . . . . . . . . . . . . . . . . . . . . . $256,570 $1,343 $245,427 $9,800
As of December 31, 2009
Asset CategoryCash . . . . . . . . . . . . . . . . . . . . . . . . . . . . . . . . . . . . . . . . . $ 1,640 $1,640 $ — $ —Equity securities (a) . . . . . . . . . . . . . . . . . . . . . . . . . . . . . 153,081 — 153,081 —Fixed income securities (a) . . . . . . . . . . . . . . . . . . . . . . . 76,585 — 76,585 —Other types of investments (b) . . . . . . . . . . . . . . . . . . . . 8,661 — — 8,661
Total . . . . . . . . . . . . . . . . . . . . . . . . . . . . . . . . . . . . . . . . $239,967 $1,640 $229,666 $8,661
(a) The assets in this category represent investments in foreign equity and bond funds. Generally, these assetsare valued using bid-market valuations provided by the funds’ investment managers.
(b) The assets in this category include investments in a liability driven investment fund and investments incommercial real estate. The liability driven investment fund is a single priced fund and the fair value of theunderlying assets are priced by the fund’s custodian based on observable market data and thereforecategorized as Level 2 in the fair value hierarchy. The investments in commercial real estate includeinvestments in a pooled property fund and a property unit trust that invest in commercial real estateproperties in the U.K. The fair values for these investments are based on inputs obtained from broker quotesthat are indicative of value and cannot be corroborated by observable market data and therefore arecategorized as Level 3 in the fair value hierarchy.
115
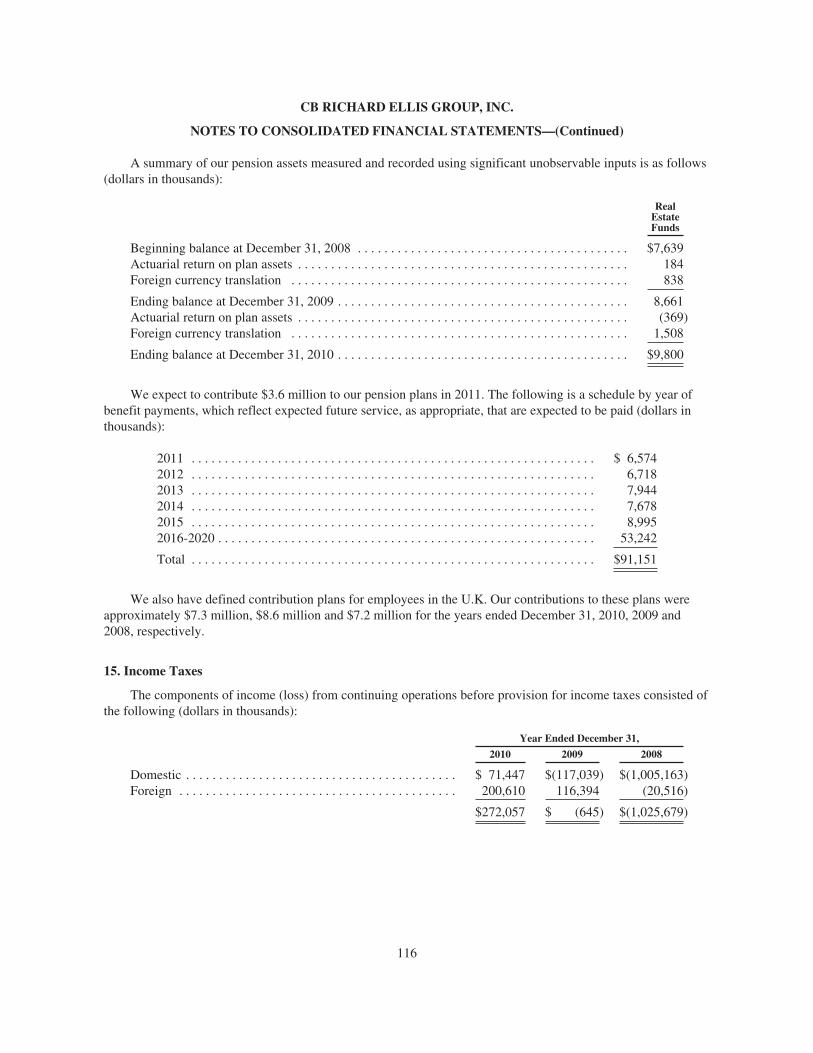
CB RICHARD ELLIS GROUP, INC.
NOTES TO CONSOLIDATED FINANCIAL STATEMENTS—(Continued)
A summary of our pension assets measured and recorded using significant unobservable inputs is as follows(dollars in thousands):
RealEstateFunds
Beginning balance at December 31, 2008 . . . . . . . . . . . . . . . . . . . . . . . . . . . . . . . . . . . . . . . . . $7,639Actuarial return on plan assets . . . . . . . . . . . . . . . . . . . . . . . . . . . . . . . . . . . . . . . . . . . . . . . . . . 184Foreign currency translation . . . . . . . . . . . . . . . . . . . . . . . . . . . . . . . . . . . . . . . . . . . . . . . . . . . 838
Ending balance at December 31, 2009 . . . . . . . . . . . . . . . . . . . . . . . . . . . . . . . . . . . . . . . . . . . . 8,661Actuarial return on plan assets . . . . . . . . . . . . . . . . . . . . . . . . . . . . . . . . . . . . . . . . . . . . . . . . . . (369)Foreign currency translation . . . . . . . . . . . . . . . . . . . . . . . . . . . . . . . . . . . . . . . . . . . . . . . . . . . 1,508
Ending balance at December 31, 2010 . . . . . . . . . . . . . . . . . . . . . . . . . . . . . . . . . . . . . . . . . . . . $9,800
We expect to contribute $3.6 million to our pension plans in 2011. The following is a schedule by year ofbenefit payments, which reflect expected future service, as appropriate, that are expected to be paid (dollars inthousands):
2011 . . . . . . . . . . . . . . . . . . . . . . . . . . . . . . . . . . . . . . . . . . . . . . . . . . . . . . . . . . . . . $ 6,5742012 . . . . . . . . . . . . . . . . . . . . . . . . . . . . . . . . . . . . . . . . . . . . . . . . . . . . . . . . . . . . . 6,7182013 . . . . . . . . . . . . . . . . . . . . . . . . . . . . . . . . . . . . . . . . . . . . . . . . . . . . . . . . . . . . . 7,9442014 . . . . . . . . . . . . . . . . . . . . . . . . . . . . . . . . . . . . . . . . . . . . . . . . . . . . . . . . . . . . . 7,6782015 . . . . . . . . . . . . . . . . . . . . . . . . . . . . . . . . . . . . . . . . . . . . . . . . . . . . . . . . . . . . . 8,9952016-2020 . . . . . . . . . . . . . . . . . . . . . . . . . . . . . . . . . . . . . . . . . . . . . . . . . . . . . . . . . 53,242
Total . . . . . . . . . . . . . . . . . . . . . . . . . . . . . . . . . . . . . . . . . . . . . . . . . . . . . . . . . . . . . $91,151
We also have defined contribution plans for employees in the U.K. Our contributions to these plans wereapproximately $7.3 million, $8.6 million and $7.2 million for the years ended December 31, 2010, 2009 and2008, respectively.
15. Income Taxes
The components of income (loss) from continuing operations before provision for income taxes consisted ofthe following (dollars in thousands):
Year Ended December 31,
2010 2009 2008
Domestic . . . . . . . . . . . . . . . . . . . . . . . . . . . . . . . . . . . . . . . . . $ 71,447 $(117,039) $(1,005,163)Foreign . . . . . . . . . . . . . . . . . . . . . . . . . . . . . . . . . . . . . . . . . . 200,610 116,394 (20,516)
$272,057 $ (645) $(1,025,679)
116
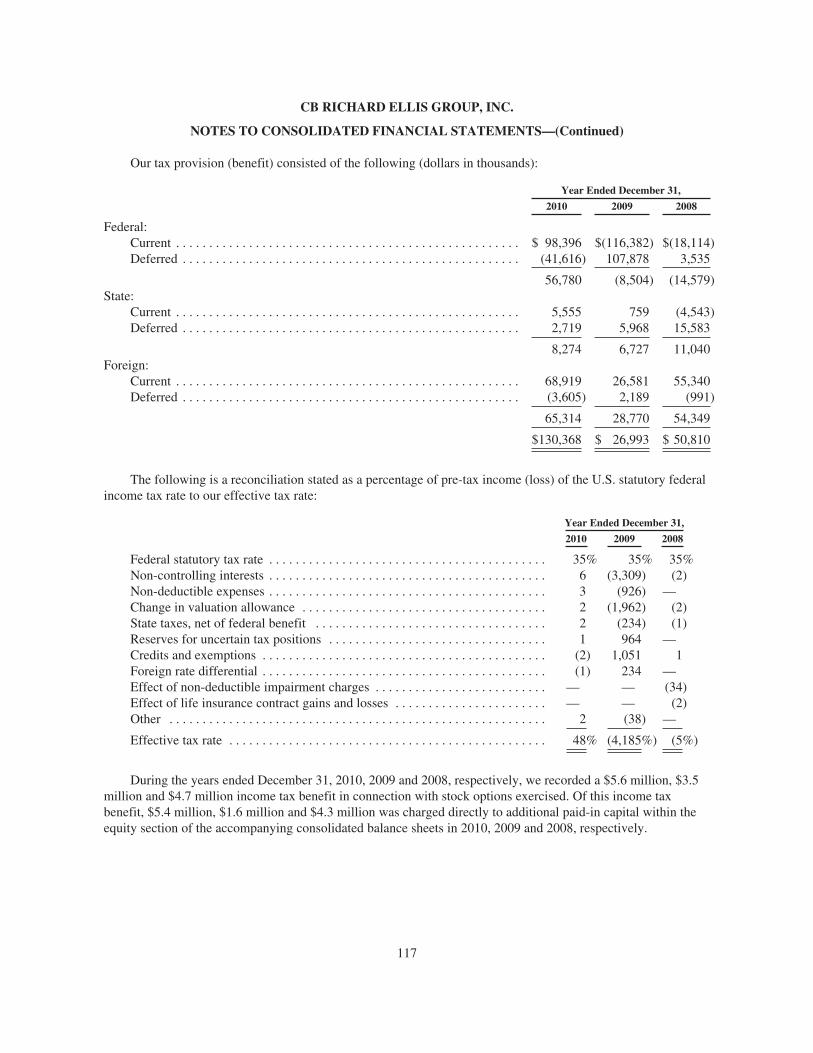
CB RICHARD ELLIS GROUP, INC.
NOTES TO CONSOLIDATED FINANCIAL STATEMENTS—(Continued)
Our tax provision (benefit) consisted of the following (dollars in thousands):
Year Ended December 31,
2010 2009 2008
Federal:Current . . . . . . . . . . . . . . . . . . . . . . . . . . . . . . . . . . . . . . . . . . . . . . . . . . . . $ 98,396 $(116,382) $(18,114)Deferred . . . . . . . . . . . . . . . . . . . . . . . . . . . . . . . . . . . . . . . . . . . . . . . . . . . (41,616) 107,878 3,535
56,780 (8,504) (14,579)State:
Current . . . . . . . . . . . . . . . . . . . . . . . . . . . . . . . . . . . . . . . . . . . . . . . . . . . . 5,555 759 (4,543)Deferred . . . . . . . . . . . . . . . . . . . . . . . . . . . . . . . . . . . . . . . . . . . . . . . . . . . 2,719 5,968 15,583
8,274 6,727 11,040Foreign:
Current . . . . . . . . . . . . . . . . . . . . . . . . . . . . . . . . . . . . . . . . . . . . . . . . . . . . 68,919 26,581 55,340Deferred . . . . . . . . . . . . . . . . . . . . . . . . . . . . . . . . . . . . . . . . . . . . . . . . . . . (3,605) 2,189 (991)
65,314 28,770 54,349
$130,368 $ 26,993 $ 50,810
The following is a reconciliation stated as a percentage of pre-tax income (loss) of the U.S. statutory federalincome tax rate to our effective tax rate:
Year Ended December 31,
2010 2009 2008
Federal statutory tax rate . . . . . . . . . . . . . . . . . . . . . . . . . . . . . . . . . . . . . . . . . . 35% 35% 35%Non-controlling interests . . . . . . . . . . . . . . . . . . . . . . . . . . . . . . . . . . . . . . . . . . 6 (3,309) (2)Non-deductible expenses . . . . . . . . . . . . . . . . . . . . . . . . . . . . . . . . . . . . . . . . . . 3 (926) —Change in valuation allowance . . . . . . . . . . . . . . . . . . . . . . . . . . . . . . . . . . . . . 2 (1,962) (2)State taxes, net of federal benefit . . . . . . . . . . . . . . . . . . . . . . . . . . . . . . . . . . . 2 (234) (1)Reserves for uncertain tax positions . . . . . . . . . . . . . . . . . . . . . . . . . . . . . . . . . 1 964 —Credits and exemptions . . . . . . . . . . . . . . . . . . . . . . . . . . . . . . . . . . . . . . . . . . . (2) 1,051 1Foreign rate differential . . . . . . . . . . . . . . . . . . . . . . . . . . . . . . . . . . . . . . . . . . . (1) 234 —Effect of non-deductible impairment charges . . . . . . . . . . . . . . . . . . . . . . . . . . — — (34)Effect of life insurance contract gains and losses . . . . . . . . . . . . . . . . . . . . . . . — — (2)Other . . . . . . . . . . . . . . . . . . . . . . . . . . . . . . . . . . . . . . . . . . . . . . . . . . . . . . . . . 2 (38) —
Effective tax rate . . . . . . . . . . . . . . . . . . . . . . . . . . . . . . . . . . . . . . . . . . . . . . . . 48% (4,185%) (5%)
During the years ended December 31, 2010, 2009 and 2008, respectively, we recorded a $5.6 million, $3.5million and $4.7 million income tax benefit in connection with stock options exercised. Of this income taxbenefit, $5.4 million, $1.6 million and $4.3 million was charged directly to additional paid-in capital within theequity section of the accompanying consolidated balance sheets in 2010, 2009 and 2008, respectively.
117
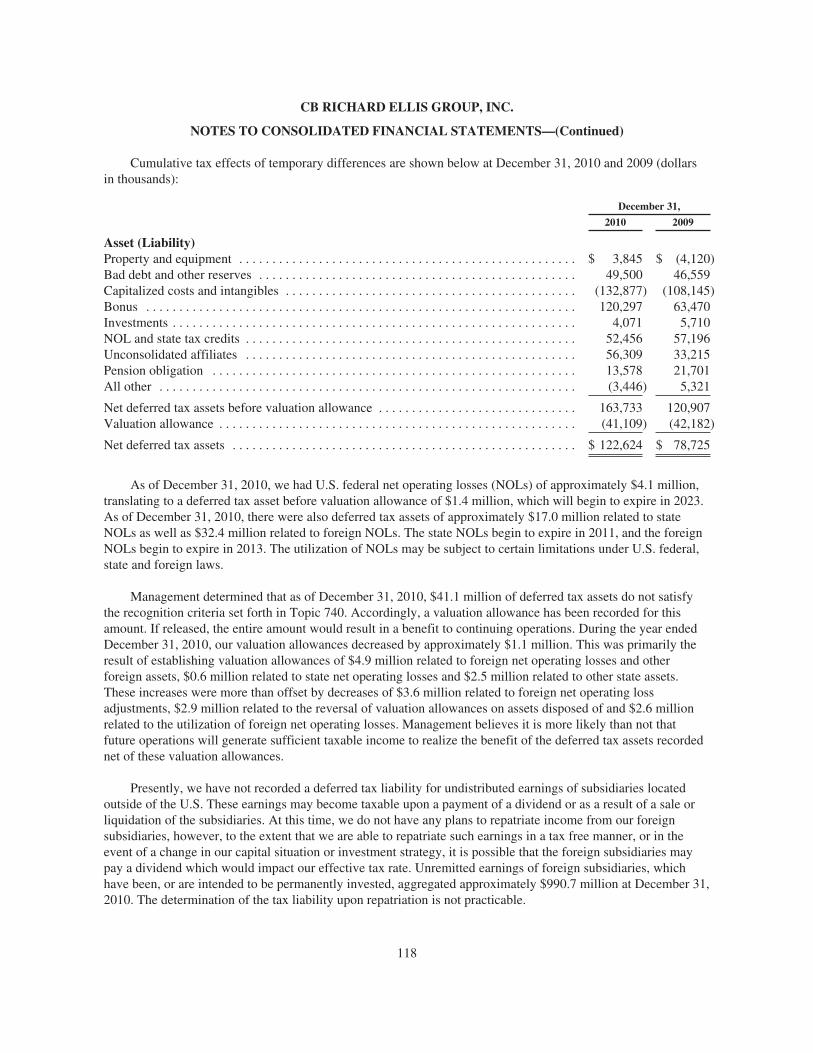
CB RICHARD ELLIS GROUP, INC.
NOTES TO CONSOLIDATED FINANCIAL STATEMENTS—(Continued)
Cumulative tax effects of temporary differences are shown below at December 31, 2010 and 2009 (dollarsin thousands):
December 31,
2010 2009
Asset (Liability)Property and equipment . . . . . . . . . . . . . . . . . . . . . . . . . . . . . . . . . . . . . . . . . . . . . . . . . . . $ 3,845 $ (4,120)Bad debt and other reserves . . . . . . . . . . . . . . . . . . . . . . . . . . . . . . . . . . . . . . . . . . . . . . . . 49,500 46,559Capitalized costs and intangibles . . . . . . . . . . . . . . . . . . . . . . . . . . . . . . . . . . . . . . . . . . . . (132,877) (108,145)Bonus . . . . . . . . . . . . . . . . . . . . . . . . . . . . . . . . . . . . . . . . . . . . . . . . . . . . . . . . . . . . . . . . . 120,297 63,470Investments . . . . . . . . . . . . . . . . . . . . . . . . . . . . . . . . . . . . . . . . . . . . . . . . . . . . . . . . . . . . . 4,071 5,710NOL and state tax credits . . . . . . . . . . . . . . . . . . . . . . . . . . . . . . . . . . . . . . . . . . . . . . . . . . 52,456 57,196Unconsolidated affiliates . . . . . . . . . . . . . . . . . . . . . . . . . . . . . . . . . . . . . . . . . . . . . . . . . . 56,309 33,215Pension obligation . . . . . . . . . . . . . . . . . . . . . . . . . . . . . . . . . . . . . . . . . . . . . . . . . . . . . . . 13,578 21,701All other . . . . . . . . . . . . . . . . . . . . . . . . . . . . . . . . . . . . . . . . . . . . . . . . . . . . . . . . . . . . . . . (3,446) 5,321
Net deferred tax assets before valuation allowance . . . . . . . . . . . . . . . . . . . . . . . . . . . . . . 163,733 120,907Valuation allowance . . . . . . . . . . . . . . . . . . . . . . . . . . . . . . . . . . . . . . . . . . . . . . . . . . . . . . (41,109) (42,182)
Net deferred tax assets . . . . . . . . . . . . . . . . . . . . . . . . . . . . . . . . . . . . . . . . . . . . . . . . . . . . $ 122,624 $ 78,725
As of December 31, 2010, we had U.S. federal net operating losses (NOLs) of approximately $4.1 million,translating to a deferred tax asset before valuation allowance of $1.4 million, which will begin to expire in 2023.As of December 31, 2010, there were also deferred tax assets of approximately $17.0 million related to stateNOLs as well as $32.4 million related to foreign NOLs. The state NOLs begin to expire in 2011, and the foreignNOLs begin to expire in 2013. The utilization of NOLs may be subject to certain limitations under U.S. federal,state and foreign laws.
Management determined that as of December 31, 2010, $41.1 million of deferred tax assets do not satisfythe recognition criteria set forth in Topic 740. Accordingly, a valuation allowance has been recorded for thisamount. If released, the entire amount would result in a benefit to continuing operations. During the year endedDecember 31, 2010, our valuation allowances decreased by approximately $1.1 million. This was primarily theresult of establishing valuation allowances of $4.9 million related to foreign net operating losses and otherforeign assets, $0.6 million related to state net operating losses and $2.5 million related to other state assets.These increases were more than offset by decreases of $3.6 million related to foreign net operating lossadjustments, $2.9 million related to the reversal of valuation allowances on assets disposed of and $2.6 millionrelated to the utilization of foreign net operating losses. Management believes it is more likely than not thatfuture operations will generate sufficient taxable income to realize the benefit of the deferred tax assets recordednet of these valuation allowances.
Presently, we have not recorded a deferred tax liability for undistributed earnings of subsidiaries locatedoutside of the U.S. These earnings may become taxable upon a payment of a dividend or as a result of a sale orliquidation of the subsidiaries. At this time, we do not have any plans to repatriate income from our foreignsubsidiaries, however, to the extent that we are able to repatriate such earnings in a tax free manner, or in theevent of a change in our capital situation or investment strategy, it is possible that the foreign subsidiaries maypay a dividend which would impact our effective tax rate. Unremitted earnings of foreign subsidiaries, whichhave been, or are intended to be permanently invested, aggregated approximately $990.7 million at December 31,2010. The determination of the tax liability upon repatriation is not practicable.
118
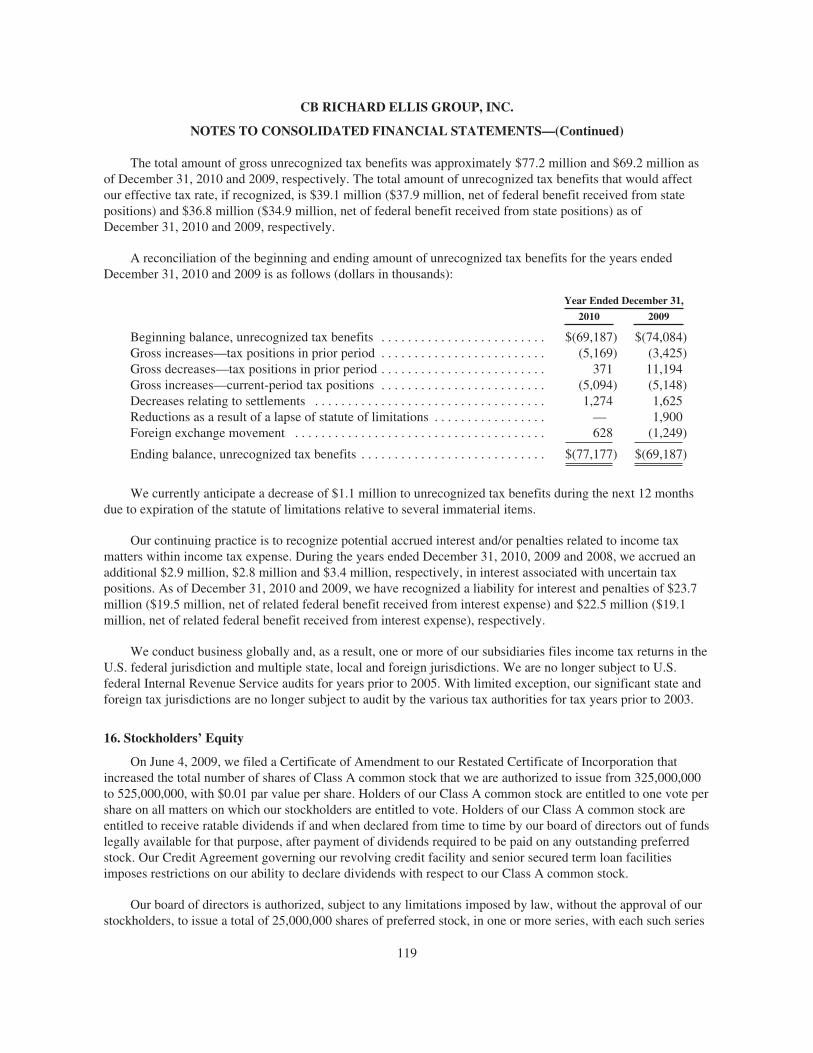
CB RICHARD ELLIS GROUP, INC.
NOTES TO CONSOLIDATED FINANCIAL STATEMENTS—(Continued)
The total amount of gross unrecognized tax benefits was approximately $77.2 million and $69.2 million asof December 31, 2010 and 2009, respectively. The total amount of unrecognized tax benefits that would affectour effective tax rate, if recognized, is $39.1 million ($37.9 million, net of federal benefit received from statepositions) and $36.8 million ($34.9 million, net of federal benefit received from state positions) as ofDecember 31, 2010 and 2009, respectively.
A reconciliation of the beginning and ending amount of unrecognized tax benefits for the years endedDecember 31, 2010 and 2009 is as follows (dollars in thousands):
Year Ended December 31,
2010 2009
Beginning balance, unrecognized tax benefits . . . . . . . . . . . . . . . . . . . . . . . . . $(69,187) $(74,084)Gross increases—tax positions in prior period . . . . . . . . . . . . . . . . . . . . . . . . . (5,169) (3,425)Gross decreases—tax positions in prior period . . . . . . . . . . . . . . . . . . . . . . . . . 371 11,194Gross increases—current-period tax positions . . . . . . . . . . . . . . . . . . . . . . . . . (5,094) (5,148)Decreases relating to settlements . . . . . . . . . . . . . . . . . . . . . . . . . . . . . . . . . . . 1,274 1,625Reductions as a result of a lapse of statute of limitations . . . . . . . . . . . . . . . . . — 1,900Foreign exchange movement . . . . . . . . . . . . . . . . . . . . . . . . . . . . . . . . . . . . . . 628 (1,249)
Ending balance, unrecognized tax benefits . . . . . . . . . . . . . . . . . . . . . . . . . . . . $(77,177) $(69,187)
We currently anticipate a decrease of $1.1 million to unrecognized tax benefits during the next 12 monthsdue to expiration of the statute of limitations relative to several immaterial items.
Our continuing practice is to recognize potential accrued interest and/or penalties related to income taxmatters within income tax expense. During the years ended December 31, 2010, 2009 and 2008, we accrued anadditional $2.9 million, $2.8 million and $3.4 million, respectively, in interest associated with uncertain taxpositions. As of December 31, 2010 and 2009, we have recognized a liability for interest and penalties of $23.7million ($19.5 million, net of related federal benefit received from interest expense) and $22.5 million ($19.1million, net of related federal benefit received from interest expense), respectively.
We conduct business globally and, as a result, one or more of our subsidiaries files income tax returns in theU.S. federal jurisdiction and multiple state, local and foreign jurisdictions. We are no longer subject to U.S.federal Internal Revenue Service audits for years prior to 2005. With limited exception, our significant state andforeign tax jurisdictions are no longer subject to audit by the various tax authorities for tax years prior to 2003.
16. Stockholders’ Equity
On June 4, 2009, we filed a Certificate of Amendment to our Restated Certificate of Incorporation thatincreased the total number of shares of Class A common stock that we are authorized to issue from 325,000,000to 525,000,000, with $0.01 par value per share. Holders of our Class A common stock are entitled to one vote pershare on all matters on which our stockholders are entitled to vote. Holders of our Class A common stock areentitled to receive ratable dividends if and when declared from time to time by our board of directors out of fundslegally available for that purpose, after payment of dividends required to be paid on any outstanding preferredstock. Our Credit Agreement governing our revolving credit facility and senior secured term loan facilitiesimposes restrictions on our ability to declare dividends with respect to our Class A common stock.
Our board of directors is authorized, subject to any limitations imposed by law, without the approval of ourstockholders, to issue a total of 25,000,000 shares of preferred stock, in one or more series, with each such series
119
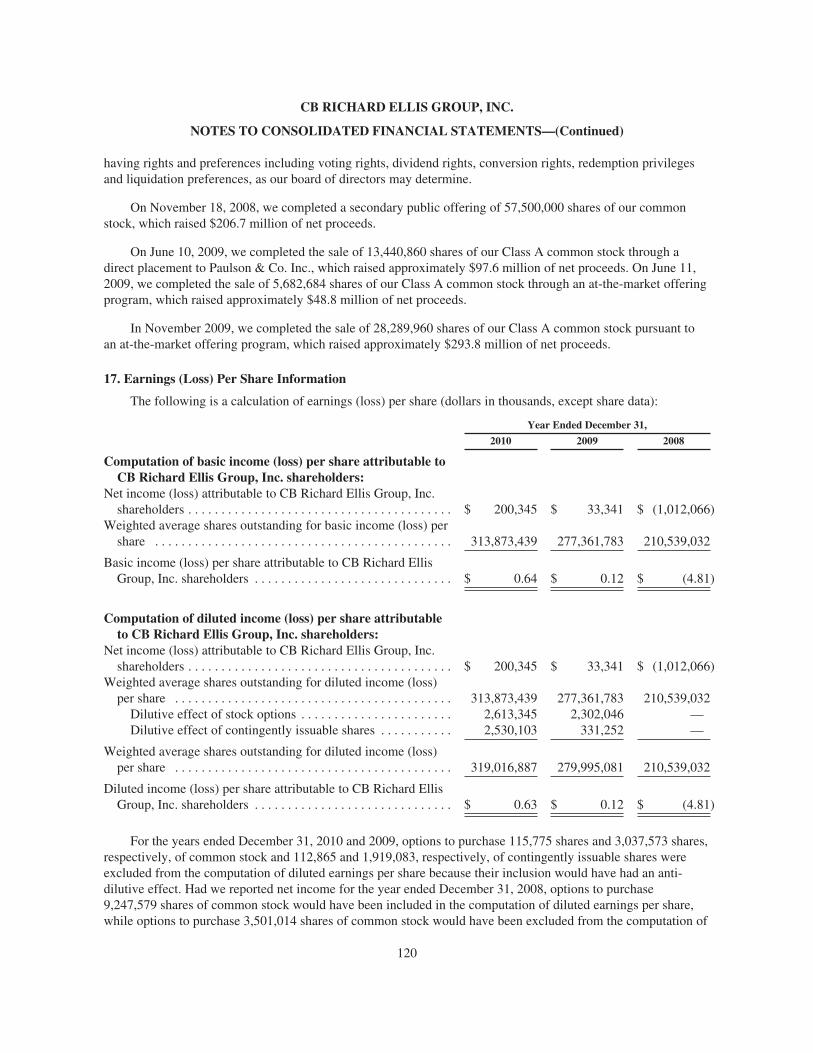
CB RICHARD ELLIS GROUP, INC.
NOTES TO CONSOLIDATED FINANCIAL STATEMENTS—(Continued)
having rights and preferences including voting rights, dividend rights, conversion rights, redemption privilegesand liquidation preferences, as our board of directors may determine.
On November 18, 2008, we completed a secondary public offering of 57,500,000 shares of our commonstock, which raised $206.7 million of net proceeds.
On June 10, 2009, we completed the sale of 13,440,860 shares of our Class A common stock through adirect placement to Paulson & Co. Inc., which raised approximately $97.6 million of net proceeds. On June 11,2009, we completed the sale of 5,682,684 shares of our Class A common stock through an at-the-market offeringprogram, which raised approximately $48.8 million of net proceeds.
In November 2009, we completed the sale of 28,289,960 shares of our Class A common stock pursuant toan at-the-market offering program, which raised approximately $293.8 million of net proceeds.
17. Earnings (Loss) Per Share Information
The following is a calculation of earnings (loss) per share (dollars in thousands, except share data):
Year Ended December 31,
2010 2009 2008
Computation of basic income (loss) per share attributable toCB Richard Ellis Group, Inc. shareholders:
Net income (loss) attributable to CB Richard Ellis Group, Inc.shareholders . . . . . . . . . . . . . . . . . . . . . . . . . . . . . . . . . . . . . . . . $ 200,345 $ 33,341 $ (1,012,066)
Weighted average shares outstanding for basic income (loss) pershare . . . . . . . . . . . . . . . . . . . . . . . . . . . . . . . . . . . . . . . . . . . . . 313,873,439 277,361,783 210,539,032
Basic income (loss) per share attributable to CB Richard EllisGroup, Inc. shareholders . . . . . . . . . . . . . . . . . . . . . . . . . . . . . . $ 0.64 $ 0.12 $ (4.81)
Computation of diluted income (loss) per share attributableto CB Richard Ellis Group, Inc. shareholders:
Net income (loss) attributable to CB Richard Ellis Group, Inc.shareholders . . . . . . . . . . . . . . . . . . . . . . . . . . . . . . . . . . . . . . . . $ 200,345 $ 33,341 $ (1,012,066)
Weighted average shares outstanding for diluted income (loss)per share . . . . . . . . . . . . . . . . . . . . . . . . . . . . . . . . . . . . . . . . . . 313,873,439 277,361,783 210,539,032
Dilutive effect of stock options . . . . . . . . . . . . . . . . . . . . . . . 2,613,345 2,302,046 —Dilutive effect of contingently issuable shares . . . . . . . . . . . 2,530,103 331,252 —
Weighted average shares outstanding for diluted income (loss)per share . . . . . . . . . . . . . . . . . . . . . . . . . . . . . . . . . . . . . . . . . . 319,016,887 279,995,081 210,539,032
Diluted income (loss) per share attributable to CB Richard EllisGroup, Inc. shareholders . . . . . . . . . . . . . . . . . . . . . . . . . . . . . . $ 0.63 $ 0.12 $ (4.81)
For the years ended December 31, 2010 and 2009, options to purchase 115,775 shares and 3,037,573 shares,respectively, of common stock and 112,865 and 1,919,083, respectively, of contingently issuable shares wereexcluded from the computation of diluted earnings per share because their inclusion would have had an anti-dilutive effect. Had we reported net income for the year ended December 31, 2008, options to purchase9,247,579 shares of common stock would have been included in the computation of diluted earnings per share,while options to purchase 3,501,014 shares of common stock would have been excluded from the computation of
120
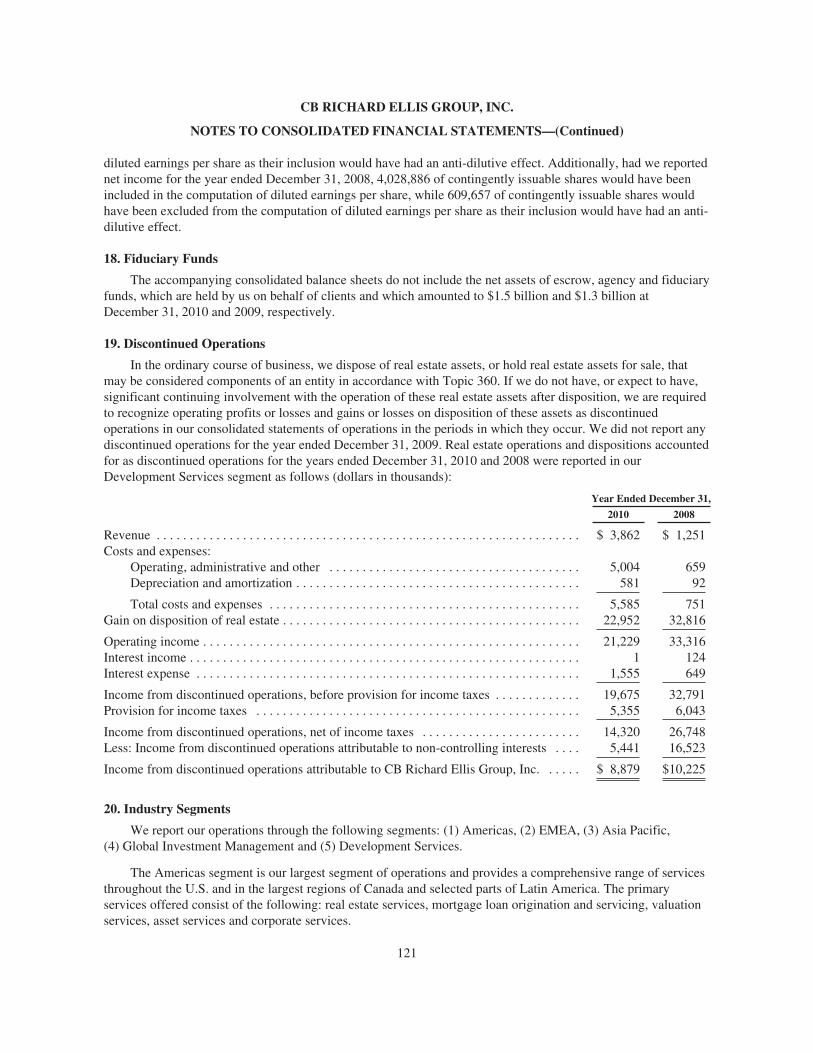
CB RICHARD ELLIS GROUP, INC.
NOTES TO CONSOLIDATED FINANCIAL STATEMENTS—(Continued)
diluted earnings per share as their inclusion would have had an anti-dilutive effect. Additionally, had we reportednet income for the year ended December 31, 2008, 4,028,886 of contingently issuable shares would have beenincluded in the computation of diluted earnings per share, while 609,657 of contingently issuable shares wouldhave been excluded from the computation of diluted earnings per share as their inclusion would have had an anti-dilutive effect.
18. Fiduciary Funds
The accompanying consolidated balance sheets do not include the net assets of escrow, agency and fiduciaryfunds, which are held by us on behalf of clients and which amounted to $1.5 billion and $1.3 billion atDecember 31, 2010 and 2009, respectively.
19. Discontinued Operations
In the ordinary course of business, we dispose of real estate assets, or hold real estate assets for sale, thatmay be considered components of an entity in accordance with Topic 360. If we do not have, or expect to have,significant continuing involvement with the operation of these real estate assets after disposition, we are requiredto recognize operating profits or losses and gains or losses on disposition of these assets as discontinuedoperations in our consolidated statements of operations in the periods in which they occur. We did not report anydiscontinued operations for the year ended December 31, 2009. Real estate operations and dispositions accountedfor as discontinued operations for the years ended December 31, 2010 and 2008 were reported in ourDevelopment Services segment as follows (dollars in thousands):
Year Ended December 31,
2010 2008
Revenue . . . . . . . . . . . . . . . . . . . . . . . . . . . . . . . . . . . . . . . . . . . . . . . . . . . . . . . . . . . . . . . . $ 3,862 $ 1,251Costs and expenses:
Operating, administrative and other . . . . . . . . . . . . . . . . . . . . . . . . . . . . . . . . . . . . . . 5,004 659Depreciation and amortization . . . . . . . . . . . . . . . . . . . . . . . . . . . . . . . . . . . . . . . . . . . 581 92
Total costs and expenses . . . . . . . . . . . . . . . . . . . . . . . . . . . . . . . . . . . . . . . . . . . . . . . 5,585 751Gain on disposition of real estate . . . . . . . . . . . . . . . . . . . . . . . . . . . . . . . . . . . . . . . . . . . . . 22,952 32,816
Operating income . . . . . . . . . . . . . . . . . . . . . . . . . . . . . . . . . . . . . . . . . . . . . . . . . . . . . . . . . 21,229 33,316Interest income . . . . . . . . . . . . . . . . . . . . . . . . . . . . . . . . . . . . . . . . . . . . . . . . . . . . . . . . . . . 1 124Interest expense . . . . . . . . . . . . . . . . . . . . . . . . . . . . . . . . . . . . . . . . . . . . . . . . . . . . . . . . . . 1,555 649
Income from discontinued operations, before provision for income taxes . . . . . . . . . . . . . 19,675 32,791Provision for income taxes . . . . . . . . . . . . . . . . . . . . . . . . . . . . . . . . . . . . . . . . . . . . . . . . . 5,355 6,043
Income from discontinued operations, net of income taxes . . . . . . . . . . . . . . . . . . . . . . . . 14,320 26,748Less: Income from discontinued operations attributable to non-controlling interests . . . . 5,441 16,523
Income from discontinued operations attributable to CB Richard Ellis Group, Inc. . . . . . $ 8,879 $10,225
20. Industry Segments
We report our operations through the following segments: (1) Americas, (2) EMEA, (3) Asia Pacific,(4) Global Investment Management and (5) Development Services.
The Americas segment is our largest segment of operations and provides a comprehensive range of servicesthroughout the U.S. and in the largest regions of Canada and selected parts of Latin America. The primaryservices offered consist of the following: real estate services, mortgage loan origination and servicing, valuationservices, asset services and corporate services.
121
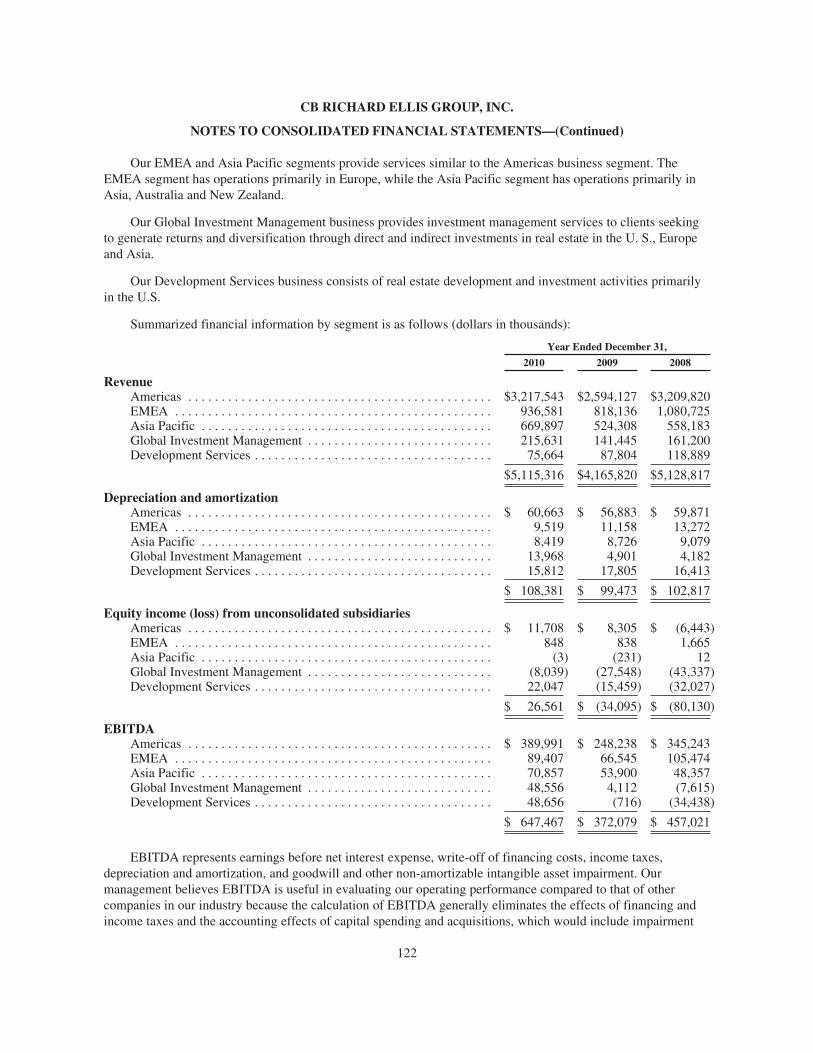
CB RICHARD ELLIS GROUP, INC.
NOTES TO CONSOLIDATED FINANCIAL STATEMENTS—(Continued)
Our EMEA and Asia Pacific segments provide services similar to the Americas business segment. TheEMEA segment has operations primarily in Europe, while the Asia Pacific segment has operations primarily inAsia, Australia and New Zealand.
Our Global Investment Management business provides investment management services to clients seekingto generate returns and diversification through direct and indirect investments in real estate in the U. S., Europeand Asia.
Our Development Services business consists of real estate development and investment activities primarilyin the U.S.
Summarized financial information by segment is as follows (dollars in thousands):
Year Ended December 31,
2010 2009 2008
RevenueAmericas . . . . . . . . . . . . . . . . . . . . . . . . . . . . . . . . . . . . . . . . . . . . . . $3,217,543 $2,594,127 $3,209,820EMEA . . . . . . . . . . . . . . . . . . . . . . . . . . . . . . . . . . . . . . . . . . . . . . . . 936,581 818,136 1,080,725Asia Pacific . . . . . . . . . . . . . . . . . . . . . . . . . . . . . . . . . . . . . . . . . . . . 669,897 524,308 558,183Global Investment Management . . . . . . . . . . . . . . . . . . . . . . . . . . . . 215,631 141,445 161,200Development Services . . . . . . . . . . . . . . . . . . . . . . . . . . . . . . . . . . . . 75,664 87,804 118,889
$5,115,316 $4,165,820 $5,128,817
Depreciation and amortizationAmericas . . . . . . . . . . . . . . . . . . . . . . . . . . . . . . . . . . . . . . . . . . . . . . $ 60,663 $ 56,883 $ 59,871EMEA . . . . . . . . . . . . . . . . . . . . . . . . . . . . . . . . . . . . . . . . . . . . . . . . 9,519 11,158 13,272Asia Pacific . . . . . . . . . . . . . . . . . . . . . . . . . . . . . . . . . . . . . . . . . . . . 8,419 8,726 9,079Global Investment Management . . . . . . . . . . . . . . . . . . . . . . . . . . . . 13,968 4,901 4,182Development Services . . . . . . . . . . . . . . . . . . . . . . . . . . . . . . . . . . . . 15,812 17,805 16,413
$ 108,381 $ 99,473 $ 102,817
Equity income (loss) from unconsolidated subsidiariesAmericas . . . . . . . . . . . . . . . . . . . . . . . . . . . . . . . . . . . . . . . . . . . . . . $ 11,708 $ 8,305 $ (6,443)EMEA . . . . . . . . . . . . . . . . . . . . . . . . . . . . . . . . . . . . . . . . . . . . . . . . 848 838 1,665Asia Pacific . . . . . . . . . . . . . . . . . . . . . . . . . . . . . . . . . . . . . . . . . . . . (3) (231) 12Global Investment Management . . . . . . . . . . . . . . . . . . . . . . . . . . . . (8,039) (27,548) (43,337)Development Services . . . . . . . . . . . . . . . . . . . . . . . . . . . . . . . . . . . . 22,047 (15,459) (32,027)
$ 26,561 $ (34,095) $ (80,130)
EBITDAAmericas . . . . . . . . . . . . . . . . . . . . . . . . . . . . . . . . . . . . . . . . . . . . . . $ 389,991 $ 248,238 $ 345,243EMEA . . . . . . . . . . . . . . . . . . . . . . . . . . . . . . . . . . . . . . . . . . . . . . . . 89,407 66,545 105,474Asia Pacific . . . . . . . . . . . . . . . . . . . . . . . . . . . . . . . . . . . . . . . . . . . . 70,857 53,900 48,357Global Investment Management . . . . . . . . . . . . . . . . . . . . . . . . . . . . 48,556 4,112 (7,615)Development Services . . . . . . . . . . . . . . . . . . . . . . . . . . . . . . . . . . . . 48,656 (716) (34,438)
$ 647,467 $ 372,079 $ 457,021
EBITDA represents earnings before net interest expense, write-off of financing costs, income taxes,depreciation and amortization, and goodwill and other non-amortizable intangible asset impairment. Ourmanagement believes EBITDA is useful in evaluating our operating performance compared to that of othercompanies in our industry because the calculation of EBITDA generally eliminates the effects of financing andincome taxes and the accounting effects of capital spending and acquisitions, which would include impairment
122
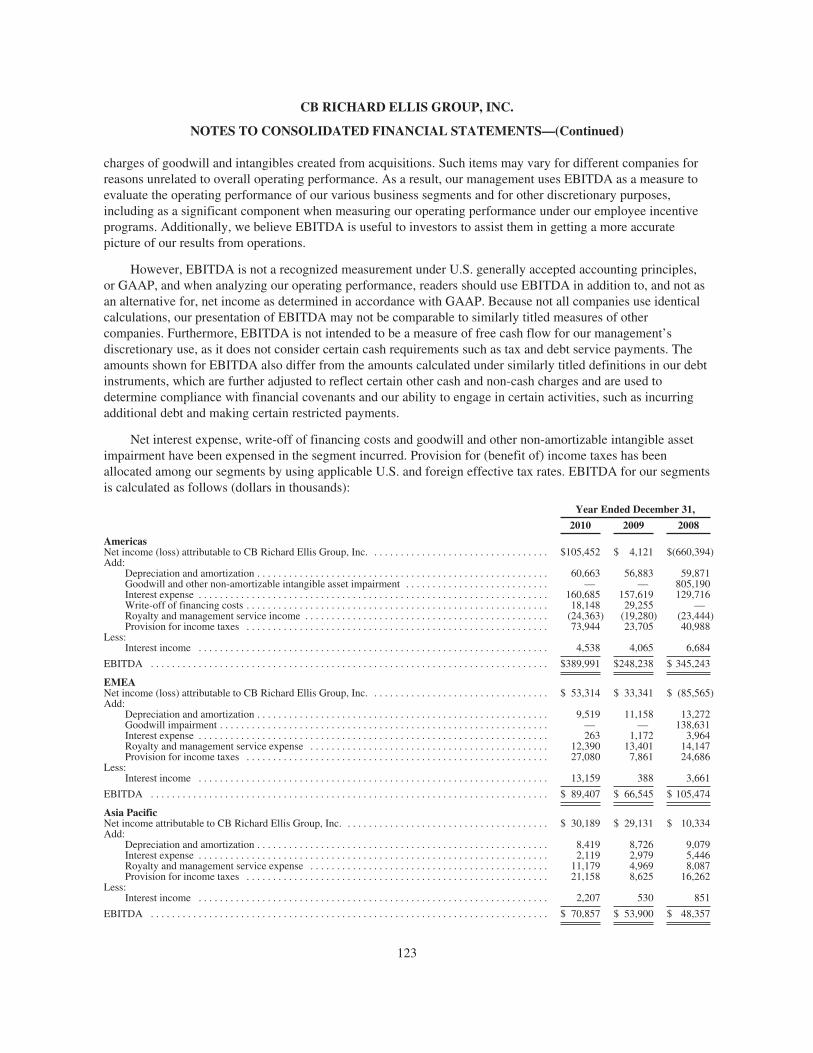
CB RICHARD ELLIS GROUP, INC.
NOTES TO CONSOLIDATED FINANCIAL STATEMENTS—(Continued)
charges of goodwill and intangibles created from acquisitions. Such items may vary for different companies forreasons unrelated to overall operating performance. As a result, our management uses EBITDA as a measure toevaluate the operating performance of our various business segments and for other discretionary purposes,including as a significant component when measuring our operating performance under our employee incentiveprograms. Additionally, we believe EBITDA is useful to investors to assist them in getting a more accuratepicture of our results from operations.
However, EBITDA is not a recognized measurement under U.S. generally accepted accounting principles,or GAAP, and when analyzing our operating performance, readers should use EBITDA in addition to, and not asan alternative for, net income as determined in accordance with GAAP. Because not all companies use identicalcalculations, our presentation of EBITDA may not be comparable to similarly titled measures of othercompanies. Furthermore, EBITDA is not intended to be a measure of free cash flow for our management’sdiscretionary use, as it does not consider certain cash requirements such as tax and debt service payments. Theamounts shown for EBITDA also differ from the amounts calculated under similarly titled definitions in our debtinstruments, which are further adjusted to reflect certain other cash and non-cash charges and are used todetermine compliance with financial covenants and our ability to engage in certain activities, such as incurringadditional debt and making certain restricted payments.
Net interest expense, write-off of financing costs and goodwill and other non-amortizable intangible assetimpairment have been expensed in the segment incurred. Provision for (benefit of) income taxes has beenallocated among our segments by using applicable U.S. and foreign effective tax rates. EBITDA for our segmentsis calculated as follows (dollars in thousands):
Year Ended December 31,
2010 2009 2008
AmericasNet income (loss) attributable to CB Richard Ellis Group, Inc. . . . . . . . . . . . . . . . . . . . . . . . . . . . . . . . . . $105,452 $ 4,121 $(660,394)Add:
Depreciation and amortization . . . . . . . . . . . . . . . . . . . . . . . . . . . . . . . . . . . . . . . . . . . . . . . . . . . . . . . 60,663 56,883 59,871Goodwill and other non-amortizable intangible asset impairment . . . . . . . . . . . . . . . . . . . . . . . . . . . — — 805,190Interest expense . . . . . . . . . . . . . . . . . . . . . . . . . . . . . . . . . . . . . . . . . . . . . . . . . . . . . . . . . . . . . . . . . . 160,685 157,619 129,716Write-off of financing costs . . . . . . . . . . . . . . . . . . . . . . . . . . . . . . . . . . . . . . . . . . . . . . . . . . . . . . . . . 18,148 29,255 —Royalty and management service income . . . . . . . . . . . . . . . . . . . . . . . . . . . . . . . . . . . . . . . . . . . . . . (24,363) (19,280) (23,444)Provision for income taxes . . . . . . . . . . . . . . . . . . . . . . . . . . . . . . . . . . . . . . . . . . . . . . . . . . . . . . . . . 73,944 23,705 40,988
Less:Interest income . . . . . . . . . . . . . . . . . . . . . . . . . . . . . . . . . . . . . . . . . . . . . . . . . . . . . . . . . . . . . . . . . . 4,538 4,065 6,684
EBITDA . . . . . . . . . . . . . . . . . . . . . . . . . . . . . . . . . . . . . . . . . . . . . . . . . . . . . . . . . . . . . . . . . . . . . . . . . . . $389,991 $248,238 $ 345,243
EMEANet income (loss) attributable to CB Richard Ellis Group, Inc. . . . . . . . . . . . . . . . . . . . . . . . . . . . . . . . . . $ 53,314 $ 33,341 $ (85,565)Add:
Depreciation and amortization . . . . . . . . . . . . . . . . . . . . . . . . . . . . . . . . . . . . . . . . . . . . . . . . . . . . . . . 9,519 11,158 13,272Goodwill impairment . . . . . . . . . . . . . . . . . . . . . . . . . . . . . . . . . . . . . . . . . . . . . . . . . . . . . . . . . . . . . . — — 138,631Interest expense . . . . . . . . . . . . . . . . . . . . . . . . . . . . . . . . . . . . . . . . . . . . . . . . . . . . . . . . . . . . . . . . . . 263 1,172 3,964Royalty and management service expense . . . . . . . . . . . . . . . . . . . . . . . . . . . . . . . . . . . . . . . . . . . . . 12,390 13,401 14,147Provision for income taxes . . . . . . . . . . . . . . . . . . . . . . . . . . . . . . . . . . . . . . . . . . . . . . . . . . . . . . . . . 27,080 7,861 24,686
Less:Interest income . . . . . . . . . . . . . . . . . . . . . . . . . . . . . . . . . . . . . . . . . . . . . . . . . . . . . . . . . . . . . . . . . . 13,159 388 3,661
EBITDA . . . . . . . . . . . . . . . . . . . . . . . . . . . . . . . . . . . . . . . . . . . . . . . . . . . . . . . . . . . . . . . . . . . . . . . . . . . $ 89,407 $ 66,545 $ 105,474
Asia PacificNet income attributable to CB Richard Ellis Group, Inc. . . . . . . . . . . . . . . . . . . . . . . . . . . . . . . . . . . . . . . $ 30,189 $ 29,131 $ 10,334Add:
Depreciation and amortization . . . . . . . . . . . . . . . . . . . . . . . . . . . . . . . . . . . . . . . . . . . . . . . . . . . . . . . 8,419 8,726 9,079Interest expense . . . . . . . . . . . . . . . . . . . . . . . . . . . . . . . . . . . . . . . . . . . . . . . . . . . . . . . . . . . . . . . . . . 2,119 2,979 5,446Royalty and management service expense . . . . . . . . . . . . . . . . . . . . . . . . . . . . . . . . . . . . . . . . . . . . . 11,179 4,969 8,087Provision for income taxes . . . . . . . . . . . . . . . . . . . . . . . . . . . . . . . . . . . . . . . . . . . . . . . . . . . . . . . . . 21,158 8,625 16,262
Less:Interest income . . . . . . . . . . . . . . . . . . . . . . . . . . . . . . . . . . . . . . . . . . . . . . . . . . . . . . . . . . . . . . . . . . 2,207 530 851
EBITDA . . . . . . . . . . . . . . . . . . . . . . . . . . . . . . . . . . . . . . . . . . . . . . . . . . . . . . . . . . . . . . . . . . . . . . . . . . . $ 70,857 $ 53,900 $ 48,357
123
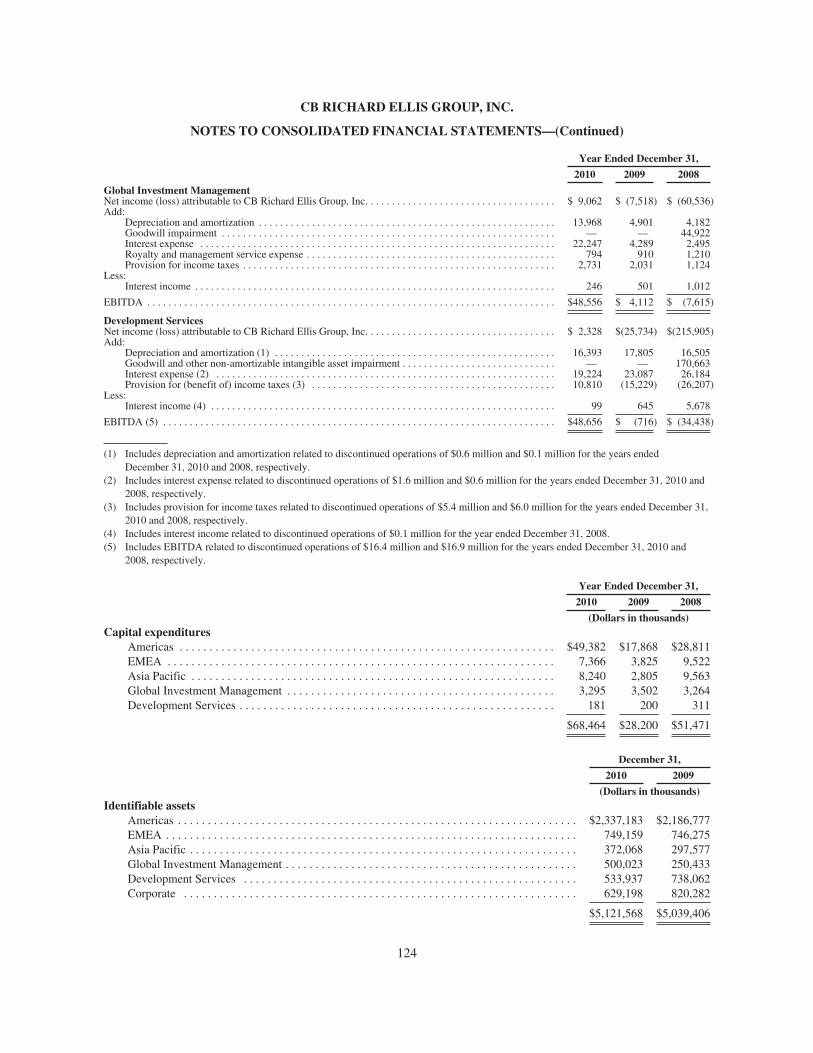
CB RICHARD ELLIS GROUP, INC.
NOTES TO CONSOLIDATED FINANCIAL STATEMENTS—(Continued)
Year Ended December 31,
2010 2009 2008
Global Investment ManagementNet income (loss) attributable to CB Richard Ellis Group, Inc. . . . . . . . . . . . . . . . . . . . . . . . . . . . . . . . . . . . $ 9,062 $ (7,518) $ (60,536)Add:
Depreciation and amortization . . . . . . . . . . . . . . . . . . . . . . . . . . . . . . . . . . . . . . . . . . . . . . . . . . . . . . . . 13,968 4,901 4,182Goodwill impairment . . . . . . . . . . . . . . . . . . . . . . . . . . . . . . . . . . . . . . . . . . . . . . . . . . . . . . . . . . . . . . . — — 44,922Interest expense . . . . . . . . . . . . . . . . . . . . . . . . . . . . . . . . . . . . . . . . . . . . . . . . . . . . . . . . . . . . . . . . . . . 22,247 4,289 2,495Royalty and management service expense . . . . . . . . . . . . . . . . . . . . . . . . . . . . . . . . . . . . . . . . . . . . . . . 794 910 1,210Provision for income taxes . . . . . . . . . . . . . . . . . . . . . . . . . . . . . . . . . . . . . . . . . . . . . . . . . . . . . . . . . . . 2,731 2,031 1,124
Less:Interest income . . . . . . . . . . . . . . . . . . . . . . . . . . . . . . . . . . . . . . . . . . . . . . . . . . . . . . . . . . . . . . . . . . . . 246 501 1,012
EBITDA . . . . . . . . . . . . . . . . . . . . . . . . . . . . . . . . . . . . . . . . . . . . . . . . . . . . . . . . . . . . . . . . . . . . . . . . . . . . . $48,556 $ 4,112 $ (7,615)
Development ServicesNet income (loss) attributable to CB Richard Ellis Group, Inc. . . . . . . . . . . . . . . . . . . . . . . . . . . . . . . . . . . . $ 2,328 $(25,734) $(215,905)Add:
Depreciation and amortization (1) . . . . . . . . . . . . . . . . . . . . . . . . . . . . . . . . . . . . . . . . . . . . . . . . . . . . . 16,393 17,805 16,505Goodwill and other non-amortizable intangible asset impairment . . . . . . . . . . . . . . . . . . . . . . . . . . . . . — — 170,663Interest expense (2) . . . . . . . . . . . . . . . . . . . . . . . . . . . . . . . . . . . . . . . . . . . . . . . . . . . . . . . . . . . . . . . . 19,224 23,087 26,184Provision for (benefit of) income taxes (3) . . . . . . . . . . . . . . . . . . . . . . . . . . . . . . . . . . . . . . . . . . . . . . 10,810 (15,229) (26,207)
Less:Interest income (4) . . . . . . . . . . . . . . . . . . . . . . . . . . . . . . . . . . . . . . . . . . . . . . . . . . . . . . . . . . . . . . . . . 99 645 5,678
EBITDA (5) . . . . . . . . . . . . . . . . . . . . . . . . . . . . . . . . . . . . . . . . . . . . . . . . . . . . . . . . . . . . . . . . . . . . . . . . . . $48,656 $ (716) $ (34,438)
(1) Includes depreciation and amortization related to discontinued operations of $0.6 million and $0.1 million for the years endedDecember 31, 2010 and 2008, respectively.
(2) Includes interest expense related to discontinued operations of $1.6 million and $0.6 million for the years ended December 31, 2010 and2008, respectively.
(3) Includes provision for income taxes related to discontinued operations of $5.4 million and $6.0 million for the years ended December 31,2010 and 2008, respectively.
(4) Includes interest income related to discontinued operations of $0.1 million for the year ended December 31, 2008.(5) Includes EBITDA related to discontinued operations of $16.4 million and $16.9 million for the years ended December 31, 2010 and
2008, respectively.
Year Ended December 31,
2010 2009 2008
(Dollars in thousands)Capital expenditures
Americas . . . . . . . . . . . . . . . . . . . . . . . . . . . . . . . . . . . . . . . . . . . . . . . . . . . . . . . . . . . . . . . $49,382 $17,868 $28,811EMEA . . . . . . . . . . . . . . . . . . . . . . . . . . . . . . . . . . . . . . . . . . . . . . . . . . . . . . . . . . . . . . . . . 7,366 3,825 9,522Asia Pacific . . . . . . . . . . . . . . . . . . . . . . . . . . . . . . . . . . . . . . . . . . . . . . . . . . . . . . . . . . . . . 8,240 2,805 9,563Global Investment Management . . . . . . . . . . . . . . . . . . . . . . . . . . . . . . . . . . . . . . . . . . . . . 3,295 3,502 3,264Development Services . . . . . . . . . . . . . . . . . . . . . . . . . . . . . . . . . . . . . . . . . . . . . . . . . . . . . 181 200 311
$68,464 $28,200 $51,471
December 31,
2010 2009
(Dollars in thousands)Identifiable assets
Americas . . . . . . . . . . . . . . . . . . . . . . . . . . . . . . . . . . . . . . . . . . . . . . . . . . . . . . . . . . . . . . . . . . . $2,337,183 $2,186,777EMEA . . . . . . . . . . . . . . . . . . . . . . . . . . . . . . . . . . . . . . . . . . . . . . . . . . . . . . . . . . . . . . . . . . . . . 749,159 746,275Asia Pacific . . . . . . . . . . . . . . . . . . . . . . . . . . . . . . . . . . . . . . . . . . . . . . . . . . . . . . . . . . . . . . . . . 372,068 297,577Global Investment Management . . . . . . . . . . . . . . . . . . . . . . . . . . . . . . . . . . . . . . . . . . . . . . . . . 500,023 250,433Development Services . . . . . . . . . . . . . . . . . . . . . . . . . . . . . . . . . . . . . . . . . . . . . . . . . . . . . . . . 533,937 738,062Corporate . . . . . . . . . . . . . . . . . . . . . . . . . . . . . . . . . . . . . . . . . . . . . . . . . . . . . . . . . . . . . . . . . . 629,198 820,282
$5,121,568 $5,039,406
124
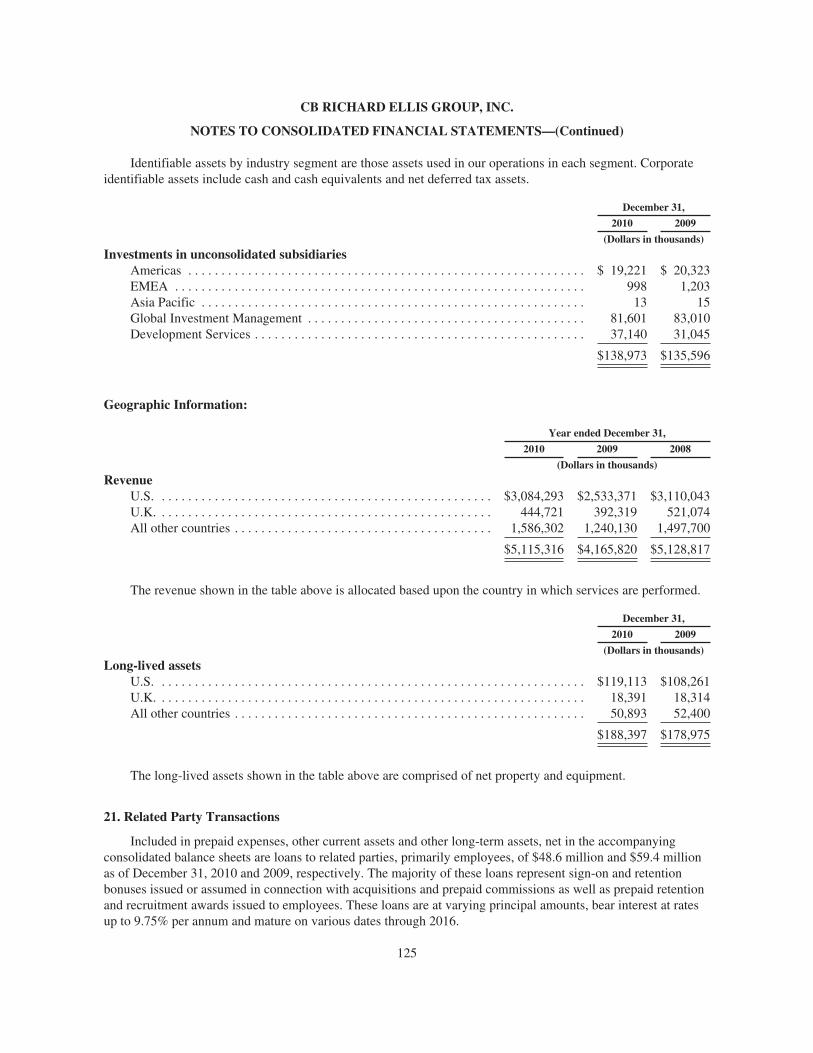
CB RICHARD ELLIS GROUP, INC.
NOTES TO CONSOLIDATED FINANCIAL STATEMENTS—(Continued)
Identifiable assets by industry segment are those assets used in our operations in each segment. Corporateidentifiable assets include cash and cash equivalents and net deferred tax assets.
December 31,
2010 2009
(Dollars in thousands)
Investments in unconsolidated subsidiariesAmericas . . . . . . . . . . . . . . . . . . . . . . . . . . . . . . . . . . . . . . . . . . . . . . . . . . . . . . . . . . . . $ 19,221 $ 20,323EMEA . . . . . . . . . . . . . . . . . . . . . . . . . . . . . . . . . . . . . . . . . . . . . . . . . . . . . . . . . . . . . . 998 1,203Asia Pacific . . . . . . . . . . . . . . . . . . . . . . . . . . . . . . . . . . . . . . . . . . . . . . . . . . . . . . . . . . 13 15Global Investment Management . . . . . . . . . . . . . . . . . . . . . . . . . . . . . . . . . . . . . . . . . . 81,601 83,010Development Services . . . . . . . . . . . . . . . . . . . . . . . . . . . . . . . . . . . . . . . . . . . . . . . . . . 37,140 31,045
$138,973 $135,596
Geographic Information:
Year ended December 31,
2010 2009 2008
(Dollars in thousands)
RevenueU.S. . . . . . . . . . . . . . . . . . . . . . . . . . . . . . . . . . . . . . . . . . . . . . . . . . . $3,084,293 $2,533,371 $3,110,043U.K. . . . . . . . . . . . . . . . . . . . . . . . . . . . . . . . . . . . . . . . . . . . . . . . . . . 444,721 392,319 521,074All other countries . . . . . . . . . . . . . . . . . . . . . . . . . . . . . . . . . . . . . . . 1,586,302 1,240,130 1,497,700
$5,115,316 $4,165,820 $5,128,817
The revenue shown in the table above is allocated based upon the country in which services are performed.
December 31,
2010 2009
(Dollars in thousands)
Long-lived assetsU.S. . . . . . . . . . . . . . . . . . . . . . . . . . . . . . . . . . . . . . . . . . . . . . . . . . . . . . . . . . . . . . . . . $119,113 $108,261U.K. . . . . . . . . . . . . . . . . . . . . . . . . . . . . . . . . . . . . . . . . . . . . . . . . . . . . . . . . . . . . . . . . 18,391 18,314All other countries . . . . . . . . . . . . . . . . . . . . . . . . . . . . . . . . . . . . . . . . . . . . . . . . . . . . . 50,893 52,400
$188,397 $178,975
The long-lived assets shown in the table above are comprised of net property and equipment.
21. Related Party Transactions
Included in prepaid expenses, other current assets and other long-term assets, net in the accompanyingconsolidated balance sheets are loans to related parties, primarily employees, of $48.6 million and $59.4 millionas of December 31, 2010 and 2009, respectively. The majority of these loans represent sign-on and retentionbonuses issued or assumed in connection with acquisitions and prepaid commissions as well as prepaid retentionand recruitment awards issued to employees. These loans are at varying principal amounts, bear interest at ratesup to 9.75% per annum and mature on various dates through 2016.
125
CB RICHARD ELLIS GROUP, INC.
NOTES TO CONSOLIDATED FINANCIAL STATEMENTS—(Continued)
Bob Sulentic, an executive officer, has committed to invest a minimum of $0.8 million in Trammell CrowCompany Acquisitions I, L.P., and Acquisitions II (through pooled co-investment vehicles organized for theinvestment of certain employees). As of December 31, 2010, Mr. Sulentic had funded $0.7 million of hiscommitment in these investments. These funds are closed-end real estate investment funds managed andsponsored by our subsidiary, Trammell Crow Company. These investments have been approved by our board ofdirectors, including all of the disinterested members.
22. Guarantor and Nonguarantor Financial Statements
The following condensed consolidating financial information includes:
(1) Condensed consolidating balance sheets as of December 31, 2010 and 2009; condensedconsolidating statements of operations for the years ended December 31, 2010, 2009 and 2008; andcondensed consolidating statements of cash flows for the years ended December 31, 2010, 2009 and 2008,of (a) CB Richard Ellis Group, Inc. as the parent, (b) CBRE as the subsidiary issuer, (c) the guarantorsubsidiaries, (d) the nonguarantor subsidiaries and (e) CB Richard Ellis Group, Inc. on a consolidated basis;and
(2) Elimination entries necessary to consolidate CB Richard Ellis Group, Inc. as the parent, with CBREand its guarantor and nonguarantor subsidiaries.
Investments in consolidated subsidiaries are presented using the equity method of accounting. The principalelimination entries eliminate investments in consolidated subsidiaries and inter-company balances andtransactions.
126
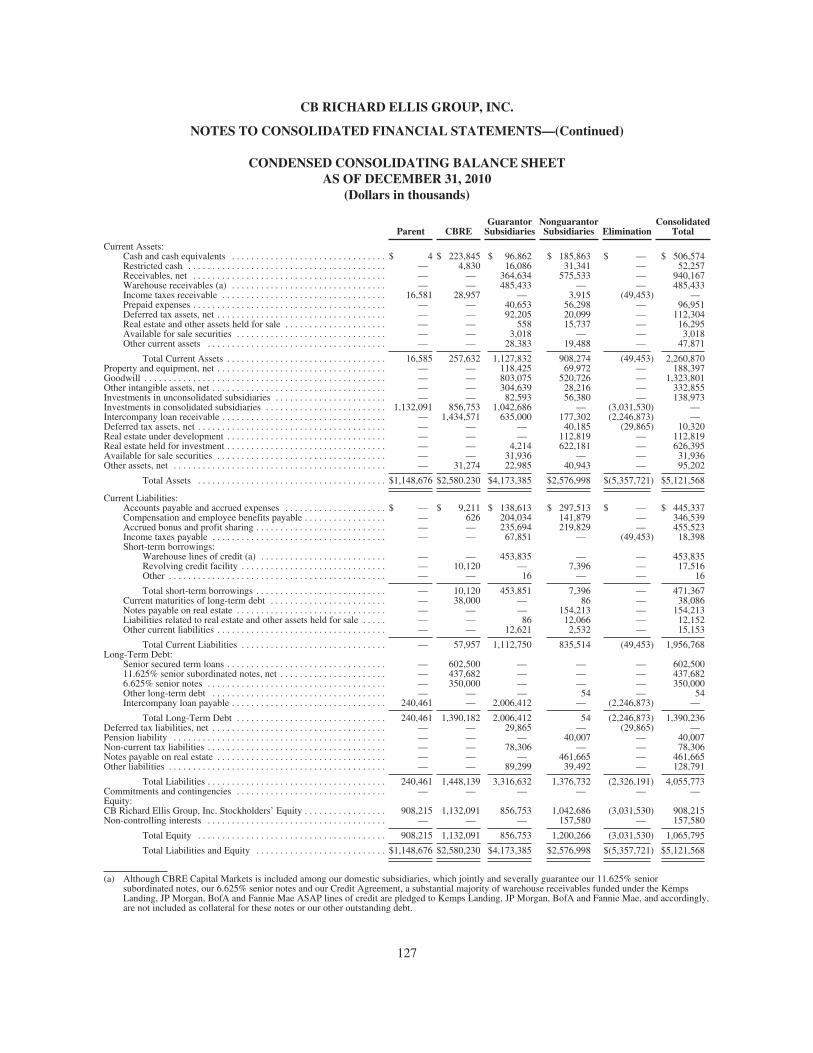
CB RICHARD ELLIS GROUP, INC.
NOTES TO CONSOLIDATED FINANCIAL STATEMENTS—(Continued)
CONDENSED CONSOLIDATING BALANCE SHEETAS OF DECEMBER 31, 2010
(Dollars in thousands)
Parent CBREGuarantor
SubsidiariesNonguarantorSubsidiaries Elimination
ConsolidatedTotal
Current Assets:Cash and cash equivalents . . . . . . . . . . . . . . . . . . . . . . . . . . . . . . . . $ 4 $ 223,845 $ 96,862 $ 185,863 $ — $ 506,574Restricted cash . . . . . . . . . . . . . . . . . . . . . . . . . . . . . . . . . . . . . . . . . — 4,830 16,086 31,341 — 52,257Receivables, net . . . . . . . . . . . . . . . . . . . . . . . . . . . . . . . . . . . . . . . . — — 364,634 575,533 — 940,167Warehouse receivables (a) . . . . . . . . . . . . . . . . . . . . . . . . . . . . . . . . — — 485,433 — — 485,433Income taxes receivable . . . . . . . . . . . . . . . . . . . . . . . . . . . . . . . . . . 16,581 28,957 — 3,915 (49,453) —Prepaid expenses . . . . . . . . . . . . . . . . . . . . . . . . . . . . . . . . . . . . . . . . — — 40,653 56,298 — 96,951Deferred tax assets, net . . . . . . . . . . . . . . . . . . . . . . . . . . . . . . . . . . . — — 92,205 20,099 — 112,304Real estate and other assets held for sale . . . . . . . . . . . . . . . . . . . . . — — 558 15,737 — 16,295Available for sale securities . . . . . . . . . . . . . . . . . . . . . . . . . . . . . . . — — 3,018 — — 3,018Other current assets . . . . . . . . . . . . . . . . . . . . . . . . . . . . . . . . . . . . . — — 28,383 19,488 — 47,871
Total Current Assets . . . . . . . . . . . . . . . . . . . . . . . . . . . . . . . . . 16,585 257,632 1,127,832 908,274 (49,453) 2,260,870Property and equipment, net . . . . . . . . . . . . . . . . . . . . . . . . . . . . . . . . . . . — — 118,425 69,972 — 188,397Goodwill . . . . . . . . . . . . . . . . . . . . . . . . . . . . . . . . . . . . . . . . . . . . . . . . . . — — 803,075 520,726 — 1,323,801Other intangible assets, net . . . . . . . . . . . . . . . . . . . . . . . . . . . . . . . . . . . . — — 304,639 28,216 — 332,855Investments in unconsolidated subsidiaries . . . . . . . . . . . . . . . . . . . . . . . — — 82,593 56,380 — 138,973Investments in consolidated subsidiaries . . . . . . . . . . . . . . . . . . . . . . . . . 1,132,091 856,753 1,042,686 — (3,031,530) —Intercompany loan receivable . . . . . . . . . . . . . . . . . . . . . . . . . . . . . . . . . . — 1,434,571 635,000 177,302 (2,246,873) —Deferred tax assets, net . . . . . . . . . . . . . . . . . . . . . . . . . . . . . . . . . . . . . . . — — — 40,185 (29,865) 10,320Real estate under development . . . . . . . . . . . . . . . . . . . . . . . . . . . . . . . . . — — — 112,819 — 112,819Real estate held for investment . . . . . . . . . . . . . . . . . . . . . . . . . . . . . . . . . — — 4,214 622,181 — 626,395Available for sale securities . . . . . . . . . . . . . . . . . . . . . . . . . . . . . . . . . . . — — 31,936 — — 31,936Other assets, net . . . . . . . . . . . . . . . . . . . . . . . . . . . . . . . . . . . . . . . . . . . . — 31,274 22,985 40,943 — 95,202
Total Assets . . . . . . . . . . . . . . . . . . . . . . . . . . . . . . . . . . . . . . . $1,148,676 $2,580.230 $4,173,385 $2,576,998 $(5,357,721) $5,121,568
Current Liabilities:Accounts payable and accrued expenses . . . . . . . . . . . . . . . . . . . . . $ — $ 9,211 $ 138,613 $ 297,513 $ — $ 445,337Compensation and employee benefits payable . . . . . . . . . . . . . . . . . — 626 204,034 141,879 — 346,539Accrued bonus and profit sharing . . . . . . . . . . . . . . . . . . . . . . . . . . . — — 235,694 219,829 — 455,523Income taxes payable . . . . . . . . . . . . . . . . . . . . . . . . . . . . . . . . . . . . — — 67,851 — (49,453) 18,398Short-term borrowings:
Warehouse lines of credit (a) . . . . . . . . . . . . . . . . . . . . . . . . . . — — 453,835 — — 453,835Revolving credit facility . . . . . . . . . . . . . . . . . . . . . . . . . . . . . . — 10,120 — 7,396 — 17,516Other . . . . . . . . . . . . . . . . . . . . . . . . . . . . . . . . . . . . . . . . . . . . . — — 16 — — 16
Total short-term borrowings . . . . . . . . . . . . . . . . . . . . . . . . . . . — 10,120 453,851 7,396 — 471,367Current maturities of long-term debt . . . . . . . . . . . . . . . . . . . . . . . . — 38,000 — 86 — 38,086Notes payable on real estate . . . . . . . . . . . . . . . . . . . . . . . . . . . . . . . — — — 154,213 — 154,213Liabilities related to real estate and other assets held for sale . . . . . — — 86 12,066 — 12,152Other current liabilities . . . . . . . . . . . . . . . . . . . . . . . . . . . . . . . . . . . — — 12,621 2,532 — 15,153
Total Current Liabilities . . . . . . . . . . . . . . . . . . . . . . . . . . . . . . — 57,957 1,112,750 835,514 (49,453) 1,956,768Long-Term Debt:
Senior secured term loans . . . . . . . . . . . . . . . . . . . . . . . . . . . . . . . . . — 602,500 — — — 602,50011.625% senior subordinated notes, net . . . . . . . . . . . . . . . . . . . . . . — 437,682 — — — 437,6826.625% senior notes . . . . . . . . . . . . . . . . . . . . . . . . . . . . . . . . . . . . . — 350,000 — — — 350,000Other long-term debt . . . . . . . . . . . . . . . . . . . . . . . . . . . . . . . . . . . . — — — 54 — 54Intercompany loan payable . . . . . . . . . . . . . . . . . . . . . . . . . . . . . . . . 240,461 — 2,006,412 — (2,246,873) —
Total Long-Term Debt . . . . . . . . . . . . . . . . . . . . . . . . . . . . . . . 240,461 1,390,182 2,006,412 54 (2,246,873) 1,390,236Deferred tax liabilities, net . . . . . . . . . . . . . . . . . . . . . . . . . . . . . . . . . . . . — — 29,865 — (29,865) —Pension liability . . . . . . . . . . . . . . . . . . . . . . . . . . . . . . . . . . . . . . . . . . . . — — — 40,007 — 40,007Non-current tax liabilities . . . . . . . . . . . . . . . . . . . . . . . . . . . . . . . . . . . . . — — 78,306 — — 78,306Notes payable on real estate . . . . . . . . . . . . . . . . . . . . . . . . . . . . . . . . . . . — — — 461,665 — 461,665Other liabilities . . . . . . . . . . . . . . . . . . . . . . . . . . . . . . . . . . . . . . . . . . . . . — — 89,299 39,492 — 128,791
Total Liabilities . . . . . . . . . . . . . . . . . . . . . . . . . . . . . . . . . . . . . 240,461 1,448,139 3,316,632 1,376,732 (2,326,191) 4,055,773Commitments and contingencies . . . . . . . . . . . . . . . . . . . . . . . . . . . . . . . — — — — — —Equity:CB Richard Ellis Group, Inc. Stockholders’ Equity . . . . . . . . . . . . . . . . . 908,215 1,132,091 856,753 1,042,686 (3,031,530) 908,215Non-controlling interests . . . . . . . . . . . . . . . . . . . . . . . . . . . . . . . . . . . . . — — — 157,580 — 157,580
Total Equity . . . . . . . . . . . . . . . . . . . . . . . . . . . . . . . . . . . . . . . 908,215 1,132,091 856,753 1,200,266 (3,031,530) 1,065,795
Total Liabilities and Equity . . . . . . . . . . . . . . . . . . . . . . . . . . . $1,148,676 $2,580,230 $4,173,385 $2,576,998 $(5,357,721) $5,121,568
(a) Although CBRE Capital Markets is included among our domestic subsidiaries, which jointly and severally guarantee our 11.625% seniorsubordinated notes, our 6.625% senior notes and our Credit Agreement, a substantial majority of warehouse receivables funded under the KempsLanding, JP Morgan, BofA and Fannie Mae ASAP lines of credit are pledged to Kemps Landing, JP Morgan, BofA and Fannie Mae, and accordingly,are not included as collateral for these notes or our other outstanding debt.
127
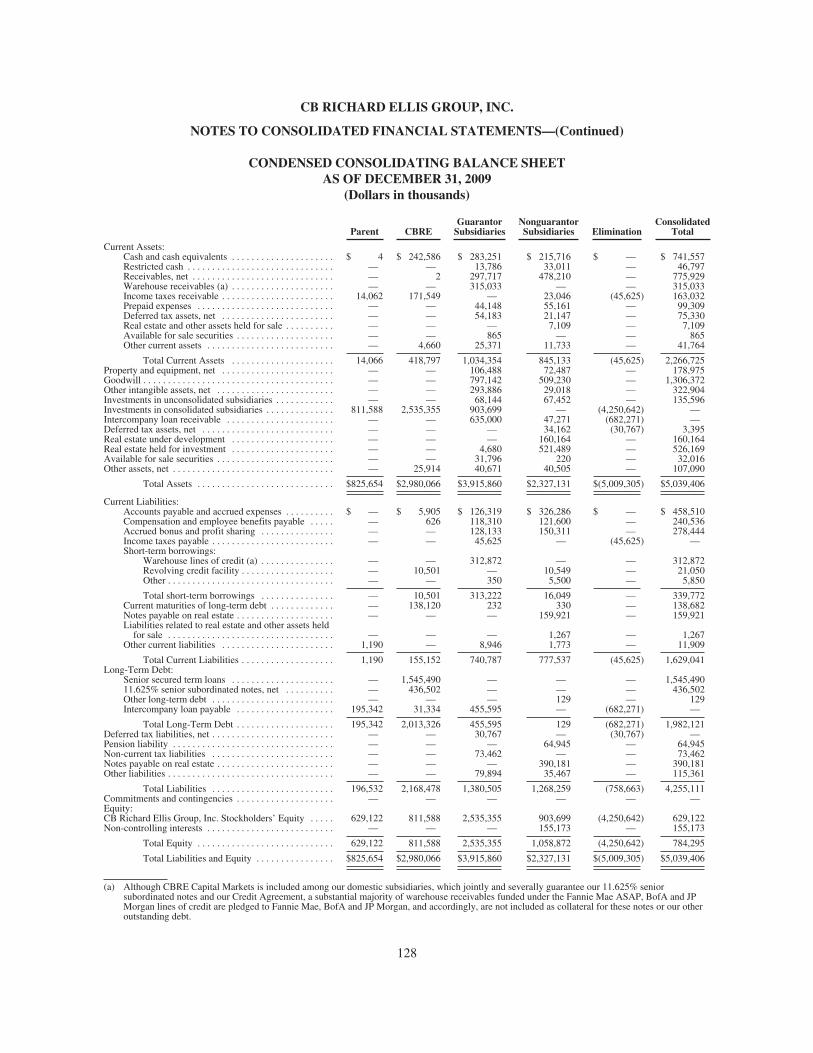
CB RICHARD ELLIS GROUP, INC.
NOTES TO CONSOLIDATED FINANCIAL STATEMENTS—(Continued)
CONDENSED CONSOLIDATING BALANCE SHEETAS OF DECEMBER 31, 2009
(Dollars in thousands)
Parent CBREGuarantor
SubsidiariesNonguarantorSubsidiaries Elimination
ConsolidatedTotal
Current Assets:Cash and cash equivalents . . . . . . . . . . . . . . . . . . . . . $ 4 $ 242,586 $ 283,251 $ 215,716 $ — $ 741,557Restricted cash . . . . . . . . . . . . . . . . . . . . . . . . . . . . . . — — 13,786 33,011 — 46,797Receivables, net . . . . . . . . . . . . . . . . . . . . . . . . . . . . . — 2 297,717 478,210 — 775,929Warehouse receivables (a) . . . . . . . . . . . . . . . . . . . . . — — 315,033 — — 315,033Income taxes receivable . . . . . . . . . . . . . . . . . . . . . . . 14,062 171,549 — 23,046 (45,625) 163,032Prepaid expenses . . . . . . . . . . . . . . . . . . . . . . . . . . . . — — 44,148 55,161 — 99,309Deferred tax assets, net . . . . . . . . . . . . . . . . . . . . . . . — — 54,183 21,147 — 75,330Real estate and other assets held for sale . . . . . . . . . . — — — 7,109 — 7,109Available for sale securities . . . . . . . . . . . . . . . . . . . . — — 865 — — 865Other current assets . . . . . . . . . . . . . . . . . . . . . . . . . . — 4,660 25,371 11,733 — 41,764
Total Current Assets . . . . . . . . . . . . . . . . . . . . . 14,066 418,797 1,034,354 845,133 (45,625) 2,266,725Property and equipment, net . . . . . . . . . . . . . . . . . . . . . . . — — 106,488 72,487 — 178,975Goodwill . . . . . . . . . . . . . . . . . . . . . . . . . . . . . . . . . . . . . . . — — 797,142 509,230 — 1,306,372Other intangible assets, net . . . . . . . . . . . . . . . . . . . . . . . . — — 293,886 29,018 — 322,904Investments in unconsolidated subsidiaries . . . . . . . . . . . . — — 68,144 67,452 — 135,596Investments in consolidated subsidiaries . . . . . . . . . . . . . . 811,588 2,535,355 903,699 — (4,250,642) —Intercompany loan receivable . . . . . . . . . . . . . . . . . . . . . . — — 635,000 47,271 (682,271) —Deferred tax assets, net . . . . . . . . . . . . . . . . . . . . . . . . . . . — — — 34,162 (30,767) 3,395Real estate under development . . . . . . . . . . . . . . . . . . . . . — — — 160,164 — 160,164Real estate held for investment . . . . . . . . . . . . . . . . . . . . . — — 4,680 521,489 — 526,169Available for sale securities . . . . . . . . . . . . . . . . . . . . . . . . — — 31,796 220 — 32,016Other assets, net . . . . . . . . . . . . . . . . . . . . . . . . . . . . . . . . . — 25,914 40,671 40,505 — 107,090
Total Assets . . . . . . . . . . . . . . . . . . . . . . . . . . . . $825,654 $2,980,066 $3,915,860 $2,327,131 $(5,009,305) $5,039,406
Current Liabilities:Accounts payable and accrued expenses . . . . . . . . . . $ — $ 5,905 $ 126,319 $ 326,286 $ — $ 458,510Compensation and employee benefits payable . . . . . — 626 118,310 121,600 — 240,536Accrued bonus and profit sharing . . . . . . . . . . . . . . . — — 128,133 150,311 — 278,444Income taxes payable . . . . . . . . . . . . . . . . . . . . . . . . . — — 45,625 — (45,625) —Short-term borrowings:
Warehouse lines of credit (a) . . . . . . . . . . . . . . . — — 312,872 — — 312,872Revolving credit facility . . . . . . . . . . . . . . . . . . . — 10,501 — 10,549 — 21,050Other . . . . . . . . . . . . . . . . . . . . . . . . . . . . . . . . . . — — 350 5,500 — 5,850
Total short-term borrowings . . . . . . . . . . . . . . . — 10,501 313,222 16,049 — 339,772Current maturities of long-term debt . . . . . . . . . . . . . — 138,120 232 330 — 138,682Notes payable on real estate . . . . . . . . . . . . . . . . . . . . — — — 159,921 — 159,921Liabilities related to real estate and other assets held
for sale . . . . . . . . . . . . . . . . . . . . . . . . . . . . . . . . . . — — — 1,267 — 1,267Other current liabilities . . . . . . . . . . . . . . . . . . . . . . . 1,190 — 8,946 1,773 — 11,909
Total Current Liabilities . . . . . . . . . . . . . . . . . . . 1,190 155,152 740,787 777,537 (45,625) 1,629,041Long-Term Debt:
Senior secured term loans . . . . . . . . . . . . . . . . . . . . . — 1,545,490 — — — 1,545,49011.625% senior subordinated notes, net . . . . . . . . . . — 436,502 — — — 436,502Other long-term debt . . . . . . . . . . . . . . . . . . . . . . . . . — — — 129 — 129Intercompany loan payable . . . . . . . . . . . . . . . . . . . . 195,342 31,334 455,595 — (682,271) —
Total Long-Term Debt . . . . . . . . . . . . . . . . . . . . 195,342 2,013,326 455,595 129 (682,271) 1,982,121Deferred tax liabilities, net . . . . . . . . . . . . . . . . . . . . . . . . . — — 30,767 — (30,767) —Pension liability . . . . . . . . . . . . . . . . . . . . . . . . . . . . . . . . . — — — 64,945 — 64,945Non-current tax liabilities . . . . . . . . . . . . . . . . . . . . . . . . . — — 73,462 — — 73,462Notes payable on real estate . . . . . . . . . . . . . . . . . . . . . . . . — — — 390,181 — 390,181Other liabilities . . . . . . . . . . . . . . . . . . . . . . . . . . . . . . . . . . — — 79,894 35,467 — 115,361
Total Liabilities . . . . . . . . . . . . . . . . . . . . . . . . . 196,532 2,168,478 1,380,505 1,268,259 (758,663) 4,255,111Commitments and contingencies . . . . . . . . . . . . . . . . . . . . — — — — — —Equity:CB Richard Ellis Group, Inc. Stockholders’ Equity . . . . . 629,122 811,588 2,535,355 903,699 (4,250,642) 629,122Non-controlling interests . . . . . . . . . . . . . . . . . . . . . . . . . . — — — 155,173 — 155,173
Total Equity . . . . . . . . . . . . . . . . . . . . . . . . . . . . 629,122 811,588 2,535,355 1,058,872 (4,250,642) 784,295
Total Liabilities and Equity . . . . . . . . . . . . . . . . $825,654 $2,980,066 $3,915,860 $2,327,131 $(5,009,305) $5,039,406
(a) Although CBRE Capital Markets is included among our domestic subsidiaries, which jointly and severally guarantee our 11.625% seniorsubordinated notes and our Credit Agreement, a substantial majority of warehouse receivables funded under the Fannie Mae ASAP, BofA and JPMorgan lines of credit are pledged to Fannie Mae, BofA and JP Morgan, and accordingly, are not included as collateral for these notes or our otheroutstanding debt.
128
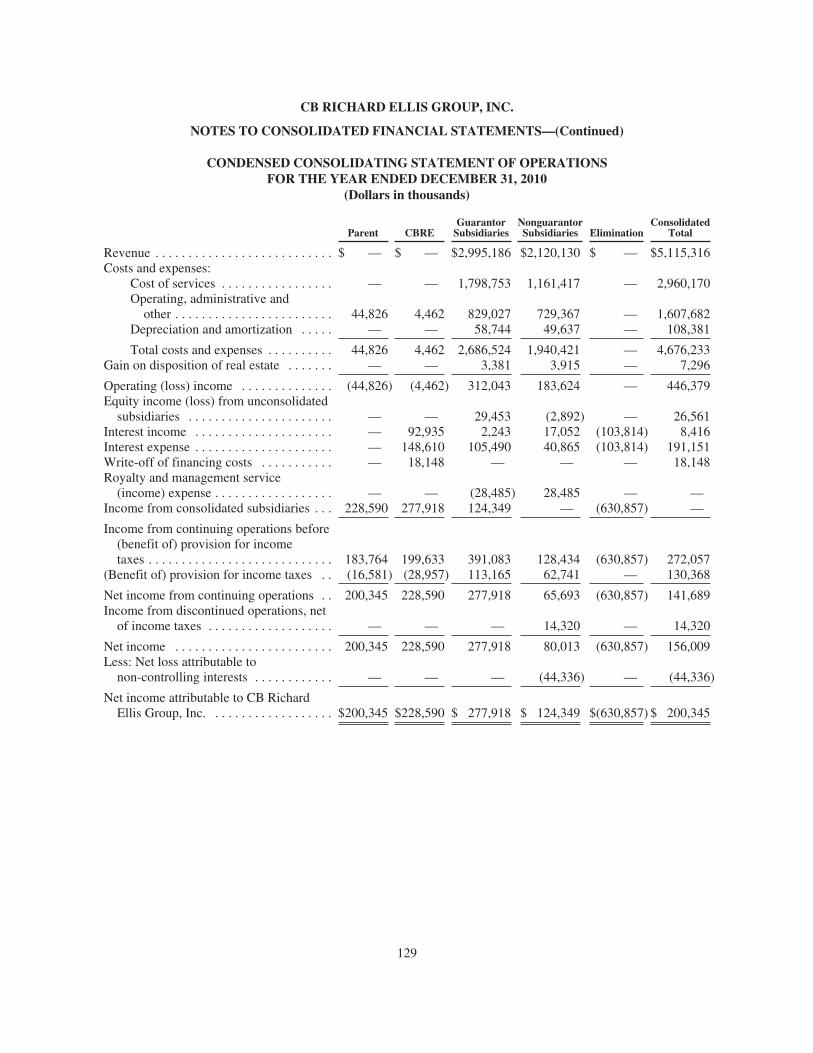
CB RICHARD ELLIS GROUP, INC.
NOTES TO CONSOLIDATED FINANCIAL STATEMENTS—(Continued)
CONDENSED CONSOLIDATING STATEMENT OF OPERATIONSFOR THE YEAR ENDED DECEMBER 31, 2010
(Dollars in thousands)
Parent CBREGuarantor
SubsidiariesNonguarantorSubsidiaries Elimination
ConsolidatedTotal
Revenue . . . . . . . . . . . . . . . . . . . . . . . . . . . $ — $ — $2,995,186 $2,120,130 $ — $5,115,316Costs and expenses:
Cost of services . . . . . . . . . . . . . . . . . — — 1,798,753 1,161,417 — 2,960,170Operating, administrative and
other . . . . . . . . . . . . . . . . . . . . . . . . 44,826 4,462 829,027 729,367 — 1,607,682Depreciation and amortization . . . . . — — 58,744 49,637 — 108,381
Total costs and expenses . . . . . . . . . . 44,826 4,462 2,686,524 1,940,421 — 4,676,233Gain on disposition of real estate . . . . . . . — — 3,381 3,915 — 7,296
Operating (loss) income . . . . . . . . . . . . . . (44,826) (4,462) 312,043 183,624 — 446,379Equity income (loss) from unconsolidated
subsidiaries . . . . . . . . . . . . . . . . . . . . . . — — 29,453 (2,892) — 26,561Interest income . . . . . . . . . . . . . . . . . . . . . — 92,935 2,243 17,052 (103,814) 8,416Interest expense . . . . . . . . . . . . . . . . . . . . . — 148,610 105,490 40,865 (103,814) 191,151Write-off of financing costs . . . . . . . . . . . — 18,148 — — — 18,148Royalty and management service
(income) expense . . . . . . . . . . . . . . . . . . — — (28,485) 28,485 — —Income from consolidated subsidiaries . . . 228,590 277,918 124,349 — (630,857) —
Income from continuing operations before(benefit of) provision for incometaxes . . . . . . . . . . . . . . . . . . . . . . . . . . . . 183,764 199,633 391,083 128,434 (630,857) 272,057
(Benefit of) provision for income taxes . . (16,581) (28,957) 113,165 62,741 — 130,368
Net income from continuing operations . . 200,345 228,590 277,918 65,693 (630,857) 141,689Income from discontinued operations, net
of income taxes . . . . . . . . . . . . . . . . . . . — — — 14,320 — 14,320
Net income . . . . . . . . . . . . . . . . . . . . . . . . 200,345 228,590 277,918 80,013 (630,857) 156,009Less: Net loss attributable to
non-controlling interests . . . . . . . . . . . . — — — (44,336) — (44,336)
Net income attributable to CB RichardEllis Group, Inc. . . . . . . . . . . . . . . . . . . $200,345 $228,590 $ 277,918 $ 124,349 $(630,857) $ 200,345
129
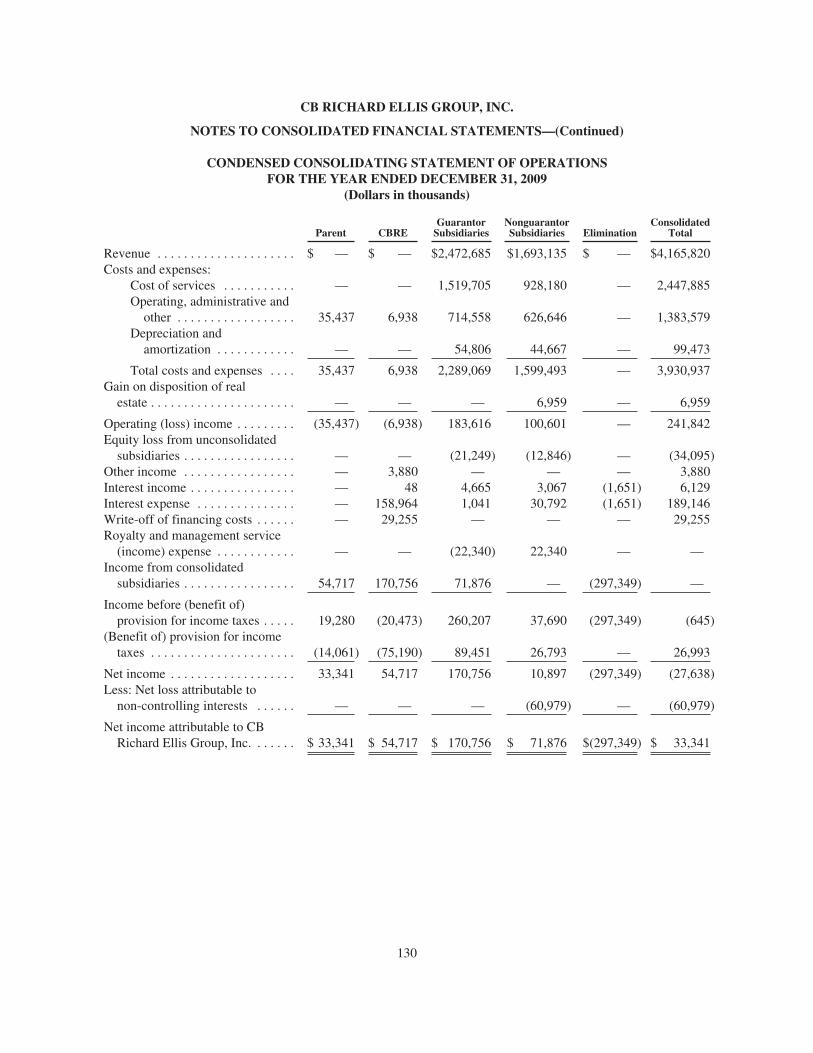
CB RICHARD ELLIS GROUP, INC.
NOTES TO CONSOLIDATED FINANCIAL STATEMENTS—(Continued)
CONDENSED CONSOLIDATING STATEMENT OF OPERATIONSFOR THE YEAR ENDED DECEMBER 31, 2009
(Dollars in thousands)
Parent CBREGuarantor
SubsidiariesNonguarantorSubsidiaries Elimination
ConsolidatedTotal
Revenue . . . . . . . . . . . . . . . . . . . . . $ — $ — $2,472,685 $1,693,135 $ — $4,165,820Costs and expenses:
Cost of services . . . . . . . . . . . — — 1,519,705 928,180 — 2,447,885Operating, administrative and
other . . . . . . . . . . . . . . . . . . 35,437 6,938 714,558 626,646 — 1,383,579Depreciation and
amortization . . . . . . . . . . . . — — 54,806 44,667 — 99,473
Total costs and expenses . . . . 35,437 6,938 2,289,069 1,599,493 — 3,930,937Gain on disposition of real
estate . . . . . . . . . . . . . . . . . . . . . . — — — 6,959 — 6,959
Operating (loss) income . . . . . . . . . (35,437) (6,938) 183,616 100,601 — 241,842Equity loss from unconsolidated
subsidiaries . . . . . . . . . . . . . . . . . — — (21,249) (12,846) — (34,095)Other income . . . . . . . . . . . . . . . . . — 3,880 — — — 3,880Interest income . . . . . . . . . . . . . . . . — 48 4,665 3,067 (1,651) 6,129Interest expense . . . . . . . . . . . . . . . — 158,964 1,041 30,792 (1,651) 189,146Write-off of financing costs . . . . . . — 29,255 — — — 29,255Royalty and management service
(income) expense . . . . . . . . . . . . — — (22,340) 22,340 — —Income from consolidated
subsidiaries . . . . . . . . . . . . . . . . . 54,717 170,756 71,876 — (297,349) —
Income before (benefit of)provision for income taxes . . . . . 19,280 (20,473) 260,207 37,690 (297,349) (645)
(Benefit of) provision for incometaxes . . . . . . . . . . . . . . . . . . . . . . (14,061) (75,190) 89,451 26,793 — 26,993
Net income . . . . . . . . . . . . . . . . . . . 33,341 54,717 170,756 10,897 (297,349) (27,638)Less: Net loss attributable to
non-controlling interests . . . . . . — — — (60,979) — (60,979)
Net income attributable to CBRichard Ellis Group, Inc. . . . . . . $ 33,341 $ 54,717 $ 170,756 $ 71,876 $(297,349) $ 33,341
130
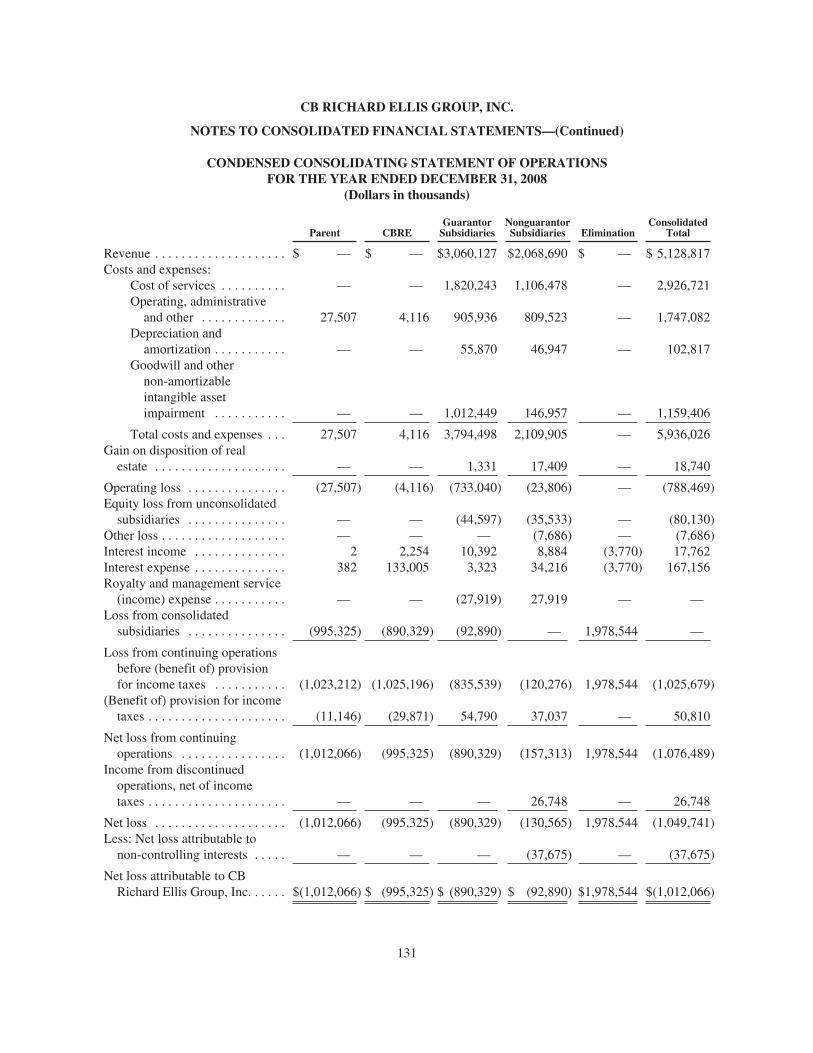
CB RICHARD ELLIS GROUP, INC.
NOTES TO CONSOLIDATED FINANCIAL STATEMENTS—(Continued)
CONDENSED CONSOLIDATING STATEMENT OF OPERATIONSFOR THE YEAR ENDED DECEMBER 31, 2008
(Dollars in thousands)
Parent CBREGuarantor
SubsidiariesNonguarantorSubsidiaries Elimination
ConsolidatedTotal
Revenue . . . . . . . . . . . . . . . . . . . . $ — $ — $3,060,127 $2,068,690 $ — $ 5,128,817Costs and expenses:
Cost of services . . . . . . . . . . — — 1,820,243 1,106,478 — 2,926,721Operating, administrative
and other . . . . . . . . . . . . . 27,507 4,116 905,936 809,523 — 1,747,082Depreciation and
amortization . . . . . . . . . . . — — 55,870 46,947 — 102,817Goodwill and other
non-amortizableintangible assetimpairment . . . . . . . . . . . — — 1,012,449 146,957 — 1,159,406
Total costs and expenses . . . 27,507 4,116 3,794,498 2,109,905 — 5,936,026Gain on disposition of real
estate . . . . . . . . . . . . . . . . . . . . — — 1,331 17,409 — 18,740
Operating loss . . . . . . . . . . . . . . . (27,507) (4,116) (733,040) (23,806) — (788,469)Equity loss from unconsolidated
subsidiaries . . . . . . . . . . . . . . . — — (44,597) (35,533) — (80,130)Other loss . . . . . . . . . . . . . . . . . . . — — — (7,686) — (7,686)Interest income . . . . . . . . . . . . . . 2 2,254 10,392 8,884 (3,770) 17,762Interest expense . . . . . . . . . . . . . . 382 133,005 3,323 34,216 (3,770) 167,156Royalty and management service
(income) expense . . . . . . . . . . . — — (27,919) 27,919 — —Loss from consolidated
subsidiaries . . . . . . . . . . . . . . . (995,325) (890,329) (92,890) — 1,978,544 —
Loss from continuing operationsbefore (benefit of) provisionfor income taxes . . . . . . . . . . . (1,023,212) (1,025,196) (835,539) (120,276) 1,978,544 (1,025,679)
(Benefit of) provision for incometaxes . . . . . . . . . . . . . . . . . . . . . (11,146) (29,871) 54,790 37,037 — 50,810
Net loss from continuingoperations . . . . . . . . . . . . . . . . (1,012,066) (995,325) (890,329) (157,313) 1,978,544 (1,076,489)
Income from discontinuedoperations, net of incometaxes . . . . . . . . . . . . . . . . . . . . . — — — 26,748 — 26,748
Net loss . . . . . . . . . . . . . . . . . . . . (1,012,066) (995,325) (890,329) (130,565) 1,978,544 (1,049,741)Less: Net loss attributable to
non-controlling interests . . . . . — — — (37,675) — (37,675)
Net loss attributable to CBRichard Ellis Group, Inc. . . . . . $(1,012,066) $ (995,325) $ (890,329) $ (92,890) $1,978,544 $(1,012,066)
131
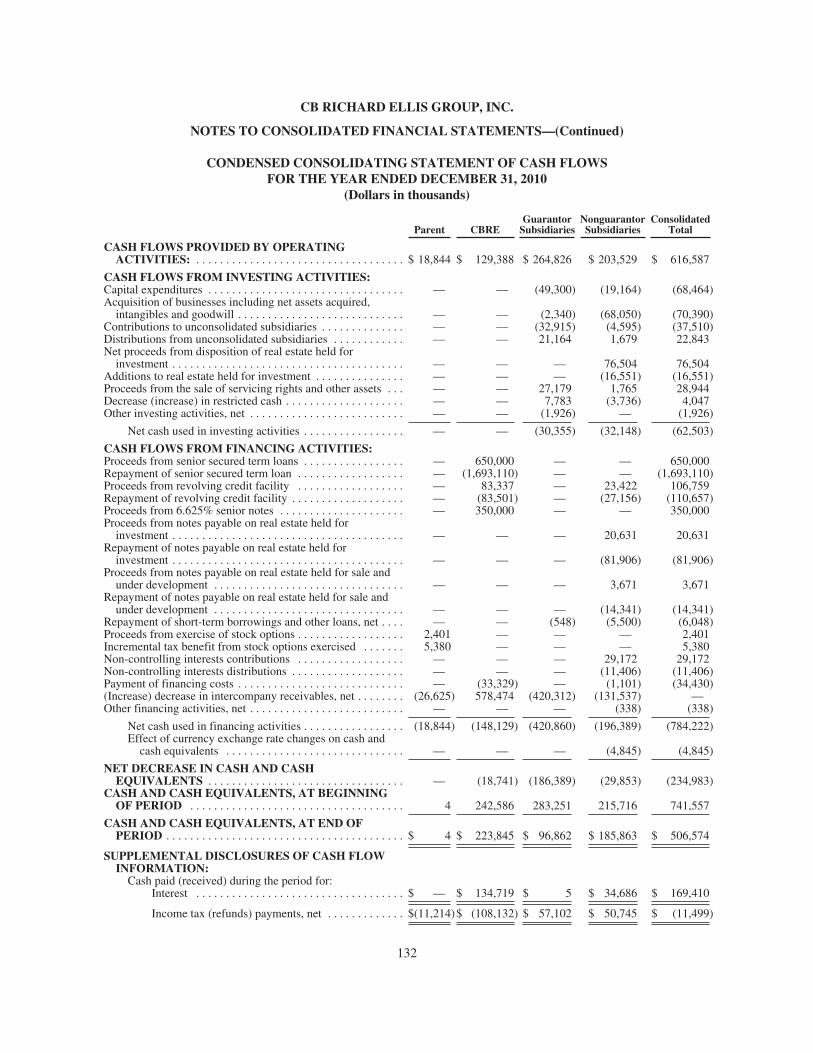
CB RICHARD ELLIS GROUP, INC.
NOTES TO CONSOLIDATED FINANCIAL STATEMENTS—(Continued)
CONDENSED CONSOLIDATING STATEMENT OF CASH FLOWSFOR THE YEAR ENDED DECEMBER 31, 2010
(Dollars in thousands)
Parent CBREGuarantor
SubsidiariesNonguarantorSubsidiaries
ConsolidatedTotal
CASH FLOWS PROVIDED BY OPERATINGACTIVITIES: . . . . . . . . . . . . . . . . . . . . . . . . . . . . . . . . . . . $ 18,844 $ 129,388 $ 264,826 $ 203,529 $ 616,587
CASH FLOWS FROM INVESTING ACTIVITIES:Capital expenditures . . . . . . . . . . . . . . . . . . . . . . . . . . . . . . . . . — — (49,300) (19,164) (68,464)Acquisition of businesses including net assets acquired,
intangibles and goodwill . . . . . . . . . . . . . . . . . . . . . . . . . . . . — — (2,340) (68,050) (70,390)Contributions to unconsolidated subsidiaries . . . . . . . . . . . . . . — — (32,915) (4,595) (37,510)Distributions from unconsolidated subsidiaries . . . . . . . . . . . . — — 21,164 1,679 22,843Net proceeds from disposition of real estate held for
investment . . . . . . . . . . . . . . . . . . . . . . . . . . . . . . . . . . . . . . . — — — 76,504 76,504Additions to real estate held for investment . . . . . . . . . . . . . . . — — — (16,551) (16,551)Proceeds from the sale of servicing rights and other assets . . . — — 27,179 1,765 28,944Decrease (increase) in restricted cash . . . . . . . . . . . . . . . . . . . . — — 7,783 (3,736) 4,047Other investing activities, net . . . . . . . . . . . . . . . . . . . . . . . . . . — — (1,926) — (1,926)
Net cash used in investing activities . . . . . . . . . . . . . . . . . — — (30,355) (32,148) (62,503)
CASH FLOWS FROM FINANCING ACTIVITIES:Proceeds from senior secured term loans . . . . . . . . . . . . . . . . . — 650,000 — — 650,000Repayment of senior secured term loan . . . . . . . . . . . . . . . . . . — (1,693,110) — — (1,693,110)Proceeds from revolving credit facility . . . . . . . . . . . . . . . . . . — 83,337 — 23,422 106,759Repayment of revolving credit facility . . . . . . . . . . . . . . . . . . . — (83,501) — (27,156) (110,657)Proceeds from 6.625% senior notes . . . . . . . . . . . . . . . . . . . . . — 350,000 — — 350,000Proceeds from notes payable on real estate held for
investment . . . . . . . . . . . . . . . . . . . . . . . . . . . . . . . . . . . . . . . — — — 20,631 20,631Repayment of notes payable on real estate held for
investment . . . . . . . . . . . . . . . . . . . . . . . . . . . . . . . . . . . . . . . — — — (81,906) (81,906)Proceeds from notes payable on real estate held for sale and
under development . . . . . . . . . . . . . . . . . . . . . . . . . . . . . . . . — — — 3,671 3,671Repayment of notes payable on real estate held for sale and
under development . . . . . . . . . . . . . . . . . . . . . . . . . . . . . . . . — — — (14,341) (14,341)Repayment of short-term borrowings and other loans, net . . . . — — (548) (5,500) (6,048)Proceeds from exercise of stock options . . . . . . . . . . . . . . . . . . 2,401 — — — 2,401Incremental tax benefit from stock options exercised . . . . . . . 5,380 — — — 5,380Non-controlling interests contributions . . . . . . . . . . . . . . . . . . — — — 29,172 29,172Non-controlling interests distributions . . . . . . . . . . . . . . . . . . . — — — (11,406) (11,406)Payment of financing costs . . . . . . . . . . . . . . . . . . . . . . . . . . . . — (33,329) — (1,101) (34,430)(Increase) decrease in intercompany receivables, net . . . . . . . . (26,625) 578,474 (420,312) (131,537) —Other financing activities, net . . . . . . . . . . . . . . . . . . . . . . . . . . — — — (338) (338)
Net cash used in financing activities . . . . . . . . . . . . . . . . . (18,844) (148,129) (420,860) (196,389) (784,222)Effect of currency exchange rate changes on cash and
cash equivalents . . . . . . . . . . . . . . . . . . . . . . . . . . . . . . — — — (4,845) (4,845)
NET DECREASE IN CASH AND CASHEQUIVALENTS . . . . . . . . . . . . . . . . . . . . . . . . . . . . . . . . . — (18,741) (186,389) (29,853) (234,983)
CASH AND CASH EQUIVALENTS, AT BEGINNINGOF PERIOD . . . . . . . . . . . . . . . . . . . . . . . . . . . . . . . . . . . . 4 242,586 283,251 215,716 741,557
CASH AND CASH EQUIVALENTS, AT END OFPERIOD . . . . . . . . . . . . . . . . . . . . . . . . . . . . . . . . . . . . . . . . $ 4 $ 223,845 $ 96,862 $ 185,863 $ 506,574
SUPPLEMENTAL DISCLOSURES OF CASH FLOWINFORMATION:
Cash paid (received) during the period for:Interest . . . . . . . . . . . . . . . . . . . . . . . . . . . . . . . . . . . $ — $ 134,719 $ 5 $ 34,686 $ 169,410
Income tax (refunds) payments, net . . . . . . . . . . . . . $(11,214)$ (108,132) $ 57,102 $ 50,745 $ (11,499)
132
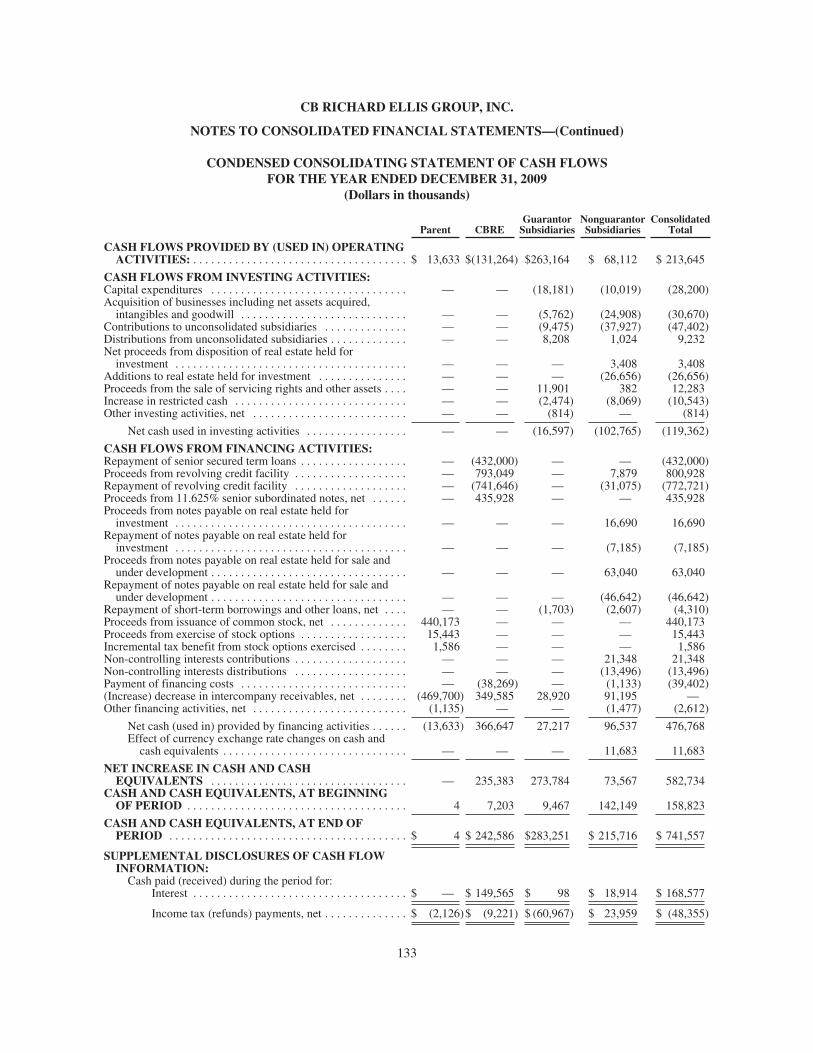
CB RICHARD ELLIS GROUP, INC.
NOTES TO CONSOLIDATED FINANCIAL STATEMENTS—(Continued)
CONDENSED CONSOLIDATING STATEMENT OF CASH FLOWSFOR THE YEAR ENDED DECEMBER 31, 2009
(Dollars in thousands)
Parent CBREGuarantor
SubsidiariesNonguarantorSubsidiaries
ConsolidatedTotal
CASH FLOWS PROVIDED BY (USED IN) OPERATINGACTIVITIES: . . . . . . . . . . . . . . . . . . . . . . . . . . . . . . . . . . . . $ 13,633 $(131,264) $263,164 $ 68,112 $ 213,645
CASH FLOWS FROM INVESTING ACTIVITIES:Capital expenditures . . . . . . . . . . . . . . . . . . . . . . . . . . . . . . . . . — — (18,181) (10,019) (28,200)Acquisition of businesses including net assets acquired,
intangibles and goodwill . . . . . . . . . . . . . . . . . . . . . . . . . . . . — — (5,762) (24,908) (30,670)Contributions to unconsolidated subsidiaries . . . . . . . . . . . . . . — — (9,475) (37,927) (47,402)Distributions from unconsolidated subsidiaries . . . . . . . . . . . . . — — 8,208 1,024 9,232Net proceeds from disposition of real estate held for
investment . . . . . . . . . . . . . . . . . . . . . . . . . . . . . . . . . . . . . . . — — — 3,408 3,408Additions to real estate held for investment . . . . . . . . . . . . . . . — — — (26,656) (26,656)Proceeds from the sale of servicing rights and other assets . . . . — — 11,901 382 12,283Increase in restricted cash . . . . . . . . . . . . . . . . . . . . . . . . . . . . . — — (2,474) (8,069) (10,543)Other investing activities, net . . . . . . . . . . . . . . . . . . . . . . . . . . — — (814) — (814)
Net cash used in investing activities . . . . . . . . . . . . . . . . . — — (16,597) (102,765) (119,362)
CASH FLOWS FROM FINANCING ACTIVITIES:Repayment of senior secured term loans . . . . . . . . . . . . . . . . . . — (432,000) — — (432,000)Proceeds from revolving credit facility . . . . . . . . . . . . . . . . . . . — 793,049 — 7,879 800,928Repayment of revolving credit facility . . . . . . . . . . . . . . . . . . . — (741,646) — (31,075) (772,721)Proceeds from 11.625% senior subordinated notes, net . . . . . . — 435,928 — — 435,928Proceeds from notes payable on real estate held for
investment . . . . . . . . . . . . . . . . . . . . . . . . . . . . . . . . . . . . . . . — — — 16,690 16,690Repayment of notes payable on real estate held for
investment . . . . . . . . . . . . . . . . . . . . . . . . . . . . . . . . . . . . . . . — — — (7,185) (7,185)Proceeds from notes payable on real estate held for sale and
under development . . . . . . . . . . . . . . . . . . . . . . . . . . . . . . . . . — — — 63,040 63,040Repayment of notes payable on real estate held for sale and
under development . . . . . . . . . . . . . . . . . . . . . . . . . . . . . . . . . — — — (46,642) (46,642)Repayment of short-term borrowings and other loans, net . . . . — — (1,703) (2,607) (4,310)Proceeds from issuance of common stock, net . . . . . . . . . . . . . 440,173 — — — 440,173Proceeds from exercise of stock options . . . . . . . . . . . . . . . . . . 15,443 — — — 15,443Incremental tax benefit from stock options exercised . . . . . . . . 1,586 — — — 1,586Non-controlling interests contributions . . . . . . . . . . . . . . . . . . . — — — 21,348 21,348Non-controlling interests distributions . . . . . . . . . . . . . . . . . . . — — — (13,496) (13,496)Payment of financing costs . . . . . . . . . . . . . . . . . . . . . . . . . . . . — (38,269) — (1,133) (39,402)(Increase) decrease in intercompany receivables, net . . . . . . . . (469,700) 349,585 28,920 91,195 —Other financing activities, net . . . . . . . . . . . . . . . . . . . . . . . . . . (1,135) — — (1,477) (2,612)
Net cash (used in) provided by financing activities . . . . . . (13,633) 366,647 27,217 96,537 476,768Effect of currency exchange rate changes on cash and
cash equivalents . . . . . . . . . . . . . . . . . . . . . . . . . . . . . . . — — — 11,683 11,683
NET INCREASE IN CASH AND CASHEQUIVALENTS . . . . . . . . . . . . . . . . . . . . . . . . . . . . . . . . . — 235,383 273,784 73,567 582,734
CASH AND CASH EQUIVALENTS, AT BEGINNINGOF PERIOD . . . . . . . . . . . . . . . . . . . . . . . . . . . . . . . . . . . . . 4 7,203 9,467 142,149 158,823
CASH AND CASH EQUIVALENTS, AT END OFPERIOD . . . . . . . . . . . . . . . . . . . . . . . . . . . . . . . . . . . . . . . . $ 4 $ 242,586 $283,251 $ 215,716 $ 741,557
SUPPLEMENTAL DISCLOSURES OF CASH FLOWINFORMATION:
Cash paid (received) during the period for:Interest . . . . . . . . . . . . . . . . . . . . . . . . . . . . . . . . . . . . $ — $ 149,565 $ 98 $ 18,914 $ 168,577
Income tax (refunds) payments, net . . . . . . . . . . . . . . $ (2,126)$ (9,221) $ (60,967) $ 23,959 $ (48,355)
133
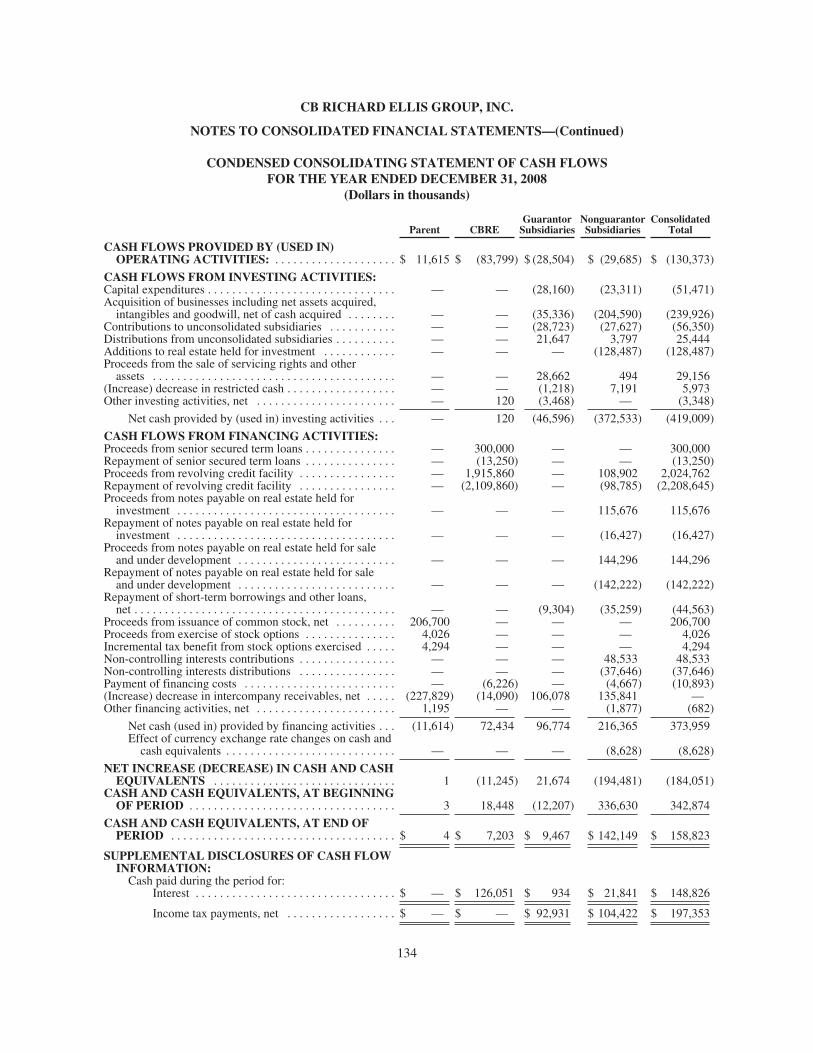
CB RICHARD ELLIS GROUP, INC.
NOTES TO CONSOLIDATED FINANCIAL STATEMENTS—(Continued)
CONDENSED CONSOLIDATING STATEMENT OF CASH FLOWSFOR THE YEAR ENDED DECEMBER 31, 2008
(Dollars in thousands)
Parent CBREGuarantor
SubsidiariesNonguarantorSubsidiaries
ConsolidatedTotal
CASH FLOWS PROVIDED BY (USED IN)OPERATING ACTIVITIES: . . . . . . . . . . . . . . . . . . . . $ 11,615 $ (83,799) $ (28,504) $ (29,685) $ (130,373)
CASH FLOWS FROM INVESTING ACTIVITIES:Capital expenditures . . . . . . . . . . . . . . . . . . . . . . . . . . . . . . . — — (28,160) (23,311) (51,471)Acquisition of businesses including net assets acquired,
intangibles and goodwill, net of cash acquired . . . . . . . . — — (35,336) (204,590) (239,926)Contributions to unconsolidated subsidiaries . . . . . . . . . . . — — (28,723) (27,627) (56,350)Distributions from unconsolidated subsidiaries . . . . . . . . . . — — 21,647 3,797 25,444Additions to real estate held for investment . . . . . . . . . . . . — — — (128,487) (128,487)Proceeds from the sale of servicing rights and other
assets . . . . . . . . . . . . . . . . . . . . . . . . . . . . . . . . . . . . . . . . — — 28,662 494 29,156(Increase) decrease in restricted cash . . . . . . . . . . . . . . . . . . — — (1,218) 7,191 5,973Other investing activities, net . . . . . . . . . . . . . . . . . . . . . . . — 120 (3,468) — (3,348)
Net cash provided by (used in) investing activities . . . — 120 (46,596) (372,533) (419,009)
CASH FLOWS FROM FINANCING ACTIVITIES:Proceeds from senior secured term loans . . . . . . . . . . . . . . . — 300,000 — — 300,000Repayment of senior secured term loans . . . . . . . . . . . . . . . — (13,250) — — (13,250)Proceeds from revolving credit facility . . . . . . . . . . . . . . . . — 1,915,860 — 108,902 2,024,762Repayment of revolving credit facility . . . . . . . . . . . . . . . . — (2,109,860) — (98,785) (2,208,645)Proceeds from notes payable on real estate held for
investment . . . . . . . . . . . . . . . . . . . . . . . . . . . . . . . . . . . . — — — 115,676 115,676Repayment of notes payable on real estate held for
investment . . . . . . . . . . . . . . . . . . . . . . . . . . . . . . . . . . . . — — — (16,427) (16,427)Proceeds from notes payable on real estate held for sale
and under development . . . . . . . . . . . . . . . . . . . . . . . . . . — — — 144,296 144,296Repayment of notes payable on real estate held for sale
and under development . . . . . . . . . . . . . . . . . . . . . . . . . . — — — (142,222) (142,222)Repayment of short-term borrowings and other loans,
net . . . . . . . . . . . . . . . . . . . . . . . . . . . . . . . . . . . . . . . . . . . — — (9,304) (35,259) (44,563)Proceeds from issuance of common stock, net . . . . . . . . . . 206,700 — — — 206,700Proceeds from exercise of stock options . . . . . . . . . . . . . . . 4,026 — — — 4,026Incremental tax benefit from stock options exercised . . . . . 4,294 — — — 4,294Non-controlling interests contributions . . . . . . . . . . . . . . . . — — — 48,533 48,533Non-controlling interests distributions . . . . . . . . . . . . . . . . — — — (37,646) (37,646)Payment of financing costs . . . . . . . . . . . . . . . . . . . . . . . . . — (6,226) — (4,667) (10,893)(Increase) decrease in intercompany receivables, net . . . . . (227,829) (14,090) 106,078 135,841 —Other financing activities, net . . . . . . . . . . . . . . . . . . . . . . . 1,195 — — (1,877) (682)
Net cash (used in) provided by financing activities . . . (11,614) 72,434 96,774 216,365 373,959Effect of currency exchange rate changes on cash and
cash equivalents . . . . . . . . . . . . . . . . . . . . . . . . . . . . — — — (8,628) (8,628)
NET INCREASE (DECREASE) IN CASH AND CASHEQUIVALENTS . . . . . . . . . . . . . . . . . . . . . . . . . . . . . . 1 (11,245) 21,674 (194,481) (184,051)
CASH AND CASH EQUIVALENTS, AT BEGINNINGOF PERIOD . . . . . . . . . . . . . . . . . . . . . . . . . . . . . . . . . . 3 18,448 (12,207) 336,630 342,874
CASH AND CASH EQUIVALENTS, AT END OFPERIOD . . . . . . . . . . . . . . . . . . . . . . . . . . . . . . . . . . . . . $ 4 $ 7,203 $ 9,467 $ 142,149 $ 158,823
SUPPLEMENTAL DISCLOSURES OF CASH FLOWINFORMATION:
Cash paid during the period for:Interest . . . . . . . . . . . . . . . . . . . . . . . . . . . . . . . . . $ — $ 126,051 $ 934 $ 21,841 $ 148,826
Income tax payments, net . . . . . . . . . . . . . . . . . . $ — $ — $ 92,931 $ 104,422 $ 197,353
134
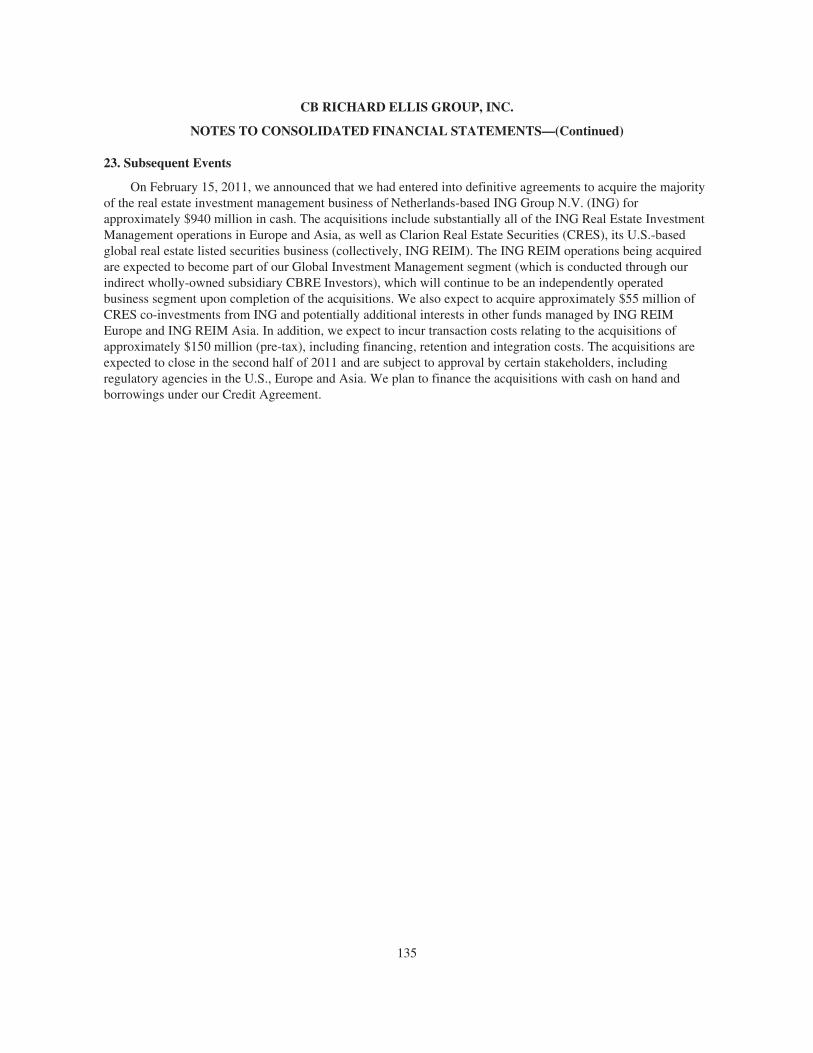
CB RICHARD ELLIS GROUP, INC.
NOTES TO CONSOLIDATED FINANCIAL STATEMENTS—(Continued)
23. Subsequent Events
On February 15, 2011, we announced that we had entered into definitive agreements to acquire the majorityof the real estate investment management business of Netherlands-based ING Group N.V. (ING) forapproximately $940 million in cash. The acquisitions include substantially all of the ING Real Estate InvestmentManagement operations in Europe and Asia, as well as Clarion Real Estate Securities (CRES), its U.S.-basedglobal real estate listed securities business (collectively, ING REIM). The ING REIM operations being acquiredare expected to become part of our Global Investment Management segment (which is conducted through ourindirect wholly-owned subsidiary CBRE Investors), which will continue to be an independently operatedbusiness segment upon completion of the acquisitions. We also expect to acquire approximately $55 million ofCRES co-investments from ING and potentially additional interests in other funds managed by ING REIMEurope and ING REIM Asia. In addition, we expect to incur transaction costs relating to the acquisitions ofapproximately $150 million (pre-tax), including financing, retention and integration costs. The acquisitions areexpected to close in the second half of 2011 and are subject to approval by certain stakeholders, includingregulatory agencies in the U.S., Europe and Asia. We plan to finance the acquisitions with cash on hand andborrowings under our Credit Agreement.
135
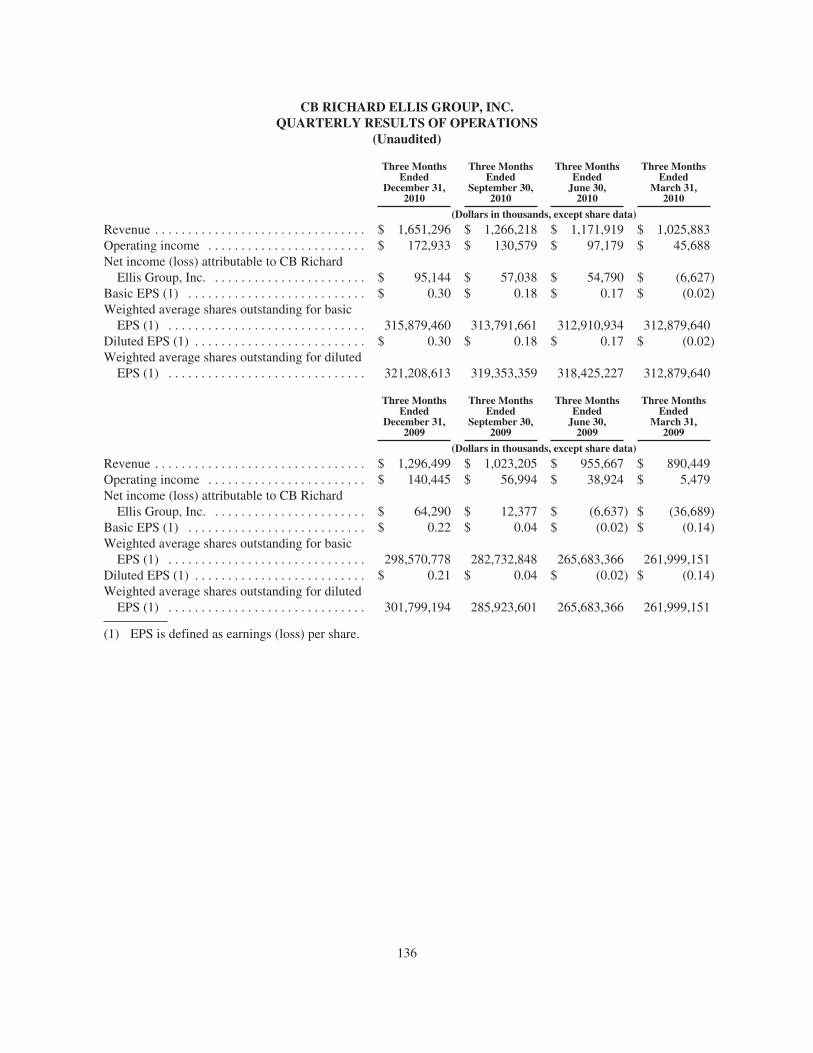
CB RICHARD ELLIS GROUP, INC.QUARTERLY RESULTS OF OPERATIONS
(Unaudited)
Three MonthsEnded
December 31,2010
Three MonthsEnded
September 30,2010
Three MonthsEnded
June 30,2010
Three MonthsEnded
March 31,2010
(Dollars in thousands, except share data)
Revenue . . . . . . . . . . . . . . . . . . . . . . . . . . . . . . . . $ 1,651,296 $ 1,266,218 $ 1,171,919 $ 1,025,883Operating income . . . . . . . . . . . . . . . . . . . . . . . . $ 172,933 $ 130,579 $ 97,179 $ 45,688Net income (loss) attributable to CB Richard
Ellis Group, Inc. . . . . . . . . . . . . . . . . . . . . . . . $ 95,144 $ 57,038 $ 54,790 $ (6,627)Basic EPS (1) . . . . . . . . . . . . . . . . . . . . . . . . . . . $ 0.30 $ 0.18 $ 0.17 $ (0.02)Weighted average shares outstanding for basic
EPS (1) . . . . . . . . . . . . . . . . . . . . . . . . . . . . . . 315,879,460 313,791,661 312,910,934 312,879,640Diluted EPS (1) . . . . . . . . . . . . . . . . . . . . . . . . . . $ 0.30 $ 0.18 $ 0.17 $ (0.02)Weighted average shares outstanding for diluted
EPS (1) . . . . . . . . . . . . . . . . . . . . . . . . . . . . . . 321,208,613 319,353,359 318,425,227 312,879,640
Three MonthsEnded
December 31,2009
Three MonthsEnded
September 30,2009
Three MonthsEnded
June 30,2009
Three MonthsEnded
March 31,2009
(Dollars in thousands, except share data)
Revenue . . . . . . . . . . . . . . . . . . . . . . . . . . . . . . . . $ 1,296,499 $ 1,023,205 $ 955,667 $ 890,449Operating income . . . . . . . . . . . . . . . . . . . . . . . . $ 140,445 $ 56,994 $ 38,924 $ 5,479Net income (loss) attributable to CB Richard
Ellis Group, Inc. . . . . . . . . . . . . . . . . . . . . . . . $ 64,290 $ 12,377 $ (6,637) $ (36,689)Basic EPS (1) . . . . . . . . . . . . . . . . . . . . . . . . . . . $ 0.22 $ 0.04 $ (0.02) $ (0.14)Weighted average shares outstanding for basic
EPS (1) . . . . . . . . . . . . . . . . . . . . . . . . . . . . . . 298,570,778 282,732,848 265,683,366 261,999,151Diluted EPS (1) . . . . . . . . . . . . . . . . . . . . . . . . . . $ 0.21 $ 0.04 $ (0.02) $ (0.14)Weighted average shares outstanding for diluted
EPS (1) . . . . . . . . . . . . . . . . . . . . . . . . . . . . . . 301,799,194 285,923,601 265,683,366 261,999,151
(1) EPS is defined as earnings (loss) per share.
136
Item 9. Changes in and Disagreements with Accountants on Accounting and Financial Disclosure
Not applicable.
Item 9A. Controls and Procedures
Management’s Report on Internal Control Over Financial Reporting
Our management is responsible for establishing and maintaining adequate internal control over financialreporting, as such term is defined in Securities Exchange Act Rules 13a-15(f), including maintenance of(i) records that in reasonable detail accurately and fairly reflect the transactions and dispositions of our assets,and (ii) policies and procedures that provide reasonable assurance that (a) transactions are recorded as necessaryto permit preparation of financial statements in accordance with accounting principles generally accepted in theUnited States of America, (b) our receipts and expenditures are being made only in accordance withauthorizations of management and our Board of Directors and (c) we will prevent or timely detect unauthorizedacquisition, use, or disposition of our assets that could have a material effect on the financial statements.
Internal control over financial reporting cannot provide absolute assurance of achieving financial reportingobjectives because of the inherent limitations of any system of internal control. Internal control over financialreporting is a process that involves human diligence and compliance and is subject to lapses of judgment andbreakdowns resulting from human failures. Internal control over financial reporting also can be circumvented bycollusion or improper overriding of controls. As a result of such limitations, there is risk that materialmisstatements may not be prevented or detected on a timely basis by internal control over financial reporting.However, these inherent limitations are known features of the financial reporting process. Therefore, it ispossible to design into the process safeguards to reduce, though not eliminate, this risk.
Under the supervision and with the participation of our management, including our Chief Executive Officerand Chief Financial Officer, we conducted an evaluation of the effectiveness of our internal control overfinancial reporting based on the criteria established in Internal Control-Integrated Framework issued by theCommittee of Sponsoring Organizations (COSO) of the Treadway Commission. Based on our evaluation underthe COSO framework, our management concluded that our internal control over financial reporting was effectiveas of December 31, 2010. The effectiveness of internal control over financial reporting as of December 31, 2010has been audited by KPMG LLP, an independent registered public accounting firm, as stated in their reportwhich is included herein.
Disclosure Controls and Procedures
Our policy for disclosure controls and procedures provides guidance on the evaluation of disclosure controlsand procedures and is designed to ensure that all corporate disclosure is complete and accurate in all materialrespects and that all information required to be disclosed in the periodic reports submitted by us under theSecurities Exchange Act of 1934 is recorded, processed, summarized and reported within the time periods and inthe manner specified in the Securities and Exchange Commission’s rules and forms. Disclosure controls andprocedures include, without limitation, controls and procedures that are designed to ensure that informationrequired to be disclosed by a company in the reports that it files or submits under the Securities Exchange Act isaccumulated and communicated to the company’s management, including its principal executive and principalfinancial officers, as appropriate to allow timely decisions regarding required disclosure. As of the end of theperiod covered by this report, we carried out an evaluation, under the supervision and with the participation ofour Chief Executive Officer and Chief Financial Officer, of the effectiveness of our disclosure controls andprocedures. Our Disclosure Committee consisting of the principal accounting officer, general counsel, chiefcommunication officer, senior officers of each significant business line and other select employees assisted theChief Executive Officer and the Chief Financial Officer in this evaluation. Based upon that evaluation, our ChiefExecutive Officer and Chief Financial Officer concluded that our disclosure controls and procedures wereeffective as required by the Securities Exchange Act Rule 13a-15(c) as of the end of the period covered by thisreport.
137

Changes in Internal Controls Over Financial Reporting
No changes in our internal control over financial reporting occurred during the last fiscal quarter that havematerially affected, or are reasonably likely to materially affect, our internal control over financial reporting.
Item 9B. Other Information
Not applicable.
PART III
Item 10. Directors, Executive Officers and Corporate Governance
The information under the headings “Information About the Board”, “Corporate Governance”, “ExecutiveOfficers” and “Stock Ownership” in the definitive proxy statement for our 2011 Annual Meeting of Stockholdersis incorporated herein by reference.
We are filing the certifications by the Chief Executive Officer and Chief Financial Officer required underSection 302 of the Sarbanes-Oxley Act as exhibits to this Annual Report on Form 10-K.
Item 11. Executive Compensation
The information contained under the headings “Information About the Board”, “Corporate Governance” and“Executive Compensation” in the definitive proxy statement for our 2011 Annual Meeting of Stockholders isincorporated herein by reference.
Item 12. Security Ownership of Certain Beneficial Owners and Management and Related StockholderMatters
The information contained under the heading “Stock Ownership” in the definitive proxy statement for our2011 Annual Meeting of Stockholders is incorporated herein by reference.
Item 13. Certain Relationships and Related Transactions, and Director Independence
The information contained under the headings “Corporate Governance”, “Executive Compensation” and“Related Party Transactions” and in the definitive proxy statement for our 2011 Annual Meeting of Stockholdersis incorporated herein by reference.
Item 14. Principal Accountant Fees and Services
The information contained under the heading “Corporate Governance—Principal Accountant Fees andServices” in the definitive proxy statement for our 2011 Annual Meeting of Stockholders is incorporated hereinby reference.
138

PART IV
Item 15. Exhibits and Financial Statement Schedules
1. Financial Statements
See Index to Consolidated Financial Statements set forth on page 61.
2. Financial Statement Schedules
See Schedule II on page 140.
See Schedule III beginning on page 141.
3. Exhibits
See Exhibit Index beginning on page 148 hereof.
139
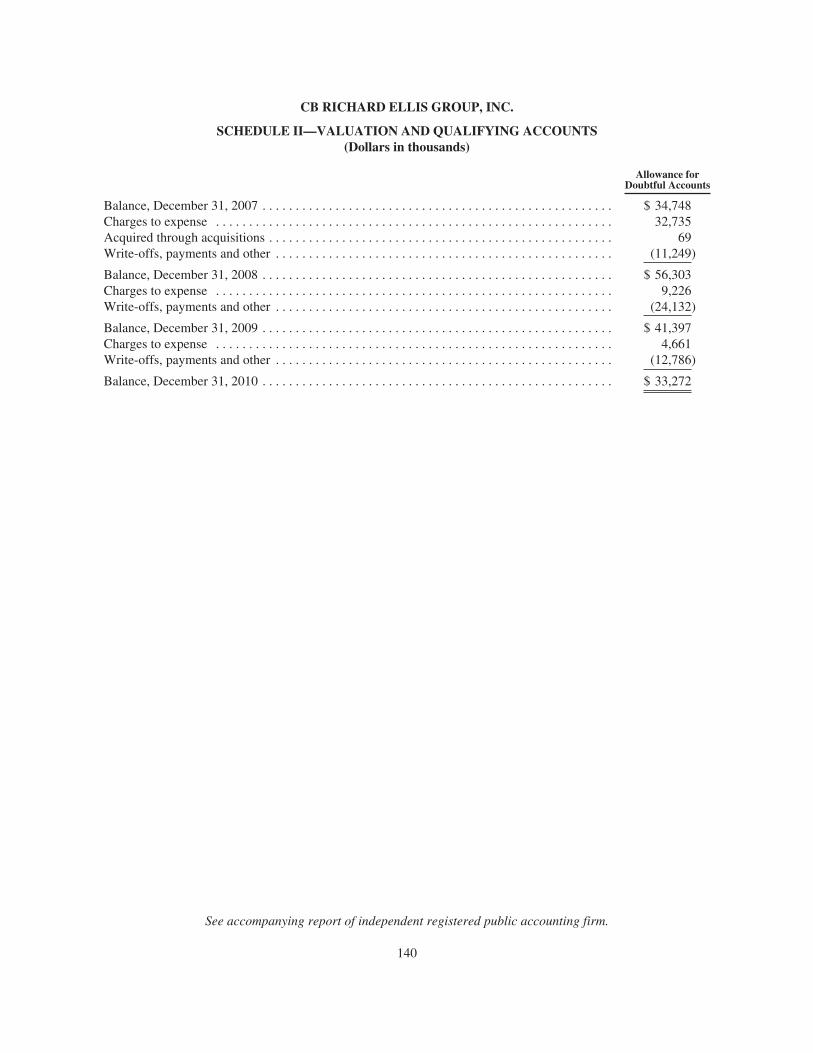
CB RICHARD ELLIS GROUP, INC.
SCHEDULE II—VALUATION AND QUALIFYING ACCOUNTS(Dollars in thousands)
Allowance forDoubtful Accounts
Balance, December 31, 2007 . . . . . . . . . . . . . . . . . . . . . . . . . . . . . . . . . . . . . . . . . . . . . . . . . . . . . $ 34,748Charges to expense . . . . . . . . . . . . . . . . . . . . . . . . . . . . . . . . . . . . . . . . . . . . . . . . . . . . . . . . . . . . 32,735Acquired through acquisitions . . . . . . . . . . . . . . . . . . . . . . . . . . . . . . . . . . . . . . . . . . . . . . . . . . . . 69Write-offs, payments and other . . . . . . . . . . . . . . . . . . . . . . . . . . . . . . . . . . . . . . . . . . . . . . . . . . . (11,249)
Balance, December 31, 2008 . . . . . . . . . . . . . . . . . . . . . . . . . . . . . . . . . . . . . . . . . . . . . . . . . . . . . $ 56,303Charges to expense . . . . . . . . . . . . . . . . . . . . . . . . . . . . . . . . . . . . . . . . . . . . . . . . . . . . . . . . . . . . 9,226Write-offs, payments and other . . . . . . . . . . . . . . . . . . . . . . . . . . . . . . . . . . . . . . . . . . . . . . . . . . . (24,132)
Balance, December 31, 2009 . . . . . . . . . . . . . . . . . . . . . . . . . . . . . . . . . . . . . . . . . . . . . . . . . . . . . $ 41,397Charges to expense . . . . . . . . . . . . . . . . . . . . . . . . . . . . . . . . . . . . . . . . . . . . . . . . . . . . . . . . . . . . 4,661Write-offs, payments and other . . . . . . . . . . . . . . . . . . . . . . . . . . . . . . . . . . . . . . . . . . . . . . . . . . . (12,786)
Balance, December 31, 2010 . . . . . . . . . . . . . . . . . . . . . . . . . . . . . . . . . . . . . . . . . . . . . . . . . . . . . $ 33,272
See accompanying report of independent registered public accounting firm.
140
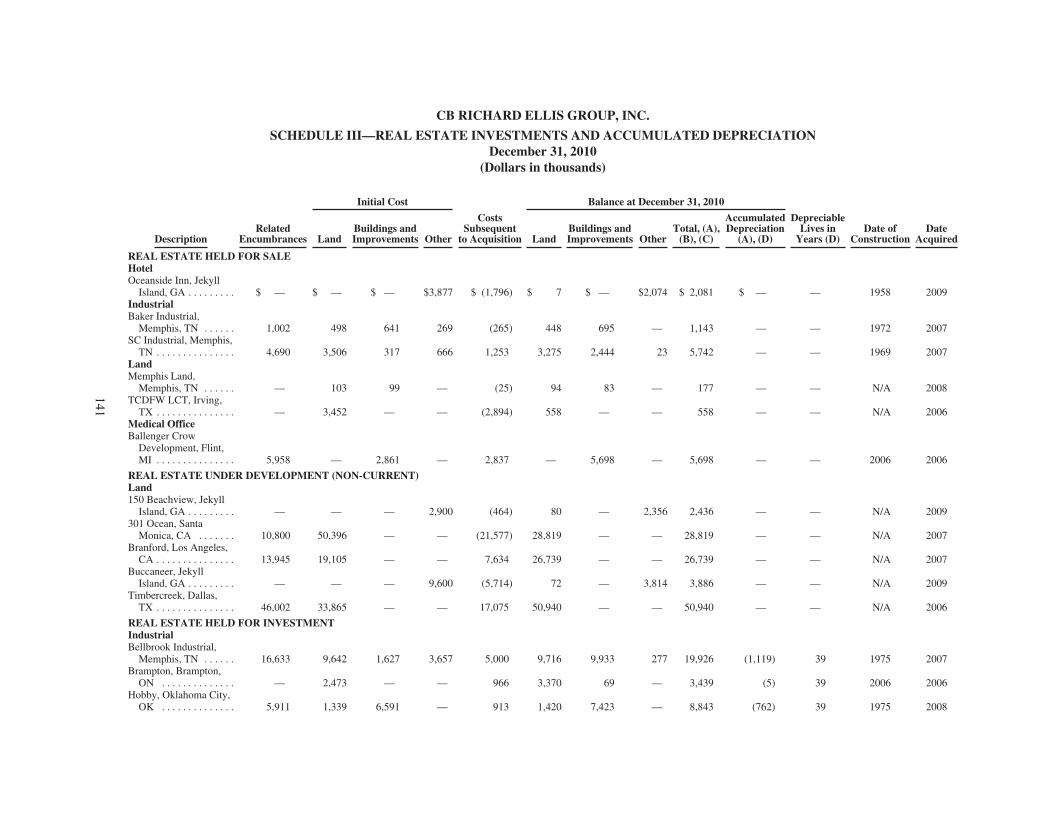
CB RICHARD ELLIS GROUP, INC.
SCHEDULE III—REAL ESTATE INVESTMENTS AND ACCUMULATED DEPRECIATIONDecember 31, 2010
(Dollars in thousands)
RelatedEncumbrances
Initial Cost
CostsSubsequent
to Acquisition
Balance at December 31, 2010
DepreciableLives in
Years (D)Date of
ConstructionDate
AcquiredDescription LandBuildings andImprovements Other Land
Buildings andImprovements Other
Total, (A),(B), (C)
AccumulatedDepreciation
(A), (D)
REAL ESTATE HELD FOR SALEHotelOceanside Inn, Jekyll
Island, GA . . . . . . . . . $ — $ — $ — $3,877 $ (1,796) $ 7 $ — $2,074 $ 2,081 $ — — 1958 2009IndustrialBaker Industrial,
Memphis, TN . . . . . . 1,002 498 641 269 (265) 448 695 — 1,143 — — 1972 2007SC Industrial, Memphis,
TN . . . . . . . . . . . . . . . 4,690 3,506 317 666 1,253 3,275 2,444 23 5,742 — — 1969 2007LandMemphis Land,
Memphis, TN . . . . . . — 103 99 — (25) 94 83 — 177 — — N/A 2008TCDFW LCT, Irving,
TX . . . . . . . . . . . . . . . — 3,452 — — (2,894) 558 — — 558 — — N/A 2006Medical OfficeBallenger Crow
Development, Flint,MI . . . . . . . . . . . . . . . 5,958 — 2,861 — 2,837 — 5,698 — 5,698 — — 2006 2006
REAL ESTATE UNDER DEVELOPMENT (NON-CURRENT)Land150 Beachview, Jekyll
Island, GA . . . . . . . . . — — — 2,900 (464) 80 — 2,356 2,436 — — N/A 2009301 Ocean, Santa
Monica, CA . . . . . . . 10,800 50,396 — — (21,577) 28,819 — — 28,819 — — N/A 2007Branford, Los Angeles,
CA . . . . . . . . . . . . . . . 13,945 19,105 — — 7,634 26,739 — — 26,739 — — N/A 2007Buccaneer, Jekyll
Island, GA . . . . . . . . . — — — 9,600 (5,714) 72 — 3,814 3,886 — — N/A 2009Timbercreek, Dallas,
TX . . . . . . . . . . . . . . . 46,002 33,865 — — 17,075 50,940 — — 50,940 — — N/A 2006
REAL ESTATE HELD FOR INVESTMENTIndustrialBellbrook Industrial,
Memphis, TN . . . . . . 16,633 9,642 1,627 3,657 5,000 9,716 9,933 277 19,926 (1,119) 39 1975 2007Brampton, Brampton,
ON . . . . . . . . . . . . . . — 2,473 — — 966 3,370 69 — 3,439 (5) 39 2006 2006Hobby, Oklahoma City,
OK . . . . . . . . . . . . . . 5,911 1,339 6,591 — 913 1,420 7,423 — 8,843 (762) 39 1975 2008
141
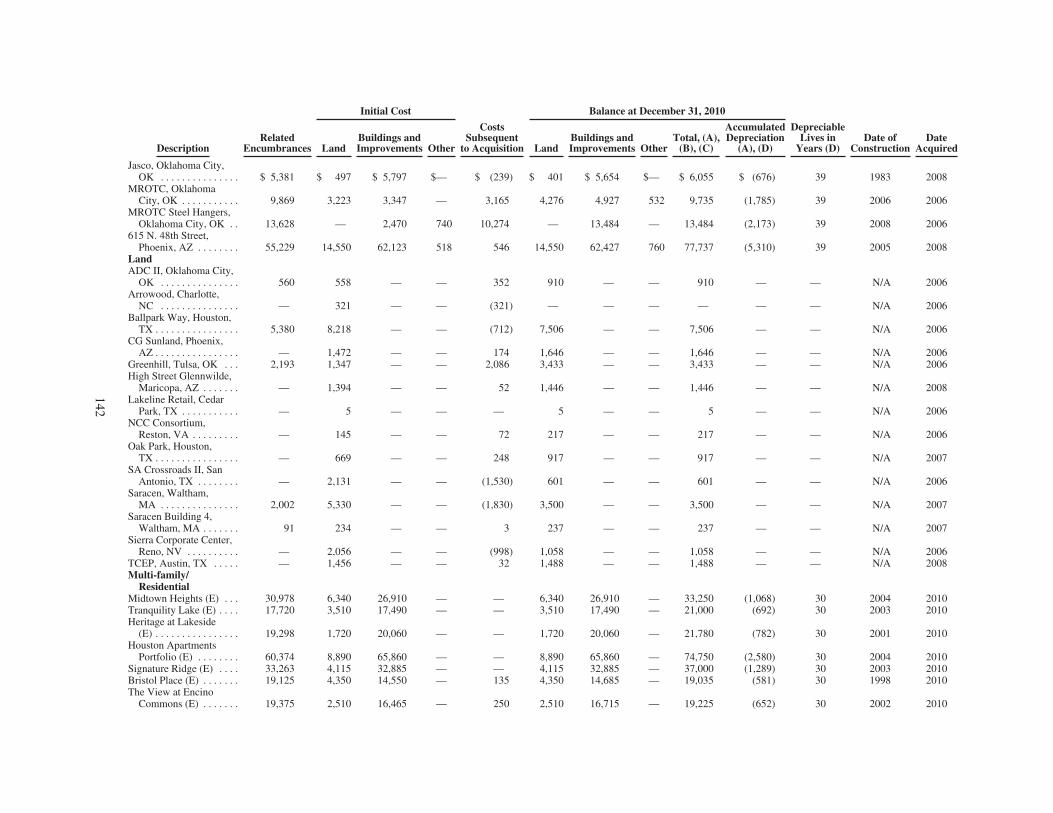
RelatedEncumbrances
Initial Cost
CostsSubsequent
to Acquisition
Balance at December 31, 2010
DepreciableLives in
Years (D)Date of
ConstructionDate
AcquiredDescription LandBuildings andImprovements Other Land
Buildings andImprovements Other
Total, (A),(B), (C)
AccumulatedDepreciation
(A), (D)
Jasco, Oklahoma City,OK . . . . . . . . . . . . . . . $ 5,381 $ 497 $ 5,797 $— $ (239) $ 401 $ 5,654 $— $ 6,055 $ (676) 39 1983 2008
MROTC, OklahomaCity, OK . . . . . . . . . . . 9,869 3,223 3,347 — 3,165 4,276 4,927 532 9,735 (1,785) 39 2006 2006
MROTC Steel Hangers,Oklahoma City, OK . . 13,628 — 2,470 740 10,274 — 13,484 — 13,484 (2,173) 39 2008 2006
615 N. 48th Street,Phoenix, AZ . . . . . . . . 55,229 14,550 62,123 518 546 14,550 62,427 760 77,737 (5,310) 39 2005 2008
LandADC II, Oklahoma City,
OK . . . . . . . . . . . . . . . 560 558 — — 352 910 — — 910 — — N/A 2006Arrowood, Charlotte,
NC . . . . . . . . . . . . . . . — 321 — — (321) — — — — — — N/A 2006Ballpark Way, Houston,
TX . . . . . . . . . . . . . . . . 5,380 8,218 — — (712) 7,506 — — 7,506 — — N/A 2006CG Sunland, Phoenix,
AZ . . . . . . . . . . . . . . . . — 1,472 — — 174 1,646 — — 1,646 — — N/A 2006Greenhill, Tulsa, OK . . . 2,193 1,347 — — 2,086 3,433 — — 3,433 — — N/A 2006High Street Glennwilde,
Maricopa, AZ . . . . . . . — 1,394 — — 52 1,446 — — 1,446 — — N/A 2008Lakeline Retail, Cedar
Park, TX . . . . . . . . . . . — 5 — — — 5 — — 5 — — N/A 2006NCC Consortium,
Reston, VA . . . . . . . . . — 145 — — 72 217 — — 217 — — N/A 2006Oak Park, Houston,
TX . . . . . . . . . . . . . . . . — 669 — — 248 917 — — 917 — — N/A 2007SA Crossroads II, San
Antonio, TX . . . . . . . . — 2,131 — — (1,530) 601 — — 601 — — N/A 2006Saracen, Waltham,
MA . . . . . . . . . . . . . . . 2,002 5,330 — — (1,830) 3,500 — — 3,500 — — N/A 2007Saracen Building 4,
Waltham, MA . . . . . . . 91 234 — — 3 237 — — 237 — — N/A 2007Sierra Corporate Center,
Reno, NV . . . . . . . . . . — 2,056 — — (998) 1,058 — — 1,058 — — N/A 2006TCEP, Austin, TX . . . . . — 1,456 — — 32 1,488 — — 1,488 — — N/A 2008Multi-family/
ResidentialMidtown Heights (E) . . . 30,978 6,340 26,910 — — 6,340 26,910 — 33,250 (1,068) 30 2004 2010Tranquility Lake (E) . . . . 17,720 3,510 17,490 — — 3,510 17,490 — 21,000 (692) 30 2003 2010Heritage at Lakeside
(E) . . . . . . . . . . . . . . . . 19,298 1,720 20,060 — — 1,720 20,060 — 21,780 (782) 30 2001 2010Houston Apartments
Portfolio (E) . . . . . . . . 60,374 8,890 65,860 — — 8,890 65,860 — 74,750 (2,580) 30 2004 2010Signature Ridge (E) . . . . 33,263 4,115 32,885 — — 4,115 32,885 — 37,000 (1,289) 30 2003 2010Bristol Place (E) . . . . . . . 19,125 4,350 14,550 — 135 4,350 14,685 — 19,035 (581) 30 1998 2010The View at Encino
Commons (E) . . . . . . . 19,375 2,510 16,465 — 250 2,510 16,715 — 19,225 (652) 30 2002 2010
142
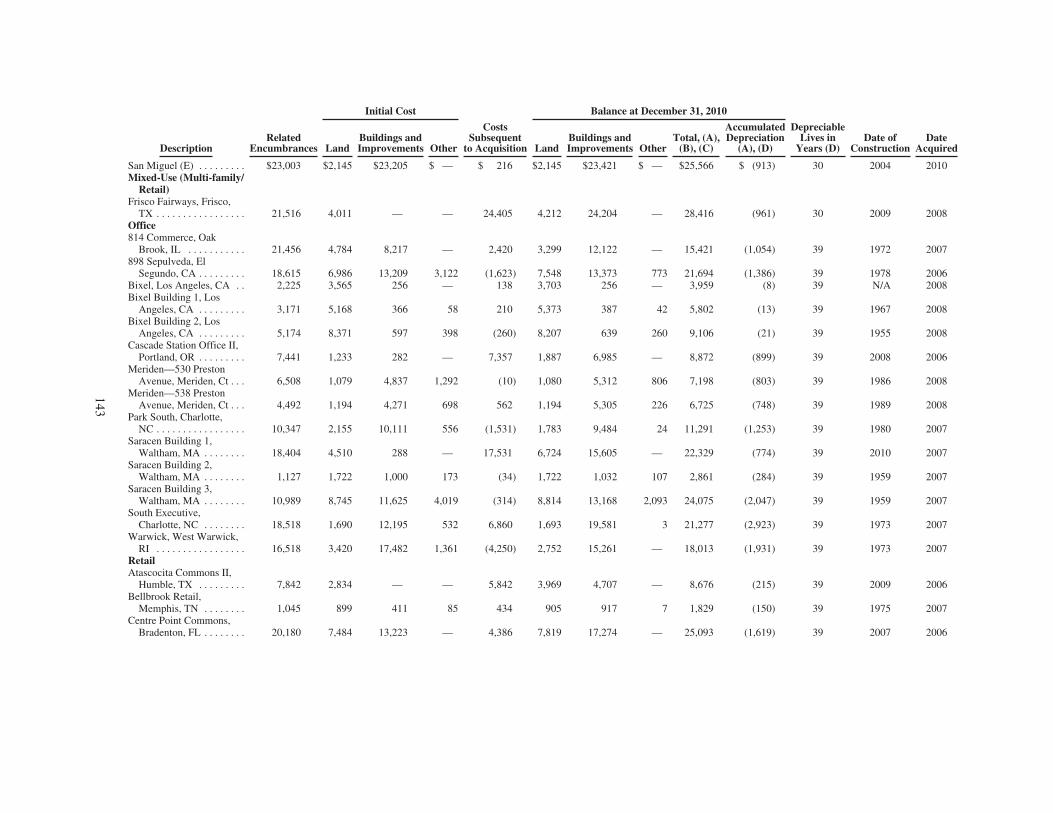
RelatedEncumbrances
Initial Cost
CostsSubsequent
to Acquisition
Balance at December 31, 2010
DepreciableLives in
Years (D)Date of
ConstructionDate
AcquiredDescription LandBuildings andImprovements Other Land
Buildings andImprovements Other
Total, (A),(B), (C)
AccumulatedDepreciation
(A), (D)
San Miguel (E) . . . . . . . . . $23,003 $2,145 $23,205 $ — $ 216 $2,145 $23,421 $ — $25,566 $ (913) 30 2004 2010Mixed-Use (Multi-family/
Retail)Frisco Fairways, Frisco,
TX . . . . . . . . . . . . . . . . . 21,516 4,011 — — 24,405 4,212 24,204 — 28,416 (961) 30 2009 2008Office814 Commerce, Oak
Brook, IL . . . . . . . . . . . 21,456 4,784 8,217 — 2,420 3,299 12,122 — 15,421 (1,054) 39 1972 2007898 Sepulveda, El
Segundo, CA . . . . . . . . . 18,615 6,986 13,209 3,122 (1,623) 7,548 13,373 773 21,694 (1,386) 39 1978 2006Bixel, Los Angeles, CA . . 2,225 3,565 256 — 138 3,703 256 — 3,959 (8) 39 N/A 2008Bixel Building 1, Los
Angeles, CA . . . . . . . . . 3,171 5,168 366 58 210 5,373 387 42 5,802 (13) 39 1967 2008Bixel Building 2, Los
Angeles, CA . . . . . . . . . 5,174 8,371 597 398 (260) 8,207 639 260 9,106 (21) 39 1955 2008Cascade Station Office II,
Portland, OR . . . . . . . . . 7,441 1,233 282 — 7,357 1,887 6,985 — 8,872 (899) 39 2008 2006Meriden—530 Preston
Avenue, Meriden, Ct . . . 6,508 1,079 4,837 1,292 (10) 1,080 5,312 806 7,198 (803) 39 1986 2008Meriden—538 Preston
Avenue, Meriden, Ct . . . 4,492 1,194 4,271 698 562 1,194 5,305 226 6,725 (748) 39 1989 2008Park South, Charlotte,
NC . . . . . . . . . . . . . . . . . 10,347 2,155 10,111 556 (1,531) 1,783 9,484 24 11,291 (1,253) 39 1980 2007Saracen Building 1,
Waltham, MA . . . . . . . . 18,404 4,510 288 — 17,531 6,724 15,605 — 22,329 (774) 39 2010 2007Saracen Building 2,
Waltham, MA . . . . . . . . 1,127 1,722 1,000 173 (34) 1,722 1,032 107 2,861 (284) 39 1959 2007Saracen Building 3,
Waltham, MA . . . . . . . . 10,989 8,745 11,625 4,019 (314) 8,814 13,168 2,093 24,075 (2,047) 39 1959 2007South Executive,
Charlotte, NC . . . . . . . . 18,518 1,690 12,195 532 6,860 1,693 19,581 3 21,277 (2,923) 39 1973 2007Warwick, West Warwick,
RI . . . . . . . . . . . . . . . . . 16,518 3,420 17,482 1,361 (4,250) 2,752 15,261 — 18,013 (1,931) 39 1973 2007RetailAtascocita Commons II,
Humble, TX . . . . . . . . . 7,842 2,834 — — 5,842 3,969 4,707 — 8,676 (215) 39 2009 2006Bellbrook Retail,
Memphis, TN . . . . . . . . 1,045 899 411 85 434 905 917 7 1,829 (150) 39 1975 2007Centre Point Commons,
Bradenton, FL . . . . . . . . 20,180 7,484 13,223 — 4,386 7,819 17,274 — 25,093 (1,619) 39 2007 2006
143
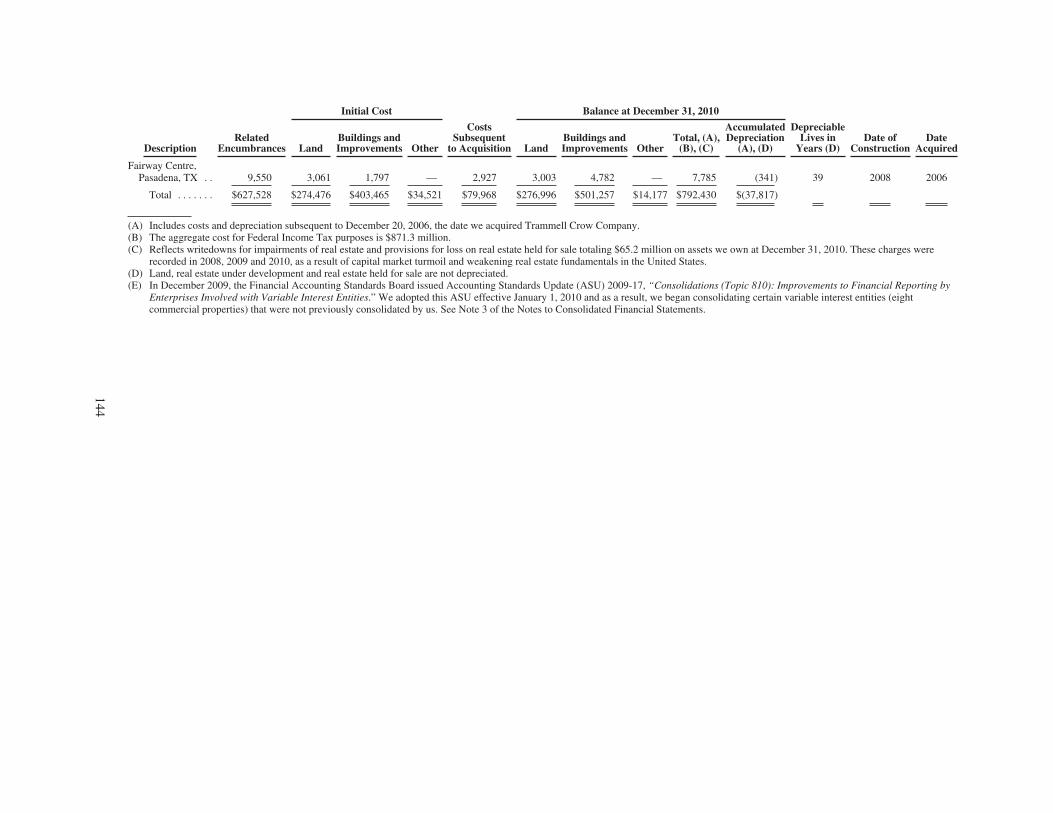
RelatedEncumbrances
Initial Cost
CostsSubsequent
to Acquisition
Balance at December 31, 2010
DepreciableLives in
Years (D)Date of
ConstructionDate
AcquiredDescription LandBuildings andImprovements Other Land
Buildings andImprovements Other
Total, (A),(B), (C)
AccumulatedDepreciation
(A), (D)
Fairway Centre,Pasadena, TX . . 9,550 3,061 1,797 — 2,927 3,003 4,782 — 7,785 (341) 39 2008 2006
Total . . . . . . . $627,528 $274,476 $403,465 $34,521 $79,968 $276,996 $501,257 $14,177 $792,430 $(37,817)
(A) Includes costs and depreciation subsequent to December 20, 2006, the date we acquired Trammell Crow Company.(B) The aggregate cost for Federal Income Tax purposes is $871.3 million.(C) Reflects writedowns for impairments of real estate and provisions for loss on real estate held for sale totaling $65.2 million on assets we own at December 31, 2010. These charges were
recorded in 2008, 2009 and 2010, as a result of capital market turmoil and weakening real estate fundamentals in the United States.(D) Land, real estate under development and real estate held for sale are not depreciated.(E) In December 2009, the Financial Accounting Standards Board issued Accounting Standards Update (ASU) 2009-17, “Consolidations (Topic 810): Improvements to Financial Reporting by
Enterprises Involved with Variable Interest Entities.” We adopted this ASU effective January 1, 2010 and as a result, we began consolidating certain variable interest entities (eightcommercial properties) that were not previously consolidated by us. See Note 3 of the Notes to Consolidated Financial Statements.
144
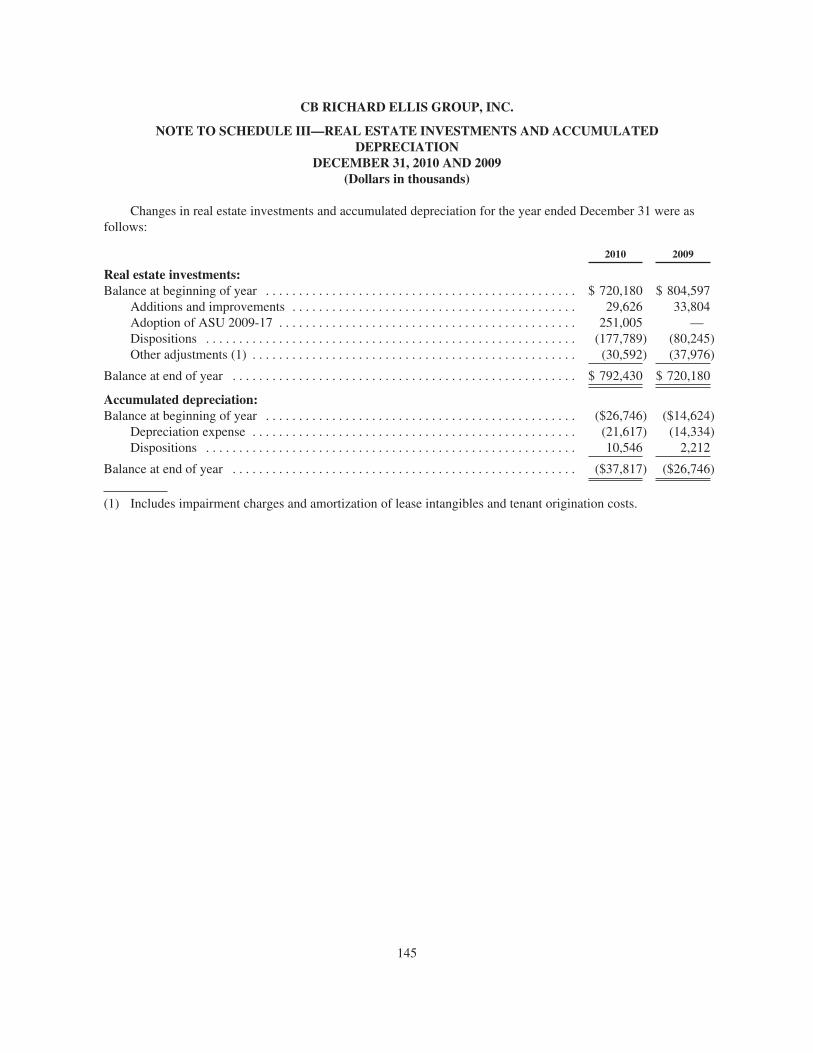
CB RICHARD ELLIS GROUP, INC.
NOTE TO SCHEDULE III—REAL ESTATE INVESTMENTS AND ACCUMULATEDDEPRECIATION
DECEMBER 31, 2010 AND 2009(Dollars in thousands)
Changes in real estate investments and accumulated depreciation for the year ended December 31 were asfollows:
2010 2009
Real estate investments:Balance at beginning of year . . . . . . . . . . . . . . . . . . . . . . . . . . . . . . . . . . . . . . . . . . . . . . . $ 720,180 $ 804,597
Additions and improvements . . . . . . . . . . . . . . . . . . . . . . . . . . . . . . . . . . . . . . . . . . . 29,626 33,804Adoption of ASU 2009-17 . . . . . . . . . . . . . . . . . . . . . . . . . . . . . . . . . . . . . . . . . . . . . 251,005 —Dispositions . . . . . . . . . . . . . . . . . . . . . . . . . . . . . . . . . . . . . . . . . . . . . . . . . . . . . . . . (177,789) (80,245)Other adjustments (1) . . . . . . . . . . . . . . . . . . . . . . . . . . . . . . . . . . . . . . . . . . . . . . . . . (30,592) (37,976)
Balance at end of year . . . . . . . . . . . . . . . . . . . . . . . . . . . . . . . . . . . . . . . . . . . . . . . . . . . . $ 792,430 $ 720,180
Accumulated depreciation:Balance at beginning of year . . . . . . . . . . . . . . . . . . . . . . . . . . . . . . . . . . . . . . . . . . . . . . . ($26,746) ($14,624)
Depreciation expense . . . . . . . . . . . . . . . . . . . . . . . . . . . . . . . . . . . . . . . . . . . . . . . . . (21,617) (14,334)Dispositions . . . . . . . . . . . . . . . . . . . . . . . . . . . . . . . . . . . . . . . . . . . . . . . . . . . . . . . . 10,546 2,212
Balance at end of year . . . . . . . . . . . . . . . . . . . . . . . . . . . . . . . . . . . . . . . . . . . . . . . . . . . . ($37,817) ($26,746)
(1) Includes impairment charges and amortization of lease intangibles and tenant origination costs.
145

SIGNATURES
Pursuant to the requirements of the Securities Exchange Act of 1934, the registrant has duly caused thisreport to be signed on its behalf by the undersigned, thereunto duly authorized.
CB RICHARD ELLIS GROUP, INC.
By: /S/ BRETT WHITE
Brett WhiteChief Executive Officer
Date: March 1, 2011
Pursuant to the requirements of the Securities Exchange Act of 1934, this report has been signed below bythe following persons on behalf of the registrant and in the capacities and on the dates indicated.
Signature Title Date
/S/ RICHARD C. BLUM
Richard C. Blum
Chairman of the Board March 1, 2011
/S/ GIL BOROK
Gil Borok
Chief Financial Officer (principalfinancial officer)
March 1, 2011
/S/ CURTIS F. FEENY
Curtis F. Feeny
Director March 1, 2011
/S/ BRADFORD M. FREEMAN
Bradford M. Freeman
Director March 1, 2011
/S/ ARLIN GAFFNER
Arlin Gaffner
Chief Accounting Officer (principalaccounting officer)
March 1, 2011
/S/ MICHAEL KANTOR
Michael Kantor
Director March 1, 2011
/S/ FREDERIC V. MALEK
Frederic V. Malek
Director March 1, 2011
/S/ JANE J. SU
Jane J. Su
Director March 1, 2011
/S/ LAURA D. TYSON
Laura D. Tyson
Director March 1, 2011
/S/ BRETT WHITE
Brett White
Director and Chief Executive Officer(principal executive officer)
March 1, 2011
146

Signature Title Date
/S/ GARY L. WILSON
Gary L. Wilson
Director March 1, 2011
/S/ RAY WIRTA
Ray Wirta
Director March 1, 2011
147
EXHIBIT INDEX
Exhibit Description
2.1 Share Purchase Agreement, dated as of February 15, 2011, by and among Investment ManagementHolding B.V. and others, CB Richard Ellis Group, Inc. and others (CRES Share Purchase Agreement)(incorporated by reference to Exhibit 2.1 of the CB Richard Ellis Group, Inc. Current Report on Form8-K filed with the SEC on February 18, 2011)
2.2 Share Purchase Agreement, dated as of February 15, 2011, by and among Investment ManagementHolding B.V. and others, CB Richard Ellis Group, Inc. and others (PERE Share Purchase Agreement)(incorporated by reference to Exhibit 2.2 of the CB Richard Ellis Group, Inc. Current Report on Form8-K filed with the SEC on February 18, 2011)
3.1 Restated Certificate of Incorporation of CB Richard Ellis Group, Inc. filed on June 16, 2004, asamended by the Certificate of Amendment filed on June 4, 2009 (incorporated by reference toExhibit 3.1 of the CB Richard Ellis Group, Inc. Quarterly Report on Form 10-Q filed with the SEC onAugust 10, 2009)
3.2 Amended and Restated By-laws of CB Richard Ellis Group, Inc. (incorporated by reference to Exhibit3.2 of the CB Richard Ellis Group, Inc. Current Report on Form 8-K filed with the SEC onDecember 5, 2008)
4.1 Form of Class A common stock certificate of CB Richard Ellis Group, Inc. (incorporated by referenceto Exhibit 4.1 of the CB Richard Ellis Group, Inc. Amendment No. 2 to Registration Statement onForm S-1 filed with the SEC (No. 333-112867) on April 30, 2004)
4.2(a) Securityholders’ Agreement, dated as of July 20, 2001 (“Securityholders’ Agreement”), by andamong, CB Richard Ellis Group, Inc., CB Richard Ellis Services, Inc., Blum Strategic Partners, L.P.,Blum Strategic Partners II, L.P., Blum Strategic Partners II GmbH & Co. KG, FS Equity Partners III,L.P., FS Equity Partners International, L.P., Credit Suisse First Boston Corporation, DLJ InvestmentFunding, Inc., The Koll Holding Company, Frederic V. Malek, the management investors namedtherein and the other persons from time to time party thereto (incorporated by reference to Exhibit 25to Amendment No. 9 to Schedule 13D with respect to CB Richard Ellis Services, Inc. filed with theSEC on July 25, 2001)
4.2(b) Amendment and Waiver to Securityholders’ Agreement, dated as of April 14, 2004, by and among,CB Richard Ellis Group, Inc., CB Richard Ellis Services, Inc. and the other parties to theSecurityholders’ Agreement (incorporated by reference to Exhibit 4.2(b) of the CB Richard EllisGroup, Inc. Amendment No. 2 to Registration Statement on Form S-1 filed with the SEC(No. 333-112867) on April 30, 2004)
4.2(c) Second Amendment and Waiver to Securityholders’ Agreement, dated as of November 24, 2004, byand among CB Richard Ellis Group, Inc., CB Richard Ellis Services, Inc. and certain of the otherparties to the Securityholders’ Agreement (incorporated by reference to Exhibit 4.2(c) of the CBRichard Ellis Group, Inc. Amendment No. 1 to Registration Statement on Form S-1 filed with theSEC (No. 333-120445) on November 24, 2004)
4.2(d) Third Amendment and Waiver to Securityholders’ Agreement, dated as of August 1, 2005, by andamong CB Richard Ellis Group, Inc., CB Richard Ellis Services, Inc. and certain of the other partiesto the Securityholders’ Agreement (incorporated by reference to Exhibit 4.1 of the CB Richard EllisGroup, Inc. Current Report on Form 8-K filed with the SEC on August 2, 2005)
4.3(a) Indenture, dated as of June 18, 2009, among CB Richard Ellis Services, Inc., CB Richard EllisGroup, Inc., the other guarantors party thereto and Wells Fargo Bank, National Association, astrustee, for the 11.625% Senior Subordinated Notes Due June 15, 2017 (incorporated by reference toExhibit 4.1 of the CB Richard Ellis Group, Inc. Form 8-K filed with the SEC on June 23, 2009)
148
Exhibit Description
4.3(b) Form of Supplemental Indenture among CB Richard Ellis Services, Inc., CB Richard EllisGroup, Inc., certain new U.S. subsidiaries from time-to-time, the other guarantors party thereto andWells Fargo Bank, National Association, as trustee, for the 11.625% Senior Subordinated Notes DueJune 15, 2017 (incorporated by reference to Exhibit 4.1 of the CB Richard Ellis Group, Inc. Form 8-Kfiled with the SEC on September 10, 2009)
4.4 Form of Exchange Note (included in Exhibit 4.3(a))
4.5 Registration Rights Agreement, dated June 15, 2009, among CB Richard Ellis Services, Inc., CBRichard Ellis Group, Inc., the other guarantors party thereto, and Banc of America Securities LLC,Credit Suisse Securities (USA) LLC and J.P. Morgan Securities Inc., as representatives of the initialpurchasers (incorporated by reference to Exhibit 4.4 of the CB Richard Ellis Group, Inc. Form 8-Kfiled with the SEC on June 23, 2009)
4.6(a) Indenture, dated as of October 8, 2010, among CB Richard Ellis Services, Inc., CB Richard EllisGroup, Inc., the other guarantors party thereto and Wells Fargo Bank, National Association, astrustee, for the 6.625% Senior Notes Due October 15, 2020 (incorporated by reference to Exhibit 4.1of the CB Richard Ellis Group, Inc. Form 8-K filed with the SEC on October 12, 2010)
4.6(b) Form of Supplemental Indenture among CB Richard Ellis Services, Inc., CB Richard EllisGroup, Inc., certain new U.S. subsidiaries from time-to-time, the other guarantors party thereto andWells Fargo Bank, National Association, as trustee, for the 6.625% Senior Notes Due October 15,2020 (incorporated by reference to Exhibit 4.1 of the CB Richard Ellis Group, Inc. Form 8-K filedwith the SEC on November 17, 2010)
4.7 Form of Exchange Note (included in Exhibit 4.6(a))
4.8 Registration Rights Agreement, dated October 8, 2010, among CB Richard Ellis Services, Inc., CBRichard Ellis Group, Inc., the other guarantors party thereto, and Banc of America Securities LLC andCredit Suisse Securities (USA) LLC, as representatives of the initial purchasers (incorporated byreference to Exhibit 4.4 of the CB Richard Ellis Group, Inc. Form 8-K filed with the SEC onOctober 12, 2010)
10.1(a) Second Amended and Restated Credit Agreement, dated as of March 24, 2009, by and among CBRichard Ellis Services, Inc., CB Richard Ellis Group, Inc., certain Subsidiaries of CB Richard EllisServices, Inc., the lenders named therein and Credit Suisse, as Administrative Agent and CollateralAgent (incorporated by reference to Exhibit 10.1(a) of the CB Richard Ellis Group, Inc. Form 10-Qfiled with the SEC on August 9, 2010)
10.1(b) Amendment No. 1, dated as of August 6, 2009, to the Second Amended and Restated CreditAgreement, dated as of March 24, 2009, among CB Richard Ellis Services, Inc., certain Subsidiariesof CB Richard Ellis Services, Inc., CB Richard Ellis Group, Inc., the lenders parties thereto and CreditSuisse, as administrative agent and collateral agent (incorporated by reference to Exhibit 10.1 of theCB Richard Ellis Group, Inc. Form 8-K filed with the SEC on August 12, 2009)
10.1(c) Loan Modification Agreement, dated as of August 24, 2009, relating to the Second Amended andRestated Credit Agreement, dated as of March 24, 2009, among CB Richard Ellis Services, Inc.,certain Subsidiaries of CB Richard Ellis Services, Inc., CB Richard Ellis Group, Inc., the lendersparties thereto and Credit Suisse, as administrative agent and collateral agent (incorporated byreference to Exhibit 10.1 of the CB Richard Ellis Group, Inc. Form 8-K filed with the SEC onAugust 28, 2009)
10.1(d) Loan Modification Agreement, dated as of February 5, 2010, relating to the Second Amended andRestated Credit Agreement, dated as of March 24, 2009, among CB Richard Ellis Services, Inc.,certain Subsidiaries of CB Richard Ellis Services, Inc., CB Richard Ellis Group, Inc., the lendersparties thereto and Credit Suisse, as administrative agent and collateral agent (incorporated byreference to Exhibit 10.1 of the CB Richard Ellis Group, Inc. Form 8-K filed with the SEC onFebruary 10, 2010)
149
Exhibit Description
10.1(e) Loan Modification Agreement, dated as of March 29, 2010, relating to the Second Amended andRestated Credit Agreement, dated as of March 24, 2009, among CB Richard Ellis Services, Inc.,certain Subsidiaries of CB Richard Ellis Services, Inc., CB Richard Ellis Group, Inc., the lendersparties thereto and Credit Suisse, as administrative agent and collateral agent (incorporated byreference to Exhibit 10.1 of the CB Richard Ellis Group, Inc. Form 8-K filed with the SEC on April 2,2010)
10.1(f) Amended and Restated Guarantee and Pledge Agreement, dated as of March 24, 2009, by and amongCB Richard Ellis Services, Inc., CB Richard Ellis Group, Inc., certain Subsidiaries of CB RichardEllis Services, Inc. and Credit Suisse, as Collateral Agent (incorporated by reference toExhibit 10.1(b) of the CB Richard Ellis Group, Inc. Form 10-Q filed with the SEC on August 9, 2010)
10.1(g) Form of Supplement, between certain new U.S. subsidiaries from time-to-time and Credit Suisse, ascollateral agent, to the Amended and Restated Guarantee and Pledge Agreement, dated as ofMarch 24, 2009, by and among CB Richard Ellis Services, Inc., CB Richard Ellis Group, Inc., certainSubsidiaries of CB Richard Ellis Services, Inc. and Credit Suisse, as collateral agent (incorporated byreference to Exhibit 10.1 of the CB Richard Ellis Group, Inc. Form 8-K filed with the SEC onSeptember 10, 2009)
10.1(h) Form of Supplement between certain non-U.S. subsidiaries of CB Richard Ellis Group, Inc. (ascontemplated by Section 5.09(b) of the Second Amended and Restated Credit Agreement, dated as ofMarch 24, 2009, by and among CB Richard Ellis Services, Inc., certain subsidiaries of CB RichardEllis Services, Inc., CB Richard Ellis Group, Inc., the lenders parties thereto and Credit Suisse AG, asadministrative agent and collateral agent) and Credit Suisse AG, as collateral agent, to the Amendedand Restated Guarantee and Pledge Agreement, dated as of March 24, 2009, by and among CBRichard Ellis Services, Inc., CB Richard Ellis Group, Inc., certain subsidiaries of CB Richard EllisServices, Inc. and Credit Suisse AG, as collateral agent (incorporated by reference to Exhibit 10.2 ofthe CB Richard Ellis Group, Inc. Form 8-K filed with the SEC on February 10, 2010)
10.2 Credit Agreement, dated as of November 10, 2010, among CB Richard Ellis Group, Inc., CB RichardEllis Services, Inc., certain subsidiaries of CB Richard Ellis Services, Inc., Credit Suisse AG, asadministrative agent and collateral agent, and the lenders party thereto (incorporated by reference toExhibit 10.1 of the CB Richard Ellis Group, Inc. Form 8-K filed with the SEC on November 17,2010)
10.3 Guarantee and Pledge Agreement, dated as of November 10, 2010, among CB Richard Ellis Group,Inc., CB Richard Ellis Services, Inc., the subsidiary guarantors party thereto and Credit Suisse AG, ascollateral agent (incorporated by reference to Exhibit 10.2 of the CB Richard Ellis Group, Inc.Form 8-K filed with the SEC on November 17, 2010)
10.4 CB Richard Ellis Group, Inc. 2001 Stock Incentive Plan, as amended (incorporated by reference toExhibit 10.1 of the CB Richard Ellis Group, Inc. Annual Report on Form 10-K filed with the SEC onMarch 25, 2003) +
10.5(a) Second Amended and Restated 2004 Stock Incentive Plan of CB Richard Ellis Group, Inc., datedJune 2, 2008 (incorporated by reference to Exhibit 10.1 of the CB Richard Ellis Group, Inc. CurrentReport on Form 8-K filed with the SEC on June 6, 2008) +
10.5(b) Amendment No. 1 to the Second Amended and Restated 2004 Stock Incentive Plan of CB RichardEllis Group, Inc., dated December 3, 2008 (incorporated by reference to Exhibit 10.3 of the CBRichard Ellis Group, Inc. Quarterly Report on Form 10-Q filed with the SEC on May 11, 2009) +
10.6(a) CB Richard Ellis Services, Inc. Amended and Restated 401(k) Plan, as amended (incorporated byreference to Exhibit 10.12 of the CB Richard Ellis Group, Inc. Annual Report on Form 10-K filedwith the SEC on March 25, 2003) +
10.6(b) Amendment to CB Richard Ellis Services, Inc. Amended and Restated 401(k) Plan, dated March 31,2006 (incorporated by reference to Exhibit 10.5(b) of the CB Richard Ellis Group, Inc. QuarterlyReport on Form 10-Q filed with the SEC on May 10, 2006) +
150
Exhibit Description
10.7(a) CB Richard Ellis Services, Inc. Amended and Restated Deferred Compensation Plan, as amended(incorporated by reference to Exhibit 10.11 of the CB Richard Ellis Group, Inc. Annual Report onForm 10-K filed with the SEC on March 25, 2003) +
10.7(b) CB Richard Ellis Deferred Compensation Plan effective as of August 1, 2004 (incorporated byreference to Exhibit 4.1 of the CB Richard Ellis Group, Inc. Registration Statement on Form S-8filed with the SEC (No. 333-119362) on September 29, 2004) +
10.7(c) Amendment, dated as of November 18, 2005, to CB Richard Ellis Deferred Compensation Plan(incorporated by reference to Exhibit 10.12(b) of the CB Richard Ellis Group, Inc. Annual Report onForm 10-K filed with the SEC on March 16, 2006) +
10.7(d) Amended and Restated CB Richard Ellis Deferred Compensation Plan (incorporated by reference toExhibit 10.1 of the CB Richard Ellis Group, Inc. Current Report on Form 8-K filed with the SEC onAugust 18, 2008) +
10.7(e) Amendment No. 2 to the CB Richard Ellis Pre August 1, 2004 Deferred Compensation Plan(incorporated by reference to Exhibit 10.2 of the CB Richard Ellis Group, Inc. Current Report onForm 8-K filed with the SEC on August 18, 2008) +
10.7(f) Merger and Amendment of CB Richard Ellis Deferred Compensation Plans, dated as ofNovember 21, 2008 (incorporated by reference to Exhibit 10.5(f) of the CB Richard Ellis Group, Inc.Form 10-K filed with the SEC on March 1, 2010) +
10.8 Executive Bonus Plan, amended and restated as of March 19, 2007 (incorporated by reference toExhibit 10.1 of the CB Richard Ellis Group, Inc. Quarterly Report on Form 10-Q filed with the SECon May 10, 2007) +
10.9 Executive Incentive Plan, effective as of January 1, 2007 (incorporated by reference to Exhibit 10.1of the CB Richard Ellis Group, Inc. Quarterly Report on Form 10-Q filed with the SEC on August 9,2007) +
10.10 Form of Indemnification Agreement for Directors and Officers (incorporated by reference to Exhibit10.1 of the CB Richard Ellis Group, Inc. Current Report on Form 8-K filed with the SEC onDecember 8, 2009) +
10.11 Special Retention Award Restricted Stock Unit Agreement, dated March 4, 2010 between CBRichard Ellis Group, Inc. and Brett White (incorporated by reference to Exhibit 10.1 of the CBRichard Ellis Group, Inc. Form 8-K filed with the SEC on March 8, 2010) +
10.12 Employment Agreement, dated November 21, 2008, between Gil Borok and CB Richard Ellis, Inc.(incorporated by reference to Exhibit 10.16 of the CB Richard Ellis Group, Inc. Annual Report onForm 10-K filed with the SEC on March 2, 2009) +
11 Statement concerning Computation of Per Share Earnings (filed as Note 17 of the ConsolidatedFinancial Statements)
12 Computation of Ratio of Earnings to Fixed Charges*
21 Subsidiaries of CB Richard Ellis Group, Inc.*
23.1 Consent of Independent Registered Public Accounting Firm*
31.1 Certification of Chief Executive Officer, pursuant to Rule 13a-14(a) and Rule 15d-14(a) of theSecurities Exchange Act of 1934, as amended (adopted pursuant to Section 302 of theSarbanes-Oxley Act of 2002)*
31.2 Certification of Chief Financial Officer, pursuant to Rule 13a-14(a) and Rule 15d-14(a) of theSecurities Exchange Act of 1934, as amended (adopted pursuant to Section 302 of theSarbanes-Oxley Act of 2002)*
151
Exhibit Description
32 Certifications by Chief Executive Officer and Chief Financial Officer, pursuant to 18 U.S.C. 1350(adopted pursuant to Section 906 of the Sarbanes-Oxley Act of 2002)*
101.INS XBRL Instance Document**
101.SCH XBRL Taxonomy Extension Schema Document**
101.CAL XBRL Taxonomy Extension Calculation Linkbase Document**
101.DEF XBRL Taxonomy Extension Definition Linkbase Document**
101.LAB XBRL Taxonomy Extension Label Linkbase Document**
101.PRE XBRL Taxonomy Extension Presentation Linkbase Document**
+ Denotes a management contract or compensatory plan or arrangement* Filed herewith** XBRL (Extensible Business Reporting Language) information is furnished and not filed herewith, is not a
part of a registration statement or Prospectus for purposes of sections 11 or 12 of the Securities Act of 1933,is deemed not filed for purposes of section 18 of the Securities Exchange Act of 1934, and otherwise is notsubject to liability under these sections.
152
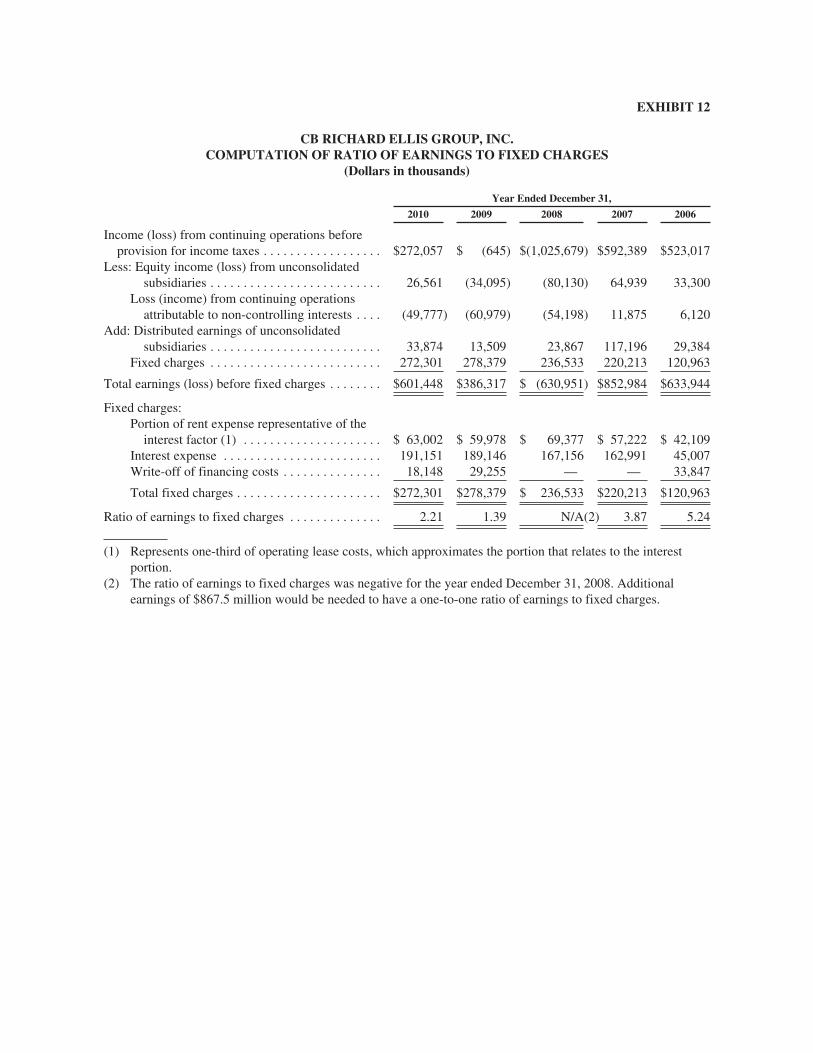
EXHIBIT 12
CB RICHARD ELLIS GROUP, INC.COMPUTATION OF RATIO OF EARNINGS TO FIXED CHARGES
(Dollars in thousands)
Year Ended December 31,
2010 2009 2008 2007 2006
Income (loss) from continuing operations beforeprovision for income taxes . . . . . . . . . . . . . . . . . . $272,057 $ (645) $(1,025,679) $592,389 $523,017
Less: Equity income (loss) from unconsolidatedsubsidiaries . . . . . . . . . . . . . . . . . . . . . . . . . . 26,561 (34,095) (80,130) 64,939 33,300
Loss (income) from continuing operationsattributable to non-controlling interests . . . . (49,777) (60,979) (54,198) 11,875 6,120
Add: Distributed earnings of unconsolidatedsubsidiaries . . . . . . . . . . . . . . . . . . . . . . . . . . 33,874 13,509 23,867 117,196 29,384
Fixed charges . . . . . . . . . . . . . . . . . . . . . . . . . . 272,301 278,379 236,533 220,213 120,963
Total earnings (loss) before fixed charges . . . . . . . . $601,448 $386,317 $ (630,951) $852,984 $633,944
Fixed charges:Portion of rent expense representative of the
interest factor (1) . . . . . . . . . . . . . . . . . . . . . $ 63,002 $ 59,978 $ 69,377 $ 57,222 $ 42,109Interest expense . . . . . . . . . . . . . . . . . . . . . . . . 191,151 189,146 167,156 162,991 45,007Write-off of financing costs . . . . . . . . . . . . . . . 18,148 29,255 — — 33,847
Total fixed charges . . . . . . . . . . . . . . . . . . . . . . $272,301 $278,379 $ 236,533 $220,213 $120,963
Ratio of earnings to fixed charges . . . . . . . . . . . . . . 2.21 1.39 N/A(2) 3.87 5.24
(1) Represents one-third of operating lease costs, which approximates the portion that relates to the interestportion.
(2) The ratio of earnings to fixed charges was negative for the year ended December 31, 2008. Additionalearnings of $867.5 million would be needed to have a one-to-one ratio of earnings to fixed charges.
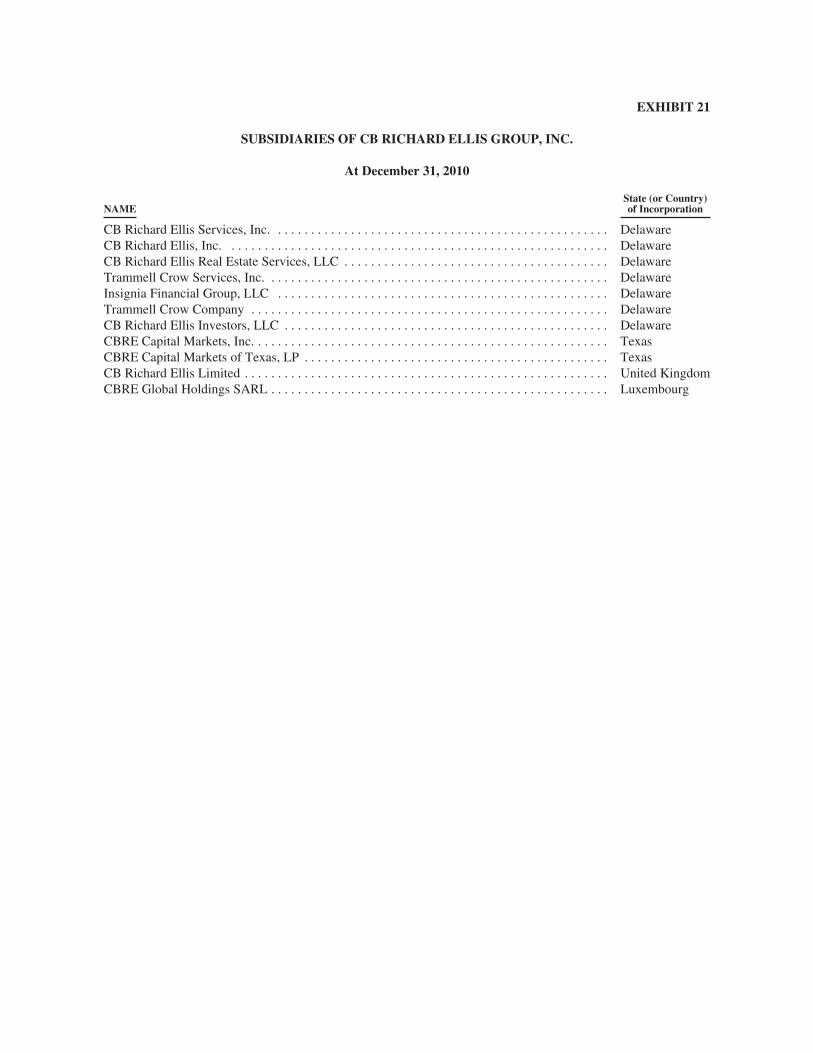
EXHIBIT 21
SUBSIDIARIES OF CB RICHARD ELLIS GROUP, INC.
At December 31, 2010
NAMEState (or Country)of Incorporation
CB Richard Ellis Services, Inc. . . . . . . . . . . . . . . . . . . . . . . . . . . . . . . . . . . . . . . . . . . . . . . . . . . DelawareCB Richard Ellis, Inc. . . . . . . . . . . . . . . . . . . . . . . . . . . . . . . . . . . . . . . . . . . . . . . . . . . . . . . . . . DelawareCB Richard Ellis Real Estate Services, LLC . . . . . . . . . . . . . . . . . . . . . . . . . . . . . . . . . . . . . . . . DelawareTrammell Crow Services, Inc. . . . . . . . . . . . . . . . . . . . . . . . . . . . . . . . . . . . . . . . . . . . . . . . . . . . DelawareInsignia Financial Group, LLC . . . . . . . . . . . . . . . . . . . . . . . . . . . . . . . . . . . . . . . . . . . . . . . . . . DelawareTrammell Crow Company . . . . . . . . . . . . . . . . . . . . . . . . . . . . . . . . . . . . . . . . . . . . . . . . . . . . . . DelawareCB Richard Ellis Investors, LLC . . . . . . . . . . . . . . . . . . . . . . . . . . . . . . . . . . . . . . . . . . . . . . . . . DelawareCBRE Capital Markets, Inc. . . . . . . . . . . . . . . . . . . . . . . . . . . . . . . . . . . . . . . . . . . . . . . . . . . . . . TexasCBRE Capital Markets of Texas, LP . . . . . . . . . . . . . . . . . . . . . . . . . . . . . . . . . . . . . . . . . . . . . . TexasCB Richard Ellis Limited . . . . . . . . . . . . . . . . . . . . . . . . . . . . . . . . . . . . . . . . . . . . . . . . . . . . . . . United KingdomCBRE Global Holdings SARL . . . . . . . . . . . . . . . . . . . . . . . . . . . . . . . . . . . . . . . . . . . . . . . . . . . Luxembourg
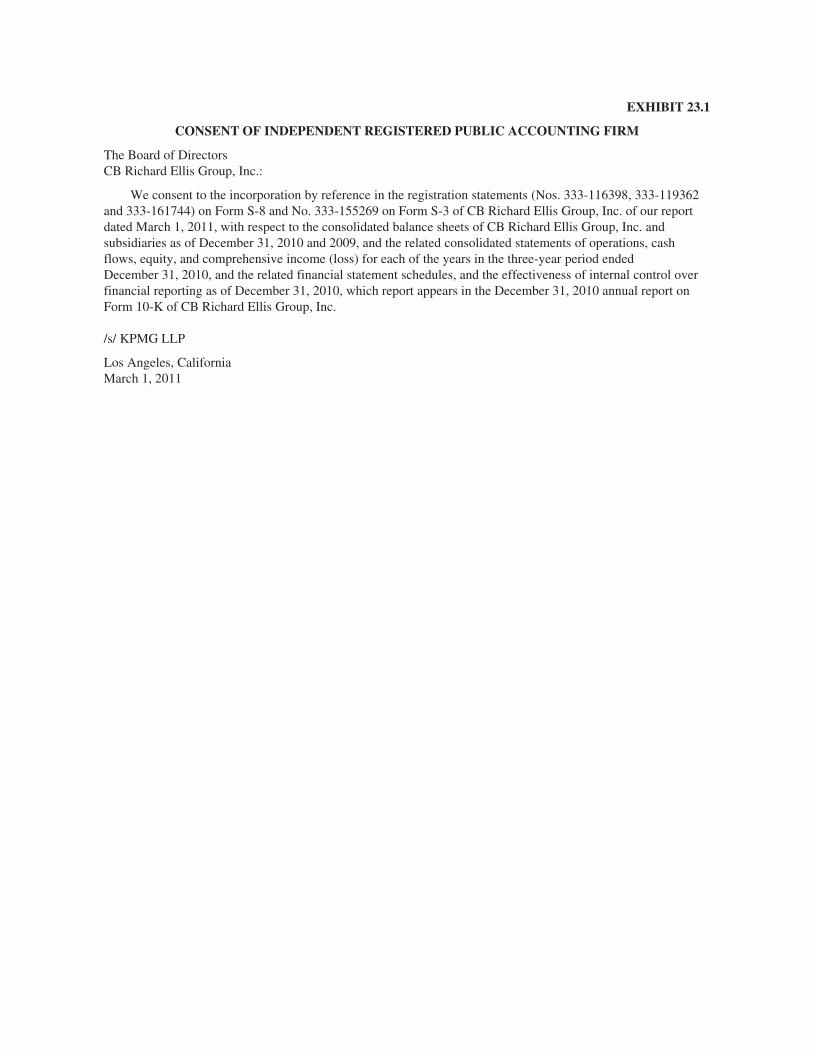
EXHIBIT 23.1
CONSENT OF INDEPENDENT REGISTERED PUBLIC ACCOUNTING FIRM
The Board of DirectorsCB Richard Ellis Group, Inc.:
We consent to the incorporation by reference in the registration statements (Nos. 333-116398, 333-119362and 333-161744) on Form S-8 and No. 333-155269 on Form S-3 of CB Richard Ellis Group, Inc. of our reportdated March 1, 2011, with respect to the consolidated balance sheets of CB Richard Ellis Group, Inc. andsubsidiaries as of December 31, 2010 and 2009, and the related consolidated statements of operations, cashflows, equity, and comprehensive income (loss) for each of the years in the three-year period endedDecember 31, 2010, and the related financial statement schedules, and the effectiveness of internal control overfinancial reporting as of December 31, 2010, which report appears in the December 31, 2010 annual report onForm 10-K of CB Richard Ellis Group, Inc.
/s/ KPMG LLP
Los Angeles, CaliforniaMarch 1, 2011

EXHIBIT 31.1
CERTIFICATION
I, Brett White, certify that:
1) I have reviewed this annual report on Form 10-K of CB Richard Ellis Group, Inc.;
2) Based on my knowledge, this report does not contain any untrue statement of a material fact or omit tostate a material fact necessary to make the statements made, in light of the circumstances under whichsuch statements were made, not misleading with respect to the period covered by this report;
3) Based on my knowledge, the financial statements and other financial information included in thisreport, fairly present in all material respects the financial condition, results of operations and cashflows of the registrant as of, and for, the periods presented in this report;
4) The registrant’s other certifying officer and I are responsible for establishing and maintainingdisclosure controls and procedures (as defined in Exchange Act Rules 13a-15(e) and 15d-15(e)) andinternal control over financial reporting (as defined in Exchange Act Rules 13a-15(f) and 15d-15(f)) forthe registrant and have:
a) Designed such disclosure controls and procedures, or caused such disclosure controls andprocedures to be designed under our supervision, to ensure that material information relating tothe registrant, including its consolidated subsidiaries, is made known to us by others within thoseentities, particularly during the period in which this report is being prepared;
b) Designed such internal control over financial reporting, or caused such internal control overfinancial reporting to be designed under our supervision, to provide reasonable assuranceregarding the reliability of financial reporting and the preparation of financial statements forexternal purposes in accordance with generally accepted accounting principles;
c) Evaluated the effectiveness of the registrant’s disclosure controls and procedures and presented inthis report our conclusions about the effectiveness of the disclosure controls and procedures, as ofthe end of the period covered by this report based on such evaluation; and
d) Disclosed in this report any change in the registrant’s internal control over financial reporting thatoccurred during the registrant’s most recent fiscal quarter (the registrant’s fourth fiscal quarter inthe case of an annual report) that has materially affected, or is reasonably likely to materiallyaffect, the registrant’s internal control over financial reporting; and
5) The registrant’s other certifying officer and I have disclosed, based on our most recent evaluation ofinternal control over financial reporting, to the registrant’s auditors and the audit committee of theregistrant’s board of directors (or persons performing the equivalent functions):
a) All significant deficiencies and material weaknesses in the design or operation of internal controlover financial reporting which are reasonably likely to adversely affect the registrant’s ability torecord, process, summarize and report financial information; and
b) Any fraud, whether or not material, that involves management or other employees who have asignificant role in the registrant’s internal control over financial reporting.
Date: March 1, 2011 /s/ BRETT WHITE
Brett WhiteChief Executive Officer
EXHIBIT 31.2
CERTIFICATION
I, Gil Borok, certify that:
1) I have reviewed this annual report on Form 10-K of CB Richard Ellis Group, Inc.;
2) Based on my knowledge, this report does not contain any untrue statement of a material fact or omit tostate a material fact necessary to make the statements made, in light of the circumstances under whichsuch statements were made, not misleading with respect to the period covered by this report;
3) Based on my knowledge, the financial statements and other financial information included in thisreport, fairly present in all material respects the financial condition, results of operations and cashflows of the registrant as of, and for, the periods presented in this report;
4) The registrant’s other certifying officer and I are responsible for establishing and maintainingdisclosure controls and procedures (as defined in Exchange Act Rules 13a-15(e) and 15d-15(e)) andinternal control over financial reporting (as defined in Exchange Act Rules 13a-15(f) and 15d-15(f)) forthe registrant and have:
a) Designed such disclosure controls and procedures, or caused such disclosure controls andprocedures to be designed under our supervision, to ensure that material information relating tothe registrant, including its consolidated subsidiaries, is made known to us by others within thoseentities, particularly during the period in which this report is being prepared;
b) Designed such internal control over financial reporting, or caused such internal control overfinancial reporting to be designed under our supervision, to provide reasonable assuranceregarding the reliability of financial reporting and the preparation of financial statements forexternal purposes in accordance with generally accepted accounting principles;
c) Evaluated the effectiveness of the registrant’s disclosure controls and procedures and presented inthis report our conclusions about the effectiveness of the disclosure controls and procedures, as ofthe end of the period covered by this report based on such evaluation; and
d) Disclosed in this report any change in the registrant’s internal control over financial reporting thatoccurred during the registrant’s most recent fiscal quarter (the registrant’s fourth fiscal quarter inthe case of an annual report) that has materially affected, or is reasonably likely to materiallyaffect, the registrant’s internal control over financial reporting; and
5) The registrant’s other certifying officer and I have disclosed, based on our most recent evaluation ofinternal control over financial reporting, to the registrant’s auditors and the audit committee of theregistrant’s board of directors (or persons performing the equivalent functions):
a) All significant deficiencies and material weaknesses in the design or operation of internal controlover financial reporting which are reasonably likely to adversely affect the registrant’s ability torecord, process, summarize and report financial information; and
b) Any fraud, whether or not material, that involves management or other employees who have asignificant role in the registrant’s internal control over financial reporting.
Date: March 1, 2011 /s/ GIL BOROK
Gil BorokChief Financial Officer
EXHIBIT 32
WRITTEN STATEMENTPURSUANT TO
18 U.S.C. SECTION 1350
The undersigned, Brett White, Chief Executive Officer, and Gil Borok, Chief Financial Officer of CBRichard Ellis Group, Inc. (the “Company”), hereby certify as of the date hereof, solely for the purposes of 18U.S.C. §1350, that:
(i) the Annual Report on Form 10-K for the period ended December 31, 2010, of the Company (the“Report”) fully complies with the requirements of Section 13(a) and 15(d), as applicable, of theSecurities Exchange Act of 1934; and
(ii) the information contained in the Report fairly presents, in all material respects, the financialcondition and results of operations of the Company at the dates and for the periods indicated.
Dated: March 1, 2011
/s/ BRETT WHITE
Brett WhiteChief Executive Officer
/s/ GIL BOROK
Gil BorokChief Financial Officer
The foregoing certification is being furnished solely pursuant to 18 U.S.C. Section 1350 and is not beingfiled as part of the Report or as a separate disclosure document.

Board of Directors
1 Richard C. Blum A, D, E
ChairmanCB Richard Ellis Group, Inc.Chairman and PresidentRichard C. Blum & Associates, Inc.
2 Curtis F. Feeny B, D
Managing DirectorVoyager Capital
3 Bradford M. Freeman A, C, D
Founding PartnerFreeman Spogli & Co., Inc.
4 Michael Kantor A, D
PartnerMayer Brown LLP
5 Frederic V. Malek B, C
ChairmanThayer Capital Partners
6 Jane J. Su C
PartnerBlum Capital Partners, L.P.
7 Laura D. Tyson A
S.K. and Angela Chan Professor of Global ManagementWalter A. Haas School of Business,University of California at Berkeley
8 Brett White A, E
Chief Executive OfficerCB Richard Ellis Group, Inc.
9 Gary L. Wilson B
Private Investor and General PartnerManhattan Pacific Partners
10 Ray Wirta A, E
Chief Executive OfficerThe Koll Company
Executive Officers
Brett WhiteChief Executive Officer
Robert E. SulenticPresident
Gil BorokExecutive Vice President andChief Financial Officer
Robert BlainPresident, Asia Pacific
Calvin W. Frese, Jr.Group President, Global Services
Arlin E. GaffnerSenior Vice President and
Chief Accounting Officer
Michael J. LafittePresident, Americas
Laurence H. MidlerExecutive Vice President, General Counsel, Chief Compliance Officer and Secretary
Michael J. StrongPresident, Europe, Middle East and Africa
Headquarters
CB Richard Ellis Group, Inc.11150 Santa Monica BoulevardSuite 1600Los Angeles, CA 90025310.405.8900
Independent Auditors
KPMG LLP355 South Grand AvenueLos Angeles, CA 90071-1568
Registrar and
Stock Transfer Agent
If you are a registered shareholder and have a question about your account, or would like to report a change in your name or address, please contact:
BNY Mellon Shareowner Services480 Washington BoulevardJersey City, NJ 07310-1900
Telephone Inquiries: 877.296.3711TDD for Hearing Impaired: 800.231.5469Foreign Shareowners: 201.680.6578TDD Foreign Shareowners: 201.680.6610
[email protected]/shareowner/equityaccess
Stock Listing
CB Richard Ellis Group, Inc. Class A Common Stock trades under the symbol CBG and is proud to meet the listing requirements of the NYSE, the world’s leading equities market.
Common Stock PriceThe high and low prices per share ofCommon Stock are set forth below for Fiscal Year 2010.
High Low
1Q $16.22 $12.052Q $17.98 $13.52 3Q $19.00 $12.814Q $21.53 $17.14
The closing share price for our Class ACommon Stock on December 31, 2010,as reported by the New York StockExchange, was $20.48.
Shareholder Inquiries
Shareholder inquiries, including requests for annual reports, may be made in writing to:
CB Richard Ellis Group, Inc.Investor Relations Department200 Park Avenue, 17th FloorNew York, NY [email protected]
De
sig
n b
y A
dd
iso
n w
ww
.ad
dis
on
.co
m
A Acquisition Committee
B Audit Committee
C Compensation Committee
D Corporate Governance and Nominating Committee
E Executive Committee
1 32 4 5
6 87 9 10

the
be
ne
fi ts of g
lob
al le
ad
ersh
ipC
B R
ich
ard
Ellis G
rou
p, In
c. 2
010
An
nu
al R
ep
ort
the benefits of global leadership 2010 Annual Report
integrated services
market intelligence
local expertise
global reach
fi nancial strength