the barclays capital guide to cash flow collateralized ...igiddy/abs/barclays_cdoguide.pdf ·...
TRANSCRIPT
CDO and Structured Funds Group March 2002
The Barclays Capital Guide to Cash Flow
Collateralized Debt Obligations


Barclays Capital Guide to Cash Flow Collateralized Debt Obligations i
Table of Contents
Introduction.................................................................................................................. 1 Collateral Asset Classes................................................................................................ 1 The Asset Manager ....................................................................................................... 1 Note Classes and the Priority of Payments ................................................................... 1 Arbitrage, Balance Sheet and Synthetic CDOs............................................................. 2 Market Growth ............................................................................................................... 2 Product Evolution........................................................................................................... 2
Benefits to Asset Managers and CDO Equity Investors.......................................... 4 Insulation from Market Value Volatility .......................................................................... 4 Leveraged Yield............................................................................................................. 4 Broad Diversification...................................................................................................... 4 Increase in Assets under Management ......................................................................... 5 Committed Funds .......................................................................................................... 5 Stability of Management Fees ....................................................................................... 5 Senior and Subordinated Fees ...................................................................................... 5 Incentive Fees ............................................................................................................... 5
Types of Cash Flow CDOs.......................................................................................... 6 Classification by Structure ............................................................................................. 6
Cash Structures....................................................................................................... 6 Synthetic Structures ................................................................................................ 6
Classification by Issuer Motivation ................................................................................ 7 Arbitrage cash flow CDOs....................................................................................... 7 Balance sheet CDOs............................................................................................... 7
Classification by Asset Class......................................................................................... 7 Classification by Country or Region .............................................................................. 8
U.S. High Yield CDOs ............................................................................................. 8 European CDOs...................................................................................................... 8 Emerging Market CDOs .......................................................................................... 8 Asian CDOs............................................................................................................. 9 Japanese CDOs...................................................................................................... 9 Korean CDOs .......................................................................................................... 9
Underlying Collateral Characteristics ..................................................................... 10 High Yield Bonds ......................................................................................................... 10 U. S. High Yield ........................................................................................................... 11 European High Yield.................................................................................................... 11 Leveraged Loans ......................................................................................................... 12 Leveraged Loans in Europe and the U.S. ................................................................... 13 Investment Grade Debt................................................................................................ 13 Non-Funded and Partially Funded Debt Commitments............................................... 14 Variable Funding Notes ............................................................................................... 14 Emerging Market Debt................................................................................................. 14 Emerging Market Corporate Debt................................................................................ 15 Emerging Market Bilateral Debt................................................................................... 15
Author: Iftikhar U. Hyder Tel: +1 (212) 412-2986 Fax: +1 (212) 412-1732 [email protected] March 8, 2002
CDO and Structured Funds Group Contacts:
Eileen Murphy +1 (212) 412-2618 New York +44 (0) 7899-065279 London [email protected]
Iftikhar U. Hyder +1 (212) 412-2986 [email protected]
Gerard O'Connor +1 (212) 412-2971 gerard.o’[email protected] Harris Cohen +1 (212) 412-1457 [email protected]
Emina Besirevic +44 (020) 7773-9966 [email protected] CDO and Structured Funds Group +1 (212) 412-CDO8

ii
Mezzanine Debt ........................................................................................................... 16 U.S. Mezzanine Debt................................................................................................... 16 Mezzanine Debt in Europe .......................................................................................... 16 ABS and MBS.............................................................................................................. 16 PIK Interest on ABS and MBS..................................................................................... 17 Interest Rate Sensitivity on ABS and MBS.................................................................. 17 Stripped MBS............................................................................................................... 17 European ABS and MBS ............................................................................................. 18 REIT Debt .................................................................................................................... 19 Project Finance Debt ................................................................................................... 19 Distressed Debt and DIP Financing ............................................................................ 19 Forfaiting Debt ............................................................................................................. 20 Synthetic Securities and Credit Linked Notes ............................................................. 20
Transaction Structure and Mechanics .................................................................... 21 Pre-closing Period ....................................................................................................... 21 Ramp-up Period........................................................................................................... 21 Reinvestment Period ................................................................................................... 21 Amortization Period ..................................................................................................... 22 Asset Manager............................................................................................................. 22 Trustee/Custodian ....................................................................................................... 22 Hedge Counterparty .................................................................................................... 22 Synthetic Security Counterparties ............................................................................... 22 Bond Insurer ................................................................................................................ 22 SPV Administrator ....................................................................................................... 22 Loss Protection to the Rated Notes............................................................................. 25 Overcollateralization and Subordination...................................................................... 25 Excess Spread............................................................................................................. 26 Reserves...................................................................................................................... 26 External Credit Enhancement...................................................................................... 26 Interest Rate Hedges................................................................................................... 26 Currency Hedges......................................................................................................... 27 Collateral Quality Tests................................................................................................ 27 Early Amortization Triggers ......................................................................................... 28
Interest Coverage Tests........................................................................................ 28 Principal Coverage Tests ...................................................................................... 28
Par Value vs. Market Value ......................................................................................... 30 Coverage Ratios by Note Class................................................................................... 31 Priority of Payments..................................................................................................... 31 Solutions for Equity and Subordinated Note Investors................................................ 34
The Role of the Asset Manager ................................................................................ 35 Responsibilities ............................................................................................................ 35 Role as Equity Investor................................................................................................ 35 Asset Selection ............................................................................................................ 35 Timing and Prices ........................................................................................................ 35

Barclays Capital Guide to Cash Flow Collateralized Debt Obligations iii
Expertise vs. Diversification......................................................................................... 36 Performance History.................................................................................................... 36 Trading Philosophy ...................................................................................................... 36 Credit and Research Capabilities ................................................................................ 36 Workout Experience .................................................................................................... 36 Key Personnel ............................................................................................................. 36 Compensation.............................................................................................................. 36 Evaluation Meetings .................................................................................................... 36
Trading Constraints and CDO Reinvestment Criteria............................................ 38 Sale of Assets .............................................................................................................. 38 Purchase of Replacement Assets ............................................................................... 38
CDO Equity Return Analysis .................................................................................... 40 Scenario Analysis and Assumptions ........................................................................... 40 Impact of Assets’ Purchase Price................................................................................ 41 Impact of Default Rates, Timing and Spikes ............................................................... 41 Impact of Coupon and Spread..................................................................................... 42 Impact of Recovery Rate and Timing .......................................................................... 42 Impact of Trading Gains .............................................................................................. 42
Summary of Major Risks for CDO Investors........................................................... 43 Credit Risk ................................................................................................................... 43 Interest Rate Risk ........................................................................................................ 43 Liquidity Risk................................................................................................................ 43 Prepayment Risk ......................................................................................................... 43 Reinvestment Risk....................................................................................................... 43 Asset Manager Risk..................................................................................................... 44 Currency Risk .............................................................................................................. 44 Counterparty/Bivariate Risk ......................................................................................... 44 Systemic Risk .............................................................................................................. 44
Glossary of Terms ..................................................................................................... 45

iv
Charts
Chart 1: Share of CDOs in ABS issuance by collateral in Europe (1996 – 2001)....... 3 Chart 2: 2000 Nominal GDP, Europe and the U.S. ................................................... 12 Chart 3: Outstanding high yield debt (December 31, 2000) ...................................... 12 Chart 4: Emerging market bond issuance (excluding debt exchanges)
by currency in 2000.................................................................................. 15 Chart 5: Emerging market bond issuance (excluding debt exchanges)
by currency, 2001..................................................................................... 15 Chart 6: Volume of European ABS and MBS issuance (excluding synthetics),
1995 - 2001 ............................................................................................. 18 Chart 7: European ABS and MBS issuance (excluding synthetics), 1998 - 2001..... 19 Chart 8: Impact of default rate on expected equity IRR ............................................ 41 Chart 9: Impact of default timing on expected equity IRR ......................................... 41 Chart 10: Impact of spike in default rate on expected equity IRR ............................. 42
Figures
Figure 1: Types of cash flow CDO transactions .......................................................... 6 Figure 2: Sample arbitrage CDO cash flows on closing date.................................... 23 Figure 3: Sample arbitrage CDO ongoing cash flows ............................................... 24 Figure 4: Sample cash flow CDO capital structure.................................................... 25
Tables
Table 1: Examples of CDO collateral assets ............................................................. 10 Table 2: Sample overcollateralization ratio for subordinated notes .......................... 30 Table 3: Sample interest coverage ratio for subordinated notes............................... 30 Table 4: Sample position of various parties within priority of payments from
interest receipts (sequential repayment of principal) ............................... 32 Table 5: Sample position of various parties within priority of payments from
principal receipts (sequential repayment of principal).............................. 33 Table 6: Sample solutions for CDO equity investors................................................. 34 Table 7: Sample discussion topics for investors’ meeting with asset manager ........ 37 Table 8: Sample assumptions for equity return analysis........................................... 40

Barclays Capital Guide to Cash Flow Collateralized Debt Obligations 1
Introduction A Cash Flow Collateralized Debt Obligation,1 or cash flow CDO, is a structured finance product that securitizes a diversified pool of debt assets into multiple classes of notes from the cash flows generated by such assets.
Cash flow CDOs offer investors access to a diversified and actively managed portfolio of credit risks in a single investment that provides enhanced returns that correspond to each investor’s appetite for risk. Investors in CDO senior and mezzanine notes can earn high returns relative to similarly rated asset-backed securities. CDO equity investors can earn leveraged returns.
Cash flow CDOs offer asset managers and issuing institutions a range of benefits, depending on the structure and motivation of each transaction. Asset managers can increase assets under management while locking in committed funds and achieving some protection from market value volatility. Issuing institutions can sell off portfolio credit risk, reduce regulatory capital requirements and lower funding costs.
Cash flow CDOs should be distinguished from market value CDOs, which are not discussed in this guide. Whereas market value CDOs are managed to pay off liabilities through the trading and sale of collateral, cash flow CDOs are managed to pay off liabilities from the interest and principal payments of collateral. This means that unlike market value CDOs, cash flow CDOs focus primarily on managing the credit quality of the underlying portfolio rather than the volatility of its market value.
Subject to investment guidelines set by each individual CDO, the underlying assets may be static or revolving, and may consist of any variety and configuration of:
n Corporate bonds, n Bank loans, n Emerging market sovereign debt, n Project finance debt, n Asset-backed securities (ABS) and other structured finance securities (such as
CMBS, RMBS and HEL), and n Credit derivatives2
The underlying collateral is managed by an asset manager who generally has demonstrated experience in managing the asset classes mandated by the transaction. The asset manager, who often has broad discretion to purchase and trade collateral, plays a key role in each CDO transaction.
The securities issued by the CDO are tranched into rated and unrated classes of notes and equity, where the rating of each note class is determined by its position in the priority of payments and other rating criteria. Payments of interest and principal to the various note classes (or liabilities) issued by a CDO are generally made sequentially, such that payment is first made to the most senior class and then to other classes, in the order of their subordination. These payments are made solely from the cash flows received from the underlying assets (including hedges).
1 In this guide, collateralized bond obligations (CBOs) and collateralized loan obligations (CLOs) are both referred to as collateralized debt obligations (CDOs). 2 For more information, please see The Barclays Capital Guide to Credit Derivatives.
Collateral Asset Classes
The Asset Manager
Note Classes and the Priority of Payments

2
The senior notes are usually rated AAA to A and have first claim on cash flows. The mezzanine and subordinated notes are usually rated BBB to B and have a subordinate claim on cash flows. The equity tranche, which occupies a first-loss position, is generally unrated and receives all or most of the residual interest proceeds of the collateral. The CDO equity represents a leveraged investment in the collateral; it has both a higher expected return and a higher volatility of return than the underlying assets.
Cash flow CDOs are usually classified as either arbitrage or balance sheet transactions. Arbitrage transactions attempt to capture for equity investors the spread between the relatively high yielding assets and the lower yielding liabilities represented by the rated notes. Balance sheet transactions, by contrast, are primarily motivated by the issuing institutions’ desire to remove loans and other assets from their balance sheets, to reduce their regulatory capital requirements and improve their return on risk capital. Some balance sheet transactions use credit derivatives to transfer the credit risk of assets from balance sheets to CDOs without the sale or transfer of the assets themselves. These structures, which may be non-funded or partially funded, are called “synthetic CDOs.”
First issued in the late 1980s, CDOs emerged in the late 1990s as the fastest growing sector of the asset-backed securities market. According to Standard & Poor’s, global funded cash flow CDO issuance volume total $59.97 billion in 2001, an increase of over 22% from the preceding year’s $48.80. The total number of funded cash flow CDO transactions issued in 2001 was 167, up 38% from 121 issued in 2000. In addition, Standard & Poor’s also rated 29 Synthetic CDO transactions with rated pool notional of $29.4 billion.3 This growth reflects the increasing appeal of CDOs for a growing universe of asset managers and investors, which now include insurance companies, mutual fund companies, unit trusts, investment trusts, commercial banks, investment banks, pension fund managers, private banking organizations and structured investment vehicles.
Particularly notable has been the growth of the CDO market in Europe since 1998. Cash issuance more than doubled to €46.4 billion in 2001, up from €19 billion in 2000. European Synthetic CDO volume grew nearly 52% to $32 billion in2001, from $21.1 billion in 2000 (see Chart 1).4 This very rapid pace of growth stems in part from the expansion of Europe’s high yield market and the growing comfort of European investors with structured finance products. Both trends have been spurred by the launch of the euro, which has consolidated and energized credit markets on the Continent.
Cash flow CDOs have undergone considerable evolution over the last thirteen years. Most notably, CDOs have greatly expanded the range of their collateral asset classes, moving beyond high yield bonds and bank loans to include asset-backed securities, emerging market bonds and loans, credit derivatives and other very specialized forms of debt. CDOs have also developed a great variety of structures and special features, including intricate priorities of payment, multiple hedges, complex definitions and multiple cash flow diversion triggers. All these asset classes and structural features require careful analysis, as each impacts the risks and returns of different classes of investors.
3 CDO Resiliency: Negative Credit Cycle Puts the Product to the Test, Standard & Poor’s, February 6, 2002 4 CDO Resiliency: Negative Credit Cycle Puts the Product to the Test, Standard & Poor’s, February 6, 2002
Arbitrage, Balance Sheet
and Synthetic CDOs
Market Growth
Product Evolution

Barclays Capital Guide to Cash Flow Collateralized Debt Obligations 3
C H A R T 1 : S H A R E O F C D O S I N A B S I S S U A N C E B Y C O L L A T E R A L I N E U R O P E ( 1 9 9 6 – 2 0 0 1 )
0
5
10
15
20
25
30
35
1996 1997 1998 1999 2000 2001
Per
cen
t
Source: Standard & Poor’s

4
Benefits to Asset Managers and CDO Equity Investors The growing popularity of CDOs over the past few years is attributable to a number of features that benefit CDO asset managers and equity investors:
The cash flow CDO structure allows asset managers to focus primarily on managing the credit quality of the underlying portfolio rather than the volatility of its market value, or net asset value (NAV).
CDO asset managers, however, cannot ignore the market values of underlying assets, which generally serve as leading indicators of improvement or deterioration of credit quality. In some transactions, overcollateralization ratios5 account for defaulted assets at the lower of their market value or their predetermined expected recovery rate. In such transactions, sufficient decline in market value of one or more defaulted assets may cause a diversion in cash flows from the subordinated noteholders to the senior noteholders.
CDO equity investors can earn leveraged returns on the underlying assets at the cost of bearing greater risk. This risk is mitigated by broad portfolio diversification and active portfolio management.
CDOs are governed by diversification guidelines. These guidelines mandate diversification by issuer, industry, asset class and region, by more than one of these criteria.
1. Diversification by Issuer CDOs generally mandate a large number of issuers, to diversify credit across a broad portfolio of underlying obligors. Concentration limits, which determine the maximum exposure to any single obligor, vary widely between transactions. For example, they are typically much lower in CDOs of leveraged bank loans than in CDOs of emerging market debt. However, higher average obligor concentration usually requires a higher subordination level to achieve the same rating.
2. Diversification by Industry CDOs generally cap exposure to particular industries. While industries can be defined in a number of ways, and some issuers are active across industries, the industry diversification requirement offers investors substantial protection in the event of a downturn in any one industry or in two or more highly correlated industries.
3. Diversification by Asset Class Most CDOs require diversification across two or more asset classes. For example, high yield CDO transactions allow varying amounts of leveraged bank loans, emerging market debt and structured finance securities. CDOs of asset-backed securities (ABS) may require investment across ABS asset classes, such as commercial and consumer, or revolving and non-revolving, that have different interest rate risk profiles.
5 For definitions of “overcollateralization” and “overcollateralization ratios,” please refer to page 25.
Insulation from Market Value Volatility
Leveraged Yield
Broad Diversification

Barclays Capital Guide to Cash Flow Collateralized Debt Obligations 5
4. Diversification by Region Most CDOs allow investment in assets from different regions. For example, most U.S. high yield CDOs allow limited exposure to obligors in Europe. Similarly, emerging market CDOs require obligors from a number of emerging market countries and regions.
5. Ability to buy Synthetic Assets Since most CDOs allow varying amounts of exposure to synthetic securities, asset managers can synthetically procure at par assets that are sparsely available or that trade at a premium. Synthetic CDOs generally acquire all their assets in synthetic form.
Arbitrage CDOs allow asset managers to increase assets under management and generate new management fees quite quickly. Balance sheet transactions, by contrast, are generally structured to transfer assets or risk from the balance sheet of sponsoring institutions. (Some arbitrage CDOs have also transferred some assets from the asset manager’s existing funds.)
Most cash flow CDO transactions have non-call provisions of up to 5 years, which prohibit investors from withdrawing funds. This feature protects asset managers and long-term investors from liquidating assets at depressed prices as a result of withdrawals by short-term investors. CDO structures also make optional redemptions conditional on the consent of the holders of a majority of the CDO’s equity, protecting equity and subordinated noteholders from losses that may result from the sale of assets at depressed prices.
For asset managers, non-call provisions have the added benefit of locking in asset management fees, most of which are generally payable only after interest payments have been made on rated notes. Furthermore, since the fees accrue on the par amount rather than on the market value (or NAV) of the collateral, the volatility of these fees is further reduced. The amounts payable to the asset manager and the position of asset management fees in the priority of payments vary greatly between transactions. The amount of the management fees partly depends on the type of underlying assets, the size of the transaction and the position of fees in the priority of payments.
Some transactions allow payment of a fee that is senior in priority of payment to the senior-most notes. However, the bulk of the asset management fees are usually subordinated to the interest on all the rated notes.
In CDO transactions, the asset manager may also enjoy the benefit of contingent incentive fees that are payable if the asset manager meets performance targets for the CDO’s equity. Incentive fees of this kind allow asset managers to participate with equity investors in the transaction’s potential upside.
Increase in Assets under Management
Committed Funds
Stability of Management Fees
Senior and Subordinated Fees
Incentive Fees

6
Types of Cash Flow CDOs CDOs can be classified by 1) structural characteristics, 2) issuer motivation, 3) asset class composition, and 4) the region or country of the collateral.
F I G U R E 1 : T Y P E S O F C A S H F L O W C D O T R A N S A C T I O N S
CashStructures
SyntheticStructures
Balance SheetCDOs
Arbitrage CDOs
Types of Assets� High Yield Bonds� Leveraged Loans (both Term Loans
and Revolving Credits)� Investment Grade Debt (Bonds, Term
Loans and Revolving Credits)� Emerging Market Debt� Mezzanine Debt� Project Finance Debt� Asset-Backed Securities� Mortgage-Backed Securities� Stripped Securities (IOs and POs)� REIT Debt� Distressed Debt� DIP Financings� Private Equity� Hedge Funds� Derivative Exposures
Types of Assets� Investment Grade Loans (both Term
Loans and Revolving Credits)� Leveraged Loans (Term and
Revolving)� Emerging Market Debt� Project Finance Debt� Asset-Backed Securities� Mortgage-Backed Securities� REIT Debt� Forfaiting Debt� Distressed Debt� DIP Financings� Derivative Exposures
Cash Flow CDOs
CDOs are classified into two broad structural categories: cash structures and synthetic structures.
Cash Structures are used by most CDOs. In these structures, liabilities are issued for cash, which is then used to buy assets.
Synthetic Structures (also called credit derivative structures) use credit derivatives to transfer the credit risk of the reference assets from the issuer’s balance sheet to the CDO without selling those assets. Synthetic structures are mostly used by banks for
Classification by Structure

Barclays Capital Guide to Cash Flow Collateralized Debt Obligations 7
balance sheet CDO transactions. Because synthetic transactions often do not involve the issuance and placement of CDO securities, they tend to be larger than cash transactions. The liability structures of Synthetic CDOs may consist of a combination of funded notes and credit derivatives. While Synthetic CDOs are commonly used for balance sheet transactions, during the last two years, some managed arbitrage CDOs have been issued using Synthetic CDO structures.
Synthetic structures fall into two basic categories: non-funded and partially funded. While non-funded structures issue no securities at all, partially funded structures issue securities to partially fund the acquisition of assets.
When defined by issuer motivation, CDOs are classified into two types: arbitrage CDOs and balance sheet CDOs.
Arbitrage cash flow CDOs are transactions in which a CDO issues two or more tranches of debt (generally rated both investment-grade and non-investment grade) and equity. The proceeds are then used to buy a portfolio of assets whose cash flows are pledged to secure timely payment of interest and principal to the CDO’s liabilities.
The arbitrage results from the positive spread between the largely non-investment grade assets and the investment grade liabilities. The greater the spread between the coupons of the assets and the rated liabilities, the greater the potential leveraged yield on the equity. As a result, the return on CDO equity, in the absence of defaults on assets, greatly exceeds the weighted average coupon earned on the underlying portfolio. This return can be further enhanced, if the assets are purchased at a discount to par.
Balance sheet CDOs are often referred to as “bank balance sheet CLOs,” because they have primarily involved securitization of commercial and industrial loans (C&I loans) coming from the balance sheets of large and highly rated banks. Issuers generally use these transactions to obtain regulatory capital relief and/or to lower their funding costs. A balance sheet CDO can free up risk-based capital for redeployment, thereby improving the bank’s return on capital and its return on risk assets. Balance sheet CDOs may also lower the cost of funding and create arbitrage opportunities, by issuing CDO liabilities that are more highly rated than the issuing bank.
Balance sheet CDOs often use synthetic structures to achieve the transfer of risk without the transfer of assets from the balance sheet of the issuing bank (or financial institution). Balance sheet CDOs have developed a wide variety of structures, each designed to meet the different needs of its issuer.
A small percentage of balance sheet CDOs have employed master trust structures similar to those used by asset-backed securities (ABS) to securitize consumer assets such as credit cards and mortgages. Master trust structures allow repeat issuance of liabilities by the same special purpose vehicle (SPV).
The bulk of CDO activity in Europe has so far involved balance sheet CDOs sponsored by large, highly rated European banks.
CDOs can also be classified by the kinds of underlying assets in which they invest. Examples include:
a) CDOs of high yield and investment grade bonds (CBOs)
b) CDOs of leveraged bank loans (CLOs)
c) CDOs of investment grade bank loans (bank balance sheet CLOs)
Classification by Issuer Motivation
Classification by Asset Class

8
d) CDOs of project finance debt (project finance CDOs)
e) CDOs of asset-backed securities (CDOs of ABS)
f) CDOs of mortgage-backed securities, including REIT debt (CDOs of MBS)
g) CDOs of debt securities issued by other CDOs (CDOs of CDOs)
h) CDOs of forfaiting debt
i) CDOs of non-performing or distressed assets
j) CDOs of private equity (sometimes called CEOs)
k) CDOs of hedge funds (a type of fund of funds sometimes called CFOs)
l) CDO of derivative exposures
Depending on the manager’s expertise and experience, a CDO transaction may permit investments in more than one asset type (except in cases such as CDOs of forfaiting debt, where the manager’s expertise may be so specialized as to preclude diversification across different asset types). For example, most arbitrage CDOs of high yield bonds (the most common type of CDO) allow limited investment in bank loans, emerging market debt, structured finance debt and synthetic securities.
The region or country of domicile of the obligors is often used to describe a CDO, as the following examples show:
U.S. High Yield CDOs
Obligors: Primarily U.S. and Canadian corporate entities
Assets: Primarily high yield bonds and leveraged loans with varying amounts of mezzanine debt, structured finance securities, convertibles and other assets
European CDOs
Obligors: Primarily corporate entities based in Western Europe
Assets: Bonds, loans (both investment grade and non-investment grade) and mezzanine debt denominated in EUR, GBP and USD
Emerging Market CDOs
Obligors Primarily sovereign and corporate entities domiciled in Latin America, the Caribbean, Eastern Europe, the CIS, Asia (except Japan and Singapore) and Africa
Assets: Generally bonds and loans denominated in USD, EUR and GBP
Classification by Country or Region

Barclays Capital Guide to Cash Flow Collateralized Debt Obligations 9
In CDO transactions, the term “emerging markets” generally refers to countries whose foreign currency denominated public debt is rated below Aa3 / AA-. Emerging market debt includes both sovereign obligations and the foreign currency obligations of corporations domiciled in these countries.
Asian CDOs
Obligors: Primarily corporate entities domiciled in emerging Asian countries
Assets: Bonds and loans
Japanese CDOs
Obligors: Primarily corporate entities domiciled in Japan
Assets: Loans and bonds
Korean CDOs
Obligors: Primarily corporate entities domiciled in South Korea
Assets: Bonds and loans

10
Underlying Collateral Characteristics The raison d'être of most arbitrage cash flow CDO transactions is the spread differential between the rate of interest earned on the underlying assets and rate of interest paid on the CDO investment-grade liabilities. It is this differential that generates the leveraged returns for the CDO’s equity investors.
To optimize the return on the liabilities with the credit risk of the assets, most arbitrage CDOs issued before late 1999 repackaged U.S. high yield bonds, leveraged loans mostly made to U.S. corporate entities, and emerging market debt. By contrast, bank balance sheet CLO transactions generally repackaged investment grade loans to U.S., European and Japanese entities.
Since 1999, CDOs have increasingly involved the repackaging of a diversified array of new asset classes, reflecting the growing and increasingly diverse universe of institutions that have issued CDOs. In 2001, three new asset classes surfaced within the CDO world. They are ‘Private Equity’, ‘Hedge Funds’ and ‘Derivative Exposures’. Although Private Equity and Hedge Funds may not necessarily be classified as ‘debt’, their repackagings borrow heavily from the CDO technology. Such repackagings are therefore included in the broader CDO definition. The CDOs of hedge funds are essentially a type of fund of fund, that have been around for some time now. Within the CDO structure, CDO of hedge funds are structured as a hybrid of market value and cash flow CDOs. The table below lists some of the assets that CDO transactions have repackaged.
T A B L E 1 : E X A M P L E S O F C D O C O L L A T E R A L A S S E T S
§ High Yield Bonds § Leveraged Bank Loans (both term and revolving) § Investment Grade Bonds and Loans (U.S. and European, both term and
revolving) § Emerging Market Sovereign Debt (capital market and bilateral debt) § Emerging Market Corporate Debt (mostly capital market debt) § Asset-Backed Securities (including CDO securities) § Mortgage-Backed Securities § REIT (Real Estate Investment Trust) Debt § Project Finance Debt (bonds and loans) § Mezzanine Debt and Private Placements § Middle Market Loans § Non-Performing Loans § Distressed Debt and DIP Financings § Non-funded Loan Commitments § Forfaiting Assets (trade finance-related debt) § Private Equity § Hedge Funds § Derivative Exposures § Synthetic Securities
High yield bonds, the most liquid form of non-investment grade corporate securities, still account for most CDO collateral.
Moody’s first started rating high yield bonds in the U.S. in early 1900s. By the early 1940s, high yield bonds accounted for almost 17% of the total corporate issuance in
High Yield Bonds

Barclays Capital Guide to Cash Flow Collateralized Debt Obligations 11
the United States. However, the market shrank during the Second World War and did not recover until the late 1980s. By the late 1970s and early 1980s, the high yield market comprised only a small fraction of the corporate bond market and the high yield market was dominated by “fallen angels” (i.e. issues that had been downgraded from investment grade to non-investment grade).
In the late 1980s, the U.S. high yield market began to grow rapidly, in part spurred by regulatory changes that allowed banks, S&Ls and other financial institutions to invest in high yield bonds. The burgeoning high yield market was followed by the inception of CDOs (then known as CBOs), which, in turn, provided a new market for high yield bonds and broadened the high yield market by offering leveraged returns to CDO equity investors on portfolios of high yield bonds.
The U.S. high yield market suffered a major setback in 1989 and the early 1990s, when the US economy went into recession. As high yield prices fell, banks and other investors were forced to liquidate their positions due to market losses, further depressing bond prices. As a result, the market for high yield CDOs stagnated between 1990 and 1995.
The U.S. high yield market rebounded in 1995 and grew rapidly in the next five years. But in 2000 and 2001, the market suffered a sharp reversal, driven by declining credit ratings, higher default rates, lower earnings and disappointing revenues. In 2000, issuance fell to some $52 billion, down 50% from the previous year, its lowest level since 1994. The downturn continued in 2001.
Europe’s high yield market has grown strongly since the mid-1990s, and could overtake the U.S. high yield market over the next decade. Today, however, the European high yield market remains much smaller than its U.S. counterpart, both in terms of issuers and outstanding debt. Total European high yield issuance in 2001 stood at €13.78 billion equivalent (including €5.12 billion in debt issued by obligors downgraded to non-investment grade). New issues from high yield issuers (excluding debt issued by obligors downgraded to non-investment grade) declined significantly during 2001 to €8.7 billion from €15.9 billion in 2000.
Almost 79% of new European high yield issues in 2001 were denominated in euro, up from 50% in 2000. High yield issuance in pound sterling and US dollar amounted to approximately 13% and 8% respectively. In comparison, in 2000, issuance in pound sterling and US dollar amounted to 12% and 38% respectively. The launch of the first phase of European economic and monetary union (EMU) and the introduction of the euro in January 1999 have helped spur the growth of high yield bonds and CDOs in Europe. In this context, it is expected that an increasing number of European CDOs will continue to be denominated in euro.
The potential for substantial growth in the European high yield is evident from Chart 2 and 3 below:
U. S. High Yield
European High Yield

12
C H A R T 2 : 2 0 0 0 N O M I N A L G D P , E U R O P E A N D T H E U . S .
€ 0
€ 2,000
€ 4,000
€ 6,000
€ 8,000
€ 10,000
€ 12,000
Europe US
Eur
o B
illio
ns
Source: Economic Portrait of the European Union 2001, Office of the Official Publications of the European Communities, Luxembourg, 2001
C H A R T 3 : O U T S T A N D I N G H I G H Y I E L D D E B T ( D E C E M B E R 3 1 , 2 0 0 0 )
$0
$100
$200
$300
$400
$500
$600
$700
Europe US
$ B
illio
ns
Source: Barclays Capital
Leveraged loans refer to financings from banks and other financial institutions to corporate entities in connection with leveraged buyouts (LBOs) or mergers and acquisitions (M&As).
Loans to the smaller end of the market (informally called “club deals”) are often less liquid, as the market for such loans is made by a limited number of participants.
For CDO issuers and investors, bank loans have several attractive features:
1. Relative insensitivity to interest rate movements
2. Relatively tight covenants
3. Security features
Leveraged Loans

Barclays Capital Guide to Cash Flow Collateralized Debt Obligations 13
4. Workout by the agent bank in case of a default
However, bank loans differ from bonds in several important ways that create difficulties for CDO issuers:
1. Bank loans lack uniform documentation, and therefore require greater due diligence.
2. Bank loans are usually not rated, so that rating agencies must assign loan obligors estimated ratings, adding to the time and cost of CDO transactions.
3. Bank loans often may prohibit sale to other parties, so that trustees must ensure that the loan documents permit assignment or participation. If transfer takes the form of participation, the CDO will be exposed to the credit risk of the selling institution.
4. Bank loans are subject to greater prepayment risk than bonds, due to shorter lock-out periods and tighter covenants. Loan prepayments generally result in negative carry for the transaction, since prepayments must be invested in high-grade, low-yielding short-term assets until they are reinvested in higher yielding assets.
5. Bank loans can be priced in several different indices, from which borrowers may choose in setting the interest rate. This often results in basis risk for the CDO transaction.
6. Bank loans can take the form of revolving loans that require lending banks to make funding available at short notice (usually two business days). Revolving loans impose a variable funding requirement on CDO transactions, which often results in the issue of revolving senior notes.
Over the last few years, issuance of leveraged loans has grown at a faster pace in Europe than in the United States. However, the total size of the non-investment grade debt in Europe remains much smaller, and the secondary market less liquid, than in the U.S. In 2000, only 3% of investors in European leveraged loans were non-banks.
A substantial portion of European non-investment grade debt (high yield bonds and loans) is concentrated in two broad industry sectors: media and telecommunications. Compared to the U.S. market, the European market for non-investment grade debt offers broader geographic diversification, with issuers spread across many countries both within and outside the European Union. Still, more than half of all leveraged loans originated in Europe are to borrowers in the U.K.
Despite a 30% decline in overall Euro-loan market during 2001 to €574 billion, leveraged loans continued to increase their share of the European loan market with an increase of 20% over the previous year to €73.9 billion.6
In recent years, investment grade debt has supplied the primary component for a number of bank balance sheet CDOs. The principal motivation for these transactions has been the issuing banks’ need to manage their regulatory capital more efficiently. By transferring quality loans to CDOs and keeping lower-quality, higher-yielding loans on their balance sheets, banks can earn higher spreads, lower their capital requirements and increase their return on risk-adjusted capital (RORAC).
6 For more information, please see European Leveraged Loans 2001 New Issues Market / 2002 Outlook, Barclays Capital, January 22, 2002.
Leveraged Loans in Europe and the U.S.
Investment Grade Debt

14
The lower coupons and spreads of investment grade debt make it much less suitable as the primary component for arbitrage CDOs, although a few such deals have been done. For CDO equity investors, the lower coupons and spreads of investment grade assets (vis-à-vis high yield bonds) can be partially offset by the lower subordination they require, and the greater leverage they provide.
Non-funded debt commitments are typically associated with revolving credits (RCs) and delayed-draw loans that may be fully or partially undrawn. In most cases, non-funded commitments are associated with bank balance sheet CDOs.
In arbitrage CDOs, revolving loans and delayed-draw loans are usually found in variable funding note (VFN) structures, which allow CDOs to adjust their funding level to address the use of revolving loans within the portfolio. Since the undrawn portion of a committed debt facility (undrawn commitment) obligates the lender to lend on short notice, such undrawn commitments may require special measures, such as obtaining similar borrowing commitments from adequately rated financial institutions.
CDOs composed primarily of emerging market debt have been issued since 1995. (Previously, a few U.S. high yield CDOs repackaged small baskets of emerging market debt as part of much larger issues.) The first CDOs backed entirely by emerging market debt were issued in 1996.
Emerging market bonds and loans offer very exciting coupon opportunities as well as generally lower liquidity, higher price volatility and greater ratings instability. However, the default rate on emerging market debt has been less severe than many market participants expected in the wake of the emerging market crisis of 1997.
Bond issuance represents a very small percentage of net private capital flows to emerging markets. According to The Institute of International Finance7, bond issuance (including debt exchanges) by emerging market borrowers from January 2001 to August 2001 amounted to $42.5 billion compared to bond issuances of $54.0 billion in the same period in 2000. In 2000, net private credit flows (bonds and loans) accounted for only 3% ($4 billion) of the total, while equity investments accounted for the rest. In comparison, net private credit flows to emerging markets turned negative in 2001, due to reduced demand for credit in Asia stemming from global slowdown last year and outflows from major markets like Argentina and Turkey, due to the crises experienced by these markets in 2001. Due to generally unfavourable market conditions, emerging markets CDO issuance continued to be weak 2001. According to Standard & Poor’s, they rated only six Emerging Markets CDO transactions in 2001. A growing portion of emerging market debt is now issued in currencies other than the US dollar. Most notably, the share of euro-denominated emerging market debt is expected to grow as the euro gains strength and becomes more prevalent. As a result, some emerging market CDOs that invest primarily in euro-denominated debt have issued notes and equity denominated in euro.
7 Capital Flows to Emerging Markets Economies, The Institute of International Finance, Inc., September 20, 2001
Non-Funded and Partially Funded
Debt Commitments
Variable Funding Notes
Emerging Market Debt

Barclays Capital Guide to Cash Flow Collateralized Debt Obligations 15
C H A R T 4 : E M E R G I N G M A R K E T B O N D I S S U A N C E ( E X C L U D I N G D E B T E X C H A N G E S ) B Y C U R R E N C Y I N 2 0 0 0
Eur31% USD
56%
Yen12%
Other1.1%
Source: Capital Flows to Emerging Markets Economies, The Institute of International Finance, Inc., January 30, 2002
C H A R T 5 : E M E R G I N G M A R K E T B O N D I S S U A N C E ( E X C L U D I N G D E B T E X C H A N G E S ) B Y C U R R E N C Y , 2 0 0 1
Eur31%
USD57%
Yen11%
Other1.0%
Source: Capital Flows to Emerging Markets Economies, The Institute of International Finance, Inc., January 30, 2002
Most emerging market CDOs cap the amount of emerging market corporate debt they may invest in. Some select corporate entities domiciled in emerging markets are often seen as financially stronger than the ratings of their foreign currency debt would suggest, which are in some cases capped at the foreign currency debt ratings of their domiciles. This ratings cap reflects the sovereign’s ability to take actions that may prevent locally domiciled corporations from servicing their foreign currency denominated debt. For example, sovereigns can restrict a corporate entity’s access to the country’s foreign currency reserves, and they can force locally domiciled corporations to convert their foreign currency financial assets and earnings into local currency.
While most emerging market CDOs have involved capital market debt that is actively traded, some transactions have repackaged bilateral debt that is not actively traded. Examples include debt owed to the Paris Club, the International Finance Corporation
Emerging Market Corporate Debt
Emerging Market Bilateral Debt

16
(the private sector lending arm of the World Bank) and various export credit guarantee agencies.
Mezzanine debt refers to financings made to medium-sized (mid-cap) companies as an alternative source of funding. These companies are generally smaller than high yield issuers and have less access to the capital markets. Mezzanine debt ranks between senior bank loans and equity in the obligor’s capital structure. It generally bears higher credit risk than high yield bonds but also promises higher potential returns.
In the United States, mezzanine debt is becoming increasingly popular as a CDO asset for two reasons: First, the mezzanine debt market has flourished as the high yield market has stagnated in recent years. Secondly, mezzanine CDO issuance has grown with the emergence of CDO asset managers that specialize in mezzanine debt. In the U.S., most mezzanine debt is issued in the form of fixed rate bonds that allow payment of interest-in-kind (PIK). It is generally unsecured and often carries a significant prepayment premium.
By contrast, European mezzanine debt financings look more like loans than bonds. European mezzanine debt generally pays a floating rate of interest (against fixed rate for U.S. mezzanine debt); it is generally placed above senior unsecured debt and closer to senior secured loans in the capital structure; and it shares collateral with senior secured debt, albeit at lower priority. (Mezzanine debt in the U.S., by contrast, is generally unsecured.)
European and U.S. mezzanine debt share some features. For example, both can often make interest payments in kind (PIK), and both frequently offer upside potential in the form of equity warrants. Both are currently issued at the operating company level, which means that while they are contractually subordinated to senior debt, they are not structurally subordinated, as is most European high yield debt.
In both the U.S. and Europe, the mezzanine debt market is much smaller and much less liquid than the markets for high yield bonds and leveraged loans. Low liquidity is a problem for CDO issuance, as is the fact that most mezzanine debt is not rated. This means that it must be rated before it is included in CDOs. Should a mezzanine debt default, the transaction should expect a relatively high recovery rate, owing to relatively lower leverage. Mezzanine debt offers CDO issuers other advantages such as higher position in the capital structure in Europe and tighter covenants relative to high yield bonds and leveraged bank loans.
The repackaging of repackaged assets such as asset-backed securities (ABS) and mortgage-backed securities (MBS) is a recent phenomenon. The use of small amounts of these asset classes in CDOs began in 1998 as an esoteric feature in some high yield and leveraged loan CDO transactions. ABS and MBS quickly caught on as attractive alternatives to such traditional asset classes as high yield bonds and leveraged loans. As CDO assets, ABS and MBS have several notable advantages, including:
n Generous coupons and spreads vis-à-vis similarly rated corporate bonds (partly due to a liquidity premium)
n Relatively lower historical default rates compared to similarly rated corporate entities
n Lower ratings volatility
Mezzanine Debt
U.S. Mezzanine Debt
Mezzanine Debt in Europe
ABS and MBS

Barclays Capital Guide to Cash Flow Collateralized Debt Obligations 17
n Diversity provided by (a) a variety of asset types and (b) a large number of underlying obligors, and
n Improving liquidity in the secondary market (which still remains relatively illiquid as compared to conventional bonds)
The use of ABS and MBS in CDOs has come a long way in a relatively short time. A number of transactions have been completed whose investment guidelines limit investments to these asset classes. An important variation involves CDOs whose only assets are CDO securities. For this reason, ABS/MBS CDOs are generally classified into three sub-categories:
n CDOs of ABS (which may include some MBS and REIT debt) n CDOs of MBS (often including REIT debt) n CDOs of CDOs (both investment grade and non-investment grade tranches of
CDOs)
These CDOs are generally issued by asset managers that specialize in ABS and/or MBS. The relatively stable ratings shared by all three sub-categories usually translate into stable ratings for their CDO notes.
In these transactions, a portion of underlying assets is often “payable-in-kind,” that is, interest payments may be capitalized to the extent funds are not available. This is particularly true for CDOs of CDOs and for CDOs of ABS/MBS with a relatively high limit for securities that may defer or capitalize interest. These transactions generally include CDO mezzanine and subordinated tranches, which are permitted to defer interest without being in default.
Prepayments on some types of consumer assets (like residential mortgages and home equity loans) are quite sensitive to interest rate movements. Higher interest rates tend to decrease the prepayment speed and, therefore, may extend the expected maturity of the CDO liabilities. Conversely, lower interest rates may increase prepayments and shorten the expected maturity of the underlying assets. Under both scenarios, investors bear prepayment risk, which may impact their returns. Since some of the underlying assets have legal final maturities much longer than those of traditional high yield bonds or leveraged bank loans, their legal final maturities are usually equal to or longer than that of the longest permitted asset.
Stripped mortgage-backed securities refer to the interest-only and principal-only classes of MBS (IOs and POs). Interest-only securities strip the interest receipts off an underlying pool of mortgages. Principal-only securities are zero coupon securities that strip principal proceeds from an underlying pool of mortgages.
CDOs of MBS can include stripped MBS. The return (yield-to-maturity) on IOs and POs is highly sensitive to interest rate movements. An increase in interest rates usually produces a decline in the prepayment rate of MBS, boosting the return on IOs and increasing interest income on a CDO portfolio. Similarly, a decrease in interest rates and a corresponding increase in prepayment rates will lead to lower returns (and, potentially, a loss of par) on IOs. POs, on the other hand, may decline in value if prepayments fall and increase in value if prepayments accelerate.
Furthermore, the market for IOs and POs tends to be less liquid and more volatile than the MBS market in general. These factors will inhibit the CDO asset manager’s ability to sell IOs and POs at certain times, which may affect the ultimate performance of the transaction.
PIK Interest on ABS and MBS
Interest Rate Sensitivity on ABS and MBS
Stripped MBS

18
Similar to the high yield market, the European ABS and MBS market is growing faster than its U.S. counterpart, albeit from a much smaller base. Structured finance issuance volume in Europe increased 48% to 139.4 billion (€156.3 billion) in 20018 from $98 billion in 2000, a growth of 27% over 1999.9
C H A R T 6 : V O L U M E O F E U R O P E A N A B S A N D M B S I S S U A N C E ( E X C L U D I N G S Y N T H E T I C S ) , 1 9 9 5 - 2 0 0 1
0
20
40
60
80
100
120
1995 1996 1997 1998 1999 2000 2001
US
Do
llar
in b
illio
n
Source: Barclays Capital
8 “European Securitization Market’s 2001 Performance Fuels Expectations for Solid Growth in 2002,“ Standard & Poor’s, January 17, 2002 9 “European Securitization Market Ends Millennium on a High Note,” Standard & Poor’s, January 24, 2001 10 “European Securitization Market Weathers Global Economic Downturn in First Quarter 2001,” Standard & Poor’s, April 2, 2001. For a more detailed discussion of European ABS and MBS, please see Building Blocks: Barclays Capital’s Asset-Backed Securities Research, January 2001.
European ABS and MBS

Barclays Capital Guide to Cash Flow Collateralized Debt Obligations 19
C H A R T 7 : E U R O P E A N A B S A N D M B S I S S U A N C E ( E X C L U D I N G S Y N T H E T I C S ) , 1 9 9 8 - 2 0 0 1
0%
20%
40%
60%
80%
100%
1998 1999 2000 2001
RMBS Consumer Receivables CDOCMBS Whole Business Govt ReceivableOther
Source: Barclays Capital
Real estate investment trusts (REITs) refer to managed vehicles (incorporated as trusts) that invest primarily in real estate or real estate-related investments in the United States. REITs generally take the form of senior unsecured debt. REIT debt is highly correlated with other mortgage-related debt, including MBS. REITs invest in a wide variety of real estate assets (offices, malls, hospitals, etc.), and their assets are geographically diversified (within the United States).
Project finance debt funds large, capital-intensive assets. Project financing differs in many ways from more traditional corporate financing, such as bond issuance, bank lending and mezzanine debt. In the U.S. and Europe, project finance loans are typically made by banks to fund large infrastructure-related assets. Some investors favor these loans over unsecured bullet debt, since they are amortizing, have much tighter covenants and are secured by both their assets and the revenues produced by their assets.
The packaging of project finance loans into CDO portfolios gives investors access to a new asset class they would otherwise find difficult to access and manage on their own. Project finance debt often carries non-standardized documentation and may bear a wide range of complex and unfamiliar risks, including economic, political, construction, operating, technology and market risks. Additionally, many projects incur cost overruns, creating greater leverage than expected. A further difficulty is that recovery analysis tends to be loan-specific, that is, it cannot be based on historical recovery rates, as is generally the case with bonds and corporate loans.
CDOs have recently begun investing in distressed debt and DIP (debtor-in-possession) financing that involve corporate entities in the U.S. that have either defaulted on their obligations or are seeking to restructure their finances. Distressed debt and DIP financing are highly specialized forms of lending that are rarely seen in CDO transactions. Since DIP financing is post-bankruptcy filing, it is senior in priority to pre-bankruptcy financings.
REIT Debt
Project Finance Debt
Distressed Debt and DIP Financing

20
Forfaiting debt is trade finance-related debt that is created when banks or specialized trade finance institutions purchase notes or other negotiable instruments on a non-recourse basis from other financial institutions.
Some CDO transactions have been backed exclusively by forfaiting debt. In such CDOs, the asset manager is usually a financial institution with substantial experience in forfaiting business or a firm specializing in the trading and management of forfaiting debt. The repackaging of forfaiting assets shows how disparate businesses can use CDO structures to meet highly specialized business needs.
In these CDO transactions, the asset manager either holds the notes until final maturity (which may be up to seven years) or sells them to another forfaiter (generally another financial institution), again on a non-recourse basis. The forfaiting debt instrument (promissory note or a bill of exchange) is drawn by the exporter (seller of goods under a letter of credit), accepted by the importer (buyer of goods under the letter of credit), and bear an aval, or unconditional guarantee, from the importer's bank. In exchange for the payment (discounted for interest for the remaining maturity of the instrument), the forfaiter then takes responsibility for claiming the debt from the importer without recourse to the exporter. There is a fairly active market in London that trades forfaiting paper, with several participants and high liquidity.
Synthetic securities now account for a small but growing portion of almost all arbitrage CDO structures. In arbitrage transactions, synthetic securities can be tailored to the exact needs of the portfolio, giving the asset manager much greater flexibility to manage portfolios and tailor precise risk profiles. In balance sheet transactions, synthetic securities allow issuing institutions to transfer the credit risk (or elements of it) of a particular asset or portfolio to the CDO without transferring or selling the asset itself.
The most widely used synthetic securities are credit linked notes (CLNs11), structured notes that are embedded with a credit derivative. The embedded credit derivative isolates the credit risk of the reference asset, and the note converts the credit derivative into a cash investment. This structure allows CDO asset managers to tailor assets and risk exposures to suit their CDO guidelines. CLNs can also enable investments at par in assets that may be trading at a premium.
The use of CLNs eliminates the credit risk of the counterparty from the CDO structure, since these notes are collateralized with highly rated collateral. Following a default or other “credit event,”12 the counterparty receives the collateral (or cash proceeds from its disposition) equal to the notional or par amount of the synthetic security.
11 For a more detailed discussion of credit linked notes, please refer to The Barclays Capital Guide to Credit Derivatives. 12 In credit default swaps and other credit derivative transactions, a “credit event” is an event that triggers a credit event payment from one counterparty to the other. The definition of credit event can vary between transactions, but it usually includes a default, bankruptcy, debt rescheduling or restructuring on the part of the transaction’s reference credit. See The Barclays Capital Guide to Credit Derivatives.
Forfaiting Debt
Synthetic Securities and Credit Linked
Notes

Barclays Capital Guide to Cash Flow Collateralized Debt Obligations 21
Transaction Structure and Mechanics Cash flow CDOs can take two basic forms: a cash structure or a synthetic structure. Cash structures are generally used for arbitrage CDOs. Synthetic structures are primarily used for balance sheet CDOs.
Cash structures issue two or more tranches of debt and equity, which are secured by a portfolio of assets bought by a special purpose vehicle (SPV).13 The SPV is established expressly for the purpose of issuing CDO notes, and its activities are generally limited to functions that are incidental to operating a CDO, including:
n Issuing notes and equity (generally, only on the closing date), n Investing in eligible assets, n Entering into hedge agreements, and n Entering into an asset management agreement with the asset manager
The SPVs are generally registered as charitable trusts and are usually established in a tax-free jurisdiction.14 However, many CDOs have a U.S. based co-issuer, particularly if the notes are to be sold to the U.S. investors.
The asset manager generally starts to acquire (or “warehouse”) assets prior to the closing date with the intention of transferring them to the SPV on the closing date. However, since the proceeds of the notes are available to pay for the assets only after the notes have been issued on the closing date, a bridge facility (or “warehouse facility”) is often used to acquire assets during a “pre-closing period” of several weeks before the closing date. The size of the warehouse facility depends on the amount of assets to be acquired on or before the closing date.
On the closing date, the SPV issues two or more tranches of debt and equity to investors. It then purchases the assets with the proceeds from the sale of debt and equity, either on the closing date or, in most cases, during the “ramp-up period” of between 60 and 180 days following the closing date. Under certain circumstances, the ramp-up period may be longer. The purchase of assets during the ramp-up period exposes the transaction to the risk of adverse price and spread movements. The severity of this “ramp-up risk” is directly proportional to the amount of assets bought during the ramp-up period and the length of the ramp-up period.
Following the ramp-up period, there is usually a “reinvestment period” (usually the initial 3 to 5 years) during which the cash flow from principal repayments due to amortization, maturity, prepayment and sale of assets are reinvested, provided that all coverage tests are met. These proceeds may be invested in short-term, liquid assets until the asset manager decides to reinvest in assets that meet the CDO’s investment guidelines. During the time that cash remains invested in short-term, liquid assets, the portfolio may suffer from negative arbitrage because the coupon rates of the CDO’s liabilities would exceed that of its short-term assets. The asset manager must therefore carefully consider the interim period when it keeps proceeds from repayment of principal in cash or cash equivalent liquid assets.
13 Also known as special purpose corporations (SPCs) or special purpose entities (SPEs) 14 E.g. Cayman Islands, Jersey, Guernsey, and Netherlands Antilles
Pre-closing Period
Ramp-up Period
Reinvestment Period

22
The transfer of loans from a seller’s books to the SPV is more complicated than the acquisition of debt securities. Sometimes lending terms prohibit the assignment (i.e. sale) of loans, because the borrower values the relationship with the lending bank and wishes to protect it. In all cases, banks that wish to securitize their corporate loan portfolios to gain capital relief must carefully manage the underlying lending relationships.
The reinvestment period is followed by the “amortization period,” during which all cash received from repayment of principal is used to pay down the liabilities and cannot be reinvested in eligible assets. The amortization period can be as short as 5 years for high yield CDOs and as long as 30 years for ABS/MBS CDOs. During this period the portfolio becomes more concentrated, and its cash flows become lumpier.
On the closing date, the SPV also enters into agreements with the following parties:
The asset manager is by far the most important participant in any CDO transaction. In arbitrage transactions, the asset manager is responsible for managing the SPV’s portfolio of assets and receives a predetermined fee from the SPV for this service. The asset manager enjoys tremendous discretion in managing assets within the transaction guidelines. In balance sheet transactions, however, the issuing bank plays a more limited role, which mostly consists of administering and servicing assets transferred from its balance sheet.
The trustee, or custodian, performs a fiduciary function. Trustee may also serve as calculation agent, and is responsible for safe custody of SPV’s assets and for ensuring compliance with the CDO’s requirements. While the asset manager advises and directs trading, the trustee carries out trades, after ensuring that various collateral quality and coverage tests are met.
Traditionally, the hedge counterparty has provided interest rate hedges (basis swaps and rate caps). With the evolution of CDOs and their spread beyond the United States, hedge counterparties have begun to offer a wider range of hedging products, including currency swaps, total return swaps, timing hedges, liquidity swaps, etc.
Synthetic security counterparties sell the SPV credit linked notes, credit default swaps, total return swaps and other credit derivatives.
In some transactions, the SPV also enters into an insurance agreement with a bond insurer, who acts as an external credit enhancer. The bond insurer guarantees the payment of principal and interest on one or more classes of notes issued by the CDO.
To insure (or “wrap”) payments on notes, the bond insurer usually issues an insurance policy (or in synthetic transactions, writes a portfolio default swap with the SPV) guaranteeing the timely payment of interest and ultimate principal on the guaranteed notes, which are generally the senior-most notes issued by the SPV. The rating of the wrapped notes reflects the claims paying ability of the bond insurer.
Typically, bond insurers involved in CDO transactions have AAA ratings. However, in recent years, bond insurers with lower ratings have also participated in CDO transactions, reflecting investors’ growing level of comfort with CDOs.
The SPV administrator performs certain administrative functions on behalf of the SPV.
Amortization Period
Asset Manager
Trustee/Custodian
Hedge Counterparty
Synthetic Security Counterparties
Bond Insurer
SPV Administrator

Barclays Capital Guide to Cash Flow Collateralized Debt Obligations 23
F I G U R E 2 : S A M P L E A R B I T R A G E C D O C A S H F L O W S O N C L O S I N G D A T E
HedgeCounterparty Trustee
Senior NoteInvestors
Mezzanine NoteInvestors
SubordinatedNote Investors
Income Notes /Equity Investors
Special PurposeVehicle
(issues CDONotes)
ExternalCredit Enhancer
SyntheticSecurities
CounterpartyAsset Manager
BB
B
C
D
A
Broker / Dealer
A
A
Portfolio ofAssets B
A
E
A. SPV issues Notes to the Investors against payment for the Notes. B. SPV uses proceeds of the Notes to pay for:
- A portfolio of Assets (Bonds, Loans, ABS Securities, Credit Linked Notes, etc.) sold by the Seller or Sellers (arms length transaction with Barclays Capital or other banks)
- Hedges from one or more Hedge Counterparties - Credit Linked Notes or Synthetic Securities from one or more adequately rated
Counterparties (including Barclays Capital) - Other incidental expenses
C. Asset Manager enters into an Investment Management Agreement with the SPV to manage the SPV’s investment portfolio.
D. Trustee enters into a Trustee Agreement with the SPV. Trustee’s role includes certain fiduciary responsibilities, which may include acting as Collateral Administrator and Calculation Agent. SPV transfers its interests in the assets (including hedge agreements and surety bond) to the Trustee, which maintains first perfected security interest in the assets.
E. External Credit Enhancer (Bond Insurer) enters into an Insurance and Indemnity Agreement with the SPV (Note: not all CDO transactions involve External Credit Enhancers).

24
F I G U R E 3 : S A M P L E A R B I T R A G E C D O O N G O I N G C A S H F L O W S
Trustee HedgeCounterparty
Senior NoteInvestors
Mezzanine NoteInvestors
SubordinatedNote Investors
Income Notes /Equity Investors
Special PurposeVehicle
(issues CDONotes)
ExternalCredit Enhancer
SyntheticSecuritiesAsset Manager
A and B
B
B
B
Portfolio ofAssets A
B
BD
D
B B and C
A. SPV receives interest payments and principal repayments on the portfolio of assets. B. SPV makes payments (according to a defined priority of payments) to
- Trustee for providing fiduciary function - Hedge Counterparty, if any payment is due under the hedge - Noteholders for the payment of interest and principal on the rated Notes - External Credit Enhancer/Bond Insurer for the insurance premium for the insured
notes - Asset Manager for managing the assets - Equity Investors
C. Hedge Counterparty makes payment, if any is due under the hedge agreement. D. Asset Manager manages the SPV’s assets.

Barclays Capital Guide to Cash Flow Collateralized Debt Obligations 25
Depending on its liability structure, each CDO issues two or more tranches of liabilities and equity.15 Each CDO tranche is rated according to elaborate criteria developed by the rating agencies, which determine the amount of loss protection that is commensurate with the rating of that tranche. One of the most important criteria is the level of “overcollateralization,” the amount of loss protection the CDO’s total collateral provides to each rated tranche. This amount of loss protection may be more than the minimum protection required at any given rating level.
Overcollateralization refers to the excess of the par amount of collateral available to secure one or more note classes over the par amount of those note classes. Overcollateralization is usually expressed as the ratio of the total par amount of available collateral to the par amount of each note class and the note classes senior to it in the priority of payments.
Subordination refers to the total par amount of liabilities that are subordinated to a particular note class. Simply put, subordination is the amount of liabilities that funds the overcollateralization of each tranche.
For example, in Figure 4, the Class A Senior Notes have a par amount of $265 million and a subordination amount of $135 million—the sum of the par values of all the subordinate note classes. Class A’s overcollateralization ratio is 151%—the CDO’s total collateral ($400 million) divided by the par value of Class A ($265 million).
The Class B Mezzanine Notes, which are subordinate to Class A, have both a lower subordination amount and a lower overcollateralization ratio. The Class B Notes’ subordination amount is $85 million (the sum of the par amounts of the Class C Subordinated Notes and the equity), and their overcollateralization ratio is 127%—$400 million divided by $315, the sum of the par amounts of the Class A and B Notes.
The Class C Notes’ subordination amount is $40 million (the par amount of the equity), and their overcollateralization ratio is 111%, or $400 million divided by $360 million, the sum of Class C’s par amount and that of all the note classes senior to it.
F I G U R E 4 : S A M P L E C A S H F L O W C D O C A P I T A L S T R U C T U R E
$ 400 million
High Yield BondsLeveraged Loans
Emerging Markets DebtAsset Backed Securities
Synthetic Securities
$265 millionClass A Senior Notes
$50 millionClass B Mezzanine Notes
$45 millionClass C Subordinated
Notes
$40 millionIncome Shares / Equity
Assets Liabilities
15 Synthetic CDOs may or may not issue notes. However, the concept remains the same for the purpose of sizing risk.
Loss Protection to the Rated Notes
Overcollateralization and Subordination

26
Excess spread refers to interest and other income classified as interest proceeds (e.g. commitment fees and commissions) that are available to the equity investors after interest payments on the CDO’s other liabilities have been made. In the absence of defaults, excess spread available to equity investors can be substantial.
Reserves may either be funded at closing or on an ongoing basis from the priority of payments at each payment date. Reserves are generally available for the benefit of the senior notes, but they may also be required to meet potential liquidity shortfalls. If the reserves are drawn down at any payment date, they are usually required to be topped up on the next payment date.
External credit enhancement refers to the guarantee payments third-party insurers may provide as credit insurance to one or more of the note classes issued by the CDO. Monoline16 credit insurance companies that are rated A or better generally provide this insurance. In synthetic transactions, credit enhancement usually takes the form of a credit default swap, which can be provided by conventional counterparties, such as banks and properly rated derivative product companies (DPCs).
CDOs generally bear considerable interest rate risk, which the asset manager must carefully manage on an ongoing basis. Interest rate risk in CDOs emanates in large part from basis mismatches among assets, and between assets and liabilities, which are generally structured to meet the interest rate basis needs of investors. This risk is generally increased by the manager’s ability to trade assets during the reinvestment period.
CDOs employ interest rate hedges to reduce the interest rate risk resulting from four major risk factors:
1. CDOs invest in both fixed and floating rate assets.
2. CDOs issue both fixed and floating rate liabilities.
3. The floating rate assets may be denominated in different indices, which creates liquidity/timing mismatch risk.
4. Most importantly, the composition of the assets and liabilities changes during the life of the transaction, due to scheduled repayments and amortization, prepayments, sales, reinvestments, defaults and recoveries. The changing composition of assets requires CDO asset managers to constantly review and manage interest rate risk.
Asset-backed securities and mortgage-backed securities that are repackaged as CDO assets can also increase interest rate risk. Principal repayments on ABS and MBS securities do not follow a predetermined schedule, and the resulting prepayment risk further complicates the management of mixed portfolios composed of both fixed and floating assets.
CDO transactions are generally hedged against most interest rate risk. Depending on the transaction structure, hedges generally include:
1. Interest rate swaps,
2. Interest rate caps,
16 These insurance companies are called monoline because credit insurance is their only line of insurance business, which distinguishes them from multiline insurers like life insurers and property & casualty (P&C) insurers (known as general insurers in the U.K.).
Excess Spread
Reserves
External Credit Enhancement
Interest Rate Hedges
Barclays Capital Guide to Cash Flow Collateralized Debt Obligations 27
3. Basis swaps,
4. Total return swaps, and
5. Liquidity swaps.
To assess interest rate risk, rating agencies use scenario-based stress testing to gauge the combined impact of changes in portfolio composition (within the mandated limits) and concurrent changes in interest rates.
The great majority of CDO liabilities and assets are still denominated in one currency (mostly USD, EUR, and GBP). However, multi-currency CDOs are becoming more common, and their popularity is expected to grow. One reason is the growth of the euro- and sterling-denominated high yield bonds and leveraged loans, and the development of liquid markets for these assets. Another reason is the growing popularity of CDOs with asset managers and investors domiciled in Europe.
Depending on the amount of foreign currency exposure, CDO currency hedges can be complex and expensive. When there are currency mismatches between assets and liabilities, CDOs must enter into currency hedges that must address a range of issues:
1. The composition of the assets and liabilities denominated in each currency is subject to change, due to prepayments, sales, reinvestments, defaults and recoveries.
2. Most CDO transactions give the asset managers discretion to hold the proceeds of repayments, prepayments, sales and recoveries prior to reinvestment. This increases uncertainty regarding the composition of assets at any future date.
3. Currency hedging becomes more complex when the transaction permits proceeds from securities denominated in one currency to be reinvested in securities denominated in another.
Collateral quality tests are designed by the rating agencies to ensure that the SPV’s assets are managed under the guidelines mandated by the transaction’s rating.
How these tests are calculated depends on the type of CDO transaction in question. For example, in conventional bond or loan transactions, the weighted average maturity test is calculated on the bonds’ maturity or the loans’ amortization schedule. In the case of CDOs of MBS/ABS, where the underlying assets do not have fixed amortization schedules and their legal final maturity is much longer than their expected average life, the weighted average maturity test is based on expected remaining average life, and not on legal final maturity. However, for some MBS/ABS, the expected remaining average life may change significantly, due to changes in interest rates or in the performance of the underlying collateral. This means that the weighted average maturity of a portfolio of ABS/MBS may change, without any change in the portfolio itself.
Most CDO transactions are also subject to a weighted average recovery rate test that sets limits for debt securities according to their position in the capital structure. (The same result can be achieved from the outset by setting limits on assets based on their seniority.)
Again, the exact method of calculating this test varies with the transaction type. In most high yield arbitrage CDOs, for example, the calculation is relatively simple. In
Currency Hedges
Collateral Quality Tests

28
conventional bond or loan transactions, it is a function of whether each asset is a bond or a loan, senior or subordinated, secured or unsecured, domiciled in the U.S., U.K., Western Europe, or emerging markets, etc. In CDOs of ABS/MBS, this test must consider the rating and seniority of each collateral tranche as well as the initial capital structure of the ABS/MBS.
Early amortization triggers are designed to protect the rated notes of cash flow CDO structures. They divert cash from lower rated notes and equity to pay down the rated notes when interest coverage or overcollateralization levels fall below certain preset levels. Most CDO structures use two types of triggers:
Interest Coverage Tests (IC tests) require the transaction to maintain a minimum interest coverage ratio for each rated note class. This is the ratio of interest income received on the assets between payment dates to interest payments due on the liabilities at each payment date.
Principal Coverage Tests (also known as par coverage tests or overcollateralization tests) require the transaction to maintain a preset minimum overcollateralization ratio for each rated note class. This is the ratio of the principal (par) amount of the assets to the performing assets, regardless of their market value plus the expected recovery rate on any defaulted assets. As mentioned earlier, for the purpose of this test only, defaulted assets may be accounted for the lower of a predetermined recovery rate or the market value.
Interest payments on subordinated notes and equity (as well as certain other subordinated payments, including those to the asset manager) cannot be made, nor can principal be reinvested, unless these tests are met at each payment date. Otherwise, principal proceeds must be held in cash (or short-term investments) until the next payment date, when principal and interest proceeds must be applied to repay the rated notes, until all coverage tests are passed.
Most CDO transactions require that, in the event of the failure of one or more coverage tests, the senior most outstanding class of the notes be paid down first, i.e., the notes be repaid sequentially. This requirement has two effects on the transaction: Firstly, the pay down result in prepayment risk being borne by the senior-most outstanding class. Secondly, and perhaps more importantly, the repayment of the notes paying the lowest coupon and spread first, increases the proportion of the junior notes (paying higher coupon and spread) to the total assets, reducing the excess spread available to the equity.
In order to improve the return to equity investors, it therefore makes sense that notes paying higher coupon and spread are repaid before the notes paying lower coupon. However, this requires repayment of notes in an order inconsistent with their seniority. This feature has appeared in some transactions, which is now generally known as Class D pay down. This feature requires that the tranche rated non-investment grade (Class D Tranche in many transaction) be paid first upon the failure of any coverage test.
Most transactions that issue multiple tranches will have coverage tests for each class of rated notes. These tests are usually set lower than the initial ratios that prevail after all collateral investments have been made during the ramp-up period.
The transactions in which these trigger are tight do not give too much room for the triggers to be breached as lower amount of losses would breach the triggers. While it
Early Amortization Triggers

Barclays Capital Guide to Cash Flow Collateralized Debt Obligations 29
may appear a good transaction characteristic, tighter trigger results in greater prepayment risk for the senior note holder as well as lower subordination levels. From the equity investors’ perspective, tighter trigger allow lower equity investments (and greater leverage). The potential equity returns in such transactions are therefore higher in the absence of any losses of par. However, if losses do exceed the available room before the triggers are breached it would also cut off the cash flows to the equity investors faster and therefore may actually reduce the expected equity returns. Conversely, the transactions, which allow more room for losses before the coverage tests are breached, would generally carry lower prepayment risk for the senior note holders and would require greater subordination levels. Furthermore, despite higher initial equity investments, the expected equity returns in such transactions may actually be higher.
In some CDOs, if the assets rated ‘Caa’/‘CCC’ or lower become a sufficiently large part of the portfolio (e.g. 7.5% or more of the par amount of the CDO’s assets), it may also cause early amortization of liabilities.

30
T A B L E 2 : S A M P L E O V E R C O L L A T E R A L I Z A T I O N R A T I O F O R S U B O R D I N A T E D N O T E S
A divided by B
A = Principal amount of performing assets plus lower of the fair market value or assumed recovery rate of defaulted assets plus cash and short-term investments not comprising interest income
B = Principal amount of the senior notes plus principal amount of the mezzanine notes including any capitalized interest plus principal amount of the subordinated notes including any capitalized interest
T A B L E 3 : S A M P L E I N T E R E S T C O V E R A G E R A T I O F O R S U B O R D I N A T E D N O T E S
A divided by B
A = Interest to be received in cash during the period on the portfolio and short-term investments plus (or minus) any scheduled amounts to be received from (or payable to) the hedge counterparty
B = Capped senior expenses plus interest amount due on senior notes plus interest amount due on mezzanine notes including interest on capitalized interest plus interest amount due on subordinated notes including interest on capitalized interest
To calculate the overcollateralization ratio, all the performing securities are accounted for at their par amount regardless of their market prices. Discounts and premiums reflected in the market values are disregarded, because cash flow CDOs are designed to pay off their liabilities through the maturity or amortization of the underlying assets, and not through their sale.
The only time market value becomes important is when the terms of the transaction require defaulted assets to be sold within a certain period (usually between 3 to 12 months after default). This so-called “forced sale” of defaulted assets exposes the transaction to market value risk. For this reason, overcollateralization ratios sometimes value defaulted assets at the lower of (a) market value or (b) the expected recovery value assigned by the rating agencies. The use of market value therefore disregards whatever recoveries the asset manager could ultimately achieve through the workout process.
It is important to note that using market value to calculate the overcollateralization ratio may in rare cases impact equity investors. If the decline in the market value of a defaulted asset is significant enough to cause a breach of an overcollateralization test, cash flows that would otherwise be available to the equity investors may be diverted to pay down the senior notes, until the tests are met. The use of market value, therefore, may potentially lower the return on the equity and, at the same time, expose the senior notes to prepayment risk.
Par Value vs. Market Value

Barclays Capital Guide to Cash Flow Collateralized Debt Obligations 31
The minimum subordinated note coverage ratios are generally set lower than the minimum mezzanine note coverage ratios, which are, in turn, set lower than the minimum senior coverage ratios. For this reason, subordinated notes coverage tests are breached earlier than mezzanine note coverage tests. The lower the minimum ratio required for any coverage test, the lower the amount of losses that will breach that test. However, the notes are almost always repaid sequentially regardless of which test is breached.
The levels at which these tests are breached are predetermined and have important implications for both subordinated notes and equity. If any of the coverage ratios fall below the test level, CDOs generally prohibit the reinvestment of any principal proceeds from repayments, amortization and recoveries on defaulted assets. Instead, these proceeds are held until the next payment date, when they are used to sequentially pay down the rated notes.
The priority of payments (also known as the “payment waterfall” or “waterfall”) refers to the sequence in which payments must be made to the holders of various note classes and to other parties to the transaction. The payments are usually separated into collections from interest and collections from principal.
Most CDOs make sequential repayment of principal. This means that the principal of the senior most outstanding class is repaid fully before any repayment of principal is made to the next class.
A small number of CDOs repay principal of various tranches “pro rata,” whereby principal is paid down pro rata according to the size of each tranche. Some transactions also make principal repayments in a “fast pay/slow pay” manner, such that a larger amount of cash is allocated to repay the principal of the senior notes and a smaller amount is allocated to the subordinated tranches.
In most payment waterfalls, payments are made first from interest and then from principal. When collections from interest are insufficient, they are generally taken from principal. When coverage tests are breached, the priority of payments changes to divert any available cash to either pay down the notes or reinvest in collateral until all coverage tests are met.
When principal repayments are made sequentially, the overcollateralization ratio increases for the senior most class outstanding at that time. This increased principal (par) coverage helps offset the incremental risk arising from a more concentrated portfolio as assets mature and their proceeds are used to pay down the senior notes.
Coverage Ratios by Note Class
Priority of Payments

32
T A B L E 4 : S A M P L E P O S I T I O N O F V A R I O U S P A R T I E S W I T H I N P R I O R I T Y O F P A Y M E N T S F R O M I N T E R E S T R E C E I P T S ( S E Q U E N T I A L R E P A Y M E N T O F P R I N C I P A L )
1. Taxes, if any SPVs that issue CDO notes are usually located in tax-free jurisdictions and, therefore, do not pay any taxes.
2. Issuers Expenses usually include fees for SPV administrators, accountants’ annual audit fees, rating agencies’ annual surveillance fees, etc.
3. Trustee Fee This is paid at an agreed rate.
4. Hedge Counterparty Payment to the Hedge Counterparty is usually only required in the case of an interest rate swap. Scheduled payments do not include any termination payments owed to the counterparty if the Hedge Counterparty is the defaulting party.
5. Asset Manager Usually a nominal amount (less than 0.2% per annum of the par amount of the collateral) is paid as a senior fee to the asset manager. Many CDO transactions do not pay any senior fees to the asset manager at all.17
6. Bond Insurer The premium for bond insurance is paid at an agreed rate in transactions that involve bond insurers.
7. Senior Noteholders Interest on any CDO tranche that cannot be deferred is paid before any coverage tests.
8. Mezzanine Noteholders Most CDO tranches rated A-/A3 or lower can defer interest without being in default, if sufficient funds are not available or if any coverage test is failed. The deferred interest is capitalized and is usually repaid on the payment date when the funds are available and all coverage tests are passed. If interest is used to pay principal on Senior Notes, it will shut off payments to the lower tranches until the Senior Notes’ Coverage Tests are passed. This diversion of interest proceeds may negatively impact the IRR of the equity investors, but not necessarily of the mezzanine noteholders, since interest is accrued on capitalized interest.
9. Subordinated Noteholders Since the Mezzanine and Subordinated Notes’ Coverage Tests are usually set lower than the Senior Notes’ Coverage Tests, they will be triggered earlier than the Senior Notes’ Coverage Tests.
10. Asset Manager The bulk of the asset manager’s fees are usually subordinated to interest payments on rated notes.
11. Equity Investors All amounts remaining after the above payments are paid to the equity investors. Some transactions require a further incentive payment to the asset manager after the equity investors’ returns exceed a predetermined hurdle rate.
17 See the discussion on Asset Manager’s Compensation on page 36.
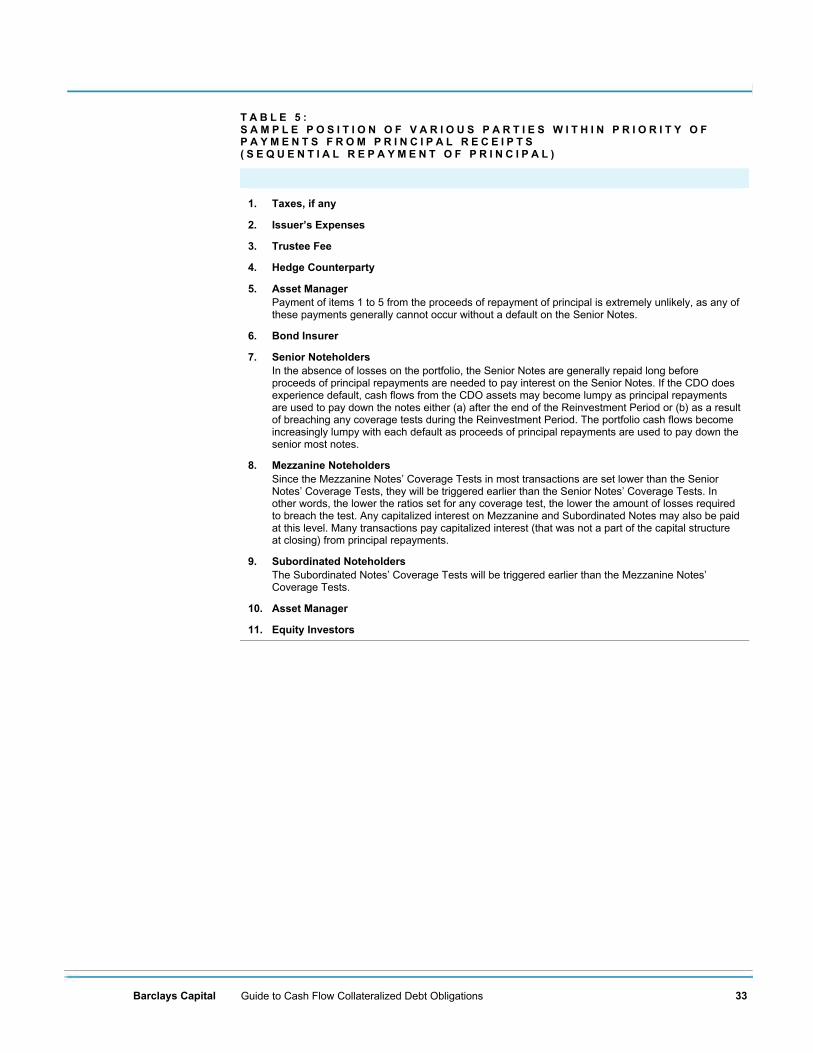
Barclays Capital Guide to Cash Flow Collateralized Debt Obligations 33
T A B L E 5 : S A M P L E P O S I T I O N O F V A R I O U S P A R T I E S W I T H I N P R I O R I T Y O F P A Y M E N T S F R O M P R I N C I P A L R E C E I P T S ( S E Q U E N T I A L R E P A Y M E N T O F P R I N C I P A L )
1. Taxes, if any
2. Issuer’s Expenses
3. Trustee Fee
4. Hedge Counterparty
5. Asset Manager Payment of items 1 to 5 from the proceeds of repayment of principal is extremely unlikely, as any of these payments generally cannot occur without a default on the Senior Notes.
6. Bond Insurer
7. Senior Noteholders In the absence of losses on the portfolio, the Senior Notes are generally repaid long before proceeds of principal repayments are needed to pay interest on the Senior Notes. If the CDO does experience default, cash flows from the CDO assets may become lumpy as principal repayments are used to pay down the notes either (a) after the end of the Reinvestment Period or (b) as a result of breaching any coverage tests during the Reinvestment Period. The portfolio cash flows become increasingly lumpy with each default as proceeds of principal repayments are used to pay down the senior most notes.
8. Mezzanine Noteholders Since the Mezzanine Notes’ Coverage Tests in most transactions are set lower than the Senior Notes’ Coverage Tests, they will be triggered earlier than the Senior Notes’ Coverage Tests. In other words, the lower the ratios set for any coverage test, the lower the amount of losses required to breach the test. Any capitalized interest on Mezzanine and Subordinated Notes may also be paid at this level. Many transactions pay capitalized interest (that was not a part of the capital structure at closing) from principal repayments.
9. Subordinated Noteholders The Subordinated Notes’ Coverage Tests will be triggered earlier than the Mezzanine Notes’ Coverage Tests.
10. Asset Manager
11. Equity Investors

34
Minimum rating requirements prevent many investors from buying lower-rated tranches or non-rated equity. For these investors, CDO structures offer various solutions, most notably principal protected notes.
Principal protected notes enable investors to benefit from the upside potential of CDO equity, while fully protecting them against the loss of principal with the certainty of a AAA rating (or any other rating level). However, in return for principal protection, these notes reduce potential returns. Principal protected notes can be tailored to suit the rating, currency and maturity requirements of individual investors.
T A B L E 6 : S A M P L E S O L U T I O N S F O R C D O E Q U I T Y I N V E S T O R S
1. Desired rating level for principal protection Depending on the investor’s risk tolerance and restrictions, rated instruments can be used to protect the principal amount of equity investment with collateral of any rating level. As a general rule, principal protection at a higher rating level requires higher amounts of initial capital outlay and provides lower upside potential. The reverse holds for lower rating levels of principal protection, which require lower initial capital outlays and permit higher upside potential. Therefore, the lowest capital outlay is required for unrated equity obligations with the greatest upside potential, and the highest capital allocation is required for AAA principal protection with the least upside potential.
2. Currency Principal protected notes can be issued in a currency other than the currency of the CDO notes. This, however, requires currency hedging of residual and uncertain cash flows.
3. Maturity The maturity of principal protected notes can be shortened or lengthened synthetically to suit investor preferences. Shortening maturities usually reduces potential equity returns, and extending maturities generally increases duration risk.
Solutions for Equity and Subordinated
Note Investors

Barclays Capital Guide to Cash Flow Collateralized Debt Obligations 35
The Role of the Asset Manager An asset manager’s role is integral to the success of any cash flow CDO transaction. The asset manager enjoys considerable flexibility and discretion, and its decisions directly impact the performance of CDO liabilities and equity. Therefore, the success of each transaction depends to a great extent on the skills and experience of the asset manager.
A CDO asset manager’s responsibilities generally include:
1. Selecting assets for the initial portfolio and subsequent reinvestments,
2. Determining the timing of sale and purchase of assets,
3. Determining the purchase and sale prices of assets,
4. Assessing the quality and adequacy of the collateral,
5. Ensuring that the SPV’s security interest in the assets are perfected,
6. Monitoring the portfolio quality,
7. Working out the defaulted assets, if any, and
8. Ensuring compliance with the investment guidelines.
CDO asset managers are often required to make decisions that might be seen to benefit one class of notes at the expense of another. Moreover, since most managers (or their affiliates) are also investors in the CDO’s equity, this dual role creates an inherent conflict of interest. For example, purchase of an asset trading at a discount to par may improve equity returns by increasing the portfolio par amount. But senior noteholders, who do not participate in the equity’s upside potential, may view the discount as simple credit deterioration that may reduce the value of their investment. The asset manager might argue that buying more par amount ultimately increases the transaction’s overcollateralization ratio and improves the position of all noteholders.
Selecting the initial portfolio is perhaps the most challenging task the CDO asset manager faces. The initial portfolio usually forms the basis for investment guidelines. Most CDO investors and participants are committed to maintaining the asset mix of the initial portfolio, although almost all CDO transactions allow trading and reinvestment that can substantially alter portfolio composition. For this reason, the asset manager’s trading and reinvestment decisions are often closely watched by investors, credit enhancers (if any) and rating agencies, especially if the portfolio experiences downgrades, defaults or trading losses.
The timing of collateral purchases and sales is also critical. Assets purchased at a discount allow managers to buy more par amount for the same price. Conversely, assets bought at a premium reduce the portfolio’s par amount, because the cash used to pay premium could be used to purchase additional assets at or below par.
For this reason, some transactions stipulate that premium can only be paid from trading gains accumulated over the par amount of the initial portfolio. However, most transactions allow purchases over par, so long as interest and par coverage tests are met.
Responsibilities
Role as Equity Investor
Asset Selection
Timing and Prices
36
Most CDO transactions allow the asset manager to invest across a broad spectrum of asset classes. Nevertheless, asset managers must demonstrate the ability to manage the type of portfolio the CDO envisages. Diversification across asset types may strengthen the transaction, but often at the cost of pushing the asset manager beyond its area of expertise.
Performance history is a critical indicator of management expertise. Past performance should be measured against the performance of peers and that of the economy as a whole. Many managers perform well during periods of strong economic growth, but may not do as well during market crises, periods of sector stagnation and economic downturns.
Asset managers differ in their trading philosophies. For example, many asset managers pursue buy-and-hold strategies, while others prefer active trading (either to take profits or minimize losses). While both strategies have their positives and negatives, strong credit skills are perhaps an asset manager’s single most important asset.
Strong credit skills rely on research and experience. A credit-oriented asset management organization must commit substantial resources to build a well-rounded team of experienced analysts and portfolio managers.
Workout experience can be critically important when the CDO portfolio does experience defaults and the asset manager must decide if and when to sell defaulted assets. However, many CDO transactions require managers to sell defaulted assets within 3 to 12 months after default, and many synthetic CDOs require speedy cash settlement of defaulted assets (for example, on the 15th day following default), effectively eliminating the manager’s discretion regarding the sale or workout of defaulted assets.
Most asset managers retain key employees whose departure could adversely affect their organization’s ability to make astute and timely decisions. The problem is complicated by high turnover rates in the asset management business. CDO asset management agreements may include “key people” clauses that provide the equity investors an option to appoint a new asset manager following the departure of certain key personnel.
Most CDO transactions pay asset management fees at various levels in the payments waterfall. Some transactions pay a nominal senior fee before interest has been paid on the senior notes, and then pay a second, larger management fee after interest has been paid to all the rated notes. In some cases, additional incentive payments are made after the equity investors have received a targeted rate of return.
Most transactions make the bulk of the payments to managers only after timely payment of interest to the rated notes has been made. This arrangement provides a strong incentive for the asset manager to ensure timely payment of interest. However, if the asset manager is removed, the replacement manager may be granted a higher senior fee (payable prior to the payment of interest on the senior notes) as an incentive to manage the transaction.
Many participants in a CDO transaction typically meet with the asset manager to evaluate the manager’s experience and expertise. If the agenda of the meeting is well planned, these meetings can be productive and mutually beneficial. Table 7 provides an example of the topics to be discussed in such meetings.
Expertise vs. Diversification
Performance History
Trading Philosophy
Credit and Research Capabilities
Workout Experience
Key Personnel
Compensation
Evaluation Meetings

Barclays Capital Guide to Cash Flow Collateralized Debt Obligations 37
T A B L E 7 : S A M P L E D I S C U S S I O N T O P I C S F O R I N V E S T O R S ’ M E E T I N G W I T H A S S E T M A N A G E R
§ History of the Firm § Affiliates and Subsidiaries § Management Structure § Number of Portfolio Managers, Credit Analysts, Traders, Research Analysts,
Support Staff, etc. § Management’s Experience in Managing Various Asset Types § Amount and Types of Assets or Funds under Management § Experience and Performance History in Managing CDOs § Performance of the Assets or Funds under Management § Asset Management Research Capability § Credit Processes § Policies and Procedures (Credit Policy Manual, Operations Manual, etc.) § Internal Compliance (Risk Management Policy, etc.) § External Compliance (Securities Regulations, etc.) § Back Office Support (e.g. to monitor compliance with the CDO’s requirements) § Internal and External Audit (Qualified or Unqualified) § Technology (Back-up, etc.)

38
Trading Constraints and CDO Reinvestment Criteria Of all structured finance products, CDOs involve the most active trading of underlying assets. All trading is governed by trading guidelines. Usually, trading is permitted only during the reinvestment period, when asset managers can reinvest principal proceeds resulting from the sale, maturity, amortization or prepayment of assets. Some transactions also allow reinvestment of principal proceeds from prepayments and unscheduled amortizations after the end of the reinvestment period. Although CDO guidelines grant asset managers great flexibility relative to other structured products, these guidelines are often viewed as too restrictive.
CDOs generally allow asset managers the freedom to sell securities they consider either credit impaired, credit improved, or defaulted. In this regard, the asset manager’s judgment is considered final, except in certain transactions that use quantitative measures (changes in spreads, ratios, etc) to determine improvement or deterioration in credit quality for accounting reasons. In addition, CDO transactions generally allow discretionary trading of between 10% and 25% of the portfolio par amount per year, provided that all other guidelines are met.
Most arbitrage CDO transactions usually permit the sale of assets under the following conditions:
n If an asset has deteriorated in credit quality (or is likely to). This provision allows CDOs to sell assets below par. Such trades, if done prudently and timed well, can prevent bigger losses from future defaults.
n If an asset has improved in credit quality. Improvement in credit quality is usually associated with decline in yield for fixed income securities, decline in spreads for loans, improvement in financial ratios, raising equity by the obligors, improvement in credit rating or higher price for the debt. By selling assets at prices higher than those of replacement assets, asset managers can realize valuable trading gains that can be passed on to equity investors. Alternatively, the gain may be retained to improve the transaction as a whole.
n If an asset has defaulted, arbitrage CDO transactions usually allow the asset manager considerable discretion with regard to workout and disposition.
The asset manager’s trading ability is constrained by rules relating to replacement assets. CDOs generally require that the purchase of replacement assets should maintain or improve a range of key credit measures, including weighted average rating, weighted average recovery rate, weighted average maturity, weighted average coupon and spread, as well as various concentration limits. In addition, CDO transactions typically require the replacement of the full par amount of securities that asset managers have sold due to improvement in credit quality (which is usually associated with higher price).
Proceeds from the sale of assets can be reinvested immediately if the manager can find replacement assets that meet all the reinvestment criteria. The sooner cash proceeds are reinvested in suitable portfolio collateral, the lower will be the negative carry resulting from the temporary investment of cash proceeds in lower-yielding, short-term investments. However, guideline restrictions often prevent the speedy replacement of assets. These restrictions include:
Sale of Assets
Purchase of Replacement Assets

Barclays Capital Guide to Cash Flow Collateralized Debt Obligations 39
n Minimum Ratings of Assets The purpose of this restriction is to size the expected loss in the transaction, based on a maximum weighted average rating factor (equivalent to a minimum rating) for the portfolio as a whole. A small (and declining) fraction of transactions have also used the “rating bucket” approach, which requires certain minimum or maximum percentages of assets to fall within specified rating categories.
n Maximum Maturity Test This test usually takes the form of a maximum weighted average maturity for the portfolio as a whole, which is usually shorter than the legal final maturity of the CDO’s liabilities. However, many transactions also specify maximum maturity buckets for individual securities. The latter approach is viewed as more restrictive, and is giving way to the weighted average maturity approach. Most transactions require that all but a negligible portion (2% to 3%) of assets mature before the CDO’s liabilities’ legal final maturity date. For securities that mature after the legal final maturity date, rating agencies normally assume a sale at distressed prices on or before the legal final maturity date, which may result in higher subordination levels.
n Maximum and Minimum Limits on Various Asset Types These include limits on non-conventional assets that fall outside of the realm of the transaction. For example, most high yield CDOs impose restrictions on the amount of bank loans, ABS, MBS and emerging market debt that may be included in the transaction.
n Maximum and Minimum Limits on Fixed and Floating Rate Assets This restriction protects the transaction against adverse moves in interest rates. At closing, most CDO transactions enter into interest rate hedges, which rating agencies test for the life of the transaction.

40
CDO Equity Return Analysis The return on CDO equity investment depends on a number of factors. Since the return is leveraged, investors can expect a higher return than what they would earn from a similar portfolio on a non-leveraged basis. By the same token, return on CDO equity investment demonstrates proportionately greater sensitivity to incidences that adversely impact returns.
Equity return analysis will differ for each CDO and must carefully consider the key variables to which each transaction is sensitive, depending on its structural elements and underlying assets. These variables include: portfolio assets, portfolio purchase price, defaults, timing and volume of default, recovery rate upon default, timing of recovery, trading losses, coupon and spread on assets and liabilities, changes in interest rate (especially if the assets are fixed rate and the liabilities are floating rate or vice versa), hedging mechanics, trigger levels, frequency of payments on assets and liabilities, payments waterfall, etc. Due to the sheer number of possible combinations of these variables, and the complexity of their interaction, no two CDO transactions will produce the same returns under the same market conditions.
Table 8 gives some sample assumptions for a hypothetical CDO equity return analysis:
T A B L E 8 : S A M P L E A S S U M P T I O N S F O R E Q U I T Y R E T U R N A N A L Y S I S
1. Par Amount of the Portfolio = $300 million
2. Amount Invested at Closing = $255 million
3. Ramp-up Period = 3 months
4. Investment during Ramp-up = $15 million at the end of each month after Closing
5. Reinvestment Period = 5 years
6. Weighted Average Maturity of the Initial Portfolio = 8.5 years
7. Legal Final Maturity = 12 years
8. Purchase Price of Initial Collateral = 96%
9. Purchase Price of Reinvested Collateral = 100%
10. Libor Rates = Forward Curve
11. Portfolio’s Weighted Average Coupon = 9.5% per annum
12. Portfolio’s Weighted Average Spread = 250 basis points per annum
13. Portfolio Default Rate = 1% to 8% per annum
14. Weighted Average Recovery Rate = 35%
15. Recovery Timing = One year after default
16. Senior Asset Management Fee = 15 basis points per annum
17. Subordinated Asset Management Fee = 35 basis points per annum
18. Trading Losses = 1% per annum
19. Trading Gains = None
Scenario Analysis and Assumptions

Barclays Capital Guide to Cash Flow Collateralized Debt Obligations 41
The purchase price of the assets has tremendous impact on the overall return on the CDO equity. Assets bought at discount permit the purchase of greater par amount and produce correspondingly higher income. However, the price discount often reflects deterioration in credit quality. The asset manager’s credit decision to invest in assets trading at a substantial discount is therefore critically important to the ultimate performance of the CDO in general and the equity in particular.
Defaults also have a pronounced impact on the equity returns. This is particularly true if the defaults happen early in the life of the transaction. Everything else being constant, early defaults reduce or terminate payments to the equity and generally result in lower expected equity returns.
C H A R T 8 : I M P A C T O F D E F A U L T R A T E O N E X P E C T E D E Q U I T Y I R R
6%5%4%1% 2% 3%
-80%
-60%
-40%
-20%
0%
20%
40%
Annual Default Rate Equity IRR
C H A R T 9 : I M P A C T O F D E F A U L T T I M I N G O N E X P E C T E D E Q U I T Y I R R
-20%
-10%
0%
10%
20%
30%
40%1 2 3 4 5
First Year of Default
Exp
ecte
d E
quity
IRR
Default Rate 1% per annumDefault Rate 2% per annumDefault Rate 3% per annumDefault Rate 4% per annumDefault Rate 5% per annum
Impact of Assets’ Purchase Price
Impact of Default Rates,
Timing and Spikes

42
C H A R T 1 0 : I M P A C T O F S P I K E I N D E F A U L T R A T E O N E X P E C T E D E Q U I T Y I R R
0%
5%
10%
15%
20%
25%
30%
1 2 3 4 5
Year of Spike in Default
Exp
ecte
d E
quity
IRR
Default rate 1% per annum (6% in spike year)Default rate 2% per annum (6% in spike year)
Everything else being equal, higher coupons earned on the assets should result in higher equity returns. However, securities that pay higher coupons are generally rated lower, and their propensity to default is higher. Therefore, the optimal mix of coupon and credit risk is an important determinant of a CDO’s performance.
The amount of recovery subsequent to default is very important. Often, higher recoveries require longer workout periods, resulting in negative carry for the transaction. Further, many transactions require defaulted assets to be sold within a predetermined period following default. Also, recovery rates will depend on the type of the asset in default, its position in the obligor’s capital structure and its liquidity in the market.
Trading gains and losses can have considerable impact on a CDO transaction. The impact of trading losses on equity returns will be similar to lower returns through higher default rates. Conversely, trading gains can offset default losses and improve overall equity returns.
Impact of Coupon and Spread
Impact of Recovery Rate and Timing
Impact of Trading Gains

Barclays Capital Guide to Cash Flow Collateralized Debt Obligations 43
Summary of Major Risks for CDO Investors Like any other structured finance product, investment in CDOs involves risk. A clear understanding of the risks, mitigants and potential rewards for taking these risks are imperative for all CDO investors and asset managers. The major risks associated with investment in and/or managing CDOs have been discussed at length in the preceding pages. Some of these are summarized below:
Credit risk refers to the risk of default on a CDO’s investment portfolio. While overcollateralization provides protection from losses to the rated notes, equity investors do not have the benefit of overcollateralization and subordination. However, CDO transactions are usually structured to provide equity investors with the targeted returns assuming a given amounts of losses on the underlying portfolio (see page 40 “Table 8: Sample Assumptions for Equity Returns Analysis”). Equity investors should weigh their expected returns against the likelihood of those losses and other assumptions.
The interest rate risk arises from various factors in CDOs and depends on the complexity of structure and the nature of hedging. In most arbitrage cash flow CDOs it is in the form of basis risk i.e. a mismatch between fixed and floating rates asset and liabilities. Most arbitrage CDOs hedge this risk with interest rate swaps, caps, and/or floors. However, the interest rate risk in CDOs is difficult to hedge fully due to the active management of assets, limited ability to buy or sell interest rate hedges, active management and embedded optionalities.
The liquidity risk in the CDO notes are of two types. First, the secondary market for CDO notes is, at best, fairly limited. This is particularly true of the tranches rated below AAA. Second, CDOs often invest in assets that may have limited liquidity. Depending on the amount of exposure to the relatively illiquid assets, the asset manager may not be able to liquidate / substitute some assets when needed. The liquidity risk would be enhanced if the relatively illiquid assets mature after the legal final maturity date of the CDO’s notes and equity. This risk also usually arises in CDOs from the inclusion of zero-coupon bonds, step-up bonds, PIK bonds, and bonds that make interest payment less frequently (e.g. annually) than the notes issued by the CDO (e.g. semi-annually).
The prepayment risk in CDOs is mostly borne by the senior most notes since the payments waterfall in most arbitrage cash flow CDOs is sequential. This risk is enhanced in transactions that have tighter coverage ratios. Transactions which are structured with lesser room between initial coverage ratios and the levels at which they are breached would have greater prepayment risk. Furthermore, all other things remaining constant, tighter triggers can allow lower subordination at the same rating level. It should, however, be remembered that breaching a trigger may not always result in a pay down of the senior notes. The senior notes are usually repaid from principal repayments on assets. If a CDO invested mostly in long-dated, bullet maturity assets (like high yield bonds), there may not be any cash available from principal repayments to effect the repayment of the senior notes.
CDOs’ investment guidelines can often be too restrictive. Although these restrictions are designed to protect the investors, they can result in delays in reinvestment of available proceeds in assets that satisfy the reinvestment criteria. Such delays result in negative carry, i.e., interest earned on short-term liquid investment would be lower
Credit Risk
Interest Rate Risk
Liquidity Risk
Prepayment Risk
Reinvestment Risk

44
than the interest paid on the liabilities. Negative carry would also impact the expected return on the CDO’s equity.
Asset manager’s expertise and ability to manage the CDO’s portfolio of assets is inextricably linked with its success. Arbitrage CDO’s cannot be extricated from its manager’s expertise and reputation. This is less true for bank balance sheet CDOs, which are not as actively managed. Asset manager’s decisions regarding portfolio composition, trading, timing of sale and purchase, etc. are crucial to a CDO’s performance. Another form of this risk arises from changes in portfolio management team (e.g. departure of a key portfolio manager), which could potentially have an adverse, albeit short-term, impact on an asset manager’s ability to manage a CDO.
CDO have made forays into investing in assets denominated in more than one currency. This feature has been facilitated by the introduction of euro in early 1999. Such transactions have so far been fairly limited. The foreign currency risks in CDOs are complex and difficult to hedge fully. The direction of interest rate movements over long periods coupled with the amount and timing of prepayment, sale, default, recoveries, reinvestment, mandatory redemption upon breach of coverage tests and trading restrictions result in a large number of possible combination of events that can cause currency loss or gain. The CDO investors should carefully evaluate currency hedges in each transaction with possible exposure to currency risk.
CDOs typically limit the counterparty credit risk by dealing only with highly rated entities for interest rate hedges, foreign currency hedges, credit derivates, loan participations and securities lending (if any). Bivariate risk in CDOs refers to the risk that payments on an underlying debt instrument could be interrupted by the declining credit quality of another entity. For example, credit linked notes are subject to the credit risk of the counterparty in addition to the credit risk of the referenced obligor. Similarly, repayment of debt issued by corporate obligors in the emerging markets could be impeded by the sovereign’s ability to enact laws that could limit or prevent the availability of foreign currencies to corporations for debt servicing.
And finally, all of the risks discussed above will be more pronounced in an economic downturn that may result in large-scale ratings downgrade and/or defaults. Sharp increase in ratings downgrade is concomitant with economic downturn and emblematic of systemic risk. CDO notes may be downgraded solely due to downgrade of sufficient number of underlying assets. This risk may be greater for CDOs with little or no cushion in their subordination levels. CDOs could potentially be more prone to systemic risk than other investments due to a host of reasons such as trading limitations arising primarily out of their status as a structured vehicle (with limited financial and management flexibility). CDO structures, however, also provide protection from systemic risk by insulating the investors from decline in market values of the performing assets.
Asset Manager Risk
Currency Risk
Counterparty/Bivariate Risk
Systemic Risk

Barclays Capital Guide to Cash Flow Collateralized Debt Obligations 45
Glossary of Terms Accrued Interest: The amount of interest accumulated on a performing bond that is payable by the buyer to the seller when the bond’s sale is settled between the payment dates on that bond.
Amortization Period: A period following the Reinvestment (or Revolving) Period during which a CDO is not permitted to reinvest any principal repayments received due to amortization, maturity, etc. Instead, any principal repayments received during this period are used to repay the notes and make payments to the equity investors. Some CDOs permit reinvestment of prepayments during this period, provided certain requirements are fulfilled.
Arbitrage CDOs: Arbitrage transactions are structured to capture for equity (first loss) investors the spread between the relatively high yielding assets and the lower yielding liabilities represented by the rated notes.
Asset-Backed Securities (ABS): Structured finance securities backed by pools of receivables, excluding mortgages. A wide range of assets, including credit card receivables, home equity lines of credit, car loans and student loans, can be securitized into ABS.
Call Date: The date prior to stated maturity on which a Callable Bond can be redeemed.
Call Price: The price at which a bond can be called on its Call Date.
Call Premium: The excess of a bond’s Call Price over its Par Value.
Callable Bonds: A bond that provides its issuer an option to redeem the bond before its stated or legal final maturity.
Capitalized Interest: Same as Deferred Interest.
Cash Flow CDO: A collateralized debt obligation that is structured to make payments of interest and principal to its liabilities from the cash flow provided by the interest and principal payments of its collateral, rather than from the trading and sales of its collateral. Compare to Market Value CDO.
Cash Flow Collateralized Bond Obligation (Cash Flow CBO): A structured finance product that issues securities whose repayments are backed by the cash flows of a portfolio consisting mostly of bonds.
Cash Flow Collateralized Debt Obligation (Cash Flow CDO): A structured finance product that issues securities whose repayments are backed by the cash flows of a portfolio comprising one or more types of non-consumer debt instruments including bonds, loans, asset-backed securities, etc. Cash Flow CDO is now generally used as a generic term for both cash flow CBOs and cash flow CLOs.
Cash Flow Collateralized Loan Obligation (Cash Flow CLO): A structured finance product that issues securities whose repayments are backed by the cash flows of a portfolio consisting mostly of bank loans.
Collateralized Equity Obligation (CEO): A term often used for CDOs of private equity.

46
Collateralized Fund Obligation (CFO): A term often used for CDOs of hedge funds.
Class: Same as Tranche.
Collateral Quality Tests: Tests that ensure that the CDO’s collateral portfolio is properly invested by asset class, maturity, rating, etc., according to the guidelines of the transaction. These tests typically vary between different CDO transactions, depending on each transaction’s structure and guidelines. Some tests may require minimum and maximum Concentration Limits.
Commercial and Industrial (C&I) Loans: Loans made by banks to commercial and industrial clients. These loans may be made to obligors that are rated investment grade or non-investment grade.
Concentration Limits: The limits imposed by a CDO’s diversity guidelines that restrict how the CDO diversifies its collateral among obligors, industries, regions, asset types, floating rate assets, fixed rate assets, annual pay bonds, PIK Bonds, etc.
Coupon Rate: The stated rate of interest paid on a bond. Also known as Coupon.
Coverage Ratios: Generally refer to both Interest Coverage Ratios and Overcollateralization Ratios (Par Coverage Ratios).
Coverage Tests: Ongoing tests used by CDOs to maintain a minimum Overcollateralization Ratio and a minimum Interest Coverage Ratio usually for each rated class of notes. If the minimum Coverage Ratios are not met on any payment date, cash available from interest receipts and/or principal repayments is diverted to repay the rated notes. Such repayment is usually made sequentially and reinvestment in assets is generally not permitted.
Credit Default Swap: A type of Credit Derivative contract under which a counterparty agrees to make periodic payments to another counterparty in return for making a payment upon default by the obligor of a reference debt obligation.
Credit Derivative: Derivative contracts traded over-the-counter whose value is derived, in part, from the credit performance of asset or assets referenced in the contracts. Credit derivatives can be structured to allow investors to assume some but not all the risks embedded in reference debt instruments. For example, credit derivatives may be used to create synthetic securities with a maturity shorter than the tenor of the reference debt instrument. Examples of credit derivatives include asset swaps, credit default swaps, total return swaps, credit-linked notes, and credit spread derivatives.
Credit-linked Note: A structured note embedded with a Credit Derivative, which may reference credit risk of an asset or a portfolio of assets. The credit-linked note (CLN) converts the credit derivative into a cash investment that can be tailored to investors’ preferences with respect to tenor, currency, fixed or floating interest rate, etc.
Deferred Interest: The amount of interest that a Payment-in-kind (PIK) Bond may capitalize i.e. that it may add to the principal instead of paying in cash. Also known as Capitalized Interest.
Default: The failure of an obligor to pay interest and/or principal when it is due and payable.

Barclays Capital Guide to Cash Flow Collateralized Debt Obligations 47
Defeasance: A technique of repaying a debt prior to its maturity by placing risk-free assets (or assets of an acceptable risk level) in an escrow account whose cash flows are used to repay the defeased debt. In CDOs, this technique is typically utilized in structuring principal protected investments for the equity investors.
Discount: The excess of a bond’s Par Value over its market value.
Diversification: The inclusion of various types of assets in a portfolio in order to reduce risk and improve performance.
Early Amortization Triggers: Coverage Tests included in CDOs whose failure on any payment date result in the diversion of a CDO’s cash flows towards curing these tests. In some CDOs, if the assets rated ‘Caa’/‘CCC’ or lower become a sufficiently large part of the portfolio (e.g. 7.5% or more of the par amount of the CDO’s assets), it may also cause early amortization of liabilities.
Face Amount: Same as Par Value or Par Amount.
Hedging: The strategy of offsetting business or investment risk in one security or portfolio of securities with another investment or transaction. In CDOs, for example, interest rate swaps are frequently used to hedge the basis risk arising from the payment obligations on floating rate liabilities from the cash flows of fixed rated assets.
High Yield: A debt instrument that is rated below investment grade (i.e. below BBB- / Baa3) by the debt rating agencies. This term is generally used for non-investment grade bonds.
Interest Coverage Ratio: For each class of notes, the ratio of the amount of interest collected from a CDO’s assets to the amount of interest due on that note class and on the note classes senior to it.
Investment Grade Debt: A debt instrument that is rated BBB- / Baa3 or higher by the debt rating agencies.
Leveraged Loans: Loans made by banks to corporate entities that are generally rated non-investment grade. These loans are usually made in connection with leveraged buyouts (LBOs) and mergers and acquisitions (M&As).
Legal Final Maturity: The date on which a debt instrument is due and payable in full.
Liquidity: The measure of the ease or difficulty with which securities (bonds, loans, promissory notes, etc.) can be bought or sold in the market. Securities that can be traded easily are said to be highly liquid. The liquidity of a security depends on a number of factors, including the number of buyers and sellers.
Market Value CDO: A collateralized debt obligation that is structured to make payments of interest and principal to its liabilities from the trading and sale of its collateral, rather than from cash flow provided by the interest and principal payments of its collateral. Compare to Cash Flow CDO.
Mandatory Redemption: The early repayment of principal of CDO notes required to cure the failure of one or more Coverage Test.
Monoline Bond Insurer: Insurance companies, usually rated AAA / Aaa, that specialize in providing credit insurance that guarantees the performance of various types of debt, including senior tranches issued by CDOs.

48
Mortgage-Backed Securities (MBS): Securities whose repayments are backed by a portfolio of residential and commercial mortgages.
Non-Investment Grade Debt: A debt instrument that is rated BB+ / Ba1 or lower by the debt rating agencies. Also known as Speculative Grade Debt.
Negative Carry: Loss resulting from the financing cost, or the cost of carrying a debt used to finance assets, being greater than the yield earned on those assets. In the CDO context, negative carry can result from the investment of cash proceeds in high-quality short-term securities that generate interest income that is lower than the interest paid to CDO liabilities. This usually occurs when cash is invested in short-term investments until the next payment date, either to pay down liabilities or to reinvest in portfolio assets that meet the CDO’s reinvestment guidelines. Also called Negative Arbitrage.
Non-call Period: A period during which a debt may not be called for Redemption.
Optional Redemption: The prepayment of a CDO’s liabilities usually at the option of equity investors. Optional redemption can not occur during the CDO’s Non-call Period.
Original Issue Discount (OID) Bonds: Bonds that are issued at substantial discount to par. Zero Coupon Bonds are an example of OIDs. OID bonds may pay Coupons that are lower than market rate at the time of issuance but their yield is adjusted through Discount.
Overcollateralization: The excess of the par amount of collateral available to secure one or more classes of notes over the par amount of those notes.
Overcollateralization Ratio: For each note class, the ratio of the par amount of a CDO’s assets to the outstanding par amount of that note class and the note classes senior to it. (Defaulted assets are generally counted at a predetermined discount to par.)
Par Coverage Ratio: Same as Overcollateralization Ratio
Par Value: The principal amount of a bond or loan that is payable at maturity. Also known as Face Amount or Par Amount.
Payments Waterfall: The order in which payments must be made to the holders of CDO’s debt and equity and various other parties like Trustee, Asset Manager, Hedge Counterparties, Monoline Bond Insurer, etc. involved in a CDO transaction. Also known as Waterfall or Priority of Payments.
Payment-in-kind (PIK) Bond: A bond that gives its issuer the option at each payment date of capitalizing interest i.e. issuing additional par amount of the same security instead of making scheduled payments of interest in cash. The par amount of new issuance will be equal to the amount of interest to be paid. CDOs also issue Tranches that may capitalize / defer interest.
Prepayment: The unscheduled repayment, either in part or in full, of the principal of a debt before it is due. Fixed income instruments often carry a prepayment penalty in the form of a Call Premium.
Premium: The excess of a bond’s market value over its Par Value.
Principal: The Par Value of a bond or a loan.

Barclays Capital Guide to Cash Flow Collateralized Debt Obligations 49
Principal Coverage Ratio: Same as Overcollateralization Ratio or Par Coverage Ratio.
Priority of Payments: Same as Payments Waterfall.
Ramp-up Period: A period of time (usually between 3 to 6 months) beginning on the day of closing, during which the CDO is required to buy assets with any proceeds of the notes and equity that remain uninvested at closing.
Ramp-up Risk: The risk of adverse price and spread movements during the ramp-up period that could make the assets more expensive to acquire and/or their credit spreads tighter, ultimately leading to lower yield on the CDO equity.
Redemption: The repayment of principal prior to the maturity of a bond or note.
Reinvestment Period: A period, generally between of 3 to 5 years, during which a CDO is permitted to reinvest any principal proceeds received due to amortization, maturity, prepayment, sale, etc. Not all CDOs have a reinvestment period.
Revolving Period: Same as Reinvestment Period.
Securitization: The process by which financial assets (consumer and/or commercial) are pooled together and sold to a Special Purpose Vehicle (SPV) that issues liability and equity tranches that are secured with the financial assets. The securities issued as a result of securitization are usually classified as either Mortgage-Backed Securities or Asset-Backed Securities.
Sequential Repayment of Principal: A method of repayment of the principal of CDO liabilities that requires principal repayment of the senior most outstanding class before applying any amount to the repayment of the principal of the next senior class.
Special Purpose Vehicle (SPV): A trust, corporation, partnership, or a limited liability company that is set up to buy assets and issue debt and equity tranches. Securitization is facilitated by the use of SPVs. Also known as special purpose entities (SPEs) and special purpose corporations (SPCs).
Step-up Bond: A bond whose Coupon Rate increases from a predetermined date. Some step-up bonds may not pay any interest up to a certain date i.e. initially they may be Zero Coupon Bonds.
Subordination: The cumulative par amount of liabilities that are subordinated to any class of notes issued by a CDO or any other form of structured financing.
Synthetic CDO Structure: A type of CDO structure that use Dredit Derivatives to transfer risk and may or may not involve sale and purchase of securities for cash. Instead credit risk is transferred through credit derivatives that reference a portfolio of credit exposures (e.g. loans and debt securities). The liability structure of Synthetic CDOs may be fully or partially non-funded.
Tranche: A class of an Asset-Backed Security. While each tranche (or class) is issued under the same documentation, the terms of each tranche may differ in terms of interest rate, maturity, etc.
Warehousing: The acquisition of assets in an escrow account on behalf of the CDO prior to the closing date.
Warehousing Facility: A debt facility set up for the purpose of acquiring assets prior to the CDO’s closing date.

50
Waterfall: Same as Payments Waterfall.
Zero Coupon Bonds: Bonds that do not pay any coupon in cash prior to maturity. The investors in zero coupon bonds receive one payment at maturity or at the call date. Zero coupon bonds do not have any Reinvestment Risk as the yield is locked in at the time of purchase provided the bond is held to maturity.

Barclays Capital Guide to Cash Flow Collateralized Debt Obligations 51
THIS PAGE INTENTIONALLY LEFT BLANK.

52
THIS PAGE INTENTIONALLY LEFT BLANK.


This publication has been prepared by Barclays Capital - the investment banking division of Barclays Bank PLC and its affiliates worldwide (‘Barclays Capital’). This publication is provided to you for information purposes, any pricing in this report is indicative and is not intended as an offer or solicitation for the purchase or sale of any financial instrument. The information contained herein has been obtained from sources believed to be reliable but Barclays Capital does not represent or warrant that it is accurate and complete. The views reflected herein are those of Barclays Capital and are subject to change without notice. Barclays Capital and its respective officers, directors, partners and employees, including persons involved in the preparation or issuance of this document, b from time to time act as manager, co-manager or underwriter of a public offering or otherwise deal in, hold or act as market-makers or advisors, brokers or commercial and/or investment bankers in relation to the securities or related derivatives which are the subject of this report. Neither Barclays Capital, nor any officer or employee thereof accepts any liability whatsoever for any direct or consequential loss arising from any use of this publication or its contents. Any securities recommendations made herein may not be suitable for all investors. Additional information regarding this report will be furnished upon request. This document has been approved for distribution in the UK by Barclays Bank PLC, regulated by the Securities and Futures Authority (‘SFA’) for the conduct of investment business. Barclays Capital Inc. accepts responsibility for the distribution of this report in the United States within the meaning of Regulation S of the US Securities Act 1933. Any transactions by US persons in any security discussed herein must be carried out through Barclays Capital Inc., 222 Broadway, New York, 10038. Clients should contact and execute transactions through a Barclays Bank PLC branch or affiliate in their home jurisdiction unless local regulations permit otherwise. Copyright in this report is owned by Barclays Capital ( Barclays Bank PLC, 2001) - no part of this report may be reproduced in any manner without the prior written permission of Barclays Capital. Barclays Bank PLC is registered in England No. 1026167. Registered office 54 Lombard Street, London EC3P 3AH.
Barclays Capital Offices
The Americas Bogota Mexico City San Francisco +571 312 8966 +525 662 2200 +1 415 765 4700
Buenos Aires Miami San Paulo +5411 4315 3370 +1 305 533 3333 +5511 284 3564
Chicago New York +1 312 341 3300 +1 212 412 4000
Europe/Africa Frankfurt Lugano Paris +49 69 71 6100 +41 91 912 16 00 +33 1 4458 3232
Geneva Madrid Prague +41 22 715 02 44 +34 91 336 1778 +4202 2422 9872
Johannesburg Milan Warsaw +2711 441 6300 +39 2 6372 2511 +48 22 635 0565
London Moscow +44 20 7623 2323 +7 503 956 3100
Asia Pacific Beijing Kuala Lumpur Sydney +86 10 6512 2288 +603 2148 8688 +612 9220 6000
Mumbai Seoul Tokyo +91 22 284 2888 +822 397 3000 +813 3276 1100
New Delhi Shanghai +91 11 371 5255 +8621 6279 8279
Hong Kong Singapore +852 2903 2000 +65 395 3000