the attribution of the present-day total greenhouse … 2010.pdf · the attribution of the...
TRANSCRIPT
JOURNAL OF GEOPHYSICAL RESEARCH, VOL. ???, NO. , PAGES 1?? ,
The attribution of the present-day total
greenhouse effect
Gavin A. Schmidt, Reto Ruedy, Ron L. Miller and Andy A. Lacis
NASA Goddard Institute for Space Studies, New York, New York
G.A. Schmidt, NASA Goddard Institute for Space Studies, 2880 Broadway, New York, NY
10025 ([email protected])
D R A F T August 10, 2010, 6:18pm D R A F T
2 SCHMIDT ET AL: GREENHOUSE EFFECT ATTRIBUTION
Abstract. The relative contributions of atmospheric long-wave absorbers
to the present-day global greenhouse effect are among the most misquoted
statistics in public discussions of climate change. Much of the interest in these
values is however due to an implicit assumption that these contributions are
directly relevant for the question of climate sensitivity. Motivated by the need
for a clear reference for this issue, we review the existing literature and use
the Goddard Institute for Space Studies ModelE radiation module to pro-
vide an overview of the role of each absorber at the present-day and under
doubled CO2. With a straightforward scheme for allocating overlaps, we find
that water vapour is the dominant contributor (∼50% of the effect), followed
by clouds (∼25%) and then CO2 with ∼20%. All other absorbers play only
minor roles. In a doubled CO2 scenario, this allocation is essentially unchanged,
even though the magnitude of the total greenhouse effect is significantly larger
than the initial radiative forcing, underscoring the importance of feedbacks
from water vapour and clouds to climate sensitivity.
D R A F T August 10, 2010, 6:18pm D R A F T
SCHMIDT ET AL: GREENHOUSE EFFECT ATTRIBUTION 3
1. Introduction
The global mean greenhouse effect can be defined as the difference between the planetary
blackbody emitting temperature (in balance with the absorbed solar irradiance) and the
global mean surface temperature. The actual mean surface temperature is larger (by
around 33◦C, assuming a constant planetary albedo) due to the absorption and emission
of long-wave (LW) radiation in the atmosphere by a number of different ’greenhouse’
substances.
A question that often arises in discussions is how much of the greenhouse effect that
can be attributed to carbon dioxide, water vapour and clouds. The public interest is
possibly linked to the notion that these factors are directly relevant to determining how
the planet will react to increasing CO2 levels (the climate sensitivity). However, while
climate sensitivity is widely discussed in the literature [e.g. Charney , 1979; Lorius et al.,
1990; Knutti et al., 2006; Annan and Hargreaves , 2006], there are only a few scattered
mentions of the magnitude of the role of CO2 in the climatological energy balance and
these are either only valid for a single profile [Kiehl and Trenberth, 1997, (henceforth
KT97)], or inconsistent [e.g. Lindzen, 1991]. Thus there remains a great deal of confusion
related to the current global CO2 contribution and what it means. The key issues relate
to the spectral overlaps between absorbers and, potentially, the spatial and temporal
distribution of absorbers. The connection (or lack thereof) between these assessments
and estimates of climate sensitivity also requires addressing. This last point depends very
much on the nature of atmospheric feedbacks on water vapour and clouds. We provide
here a relatively straightforward investigation of these issues in an attempt to synthesize
previous work, address some of the issues more comprehensively and provide some insight
D R A F T August 10, 2010, 6:18pm D R A F T
4 SCHMIDT ET AL: GREENHOUSE EFFECT ATTRIBUTION
into the connection between the attribution of the total present-day greenhouse effect and
the climate sensitivity. Note that we are not discussing the attribution of any specific
climate changes.
We quantify the impact of each individual absorber in the total effect by examining the
net amount of long-wave radiation absorbed in the atmosphere (G, global annual mean
surface upwelling LW minus the TOA LW upwelling flux) [Raval and Ramanathan, 1989;
Stephens and Greenwald , 1991]. This is zero in the absence of any long-wave absorbers,
and around 155 W/m2 in the present-day atmosphere [Kiehl and Trenberth, 1997]. This
reduction in outgoing LW flux drives the 33◦C greenhouse effect defined above, and is an
easier diagnostic to work with. We therefore use the percentage change in the LW flux
reduction as our metric for the greenhouse effect throughout this paper. All percentages
can easily be converted to W/m2 by multiplying by 155. There is a connection between our
metric and the oft-used ’no-feedback’ temperature (i.e. the surface temperature change
that re-equilibriate the top-of-atmosphere (TOA) radiation assuming a constant lapse
rate and that all other constituents remain constant) [Hansen et al., 1984, 1988], but the
relationship is not linear, nor constant across absorbers.
Long-wave absorbers in the present-day atmosphere consist of water vapour, clouds
(condensed water in ice and liquid form), the well-mixed greenhouse gases (GHGs, i.e.
CO2, CH4, N2O, CFCs), ozone, aerosols (sulfates, nitrates, dust, soot and other carbona-
ceous aerosols) and very small contributions from other absorbers. Of these factors, water
vapour, clouds and CO2 dominate, while all aerosols and other contributors only make
small contributions to the overall effect. Periodic injections of volcanic aerosols into the
stratosphere can make a noticeable difference to LW fluxes, but will not be considered
D R A F T August 10, 2010, 6:18pm D R A F T
SCHMIDT ET AL: GREENHOUSE EFFECT ATTRIBUTION 5
here. Gases, clouds and aerosols can have significant short-wave (SW) impacts as well
(and in the latter two cases, the cooling impact via SW reflection is dominant) but these
are not central to the discussion here.
For each pair of absorbers, there is potentially a spectral overlap. For example, both
water vapour and CO2 have overlapping absorption lines spread across the LW spectrum.
This means that the sum of the effect of each absorber acting separately is greater than
if they act together. Therefore the maximum effect of an absorber (when it acts alone)
can be significantly different from the minimum effect (when only it is removed). We
denote these effects as the single-factor addition and single-factor removal, respectively.
The importance of any one absorber is consequently dependent on all the others and
there is no unique relationship between the amount of any one absorber and the total LW
absorption. The spatial distribution of absorbers (particularly water vapour and clouds)
and temperatures will also impact the global mean effect.
Before we continue, we must clarify two potential areas of semantic confusion. Firstly,
the concepts of forcings and feedbacks are key in assessing climate sensitivity [Ramaswamy
et al., 2001]. Generally speaking the definitions depend on the modelled system. For in-
stance, in a coupled ocean-atmosphere model, sea surface temperatures (SST) will change
and act as a feedback to changes in the atmosphere, whereas in an atmosphere-only
model, SST changes can be imposed and are thus an external forcing. The system which
is relevant for our discussion of climate sensitivity consists of the atmosphere (winds,
temperature, humidity, clouds etc.) coupled to a simplified upper ocean component that
allows SST to vary [Charney , 1979]. In this system, CO2, other trace GHGs, solar vari-
ations etc. are forcings, while the changes to internal prognostic variables corresponding
D R A F T August 10, 2010, 6:18pm D R A F T
6 SCHMIDT ET AL: GREENHOUSE EFFECT ATTRIBUTION
to clouds and water vapour (that occur as a function of other changes in climate, which
then go on to change the radiative transfer in the climate themselves) will be feedbacks.
The response of this system to radiative forcing is increasingly defined as the ’Charney
sensitivity’ (defined as the ◦C warming for a doubling of CO2 or, equivalently, the warming
per unit radiative forcing (measured in ◦C/(W/m2) ) after the eponymous 1979 report
cited above. It is possible to have forcings directly affect internal variables (such as the
indirect aerosol effect on clouds or the the impact of stratospheric water vapour of changes
in methane) but we do not consider these cases here [Hansen et al., 2005]. The internal
changes are sometimes referred to as ’fast feedbacks’ to distinguish them from ’slow feed-
back’ processes (such as vegetation or carbon cycle changes) that are not included within
our modelled system, though since many fast feedbacks associated with atmospheric chem-
istry or aerosols are also not included, that nomenclature is not completely appropriate
[e.g Lohmann et al., 2010].
Secondly, the term ’radiative forcing’ has been used differently by different authors. For
instance, KT97 define G as the ’long-wave radiative forcing’, and Harrison et al. [1990]
define ’cloud radiative forcing’ as the difference in satellite-derived fluxes between cloudy
and clear sky pixels (see also Ramanathan and Inamdar [2006]). However, ’radiative
forcing’ in the sense used by the Intergovernmental Panel on Climate Change (IPCC)
assessment reports [Houghton et al., 2001] is a metric that is designed to allow compar-
isons of different external forcings (such as changes in greenhouse gases, solar irradiance
or aerosols), such that the climate response (to zeroth order) only depends on the net
radiative forcing rather than the physics of the specific forcing agent. Neither total water
vapour nor clouds have a radiative forcing in this IPCC sense. Thus comparisons of the
D R A F T August 10, 2010, 6:18pm D R A F T
SCHMIDT ET AL: GREENHOUSE EFFECT ATTRIBUTION 7
different kinds of ’radiative forcings’ are not particularly insightful, and we try to carefully
delineate what we mean in each case below.
2. Previous descriptions
The first quantitative estimates of the relative importance of LW absorbers dates back
(at least) to the first experiments with radiative-convective column models for the Earth’s
atmosphere [Manabe and Strickler , 1964; Manabe and Wetherald , 1967]. In particular,
the review of Ramanathan and Coakley [1978] assessed the importance of water vapour,
CO2 and O3 in the clear sky long-wave budget for mean column properties by removing
each absorber in turn. Using our metric of G, (the net LW flux reduction), they found
the single-factor removal effect for water vapour, CO2 and O3 of 35%, 12% and 3%,
respectively. Similarly, Hansen et al. [1988] in a 3-dimensional atmospheric model imply
a ∼7 K ’no-feedback’ temperature response for removing 338ppm of CO2 (1980 values)
out of the total 33K greenhouse effect (equivalent to a single-factor removal effect of a
15% decrease in G).
The IPCC 1990 report [Houghton et al., 1990] states (without reference, p48) that the
water vapour acting alone provides 60–70% of the long-wave absorption and CO2 (alone),
25%. In more recent work, similar numbers can be inferred (i.e. Clough and Iacono [1995]
calculate that water vapour alone would provide 63% of the net LW absorption (for a
single reference profile)). Neither of these studies contradict Ramanathan and Coakley
[1978] since these are the single-factor addition effects (each substance acting on its own).
Another early and widely cited estimate is by Lindzen [1991] (in a book review of the
1990 IPCC volume) states that “98% of the natural greenhouse effect” is due to water
D R A F T August 10, 2010, 6:18pm D R A F T
8 SCHMIDT ET AL: GREENHOUSE EFFECT ATTRIBUTION
vapour and stratiform clouds, and “less than 2%” for CO2, though no source is given for
these numbers.
With respect to clouds, Houghton et al. [2001] quotes Ramanathan and Coakley [1978]
as providing an estimate for the LW effect of the removal of clouds as 14%, although the
characteristics of the clouds in that model were grossly simplified. Observational estimates
of LW ’cloud radiative forcing’ (CRF) from the Earth Radiation Budget Experiment
(ERBE), suggest a value of 31 W/m2 for the long-wave effect of clouds [Harrison et al.,
1990]. This is equivalent to a ∼20% effect on G and is the single-factor removal value in
the sense defined above. Note that while this paper is concerned with the ’greenhouse’
impact of clouds, their net radiative impact including SW effects is one of cooling.
KT97 used a single representative (but adjusted) atmospheric profile with a simplified
cloud distribution and examined the roles of different absorbers in the long- and short-
wave radiation budget under clear and cloudy skies. The single-factor removal effect of
clouds (in LW) was set from the ERBE data (i.e. 20%) but the single-factor addition effect
in their experiment can be calculated to be 45%. In the clear sky case, they found (after
accounting for overlaps) that water vapour, CO2, O3 and others provided 60%, 26%, 8%
and 6% of the net LW absorption respectively with similar percentages in cloudy skies.
The all-sky percent contributions can be estimated (within a percent) to be 41%, 31%,
18% and 9% for water vapour, clouds, CO2 and everything else.
Thus while related and interesting aspects of the issue have been noted as described,
there does not appear to have been a global analysis that a) takes into account the
full spatial and temporal distribution of absorbers and temperatures, b) clearly gives
the single-factor addition, removal and net effects for all the different absorbers, and c)
D R A F T August 10, 2010, 6:18pm D R A F T
SCHMIDT ET AL: GREENHOUSE EFFECT ATTRIBUTION 9
discusses the context of these calculations for climate sensitivity. We therefore use the
radiation module within a 3-dimensional model below to attempt a synthesis of the above
information and address the few missing elements.
3. Modelling experiments
We use the IPCC AR4 version of GISS ModelE [Schmidt et al., 2006] to calculate the
instantaneous changes in radiative fluxes to changes in individual LW absorbers, while
holding the climate (spatial and temporal distributions of temperature, surface properties
etc.) fixed [Hansen et al., 1997]. The issues of spectral overlap are accurately rendered in
the ModelE radiation code via a correlated k-distribution parameterisation fitted to line-
by-line calculations [Lacis and Oinas , 1991]. The water vapour continuum used was taken
from Ma and Tipping [2002]. We made one adjustment to the ModelE radiative scheme
for the purposes of these experiments which was to improve the calculations for CO2 LW
absorption such that the scheme matched line-by-line calculations at low concentrations
that were not originally explicitly included in the operational climate model.
The climatology is derived from a year-long simulation using ca. 1980 conditions (CO2
concentrations are 339ppmv etc. as described in Schmidt et al. [2006]) and each experiment
consists of a year’s simulation with a transient but non-interactive climate. Global mean
radiative fluxes are similar to observed — the net absorbed LW in the atmosphere is 153.4
W/m2, within the observational error of the inferred real world value (155 W/m2), though
note that this follows from a combination of reasonable surface temperatures, a ∼30%
global albedo and TOA energy balance. Biases do however exist regionally and in various
components, the most important of which for our purposes is that clouds are generally
too thick and have less coverage (58%) than observed by satellites (66±2%). Also, net
D R A F T August 10, 2010, 6:18pm D R A F T
10 SCHMIDT ET AL: GREENHOUSE EFFECT ATTRIBUTION
LW CRF is 22.5 W/m2 compared to the observed estimate of 31 W/m2 [Harrison et al.,
1990]). The implications of these biases are addressed in the discussion.
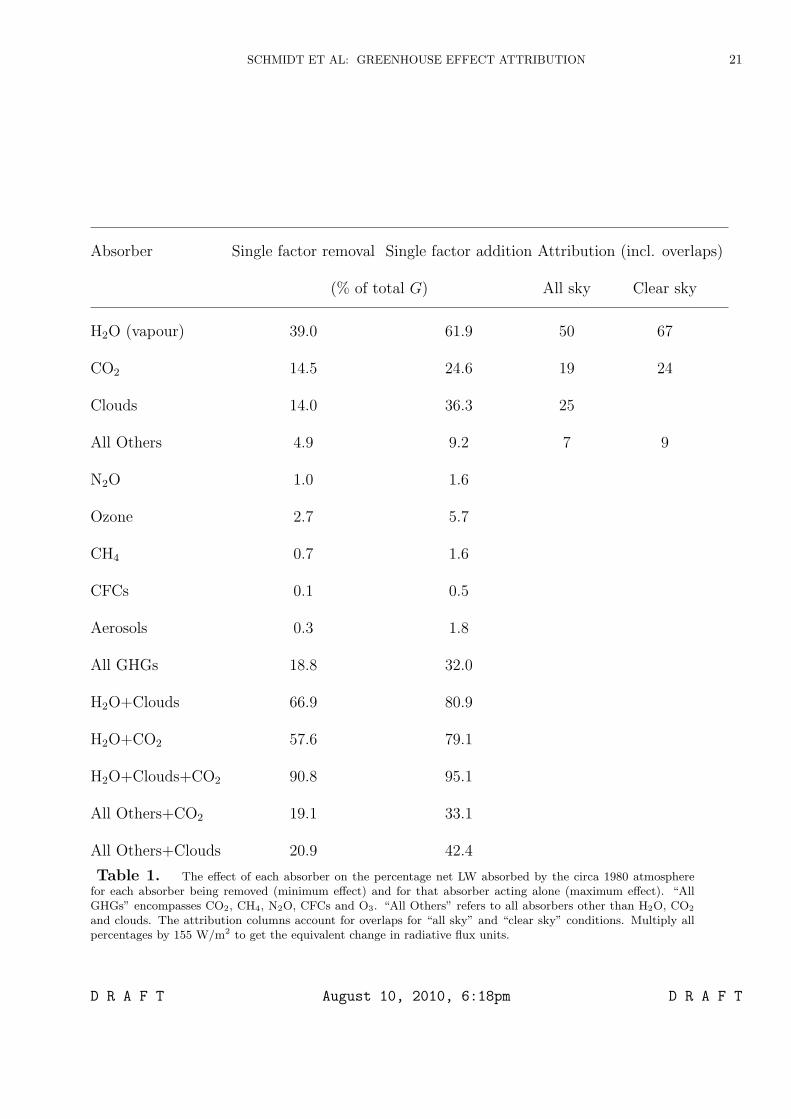
In one set of calculations, we remove the radiative effects of each major absorber in turn
(water vapour, clouds, CO2, CH4, N2O, CFCs, ozone, aerosols), and then in the second
set, we only use each individual absorber — thus defining the minimum and maximum
impact of each radiative constituent (Table 1). For each absorber, both short- and long-
wave effects were used or removed simultaneously, though we focus on the LW impacts
here. We also performed a number of combination experiments (for instance, including the
effects of all greenhouse gases gives a slightly larger impact than for CO2 alone) (Table 1).
As well as changing the TOA outgoing LW, removal of an absorber also changes upwelling
surface LW slightly. This is due to the modelled surface being a ’grey’ body, with LW
emissivity slightly less than unity, and which consequently has a small amount of LW
reflection.
If the absorbers are grouped in a simple manner i.e. water vapour, clouds, CO2 and
all other factors, and some simplifying assumptions made, it is relatively straightforward
to infer the overlaps and estimate the net attribution of the total greenhouse effect to
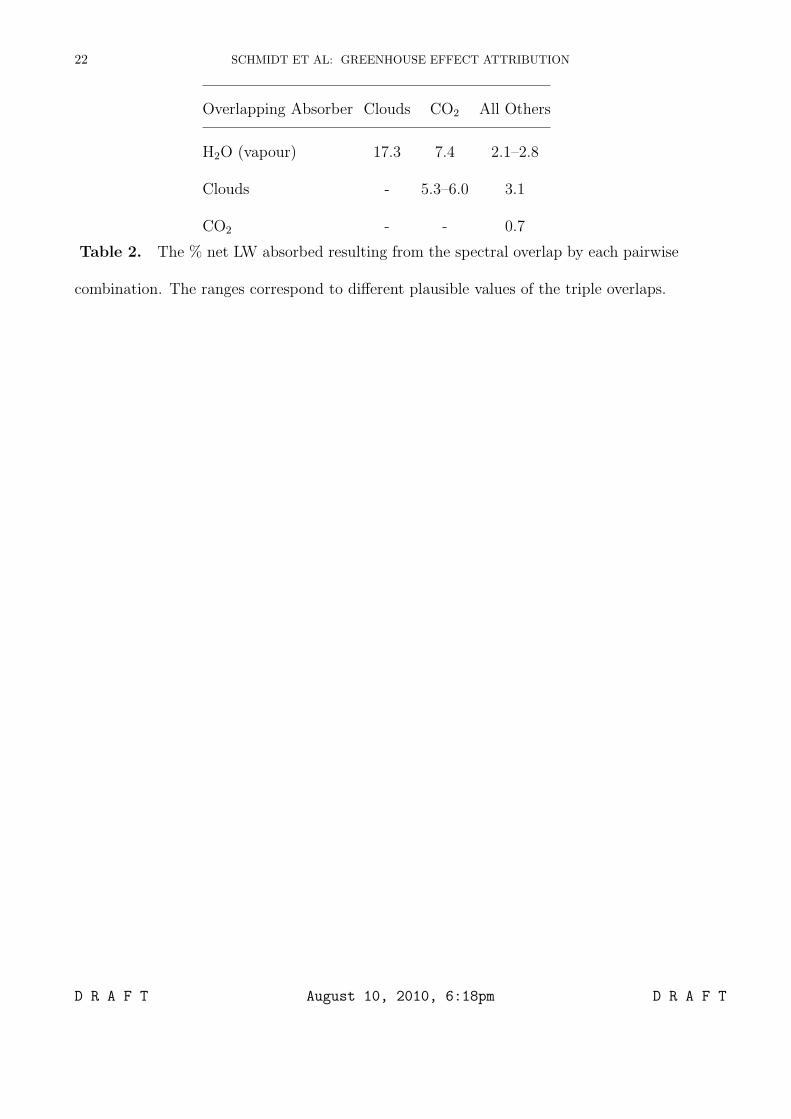
the individual constituents. Following KT97, given an overlap between two absorbers, an
obvious allocation is to split the difference. i.e. if 5% of the net LW radiation could be
absorbed either by water vapour or CO2, then each is allocated 2.5%. For triple overlaps,
a third is apportioned to each absorber. There is a little ambiguity in the triple overlaps
because we have not performed quite enough experiments to isolate each one. However,
the difference this makes to the attributions is less than a percent and so is neglected.
D R A F T August 10, 2010, 6:18pm D R A F T
SCHMIDT ET AL: GREENHOUSE EFFECT ATTRIBUTION 11
As expected, the joint effects of removing water vapour and CO2 or water vapour and
clouds is greater than the sum of effects of removing each component individually. In line
with previous results, we find that water vapour accounts for ∼39% if removed, and 62%
of the net LW absorption if acting alone, similarly, clouds account for 15 and 36% and
CO2, 14 and 25%.
As can be seen in Table 2, the most important overlaps are between water vapour
and clouds, followed by water vapour and CO2. Once they are attributed, the total net
effects for water vapour, clouds, CO2 and the other forcings are 50%, 25%, 19% and 7%,
respectively. For the clear sky calculation, we can remove the clouds and examine the
allocation of the remaining LW absorption to get 67%, 24% and 9% for water vapour,
CO2 and the other forcings respectively.
Most of our results are within a couple of percent of all previously published estimates
detailed above. However, there are a few anomalies. Unsurprisingly, the biggest variation
across the experiments relates to cloud effects. Cloud treatments in the previous work
tended to be quite simple, though in GCMs too they are among the least well param-
eterised effects. Therefore, the different approaches are likely to produce varied results.
Our estimates of the role of clouds are probably a little too low (∼5% relative to other
estimates) due to the climate model biases mentioned above.
Compared to KT97, we systematically find a larger clear sky role for water vapour (67%
compared to 60% in KT97), and a decreased role for ozone and other minor absorbers
(9% compared to 14%). This difference carries over to the all-sky results as well (50%
vs. 41%). This is perhaps related either to the 12% reduction made by KT97 to their
D R A F T August 10, 2010, 6:18pm D R A F T
12 SCHMIDT ET AL: GREENHOUSE EFFECT ATTRIBUTION
total humidity in order to balance the clear sky fluxes using a standard (mid-latitude)
atmospheric profile, or to the impacts of the spatial averaging implicit in our approach.
We can test the spatial variation of these results by performing the calculations sep-
arately for each latitude band in the annual means. There is some variation, with the
attribution to water vapour is highest in tropics (55%) and lowest near the poles (∼40%
in the Arctic and lower still in the southern hemisphere). For CO2, the values are more
uniform, with a few percent dip near the equator, and a rise near the poles. Cloud forc-
ing varies the most — being high (∼35%) in the mid-latitude storm bands and on the
equator, and low in the sub tropics (18%). The profile used in KT97 was nominally a
mid-latitude profile, and in these results, we do not see any particular increase in mid-
latitudes of the importance of ozone, leading us to conclude that the KT97 adjustment
to water vapour is the likely reason for the above-mentioned discrepancy, most probably
because of the consequent increase in upwelling LW to the stratosphere at 9.6µm. Small
differences could also have arisen due to the treatment of the water vapour continuum in
the different radiation codes.
We estimate the all-sky attribution to water vapour and clouds together to be around
75% (after apportioning overlaps), or 80% if all other absorbers are removed. Similar
results can be inferred from KT97 (72%, or 79% at maximum). This is significantly less
than the 98% quoted by Lindzen. This discrepancy could have arisen from a confusion
between the forcing from 2×CO2 (roughly 3.7/155 or 2% of the absorbed LW), with the
impact of removing all CO2, though this would have ignored the non-linearity of the CO2
forcing and the overlaps with other absorbers.
D R A F T August 10, 2010, 6:18pm D R A F T
SCHMIDT ET AL: GREENHOUSE EFFECT ATTRIBUTION 13
4. Attributions in a 2×CO2 simulation
The radiative forcing due to a change in trace components in the atmosphere is a useful
diagnostic for estimating the effects of such a change on the long-term equilibrium of a
model [Hansen et al., 1997]. In particular, the adjusted radiative forcing at the TOA is
a good predictor of eventual global mean surface temperature changes [Houghton et al.,
2001; Hansen et al., 2005]. ’Adjusted’ in this context means allowing the stratosphere to
come into radiative equilibrium with the forcings, a procedure that improves the predic-
tive value of the diagnostic [Hansen et al., 1997]. However the distinction between the
instantaneous and adjusted forcings for the purpose of this note is relatively unimportant.
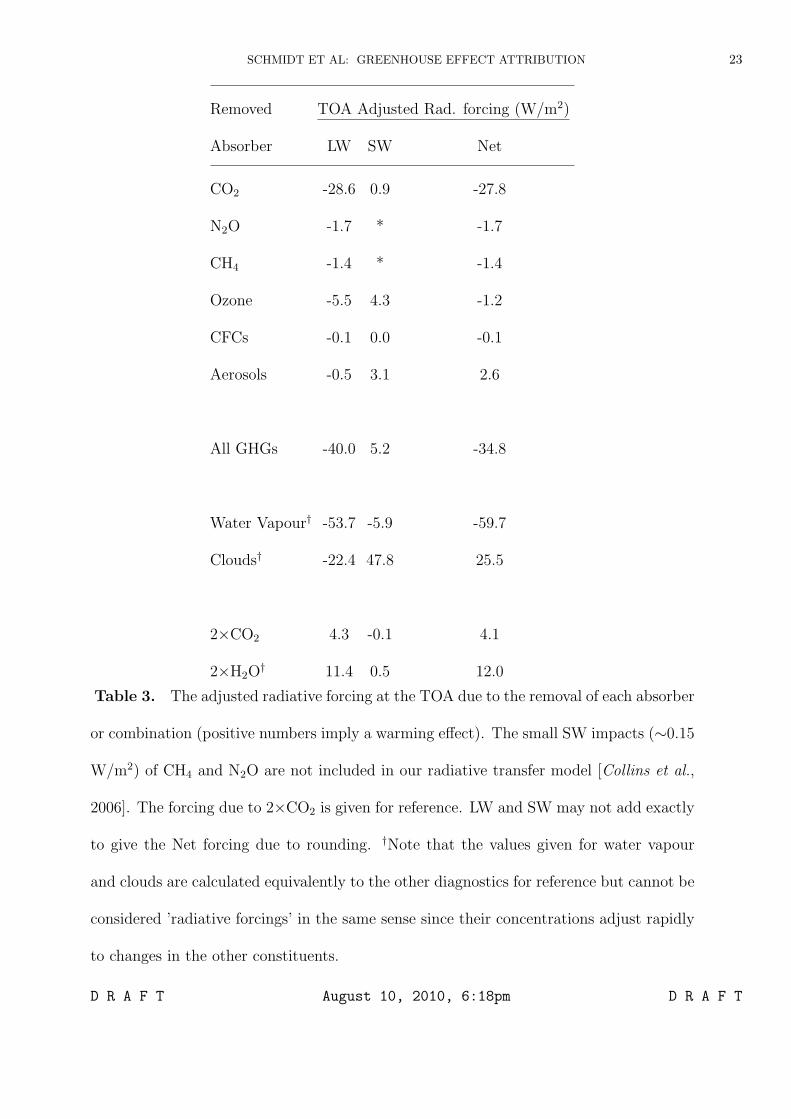
The values of the forcings in Table 3 are closely related to the percentage change in net
LW absorbed in the single-factor removals in Table 1 (they would be exactly equivalent
for the instantaneous forcings). The impact of entirely removing CO2 is almost 7 times
the impact of doubling CO2, underlining the highly non-linear nature of the forcing due
to CO2 concentration change over this range.
It is in part due to these non-linearities combined with associated feedbacks that the
attribution calculations are not directly useful for determining climate sensitivity. For
instance, one can’t simply take the attribution to CO2 of the total greenhouse effect (20%
of 33◦C) and project that onto a 2×CO2 scenario. That would exaggerate the no-feedback
impact of the extra CO2 while ignoring the role of feedbacks that might change the water
vapour and clouds. In GISS ModelE, the Charney sensitivity is 2.7◦C for a doubling of
CO2 (or ∼0.7 ◦C/(W/m2)) [Schmidt et al., 2006].
We can however examine how the net LW absorption changes in the GISS model after a
doubling of CO2 in order to quantify some of the feedbacks involved. This experiment is
D R A F T August 10, 2010, 6:18pm D R A F T
14 SCHMIDT ET AL: GREENHOUSE EFFECT ATTRIBUTION
performed using a fully prognostic atmosphere and a slab ocean model so that the ocean
temperatures can equilibriate with the atmospheric energy fluxes. As seen in Table 3,
the LW forcing associated with 2×CO2 is around 4 W/m2, but the overall change in net
absorbed LW will differ at equilibrium due to changes to the temperature structure (lapse
rate feedback), water vapour or clouds [Soden and Held , 2006]. There are also feedbacks
that affect the SW component (such as the ice-albedo feedback and clouds) that will
indirectly impact LW radiation.
At the 2×CO2 equilibrium, the global mean increase in G, the total greenhouse effect, is
around 20 W/m2, significantly larger than the 4 W/m2 initial forcing and demonstrating
the overall affect of the LW feedbacks is positive (in this model). That is, the extra net
absorption by CO2 has been amplified by the response of water vapour and clouds to
the initial forcing. The 20 W/m2 greenhouse effect enhancement is associated with a 15
W/m2 extra emission from the surface (since the planet has warmed by 2.7◦C) and a 5
W/m2 reduction in outgoing LW that balances a 1.5% increase in planetary albedo (due
to increased cloud cover, a negative (SW) feedback).
In doing the identical attribution as described above, we find to zeroth order the propor-
tions remain mostly unaltered. The attribution to CO2 and clouds are slightly increased
(a percent or so), and that for water vapour diminished (by ∼2%). The increase in net
LW absorption associated with clouds and water vapour is 7.2 W/m2 and 6.3 W/m2,
respectively — together approximately 3 times the direct impact of CO2 itself.
The ratio of the direct impact of all greenhouse gases to the effect of cloud and wa-
ter vapour in the present-day case is however very similar to the feedback response at
2×CO2. This is consistent with the idea that much of the water vapour and cloud im-
D R A F T August 10, 2010, 6:18pm D R A F T
SCHMIDT ET AL: GREENHOUSE EFFECT ATTRIBUTION 15
pacts in the climatological greenhouse effect are feedbacks to the trace greenhouse gas
contributions. That implies that were CO2 to be somehow completely removed from the
atmosphere, a large part of the other greenhouse constituents would be reduced as well,
producing a cooling much greater than the ’no-feedback’ response (at least according to
this model). Indeed, a model simulation performed with zero CO2 gives a global mean
temperature changes of about -35◦C and produces an ice covered planet (A. Lacis, pers.
communication).
5. Discussion and Conclusion
Our 3-dimensional results support simpler calculations performed over three decades
with 1-dimensional radiative-convective models, but are more comprehensive and are able
to reconcile and synthesise the differing attributions in the literature (with a single ex-
ception).
What impacts might model biases have on the attributions? We raised one potential
issue above: the distribution and nature of the modelled cloud cover, specifically that our
simulations are biased towards lower, optically thick clouds [Schmidt et al., 2006]. This
would tend to diminish the LW role for clouds which is associated with higher, optically
thin clouds. From comparisons with ERBE data [Harrison et al., 1990], we estimate that
the minimum cloud contribution in Table 1 could be increased to 20% (from 15%) (as in
KT97) which could subsequently affect on the attribution calculation depending on the
relative impact on the water vapour and CO2 overlaps. Additionally, we also note that
our adjusted radiative forcing for a doubling of CO2 is 4.1 W/m2, roughly 10% larger than
the canonical estimate of 3.7±0.4 W/m2 [Houghton et al., 2001; Myhre et al., 1998]. This
might then lead to an ∼10% overestimate of its role (i.e. a percent or two in Table 1).
D R A F T August 10, 2010, 6:18pm D R A F T
16 SCHMIDT ET AL: GREENHOUSE EFFECT ATTRIBUTION
Overall, we estimate that these biases could change the final attributions for water
vapour, clouds and CO2 by up to 5%, but it is difficult to be precise. These calculations
could be usefully repeated with a line-by-line radiative code using input from a re-analysis
and although the re-analysis cloud properties themselves may well have biases, their dis-
tribution may be improved over our model.
We conclude that, given the uncertainties, that water vapour is responsible for just over
half, clouds around a quarter and CO2 about a fifth of the present-day total greenhouse
effect. Given that the attribution is closer to 20% than 2%, it might make more intuitive
sense that changes in CO2 could be important for climate change. Nonetheless, climate
sensitivity can only be properly assessed from examining changes in climate, not from the
mean climatology alone [Annan and Hargreaves , 2006].
Acknowledgments. This note arose from discussions on RealClimate.org (www.-
realclimate.org/index.php/archives/2005/04/water-vapour-feedback-or-forcing/) that at-
tempted to crudely quantify this issue. The numbers in that note are slightly different to
those presented here due to an improvement in the radiative transfer code for low CO2
amounts and the use of a full year’s simulation, compared to an hour. We would like to
thank William Ingram and Chris Forest for encouraging us to do the calculations prop-
erly, Valdar Oinas for providing the more accurate radiative transfer code and multiple
reviewers for their constructive suggestions on earlier drafts.
References
Annan, J. D., and J. C. Hargreaves, Using multiple observationally-based constraints to es-
timate climate sensitivity, Geophys. Res. Lett., 33, L06704, doi:10.1029/2005GL025259,
D R A F T August 10, 2010, 6:18pm D R A F T
SCHMIDT ET AL: GREENHOUSE EFFECT ATTRIBUTION 17
2006.
Charney, J., Carbon Dioxide and Climate: A Scientific Assessment, National Academy
Press, Washington D. C., 1979.
Clough, S. A., and M. J. Iacono, Line-by-line calculations of atmospheric fluxes and
cooling rates II: Application to carbon dioxide, ozone, methane, nitrous oxide, and the
halocarbons, J. Geophys. Res., 100, 16,519–16,535, 1995.
Collins, W. D., et al., Radiative forcing by well-mixed greenhouse gases: Estimates from
climate models in the Intergovernmental Panel on Climate Change (IPCC) Fourth As-
sessment Report (AR4), J. Geophys. Res, 111, D14317, doi:10.1029/2005JD006713,
2006.
Hansen, J., A. Lacis, D. Rind, G. Russell, P. Stone, I. Fung, R. Ruedy, and J. Lerner,
Climate sensitivity: Analysis of feedback mechanisms, in Climate Processes and Cli-
mate Sensitivity, edited by J. E. Hansen and T. Takahashi, no. 29 in AGU Geophys.
Monograph, pp. 130–163, American Geophysical Union. Washington, D. C.., 1984.
Hansen, J., I. Fung, A. Lacis, D. Rind, S. Lebedeff, R. Ruedy, G. Russell, and P. Stone,
Global climate changes as forecast by Goddard Institute for Space Studies three-
dimensional model, J. Geophys. Res., 93, 9341–9364, 1988.
Hansen, J. E., et al., Forcings and chaos in interannual to decadal climate change, J.
Geophys. Res., 102, 25,679–25,720, 1997.
Hansen, J. E., et al., Efficacy of climate forcings, J. Geophys. Res., 110, D18104, doi:
10.1029/2005JD005776, 2005.
Harrison, E. F., P. Minnis, B. R. Barkstrom, V. Ramanathan, R. D. Cess, and G. G.
Gibson, Seasonal variation of cloud radiative forcing derived from the Earth Radiation
D R A F T August 10, 2010, 6:18pm D R A F T
18 SCHMIDT ET AL: GREENHOUSE EFFECT ATTRIBUTION
Budget Experiment, J. Geophys. Res., 95, 18,687–18,703, 1990.
Houghton, J. T., G. J. Jenkins, and J. J. Ephraums, Climate Change: The IPCC Scientific
Assessment, 365pp pp., Cambridge Univ. Press, New York, 1990.
Houghton, J. T., Y. Ding, D. J. Griggs, M. Nouger, P. J. van der Linden, X. Dai,
K. Maskell, and C. A. Johnson, Climate Change 2001: The scientific basis, 881pp
pp., Cambridge Univ. Press, New York, 2001.
Kiehl, J. T., and K. E. Trenberth, Earth’s annual global mean energy budget, Bull. Amer.
Meteor. Soc., 78, 197–208, 1997.
Knutti, R., G. A. Meehl, M. R. Allen, and D. A. Stainforth, Constraining climate sensi-
tivity from the seasonal cycle in surface temperature, J. Clim., 19, 4224–4233, 2006.
Lacis, A. A., and V. Oinas, A description of the correlated k distribution method for mod-
eling nongray gaseous absorption, thermal emission and multiple scattering in vertically
inhomogeneous atmospheres, J. Geophys. Res., 96, 9027–9063, 1991.
Lindzen, R. S., Review: ”Climate Change: The IPCC Scientific Assessment”, Quart. J.
Roy. Met. Soc., 117, 651–652, 1991.
Lohmann, U., L. Rotstayn, T. Storelvmo, A. Jones, S. Menon, J. Quaas, A. M. L. Ek-
man, D. Koch, and R. Ruedy, Total aerosol effect: radiative forcing or radiative flux
perturbation?, Atmospheric Chemistry and Physics, 10 (7), 3235–3246, doi:10.5194/acp-
10-3235-2010, 2010.
Lorius, C., J. Jouzel, D. Raynaud, J. Hansen, and H. L. Treut, The ice-core record:
Climate sensitivity and future greenhouse warming, Nature, 347, 139–145, 1990.
Ma, Q., and R. Tipping, Water vapor millimeter wave foreign continuum: A lanczos
calculation in the coordinate representation, J. Chem. Phys., 117, 10,581–10,596, doi:
D R A F T August 10, 2010, 6:18pm D R A F T
SCHMIDT ET AL: GREENHOUSE EFFECT ATTRIBUTION 19
10.1063/1.1516792, 2002.
Manabe, S., and R. F. Strickler, Thermal equilibrium in the atmosphere with a convective
adjustment, J. Atmos., Sci., 21, 361–385, 1964.
Manabe, S., and R. T. Wetherald, Thermal equilibrium of the atmosphere with a given
distribution of relative humidity, J. Atmos. Sci., 24, 241–259, 1967.
Myhre, G., E. J. Highwood, K. Shine, and F. Stordal, New estimates of radiative forcing
due to well mixed greenhouse gases, Geophys. Res. Letts., 25, 2715–2718, 1998.
Ramanathan, V., and J. A. Coakley, Jr., Climate modeling through radiative-convective
models, Rev. Geophys and Space Phys., 16, 465–489, 1978.
Ramanathan, V., and A. Inamdar, The radiative forcing due to clouds and water vapor, in
Frontiers of Climate Modeling, edited by J. T. Kiehl and V. Ramanthan, pp. 119–151,
Cambridge University Press, 2006.
Ramaswamy, V., O. Boucher, J. Haigh, D. Hauglustaine, J. Haywood, G. Myhre, T. Naka-
jima, G. Shi, and S. Solomon, Radiative forcing of climate change, in Climate Change
2001: The scientific basis, edited by J. T. Houghton, Y. Ding, D. J. Griggs, M. Nouger,
P. J. van der Linden, X. Dai, K. Maskell, and C. A. Johnson, p. 881, Cambridge Univ.
Press, New York, 2001.
Raval, A., and V. Ramanathan, Observational determination of the greenhouse effect,
Nature, 342, 758–761, 1989.
Schmidt, G. A., et al., Present day atmospheric simulations using GISS Model-
E: Comparison to in-situ, satellite and reanalysis data, J. Clim., 19, 153–192,
http://www.giss.nasa.gov/tools/modelE, 2006.
D R A F T August 10, 2010, 6:18pm D R A F T
20 SCHMIDT ET AL: GREENHOUSE EFFECT ATTRIBUTION
Soden, B. J., and I. M. Held, An assessment of climate feedbacks in coupled ocean-
atmosphere models, J. Clim., 19, 3354–3360, 2006.
Stephens, G. L., and T. J. Greenwald, The Earth’s radiation budget and its relation to
atmospheric hydrology 1. observations of the clear sky greenhouse effect, J. Geophys.
Res., 96, 15,311–15,324, doi:10.1029/91JD00973, 1991.
D R A F T August 10, 2010, 6:18pm D R A F T
SCHMIDT ET AL: GREENHOUSE EFFECT ATTRIBUTION 21
Absorber Single factor removal Single factor addition Attribution (incl. overlaps)
(% of total G) All sky Clear sky
H2O (vapour) 39.0 61.9 50 67
CO2 14.5 24.6 19 24
Clouds 14.0 36.3 25
All Others 4.9 9.2 7 9
N2O 1.0 1.6
Ozone 2.7 5.7
CH4 0.7 1.6
CFCs 0.1 0.5
Aerosols 0.3 1.8
All GHGs 18.8 32.0
H2O+Clouds 66.9 80.9
H2O+CO2 57.6 79.1
H2O+Clouds+CO2 90.8 95.1
All Others+CO2 19.1 33.1
All Others+Clouds 20.9 42.4
Table 1. The effect of each absorber on the percentage net LW absorbed by the circa 1980 atmospherefor each absorber being removed (minimum effect) and for that absorber acting alone (maximum effect). “AllGHGs” encompasses CO2, CH4, N2O, CFCs and O3. “All Others” refers to all absorbers other than H2O, CO2
and clouds. The attribution columns account for overlaps for “all sky” and “clear sky” conditions. Multiply allpercentages by 155 W/m2 to get the equivalent change in radiative flux units.
D R A F T August 10, 2010, 6:18pm D R A F T
22 SCHMIDT ET AL: GREENHOUSE EFFECT ATTRIBUTION
Overlapping Absorber Clouds CO2 All Others
H2O (vapour) 17.3 7.4 2.1–2.8
Clouds - 5.3–6.0 3.1
CO2 - - 0.7
Table 2. The % net LW absorbed resulting from the spectral overlap by each pairwise
combination. The ranges correspond to different plausible values of the triple overlaps.
D R A F T August 10, 2010, 6:18pm D R A F T
SCHMIDT ET AL: GREENHOUSE EFFECT ATTRIBUTION 23
Removed TOA Adjusted Rad. forcing (W/m2)
Absorber LW SW Net
CO2 -28.6 0.9 -27.8
N2O -1.7 * -1.7
CH4 -1.4 * -1.4
Ozone -5.5 4.3 -1.2
CFCs -0.1 0.0 -0.1
Aerosols -0.5 3.1 2.6
All GHGs -40.0 5.2 -34.8
Water Vapour† -53.7 -5.9 -59.7
Clouds† -22.4 47.8 25.5
2×CO2 4.3 -0.1 4.1
2×H2O† 11.4 0.5 12.0
Table 3. The adjusted radiative forcing at the TOA due to the removal of each absorber
or combination (positive numbers imply a warming effect). The small SW impacts (∼0.15
W/m2) of CH4 and N2O are not included in our radiative transfer model [Collins et al.,
2006]. The forcing due to 2×CO2 is given for reference. LW and SW may not add exactly
to give the Net forcing due to rounding. †Note that the values given for water vapour
and clouds are calculated equivalently to the other diagnostics for reference but cannot be
considered ’radiative forcings’ in the same sense since their concentrations adjust rapidly
to changes in the other constituents.
D R A F T August 10, 2010, 6:18pm D R A F T