the analysis of lactic and acetic acids in sour beers by ... robust hplc method for the quantitative...
TRANSCRIPT
Introduction Sour beers are one of the fastest-growing categories in the beer market. The degree
and character of tartness are key attributes. Sour beers may age for several months, or even years, to achieve the desired flavor.
Several different bacteria including acetobacter, lactobacilli and pediococci, as well as yeast (Dekkera/Brettanomyces) are employed, alone or in tandem, to create the vast array of sour flavors. Lactic and acetic acids are among the key contributors responsible for the tartness in most sour beers.
With the above in mind, some objective means of determining the degree of sourness would help assess the readiness of a given beer for packaging. One of the two existing official methods to measure tartness of sour beers is based on analytical titrations.1 The titration method provides useful information about the quantity of overall tartness, but offers little insight into the character of tartness. The other method is an enzymatic assay specific for lactic acid, which provides quantitative information for lactic acid, but not for acetic acid.2
The Analysis of Lactic and Acetic Acids in Sour Beers by HPLC with PDA Detection
A P P L I C A T I O N N O T E
Authors:
Andrew TiplerWilhad M Reuter
PerkinElmer, Inc. Shelton, CT
Lucas R Chadwick
Bell’s Brewery Inc. USA
Liquid Chromatography
2
HPLC is among the few ‘general purpose’ laboratory techniques capable of quantitating both lactic and acetic acids in a single method. Thereupon, this work pursued an effective, efficient and robust HPLC method for the quantitative analysis of lactic and acetic acid in beers by HPLC with photodiode array (PDA) detection. Performance results, including repeatability, linearity and limits of detection, are provided. Eight different sour beers from a regional craft brewery were then analyzed and compared.
Experimental
Hardware/SoftwareA PerkinElmer Altus™ HPLC system was used, including the A-10 Solvent/Sample Manager, A-10 column heater and A-10 PDA detector (PerkinElmer, Shelton, CT, USA). A PerkinElmer Brownlee Validated Aqueous C18 5µm, 4.6 x 250-mm column was used for all analyses (PerkinElmer, Shelton, CT, USA). All instrument control, analysis, and data processing was performed via Waters® Empower® 3 CDS software.
Method ParametersThe LC method parameters are shown in Table 1.
Table 1. LC Method Parameters.
HPLC Method
Column:PerkinElmer Brownlee™ Validated Aqueous C18, 5 µm, 4.6 x 250-mm (Part # N9303549)
Mobile Phase: Isocratic; 10-mM K-phosphate buffer; pH 2.4
Analysis Time: 10.0 min.; wash/equilibration time = 5.0 min
Flow Rate: 1.5 mL/min. (~2900 psi)
Oven Temp.: 25 ºC
UV Detection: Wavelength: 210 nm
Injection Volume: 20 µL
Sampling (Data) Rate: 5 pts./sec
Solvents, Standards and SamplesThe water, used for both solvent and as diluent, was HPLC grade. For buffering the mobile phase and adjusting the pH to 2.4, both monobasic potassium phosphate and phosphoric acid were used, obtained from Sigma Aldrich, Inc® (Allentown, PA).
The acetic acid was obtained from Sigma Aldrich Inc.® and the lactic acid (88% solution) was obtained from BSG™ Handcraft (Shakopee, MN).
A 2.0% lactic/0.2% acetic acid stock standard was prepared by adding 2.27 mL of the 88% lactic acid solution and 0.20 mL of acetic acid to a 100-mL volumetric flask and filling to volume with diluent. For calibration purposes, seven calibrant levels were prepared via serial dilution of the stock standard with diluent.
Eight sour beer samples were obtained from a regional craft brewery, labeled “LC #”, where # = 1, 2, 3, 5, 6, 7, 8 and 9. There was no “LC 4”. All samples were diluted 3:1 with diluent.
The buffered mobile phase and all standards and samples were first filtered through 0.45 µm PVDF filters before injection.
Results and Discussion
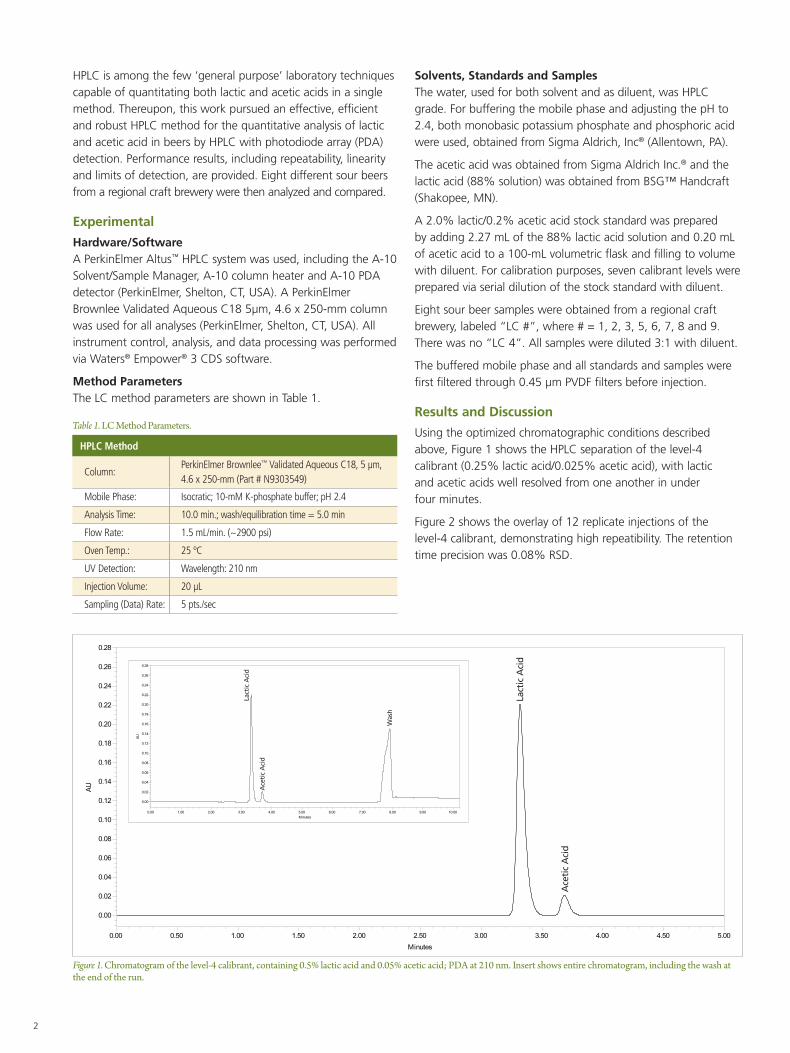
Using the optimized chromatographic conditions described above, Figure 1 shows the HPLC separation of the level-4 calibrant (0.25% lactic acid/0.025% acetic acid), with lactic and acetic acids well resolved from one another in under four minutes.
Figure 2 shows the overlay of 12 replicate injections of the level-4 calibrant, demonstrating high repeatibility. The retention time precision was 0.08% RSD.
Figure 1. Chromatogram of the level-4 calibrant, containing 0.5% lactic acid and 0.05% acetic acid; PDA at 210 nm. Insert shows entire chromatogram, including the wash at the end of the run.
AU
0.00
0.02
0.04
0.06
0.08
0.10
0.12
0.14
0.16
0.18
0.20
0.22
0.24
0.26
0.28
Minutes0.00 0.50 1.00 1.50 2.00 2.50 3.00 3.50 4.00 4.50 5.00
Lact
ic A
cid
Ace
tic
Aci
d
AU
0.00
0.02
0.04
0.06
0.08
0.10
0.12
0.14
0.16
0.18
0.20
0.22
0.24
0.26
0.28
Minutes0.00 1.00 2.00 3.00 4.00 5.00 6.00 7.00 8.00 9.00 10.00
Lact
ic A
cid
Ace
tic
Aci
d
Was
h
3
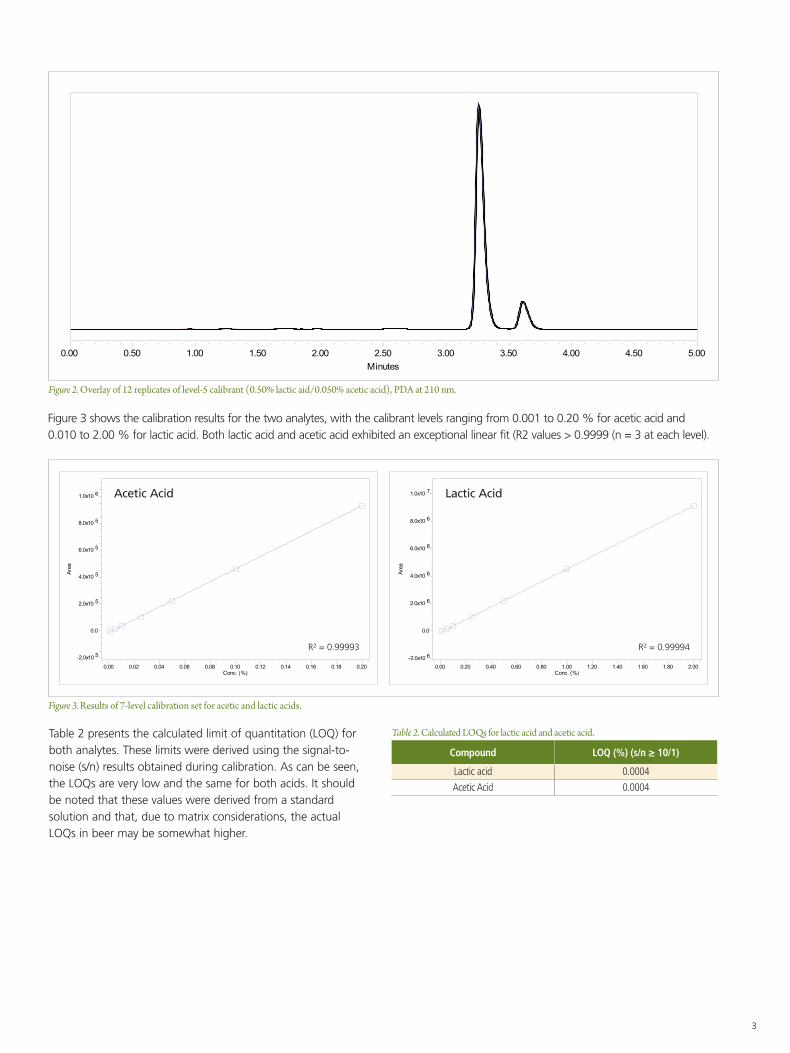
Figure 3 shows the calibration results for the two analytes, with the calibrant levels ranging from 0.001 to 0.20 % for acetic acid and 0.010 to 2.00 % for lactic acid. Both lactic acid and acetic acid exhibited an exceptional linear fit (R2 values > 0.9999 (n = 3 at each level).
Table 2 presents the calculated limit of quantitation (LOQ) for both analytes. These limits were derived using the signal-to-noise (s/n) results obtained during calibration. As can be seen, the LOQs are very low and the same for both acids. It should be noted that these values were derived from a standard solution and that, due to matrix considerations, the actual LOQs in beer may be somewhat higher.
Figure 2. Overlay of 12 replicates of level-5 calibrant (0.50% lactic aid/0.050% acetic acid), PDA at 210 nm.
Minutes0.00 0.50 1.00 1.50 2.00 2.50 3.00 3.50 4.00 4.50 5.00
Figure 3. Results of 7-level calibration set for acetic and lactic acids.
Area
-2.0x10 5
0.0
2.0x10 5
4.0x10 5
6.0x10 5
8.0x10 5
1.0x10 6
Conc. (%)0.00 0.02 0.04 0.06 0.08 0.10 0.12 0.14 0.16 0.18 0.20
Area
-2.0x10 6
0.0
2.0x10 6
4.0x10 6
6.0x10 6
8.0x10 6
1.0x10 7
Conc. (%)0.00 0.20 0.40 0.60 0.80 1.00 1.20 1.40 1.60 1.80 2.00
Area
-2.0x10 5
0.0
2.0x10 5
4.0x10 5
6.0x10 5
8.0x10 5
1.0x10 6
Conc. (%)0.00 0.02 0.04 0.06 0.08 0.10 0.12 0.14 0.16 0.18 0.20
Area
-2.0x10 6
0.0
2.0x10 6
4.0x10 6
6.0x10 6
8.0x10 6
1.0x10 7
Conc. (%)0.00 0.20 0.40 0.60 0.80 1.00 1.20 1.40 1.60 1.80 2.00
Acetic Acid Lactic Acid
R² = 0.99993 R² = 0.99994
Table 2. Calculated LOQs for lactic acid and acetic acid.
Compound LOQ (%) (s/n ≥ 10/1)
Lactic acid 0.0004
Acetic Acid 0.0004
4
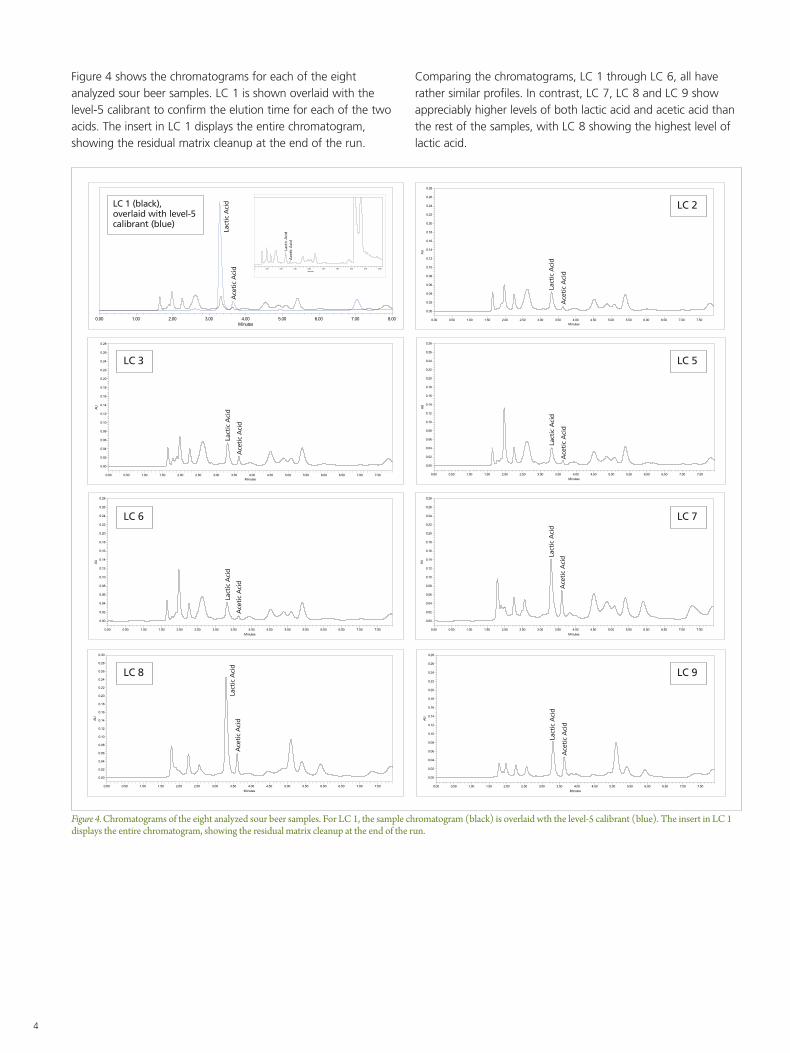
Figure 4 shows the chromatograms for each of the eight analyzed sour beer samples. LC 1 is shown overlaid with the level-5 calibrant to confirm the elution time for each of the two acids. The insert in LC 1 displays the entire chromatogram, showing the residual matrix cleanup at the end of the run.
Comparing the chromatograms, LC 1 through LC 6, all have rather similar profiles. In contrast, LC 7, LC 8 and LC 9 show appreciably higher levels of both lactic acid and acetic acid than the rest of the samples, with LC 8 showing the highest level of lactic acid.
LC 1 (black), overlaid with level-5 calibrant (blue)
Figure 4. Chromatograms of the eight analyzed sour beer samples. For LC 1, the sample chromatogram (black) is overlaid wth the level-5 calibrant (blue). The insert in LC 1 displays the entire chromatogram, showing the residual matrix cleanup at the end of the run.
AU
0.00
0.02
0.04
0.06
0.08
0.10
0.12
0.14
0.16
0.18
0.20
0.22
0.24
0.26
0.28
Minutes0.00 0.50 1.00 1.50 2.00 2.50 3.00 3.50 4.00 4.50 5.00 5.50 6.00 6.50 7.00 7.50
Minutes0.00 1.00 2.00 3.00 4.00 5.00 6.00 7.00 8.00
AU
0.00
0.02
0.04
0.06
0.08
0.10
0.12
0.14
0.16
0.18
0.20
0.22
0.24
0.26
0.28
0.30
Minutes0.00 0.50 1.00 1.50 2.00 2.50 3.00 3.50 4.00 4.50 5.00 5.50 6.00 6.50 7.00 7.50
AU
0.00
0.02
0.04
0.06
0.08
0.10
0.12
0.14
0.16
0.18
0.20
0.22
0.24
0.26
0.28
Minutes0.00 0.50 1.00 1.50 2.00 2.50 3.00 3.50 4.00 4.50 5.00 5.50 6.00 6.50 7.00 7.50
AU
0.00
0.02
0.04
0.06
0.08
0.10
0.12
0.14
0.16
0.18
0.20
0.22
0.24
0.26
0.28
Minutes0.00 0.50 1.00 1.50 2.00 2.50 3.00 3.50 4.00 4.50 5.00 5.50 6.00 6.50 7.00 7.50
AU
0.00
0.02
0.04
0.06
0.08
0.10
0.12
0.14
0.16
0.18
0.20
0.22
0.24
0.26
0.28
Minutes0.00 0.50 1.00 1.50 2.00 2.50 3.00 3.50 4.00 4.50 5.00 5.50 6.00 6.50 7.00 7.50
AU
0.00
0.02
0.04
0.06
0.08
0.10
0.12
0.14
0.16
0.18
0.20
0.22
0.24
0.26
0.28
Minutes0.00 0.50 1.00 1.50 2.00 2.50 3.00 3.50 4.00 4.50 5.00 5.50 6.00 6.50 7.00 7.50
AU
0.00
0.02
0.04
0.06
0.08
0.10
0.12
0.14
0.16
0.18
0.20
0.22
0.24
0.26
0.28
Minutes0.00 0.50 1.00 1.50 2.00 2.50 3.00 3.50 4.00 4.50 5.00 5.50 6.00 6.50 7.00 7.50
AU
0.00
0.02
0.04
0.06
0.08
0.10
0.12
0.14
0.16
0.18
0.20
0.22
0.24
0.26
0.28
Minutes0.00 1.00 2.00 3.00 4.00 5.00 6.00 7.00 8.00 9.00 10.00
Lact
ic A
cid
Ace
tic
Aci
dLa
ctic
Aci
d
Ace
tic
Aci
d
Lact
ic A
cid
Ace
tic
Aci
d
Lact
ic A
cid
Ace
tic
Aci
d
Lact
ic A
cid
Ace
tic
Aci
d
Lact
ic A
cid
Ace
tic
Aci
d
Lact
ic A
cid
Ace
tic
Aci
d
Lact
ic A
cid
Ace
tic
Aci
d
Lact
ic A
cid
Ace
tic
Aci
d
LC 3
LC 6
LC 8
LC 2
LC 5
LC 7
LC 9
For a complete listing of our global offices, visit www.perkinelmer.com/ContactUs
Copyright ©2015, PerkinElmer, Inc. All rights reserved. PerkinElmer® is a registered trademark of PerkinElmer, Inc. All other trademarks are the property of their respective owners. 012511_01 PKI
PerkinElmer, Inc. 940 Winter Street Waltham, MA 02451 USA P: (800) 762-4000 or (+1) 203-925-4602www.perkinelmer.com
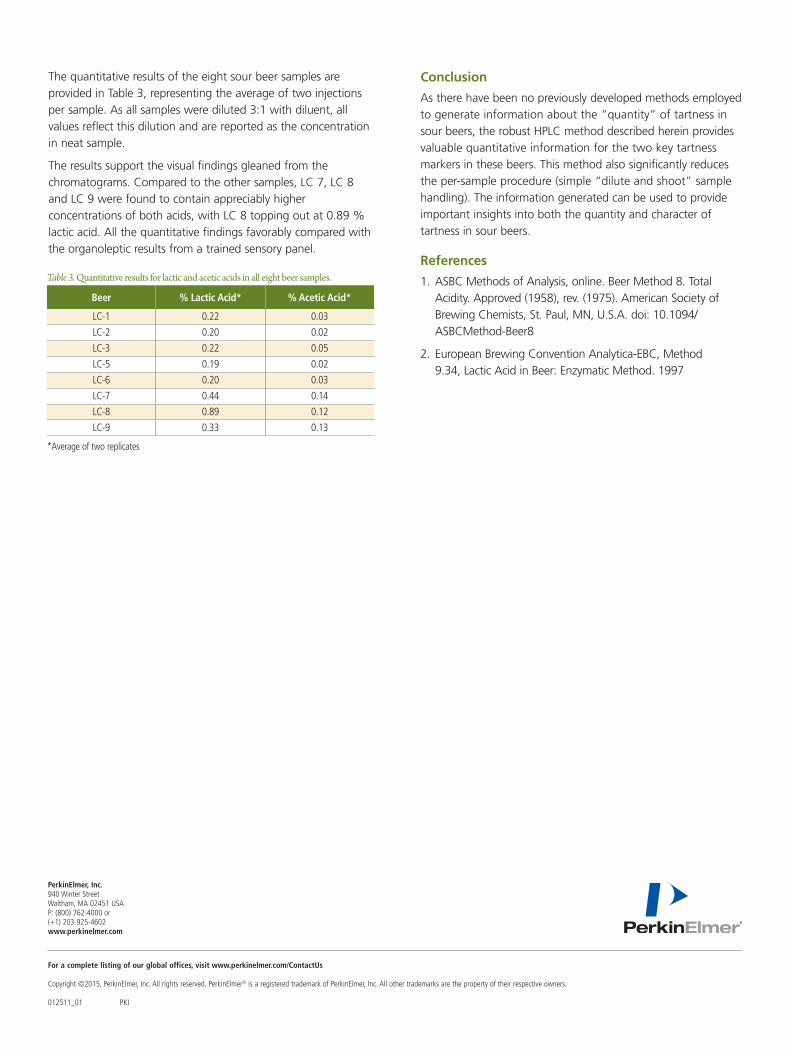
The quantitative results of the eight sour beer samples are provided in Table 3, representing the average of two injections per sample. As all samples were diluted 3:1 with diluent, all values reflect this dilution and are reported as the concentration in neat sample.
The results support the visual findings gleaned from the chromatograms. Compared to the other samples, LC 7, LC 8 and LC 9 were found to contain appreciably higher concentrations of both acids, with LC 8 topping out at 0.89 % lactic acid. All the quantitative findings favorably compared with the organoleptic results from a trained sensory panel.
Table 3. Quantitative results for lactic and acetic acids in all eight beer samples.
Beer % Lactic Acid* % Acetic Acid*
LC-1 0.22 0.03
LC-2 0.20 0.02
LC-3 0.22 0.05
LC-5 0.19 0.02
LC-6 0.20 0.03
LC-7 0.44 0.14
LC-8 0.89 0.12
LC-9 0.33 0.13
*Average of two replicates
Conclusion
As there have been no previously developed methods employed to generate information about the “quantity” of tartness in sour beers, the robust HPLC method described herein provides valuable quantitative information for the two key tartness markers in these beers. This method also significantly reduces the per-sample procedure (simple “dilute and shoot” sample handling). The information generated can be used to provide important insights into both the quantity and character of tartness in sour beers.
References
1. ASBC Methods of Analysis, online. Beer Method 8. Total Acidity. Approved (1958), rev. (1975). American Society of Brewing Chemists, St. Paul, MN, U.S.A. doi: 10.1094/ASBCMethod-Beer8
2. European Brewing Convention Analytica-EBC, Method 9.34, Lactic Acid in Beer: Enzymatic Method. 1997