the agricultural and fisheries sector in andalusia · consejería de agricultura, pesca y...
TRANSCRIPT

Consejería de Agricultura, Pesca y Desarrollo Rural
Consejería de Agricultura, Pesca y Desarrollo Rural
Consejería de Agricultura, Pesca y Desarrollo Rural
Consejería de Agricultura, Pesca y Desarrollo Rural
Secretaría General de Agricultura y Alimentación
The Agricultural and Fisheries sector in Andalusia

Consejería de Agricultura, Pesca y Desarrollo Rural
Consejería de Agricultura, Pesca y Desarrollo Rural
Consejería de Agricultura, Pesca y Desarrollo Rural
Consejería de Agricultura, Pesca y Desarrollo Rural
Secretaría General de Agricultura y Alimentación
(1) Region included in the Convergence Objective: those NUTS 2 regions whose GDP per head is between 75% and 90% of the European Union average.
(2) Intermediate Region (IR): those where the shareof population living in rural areas is between15% and 50%. Andalusia has a share of 32% of its population living in rural areas.
Region of Andalusia
Member State: Spain
Area: 87,597 km2
(17% of the Spanish area, 2% of the UE28 area)
Region included in theConvergence Objective 1
period 2014-2020
Andalusia is classified as Intermediate region 2,
according to the OECD classification
28 EU Member States since July 1, 2013
Andalusia
Consejería de Agricultura, Pesca y Desarrollo Rural
Consejería de Agricultura, Pesca y Desarrollo Rural
Consejería de Agricultura, Pesca y Desarrollo Rural
Consejería de Agricultura, Pesca y Desarrollo Rural
Secretaría General de Agricultura y Alimentación
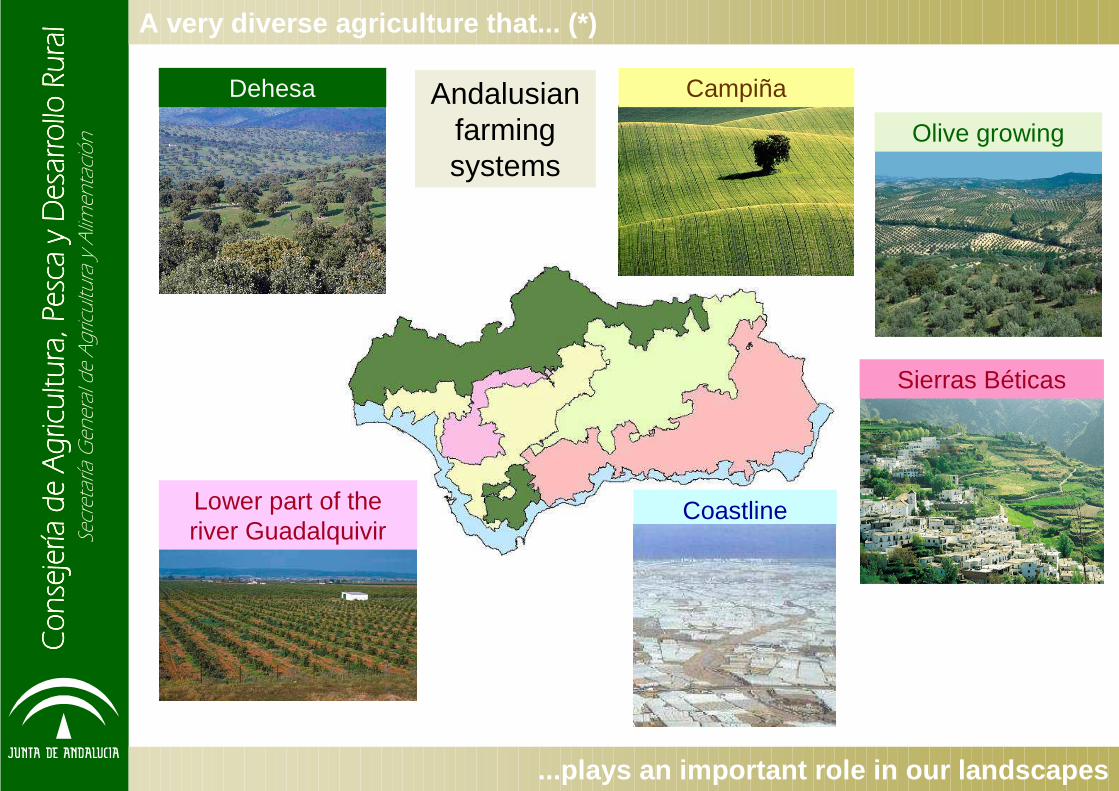
A very diverse agriculture that... (*)
Andalusian farming systems
Campiña
Sierras Béticas
Lower part of the river Guadalquivir
Dehesa
Olive growing
Coastline
...plays an important role in our landscapes

Consejería de Agricultura, Pesca y Desarrollo Rural
Consejería de Agricultura, Pesca y Desarrollo Rural
Consejería de Agricultura, Pesca y Desarrollo Rural
Consejería de Agricultura, Pesca y Desarrollo Rural
Secretaría General de Agricultura y Alimentación
Socio-economic context. Population
Population growth
Source: EUROSTAT, Spanish Office for National Statistics
Source: EUROSTAT, Spanish Office for National Statistics
Andalusian populationrepresents 1.66% of the EU
28 total population and 18.06% of the Spanish
population
High growth rate of the Andalusian and Spanish population compared to the EU28
population between 2004 and 2014.
However, in 2014 Spanish population was0.27% lower than in 2013 . Morever, Andalusia and EU28 increased their
populations in 0.05% and 0.25%respectively.
Provisional data published on 10th December 2014 for Spain and Andalusia. Provisional data published on 1st January 2014 for EU28.
Difference 2004-2014
Difference 2013-2014
UE28 2.88% 0.25%
Spain 7.56% -0.27%
Andalusia 9.17% 0.05%
Total population in 2014
8,393
46,464
506,913
0
100.000
200.000
300.000
400.000
500.000
EU 28 Spain Andalusia
thou
sand
of p
eopl
e

Consejería de Agricultura, Pesca y Desarrollo Rural
Consejería de Agricultura, Pesca y Desarrollo Rural
Consejería de Agricultura, Pesca y Desarrollo Rural
Consejería de Agricultura, Pesca y Desarrollo Rural
Secretaría General de Agricultura y Alimentación
Socio-economic context. Population
Andalusia has a population density a little
bit higher than the Spanish one and, lowerthan the EU 28 density…
…in any case, population density changes
depending on the area:
- Higher density: capital cities and coastal areas
- Lower density: inland areas of Eastern
Andalusia and North of the region
Source: prepared by the author on the basis of data from EUROSTAT and the Spanish Institute of Statistics
Source: prepared by the author on the basis of data from the Spanish Office for National Statistics. Year 2012
Population density (population per km 2)
Population density in 2014
95.891.8113.6
0
20
40
60
80
100
120
EU 28 Spain Andalusia
popu
latio
n pe
r km
2

Consejería de Agricultura, Pesca y Desarrollo Rural
Consejería de Agricultura, Pesca y Desarrollo Rural
Consejería de Agricultura, Pesca y Desarrollo Rural
Consejería de Agricultura, Pesca y Desarrollo Rural
Secretaría General de Agricultura y Alimentación
Socio-economic context. Population
Source: EUROSTAT, Spanish Office for National Statistics
(*)The population pyramid shows a younger population in Andalusia compared to Spain and the
EU 28
Population structure by age. 2013
0%
10%
20%
30%
40%
50%
60%
70%
80%
90%
100%
EU 28 Spain Andalusia
0-14 15-24 25-49 50-64 65-79 80 y más

Consejería de Agricultura, Pesca y Desarrollo Rural
Consejería de Agricultura, Pesca y Desarrollo Rural
Consejería de Agricultura, Pesca y Desarrollo Rural
Consejería de Agricultura, Pesca y Desarrollo Rural
Secretaría General de Agricultura y Alimentación
(*) The Andalusian GDP shows a growth rate higher than the European one and slightly higher than the Spanish rate until 2007.
In 2009, the Andalusian GDP growth rate just like the European and Spanish ones registered
negative figures.
In 2010, the GDP growth rate registered a recovery at the four levels although only the Spanish rate is the only one that still have
negative results.
In 2011, the Spanish GDP growth rateincreased in relation to the previous year, while the European, Eurozone and Andalusian GDP
showed a slight decline.
In 2012, the Andalusian, Spanish and EuropeanGDP rates decreased. This decrease was far
higher in Andalusia.
In 2013, the GDP growth rate showed a recovery at the four levels, but only the
European reached a positive figure (0.1%).
Source: EUROSTAT
In 2013, the GDP per head in Andalusia (72%) was lower than the European, Eurozone and
Spanish ones.The Andalusian GDP per head between 2012
and 2013 showed a decline compared to 2011, when it represented 74% of the GDP per head
of the EU28
Socio-economic context. Economic growthEvolution of GDP growth rate
-6%
-4%
-2%
0%
2%
4%
6%
8%
2000 2001 2002 2003 2004 2005 2006 2007 2008 2009 2010 2011 2012 2013
EU28 Eurozone Spain Andalusia
Source: EUROSTAT, Spanish Office for National Statistics and Andalusian Institute of Statistics
GDP per capita. Year 2013 (UE 28 = 100)
72%95%108%100%
0%
20%
40%
60%
80%
100%
EU 28 Eurozone Spain Andalusia

Consejería de Agricultura, Pesca y Desarrollo Rural
Consejería de Agricultura, Pesca y Desarrollo Rural
Consejería de Agricultura, Pesca y Desarrollo Rural
Consejería de Agricultura, Pesca y Desarrollo Rural
Secretaría General de Agricultura y Alimentación The Andalusian agricultural GDP accounts
for around 4.5% of the total Andalusian GDP. It witnessed a slight growth in 2013
compared to 2008.
The share of the agricultural sector in the Andalusian total GDP exceeds the share of
the agricultural sector at Spanish and European levels.
Source: EUROSTAT, iNE
Socio-economic context. Economic growth
The Andalusian agricultural GDP has increased from 2.59% of Spanish
agricultural GDP in 2008 to 26.0% in 2013, therefore growing its share.
Evolution of % agricultural GDP / total GDP
1.7%1.7% 1.6% 1.7% 1.7% 1.7%
2.4%2.3%
2.3%2.3%2.4%2.2%
4.3% 4.1%
4.2% 4.5% 4.2% 4.5%
0%
1%
2%
3%
4%
5%
2008 2009 2010 2011 2012 2013
EU28 Spain Andalusia Evolution % agricultural GDP / total GDP
26.0%25.1%25.8%26.1%
24.3%25.9%
0%
5%
10%
15%
20%
25%
30%
2008 2009 2010 2011 2012 2013
% Andalusian agricultural GDP / Spanish agricultura l GDP

Consejería de Agricultura, Pesca y Desarrollo Rural
Consejería de Agricultura, Pesca y Desarrollo Rural
Consejería de Agricultura, Pesca y Desarrollo Rural
Consejería de Agricultura, Pesca y Desarrollo Rural
Secretaría General de Agricultura y Alimentación
Source: EUROSTAT
The Andalusian employment ratewas below the Spanish and
European rate regarding both the population rate in general and male
and female employment rates in particular.
Socio-economic context. Labour market
Labour force participation. 2013
64.1%64.0% 63.4% 54.8% 45.3%
0%
10%
20%
30%
40%
50%
60%
70%
EU 28 EU 27 Eurozone Spain Andalusia
Men's labour force participation rate. 2013
50.4%59.2%68.6%69.3% 69.4%
0%
10%
20%
30%
40%
50%
60%
70%
80%
EU 28 EU 27 Eurozone Spain Andalusia
Women's labour force participation rate. 2013
58.8%58.7% 58.2% 50.3% 40.0%
0%
10%
20%
30%
40%
50%
60%
70%
EU 28 EU 27 Eurozone Spain Andalusia

Consejería de Agricultura, Pesca y Desarrollo Rural
Consejería de Agricultura, Pesca y Desarrollo Rural
Consejería de Agricultura, Pesca y Desarrollo Rural
Consejería de Agricultura, Pesca y Desarrollo Rural
Secretaría General de Agricultura y Alimentación
Source: EUROSTAT
Since 2008 there has been a step backwards in the
European, Spanish andAndalusian employment rates due to the general economic situation. This step has been more striking among the total
population compared towomen’s population
... but it shows a high growthand convergence speed , until
2007
Socio-economic context. Labour market
Evolution of the employment rate. 2003-2013
0%
10%
20%
30%
40%
50%
60%
70%
2003 2004 2005 2006 2007 2008 2009 2010 2011 2012 2013
EU28 EU27 Eurozone Spain Andalusia
Evolution of the women's employment rate. 2003-2013
0%
10%
20%
30%
40%
50%
60%
70%
2003 2004 2005 2006 2007 2008 2009 2010 2011 2012 2013
EU28 EU27 Eurozone Spain Andalusia
Consejería de Agricultura, Pesca y Desarrollo Rural
Consejería de Agricultura, Pesca y Desarrollo Rural
Consejería de Agricultura, Pesca y Desarrollo Rural
Consejería de Agricultura, Pesca y Desarrollo Rural
Secretaría General de Agricultura y Alimentación
Source: EUROSTAT
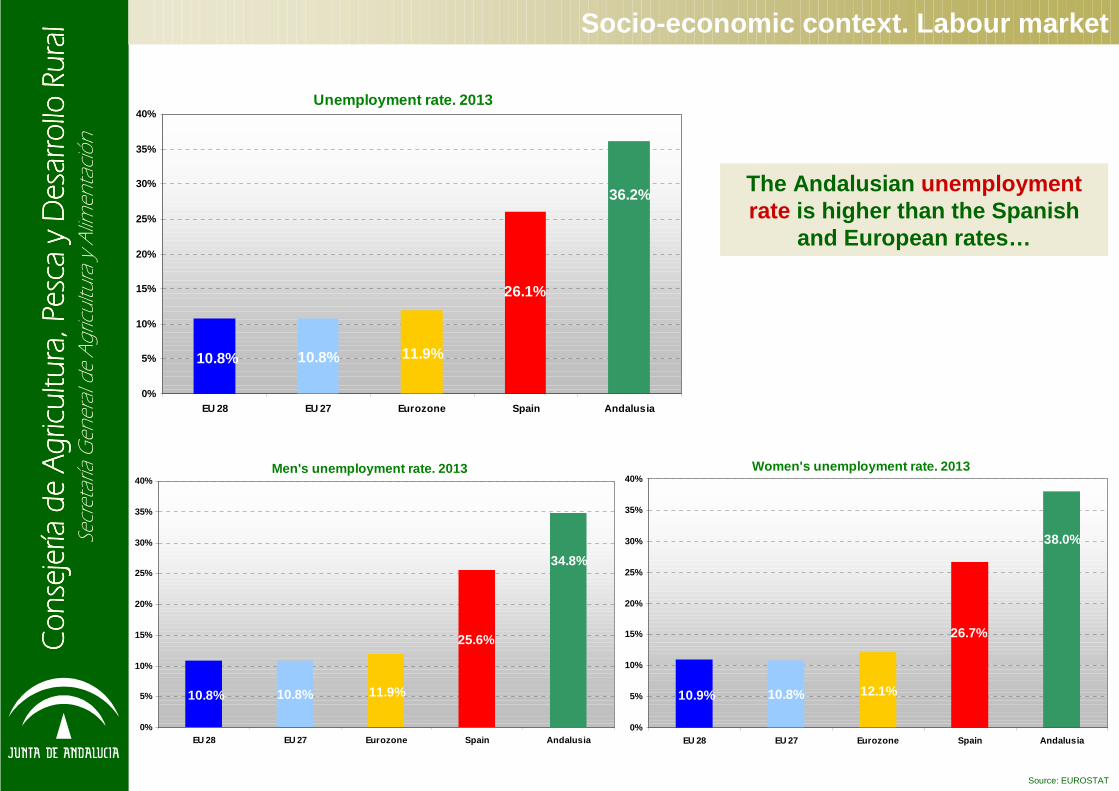
Socio-economic context. Labour market
The Andalusian unemployment rate is higher than the Spanish
and European rates…
Unemployment rate. 2013
36.2%
26.1%
11.9%10.8% 10.8%
0%
5%
10%
15%
20%
25%
30%
35%
40%
EU 28 EU 27 Eurozone Spain Andalusia
Men's unemployment rate. 2013
10.8%10.8% 11.9%
25.6%
34.8%
0%
5%
10%
15%
20%
25%
30%
35%
40%
EU 28 EU 27 Eurozone Spain Andalusia
Women's unemployment rate. 2013
38.0%
26.7%
12.1%10.9% 10.8%
0%
5%
10%
15%
20%
25%
30%
35%
40%
EU 28 EU 27 Eurozone Spain Andalusia

Consejería de Agricultura, Pesca y Desarrollo Rural
Consejería de Agricultura, Pesca y Desarrollo Rural
Consejería de Agricultura, Pesca y Desarrollo Rural
Consejería de Agricultura, Pesca y Desarrollo Rural
Secretaría General de Agricultura y Alimentación
Source: EUROSTAT
... but it showed a fast growth and convergence speed until 2007
The Spanish unemployment rate in 2013 increased to 26.1%, a figure lower
than the Andalusian unemployment rate which was at 36.2%
Spanish and Andalusian unemployment rates are much higher
than European and Eurozone unemployment rates.
The Spanish women’s unemployment rate in 2013 was at 26.7%, while the
Andalusian unemployment rate was a bit higher, standing at 38.0%
Spanish and Andalusian women´s unemployment rates are much higher
than European and Eurozone women’s unemployment rates.
In 2008 this trend at national and regional levels changed due to the
general economic situation
Socio-economic context. Labour market
Evolución tasa de desempleo periodo 2003-2013
0%
10%
20%
30%
40%
50%
60%
70%
2003 2004 2005 2006 2007 2008 2009 2010 2011 2012 2013
UE 28 UE 27 Zona Euro España Andalucía
Evolution of the unemployment rate. 2003-2013
Evolución tasa de desempleo femenino periodo 2003-2 013
0%
10%
20%
30%
40%
50%
60%
70%
2003 2004 2005 2006 2007 2008 2009 2010 2011 2012 2013
UE 28 UE 27 Zona Euro España Andalucía
Evolution of the women’s unemployment rate. 2003-20 13

Consejería de Agricultura, Pesca y Desarrollo Rural
Consejería de Agricultura, Pesca y Desarrollo Rural
Consejería de Agricultura, Pesca y Desarrollo Rural
Consejería de Agricultura, Pesca y Desarrollo Rural
Secretaría General de Agricultura y Alimentación
Socio-economic context. Labour market
The population working in the agricultural sector in Andalusia in 2013 stood at 7.6%, figure much
higher than the Spanish figure (4.3%) and the Eurozone figure (3.4%)
The average agricultural unemployment rate registered in 2013
was 44.4%, while the average total unemployment rate registered in the
same year was 36.2%
Agricultural activities are the main
employment source in half of Andalusian
municipalities
Importance of Agricultural Employment
Source: EUROSTAT & INE
% population working in the agricultural sector. 2 013
4.8%4.8% 3.4%
4.3%
7.6%
0%
1%
2%
3%
4%
5%
6%
7%
8%
EU 28 EU 27 Eurozone Spain Andalusia
% workforce. 2013
70.9%
6.9%4.9%
17.3%
4.3% 13.7%6.0%
76.0%
7.6% 8.6% 5.2%
78.6%
0%
10%
20%
30%
40%
50%
60%
70%
80%
90%
Agriculture Industry Construction Services
EU28 Spain Andalusia

Consejería de Agricultura, Pesca y Desarrollo Rural
Consejería de Agricultura, Pesca y Desarrollo Rural
Consejería de Agricultura, Pesca y Desarrollo Rural
Consejería de Agricultura, Pesca y Desarrollo Rural
Secretaría General de Agricultura y Alimentación
Source: INE
The share of the agricultural population compared to the total active population is more representative in Andalusia than in Spain throughout the period considered.
The active agricultural population increased in Andalusia from 2008 to
2011, but in 2014 began to show a new trend.
In Spain, the active agricultural population showed a stable trend from
2008 to 2014.
Agricultural population
Whereas at national level the number of agricultural population fell by scarcely 0.3% in the period 2008-
2014 in Andalusia this number increased by 5.7%.
Socio-economic context. Labour market
Share of the agricultural active population in the total active population
4.4%4.4%4.3%4.3%4.4%4.3%4.4%
9.3%8.7%
8.8%9.0%9.0%
8.2%8.5%
0%
2%
4%
6%
8%
10%
12%
2008 2009 2010 2011 2012 2013 2014
Spain Andalusia
Evolution of active agricultural population
1,108
1,0141,0111,0089931,0169791,0171,0221,035
3763520,358359359334316306311339
0,000
0,200
0,400
0,600
0,800
1,000
1,200
2005 2006 2007 2008 2009 2010 2011 2012 2013 2014
Tho
usan
ds o
f peo
ple
Spain Andalusia

Consejería de Agricultura, Pesca y Desarrollo Rural
Consejería de Agricultura, Pesca y Desarrollo Rural
Consejería de Agricultura, Pesca y Desarrollo Rural
Consejería de Agricultura, Pesca y Desarrollo Rural
Secretaría General de Agricultura y Alimentación
The importance of those employed in the agricultural sector compared to the total employed population showed a downward trend until 2009 both in Spain
and in Andalusia
This trend changed in 2010, when the importance of the agricultural employed population compared to the total employed population slightly recovered at
national level and, prominently in Andalusia
In 2012, there was a decrease in the importance of the agricultural employed people compared to the
total employed population in the region of Andalusia, while at national level there was a slight increase.
However in 2014 this trend changed again in Andalusia, while in Spain this trend remained stable.
Source: INE
Employment rate in the agricultural sector
The employment rate in the agricultural sector dropped
substantially in the period 2008-2014 both at national and Andalusian levels, falling to 16.3% and 6.0% respectively.
Socio-economic context. Labour market
Share of the population working in the agricultural sector compared to the total workforce
4.2%4.3%4.2%4.2%4.3%4.2%4.3%
8.4%
7.6%7.6%7.8%8.1%
7.4%7.5%
0%
1%
2%
3%
4%
5%
6%
7%
8%
9%
2008 2009 2010 2011 2012 2013 2014
Spain Andalucía
Evolution of people working in the agricultural sec tor
735.9736.6743.4760.2793.0786.1
879.0
220.8195.4201.8216.5230.5217.4234.9
0
100
200
300
400
500
600
700
800
900
1000
2008 2009 2010 2011 2012 2013 2014
Tho
usan
ds o
f peo
ple
Spain Andalusia

Consejería de Agricultura, Pesca y Desarrollo Rural
Consejería de Agricultura, Pesca y Desarrollo Rural
Consejería de Agricultura, Pesca y Desarrollo Rural
Consejería de Agricultura, Pesca y Desarrollo Rural
Secretaría General de Agricultura y Alimentación
Source: INE
The importance of those unemployed in the agricultural sector compared to the total
unemployed population has decreased slightly by 0.5% in Spain and by 0.6% Andalusia, from
2008 to 2014.
Unemployment rate in the agricultural sector
The unemployment rate in the agricultural sector grew significantly
in the 2008-2014 period both at national and Andalusian levels.
Socio-economic context. Labour market
Share of the unemployed agricultural population on the total unemployed population
5.3%4.7% 4.8% 4.7% 4.7% 4.5% 4.8%
11.2%
10.7%11.1%11.7%11.6%11.8%11.8%
0%
2%
4%
6%
8%
10%
12%
14%
2008 2009 2010 2011 2012 2013 2014
Spain Andalusia
Evolution of agricultural unemployed people
137.6
277.68273.93265.05
233.1223.2
193.3
155.18156.2156.1142.0
128.5117.1
80.9
0,000
0,050
0,100
0,150
0,200
0,250
0,300
2008 2009 2010 2011 2012 2013 2014
Tho
usan
ds o
f peo
ple
Spain Andalusia

Consejería de Agricultura, Pesca y Desarrollo Rural
Consejería de Agricultura, Pesca y Desarrollo Rural
Consejería de Agricultura, Pesca y Desarrollo Rural
Consejería de Agricultura, Pesca y Desarrollo Rural
Secretaría General de Agricultura y Alimentación
Affiliation to Social Security
Source: INE
The number of people affiliated to the Special Agricultural scheme in Andalusia has increased since 2008. In two years, the number of affiliates has increa sed by 30,400 people, what represents a growth of 6.6%. The main reason of this increase could be the numbe r of employees that have decided to go
back to the agricultural sector after having been w orking in other productive sector for years
In 2010, there was a deceleration in the rate of af filiation to the Special Agricultural scheme over th e previous year, and a less pronounced loss among mem bers of the General Social Security Scheme in Andalusia. In 2012 the rate of affiliation to the Sp ecial Agricultural began to show a new upward trend,
but in 2014 it decreased again.
From 2010 to 2014 the number of people affiliated t o the General Social Security Scheme in Andalusia increased, showing an annual growth of +3.7%.
Socio-economic context. Labour market
Interanual difference of the number of people affil iated to the Social Security in Andalusia
-10%
-8%
-6%
-4%
-2%
0%
2%
4%
6%
8%
2001 2002 2003 2004 2005 2006 2007 2008 2009 2010 2011 2012 2013 2014
General scheme Special Agricultural scheme

Consejería de Agricultura, Pesca y Desarrollo Rural
Consejería de Agricultura, Pesca y Desarrollo Rural
Consejería de Agricultura, Pesca y Desarrollo Rural
Consejería de Agricultura, Pesca y Desarrollo Rural
Secretaría General de Agricultura y Alimentación
Distribution of arable land
The Utilised Agricultural Area accounts for about 172 million hectares, in which farmland (60.0%) and
permanent pasture lands (33.6%) highlight.
EU27
Most of the Spanish UUA is used to cultivate arable crops (47.5%) and permanent pastures (35.3%). This area represents 13.8% of the UAA of the EU27. Olive
groves account for just 9.1% of the UAA.
Spain
Source: INE. Agricultural census 2009. Farm structure. Spanish Ministry for Agriculture, food and environment. February 2013.
The Andalusian UAA represents 18.5% of the Spanish UAA and its shows a balance between permanent and
annual crops. Olive groves represent an important share accounting for 1.5 million hectares (30.9% UAA).
Andalusia
Permanent grazing land
33.6%
Area for permanent
crops 6.2%
Arable and fallow land
60.0%
Area for family vegetable patches
0.2%
Permanent grasslands35.3%
Other arable land0.2%
Olive groves9.1%
Arable crops47.5%
Fruits4.4%
Vineyards3.6%
Vineyards0.6%
Fruits5.2%
Arable crops35.5%
Olive groves30.9%
Other arable land0.1%
Permanent grasslands
27.7%

Consejería de Agricultura, Pesca y Desarrollo Rural
Consejería de Agricultura, Pesca y Desarrollo Rural
Consejería de Agricultura, Pesca y Desarrollo Rural
Consejería de Agricultura, Pesca y Desarrollo Rural
Secretaría General de Agricultura y Alimentación
The Agriculture Sector in Andalusia
According to Data from the Agricultural Census 2009, of the Spanish Office for National Statistics, in Andalusia, arable land occupies 3,183,567 hectares , permanent grazing land occupies 1,219,193 hectares, and the areas considered as “other types of land” occupy 1,091,067
hectares . The total area of these lands is 5,493,830 hectares , that represents 63% of the totalAndalusian area.
Source: Statistical atlas of Andalusia, year 2003. Institute of Statistics of Andalusia
Predominant vegetation and land uses per municipali ty in Andalusia

Consejería de Agricultura, Pesca y Desarrollo Rural
Consejería de Agricultura, Pesca y Desarrollo Rural
Consejería de Agricultura, Pesca y Desarrollo Rural
Consejería de Agricultura, Pesca y Desarrollo Rural
Secretaría General de Agricultura y Alimentación
Farms characterization
Provincial distribution of the Utilised Agricultura l Area (UAA) in Andalusia
Provincial distribution of the number of farms
Source: Spanish Institute of Statistics. Agricultural Census 2009
Jaen is the province with a greater number of farms, representing 26.8%. However,
Cadiz just has 4.2% of the total number of Andalusian farms.
Sevilla is the province with the highest UAA. It represents more than a fifth of the
total Andalusian UAA.
The Utilised Agricultural Area in Andalusiareaches 4,402,460 hectares. It represents
18.5% of the Spanish UAA.
There are 246,104 farms in Andalusia (*)
(*) Agrarian Census excludes farms of less than 1 hectare.
Almería5.3% Cádiz
9.6%
Córdoba19.2%
Granada14.2%Huelva
7.5%
Jaén15.8%
Málaga7.0%
Sevilla21.3%
Sevilla11.8%
Málaga10.8%
Jaén26.8%
Huelva5.1%
Granada16.9%
Córdoba15.0%
Cádiz4.2%
Almería9.3%

Consejería de Agricultura, Pesca y Desarrollo Rural
Consejería de Agricultura, Pesca y Desarrollo Rural
Consejería de Agricultura, Pesca y Desarrollo Rural
Consejería de Agricultura, Pesca y Desarrollo Rural
Secretaría General de Agricultura y Alimentación
Farm’s average size per total area (hectares)
Farm’s average size per usable agricultural area (h ectares)
Source: Spanish Institute of Statistics. Agricultural Census 2009
Farms characterization
The Andalusian farm´s average size per total area (22.3 hectares) is27.8% lower than the Spanish
farm´s average size per total area(30.9 hectares).
The Andalusian farm’s average size per usable agricultural area (17.9 hectares) is 25.4% lower than the national average (24.0 hectares).
54.6
44.4
34.4
39.638.1
33.4
22.722.524.0
18.917.017.9
15.212.111.5
8.05.53.9
0
10
20
30
40
50
60
Can
aria
s
Val
enci
a
Gal
icia
Paí
s V
asco
Mur
cia
Ast
uria
s
And
aluc
ía
Bal
eare
s
Cat
aluñ
a
ES
PA
ÑA
La R
ioja
Can
tabr
ia
Cat
illa
la M
anch
a
Mad
rid
Ext
rem
adu
ra
Nav
arra
Ara
gón
Cas
tilla
y L
eón
Far
m´s
ave
rage
siz
e pe
r usa
ble
agric
ultu
ra a
rea
(he
ctar
es)
68.0
57.7
50.047.646.5
43.4
34.734.430.9
27.024.222.321.9
15.915.811.3
7.55.1
0
10
20
30
40
50
60
70
80
Can
aria
s
Val
enci
a
Gal
icia
Paí
s V
asco
Mur
cia
Ast
uria
s
And
aluc
ía
Bal
eare
s
Cat
aluñ
a
ES
PA
ÑA
La R
ioja
Can
tabr
ia
Cat
illa
la M
anch
a
Mad
rid
Ext
rem
adur
a
Nav
arra
Ara
gón
Cas
tilla
y L
eón
Far
m´s
ave
rage
siz
e pe
r to
tal a
rea
(hec
tare
s)

Consejería de Agricultura, Pesca y Desarrollo Rural
Consejería de Agricultura, Pesca y Desarrollo Rural
Consejería de Agricultura, Pesca y Desarrollo Rural
Consejería de Agricultura, Pesca y Desarrollo Rural
Secretaría General de Agricultura y Alimentación
Farm’s average size by total area (hectares)
Farm’s average size by UAA (hectares)
The farm’s average size by total area in Andalusia is 22.3 hectares, but if we measure it by UAA, the farm’s
average size is 17.9 hectares.
Farms characterization
The farm’s average size by total area and by UAA are higher in Western
provinces than in Eastern provinces
Source: Spanish Institute of Statistics. Agricultural Census 2009
22.3
37.6
13.912.4
44.8
18.2
27.7
51.9
14.3
0
10
20
30
40
50
60
Almería Cádiz Córdoba Granada Huelva Jaén Málaga Sevilla A ndalucía
Far
m´s
ave
rage
siz
e by
tota
l are
a (h
ecta
res)
10,2
40,8
22,8
15,0
26,3
10,611,6
32,4
17,9
0
5
10
15
20
25
30
35
40
45
Almería Cádiz Córdoba Granada Huelva Jaén Málaga Sevilla A ndalucía
Far
m´s
ave
rage
siz
e by
UA
A (
hect
ares
)

Consejería de Agricultura, Pesca y Desarrollo Rural
Consejería de Agricultura, Pesca y Desarrollo Rural
Consejería de Agricultura, Pesca y Desarrollo Rural
Consejería de Agricultura, Pesca y Desarrollo Rural
Secretaría General de Agricultura y Alimentación
Source: Livestock surveys. Spanish Ministry for Agriculture, food and environment.
Farms characterization
Sheep population suffered the highest decreased in Spain (-29.1%) between 2005 and 2013.
On other hand, swine population increased (+2.1%) slightly in the same period.
Main livestock populations have decreased in Spain and Andalusia in recent years. In fact, swine
population was the only one that slightly increased.
In Andalusia, sheep population also suffered the highest decreased (-29,3%) since 2005 to 2013.However, from 2005 to 2014 the highest decline
corresponded to bovine population (-31.7%).It is also important to note that swine population in Andalusia decreased by 11.2% from 2005 to 2014.
Evolution of main livestock populations in Andalusi a
541
792
2,224
3,147
946
1,107
1,971
2,221
0,000
0,500
1,000
1,500
2,000
2,500
3,000
3,500
2005 2006 2007 2008 2009 2010 2011 2012 2013 2014
Tho
usan
ds o
f hea
ds
Bovine Sheep Goat Swine
Evolution of main livestock populations in Spain
6,0086,464
16,119
22,749
2,6102,905
25,41224,884
0,000
5,000
10,000
15,000
20,000
25,000
30,000
2005 2006 2007 2008 2009 2010 2011 2012 2013 2014
Tho
usan
ds o
f hea
ds
Bovine Sheep Goat Swine

Consejería de Agricultura, Pesca y Desarrollo Rural
Consejería de Agricultura, Pesca y Desarrollo Rural
Consejería de Agricultura, Pesca y Desarrollo Rural
Consejería de Agricultura, Pesca y Desarrollo Rural
Secretaría General de Agricultura y Alimentación
Farms characterization
The main Andalusian livestock herds are less representative in the national herds in recent years
Andalusian sheep have kept their share more stable in the period 2005-2013
The share of the Andalusian pig population in the Spanish one decreased just 0.9% in the period 2005-2012, which made it become one of the most stable herds. However, in 2013, this herd sharply decreased in Andalusia, reducing its share at
Spanish level by 1.1% between 2005 and 2014
Goats have experienced a decline of 1.9% in terms of importance in the Spanish goats herd between 2005 and 2013
Andalusian cattle had a 3.2% smaller share at Spanish level between 2005 and 2014.
Source: Livestock surveys. Spanish Ministry for Agriculture, food and environment.
Evolution of livestock populations rates (%) betwee n Andalusia and Spain
9.0%12.2%
13.8%13.8%
36.2%38.1%
7.8%8.9%
0%
5%
10%
15%
20%
25%
30%
35%
40%
45%
2005 2006 2007 2008 2009 2010 2011 2012 2013 2014
Bovine Sheep Goat Swine

Consejería de Agricultura, Pesca y Desarrollo Rural
Consejería de Agricultura, Pesca y Desarrollo Rural
Consejería de Agricultura, Pesca y Desarrollo Rural
Consejería de Agricultura, Pesca y Desarrollo Rural
Secretaría General de Agricultura y Alimentación
Source: Spanish Institute of Statistics. Agricultural Census 2009
Farms characterization
Horses are the herd with a higher presence in Andalusian farms (39%), followed by sheep (31%). In Spain, cattle is the herd that is present in a larger number of farms (46%).
Those Andalusian farms which have goats represent 23% at national level, followed by those with horses, which represent 21% at Spanish level
Andalusian goats represent 37% of those registered in Spain, followed by horses (34%), and beehives, 17% of those registered in Spain
Livestock populations in farms in Spain (%)
0%
5%
10%
15%
20%
25%
30%
35%
40%
45%
50%
Bovine Sheep Goat Swine Equine Poultry Rabbits
Livestock populations in farms in Andalusia (%)
0%
5%
10%
15%
20%
25%
30%
35%
40%
45%
50%
Bovine Sheep Goat Swine Equine Poultry Rabbits
Andalusia/Spain farms rate (%)
0%
5%
10%
15%
20%
25%
30%
35%
40%
Bovine Sheep Goat Swine Equine Poultry Rabbits Hives
Andalusia/Spain heads or units rate (%)
0%
5%
10%
15%
20%
25%
30%
35%
40%
Bovine Sheep Goat Swine Equine Poultry Rabbits Hives

Consejería de Agricultura, Pesca y Desarrollo Rural
Consejería de Agricultura, Pesca y Desarrollo Rural
Consejería de Agricultura, Pesca y Desarrollo Rural
Consejería de Agricultura, Pesca y Desarrollo Rural
Secretaría General de Agricultura y Alimentación
Almería17%
Cádiz5%
Córdoba13%
Granada12%Huelva
12%
Jaén19%
Málaga8%
Sevilla14%
Source: Spanish Office for National Statistics. Agricultural Census 2009
Agricultural activity provides in Andalusia around 260,000 AWU,
distributed as follows
Utilised agricultural area (ha) required to generate an AWU Jaen, accounting for 27% of farms, is the province of
Andalusia that generates a greater number of AWU (19%); followed by Almeria, accounting for 9.3% of
farms, that provides 17% of the agricultural employment
Average employment generated per farm by agriculture at province level
Huelva is a province whose average farm requires more manpower, having 2.6 AWU/farm
Almeria is in second position, requiring about 1.9 AWU/farm
On the one hand, the average area necessary to generate an AWU in Almeria is 5.4 hectares (intensive
farms)On the other hand, Cadiz, requires 32.6 hectares to
achieve an AWU (extensive farms)
AWU: Agricultural Work Unit = 240 days
Farms characterization
16.9
25.2
15.014.7
10.2
20.3
24.4
32.6
5.4
0
5
10
15
20
25
30
35
Almería Cádiz Córdoba Granada Huelva Jaén Málaga Sevilla An dalucía
UA
A (
hect
ares
) /
AW
U
1.1
1.3
0.80.7
2.6
0.7
0.9
1.3
1.9
0
1
2
3
Almería Cádiz Córdoba Granada Huelva Jaén Málaga Sevilla An dalucía
AW
U p
er fa
rm

Consejería de Agricultura, Pesca y Desarrollo Rural
Consejería de Agricultura, Pesca y Desarrollo Rural
Consejería de Agricultura, Pesca y Desarrollo Rural
Consejería de Agricultura, Pesca y Desarrollo Rural
Secretaría General de Agricultura y Alimentación
Characterization of farms according to their legal status
Legal people are holders of 94% of farms, representing 64% of the total UAA of Andalusia and 71% of the AWU generated
by agricultureTrading companies (3% of farms owners), account for 18% of
the total UAA of Andalusia and 18% of the total employment generated by farming
Average area (UAA) of farms according to their legal status
Average employment generated by agriculture by legal status
UAA area required to generate a AWU according to the legal status
Farms characterization
Source: Spanish Office for National Statistics. Agricultural Census 2009
Legal status Nº farms Total UAA (ha) Total AWU
Legal person 231,482 2,802,110.4 183,898.8
Trading company 6,276 804,300.6 45,553.4
Public entity 213 119,367.9 622.4
Cooperative society 800 71,193.3 9,294.9
Other legal status 7,333 605,788.1 20,384.4
Andalusía 246,104 4,402,760 259,754
128.2
89.0 82.6
17.9
560.4
12.1
0
100
200
300
400
500
600
Legal person Tradingcompany
Public entity Cooperativesociety
Other legalstatus
Andalusia
UA
A (
ha)
/ fa
rm
7.3
11.6
2.8
1.10.8
2.9
0
2
4
6
8
10
12
14
Legalperson
Tradingcompany
Public entity Cooperativesociety
Other legalstatus
Andalusia
AW
U /
farm
17.77.7
29.7
16.9
191.8
15.2
0
20
40
60
80
100
120
140
160
180
200
Legal person Tradingcompany
Public entity Cooperativesociety
Other legalstatus
Andalusia
UA
A (
ha)
/ A
WU
Consejería de Agricultura, Pesca y Desarrollo Rural
Consejería de Agricultura, Pesca y Desarrollo Rural
Consejería de Agricultura, Pesca y Desarrollo Rural
Consejería de Agricultura, Pesca y Desarrollo Rural
Secretaría General de Agricultura y Alimentación
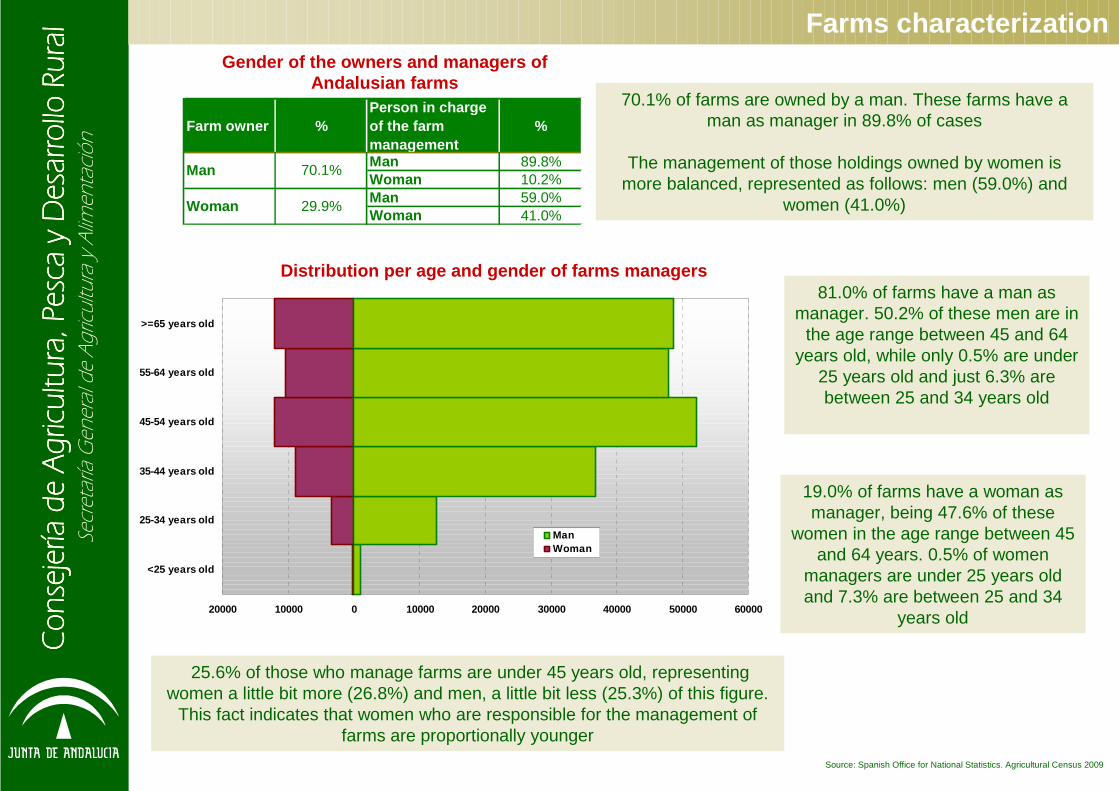
Gender of the owners and managers of Andalusian farms
Distribution per age and gender of farms managers
70.1% of farms are owned by a man. These farms have a man as manager in 89.8% of cases
The management of those holdings owned by women is more balanced, represented as follows: men (59.0%) and
women (41.0%)
81.0% of farms have a man as manager. 50.2% of these men are in
the age range between 45 and 64 years old, while only 0.5% are under
25 years old and just 6.3% are between 25 and 34 years old
19.0% of farms have a woman as manager, being 47.6% of these
women in the age range between 45 and 64 years. 0.5% of women
managers are under 25 years old and 7.3% are between 25 and 34
years old
25.6% of those who manage farms are under 45 years old, representing women a little bit more (26.8%) and men, a little bit less (25.3%) of this figure.
This fact indicates that women who are responsible for the management of farms are proportionally younger
Farms characterization
Source: Spanish Office for National Statistics. Agricultural Census 2009
Farm owner %Person in charge of the farm management
%
Man 89.8%Woman 10.2%Man 59.0%Woman 41.0%
Man 70.1%
Woman 29.9%
20000 10000 0 10000 20000 30000 40000 50000 60000
<25 years old
25-34 years old
35-44 years old
45-54 years old
55-64 years old
>=65 years old
ManWoman

Consejería de Agricultura, Pesca y Desarrollo Rural
Consejería de Agricultura, Pesca y Desarrollo Rural
Consejería de Agricultura, Pesca y Desarrollo Rural
Consejería de Agricultura, Pesca y Desarrollo Rural
Secretaría General de Agricultura y Alimentación Local distribution of young
farmers
Young farmers are principally located in the areas of the coast of Almeria and Huelva, followed by the
municipalities located in the mountains in which olive growing plays an important role
Local distribution of female farm managers
In 87.4% of the Andalusian municipalities with farms, the management of between 15% and 25% of them is
carried out by a womanThe coast of Huelva and the lower part of the river
Guadalquivir are places where there are fewer women managing farms
Farms characterization
Source: Spanish Office for National Statistics. Agricultural Census 2009

Consejería de Agricultura, Pesca y Desarrollo Rural
Consejería de Agricultura, Pesca y Desarrollo Rural
Consejería de Agricultura, Pesca y Desarrollo Rural
Consejería de Agricultura, Pesca y Desarrollo Rural
Secretaría General de Agricultura y Alimentación
% farms by TEG % UAA by TEG
Farms characterization
0
50,000
100,000
150,000
200,000
Generalagriculture
Woody crops Crops andlivestock
production
Mixtedlivestock
production
Granivores Grazinglivestock
Horticulture(vegetable
gardens andflowers)
Polyculture Not classified
Are
a (h
a)
0
500,000
1,000,000
1,500,000
2,000,000
Nº
of fa
rms
Area (ha) Nº farms
Technical Economic Guidelines (TEG) Andalusia
3.6%
1.1%
1.0%
0.6%
1.4%
4.7%
7.5%
68.9%
11.2%
General agricultureWoody cropsCrops and livestock productionMixted livestock productionGranivoresGrazing livestockHorticulture (vegetable gardens and flowers)
7.6%
26.1%
39.4%
1.8%
14.9%
5.4%
2.8%
0.5%
1.5%
General agricultureWoody cropsCrops and livestock productionMixted livestock productionGranivoresGrazing livestockHorticulture (vegetable gardens and flowers)
Source: Spanish Office for National Statistics. Agricultural Census 2009

Consejería de Agricultura, Pesca y Desarrollo Rural
Consejería de Agricultura, Pesca y Desarrollo Rural
Consejería de Agricultura, Pesca y Desarrollo Rural
Consejería de Agricultura, Pesca y Desarrollo Rural
Secretaría General de Agricultura y Alimentación
Main Technical Economic Guidelines (TEG) in Andalus ia
Farms characterization
Total UAA 4,402,760 ha
Total employment 259,754 AWU
Total number of farms 246,104 farms
Total standard production (TSP) 7,818 million €
% area by TEG
% farms by TEG
% employment generated (AWU) according to TEG
% total standard production by TEG
Olive groves32.8%
Grain (except rice), oilseeds and pulses
15.6%
Rest TEG51.6%
Olive groves39.8%
Greenhouse vegetables
20.2%
Rest TEG40.0%
Olive groves57.0%
Greenhouse vegetables
6.0%
Grain (except rice), oilseeds and pulses
6.4%
Rest TEG30.6%
Olive groves25.9%
Greenhouse vegetables
14.6%
Citrus4.0%
Rest TEG41.4%
Fresh vegetables cultivated in farm
land9.0%
Greenhouse flowers and
ornamental plants5.1%
Source: Spanish Office for National Statistics. Agricultural Census 2009
Consejería de Agricultura, Pesca y Desarrollo Rural
Consejería de Agricultura, Pesca y Desarrollo Rural
Consejería de Agricultura, Pesca y Desarrollo Rural
Consejería de Agricultura, Pesca y Desarrollo Rural
Secretaría General de Agricultura y Alimentación
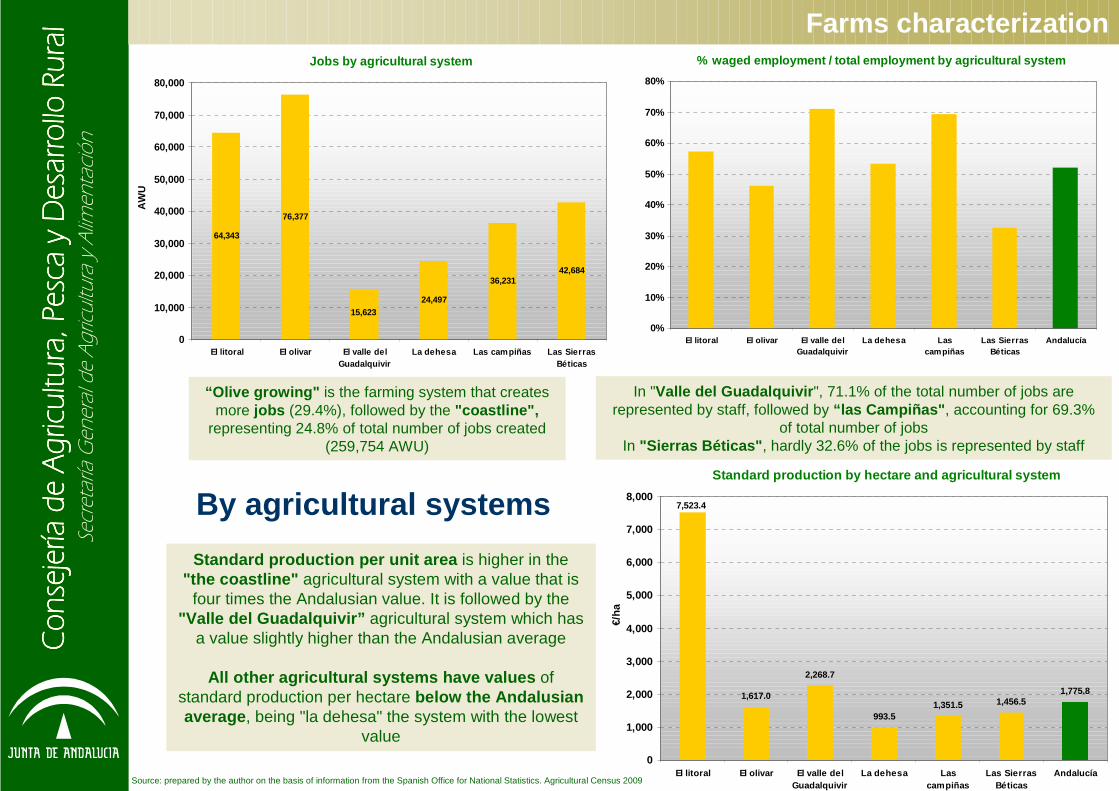
Farms characterizationJobs by agricultural system
64,343
76,377
24,497
36,23142,684
15,623
0
10,000
20,000
30,000
40,000
50,000
60,000
70,000
80,000
El litoral El olivar El valle delGuadalquivir
La dehesa Las campiñas Las SierrasBéticas
AW
U
% waged employment / total employment by agricultur al system
0%
10%
20%
30%
40%
50%
60%
70%
80%
El litoral El olivar El valle delGuadalquivir
La dehesa Lascampiñas
Las SierrasBéticas
Andalucía
“Olive growing" is the farming system that creates more jobs (29.4%), followed by the "coastline",
representing 24.8% of total number of jobs created (259,754 AWU)
In "Valle del Guadalquivir ", 71.1% of the total number of jobs are represented by staff, followed by “las Campiñas" , accounting for 69.3%
of total number of jobsIn "Sierras Béticas" , hardly 32.6% of the jobs is represented by staff
Standard production by hectare and agricultural sys tem
1,617.0
2,268.7
993.51,351.5 1,456.5
1,775.8
7,523.4
0
1,000
2,000
3,000
4,000
5,000
6,000
7,000
8,000
El litoral El olivar El valle delGuadalquivir
La dehesa Lascampiñas
Las SierrasBéticas
Andalucía
€/ha
Source: prepared by the author on the basis of information from the Spanish Office for National Statistics. Agricultural Census 2009
Standard production per unit area is higher in the "the coastline" agricultural system with a value that is
four times the Andalusian value. It is followed by the "Valle del Guadalquivir” agricultural system which has
a value slightly higher than the Andalusian average
All other agricultural systems have values of standard production per hectare below the Andalusianaverage , being "la dehesa" the system with the lowest
value
By agricultural systems

Consejería de Agricultura, Pesca y Desarrollo Rural
Consejería de Agricultura, Pesca y Desarrollo Rural
Consejería de Agricultura, Pesca y Desarrollo Rural
Consejería de Agricultura, Pesca y Desarrollo Rural
Secretaría General de Agricultura y Alimentación
Fuel: the high increase in fuel price since 2010 has no correlation with the trend of fertilizers prices, which were maintained from 2010 to 2014.
In 2014, from July to December, fuel prices fell due to increasing world fuel production and the loss of demand as a result of the present general economic situation. However, since Jaunary
2015 fuel prices started to grow again.
Evolution of agricultural inputs prices
Evolution of oil and fertilizer's prices
0
10
20
30
40
50
60
70
80
90
100
2006 2007 2008 2009 2010 2011 2012 2013 2014 2015
Pric
e (€
/100
kg
- €/
Bbl
)
Ammonium nitrate 33,5% Urea 46% Mixed fertilizer 15-15-15 Oil
Source: Spanish Ministry of Agriculture and Rural and Marine Areas
Consejería de Agricultura, Pesca y Desarrollo Rural
Consejería de Agricultura, Pesca y Desarrollo Rural
Consejería de Agricultura, Pesca y Desarrollo Rural
Consejería de Agricultura, Pesca y Desarrollo Rural
Secretaría General de Agricultura y Alimentación
Evolution of agricultural inputs prices
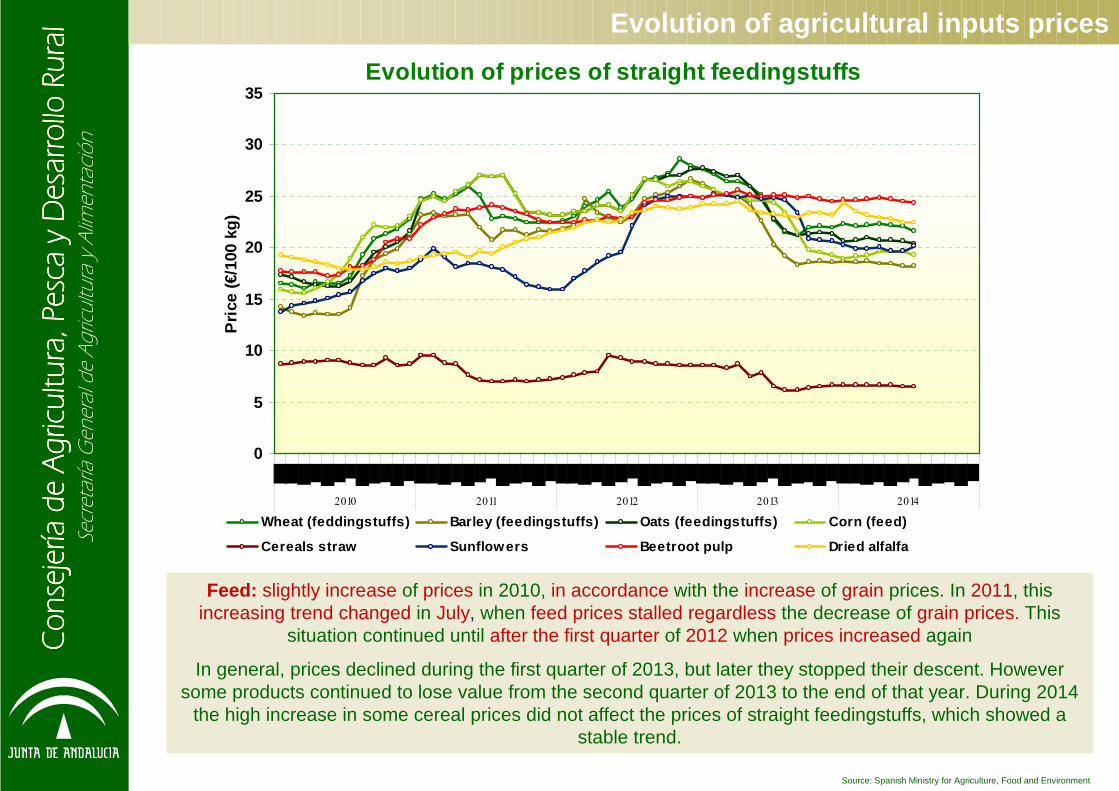
Feed: slightly increase of prices in 2010, in accordance with the increase of grain prices. In 2011, thisincreasing trend changed in July, when feed prices stalled regardless the decrease of grain prices. This
situation continued until after the first quarter of 2012 when prices increased again
In general, prices declined during the first quarter of 2013, but later they stopped their descent. However some products continued to lose value from the second quarter of 2013 to the end of that year. During 2014
the high increase in some cereal prices did not affect the prices of straight feedingstuffs, which showed a stable trend.
Source: Spanish Ministry for Agriculture, Food and Environment
Evolution of prices of straight feedingstuffs
0
5
10
15
20
25
30
35
2010 2011 2012 2013 2014
Pric
e (€
/100
kg)
Wheat (feddingstuffs) Barley (feedingstuffs) Oats (feedingstuffs) Corn (feed)
Cereals straw Sunflowers Beetroot pulp Dried alfalfa
Consejería de Agricultura, Pesca y Desarrollo Rural
Consejería de Agricultura, Pesca y Desarrollo Rural
Consejería de Agricultura, Pesca y Desarrollo Rural
Consejería de Agricultura, Pesca y Desarrollo Rural
Secretaría General de Agricultura y Alimentación
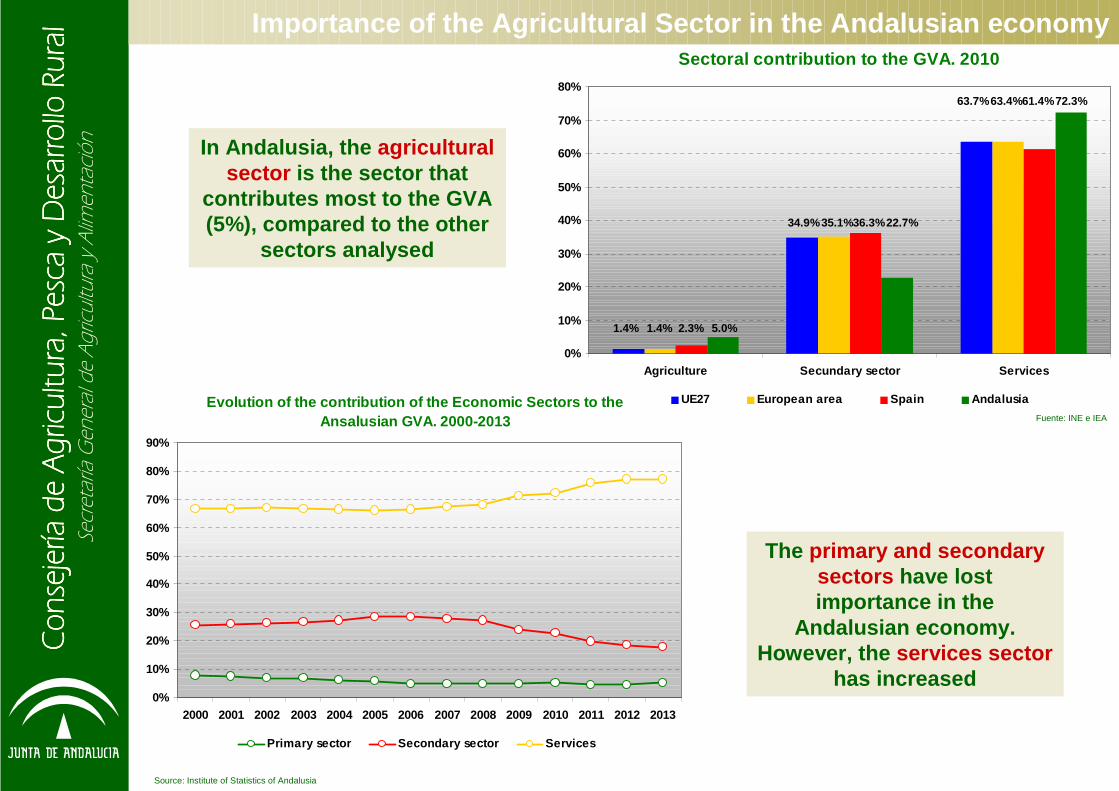
The primary and secondary sectors have lost importance in the
Andalusian economy. However, the services sector
has increased
Importance of the Agricultural Sector in the Andalus ian economy
Fuente: INE e IEA
In Andalusia, the agricultural sector is the sector that
contributes most to the GVA (5%), compared to the other
sectors analysed
Sectoral contribution to the GVA. 2010
0%
10%
20%
30%
40%
50%
60%
70%
80%
Agriculture Secundary sector Services
UE27 European area Spain Andalusia
1.4% 1.4% 2.3% 5.0%
34.9%35.1%36.3%22.7%
63.7%63.4%61.4%72.3%
Source: Institute of Statistics of Andalusia
Evolution of the contribution of the Economic Secto rs to the Ansalusian GVA. 2000-2013
0%
10%
20%
30%
40%
50%
60%
70%
80%
90%
2000 2001 2002 2003 2004 2005 2006 2007 2008 2009 2010 2011 2012 2013
Primary sector Secondary sector Services

Consejería de Agricultura, Pesca y Desarrollo Rural
Consejería de Agricultura, Pesca y Desarrollo Rural
Consejería de Agricultura, Pesca y Desarrollo Rural
Consejería de Agricultura, Pesca y Desarrollo Rural
Secretaría General de Agricultura y Alimentación
Economic importance of the Andalusian agricultural se ctor
Production of the Agricultural Sector (PAS)
Source: Statistics yearbook 2009. Spanish Ministry of Agriculture, Fisheries and Environment. Economic indicators of Andalusia 2010. Regional Ministry of Agriculture, Fisheries and Rural Development.
In 2013, the Production of the Agricultural Sector of Spain, worth
44,271 million €, represented 10.7%of the PAS of the EU-28
In 2013, the PAS of Andalusia, worth 9,831 million €, represented 2.4% of the PAS of the EU-28 and 22.2% of
Spain
According the Report of the Statistics yearbook 2013 of the Spanish Ministry for Agriculture, Food and Environment, the value of the Spanish PAS of 2013 rose to 44,271 million €, what
represented an increase of 2.6% compared to the value of the Spanish PAS of 2012
The evolution of the Andalusian agricultural economic indicators predicted that the AndalusianPAS for 2013 would be about 9,831 million €, what meant an increase of 0.6% compared to
the PAS of 2012 (9,769 million €)
Value of the agricultural production in 2013
9,80744,271
414,148
0,000
50,000
100,000
150,000
200,000
250,000
300,000
350,000
400,000
450,000
EU28 Spain Andalusia
mili
ons
€

Consejería de Agricultura, Pesca y Desarrollo Rural
Consejería de Agricultura, Pesca y Desarrollo Rural
Consejería de Agricultura, Pesca y Desarrollo Rural
Consejería de Agricultura, Pesca y Desarrollo Rural
Secretaría General de Agricultura y Alimentación
In 2004, the PAS reached its maximum value at 11,356 mill €. The Production of the Crops sub-sector rose to 9,640 mill €, while the Production of the Animal sub-
sector reached 1,387 mill €
Production of the Agriculture Sector (PAS): Crop and Animal production in Andalusia
In 2014, the Andalusian PAS reached 10,939 mill €, which was 11.5% higher than the previous year and 24.9% higher than the value reached in 2000.
Crop Production value in 2014 represented 82.7% of PAS. Furthermore the Animal Production value was 14.8% of PAS, in the same year.
Crop Production value in 2014 was 14.2% higher than it was in 2013, due to the increase of olive oil harvest which represents an important part of Crop Production value in Andalusia. Furthermore Livestock Production value was
0.4% higher than it was in 2013, due to the positive performance of prices.
Note about the Methodology: The reform of the CAP i n terms of subsidies led to a partial decoupling be tween subsidies and productions in 2006 so that far mers receive part of the grants as a “SINGLE PAYMENT", what means, a new concept. This means that such amou nts can not be attributed to any particular product, so part of the Subsidies granted to Products that w ere included in the value of the production in 2005 , are part of the amount included in the “SINGLE PA YMENT" in 2006 and beyond and, count, therefore, as "Other Grants".
Source: Agricultural economic indicators of Andalusia. Regional Ministry of Agriculture, Fisheries and Rural Development
An upward trend of the PAS can be observed since 2000
Evolution of the value of the agricultural producti on in Andalusia
8,760
10,939
7,314
9,050
1,618
1,1670,000
2,000
4,000
6,000
8,000
10,000
12,000
2000 2001 2002 2003 2004 2005 2006 2007 2008 2009 2010 2011 2012 2013 2014
mili
ons
€
Production of the agricultural sector Crop production Livestock production

Consejería de Agricultura, Pesca y Desarrollo Rural
Consejería de Agricultura, Pesca y Desarrollo Rural
Consejería de Agricultura, Pesca y Desarrollo Rural
Consejería de Agricultura, Pesca y Desarrollo Rural
Secretaría General de Agricultura y Alimentación
Olive oil sector reached 2,196 mill € in 2014, which represents an increase of 160.6% compared to 2013.
Production of the Agriculture Sector (PAS) by sub-s ectors. Andalusia
Source: Economic indicators of Andalusia 2013. Regional Ministry of Agriculture and Fisheries. The value of the animal production corresponds to 2010
Production of agriculture sector, 2010-2014
Crop production, 2010-2014 Livestock production, 2010- 2012
The Fruits, Vegetables and Olive oil sub-sectors represented 70% of the average production of the
Andalusian agriculture sector between 2010 and 2014and 85% of the Crop Production.
The Vegetables, seddings, flowers and plantations sector in 2014 reached 3,527 mill €, which represented
an increase of 3.7% compared to the previous year (3,402 mill €).
Olive oil16%
Fruits21%
Livestock production
15%
Cereals 5%
Services and non-farm activities 3%
Other crops4%
Industrial crops 4%
Vegetables, seddings, flowers
and plantations32%
Fruits27%
Olive oil19%
Cereals6%
Other crops4%
Industrial crops4%
Vegetables, seddings, flowers
and plantations40%
Bovine14%
Swine31%
Poultry21%
Milk18%
Other livestock productions 1%
Eggs4%
Other meats0,2%
Sheep and Goats8%
Horses1%

Consejería de Agricultura, Pesca y Desarrollo Rural
Consejería de Agricultura, Pesca y Desarrollo Rural
Consejería de Agricultura, Pesca y Desarrollo Rural
Consejería de Agricultura, Pesca y Desarrollo Rural
Secretaría General de Agricultura y Alimentación
The Spanish Farm Income, worth 24,321 mill €, represented 16.8% of the EU-28
Farm Income in 2013
Farm Income
Source: Agricultural statistics yearbook 2012. Spanish Ministry of Agriculture, Fisheries and Environment. Economic indicators of Andalusia 2012. Regional Ministry of Agriculture, Fisheries and Rural Development
According the Report of the Statistics yearbook 2013 of the Spanish Ministry for Agriculture, Food and Environment, the Spanish Farm Income of 2013 increased by 7.0%
compared to the Spanish Farm Income of 2012.
According to the Evolution of the agricultural economic indicators of Andalusia in 2013, the Andalusian Farm Income of 2013 reached 7,201 mill €, which represented a slight
increase of 0.4% compared to the Andalusian Farm Income of 2012
The Farm Income of Andalusia, worth 7,201 mill €, represented 5.0% of the FI of
the EU-28 and 29.6% of Spain in 2013
Farm income 2013
144,879
24,321 7,183
0,000
20,000
40,000
60,000
80,000
100,000
120,000
140,000
160,000
EU28 Spain Andalusia
Mill
on €
Consejería de Agricultura, Pesca y Desarrollo Rural
Consejería de Agricultura, Pesca y Desarrollo Rural
Consejería de Agricultura, Pesca y Desarrollo Rural
Consejería de Agricultura, Pesca y Desarrollo Rural
Secretaría General de Agricultura y Alimentación
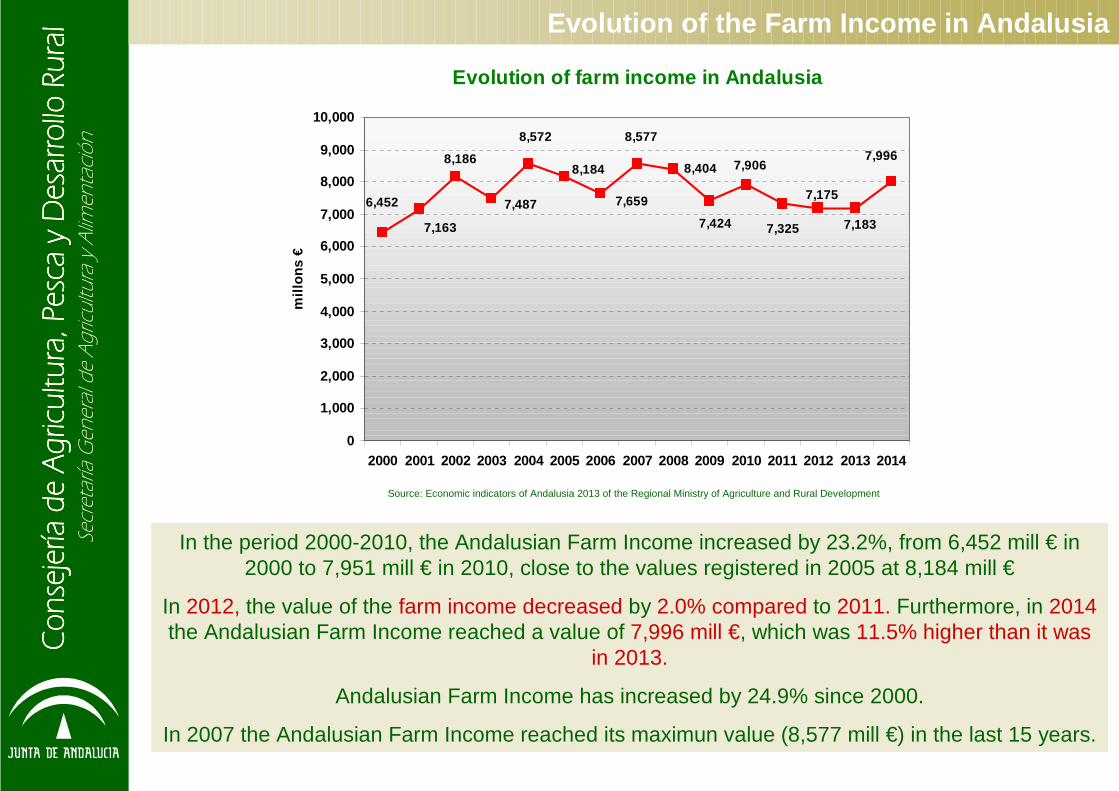
In the period 2000-2010, the Andalusian Farm Income increased by 23.2%, from 6,452 mill € in2000 to 7,951 mill € in 2010, close to the values registered in 2005 at 8,184 mill €
In 2012, the value of the farm income decreased by 2.0% compared to 2011. Furthermore, in 2014the Andalusian Farm Income reached a value of 7,996 mill €, which was 11.5% higher than it was
in 2013.
Andalusian Farm Income has increased by 24.9% since 2000.
In 2007 the Andalusian Farm Income reached its maximun value (8,577 mill €) in the last 15 years.
Evolution of the Farm Income in Andalusia
Source: Economic indicators of Andalusia 2013 of the Regional Ministry of Agriculture and Rural Development
Evolution of farm income in Andalusia
8,4047,996
7,183
7,175
7,325
7,906
7,424
8,577
7,659
8,184
8,572
7,487
8,186
7,163
6,452
0,000
1,000
2,000
3,000
4,000
5,000
6,000
7,000
8,000
9,000
10,000
2000 2001 2002 2003 2004 2005 2006 2007 2008 2009 2010 2011 2012 2013 2014
mill
ons
€

Consejería de Agricultura, Pesca y Desarrollo Rural
Consejería de Agricultura, Pesca y Desarrollo Rural
Consejería de Agricultura, Pesca y Desarrollo Rural
Consejería de Agricultura, Pesca y Desarrollo Rural
Secretaría General de Agricultura y Alimentación
Regarding the evolution of the farm income by AWU in Andalusia between 2000 and 2014 and considering it in current terms, it has experienced a growth of 53.3%. However, if we analyse it in constant terms, it has
remained almost at a standstill because it has slightly decreased in the period considered of 2.9%.
Therefore, the disposable income to pay agricultural jobs has remained virtually unchanged, making the sector less attractive to job seekers
Evolution of the Farm Income in Andalusia
Source: Economic indicators of Andalusia (SEC-95 Methodology). Regional Ministry for Agriculture, Fisheries and Rural Development of Andalusia
The farm income by AWU in Spain, in current terms, has experienced a growth of 69.8% in the period 2000-2014, while if it is analysed in constant terms, it has slightly grown in the period considered (1.9%)
Evolution of Farm Income by AWU in Spain and Andalu sia
0,000
5,000
10,000
15,000
20,000
25,000
30,000
35,000
40,000
1990
1992
1994
1996
1998
2000
2002
2004
2006
2008
2010
2012
2014
€/A
WU
FI by AWU. Current prices in Spain FI by AWU. Constant prices in Spain
FI by AWU. Current prices in Andalusia FI by AWU. Constant prices in Andalusia

Consejería de Agricultura, Pesca y Desarrollo Rural
Consejería de Agricultura, Pesca y Desarrollo Rural
Consejería de Agricultura, Pesca y Desarrollo Rural
Consejería de Agricultura, Pesca y Desarrollo Rural
Secretaría General de Agricultura y Alimentación
Organic farming
Spain has become the EU-28 country with the largest Organic Farming area. In 2012, the Spanish share of Organic
Farming was 18.2%.
The area for Organic Farming in Spain has increased continously. In fact, the area
cultivated in 2009 was six times larger than it was in 1998.
In 2011, Spain reached the highest surface cultivated in Organic Farming. However it fell by 2.8% in 2012, and by 8.3 in 2013
compared to the previous year.
Source: Eurostat and Spanish Ministry for Agriculture, Food and Environment
Evolution % of the Organic Farming Area of the main countries of the EU-28
18.2%
12.8% 12.1%
18.5%
9.9%
12.9%
6.1%
12.3% 10.7%
9.7%
0%
2%
4%
6%
8%
10%
12%
14%
16%
18%
20%
2003 2004 2005 2006 2007 2008 2009 2010 2011 2012
Spain Italy Germany United Kingdom France
Evolution of the Organic Farming Area in Spain
1,318
1,6031,651
1,8451,757
1,610
381
988926
808733725
665
485352
269152
2440,000
0,200
0,400
0,600
0,800
1,000
1,200
1,400
1,600
1,800
2,000
1991
1995
1997
1998
1999
2000
2001
2002
2003
2004
2005
2006
2007
2008
2009
2010
2011
2012
2013
Tho
usan
d of
hec
tare
s

Consejería de Agricultura, Pesca y Desarrollo Rural
Consejería de Agricultura, Pesca y Desarrollo Rural
Consejería de Agricultura, Pesca y Desarrollo Rural
Consejería de Agricultura, Pesca y Desarrollo Rural
Secretaría General de Agricultura y Alimentación
Organic farming
Source: Eurostat and Spanish Ministry for Agriculture, Food and Environment
In 2013 Andalusia was the Spanish region with the highest organic farming surface (806,726 hectares), representing 50.1% of the national organic
farming surface.
Distribution of Organic Farming Area by Spanish r egions in 2013
Andalusia50.1%
Catalonia5.7%
Castile-La Mancha18.0%
Extremadura4.6%
Navarre3.2%
Castile and Leon2.1%
Balearic Islands1.6%
Valencian Community
3.3%
Asturias1.4%
Others2.7%
Murcia3.8%
Aragon3.7%

Consejería de Agricultura, Pesca y Desarrollo Rural
Consejería de Agricultura, Pesca y Desarrollo Rural
Consejería de Agricultura, Pesca y Desarrollo Rural
Consejería de Agricultura, Pesca y Desarrollo Rural
Secretaría General de Agricultura y Alimentación
Organic farming
Provincial distribution. Organic Farming Area 2014
Distribution by crops of the Andalusian Organic Farm ing Area. 2014
Almería5%
Cádiz15%
Córdoba13%
Granada13%
Huelva19%
Jaén17%
Málaga4% Sevilla
14%
Source: Regional Ministry of Agriculture, Fisheries and Rural Development
Cereals and pulses
Vegetables and tubers
Citrus
Fruit orchards
Olive groves
Veiney ards
Nuts
Banana plantations andsubtropical crops
Aromatic and medicalplants
33%
36%
23%
Fallow land and green cover
4.7%
Crops18.9%
Forest and wild16.0%
Grazing land, meadows and
fodder60.4%
Other crops0.02%
Evolution of the Organic Farming Area in Andalusia
225,599283,220
326,704403,360
537,269582,745
784,098
879,859946,025
806,727853,494
107,380
973,239
866,800
0,000
200,000
400,000
600,000
800,000
1000,000
1200,000
2001 2002 2003 2004 2005 2006 2007 2008 2009 2010 2011 2012 2013 2014
Hec
tare
s
Consejería de Agricultura, Pesca y Desarrollo Rural
Consejería de Agricultura, Pesca y Desarrollo Rural
Consejería de Agricultura, Pesca y Desarrollo Rural
Consejería de Agricultura, Pesca y Desarrollo Rural
Secretaría General de Agricultura y Alimentación
Organic stockbreeding
Source: Regional Ministry of Agriculture, Fisheries and Rural Development
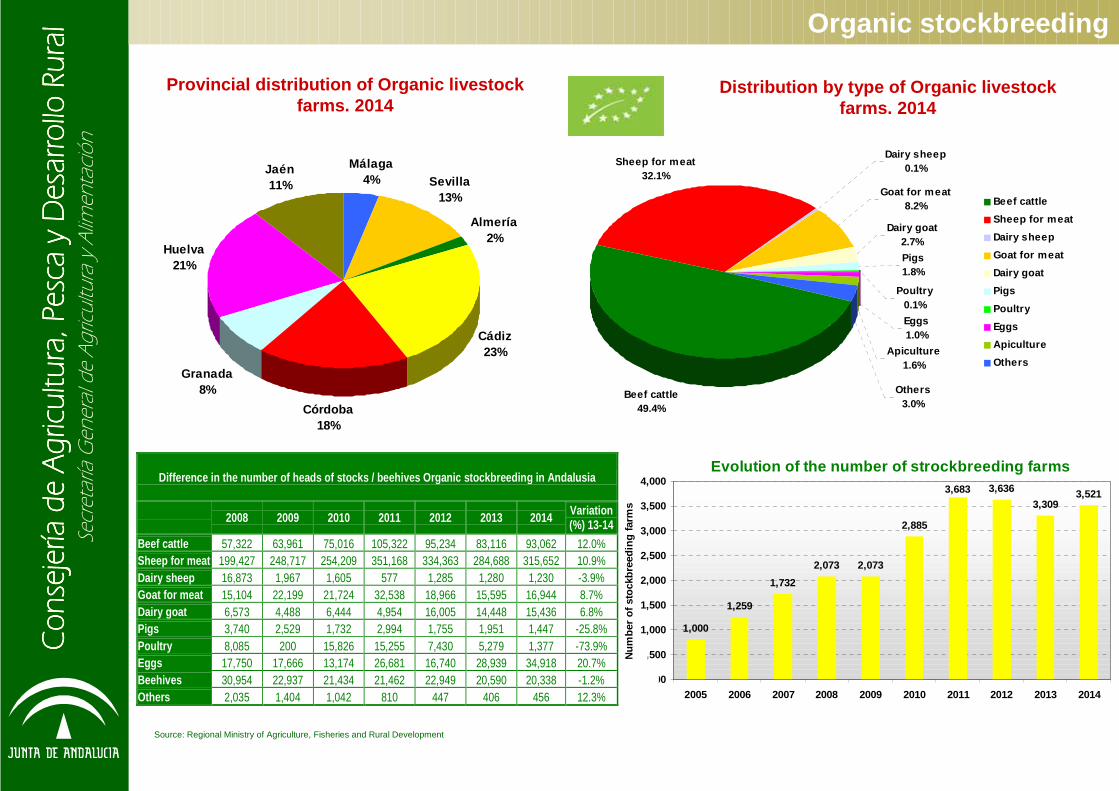
Provincial distribution of Organic livestock farms. 2014
Distribution by type of Organic livestock farms. 2014
Almería2%
Cádiz23%
Córdoba18%
Granada8%
Huelva21%
Jaén11%
Málaga4% Sevilla
13%
Beef cattle49.4%
Sheep for meat32.1%
Dairy sheep0.1%
Goat for meat8.2%
Dairy goat2.7%
Pigs1.8%
Eggs1.0%
Apiculture1.6%
Others3.0%
Poultry0.1%
Beef cattle
Sheep for meat
Dairy sheep
Goat for meat
Dairy goat
Pigs
Poultry
Eggs
Apiculture
Others
Difference in the number of heads of stocks / beehi ves Organic stockbreeding in Andalusia
2008 2009 2010 2011 2012 2013 2014 Variation
(%) 13-14
Beef cattle 57,322 63,961 75,016 105,322 95,234 83,116 93,062 12.0% Sheep for meat 199,427 248,717 254,209 351,168 334,363 284,688 315,652 10.9% Dairy sheep 16,873 1,967 1,605 577 1,285 1,280 1,230 -3.9% Goat for meat 15,104 22,199 21,724 32,538 18,966 15,595 16,944 8.7% Dairy goat 6,573 4,488 6,444 4,954 16,005 14,448 15,436 6.8% Pigs 3,740 2,529 1,732 2,994 1,755 1,951 1,447 -25.8% Poultry 8,085 200 15,826 15,255 7,430 5,279 1,377 -73.9% Eggs 17,750 17,666 13,174 26,681 16,740 28,939 34,918 20.7% Beehives 30,954 22,937 21,434 21,462 22,949 20,590 20,338 -1.2% Others 2,035 1,404 1,042 810 447 406 456 12.3%
Evolution of the number of strockbreeding farms
1,000
3,5213,309
3,636
2,885
2,0732,073
1,732
1,259
3,683
0,000
0,500
1,000
1,500
2,000
2,500
3,000
3,500
4,000
2005 2006 2007 2008 2009 2010 2011 2012 2013 2014
Num
ber
of s
tock
bree
ding
farm
s

Consejería de Agricultura, Pesca y Desarrollo Rural
Consejería de Agricultura, Pesca y Desarrollo Rural
Consejería de Agricultura, Pesca y Desarrollo Rural
Consejería de Agricultura, Pesca y Desarrollo Rural
Secretaría General de Agricultura y Alimentación
Andalusian Eco-industry
Provincial distribution of Eco-Industries 2014
Almería11%
Cádiz8%
Córdoba14%
Granada16%
Huelva5%
Málaga19%
Sevilla 19%
Jaén8%
Difference in the number of Eco-Industries in Andal usia
2008 2009 2010 2011 2012 2013 2014 Diference 13-14
Olive oil mill and/or bottlilng plant 97 110 127 150 188 210 209 -0.5% Wineries and bottling plants of wine 21 31 43 32 62 62 57 -8.1% Fresh vegetables and fruits handling and packing 97 122 143 174 210 213 212 -0.5%
Preserves and semi-preserved products and vegetable s juicies 20 39 73 76 102 108 103 -4.6%
Preparation of spices and aromatic and medicinal pl ants 46 33 28 43 41 48 43 -10.4% Bread and pasta making 4 48 62 20 55 52 52 0.0% Cookies and cakes 9 12 24 32 25 27 26 -3.7% Nutshandling and packing 18 21 31 39 51 57 56 -1.8% Frain handling and packing 5 8 15 24 24 32 36 12.5% Food preparation 4 32 35 36 44 52 44 -15.4% Slaughterhouses and cutting plants 20 15 34 41 51 38 29 -23.7% Cold meat and salted meat 8 20 27 28 28 30 22 -26.7% Milk, cheese and dairy products 7 13 18 22 33 26 27 3.8% Meat 7 26 14 17 16 14 11 -21.4% Eggs 9 14 11 27 26 16 14 -12.5% Honey 14 46 14 70 73 29 28 -3.4% Feedingstuffs 62 8 7 4 13 14 10 -28.6% Others 5 49 88 132 208 210 202 -3.8% TOTAL 453 647 794 967 1.250 1.238 1.181 -4.6%
Source: Regional Ministry of Agriculture, Fisheries and Rural Development
Evolution of number of traders
10,61210,08110,18010,203
8,4018,4448,1257,585
6,510
5,043
0,000
2,000
4,000
6,000
8,000
10,000
12,000
2005 2006 2007 2008 2009 2010 2011 2012 2013 2014
Nº
of tr
ader
s

Consejería de Agricultura, Pesca y Desarrollo Rural
Consejería de Agricultura, Pesca y Desarrollo Rural
Consejería de Agricultura, Pesca y Desarrollo Rural
Consejería de Agricultura, Pesca y Desarrollo Rural
Secretaría General de Agricultura y Alimentación
Organic sector
Source: prepared by the author on the basis of data from the Spanish Ministry for Agriculture, Food and Environment and webwites
Value of organic production 2011
The value of the Andalusian organic
production represented 41.8% of the Spanish organic production in
2011
Andalusia represented 45.0% of the value of the
Spanish organic crop production
Andalusia represented 27.4% of the value of the Spanish organic livestock
production
300
146
66740
0
100
200
300
400
500
600
700
800
900
1,000
Spain Andalucia
mill
ions
of €
Organic crop production Organic stockbreeding
340 mill €
813 mill €
The value of the Andalusian organic
production corresponding to 2012 amounted to 400
millions € , figure that represents 17.6% more than
the value of the previous year
The value of organic production showed a
strong growth between 2008 and 2011

Consejería de Agricultura, Pesca y Desarrollo Rural
Consejería de Agricultura, Pesca y Desarrollo Rural
Consejería de Agricultura, Pesca y Desarrollo Rural
Consejería de Agricultura, Pesca y Desarrollo Rural
Secretaría General de Agricultura y Alimentación
Organic sector
225 mill € of investment of the Regional Ministry
of Agriculture, Fisheries and
Environment of Andalusia
2007-2011
25,949 € of average
investment / trader
Creation of 20,000 jobs
INSTRUMENTS FOR THE GROWTH OF THE ORGANIC SECTOR
At end of 2012, the Andalusian Parliament adopted th e Non-legislative proposal for the creation of the Third Organic Farming Scheme of Andalusia 2014-2020 (III-PAAE)
This Scheme met the demands of the industry, registered in the Intermediate Evaluation of the II-PAAE 2010It consolidated the sector and became a tool to address the challenges of sustainability, food security, rural development and climate change in AndalusiaSectoral and provincial meetings with the sector was carried out. They provided guidelines and orientations for the III-PAAEIn order to expand and know the opinion of the rest of the organic production sector and citizenship, in general, a survey was carried out so as to define the limitations of the broad lines, aspects and measures of the III-PAAE
Source: Regional Ministry of Agriculture, Fisheries and Rural Development

Consejería de Agricultura, Pesca y Desarrollo Rural
Consejería de Agricultura, Pesca y Desarrollo Rural
Consejería de Agricultura, Pesca y Desarrollo Rural
Consejería de Agricultura, Pesca y Desarrollo Rural
Secretaría General de Agricultura y Alimentación
Integrated production
Source: Spanish Ministry for Agriculture, Food and Environment., Survey on Integrate Production to the Spanish regions and the Regional Ministry of Agriculture, Fisheries and Rural Development
In 2014 Andalusia had 554,399 hectares under Integrated Production conditions, 6.5% more than the
previous year. Sevilla, with 209,453, was the Andalusian province with the greatest area, followed by Jaen with 95,348 hectares and Granada with 91.529 hectares.
Provincial distribution of the integrated production area. 2014
Distribution per Spanish regions of the area cultivated under Integrated
production conditions. 2013
Between 2003-2013 the area cultivated under Integrated Production increased
sixfold in Andalusia.
Resto CCAA2%
Cataluña4%
Valencia6%Aragón
7%
Murcia3% Canarias
1%
Extremadura15%
Andalucía62%
In 2013, Spain accounted for a total of 831,702 hectares under Integrated Production conditions, 3.5% more than
the previous year.In 2013, Andalusia accounted for 62% of the Spanish total
cultivated area under Integrated Production conditions, becoming the leading region in Spain of this type of
agriculture, followed by Extremadura that represented 13% and Aragon that represented 7% of the Spanish area under
Integrated Production conditions.
Málaga9.1%
Jaén17.2% Huelva
2.0%
Granada16.5%
Córdoba11.6%
Almería1.1%Cádiz4.9%
Sevilla37.8%
Evolution of the area cultivated under Integrated P roduction conditions in Andalusia
0,000
100,000
200,000
300,000
400,000
500,000
600,000
2003 2004 2005 2006 2007 2008 2009 2010 2011 2012 2013 2014
Are
a (h
ecta
res)

Consejería de Agricultura, Pesca y Desarrollo Rural
Consejería de Agricultura, Pesca y Desarrollo Rural
Consejería de Agricultura, Pesca y Desarrollo Rural
Consejería de Agricultura, Pesca y Desarrollo Rural
Secretaría General de Agricultura y Alimentación
Integrated production
Source: Register of Integrated Production in Andalusia 2012. Regional Ministry of Agriculture, Fisheries and Rural Development. Progress of the areas and productions of the same Ministry, October 2014
Distribution per crops. Integrated Production area 2014
Olive groves represented 72% of the
total area under Integrated Production
conditions in Andalusia in 2014. 28% of
Ansalusian olive grovesare cultivated under
Integrated Production conditions
Evolution of the area of the main crops cultivated under Integrated Production conditions in Andalusia
Cotton9%
Rice7%
Strawberries1%
Olive groves72%
Rest of crops11%
Cotton represents 9%of the area cultivated under Integrated
Production conditions. 82% of the cotton
cultivated in Andalusia in 2014 was grown under Integrated
Production conditions
Rice represents 7%of the area cultivated under Integrated
Production conditions. 94% of the rice
cultivated in Andalusia in 2014 was grown under Integrated
Production conditions
70% of strawberries
grown in Andalusia in 2014 were grown under
Integrated Production conditions
0,000
50,000
100,000
150,000
200,000
250,000
300,000
350,000
400,000
450,000
2003 2004 2005 2006 2007 2008 2009 2010 2011 2012 2013 2014
Are
a (h
ecta
res)
Cotton Rice Strawberries Olive groves Rest of crops
Consejería de Agricultura, Pesca y Desarrollo Rural
Consejería de Agricultura, Pesca y Desarrollo Rural
Consejería de Agricultura, Pesca y Desarrollo Rural
Consejería de Agricultura, Pesca y Desarrollo Rural
Secretaría General de Agricultura y Alimentación
Conservation agricultureEvolution of the area cultivated under conservation
techniques
Area by type of crop using conservation techniques. 2010
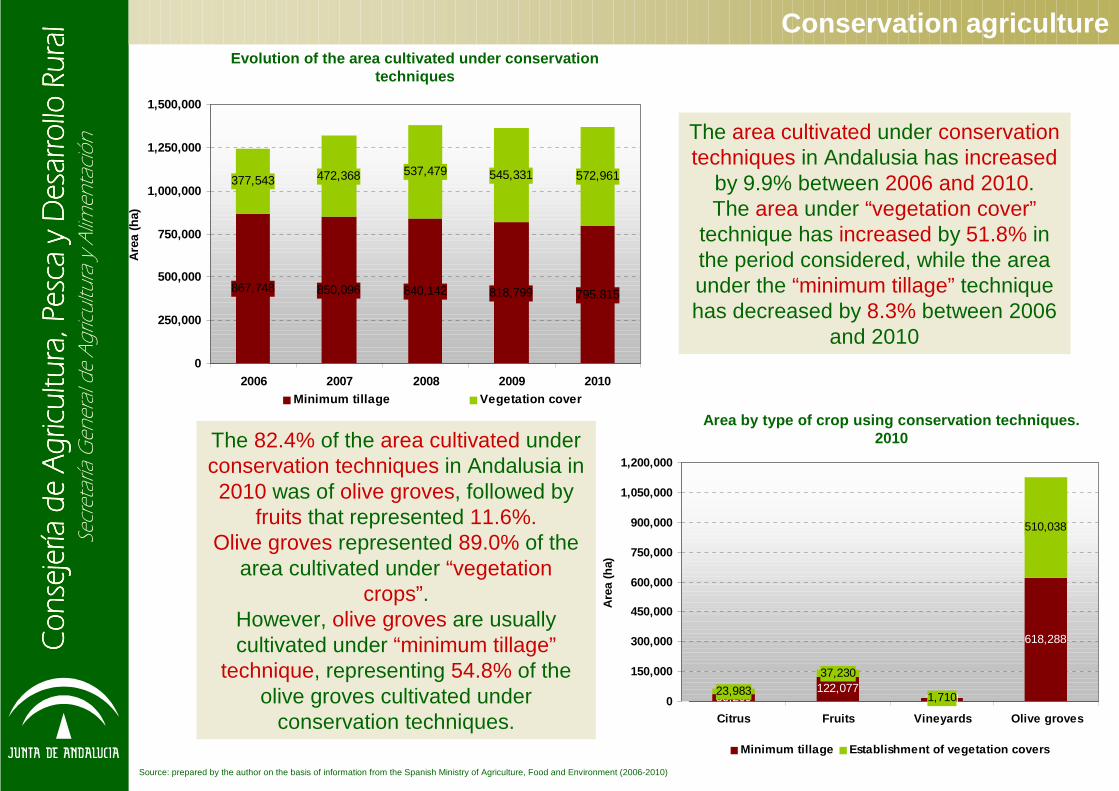
The area cultivated under conservation techniques in Andalusia has increased
by 9.9% between 2006 and 2010.The area under “vegetation cover”
technique has increased by 51.8% in the period considered, while the area under the “minimum tillage” technique has decreased by 8.3% between 2006
and 2010
The 82.4% of the area cultivated under conservation techniques in Andalusia in 2010 was of olive groves, followed by
fruits that represented 11.6%.Olive groves represented 89.0% of the
area cultivated under “vegetation crops”.
However, olive groves are usually cultivated under “minimum tillage”
technique, representing 54.8% of the olive groves cultivated under
conservation techniques.
Source: prepared by the author on the basis of information from the Spanish Ministry of Agriculture, Food and Environment (2006-2010)
867,748 850,096 840,142 818,799 795,815
377,543 472,368 537,479 545,331 572,961
0
250,000
500,000
750,000
1,000,000
1,250,000
1,500,000
2006 2007 2008 2009 2010
Are
a (h
a)
Minimum tillage Vegetation cover
38,209122,077
17,241
618,288
23,983
37,230
1,710
510,038
0
150,000
300,000
450,000
600,000
750,000
900,000
1,050,000
1,200,000
Citrus Fruits Vineyards Olive groves
Are
a (h
a)
Minimum tillage Establishment of vegetation covers

Consejería de Agricultura, Pesca y Desarrollo Rural
Consejería de Agricultura, Pesca y Desarrollo Rural
Consejería de Agricultura, Pesca y Desarrollo Rural
Consejería de Agricultura, Pesca y Desarrollo Rural
Secretaría General de Agricultura y Alimentación
The most important sub-sectors
Olive growing• 1.5 million hectares (more than 578,000 hectares are irrigated)
• 2,400 million € is the value of production (2,150 M€ corresponds to olive oil and 250 M€ to tableolives)
• 24% of the value of agricultural production corresp onds to olive growing
• There are more than 800 olive mills and 200 seasoni ng plants
• It is the main activity of more than 300 towns and 250,000 households
Law for olive growing of Andalusia
to promote and improve the sector
1,200,000 tons of olive oil...
...almost 40% of total world production
380,000 tons oftable olives ...
...almost 20% of total world production
28% of the Andalusian agri-food exports:
• 1,200 million € of olive oil (21%)
• 420 million € of table olives (7%)

Consejería de Agricultura, Pesca y Desarrollo Rural
Consejería de Agricultura, Pesca y Desarrollo Rural
Consejería de Agricultura, Pesca y Desarrollo Rural
Consejería de Agricultura, Pesca y Desarrollo Rural
Secretaría General de Agricultura y Alimentación
The most important sub-sectors
Fruits
In 2012 the production of fruits in Andalusia was 2,37 Million tonnes, with a value of 1,823 Million €, which represented 30% of the value of the Spanish production of fruits in the same year.
In 2012 the area dedicated to cultivate fruit trees in Andalusia was 123,903 hectares (without counting 162,861 hectares of almond trees), which represented 15% of the Spanish area(almond trees included) and 2% of the European Union area cultivated under these crops.
12.806 ha440 M€
9.329 ha104 M€
3.477 ha47 M€
27.814 ha548 M€ 35.764 ha
534 M€
21.816 ha241 M€
11.134 ha208 M€
1.763 ha301 M€In 2013 Huelva was leader by
value of production
The value of the production of fruits in Andalusia in 2013 was 2,459 Million €, 35% higher than the previous year (1.823 Million €).
Sources:
Report of the progresses of areas and production of The Regional Ministry for Agriculture, Fisheries and Rural Development of Andalusia, 2012.
Agricultural economic indicators of Andalusia, 2012-2013.
Survey of Areas and yield. Spanish Ministry for Agriculture, Food and Environment, 2013.
Spanish Office for National Statistics.
FAO.
0%
5%
10%
15%
20%
25%
30%
Almería Cádiz Córdoba Granada Huelva Jaén Málaga Sevilla
% Fruits area % Value of the production of fruits

Consejería de Agricultura, Pesca y Desarrollo Rural
Consejería de Agricultura, Pesca y Desarrollo Rural
Consejería de Agricultura, Pesca y Desarrollo Rural
Consejería de Agricultura, Pesca y Desarrollo Rural
Secretaría General de Agricultura y Alimentación
The most important sub-sectors
Vegetables
Vegetables produced in Andalusia in 2012: 5.18 million tons, with a value of 2,743 million €, that accounted for 37.4% of the value of the Spanish production of vegetables in 2012
The area of vegetables in Andalusia in 2012 amounted to 115,191 hectares, what represents about 53% of the Spanish area and 5% of the Community area in which these crops are cultivated
6,786 ha83 M€
47,601 ha1,777 M€
7,834 ha152 M€
8,919 ha15 M€ 9,919 ha
147 M€
8,874 ha160 M€
22,375 ha579 M€
2,883 ha22 M€
In 2013 Almería was leader by value and production
The value of the production of vegetables in Andalusia in 2013 was 2,933 Million €, 7% higher than the previous year (2,743 Million €).
Sources:
Report of the progresses of areas and production of The Regional Ministry for Agriculture, Fisheries and Rural Development of Andalusia, 2012.
Agricultural economic indicators of Andalusia, 2012-2013.
Survey of Areas and yield. Spanish Ministry for Agriculture, Food and Environment, 2013.
Spanish Office for National Statistics.
FAO.
0%
10%
20%
30%
40%
50%
60%
70%
Almería Cádiz Córdoba Granada Huelva Jaén Málaga Sevilla
% Vegetables area % Value of the production of vegetables

Consejería de Agricultura, Pesca y Desarrollo Rural
Consejería de Agricultura, Pesca y Desarrollo Rural
Consejería de Agricultura, Pesca y Desarrollo Rural
Consejería de Agricultura, Pesca y Desarrollo Rural
Secretaría General de Agricultura y Alimentación
The most important sub-sectors
Fruits and vegetables⇒ Great diversity of productions:
⇒ Outdoors: Citrus, Stone fruits, Tropical fruits, Vegetables...
⇒ In Glasshouses: Vegetables and Strawberries (Almería and Huelva)
⇒ Andalusia is the main area that supplies the European Union:3,526,669 tonnes and 3,493 Million € in 2014.
High value of the exports of products grown in greenhouse2:
Tomato 2014: 659 M€, -1.4% 2013
Pepper 2014: 358 M€, -3.7% 2013
Cucumber 2014: 535 M€, +7.3% 2013
Strawberry 2014: 417 M€, -10.6% 2013
Evolution of the Andalusian exports value of fruits and vegetables
0
100
200
300
400
500
600
700
800
2001 2002 2003 2004 2005 2006 2007 2008 2009 2010 2011 2012 2013 2014
Mill
ion
€
Tomato Pepper Cucumber Strawberry
(1) Source: DataComex. Exports Andalusia-EU-28. Chapter 7 and 8. Data 2014(2) Source: DataComex. Exports Andalusia-EU-28. Data 2014

Consejería de Agricultura, Pesca y Desarrollo Rural
Consejería de Agricultura, Pesca y Desarrollo Rural
Consejería de Agricultura, Pesca y Desarrollo Rural
Consejería de Agricultura, Pesca y Desarrollo Rural
Secretaría General de Agricultura y Alimentación
Almería44%
Granada18%
Huelva7%
Málaga12% Sevilla
10%
Córdoba6%
Cádiz3%
Fruits and Vegetables
OFVP’s legal form OFVP sectors
105 OFVP
OFVP per province
43
15
Producers per province
The most important sub-sectors
4215
1325
5
2
3
Agricultural processing company
50%
Limited liability company
1%
Limited company
1%
Andalusian cooperative
47%
Civil labour company
1%
Fruits and vegetables 58%
Fruits 23%
Vegetables2%
Products of processing
2%Citrus
9%
Nuts 6%
Source: Regional Ministry of Agriculture, Fisheries and Rural Development of Andalusia. Data 11/03/2013

Consejería de Agricultura, Pesca y Desarrollo Rural
Consejería de Agricultura, Pesca y Desarrollo Rural
Consejería de Agricultura, Pesca y Desarrollo Rural
Consejería de Agricultura, Pesca y Desarrollo Rural
Secretaría General de Agricultura y Alimentación
The importance of irrigation in Andalusia
Irrigation farming
Cultivated area3,183,567 ha
Dry farming
Source: Report on Andalusian irrigated areas for 2015. Data from the Inventory of irrigated areas of Andalusia 2008 and Yearbook of Agricultural and Fisheries Statistics 2004-2008. Regional Ministry of Agriculture, Fisheries and Rural Development. Agricultural census 2009, Spanish Ministry of Agriculture and Environment areas
Crops production 20137,948 mill €
Usable agricultural area
4,402,760 ha
Final agricultural production 20139,831 mill €
24%
63%
13%
Jobs 260,000 AWU
5%
40% 55%
CAP aid 2014 1,593 mill €
Stockbreeding
15%
63%
22%
26%
74%75%
25%
76%
24%
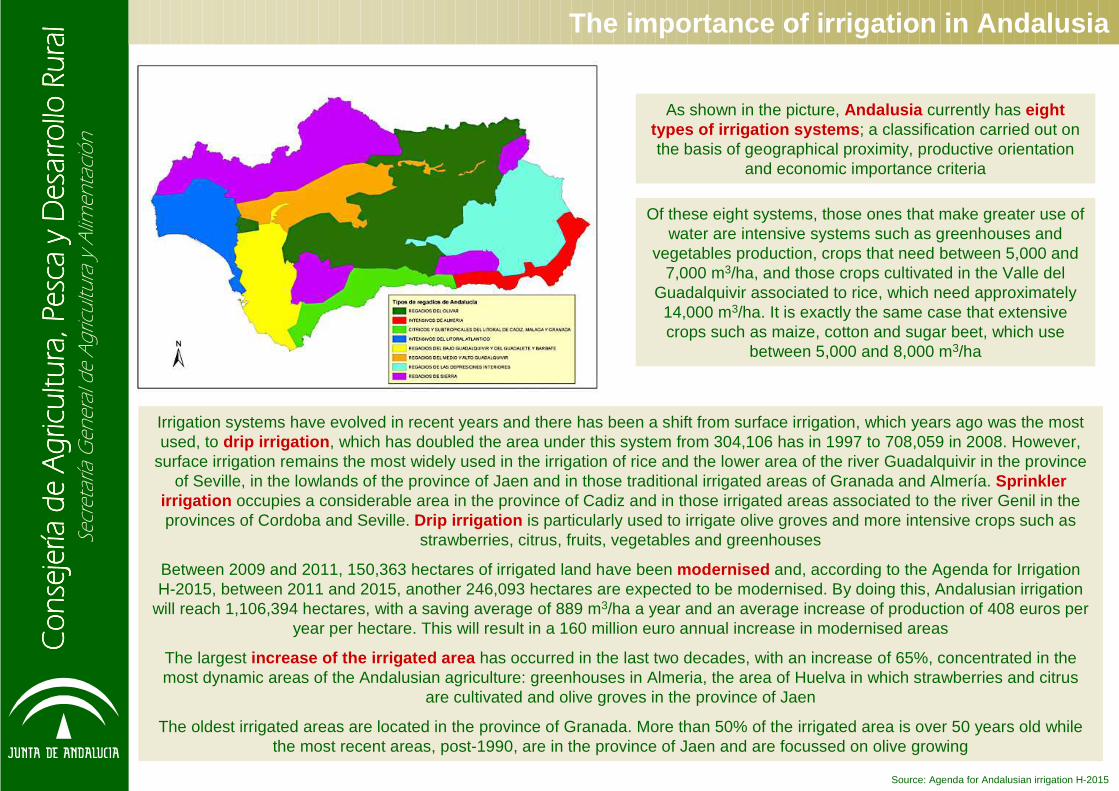
Consejería de Agricultura, Pesca y Desarrollo Rural
Consejería de Agricultura, Pesca y Desarrollo Rural
Consejería de Agricultura, Pesca y Desarrollo Rural
Consejería de Agricultura, Pesca y Desarrollo Rural
Secretaría General de Agricultura y Alimentación
The importance of irrigation in Andalusia
Source: Agenda for Andalusian irrigation H-2015
As shown in the picture, Andalusia currently has eight types of irrigation systems ; a classification carried out on the basis of geographical proximity, productive orientation
and economic importance criteria
Irrigation systems have evolved in recent years and there has been a shift from surface irrigation, which years ago was the mostused, to drip irrigation , which has doubled the area under this system from 304,106 has in 1997 to 708,059 in 2008. However,
surface irrigation remains the most widely used in the irrigation of rice and the lower area of the river Guadalquivir in the province of Seville, in the lowlands of the province of Jaen and in those traditional irrigated areas of Granada and Almería. Sprinkler
irrigation occupies a considerable area in the province of Cadiz and in those irrigated areas associated to the river Genil in the provinces of Cordoba and Seville. Drip irrigation is particularly used to irrigate olive groves and more intensive crops such as
strawberries, citrus, fruits, vegetables and greenhouses
Between 2009 and 2011, 150,363 hectares of irrigated land have been modernised and, according to the Agenda for Irrigation H-2015, between 2011 and 2015, another 246,093 hectares are expected to be modernised. By doing this, Andalusian irrigation
will reach 1,106,394 hectares, with a saving average of 889 m3/ha a year and an average increase of production of 408 euros per year per hectare. This will result in a 160 million euro annual increase in modernised areas
The largest increase of the irrigated area has occurred in the last two decades, with an increase of 65%, concentrated in the most dynamic areas of the Andalusian agriculture: greenhouses in Almeria, the area of Huelva in which strawberries and citrus
are cultivated and olive groves in the province of Jaen
The oldest irrigated areas are located in the province of Granada. More than 50% of the irrigated area is over 50 years old while the most recent areas, post-1990, are in the province of Jaen and are focussed on olive growing
Of these eight systems, those ones that make greater use of water are intensive systems such as greenhouses and
vegetables production, crops that need between 5,000 and 7,000 m3/ha, and those crops cultivated in the Valle del
Guadalquivir associated to rice, which need approximately 14,000 m3/ha. It is exactly the same case that extensive crops such as maize, cotton and sugar beet, which use
between 5,000 and 8,000 m3/ha

Consejería de Agricultura, Pesca y Desarrollo Rural
Consejería de Agricultura, Pesca y Desarrollo Rural
Consejería de Agricultura, Pesca y Desarrollo Rural
Consejería de Agricultura, Pesca y Desarrollo Rural
Secretaría General de Agricultura y Alimentación
The current situation of Fisheries in Andalusia
1,619 fishing vessels
32 ports43 fish processing
companies registered
25 computerized fish markets
5 centres for research and
training
112 aquaculture businesses
22,583 jobs35% of direct employment
Source: System of Socioeconomic indicators of the Fisheries sector of Andalusia. 2010. Regional Ministry for Agriculture, Fisheries and Rural Development of Andalusia

Consejería de Agricultura, Pesca y Desarrollo Rural
Consejería de Agricultura, Pesca y Desarrollo Rural
Consejería de Agricultura, Pesca y Desarrollo Rural
Consejería de Agricultura, Pesca y Desarrollo Rural
Secretaría General de Agricultura y Alimentación
The Agri-food sector
Source: EUROSTAT
Evolution in % of the GVA in the agri-food industry by country compared to EU28
0%
2%
4%
6%
8%
10%
12%
14%
16%
18%
20%
2003 2004 2005 2006 2007 2008 2009 2010 2011 2012 2013 2014
France Italy Spain Germany
The Spanish agri-food sector has decreased its share in the Gross
Value Added contributed by EU28 agri-food sector during the period 2001-2014, although it showed
some fluctuations.
The Spanish agri-food industry is the third leading industry by
importance in the EU28, being France and Italy the leading
countries.
Evolution of the agri-food industry GVA
0,000
5,000
10,000
15,000
20,000
25,000
30,000
35,000
2003 2004 2005 2006 2007 2008 2009 2010 2011 2012 2013 2014
Mill
ions
€
France Italy Spain Germany

Consejería de Agricultura, Pesca y Desarrollo Rural
Consejería de Agricultura, Pesca y Desarrollo Rural
Consejería de Agricultura, Pesca y Desarrollo Rural
Consejería de Agricultura, Pesca y Desarrollo Rural
Secretaría General de Agricultura y Alimentación
The Agri-food sector
The Andalusian agri-food industry is the second leading sector, being the Catalonian the leading one. However, the Andalusian agri-food industry has a greater potential
due to its outstanding primary sector
Two activities accounted for 43% of production value in 2013:
• Oil and fat industry (27.8%)
• Meat processing industry (10.2%)
• Investment of 68.78 million € in innovation (7.68% of the budget for the Strategic Plan for the Andalusian agri-food industry, Horizon 2013. 2008-2013)
• Increase of 96.9% of the value of the agri-food trad e balance in the period 2000-2013 (Andalusia-worldwide)
Source: Spanish Office for National Statistics and Andalusian Institute for Statistics
In 2013, with regard to Operating Incomes, the agri-food sector is the second industrial leading sector in Andalusia, representing 19.7%. The leading industrial sector is the oil,
energy and water extractive sector, that represents 47% of the total operating incomes.
Incomes of the agri-food industry per region. 2013
Andalucía13%
Castilla y León9%
C.Valenciana8%
Castilla - La Mancha
8% Galicia8%
Murcia5%Madrid
4%
Resto20%
Cataluña25%

Consejería de Agricultura, Pesca y Desarrollo Rural
Consejería de Agricultura, Pesca y Desarrollo Rural
Consejería de Agricultura, Pesca y Desarrollo Rural
Consejería de Agricultura, Pesca y Desarrollo Rural
Secretaría General de Agricultura y Alimentación
The Andalusian agri-food sector increased its share in the national sector during the period 2001-2007. Since 2008, a slightly decrease was registered
In 2013 in Andalusia, the agri-food sector was the second Industrial Sector concerning the value of the production marketed.
The Agri-food sector in Andalusia
In Andalusia, the agri-food industry was(*) the first industrial sector. Concerning the value of the marketed production, it grew progressively at an average rate of 13.7% every year (2003-2005), what represents more than the double of the Spanish agri-food sector (6.2%). Since 2006, the inter-annual
growth significantly decreased to values around 4.5%. In 2008, the growth hardly reached 0.8%compared to 2007. In 2009, the value of the agri-food production decreased at national and
Andalusian levels for the first time. In 2010, the value of the agri-food production recovered, being higher at Spanish level than at Andalusian level
Source: Andalusian Institute of Statistics. Industrial survey of products. Results for Andalusia
Andalusia Spain
Value of agri-food production
(thousands of €)
Share in the total Andalusian industry
sector (%)
Value of agri-food production
(thousands of €)
Share in the total Spanish industry
sector (%)
Share of the Andalusian agri-food
sector at national level (%)
2001 7,718,623 29.5% 54,258,846 18.3% 14.2% 2002 8,398,603 30.2% 56,774,978 18.1% 14.8% 2003 8,732,858 28.8% 60,139,616 18.3% 14.5% 2004 10,305,841 29.9% 65,420,845 18.5% 15.8% 2005 11,266,645 27.0% 67,750,635 17.8% 16.6% 2006 11,796,462 25.2% 71,147,482 17.6% 16.6% 2007 12,315,522 25.3% 75,877,155 17.1% 16.2% 2008 12,413,456 25.9% 78,961,960 18.3% 15.7% 2009 11,092,008 29.7% 72,985,273 21.7% 15.2% 2010 11,581,013 28.0% 74,989,075 20.8% 15.4%
2011 11,785,850 25.2% 78,638,162 20.6% 15.0%
2012 12,171,075 25.2% 81,505,495 21.6% 14.9% 2013 10,909,224 24.5% 81,816,857 22.1% 13.3%

Consejería de Agricultura, Pesca y Desarrollo Rural
Consejería de Agricultura, Pesca y Desarrollo Rural
Consejería de Agricultura, Pesca y Desarrollo Rural
Consejería de Agricultura, Pesca y Desarrollo Rural
Secretaría General de Agricultura y Alimentación
Importance of the Andalusian Agri-food sector
According to the Industrial survey of the Spanish Office for National Statistics,
the Andalusian agri-food sector accounts for about 22.7% of industrial
incomes.
The Andalusian agri-food sector created about 21% of industrial jobs in the period 2000-2008 (it created more
than 50,000 jobs) and about 23%between 2009 and 2013.
In 2009, the number of jobs in theAndalusian agri-food sector decreased
by 6.7% compared to 2008.
In 2010, a recovery of 0.9% was registered. In 2011, the number of jobsof this sector decreased by 4.4%, and
in 2012 it returned to fall again by 5.0%.
In 2013, the Andalusian agri-food had lost 10.2% of jobs in comparison to
2008
The Agri-food sector in Andalusia
Source: Spanish Office for National Statistics
Evolution of the Andalusian agri-food incomes 2001- 2013
14,133
10,397
0,000
2,000
4,000
6,000
8,000
10,000
12,000
14,000
16,000
2001 20002 2003 2004 2005 2006 2007 2008 2009 2010 2011 2012 2013
Mill
ions
€
Evolution of the number of people employed in the a gri-food sector in Andalusia
47,170
53,856
0,000
10,000
20,000
30,000
40,000
50,000
60,000
2000 2001 2002 2003 2004 2005 2006 2007 2008 2009 2010 2011 2012 2013
num
ber
of p
eopl
e em
ploy
ed

Consejería de Agricultura, Pesca y Desarrollo Rural
Consejería de Agricultura, Pesca y Desarrollo Rural
Consejería de Agricultura, Pesca y Desarrollo Rural
Consejería de Agricultura, Pesca y Desarrollo Rural
Secretaría General de Agricultura y Alimentación
The gross value added generated by the Andalusian industry decreased by
5.5% in 2010 compared to 2008, although in 2011, there was a recovery
in which the Andalusian GVA of the industry grew by 5.6% compared to the GVA of the previous year. In 2013 the
GVA was1.2% lower than it was in2012.
However, the GVA of the Andalusian agrifood industry grew by 1.9% in the
period 2008-2011
The GVA of the Andalusian agrifood industry accounted for 19.0% of the
total GVA of the Andalusian industryin 2008, slightly increasing in
subsequent years
The Agri-food sector in Andalusia
The GVA of the Andalusian agrigood industry represented about 12.4% of the Spanish agrifood GVA in 2011.
In addition, the GVA of the Andalusian industry represented about 9.9% of the GVA of the Spanish industry in 2013
Source: Spanish Office for National Regional accountability of Spain. Results of Andalusia
Evolution of the %GVA of the Andalusian industry co mpared to the GVA of the Spanish industry
9.9%9.9%
9.4%
9.0% 9.5% 9.6%
12.4%12.9%12.7%
12.7%
0%
2%
4%
6%
8%
10%
12%
14%
2008 2009 2010 2011 2012 2013
% GVA of the Andalusian agro-industry / GVA of the Spanish industry
% GVA of the Andalusian industry / GVA of the Spani sh agro-industry
Evolution of GVA of the Andalusian industry
16,08716,27615,788
14,948
13,502
15,811
3,055
3,030
2,996
2,928
0,000
2,000
4,000
6,000
8,000
10,000
12,000
14,000
16,000
18,000
2008 2009 2010 2011 2012 2013
Milli
ons
€
Industry Agro-industry

Consejería de Agricultura, Pesca y Desarrollo Rural
Consejería de Agricultura, Pesca y Desarrollo Rural
Consejería de Agricultura, Pesca y Desarrollo Rural
Consejería de Agricultura, Pesca y Desarrollo Rural
Secretaría General de Agricultura y Alimentación
The number ofAndalusian agri-food industries, including those for vegetables
handling, slightly decreased between
2004-2006. Since then, an increase can be
observed
Olive oil and meat businesses together with horticultural centres, including those for
vegetables handling, predominate by number, among the Andalusian Agri-food sector.
Seville is the province in which there is a greater number of food processing industries, in which canning and seasoning industries stand out, as
they represent 18% of the facilities
The Agri-food sector in Andalusia
Source: Register of Agri-food industries
Distribution per provinces of the Andalusian agri-f ood companies. 31 December 2014
Córdoba15%
Granada13%
Sevilla18%
Almería8%Cádiz
10%
Málaga13%
Huelva10%
Jaén13%
Distribution per sub-sectors of the Andalusian agri -food companies. 31 December 2014
Wines10.4%
Feedingstuffs6.4%
Seasoning6.4%
Horticultural centres23.8%
Oils19.0%
Other industries18.8%
Meat15.0%
Evolution of the number of agri-food companies in A ndalusia
0,000
1,000
2,000
3,000
4,000
5,000
6,000
7,000
2000 2001 2002 2003 2004 2005 2006 2007 2008 2009 2010 2011 2012 2013 2014
num
ber o
f com
pani
es

Consejería de Agricultura, Pesca y Desarrollo Rural
Consejería de Agricultura, Pesca y Desarrollo Rural
Consejería de Agricultura, Pesca y Desarrollo Rural
Consejería de Agricultura, Pesca y Desarrollo Rural
Secretaría General de Agricultura y Alimentación
In 2013 Andalusia was the Spanish region with a higher number of agri-food companies, followed by Catalonia.
Source: MERCASA
The Agri-food sector in Andalusia
Distribution of Spanish agri-food companies by regi ons. 2013
1,0120,650
0,942
0,385
2,391
3,0743,408
1,474
1,987
1,383
2,359
0,4790,743 0,643
1,4101,056
5,301
0,000
1,000
2,000
3,000
4,000
5,000
6,000
And
aluc
ía
Ara
gón
Ast
uria
s
Can
aria
s
Can
tabr
ia
Cas
tilla
la M
anch
a
Cas
tilla
Leó
n
Cat
aluñ
a
Mad
rid
Val
enci
a
Ext
rem
adur
a
Gal
icia
Bal
eare
s
La R
ioja
Nav
arra
Paí
s V
asco
Mur
cia
Num
ber o
f com
pani
es

Consejería de Agricultura, Pesca y Desarrollo Rural
Consejería de Agricultura, Pesca y Desarrollo Rural
Consejería de Agricultura, Pesca y Desarrollo Rural
Consejería de Agricultura, Pesca y Desarrollo Rural
Secretaría General de Agricultura y Alimentación
Quality designations
12 PDO
EXTRA VIRGIN OLIVE OIL
2 PDO2 PGI1 GTE
HAMS AND SHOULDERS
1 PDO2 PGI
FRUITS AND VEGETABLES
6 PDO2 Quality wines
16 wines of the region
WINES
3 PDO
VINEGARS
1 PGI5 GI
SPIRITS
3 PDO4 PGI2 GTE
OTHER PRODUCTS
PDO: Protected Designation of Origin
PGI: Protected Geographical Indication
GTE: Guaranteed Traditional Specialty
GI: Geographical Indication
The Agri-food sector in Andalusia
Source: Regional Ministry of Agriculture, Fisheries and Rural Development

Consejería de Agricultura, Pesca y Desarrollo Rural
Consejería de Agricultura, Pesca y Desarrollo Rural
Consejería de Agricultura, Pesca y Desarrollo Rural
Consejería de Agricultura, Pesca y Desarrollo Rural
Secretaría General de Agricultura y Alimentación
EXTRA VIRGIN OLIVE OIL
Source: Regional Ministry of Agriculture, Fisheries and Environment of Andalusia.
Area registered under extra virgin olive oil PDO. 2012
462,553 hectares
Production of extra virgin olive oil covered under PDO. 2012
144,673 tonnes
Production of extra virgin olive oil marketed under PDO. 2012
37,239 tonnes70% Spain
Markets 26% European Union
4% Other countries
Value of the production of extra virgin olive oil marketed under PDO. 2012
113.76 million €71% Spain
Markets 24% European Union
5% Other countries
Source: Regulatory board of the PDO of extra virgin olive oil
The Agri-food sector in Andalusia. Quality Designati ons

Consejería de Agricultura, Pesca y Desarrollo Rural
Consejería de Agricultura, Pesca y Desarrollo Rural
Consejería de Agricultura, Pesca y Desarrollo Rural
Consejería de Agricultura, Pesca y Desarrollo Rural
Secretaría General de Agricultura y Alimentación
Source: Regional Ministry for Agriculture, Fisheries and Rural Development of Andalusia and Source: Regulatory board of the Andalusian PDO of wines
WINESUnder PDO
Area registered under PDO wines. 2011-2012
17,291 hectares
Production of wine covered under PDO. 2011-2012
581,152 hectolitres
Production of wine marketed under PDO. 2011-2012
723,293 hectolitres 55% Spanish market
45% Exports
Value of the production of wine marketed under PDO. 2011-2012
82.5 mill € (sales in Spain)
92.5 mill € (sales abroad)
The Agri-food sector in Andalusia. Quality Designati ons

Consejería de Agricultura, Pesca y Desarrollo Rural
Consejería de Agricultura, Pesca y Desarrollo Rural
Consejería de Agricultura, Pesca y Desarrollo Rural
Consejería de Agricultura, Pesca y Desarrollo Rural
Secretaría General de Agricultura y Alimentación
Source:Regional Ministry of Agriculture, Fisheries and Rural Development of Andalusia and Regulatory boards of the Andalusian PDO of wines
WINES under PGI
Area registered under PGI wines. 2011-2012
648 hectares
Production of wine covered under PGI. 2011-2012
20,467 hectolitres
Production of wine marketed under PGI. 2011-2012
14,147 hectolitres 85% Spanish market
15% Exports
Value of the production of wine marketed under PGI. 2011-2012
4.5 million € 80% Spanish market
20% Exports
The Agri-food sector in Andalusia. Quality Designati ons

Consejería de Agricultura, Pesca y Desarrollo Rural
Consejería de Agricultura, Pesca y Desarrollo Rural
Consejería de Agricultura, Pesca y Desarrollo Rural
Consejería de Agricultura, Pesca y Desarrollo Rural
Secretaría General de Agricultura y Alimentación
VINEGARS
15(*) Wineries that produce vinegars under PDO. 2012
Production of 54,851 hectolitres of vinegar covered under PDO. 2012
Production of vinegar marketed under PDO. 2012
72,750 hectolitres 69% Spanish market
28% European union
3% Other countries
Source:Regional Ministry of Agriculture, Fisheries and Rural Development of Andalusia and Regulatory boards of the Andalusian PDO of vinegars
The Agri-food sector in Andalusia. Quality Designati ons
(*) Wineries belonging to PDO Montilla-Moriles were not taken into account, because they had not any production in 2012.

Consejería de Agricultura, Pesca y Desarrollo Rural
Consejería de Agricultura, Pesca y Desarrollo Rural
Consejería de Agricultura, Pesca y Desarrollo Rural
Consejería de Agricultura, Pesca y Desarrollo Rural
Secretaría General de Agricultura y Alimentación
HAMS AND SHOULDERS
The Agri-food sector in Andalusia. Quality Designati ons
1,643 farms registered in the PDO for hams and shoulders 2012
96,374 hams 2012
96,418 shoulders 2012
Units marketed by PDO and PGI for hams and shoulders. 2012
182,690 hams
49,031 shoulders
Value of the hams and shoulders marketed under the PDO and PGI.
2012
Hams: 21.8 million €
Shoulders: 3.1 million €
Source:Regional Ministry of Agriculture, Fisheries and Rural Development of Andalusia and Regulatory boards of the Andalusian PDO and PGI of Hams and Shoulders
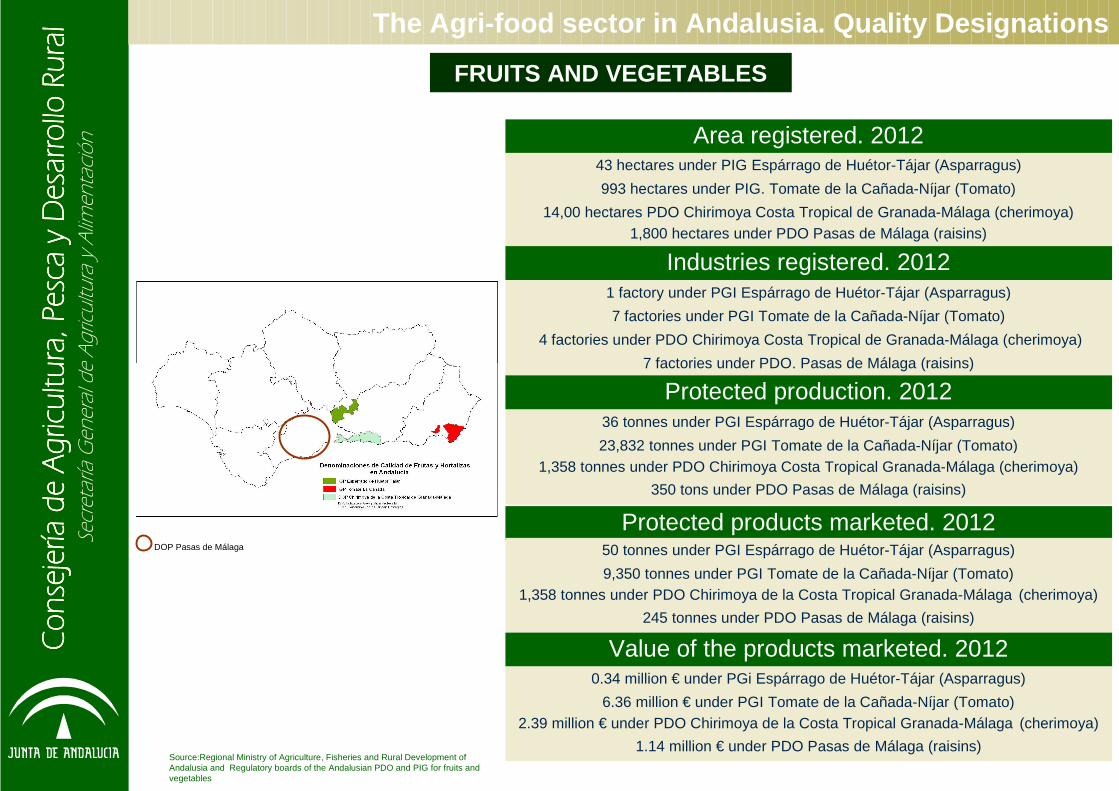
Consejería de Agricultura, Pesca y Desarrollo Rural
Consejería de Agricultura, Pesca y Desarrollo Rural
Consejería de Agricultura, Pesca y Desarrollo Rural
Consejería de Agricultura, Pesca y Desarrollo Rural
Secretaría General de Agricultura y Alimentación
FRUITS AND VEGETABLES
Area registered. 201243 hectares under PIG Espárrago de Huétor-Tájar (Asparragus)
993 hectares under PIG. Tomate de la Cañada-Níjar (Tomato)
14,00 hectares PDO Chirimoya Costa Tropical de Granada-Málaga (cherimoya) 1,800 hectares under PDO Pasas de Málaga (raisins)
Industries registered. 20121 factory under PGI Espárrago de Huétor-Tájar (Asparragus)
7 factories under PGI Tomate de la Cañada-Níjar (Tomato)
4 factories under PDO Chirimoya Costa Tropical de Granada-Málaga (cherimoya)
7 factories under PDO. Pasas de Málaga (raisins)
Protected production. 201236 tonnes under PGI Espárrago de Huétor-Tájar (Asparragus)
23,832 tonnes under PGI Tomate de la Cañada-Níjar (Tomato) 1,358 tonnes under PDO Chirimoya Costa Tropical Granada-Málaga (cherimoya)
350 tons under PDO Pasas de Málaga (raisins)
Protected products marketed. 201250 tonnes under PGI Espárrago de Huétor-Tájar (Asparragus)
9,350 tonnes under PGI Tomate de la Cañada-Níjar (Tomato) 1,358 tonnes under PDO Chirimoya de la Costa Tropical Granada-Málaga (cherimoya)
245 tonnes under PDO Pasas de Málaga (raisins)
Value of the products marketed. 20120.34 million € under PGi Espárrago de Huétor-Tájar (Asparragus)
6.36 million € under PGI Tomate de la Cañada-Níjar (Tomato) 2.39 million € under PDO Chirimoya de la Costa Tropical Granada-Málaga (cherimoya)
1.14 million € under PDO Pasas de Málaga (raisins)Source:Regional Ministry of Agriculture, Fisheries and Rural Development of Andalusia and Regulatory boards of the Andalusian PDO and PIG for fruits and vegetables
DOP Pasas de Málaga
The Agri-food sector in Andalusia. Quality Designati ons

Consejería de Agricultura, Pesca y Desarrollo Rural
Consejería de Agricultura, Pesca y Desarrollo Rural
Consejería de Agricultura, Pesca y Desarrollo Rural
Consejería de Agricultura, Pesca y Desarrollo Rural
Secretaría General de Agricultura y Alimentación
OTHER PRODUCTS: PDO Miel de Granada (Honey)
13,295 beehives registered under PDO. 2012
51 producers and 5 packing plants registered under PDO. 2012
199,425 kg of honey marketed under PDO. 2012
Spanish market
Value of the honey marketed under the PDO. 2012
2.08 million €Spanish market
Source:Regional Ministry of Agriculture, Fisheries and Rural Development of Andalucia and Regulatory boards of the Andalucian PDO
The Agri-food sector in Andalusia. Quality Designati ons

Consejería de Agricultura, Pesca y Desarrollo Rural
Consejería de Agricultura, Pesca y Desarrollo Rural
Consejería de Agricultura, Pesca y Desarrollo Rural
Consejería de Agricultura, Pesca y Desarrollo Rural
Secretaría General de Agricultura y Alimentación
OTHER PRODUCTS: PGI Caballa de Andalucía and Melva de Andalucía
(Mackerel and frigate tuna, respectively)
4 industries registered under PGI. 2012
1,255 tonnes of mackerels registered and marketed under PGI. 2012
64% Spanish market
31% European Union
5% Other countries
630 tons of frigate tuna registered and marketed under PGI. 2012
63% Spanish market
29% European Union
7% Other countries
Source:Regional Ministry of Agriculture, Fisheries and Rural Development of Andalusia and Regulatory boards of the Andalusian PDO for mackerel and frigate tuna
12.55 million € of mackerels marketed under PGI. 201264% Spanish market
31% European Union
5% Other countries
9.32 million € of frigate tunas marketed under PGI. 201263% Spanish market
29% European Union
7% Other countries
The Agri-food sector in Andalusia. Quality Designati ons

Consejería de Agricultura, Pesca y Desarrollo Rural
Consejería de Agricultura, Pesca y Desarrollo Rural
Consejería de Agricultura, Pesca y Desarrollo Rural
Consejería de Agricultura, Pesca y Desarrollo Rural
Secretaría General de Agricultura y Alimentación
OTHER PRODUCTS: PDO Aceituna Aloreña de Málaga
(olives) Area registered under PDO. 2012
25,000 hectares
9 industries registered as producers of products covered under PDO. 2012
Production of olives covered under PDO, 1,400 tonnes 2012
Value of the production of olives marketed under PDO. 2012
7.0 million €
Source:Regional Ministry of Agriculture, Fisheries and Rural Development of Andalusia and Regulatory boards of the Andalusian PDO
Production of olives marketed under PDO, 1,400 tonnes in 2011, 90% for the Spanish market , 8% for the UE
and 2% for the other countries
The Agri-food sector in Andalusia. Quality Designati ons

Consejería de Agricultura, Pesca y Desarrollo Rural
Consejería de Agricultura, Pesca y Desarrollo Rural
Consejería de Agricultura, Pesca y Desarrollo Rural
Consejería de Agricultura, Pesca y Desarrollo Rural
Secretaría General de Agricultura y Alimentación
OTHER PRODUCTS
Source:Regional Ministry of Agriculture, Fisheries and Rural Development of Andalusia
PGI Alfajorde Medina
Sidonia(traditional
pastry)
PGI Cordero de las Sierras de Segura y La Sagra (lamb)
PGI Mantecados de
Estepa(traditional
pastry)
The Agri-food sector in Andalusia. Quality Designati ons

Consejería de Agricultura, Pesca y Desarrollo Rural
Consejería de Agricultura, Pesca y Desarrollo Rural
Consejería de Agricultura, Pesca y Desarrollo Rural
Consejería de Agricultura, Pesca y Desarrollo Rural
Secretaría General de Agricultura y Alimentación
The Andalusian Agri-food balance of trade showed a positive value , higher than the Spanish balance of trade in the per iod 2000-2010
However, from 2011 on, this trend changed and the agri-food balance of trade of Spain became 64% higher than the Andalusian one in 2014.
Agri-food balance of trade
Source: DATACOMEX
Evolution of the agri-food balance of trade
3,6203,1671,988
1,6371,474
6,138
2,491
350
1,432
8,212
1,050
137
733
2,480
8,917
5,312
3,076 4,0383,548
3,2702,9652,561
2,540
3,049
3,131
3,1012,442
2,199
4,329
3,268
0,000
1,000
2,000
3,000
4,000
5,000
6,000
7,000
8,000
9,000
10,000
2000 2001 2002 2003 2004 2005 2006 2007 2008 2009 2010 2011 2012 2013 2014
Mill
ions
of €
Spain Andalusia

Consejería de Agricultura, Pesca y Desarrollo Rural
Consejería de Agricultura, Pesca y Desarrollo Rural
Consejería de Agricultura, Pesca y Desarrollo Rural
Consejería de Agricultura, Pesca y Desarrollo Rural
Secretaría General de Agricultura y Alimentación
Source: DATACOMEX
Agri-food balance of trade
In 2014, the maximum value of agricultural exports (8,343 mill €) was reached. The value of the balance of trade increased 22.7% compared to the previous year
In 2009, the exports carried out by Andalusia decreased, although they recovered in 2010
The imports carried out by Andalusia decreased in 2009 although they rose to 3,248 mill € in 2011. In 2014, it decreased by 2.7% compared to 2013
In both cases, exports and imports followed an upward trend in the period 2000-2014
Evolution of the agri-food imports and exports carr ied out by Andalusia
8,343
7,445
5,0774,813
7,149
3,6694,149
4,809
6,094
6,516
5,030 5,259
5,6386,066
5,479
3,0313,116
1,4701,706 1,708 1,682
2,0282,489
2,697 2,673 2,796
2,546
3,112
2,403
3,248
0,000
1,000
2,000
3,000
4,000
5,000
6,000
7,000
8,000
9,000
2000 2001 2002 2003 2004 2005 2006 2007 2008 2009 2010 2011 2012 2013 2014
Mill
ions
of €
Exports Imports

Consejería de Agricultura, Pesca y Desarrollo Rural
Consejería de Agricultura, Pesca y Desarrollo Rural
Consejería de Agricultura, Pesca y Desarrollo Rural
Consejería de Agricultura, Pesca y Desarrollo Rural
Secretaría General de Agricultura y Alimentación
Source:: DATACOMEX
Agri-food balance of trade
The fresh vegetables sub-sector had the most favourable balance of trade, settled at about 1,500 mill € in the period 2003-2007. In 2013, it registered its maximum at 2,106 mill € and in 2014 it reached
2,088 mill €.
The olive oil sub-sector showed fluctuations in the value of its balance through the period. However, it has always had an upward trend; in 2014 it rose to 1,842 mill €
The fresh fruits balance of trade rose by 113% in the period 2000-2014, reaching its maximum in 2014 at 1,321 mill €
The processed vegetables balance of trade grew by 75% in the period 2000-2014, registering its highest value in 2014 at 573 mill €
Evolution of the balance of trade of the main Andal usian agri-food subsectors
573509
328
1,842
963
560
1,3211,220
621
2,0882,106
1,127
0,000
1,000
2,000
3,000
2000 2001 2002 2003 2004 2005 2006 2007 2008 2009 2010 2011 2012 2013 2014
Mill
ions
of €
Processed fruits and vegetables Oils Fresh fruits Fresh vegetables

Consejería de Agricultura, Pesca y Desarrollo Rural
Consejería de Agricultura, Pesca y Desarrollo Rural
Consejería de Agricultura, Pesca y Desarrollo Rural
Consejería de Agricultura, Pesca y Desarrollo Rural
Secretaría General de Agricultura y Alimentación
Agri-food exports
Agri-food balance of trade
Andalusia is a net exporting region of agri-food products
�The Andalusian Agri-food balance is always positive
� The Andalusian Agri-food balance, compared to the world balance, increased by 114.6% in the period 2000-2014, reaching 5,312 million € in 2014, 22.7% more than the previous year.
� Olive oil is the agri-food product that stands out in Andalusian trading relations. It had a balance of trade of 1,949 million € in 2014, 63.2% higher than the previous year. Due the importance reached by Andalusian olive oil in the international markets, this product has increased the Andalusian balance trade 90.2% in the last decade and 254.8% since 2000.
8,343 M€3,031 M€
Most importantproducts:Olive oilFruits and vegetablesOlives
Most important products:Fish and sea foodFats, animal or vegetable oilGrainSugar and confectionery products
Exports 2014Imports 2014
Source: DATACOMEX

Consejería de Agricultura, Pesca y Desarrollo Rural
Consejería de Agricultura, Pesca y Desarrollo Rural
Consejería de Agricultura, Pesca y Desarrollo Rural
Consejería de Agricultura, Pesca y Desarrollo Rural
Secretaría General de Agricultura y Alimentación
Andalusian agri-food exports
The EU is the main destination of the Andalusian exports and the main supplier of agri-food imports carried out by Andalusia
� Andalusian exports to the EU, in 2014: �Italy (20.9%)�Germany (19.4%)�France (15.8%)�Portugal (11.6%)�United Kingdom (10.6%)�The Netherlands (8.1%)
� The EU was also the main agri-food supplier of Andalusia in 2014:�Portugal (21.7%)�France (18.0%)�United Kingdom (11.6%)�Germany (7.5%)�Italy (6.5%)
EEUU (6.0%), Japan (1.4%), China (1.2%), Switzerland (1.1%), and Brazil (0.8%) are important destinations for Andalusian exports outside the EU
The most important Andalusian imports come from Morocco (12.0%), Indonesia (7.3%),Ukraine (3.8%), United States (3.2%), and Peru (2.9%)
Agri-food balance of trade
Source: Data 2012 (provisional). Value of the exports and imports carried out by Andalucia (millions of €). DATACOMEX.

Consejería de Agricultura, Pesca y Desarrollo Rural
Consejería de Agricultura, Pesca y Desarrollo Rural
Consejería de Agricultura, Pesca y Desarrollo Rural
Consejería de Agricultura, Pesca y Desarrollo Rural
Secretaría General de Agricultura y Alimentación
Source: FEGA (The Spanish Paying Agency)
Evolution of the Direct aids between 2010 and 2012 at national level.
At national level, the number of beneficiaries of direct aid decreased by
7.0% in 2012 compared to 2010; the number of male beneficiaries of such aid
has decreased the most (7.2%), compared to female that decreased by 6.7% in the
period under study
At national level, the total amount payable by way of direct aid decreased by 4.3% in
2012 compared to 2010
In the period 2010-2012, 64.5% of the beneficiaries of direct aid were men
In the period 2010-2012, 73.3% of the amount payable by way of direct aid was
received by men
Number of beneficiaries
292,039
530,834
302,701312,998
550,944571,983
822,873
853,645884,981
0
200,000
400,000
600,000
800,000
1,000,000
2010 2011 2012
Num
ber
of b
enef
icia
ries
Women Men Total
Amount payable by way of direct aid
2,816
3,844
1,075 1,0681,028
2,8752,942
4,017 3,944
0
1,000
2,000
3,000
4,000
5,000
2010 2011 2012
mill
ions
€
Women Men Total
Direct aids of the Common Agricultural Policy (CAP)

Consejería de Agricultura, Pesca y Desarrollo Rural
Consejería de Agricultura, Pesca y Desarrollo Rural
Consejería de Agricultura, Pesca y Desarrollo Rural
Consejería de Agricultura, Pesca y Desarrollo Rural
Secretaría General de Agricultura y Alimentación
Average amount of direct aids. 2012
Andalusians received 8.7% less than the amount received on
average in Spain
Characterization of the beneficiaries of direct aids at national level
(according to their legal status). 2012
Source: FEGA (The Spanish Paying Agency)
Distribution per beneficiaries
Legal person 5%
Natural person 95%
Amount received
Legal person 27%
Natural person 73%
4,6434,237
0
2,000
4,000
6,000
8,000
10,000
C V
alen
cian
a
Bal
eare
s
Mur
cia
La R
ioja
Paí
s V
asco
Gal
icia
Cat
aluñ
a
Mad
rid
And
aluc
ía
Cas
tilla
Man
cha
Ast
uria
s
Esp
aña
Nav
arra
Can
tabr
ia
Ext
rem
adur
a
Ara
gón
Can
aria
s
Cas
tilla
yLe
ón
€/be
nefic
iarie
s of
dire
ct a
ids
Direct aids of the Common Agricultural Policy (CAP)

Consejería de Agricultura, Pesca y Desarrollo Rural
Consejería de Agricultura, Pesca y Desarrollo Rural
Consejería de Agricultura, Pesca y Desarrollo Rural
Consejería de Agricultura, Pesca y Desarrollo Rural
Secretaría General de Agricultura y Alimentación
60000 50000 40000 30000 20000 10000 0 10000 20000 30000
<25 years old
25-34
35-44
45-54
55-64
≥65 years old
Source: FEGA (The Spanish Paying Agency)
Age
of b
enef
icia
ries
Number of beneficiaries
Men Women
Andalusia
Spain
29.0% of the beneficiaries of the direct aid received by Spain in 2012 were from
Andalusia
27.6% of the beneficiaries of direct aid greater than or equal to 65 years were
Andalusians
40.6% of the beneficiaries of direct aid at national level
were greater than or equal to 65 years A
ge o
f ben
efic
iarie
s
Number of beneficiaries
Beneficiaries of direct aid. 2012
Andalusia
Spain
250000 200000 150000 100000 50000 0 50000 100000 150000 200000 250000
<25 years old
25-34
35-44
45-54
55-64
≥65 years old
Direct aids of the Common Agricultural Policy (CAP)
Men Women
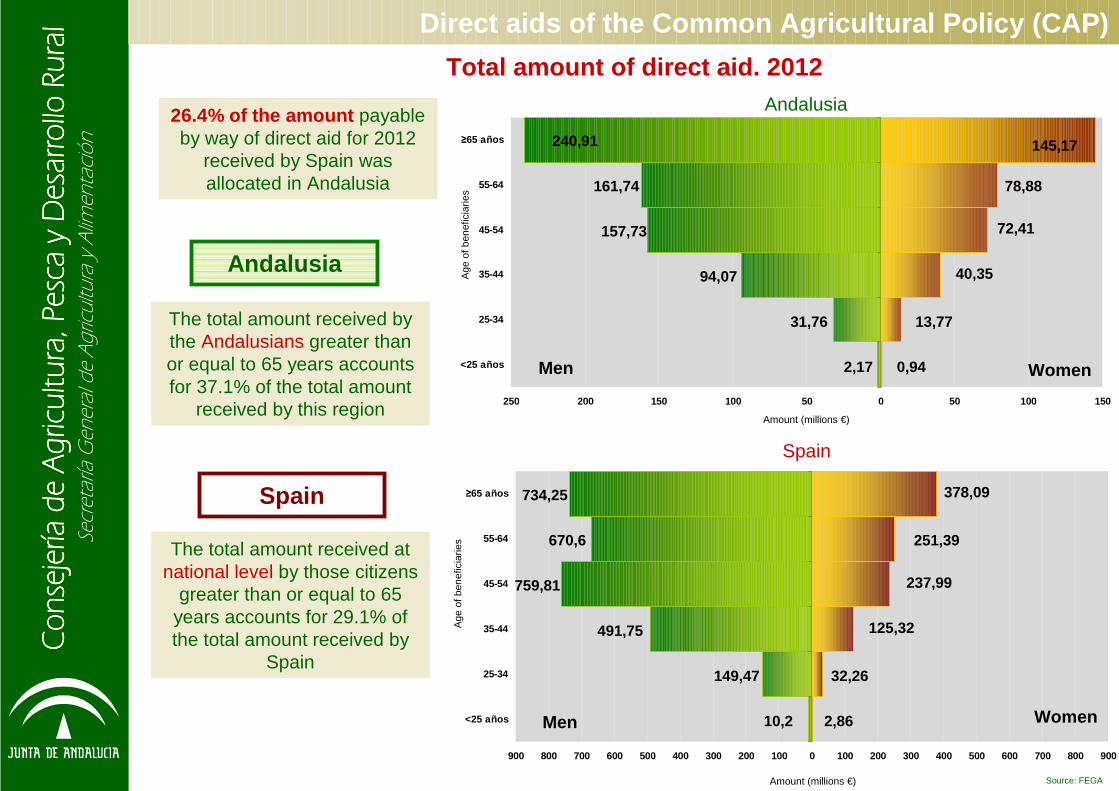
Consejería de Agricultura, Pesca y Desarrollo Rural
Consejería de Agricultura, Pesca y Desarrollo Rural
Consejería de Agricultura, Pesca y Desarrollo Rural
Consejería de Agricultura, Pesca y Desarrollo Rural
Secretaría General de Agricultura y Alimentación
900 800 700 600 500 400 300 200 100 0 100 200 300 400 500 600 700 800 900
<25 años
25-34
35-44
45-54
55-64
≥65 años
250 200 150 100 50 0 50 100 150
<25 años
25-34
35-44
45-54
55-64
≥65 años
Source: FEGA
Andalusia
Spain
Andalusia
Spain
Men Women
Men Women
0,94
13,77
40,35
72,41
78,88
145,17
2,17
31,76
94,07
157,73
161,74
240,91
2,86
32,26
125,32
237,99
251,39
378,09
10,2
149,47
491,75
759,81
670,6
734,25
Direct aids of the Common Agricultural Policy (CAP)
26.4% of the amount payable by way of direct aid for 2012
received by Spain was allocated in Andalusia
The total amount received by the Andalusians greater than or equal to 65 years accounts for 37.1% of the total amount
received by this region
Total amount of direct aid. 2012
Age
of b
enef
icia
ries
Age
of b
enef
icia
ries
Amount (millions €)
Amount (millions €)
The total amount received at national level by those citizens
greater than or equal to 65 years accounts for 29.1% of the total amount received by
Spain

Consejería de Agricultura, Pesca y Desarrollo Rural
Consejería de Agricultura, Pesca y Desarrollo Rural
Consejería de Agricultura, Pesca y Desarrollo Rural
Consejería de Agricultura, Pesca y Desarrollo Rural
Secretaría General de Agricultura y Alimentación
Distribution of support. EAGF 2014
Since the Single payment scheme came into force, the
most important amount of aid is allocated to farmers
decoupled to the productive activity. Due to this, it is not possible to know in which
sectors this aid is allocated
Common Agricultural Policy (CAP) Aid
Rest of EAGFFuns 13%
Single Payment87%
The Andalusian public administration paid over 1,500 mill € in annual paymentsfrom the EAGF fund between 2000 and 2014. In 2009, the highest value o f the
period studied was registered at 1,862 mill €
Source: FEGA (The Spanish Paying Agency)
Beef17%
Others18%
Cotton32%
Fruits and Vegetables
33%
2000 2001 2002 2003 2004 2005 2006 2007 2008 2009 2010 2011 2012 2013 2014
1,598 1,614 1,697 1,742 1,710 1,817 1,806 1,676 1,689 1,862 1,685 1,690 1,671 1,636 1,597
Payments (Millions of €)
EAGF financial years

Consejería de Agricultura, Pesca y Desarrollo Rural
Consejería de Agricultura, Pesca y Desarrollo Rural
Consejería de Agricultura, Pesca y Desarrollo Rural
Consejería de Agricultura, Pesca y Desarrollo Rural
Secretaría General de Agricultura y Alimentación
Distribution of the support. EAFRD 2014 (16 October 2013 – 15 October 2014)
Total: 264,78 M€18.0% of the
national amount
Common Agricultural Policy (CAP) Aid
Axis 2 - Improving the environment and the countryside by
supporting land management
52%
Axis 4 - LEADER4%
Axis 1 - Improving the competitiveness
of the agricultural and forestry sector
41%
Axis 3 - Improving the quality of life in
rural areas and encouraging
diversification of economic activity
1%
Technical assistance
2%
Source: FEGA (The Spanish Paying Agency)
In the financial year 2014, the EAFRD allocated 264.78 million EuroAxis 2: Improving the Environment and Diversification of the Rural Economy, represented 52% of the amount allocated in that financial year. Among this axis, it is necessary to highlight the Environmental
Support which represented 52% of the total EAFRD amount for this Axis in 2014
Axis 1: Improving the competitiveness of the agricultural and forestry sector, accounted for 41% of the amount allocated in this financial year. Among this axis, it is necessary to highlight the support to Aids
and infrastructures, that represented 60% of the amount allocated to Axis 1 by the EAFRD in 2014

Consejería de Agricultura, Pesca y Desarrollo Rural
Consejería de Agricultura, Pesca y Desarrollo Rural
Consejería de Agricultura, Pesca y Desarrollo Rural
Consejería de Agricultura, Pesca y Desarrollo Rural
Secretaría General de Agricultura y Alimentación
The natural resources of Andalusia
2,590,008.9 hectares of the Andalusian area are included in the Natura 2000 Network (about 30% of the total of the region)
The Andalusian area included in the Natura 2000 Networ k is selected from the Network of Protected areas of Andalusia , made up of 150 Protected Areas with an area of 1, 694,849
hectares

Consejería de Agricultura, Pesca y Desarrollo Rural
Consejería de Agricultura, Pesca y Desarrollo Rural
Consejería de Agricultura, Pesca y Desarrollo Rural
Consejería de Agricultura, Pesca y Desarrollo Rural
Secretaría General de Agricultura y Alimentación
• Andalusian forest areas occupy 4.8 million hectares (55% of the total area of Andalusia)
• 54.1% are grove areas (among them, 70.7% are leafy, where oaks and cork oaksstand out),
• 31.9% are bush areas,
• 14% are herbs and other forest areas
• About 1.2 million hectares of these forest areas ar e also used for extensive agricultural purposes ( dehesas)
• These forest areas capture, every year, more than 2.1 million tons of c arbon . In addition to this capture, we can also include th e capture carried out by agricultural crops (permanent woody crops), estimated on average at 0.42 tons per hectare and year
The natural resources of Andalusia
Consejería de Agricultura, Pesca y Desarrollo Rural
Consejería de Agricultura, Pesca y Desarrollo Rural
Consejería de Agricultura, Pesca y Desarrollo Rural
Consejería de Agricultura, Pesca y Desarrollo Rural
Secretaría General de Agricultura y Alimentación • Only 16% of the total Andalusian forest groves are da maged (with defoliation
over 25%). These damages are greater in leafy areas (where the percentage of damaged trees rise to 21%) than in conifer areas (j ust 5% of damaged trees)
• The Andalusian flora has more than 4,000 taxons, 60% of the Iberian flora. Among them, 484 taxons are Andalusian endemic and 466 are Ib erian endemic or beticus-Mauritanian
• The storage capacity of the water resources of Andalusia is over 10,000 hm3. The available resources are about 5,500 hm3
• Andalusia has an average annual soil loss of 5.5 tons per hectare. In the past 10 years, the areas with greater losses (more than 100 tons/hectare/year) have been reduced by more than 50%
The natural resources of Andalusia

Consejería de Agricultura, Pesca y Desarrollo Rural
Consejería de Agricultura, Pesca y Desarrollo Rural
Consejería de Agricultura, Pesca y Desarrollo Rural
Consejería de Agricultura, Pesca y Desarrollo Rural
Secretaría General de Agricultura y Alimentación
The Agricultural and Fisheries sector in Andalusia