the 51st annual report · 2006 mar launched “rexton ii” ... annual report 1. corporate overview...
TRANSCRIPT
The 51st Annual Report
(2012. 1. 1 ~ 2012. 12. 31)
Ssangyong Motor Company
2
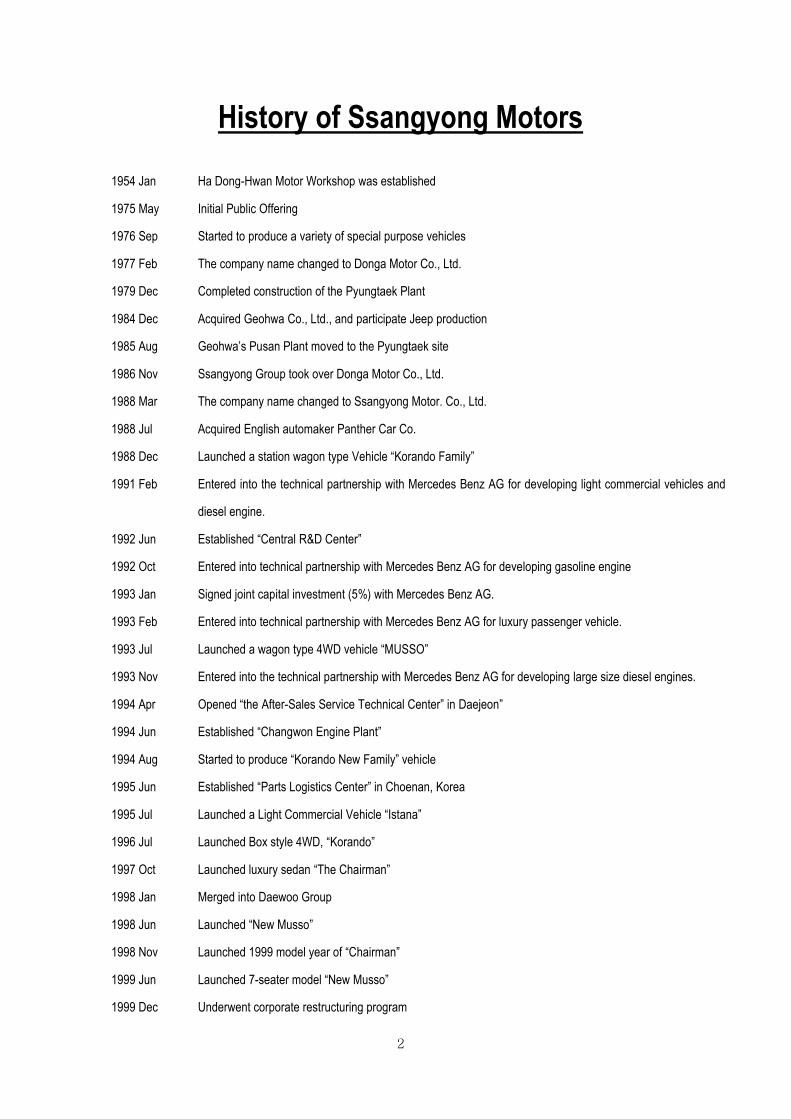
History of Ssangyong Motors
1954 Jan Ha Dong-Hwan Motor Workshop was established
1975 May Initial Public Offering
1976 Sep Started to produce a variety of special purpose vehicles
1977 Feb The company name changed to Donga Motor Co., Ltd.
1979 Dec Completed construction of the Pyungtaek Plant
1984 Dec Acquired Geohwa Co., Ltd., and participate Jeep production
1985 Aug Geohwa’s Pusan Plant moved to the Pyungtaek site
1986 Nov Ssangyong Group took over Donga Motor Co., Ltd.
1988 Mar The company name changed to Ssangyong Motor. Co., Ltd.
1988 Jul Acquired English automaker Panther Car Co.
1988 Dec Launched a station wagon type Vehicle “Korando Family”
1991 Feb Entered into the technical partnership with Mercedes Benz AG for developing light commercial vehicles and
diesel engine.
1992 Jun Established “Central R&D Center”
1992 Oct Entered into technical partnership with Mercedes Benz AG for developing gasoline engine
1993 Jan Signed joint capital investment (5%) with Mercedes Benz AG.
1993 Feb Entered into technical partnership with Mercedes Benz AG for luxury passenger vehicle.
1993 Jul Launched a wagon type 4WD vehicle “MUSSO”
1993 Nov Entered into the technical partnership with Mercedes Benz AG for developing large size diesel engines.
1994 Apr Opened “the After-Sales Service Technical Center” in Daejeon”
1994 Jun Established “Changwon Engine Plant”
1994 Aug Started to produce “Korando New Family” vehicle
1995 Jun Established “Parts Logistics Center” in Choenan, Korea
1995 Jul Launched a Light Commercial Vehicle “Istana”
1996 Jul Launched Box style 4WD, “Korando”
1997 Oct Launched luxury sedan “The Chairman”
1998 Jan Merged into Daewoo Group
1998 Jun Launched “New Musso”
1998 Nov Launched 1999 model year of “Chairman”
1999 Jun Launched 7-seater model “New Musso”
1999 Dec Underwent corporate restructuring program
3
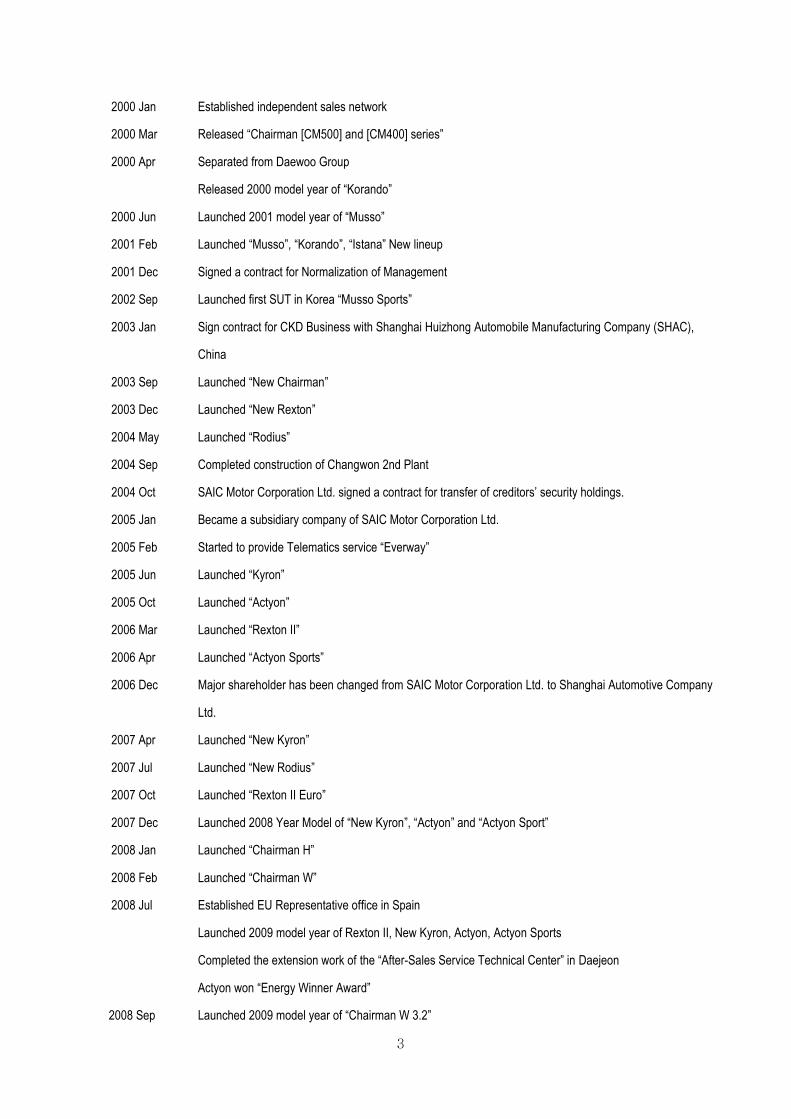
2000 Jan Established independent sales network
2000 Mar Released “Chairman [CM500] and [CM400] series”
2000 Apr Separated from Daewoo Group
Released 2000 model year of “Korando”
2000 Jun Launched 2001 model year of “Musso”
2001 Feb Launched “Musso”, “Korando”, “Istana” New lineup
2001 Dec Signed a contract for Normalization of Management
2002 Sep Launched first SUT in Korea “Musso Sports”
2003 Jan Sign contract for CKD Business with Shanghai Huizhong Automobile Manufacturing Company (SHAC),
China
2003 Sep Launched “New Chairman”
2003 Dec Launched “New Rexton”
2004 May Launched “Rodius”
2004 Sep Completed construction of Changwon 2nd Plant
2004 Oct SAIC Motor Corporation Ltd. signed a contract for transfer of creditors’ security holdings.
2005 Jan Became a subsidiary company of SAIC Motor Corporation Ltd.
2005 Feb Started to provide Telematics service “Everway”
2005 Jun Launched “Kyron”
2005 Oct Launched “Actyon”
2006 Mar Launched “Rexton II”
2006 Apr Launched “Actyon Sports”
2006 Dec Major shareholder has been changed from SAIC Motor Corporation Ltd. to Shanghai Automotive Company
Ltd.
2007 Apr Launched “New Kyron”
2007 Jul Launched “New Rodius”
2007 Oct Launched “Rexton II Euro”
2007 Dec Launched 2008 Year Model of “New Kyron”, “Actyon” and “Actyon Sport”
2008 Jan Launched “Chairman H”
2008 Feb Launched “Chairman W”
2008 Jul Established EU Representative office in Spain
Launched 2009 model year of Rexton II, New Kyron, Actyon, Actyon Sports
Completed the extension work of the “After-Sales Service Technical Center” in Daejeon
Actyon won “Energy Winner Award”
2008 Sep Launched 2009 model year of “Chairman W 3.2”
4
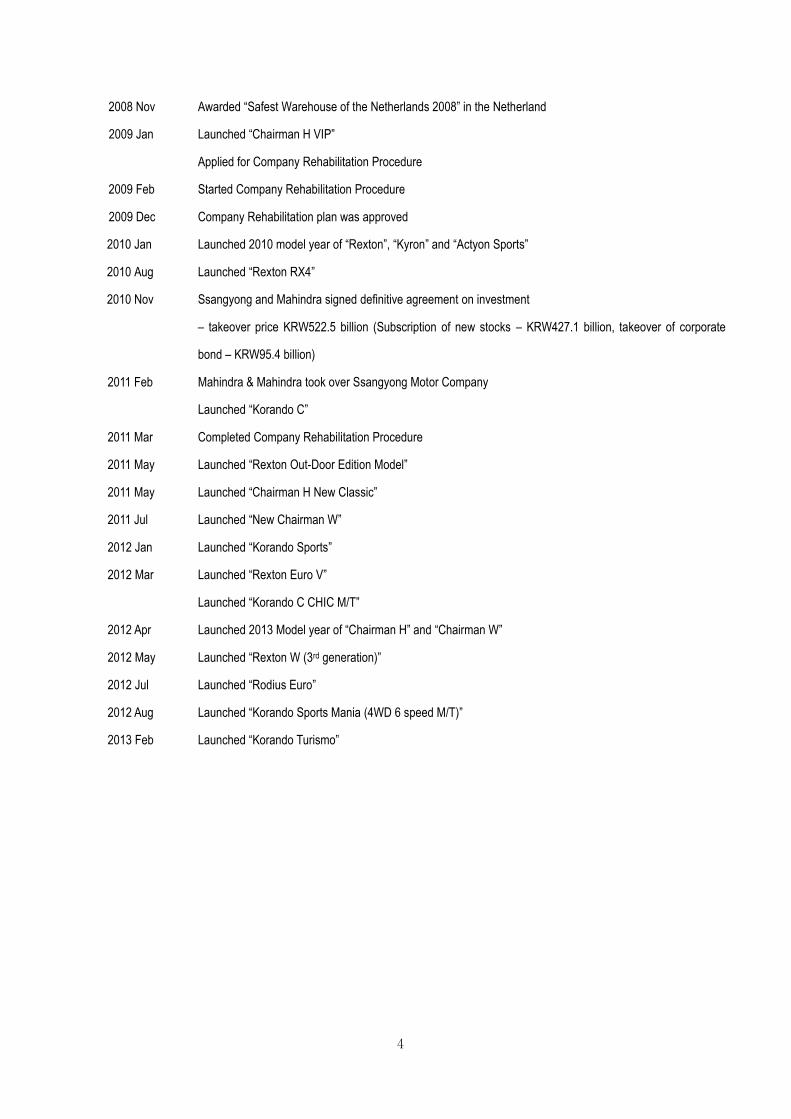
2008 Nov Awarded “Safest Warehouse of the Netherlands 2008” in the Netherland
2009 Jan Launched “Chairman H VIP”
Applied for Company Rehabilitation Procedure
2009 Feb Started Company Rehabilitation Procedure
2009 Dec Company Rehabilitation plan was approved
2010 Jan Launched 2010 model year of “Rexton”, “Kyron” and “Actyon Sports”
2010 Aug Launched “Rexton RX4”
2010 Nov Ssangyong and Mahindra signed definitive agreement on investment
– takeover price KRW522.5 billion (Subscription of new stocks – KRW427.1 billion, takeover of corporate
bond – KRW95.4 billion)
2011 Feb Mahindra & Mahindra took over Ssangyong Motor Company
Launched “Korando C”
2011 Mar Completed Company Rehabilitation Procedure
2011 May Launched “Rexton Out-Door Edition Model”
2011 May Launched “Chairman H New Classic”
2011 Jul Launched “New Chairman W”
2012 Jan Launched “Korando Sports”
2012 Mar Launched “Rexton Euro V”
Launched “Korando C CHIC M/T”
2012 Apr Launched 2013 Model year of “Chairman H” and “Chairman W”
2012 May Launched “Rexton W (3rd generation)”
2012 Jul Launched “Rodius Euro”
2012 Aug Launched “Korando Sports Mania (4WD 6 speed M/T)”
2013 Feb Launched “Korando Turismo”
5
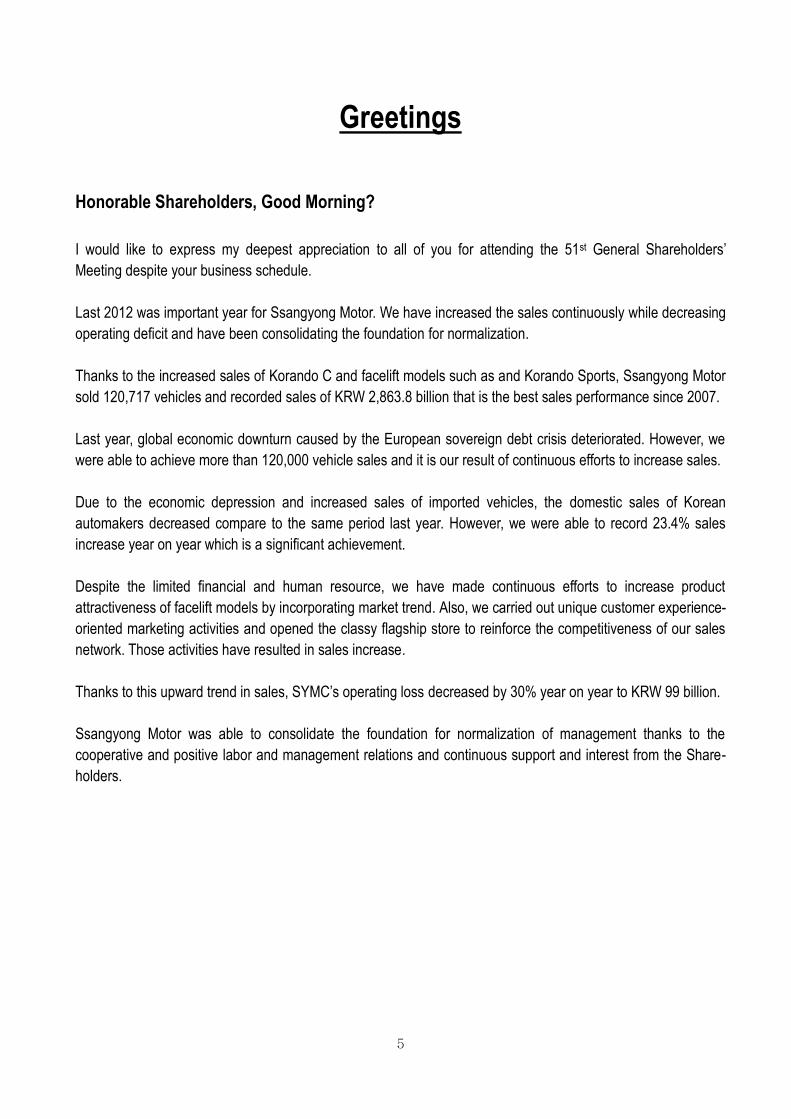
Greetings Honorable Shareholders, Good Morning?
I would like to express my deepest appreciation to all of you for attending the 51st General Shareholders’
Meeting despite your business schedule.
Last 2012 was important year for Ssangyong Motor. We have increased the sales continuously while decreasing
operating deficit and have been consolidating the foundation for normalization.
Thanks to the increased sales of Korando C and facelift models such as and Korando Sports, Ssangyong Motor
sold 120,717 vehicles and recorded sales of KRW 2,863.8 billion that is the best sales performance since 2007.
Last year, global economic downturn caused by the European sovereign debt crisis deteriorated. However, we
were able to achieve more than 120,000 vehicle sales and it is our result of continuous efforts to increase sales.
Due to the economic depression and increased sales of imported vehicles, the domestic sales of Korean
automakers decreased compare to the same period last year. However, we were able to record 23.4% sales
increase year on year which is a significant achievement.
Despite the limited financial and human resource, we have made continuous efforts to increase product
attractiveness of facelift models by incorporating market trend. Also, we carried out unique customer experience-
oriented marketing activities and opened the classy flagship store to reinforce the competitiveness of our sales
network. Those activities have resulted in sales increase.
Thanks to this upward trend in sales, SYMC’s operating loss decreased by 30% year on year to KRW 99 billion.
Ssangyong Motor was able to consolidate the foundation for normalization of management thanks to the
cooperative and positive labor and management relations and continuous support and interest from the Share-
holders.
6
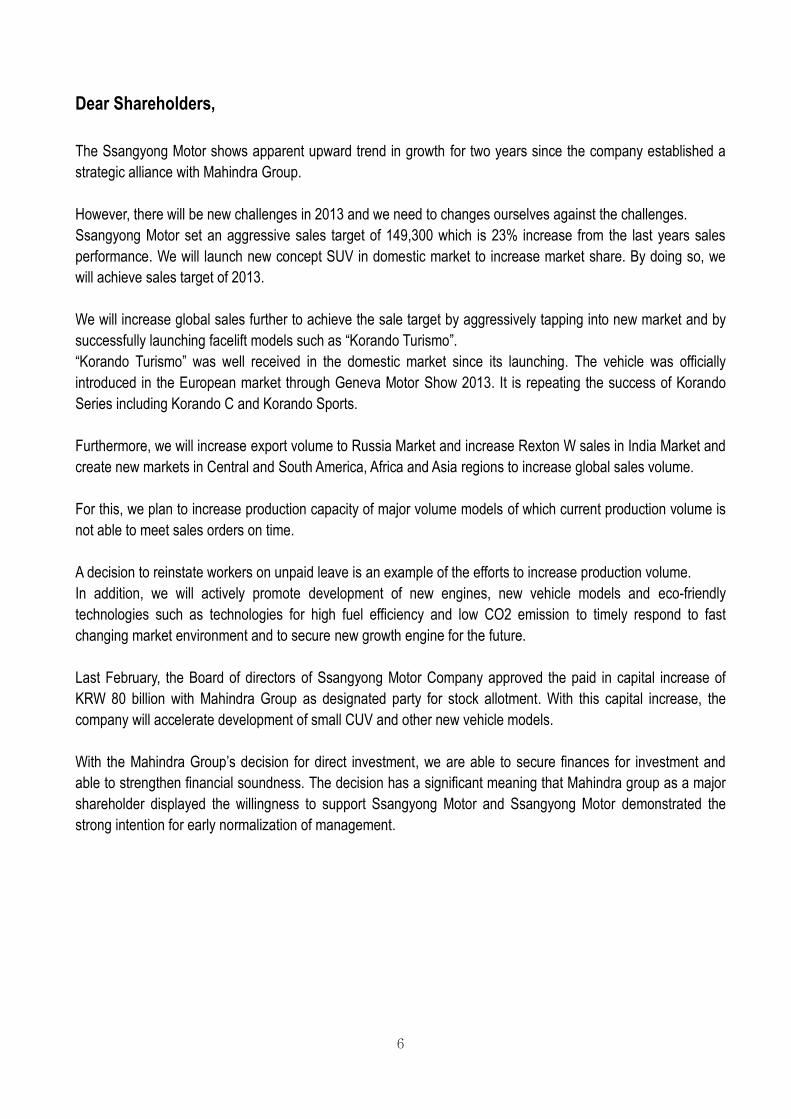
Dear Shareholders,
The Ssangyong Motor shows apparent upward trend in growth for two years since the company established a
strategic alliance with Mahindra Group.
However, there will be new challenges in 2013 and we need to changes ourselves against the challenges.
Ssangyong Motor set an aggressive sales target of 149,300 which is 23% increase from the last years sales
performance. We will launch new concept SUV in domestic market to increase market share. By doing so, we
will achieve sales target of 2013.
We will increase global sales further to achieve the sale target by aggressively tapping into new market and by
successfully launching facelift models such as “Korando Turismo”.
“Korando Turismo” was well received in the domestic market since its launching. The vehicle was officially
introduced in the European market through Geneva Motor Show 2013. It is repeating the success of Korando
Series including Korando C and Korando Sports.
Furthermore, we will increase export volume to Russia Market and increase Rexton W sales in India Market and
create new markets in Central and South America, Africa and Asia regions to increase global sales volume.
For this, we plan to increase production capacity of major volume models of which current production volume is
not able to meet sales orders on time.
A decision to reinstate workers on unpaid leave is an example of the efforts to increase production volume.
In addition, we will actively promote development of new engines, new vehicle models and eco-friendly
technologies such as technologies for high fuel efficiency and low CO2 emission to timely respond to fast
changing market environment and to secure new growth engine for the future.
Last February, the Board of directors of Ssangyong Motor Company approved the paid in capital increase of
KRW 80 billion with Mahindra Group as designated party for stock allotment. With this capital increase, the
company will accelerate development of small CUV and other new vehicle models.
With the Mahindra Group’s decision for direct investment, we are able to secure finances for investment and
able to strengthen financial soundness. The decision has a significant meaning that Mahindra group as a major
shareholder displayed the willingness to support Ssangyong Motor and Ssangyong Motor demonstrated the
strong intention for early normalization of management.
7
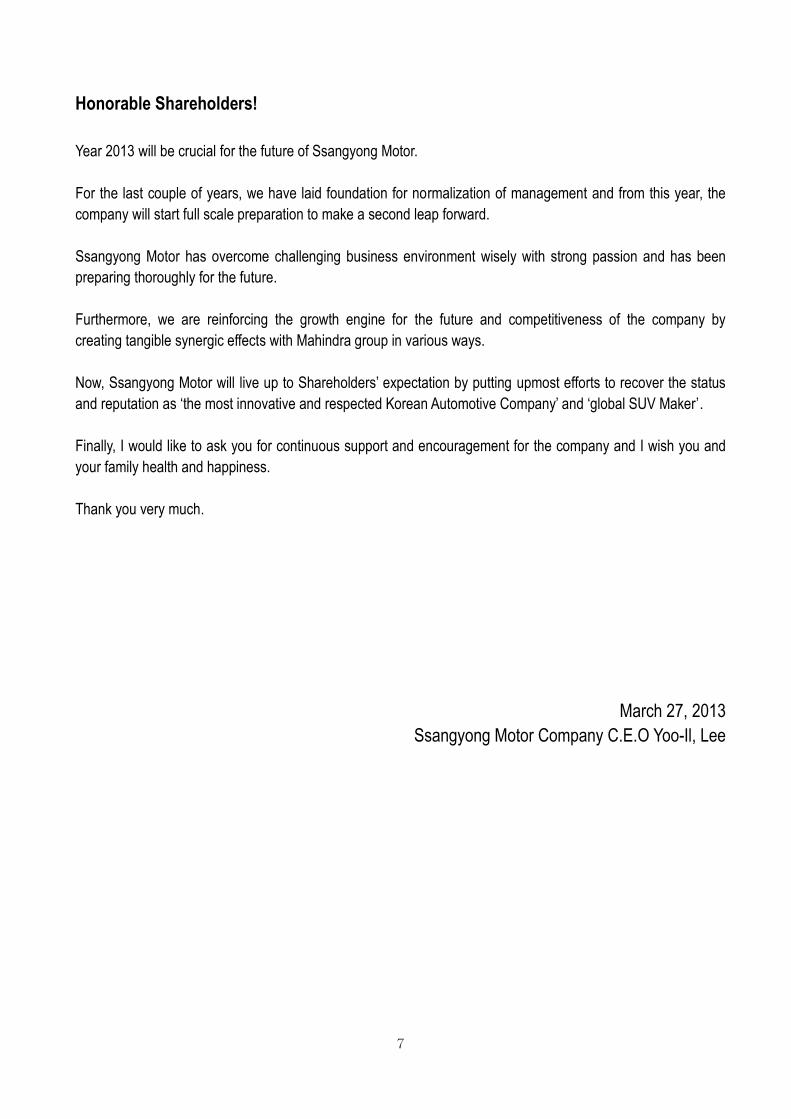
Honorable Shareholders!
Year 2013 will be crucial for the future of Ssangyong Motor.
For the last couple of years, we have laid foundation for normalization of management and from this year, the
company will start full scale preparation to make a second leap forward.
Ssangyong Motor has overcome challenging business environment wisely with strong passion and has been
preparing thoroughly for the future.
Furthermore, we are reinforcing the growth engine for the future and competitiveness of the company by
creating tangible synergic effects with Mahindra group in various ways.
Now, Ssangyong Motor will live up to Shareholders’ expectation by putting upmost efforts to recover the status
and reputation as ‘the most innovative and respected Korean Automotive Company’ and ‘global SUV Maker’.
Finally, I would like to ask you for continuous support and encouragement for the company and I wish you and
your family health and happiness.
Thank you very much.
March 27, 2013
Ssangyong Motor Company C.E.O Yoo-Il, Lee
8
Table of Contents
Ⅰ. Annual Report
1. Corporate Overview -------------------------------------------------------------------- 9
2. Sales Performance --------------------------------------------------------------------- 12
3. Parent Company, Subsidiary Company and Company Combination ----- 15
4. Business Performance and Financial Condition for the Past 3 Years ------- 17
5. Issues to be Addressed ---------------------------------------------------------------- 19
6. Board & Audit Committee Composition ---------------------------------------------- 19
7. Major Shareholder Status ------------------------------------------------------------- 19
8. Investment in SYMC, SYMC and Subsidiary Companies or SYMC’s
Subsidiary Companies ------------------------------------------------------------------- 20
9. Major Creditors ----------------------------------------------------------------------------- 20
10. Important Issues Occurred after Settlement of Accounts ----------------------- 21
11. Important Sales Issues ------------------------------------------------------------------- 22
9
Ⅰ. Annual Report 1. Corporate Overview
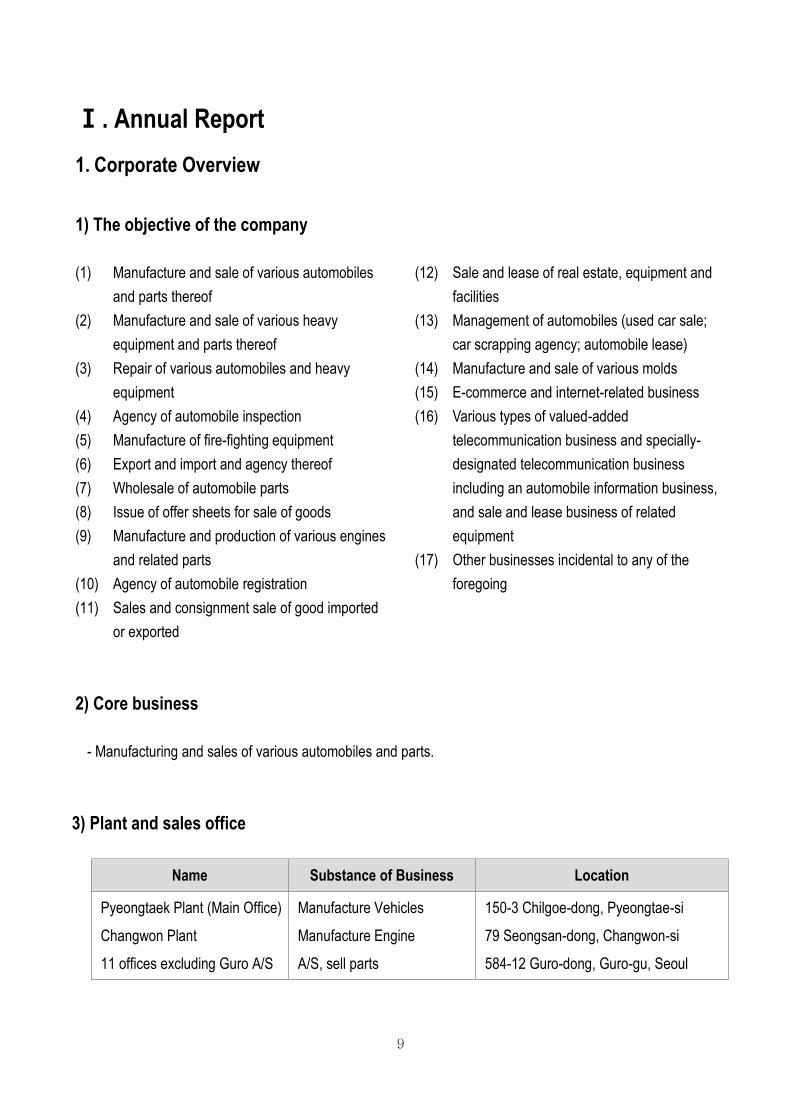
1) The objective of the company
(1) Manufacture and sale of various automobiles
and parts thereof
(2) Manufacture and sale of various heavy
equipment and parts thereof
(3) Repair of various automobiles and heavy
equipment
(4) Agency of automobile inspection
(5) Manufacture of fire-fighting equipment
(6) Export and import and agency thereof
(7) Wholesale of automobile parts
(8) Issue of offer sheets for sale of goods
(9) Manufacture and production of various engines
and related parts
(10) Agency of automobile registration
(11) Sales and consignment sale of good imported
or exported
(12) Sale and lease of real estate, equipment and
facilities
(13) Management of automobiles (used car sale;
car scrapping agency; automobile lease)
(14) Manufacture and sale of various molds
(15) E-commerce and internet-related business
(16) Various types of valued-added
telecommunication business and specially-
designated telecommunication business
including an automobile information business,
and sale and lease business of related
equipment
(17) Other businesses incidental to any of the
foregoing
2) Core business - Manufacturing and sales of various automobiles and parts.
3) Plant and sales office
Name Substance of Business Location
Pyeongtaek Plant (Main Office)
Changwon Plant
11 offices excluding Guro A/S
Manufacture Vehicles
Manufacture Engine
A/S, sell parts
150-3 Chilgoe-dong, Pyeongtae-si
79 Seongsan-dong, Changwon-si
584-12 Guro-dong, Guro-gu, Seoul
10
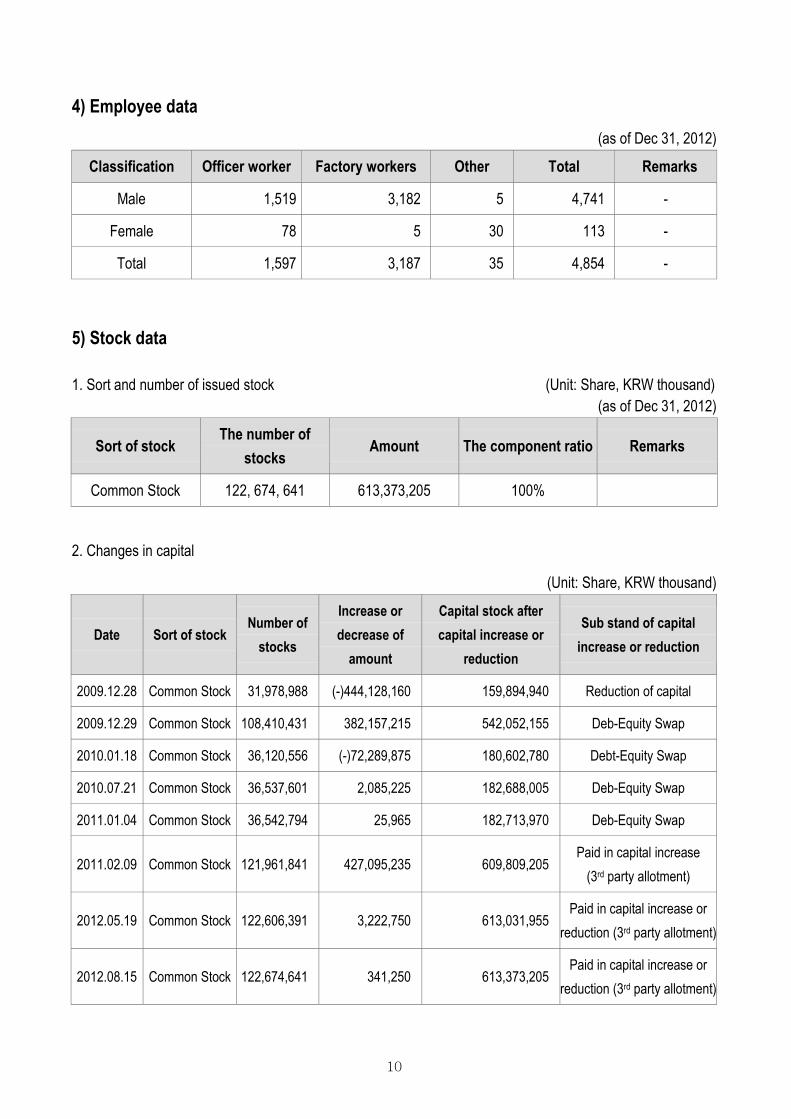
4) Employee data (as of Dec 31, 2012)
Classification Officer worker Factory workers Other Total Remarks
Male 1,519 3,182 5 4,741 -
Female 78 5 30 113 -
Total 1,597 3,187 35 4,854 -
5) Stock data
1. Sort and number of issued stock (Unit: Share, KRW thousand) (as of Dec 31, 2012)
Sort of stock The number of
stocks Amount The component ratio Remarks
Common Stock 122, 674, 641 613,373,205 100%
2. Changes in capital
(Unit: Share, KRW thousand)
Date Sort of stock Number of
stocks
Increase or decrease of
amount
Capital stock after capital increase or
reduction
Sub stand of capital increase or reduction
2009.12.28 Common Stock 31,978,988 (-)444,128,160 159,894,940 Reduction of capital
2009.12.29 Common Stock 108,410,431 382,157,215 542,052,155 Deb-Equity Swap
2010.01.18 Common Stock 36,120,556 (-)72,289,875 180,602,780 Debt-Equity Swap
2010.07.21 Common Stock 36,537,601 2,085,225 182,688,005 Deb-Equity Swap
2011.01.04 Common Stock 36,542,794 25,965 182,713,970 Deb-Equity Swap
2011.02.09 Common Stock 121,961,841 427,095,235 609,809,205 Paid in capital increase
(3rd party allotment)
2012.05.19 Common Stock 122,606,391 3,222,750 613,031,955 Paid in capital increase or
reduction (3rd party allotment)
2012.08.15 Common Stock 122,674,641 341,250 613,373,205 Paid in capital increase or
reduction (3rd party allotment)
11
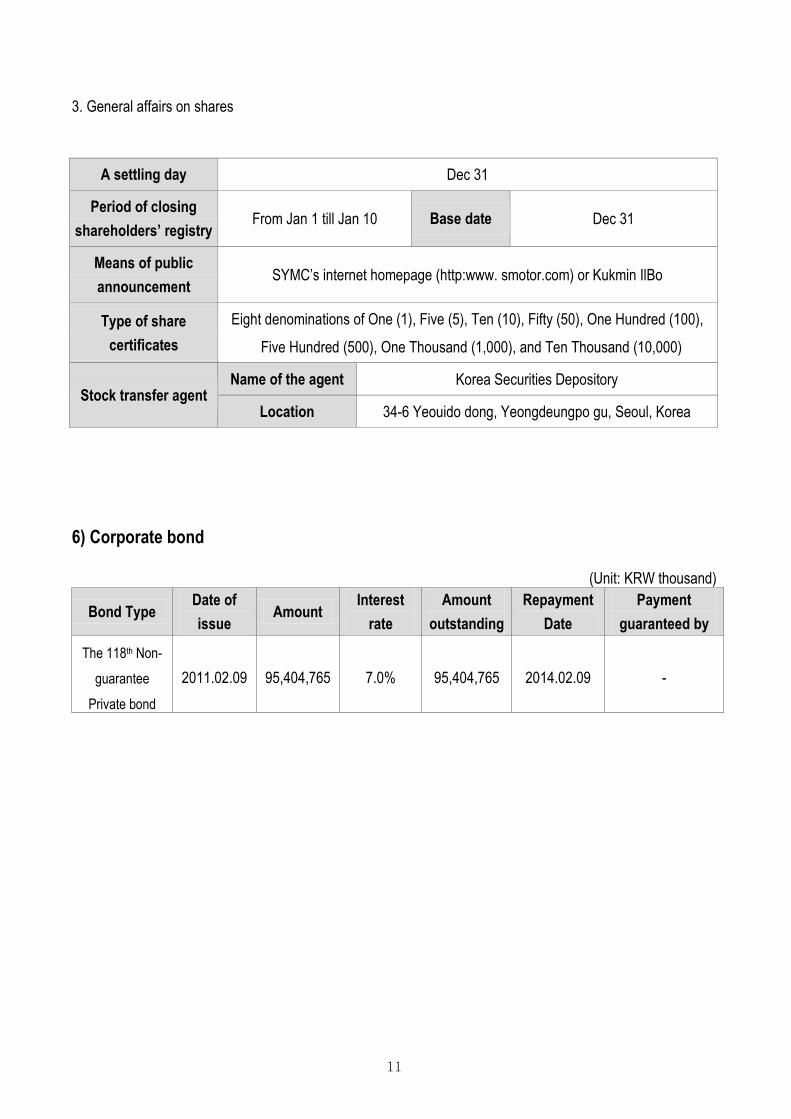
3. General affairs on shares
A settling day Dec 31
Period of closing shareholders’ registry
From Jan 1 till Jan 10 Base date Dec 31
Means of public announcement
SYMC’s internet homepage (http:www. smotor.com) or Kukmin IlBo
Type of share certificates
Eight denominations of One (1), Five (5), Ten (10), Fifty (50), One Hundred (100),
Five Hundred (500), One Thousand (1,000), and Ten Thousand (10,000)
Stock transfer agent Name of the agent Korea Securities Depository
Location 34-6 Yeouido dong, Yeongdeungpo gu, Seoul, Korea
6) Corporate bond
(Unit: KRW thousand)
Bond Type Date of issue
Amount Interest
rate Amount
outstanding Repayment
Date Payment
guaranteed by
The 118th Non-
guarantee
Private bond
2011.02.09 95,404,765 7.0% 95,404,765 2014.02.09 -
12
2. Sales Performance
1) Overall outlook
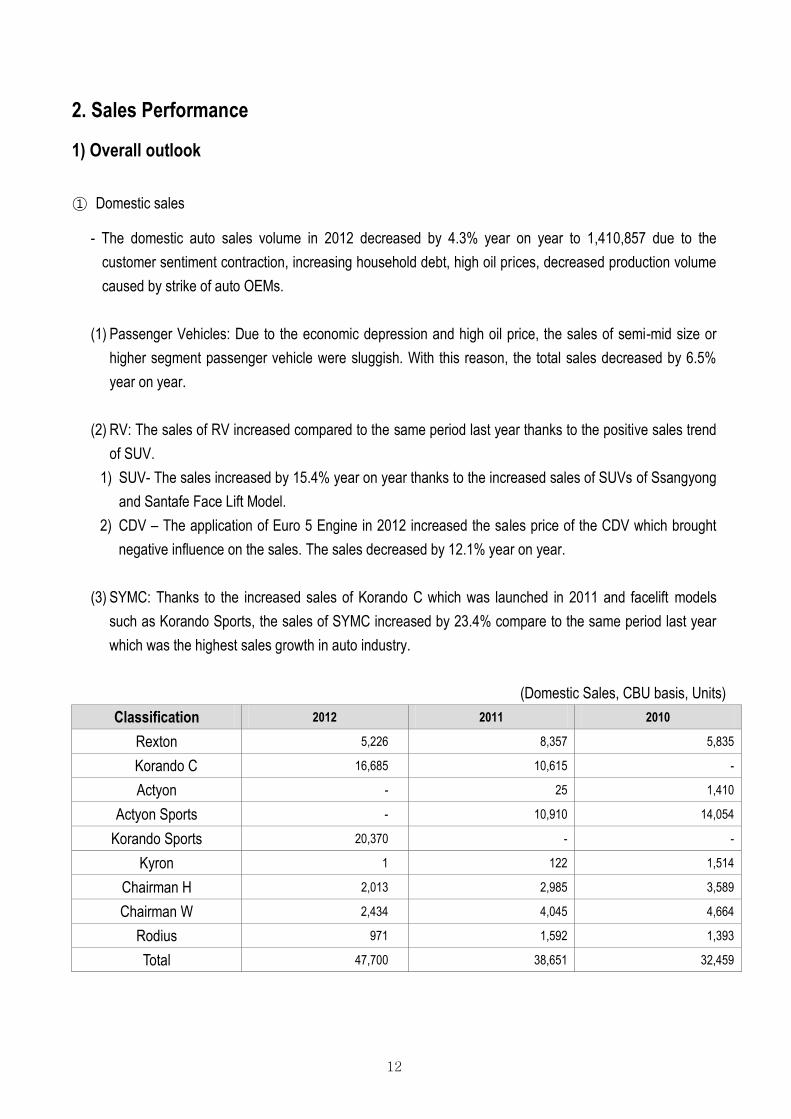
① Domestic sales
- The domestic auto sales volume in 2012 decreased by 4.3% year on year to 1,410,857 due to the
customer sentiment contraction, increasing household debt, high oil prices, decreased production volume
caused by strike of auto OEMs.
(1) Passenger Vehicles: Due to the economic depression and high oil price, the sales of semi-mid size or
higher segment passenger vehicle were sluggish. With this reason, the total sales decreased by 6.5%
year on year.
(2) RV: The sales of RV increased compared to the same period last year thanks to the positive sales trend
of SUV.
1) SUV- The sales increased by 15.4% year on year thanks to the increased sales of SUVs of Ssangyong
and Santafe Face Lift Model.
2) CDV – The application of Euro 5 Engine in 2012 increased the sales price of the CDV which brought
negative influence on the sales. The sales decreased by 12.1% year on year.
(3) SYMC: Thanks to the increased sales of Korando C which was launched in 2011 and facelift models
such as Korando Sports, the sales of SYMC increased by 23.4% compare to the same period last year
which was the highest sales growth in auto industry.
(Domestic Sales, CBU basis, Units)
Classification 2012 2011 2010
Rexton 5,226 8,357 5,835
Korando C 16,685 10,615 -
Actyon - 25 1,410
Actyon Sports - 10,910 14,054
Korando Sports 20,370 - -
Kyron 1 122 1,514
Chairman H 2,013 2,985 3,589
Chairman W 2,434 4,045 4,664
Rodius 971 1,592 1,393
Total 47,700 38,651 32,459
13
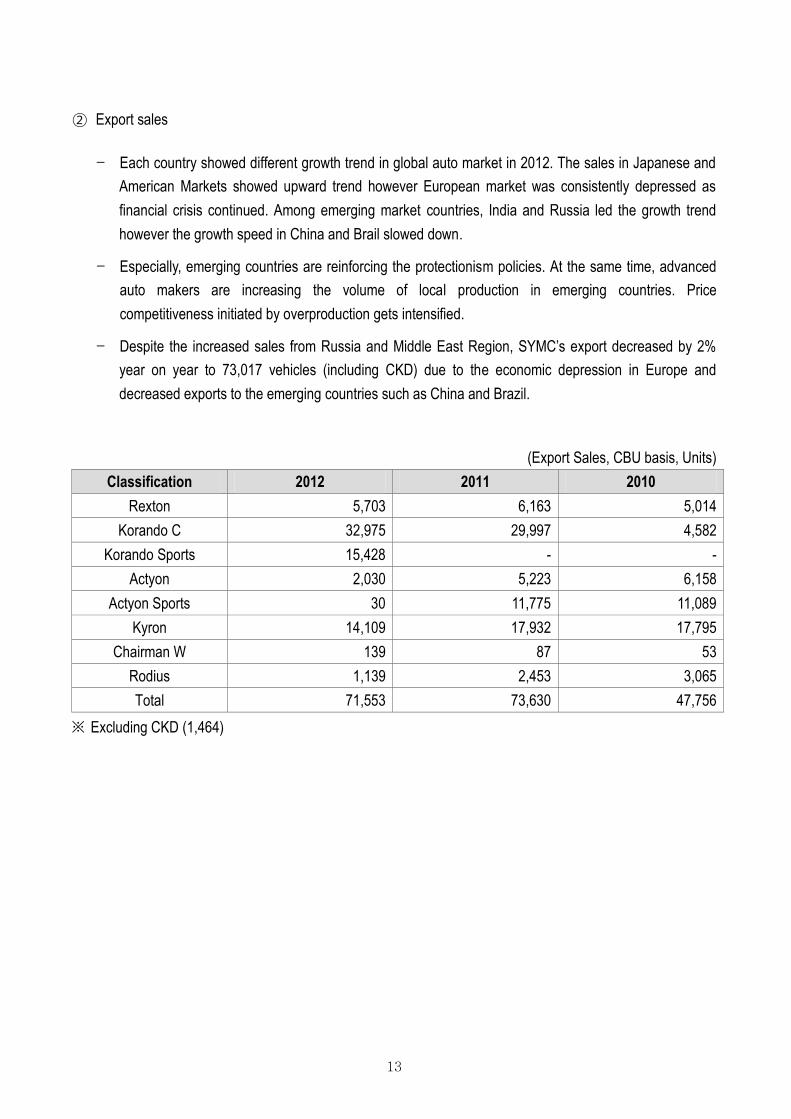
② Export sales
- Each country showed different growth trend in global auto market in 2012. The sales in Japanese and
American Markets showed upward trend however European market was consistently depressed as
financial crisis continued. Among emerging market countries, India and Russia led the growth trend
however the growth speed in China and Brail slowed down.
- Especially, emerging countries are reinforcing the protectionism policies. At the same time, advanced
auto makers are increasing the volume of local production in emerging countries. Price
competitiveness initiated by overproduction gets intensified.
- Despite the increased sales from Russia and Middle East Region, SYMC’s export decreased by 2%
year on year to 73,017 vehicles (including CKD) due to the economic depression in Europe and
decreased exports to the emerging countries such as China and Brazil.
(Export Sales, CBU basis, Units)
Classification 2012 2011 2010 Rexton 5,703 6,163 5,014
Korando C 32,975 29,997 4,582
Korando Sports 15,428 - -
Actyon 2,030 5,223 6,158
Actyon Sports 30 11,775 11,089
Kyron 14,109 17,932 17,795
Chairman W 139 87 53
Rodius 1,139 2,453 3,065
Total 71,553 73,630 47,756
※ Excluding CKD (1,464)
14
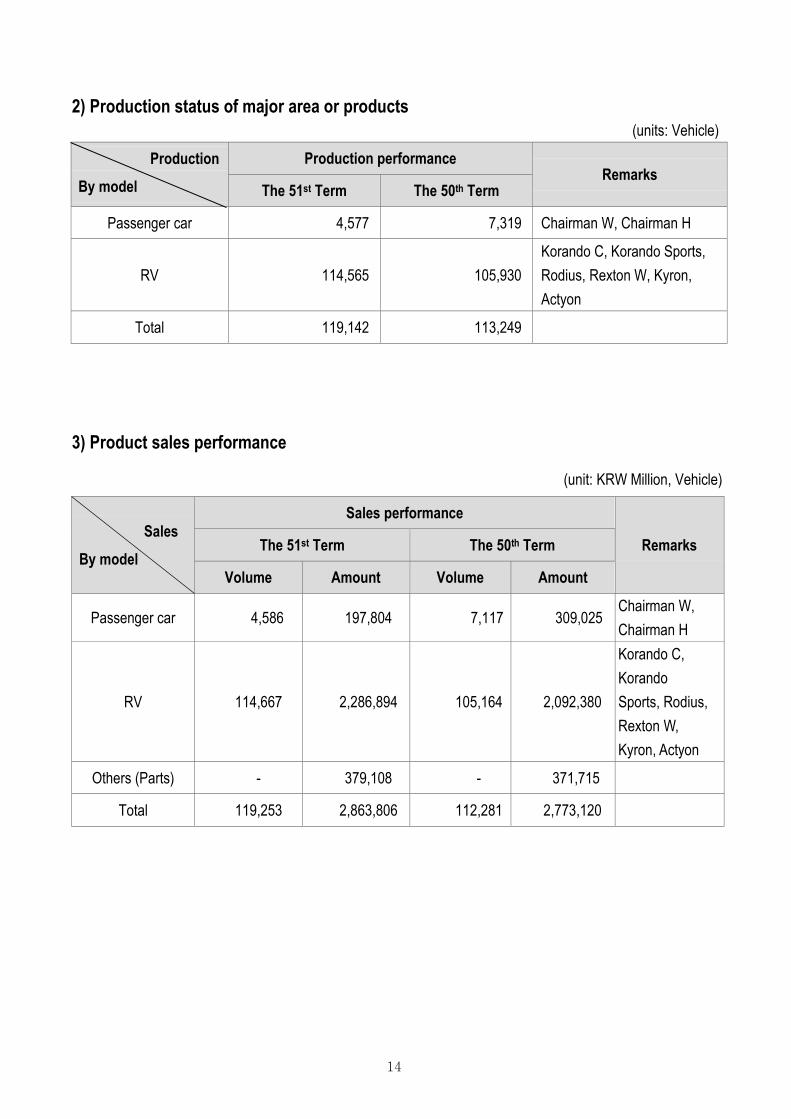
2) Production status of major area or products (units: Vehicle)
Production By model
Production performance Remarks
The 51st Term The 50th Term
Passenger car 4,577 7,319 Chairman W, Chairman H
RV 114,565 105,930
Korando C, Korando Sports,
Rodius, Rexton W, Kyron,
Actyon
Total 119,142 113,249
3) Product sales performance (unit: KRW Million, Vehicle)
Sales By model
Sales performance
Remarks The 51st Term The 50th Term
Volume Amount Volume Amount
Passenger car 4,586 197,804 7,117 309,025 Chairman W,
Chairman H
RV 114,667 2,286,894 105,164 2,092,380
Korando C,
Korando
Sports, Rodius,
Rexton W,
Kyron, Actyon
Others (Parts) - 379,108 - 371,715
Total 119,253 2,863,806 112,281 2,773,120
15
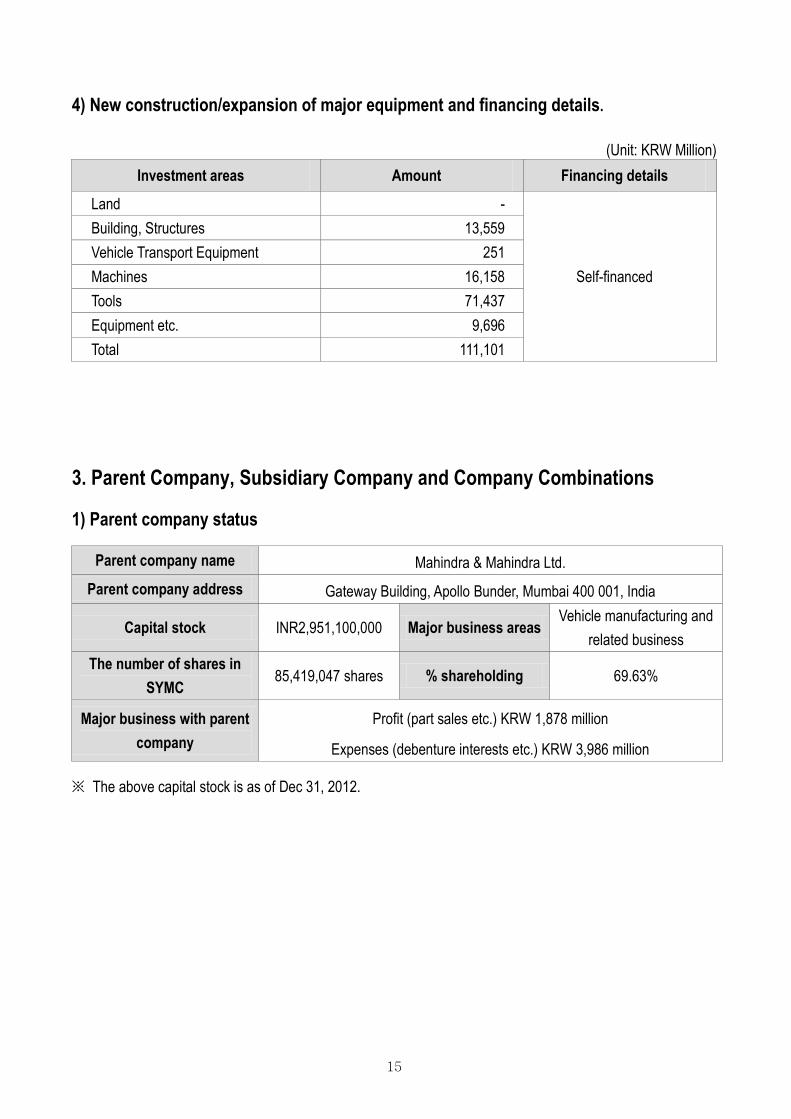
4) New construction/expansion of major equipment and financing details.
(Unit: KRW Million)
Investment areas Amount Financing details
Land -
Self-financed
Building, Structures 13,559
Vehicle Transport Equipment 251
Machines 16,158
Tools 71,437
Equipment etc. 9,696
Total 111,101
3. Parent Company, Subsidiary Company and Company Combinations
1) Parent company status
Parent company name Mahindra & Mahindra Ltd.
Parent company address Gateway Building, Apollo Bunder, Mumbai 400 001, India
Capital stock INR2,951,100,000 Major business areas Vehicle manufacturing and
related business
The number of shares in SYMC
85,419,047 shares % shareholding 69.63%
Major business with parent company
Profit (part sales etc.) KRW 1,878 million
Expenses (debenture interests etc.) KRW 3,986 million
※ The above capital stock is as of Dec 31, 2012.
16
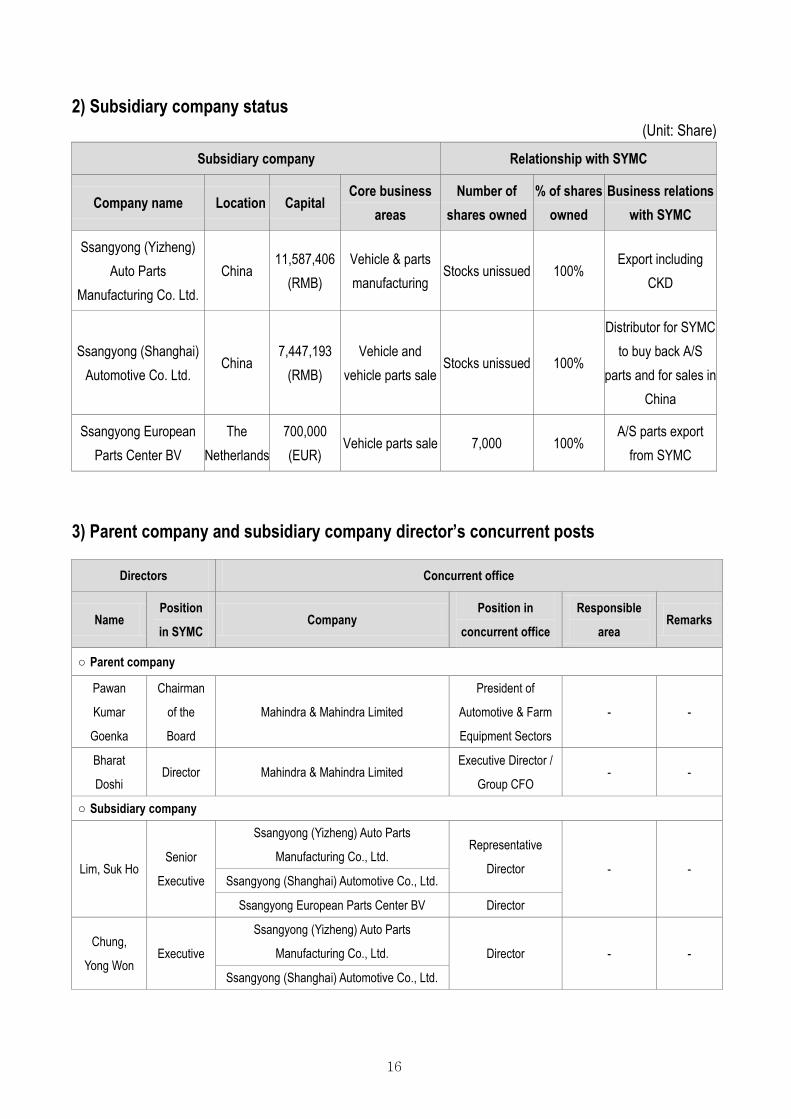
2) Subsidiary company status (Unit: Share)
Subsidiary company Relationship with SYMC
Company name Location Capital Core business
areas Number of
shares owned % of shares
owned Business relations
with SYMC
Ssangyong (Yizheng)
Auto Parts
Manufacturing Co. Ltd.
China 11,587,406
(RMB)
Vehicle & parts
manufacturing Stocks unissued 100%
Export including
CKD
Ssangyong (Shanghai)
Automotive Co. Ltd. China
7,447,193
(RMB)
Vehicle and
vehicle parts sale Stocks unissued 100%
Distributor for SYMC
to buy back A/S
parts and for sales in
China
Ssangyong European
Parts Center BV
The
Netherlands
700,000
(EUR) Vehicle parts sale 7,000 100%
A/S parts export
from SYMC
3) Parent company and subsidiary company director’s concurrent posts
Directors Concurrent office
Name Position
in SYMC Company
Position in
concurrent office
Responsible
area Remarks
○ Parent company
Pawan
Kumar
Goenka
Chairman
of the
Board
Mahindra & Mahindra Limited
President of
Automotive & Farm
Equipment Sectors
- -
Bharat
Doshi Director Mahindra & Mahindra Limited
Executive Director /
Group CFO - -
○ Subsidiary company
Lim, Suk Ho Senior
Executive
Ssangyong (Yizheng) Auto Parts
Manufacturing Co., Ltd. Representative
Director - - Ssangyong (Shanghai) Automotive Co., Ltd.
Ssangyong European Parts Center BV Director
Chung,
Yong Won Executive
Ssangyong (Yizheng) Auto Parts
Manufacturing Co., Ltd. Director - -
Ssangyong (Shanghai) Automotive Co., Ltd.
17
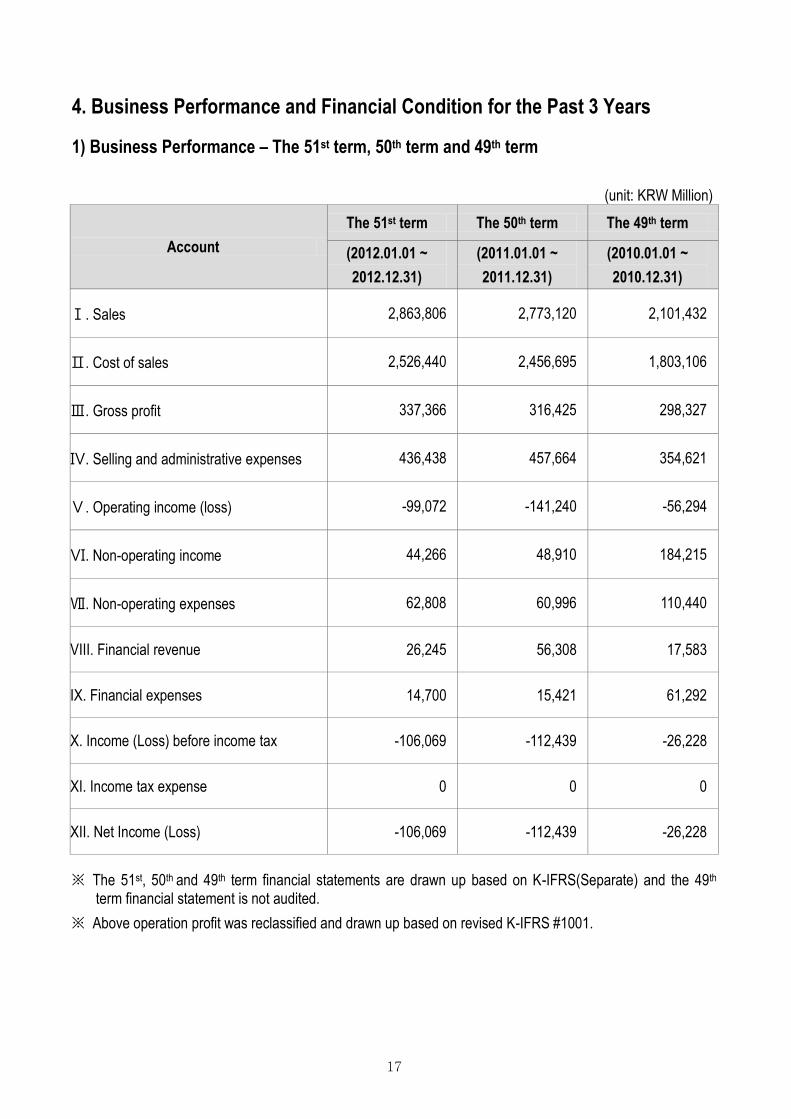
4. Business Performance and Financial Condition for the Past 3 Years
1) Business Performance – The 51st term, 50th term and 49th term
(unit: KRW Million)
Account The 51st term The 50th term The 49th term
(2012.01.01 ~ 2012.12.31)
(2011.01.01 ~ 2011.12.31)
(2010.01.01 ~ 2010.12.31)
Ⅰ. Sales 2,863,806 2,773,120 2,101,432
Ⅱ. Cost of sales 2,526,440 2,456,695 1,803,106
Ⅲ. Gross profit 337,366 316,425 298,327
Ⅳ. Selling and administrative expenses 436,438 457,664 354,621
Ⅴ. Operating income (loss) -99,072 -141,240 -56,294
Ⅵ. Non-operating income 44,266 48,910 184,215
Ⅶ. Non-operating expenses 62,808 60,996 110,440
VIII. Financial revenue 26,245 56,308 17,583
IX. Financial expenses 14,700 15,421 61,292
X. Income (Loss) before income tax -106,069 -112,439 -26,228
XI. Income tax expense 0 0 0
XII. Net Income (Loss) -106,069 -112,439 -26,228
※ The 51st, 50th and 49th term financial statements are drawn up based on K-IFRS(Separate) and the 49th term financial statement is not audited.
※ Above operation profit was reclassified and drawn up based on revised K-IFRS #1001.
18
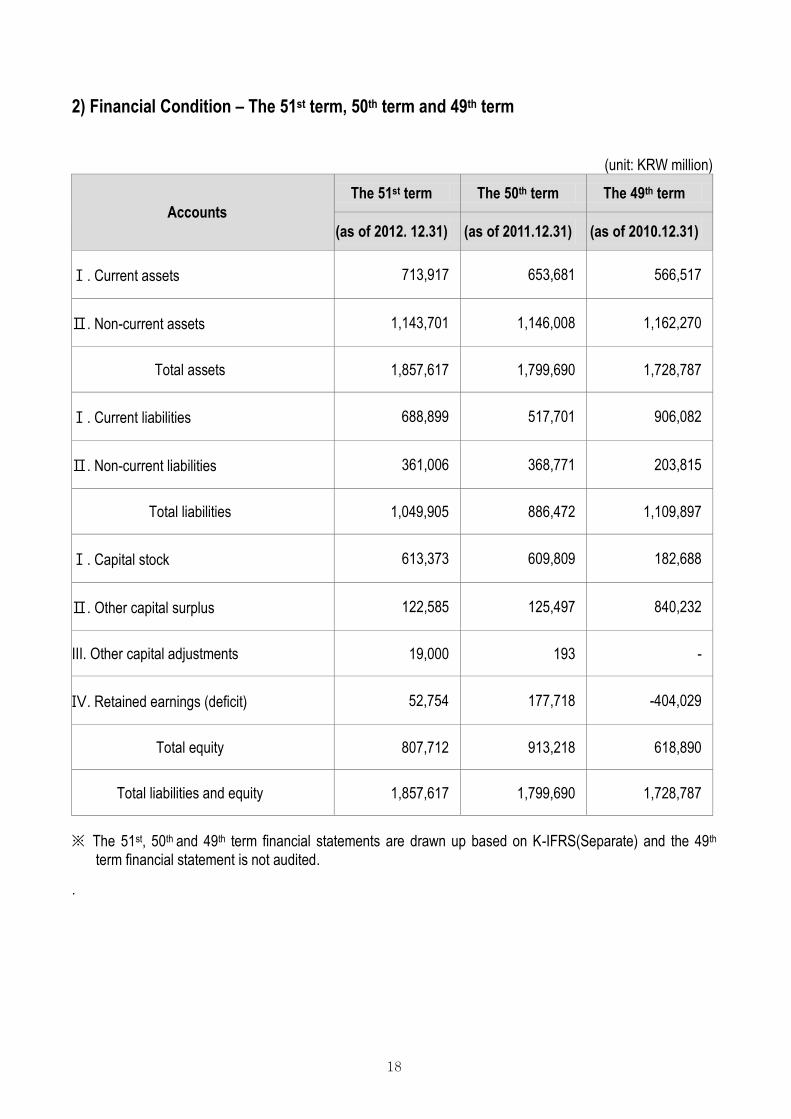
2) Financial Condition – The 51st term, 50th term and 49th term
(unit: KRW million)
Accounts The 51st term The 50th term The 49th term
(as of 2012. 12.31) (as of 2011.12.31) (as of 2010.12.31)
Ⅰ. Current assets 713,917 653,681 566,517
Ⅱ. Non-current assets 1,143,701 1,146,008 1,162,270
Total assets 1,857,617 1,799,690 1,728,787
Ⅰ. Current liabilities 688,899 517,701 906,082
Ⅱ. Non-current liabilities 361,006 368,771 203,815
Total liabilities 1,049,905 886,472 1,109,897
Ⅰ. Capital stock 613,373 609,809 182,688
Ⅱ. Other capital surplus 122,585 125,497 840,232
III. Other capital adjustments 19,000 193 -
Ⅳ. Retained earnings (deficit) 52,754 177,718 -404,029
Total equity 807,712 913,218 618,890
Total liabilities and equity 1,857,617 1,799,690 1,728,787
※ The 51st, 50th and 49th term financial statements are drawn up based on K-IFRS(Separate) and the 49th term financial statement is not audited.
.
19
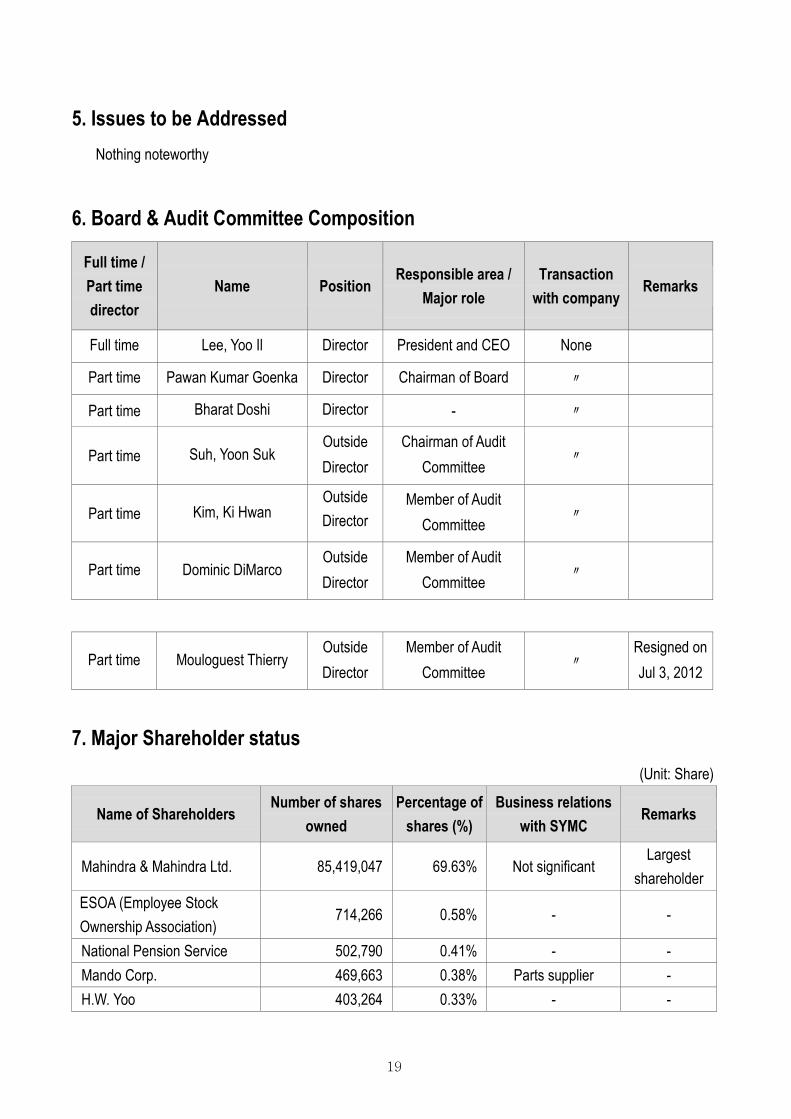
5. Issues to be Addressed
Nothing noteworthy
6. Board & Audit Committee Composition
Full time / Part time director
Name Position Responsible area /
Major role Transaction
with company Remarks
Full time Lee, Yoo Il Director President and CEO None
Part time Pawan Kumar Goenka Director Chairman of Board 〃
Part time Bharat Doshi Director - 〃
Part time Suh, Yoon Suk Outside
Director
Chairman of Audit
Committee 〃
Part time Kim, Ki Hwan Outside
Director
Member of Audit
Committee 〃
Part time Dominic DiMarco Outside
Director
Member of Audit
Committee 〃
Part time Mouloguest Thierry Outside
Director
Member of Audit
Committee 〃
Resigned on
Jul 3, 2012
7. Major Shareholder status
(Unit: Share)
Name of Shareholders Number of shares
owned Percentage of
shares (%) Business relations
with SYMC Remarks
Mahindra & Mahindra Ltd. 85,419,047 69.63% Not significant Largest
shareholder
ESOA (Employee Stock
Ownership Association) 714,266 0.58% - -
National Pension Service 502,790 0.41% - -
Mando Corp. 469,663 0.38% Parts supplier -
H.W. Yoo 403,264 0.33% - -
20
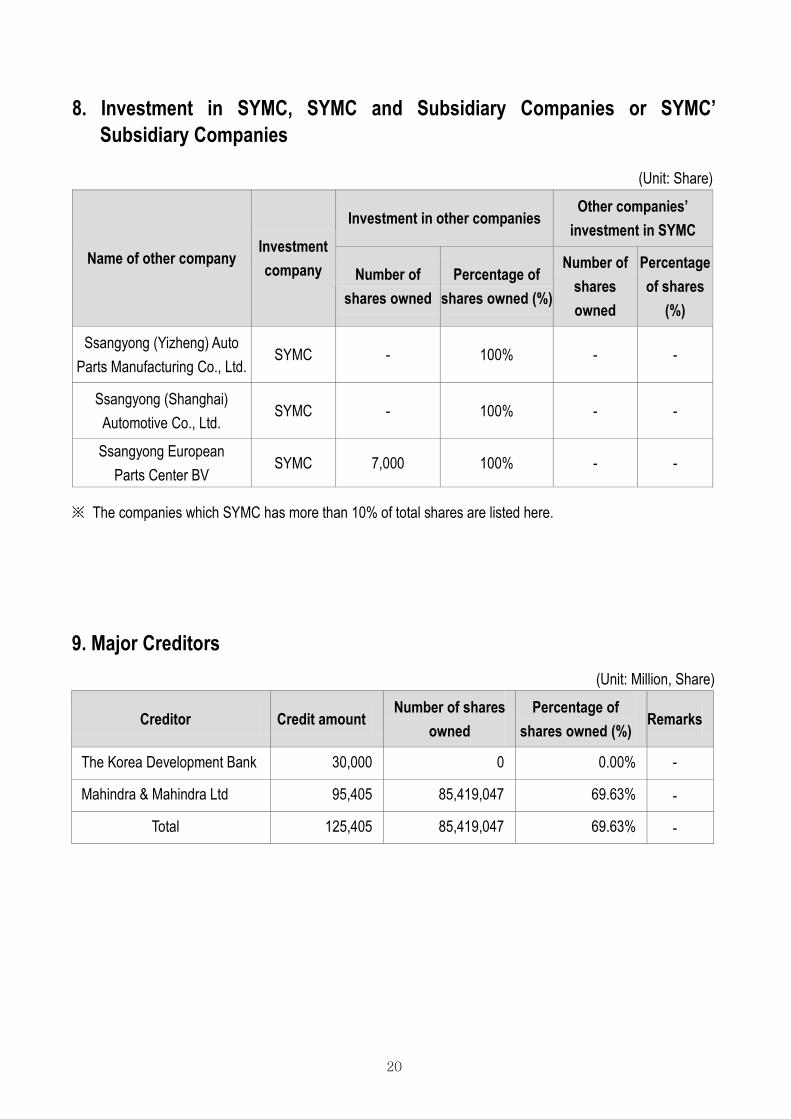
8. Investment in SYMC, SYMC and Subsidiary Companies or SYMC’ Subsidiary Companies
(Unit: Share)
Name of other company Investment company
Investment in other companies Other companies’
investment in SYMC
Number of shares owned
Percentage of shares owned (%)
Number of shares owned
Percentage of shares
(%)
Ssangyong (Yizheng) Auto
Parts Manufacturing Co., Ltd. SYMC - 100% - -
Ssangyong (Shanghai)
Automotive Co., Ltd. SYMC - 100% - -
Ssangyong European
Parts Center BV SYMC 7,000 100% - -
※ The companies which SYMC has more than 10% of total shares are listed here.
9. Major Creditors
(Unit: Million, Share)
Creditor Credit amount Number of shares
owned Percentage of
shares owned (%) Remarks
The Korea Development Bank 30,000 0 0.00% -
Mahindra & Mahindra Ltd 95,405 85,419,047 69.63% -
Total 125,405 85,419,047 69.63% -
21
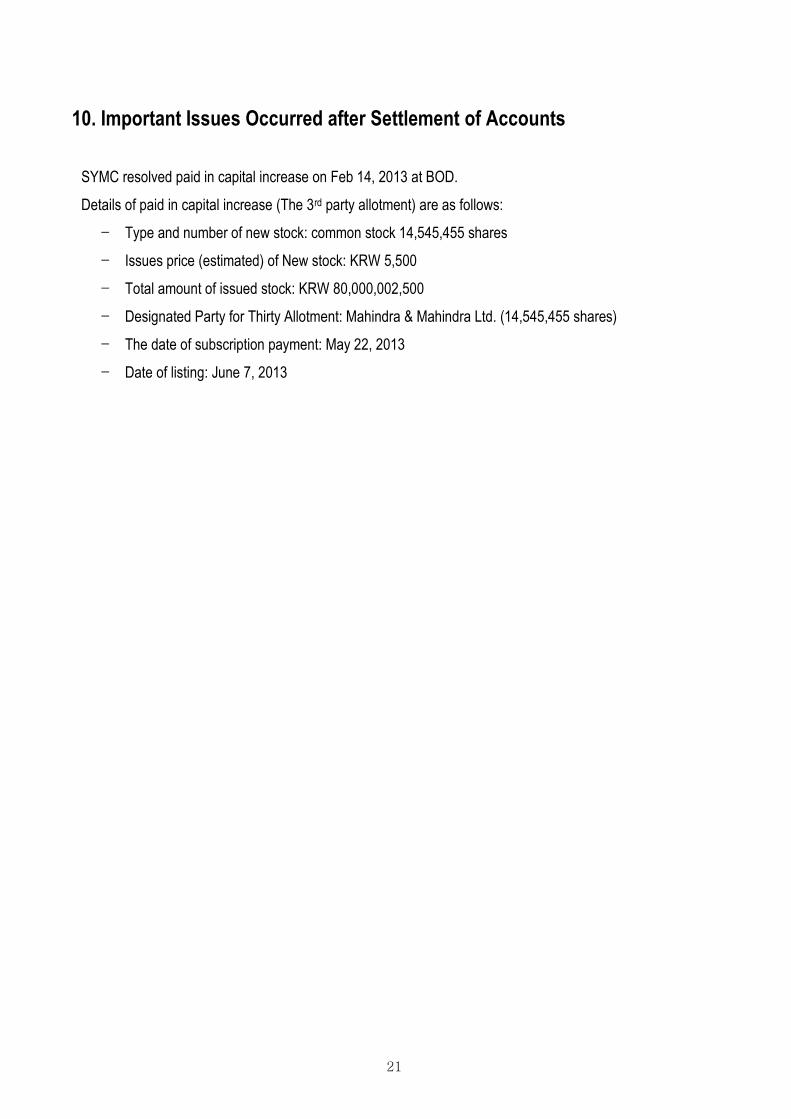
10. Important Issues Occurred after Settlement of Accounts
SYMC resolved paid in capital increase on Feb 14, 2013 at BOD.
Details of paid in capital increase (The 3rd party allotment) are as follows:
- Type and number of new stock: common stock 14,545,455 shares
- Issues price (estimated) of New stock: KRW 5,500
- Total amount of issued stock: KRW 80,000,002,500
- Designated Party for Thirty Allotment: Mahindra & Mahindra Ltd. (14,545,455 shares)
- The date of subscription payment: May 22, 2013
- Date of listing: June 7, 2013
22
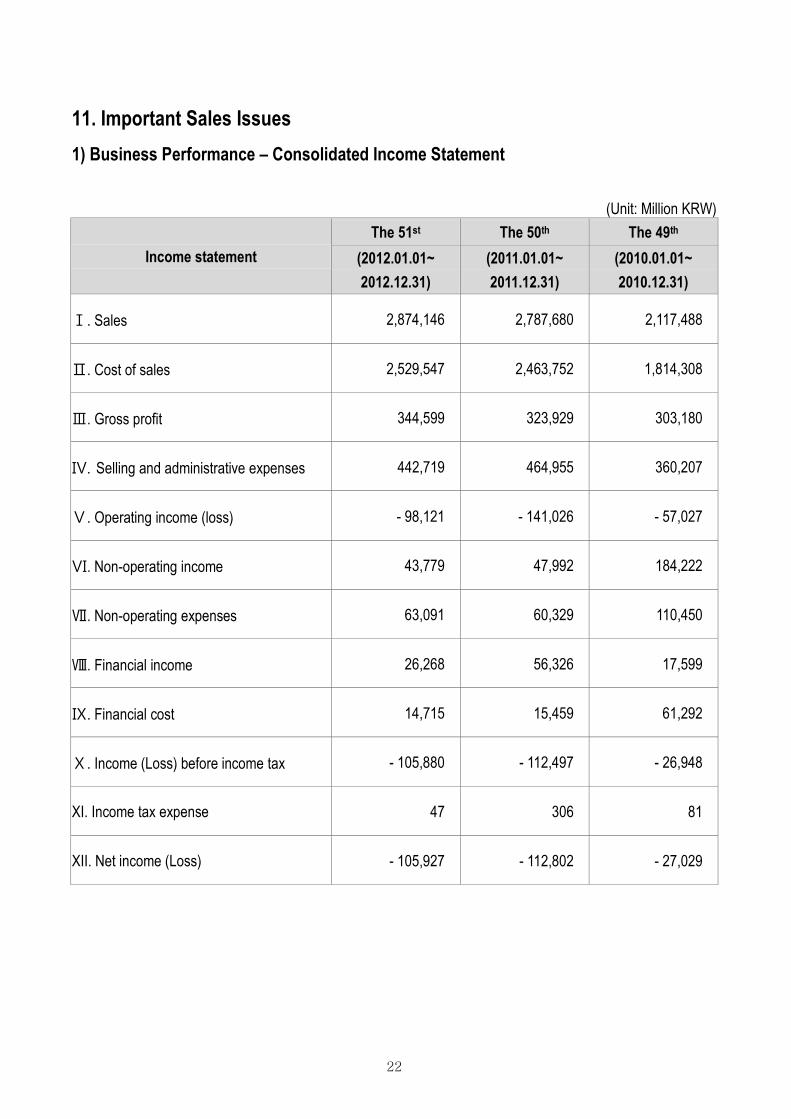
11. Important Sales Issues 1) Business Performance – Consolidated Income Statement
(Unit: Million KRW)
Income statement The 51st The 50th The 49th
(2012.01.01~ 2012.12.31)
(2011.01.01~ 2011.12.31)
(2010.01.01~ 2010.12.31)
Ⅰ. Sales 2,874,146 2,787,680 2,117,488
Ⅱ. Cost of sales 2,529,547 2,463,752 1,814,308
Ⅲ. Gross profit 344,599 323,929 303,180
Ⅳ. Selling and administrative expenses 442,719 464,955 360,207
Ⅴ. Operating income (loss) - 98,121 - 141,026 - 57,027
Ⅵ. Non-operating income 43,779 47,992 184,222
Ⅶ. Non-operating expenses 63,091 60,329 110,450
Ⅷ. Financial income 26,268 56,326 17,599
Ⅸ. Financial cost 14,715 15,459 61,292
Ⅹ. Income (Loss) before income tax - 105,880 - 112,497 - 26,948
XI. Income tax expense 47 306 81
XII. Net income (Loss) - 105,927 - 112,802 - 27,029
23
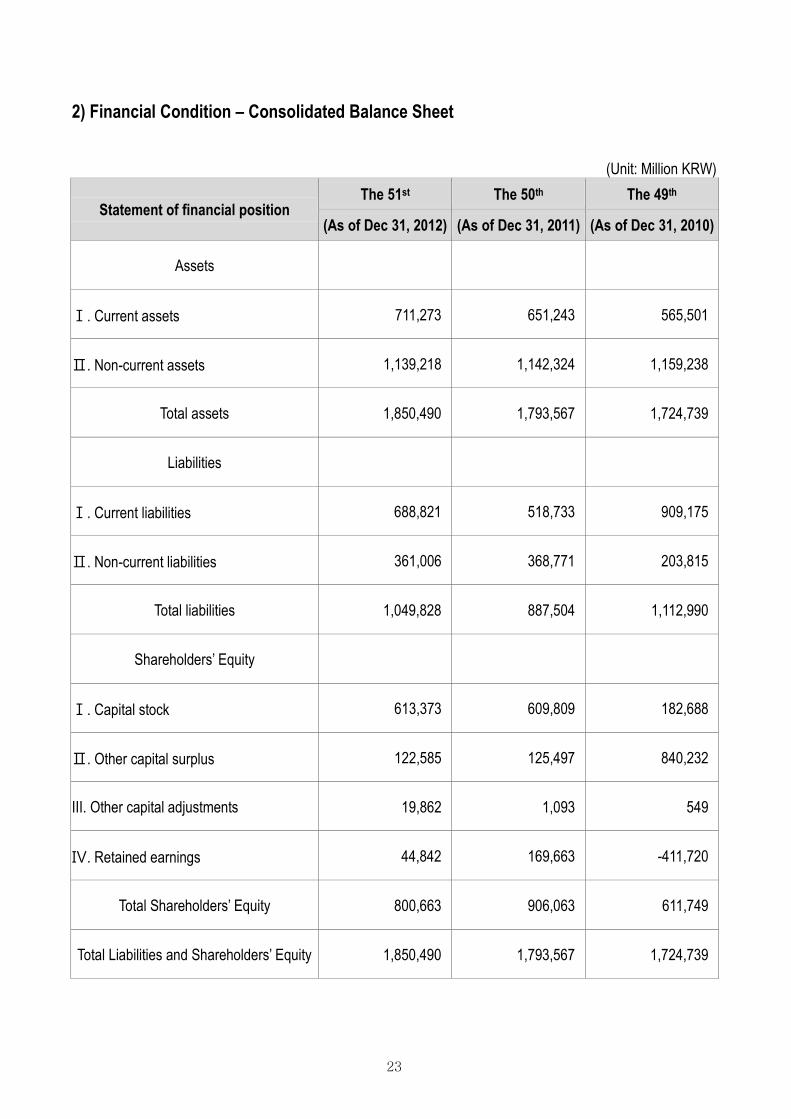
2) Financial Condition – Consolidated Balance Sheet
(Unit: Million KRW)
Statement of financial position The 51st The 50th The 49th
(As of Dec 31, 2012) (As of Dec 31, 2011) (As of Dec 31, 2010)
Assets
Ⅰ. Current assets 711,273 651,243 565,501
Ⅱ. Non-current assets 1,139,218 1,142,324 1,159,238
Total assets 1,850,490 1,793,567 1,724,739
Liabilities
Ⅰ. Current liabilities 688,821 518,733 909,175
Ⅱ. Non-current liabilities 361,006 368,771 203,815
Total liabilities 1,049,828 887,504 1,112,990
Shareholders’ Equity
Ⅰ. Capital stock 613,373 609,809 182,688
Ⅱ. Other capital surplus 122,585 125,497 840,232
III. Other capital adjustments 19,862 1,093 549
Ⅳ. Retained earnings 44,842 169,663 -411,720
Total Shareholders’ Equity 800,663 906,063 611,749
Total Liabilities and Shareholders’ Equity 1,850,490 1,793,567 1,724,739
24
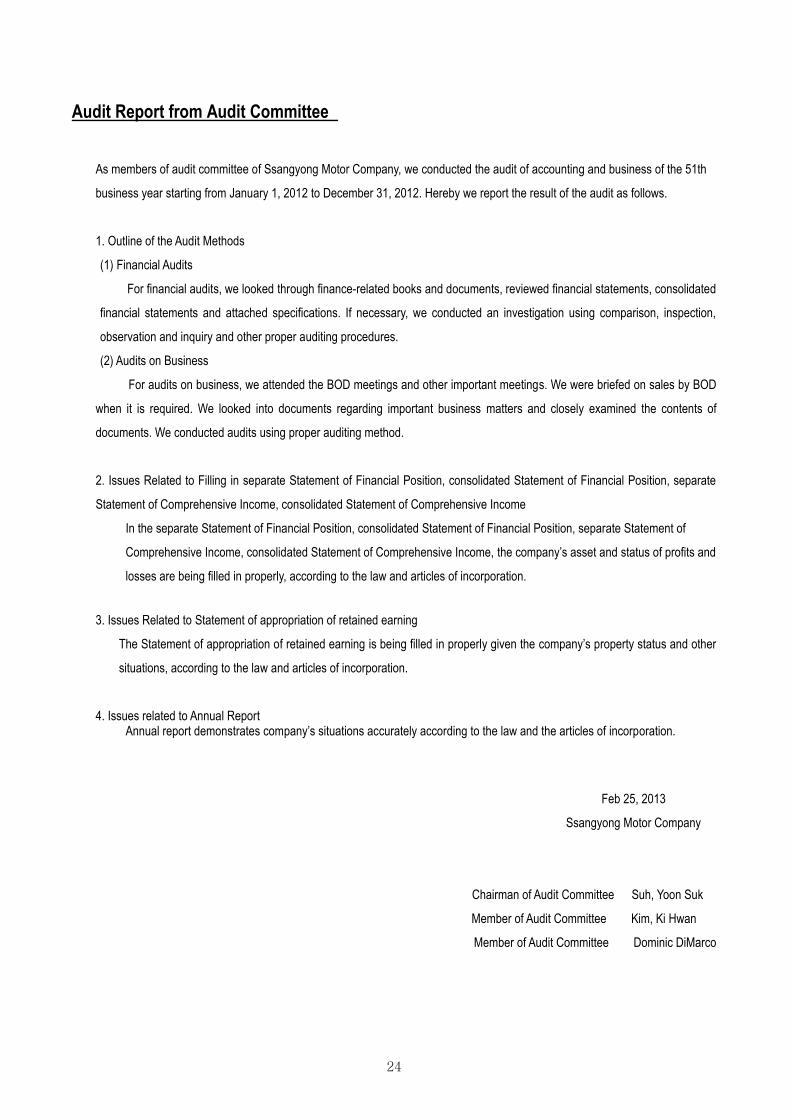
Audit Report from Audit Committee
As members of audit committee of Ssangyong Motor Company, we conducted the audit of accounting and business of the 51th
business year starting from January 1, 2012 to December 31, 2012. Hereby we report the result of the audit as follows.
1. Outline of the Audit Methods
(1) Financial Audits
For financial audits, we looked through finance-related books and documents, reviewed financial statements, consolidated
financial statements and attached specifications. If necessary, we conducted an investigation using comparison, inspection,
observation and inquiry and other proper auditing procedures.
(2) Audits on Business
For audits on business, we attended the BOD meetings and other important meetings. We were briefed on sales by BOD
when it is required. We looked into documents regarding important business matters and closely examined the contents of
documents. We conducted audits using proper auditing method.
2. Issues Related to Filling in separate Statement of Financial Position, consolidated Statement of Financial Position, separate
Statement of Comprehensive Income, consolidated Statement of Comprehensive Income
In the separate Statement of Financial Position, consolidated Statement of Financial Position, separate Statement of
Comprehensive Income, consolidated Statement of Comprehensive Income, the company’s asset and status of profits and
losses are being filled in properly, according to the law and articles of incorporation.
3. Issues Related to Statement of appropriation of retained earning
The Statement of appropriation of retained earning is being filled in properly given the company’s property status and other
situations, according to the law and articles of incorporation.
4. Issues related to Annual Report Annual report demonstrates company’s situations accurately according to the law and the articles of incorporation.
Feb 25, 2013
Ssangyong Motor Company
Chairman of Audit Committee Suh, Yoon Suk
Member of Audit Committee Kim, Ki Hwan
Member of Audit Committee Dominic DiMarco
25
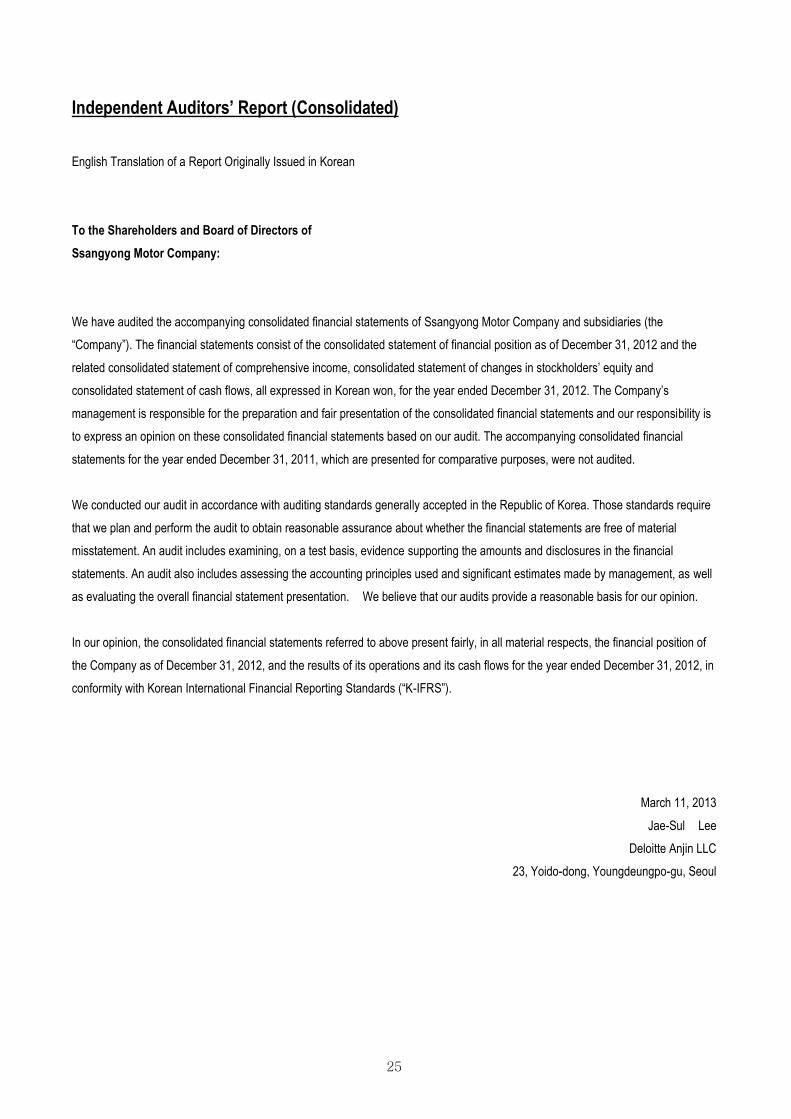
Independent Auditors’ Report (Consolidated)
English Translation of a Report Originally Issued in Korean
To the Shareholders and Board of Directors of Ssangyong Motor Company:
We have audited the accompanying consolidated financial statements of Ssangyong Motor Company and subsidiaries (the
“Company”). The financial statements consist of the consolidated statement of financial position as of December 31, 2012 and the
related consolidated statement of comprehensive income, consolidated statement of changes in stockholders’ equity and
consolidated statement of cash flows, all expressed in Korean won, for the year ended December 31, 2012. The Company’s
management is responsible for the preparation and fair presentation of the consolidated financial statements and our responsibility is
to express an opinion on these consolidated financial statements based on our audit. The accompanying consolidated financial
statements for the year ended December 31, 2011, which are presented for comparative purposes, were not audited.
We conducted our audit in accordance with auditing standards generally accepted in the Republic of Korea. Those standards require
that we plan and perform the audit to obtain reasonable assurance about whether the financial statements are free of material
misstatement. An audit includes examining, on a test basis, evidence supporting the amounts and disclosures in the financial
statements. An audit also includes assessing the accounting principles used and significant estimates made by management, as well
as evaluating the overall financial statement presentation. We believe that our audits provide a reasonable basis for our opinion.
In our opinion, the consolidated financial statements referred to above present fairly, in all material respects, the financial position of
the Company as of December 31, 2012, and the results of its operations and its cash flows for the year ended December 31, 2012, in
conformity with Korean International Financial Reporting Standards (“K-IFRS”).
March 11, 2013
Jae-Sul Lee
Deloitte Anjin LLC
23, Yoido-dong, Youngdeungpo-gu, Seoul
26
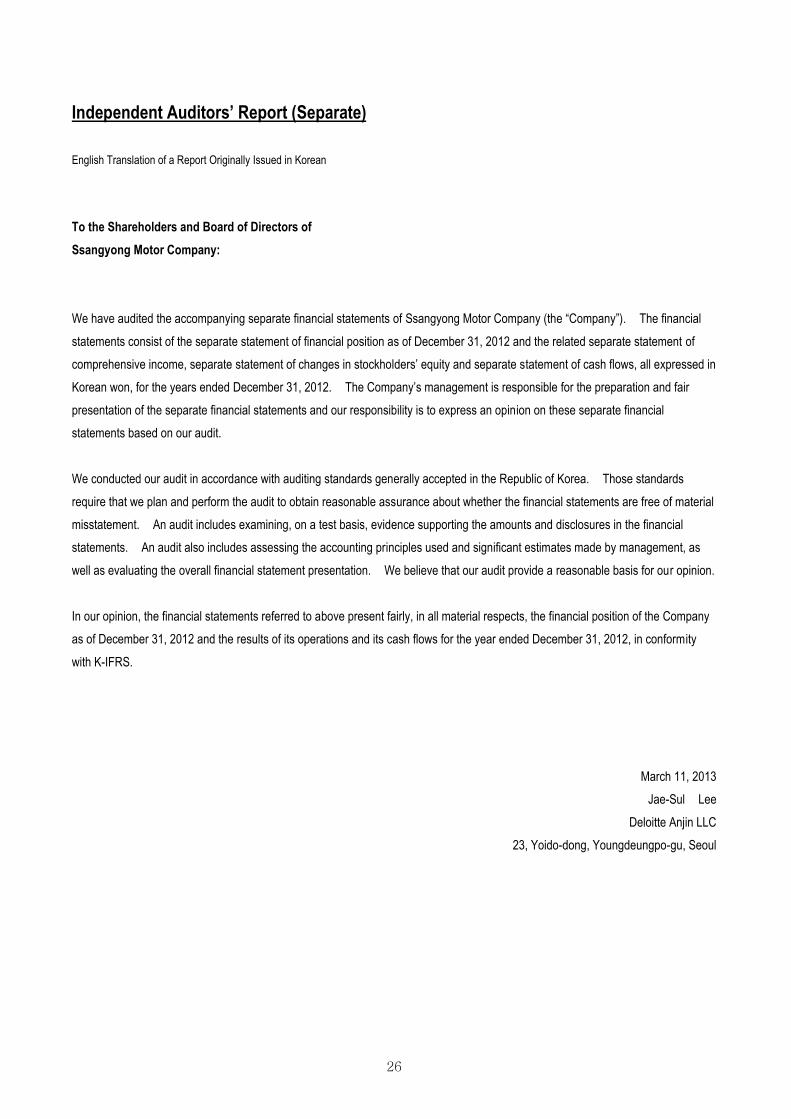
Independent Auditors’ Report (Separate)
English Translation of a Report Originally Issued in Korean
To the Shareholders and Board of Directors of Ssangyong Motor Company:
We have audited the accompanying separate financial statements of Ssangyong Motor Company (the “Company”). The financial
statements consist of the separate statement of financial position as of December 31, 2012 and the related separate statement of
comprehensive income, separate statement of changes in stockholders’ equity and separate statement of cash flows, all expressed in
Korean won, for the years ended December 31, 2012. The Company’s management is responsible for the preparation and fair
presentation of the separate financial statements and our responsibility is to express an opinion on these separate financial
statements based on our audit.
We conducted our audit in accordance with auditing standards generally accepted in the Republic of Korea. Those standards
require that we plan and perform the audit to obtain reasonable assurance about whether the financial statements are free of material
misstatement. An audit includes examining, on a test basis, evidence supporting the amounts and disclosures in the financial
statements. An audit also includes assessing the accounting principles used and significant estimates made by management, as
well as evaluating the overall financial statement presentation. We believe that our audit provide a reasonable basis for our opinion.
In our opinion, the financial statements referred to above present fairly, in all material respects, the financial position of the Company
as of December 31, 2012 and the results of its operations and its cash flows for the year ended December 31, 2012, in conformity
with K-IFRS.
March 11, 2013
Jae-Sul Lee
Deloitte Anjin LLC
23, Yoido-dong, Youngdeungpo-gu, Seoul
27
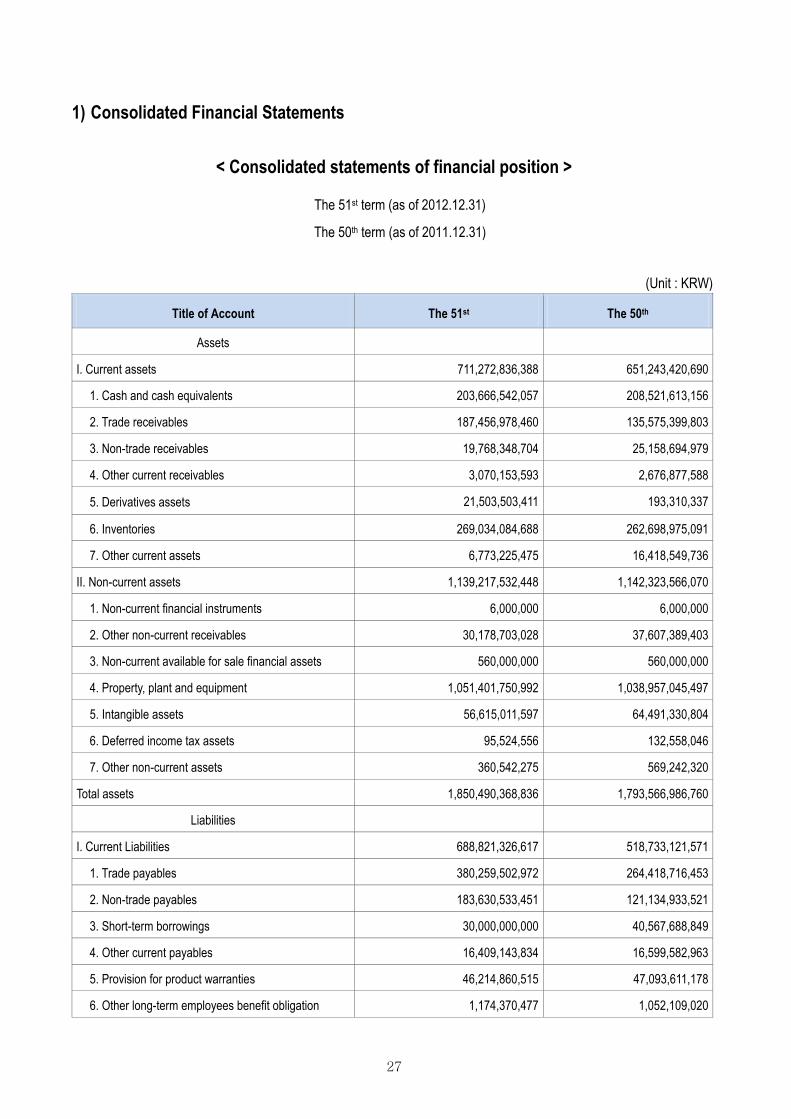
1) Consolidated Financial Statements
< Consolidated statements of financial position >
The 51st term (as of 2012.12.31)
The 50th term (as of 2011.12.31)
(Unit : KRW)
Title of Account The 51st The 50th
Assets
I. Current assets 711,272,836,388 651,243,420,690
1. Cash and cash equivalents 203,666,542,057 208,521,613,156
2. Trade receivables 187,456,978,460 135,575,399,803
3. Non-trade receivables 19,768,348,704 25,158,694,979
4. Other current receivables 3,070,153,593 2,676,877,588
5. Derivatives assets 21,503,503,411 193,310,337
6. Inventories 269,034,084,688 262,698,975,091
7. Other current assets 6,773,225,475 16,418,549,736
II. Non-current assets 1,139,217,532,448 1,142,323,566,070
1. Non-current financial instruments 6,000,000 6,000,000
2. Other non-current receivables 30,178,703,028 37,607,389,403
3. Non-current available for sale financial assets 560,000,000 560,000,000
4. Property, plant and equipment 1,051,401,750,992 1,038,957,045,497
5. Intangible assets 56,615,011,597 64,491,330,804
6. Deferred income tax assets 95,524,556 132,558,046
7. Other non-current assets 360,542,275 569,242,320
Total assets 1,850,490,368,836 1,793,566,986,760
Liabilities
I. Current Liabilities 688,821,326,617 518,733,121,571
1. Trade payables 380,259,502,972 264,418,716,453
2. Non-trade payables 183,630,533,451 121,134,933,521
3. Short-term borrowings 30,000,000,000 40,567,688,849
4. Other current payables 16,409,143,834 16,599,582,963
5. Provision for product warranties 46,214,860,515 47,093,611,178
6. Other long-term employees benefit obligation 1,174,370,477 1,052,109,020
28
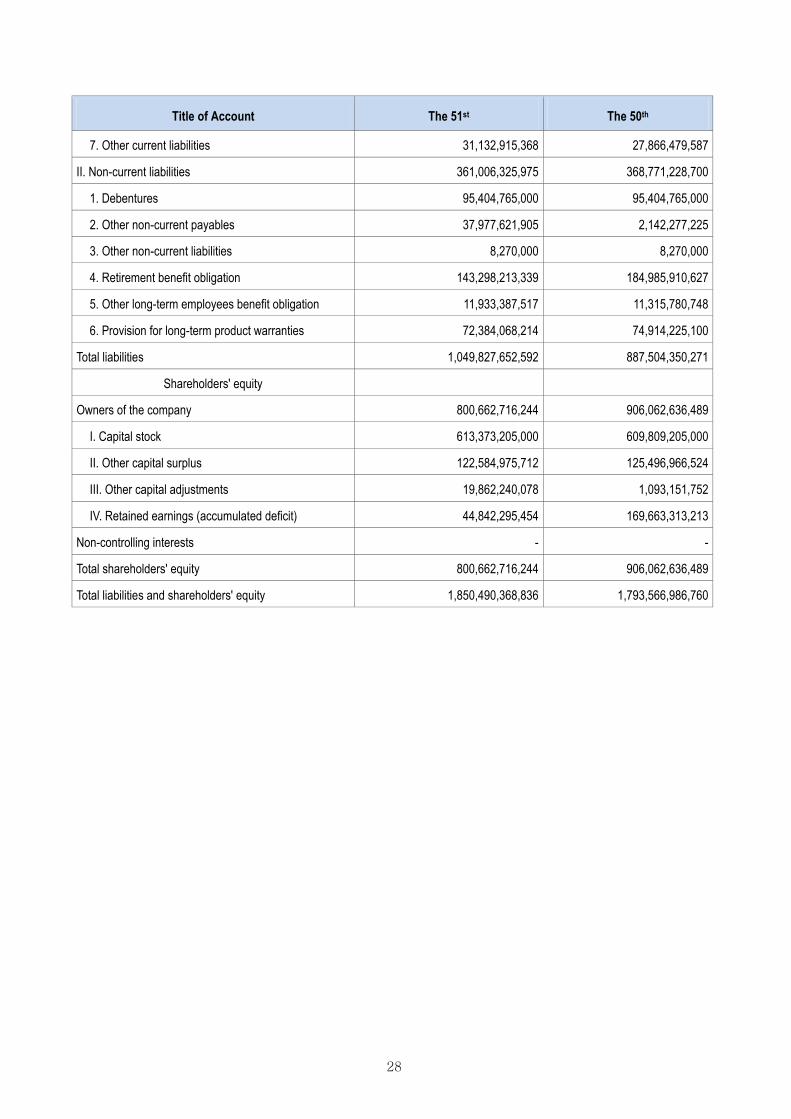
Title of Account The 51st The 50th
7. Other current liabilities 31,132,915,368 27,866,479,587
II. Non-current liabilities 361,006,325,975 368,771,228,700
1. Debentures 95,404,765,000 95,404,765,000
2. Other non-current payables 37,977,621,905 2,142,277,225
3. Other non-current liabilities 8,270,000 8,270,000
4. Retirement benefit obligation 143,298,213,339 184,985,910,627
5. Other long-term employees benefit obligation 11,933,387,517 11,315,780,748
6. Provision for long-term product warranties 72,384,068,214 74,914,225,100
Total liabilities 1,049,827,652,592 887,504,350,271
Shareholders' equity
Owners of the company 800,662,716,244 906,062,636,489
I. Capital stock 613,373,205,000 609,809,205,000
II. Other capital surplus 122,584,975,712 125,496,966,524
III. Other capital adjustments 19,862,240,078 1,093,151,752
IV. Retained earnings (accumulated deficit) 44,842,295,454 169,663,313,213
Non-controlling interests - -
Total shareholders' equity 800,662,716,244 906,062,636,489
Total liabilities and shareholders' equity 1,850,490,368,836 1,793,566,986,760
29
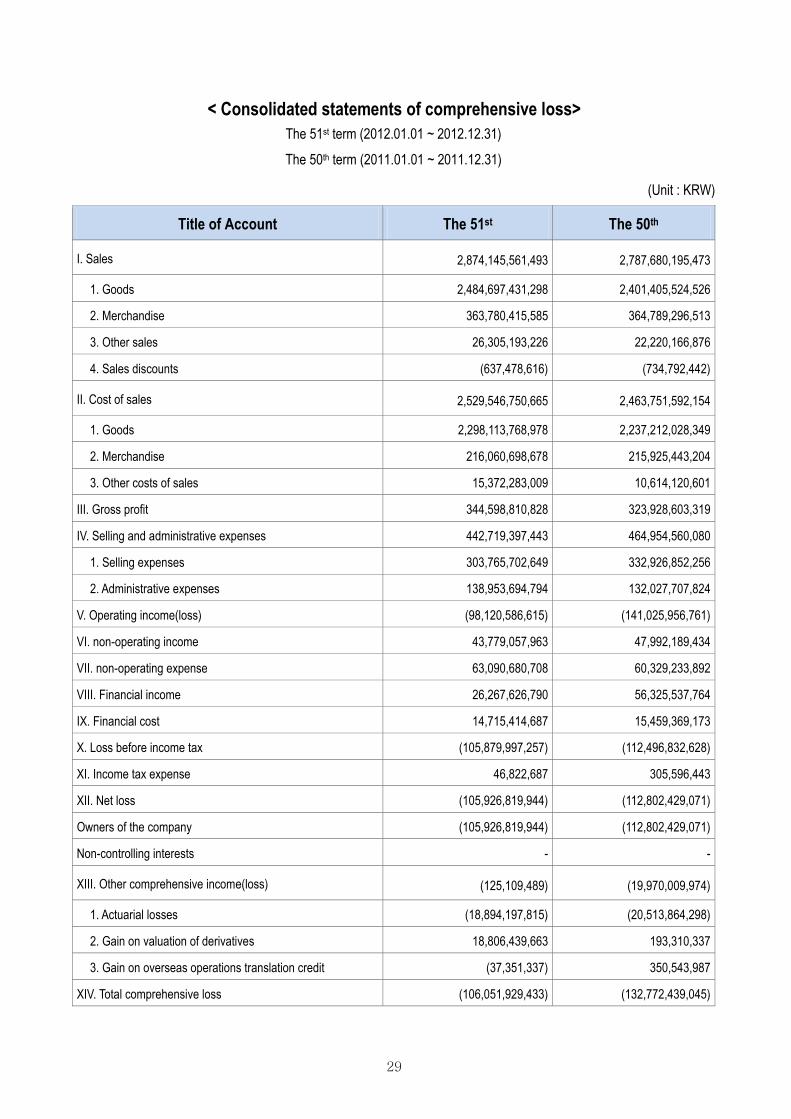
< Consolidated statements of comprehensive loss> The 51st term (2012.01.01 ~ 2012.12.31)
The 50th term (2011.01.01 ~ 2011.12.31)
(Unit : KRW)
Title of Account The 51st The 50th
I. Sales 2,874,145,561,493 2,787,680,195,473
1. Goods 2,484,697,431,298 2,401,405,524,526
2. Merchandise 363,780,415,585 364,789,296,513
3. Other sales 26,305,193,226 22,220,166,876
4. Sales discounts (637,478,616) (734,792,442)
II. Cost of sales 2,529,546,750,665 2,463,751,592,154
1. Goods 2,298,113,768,978 2,237,212,028,349
2. Merchandise 216,060,698,678 215,925,443,204
3. Other costs of sales 15,372,283,009 10,614,120,601
III. Gross profit 344,598,810,828 323,928,603,319
IV. Selling and administrative expenses 442,719,397,443 464,954,560,080
1. Selling expenses 303,765,702,649 332,926,852,256
2. Administrative expenses 138,953,694,794 132,027,707,824
V. Operating income(loss) (98,120,586,615) (141,025,956,761)
VI. non-operating income 43,779,057,963 47,992,189,434
VII. non-operating expense 63,090,680,708 60,329,233,892
VIII. Financial income 26,267,626,790 56,325,537,764
IX. Financial cost 14,715,414,687 15,459,369,173
X. Loss before income tax (105,879,997,257) (112,496,832,628)
XI. Income tax expense 46,822,687 305,596,443
XII. Net loss (105,926,819,944) (112,802,429,071)
Owners of the company (105,926,819,944) (112,802,429,071)
Non-controlling interests - -
XIII. Other comprehensive income(loss) (125,109,489) (19,970,009,974)
1. Actuarial losses (18,894,197,815) (20,513,864,298)
2. Gain on valuation of derivatives 18,806,439,663 193,310,337
3. Gain on overseas operations translation credit (37,351,337) 350,543,987
XIV. Total comprehensive loss (106,051,929,433) (132,772,439,045)
30
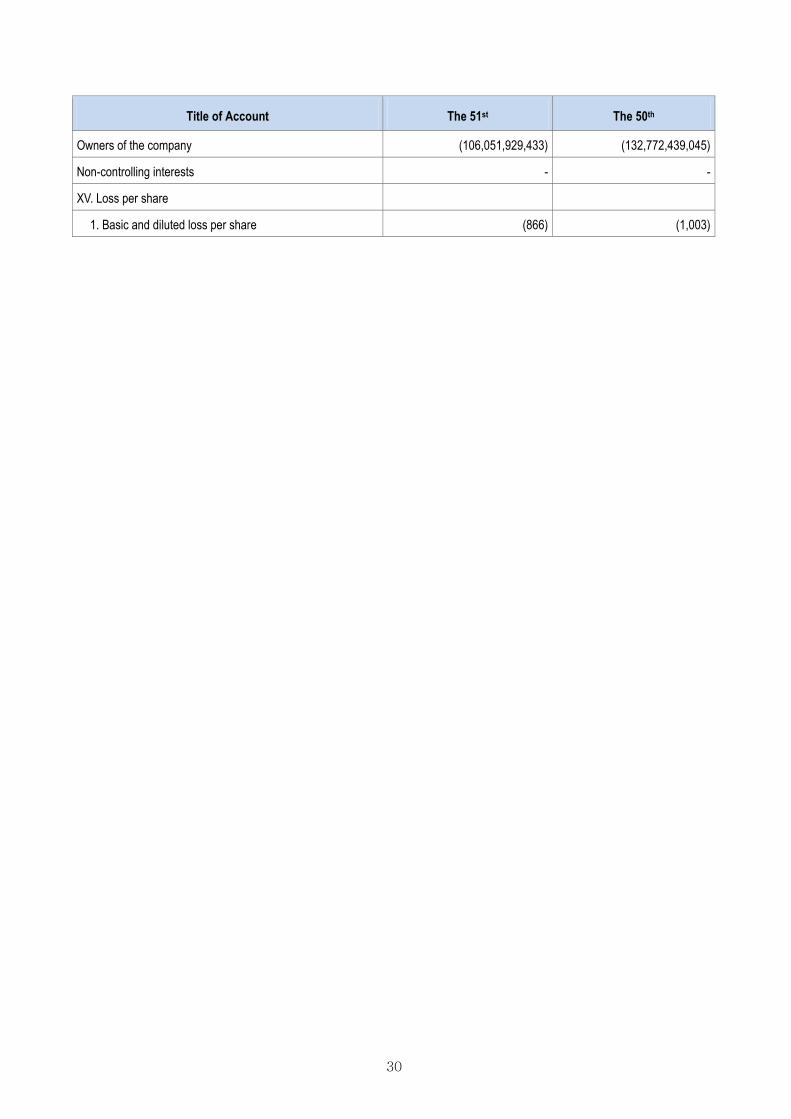
Title of Account The 51st The 50th
Owners of the company (106,051,929,433) (132,772,439,045)
Non-controlling interests - -
XV. Loss per share
1. Basic and diluted loss per share (866) (1,003)
31
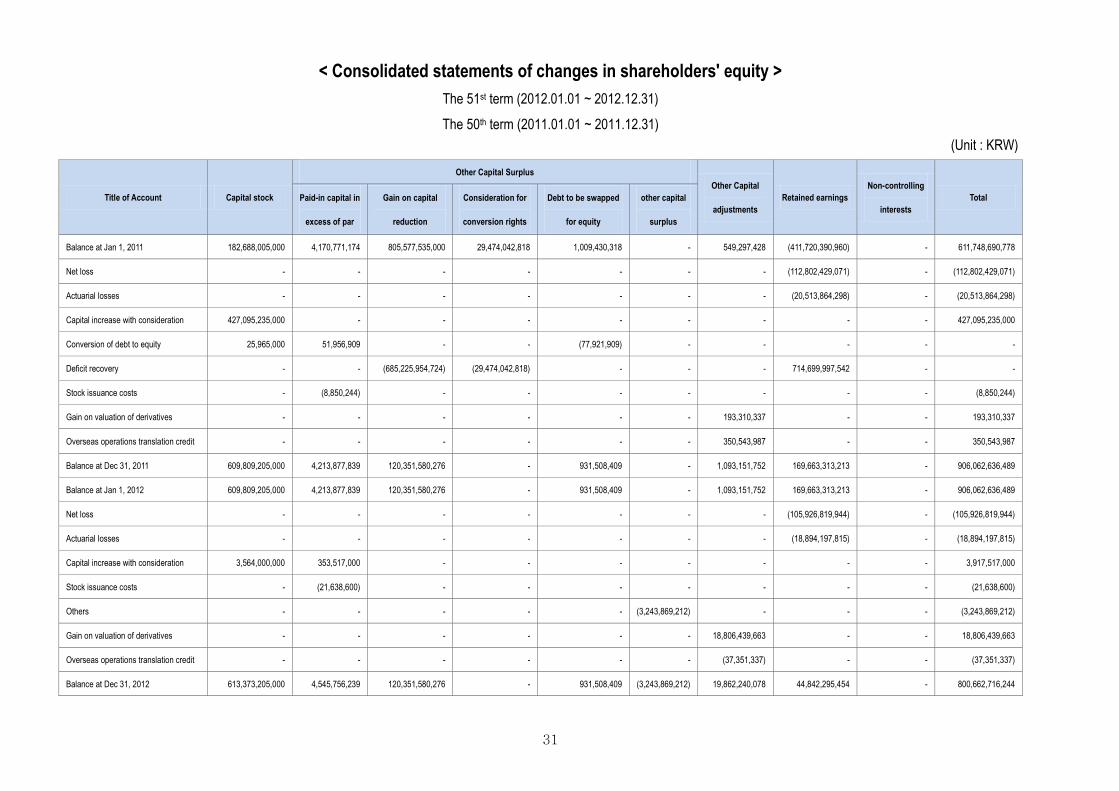
< Consolidated statements of changes in shareholders' equity > The 51st term (2012.01.01 ~ 2012.12.31) The 50th term (2011.01.01 ~ 2011.12.31)
(Unit : KRW)
Title of Account Capital stock
Other Capital Surplus Other Capital
adjustments Retained earnings
Non-controlling
interests Total Paid-in capital in
excess of par
Gain on capital
reduction
Consideration for
conversion rights
Debt to be swapped
for equity
other capital
surplus
Balance at Jan 1, 2011 182,688,005,000 4,170,771,174 805,577,535,000 29,474,042,818 1,009,430,318 - 549,297,428 (411,720,390,960) - 611,748,690,778
Net loss - - - - - - - (112,802,429,071) - (112,802,429,071)
Actuarial losses - - - - - - - (20,513,864,298) - (20,513,864,298)
Capital increase with consideration 427,095,235,000 - - - - - - - - 427,095,235,000
Conversion of debt to equity 25,965,000 51,956,909 - - (77,921,909) - - - - -
Deficit recovery - - (685,225,954,724) (29,474,042,818) - - - 714,699,997,542 - -
Stock issuance costs - (8,850,244) - - - - - - - (8,850,244)
Gain on valuation of derivatives - - - - - - 193,310,337 - - 193,310,337
Overseas operations translation credit - - - - - - 350,543,987 - - 350,543,987
Balance at Dec 31, 2011 609,809,205,000 4,213,877,839 120,351,580,276 - 931,508,409 - 1,093,151,752 169,663,313,213 - 906,062,636,489
Balance at Jan 1, 2012 609,809,205,000 4,213,877,839 120,351,580,276 - 931,508,409 - 1,093,151,752 169,663,313,213 - 906,062,636,489
Net loss - - - - - - - (105,926,819,944) - (105,926,819,944)
Actuarial losses - - - - - - - (18,894,197,815) - (18,894,197,815)
Capital increase with consideration 3,564,000,000 353,517,000 - - - - - - - 3,917,517,000
Stock issuance costs - (21,638,600) - - - - - - - (21,638,600)
Others - - - - - (3,243,869,212) - - - (3,243,869,212)
Gain on valuation of derivatives - - - - - - 18,806,439,663 - - 18,806,439,663
Overseas operations translation credit - - - - - - (37,351,337) - - (37,351,337)
Balance at Dec 31, 2012 613,373,205,000 4,545,756,239 120,351,580,276 - 931,508,409 (3,243,869,212) 19,862,240,078 44,842,295,454 - 800,662,716,244
32
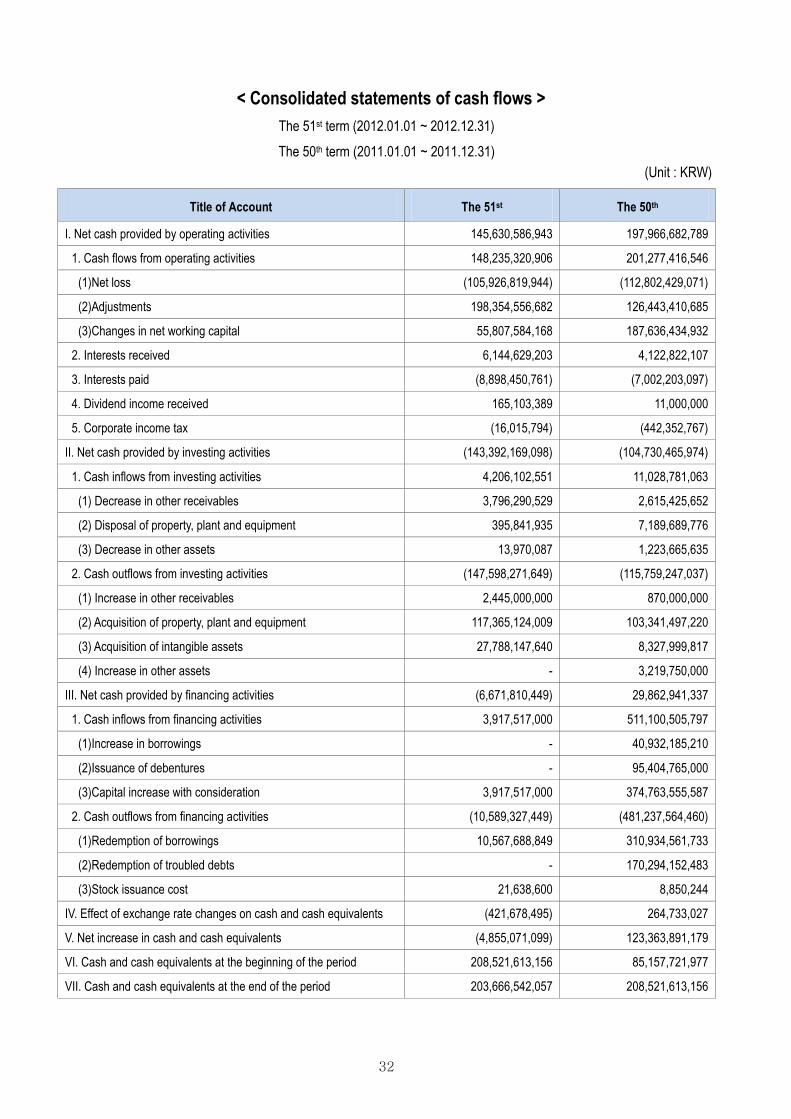
< Consolidated statements of cash flows > The 51st term (2012.01.01 ~ 2012.12.31) The 50th term (2011.01.01 ~ 2011.12.31)
(Unit : KRW)
Title of Account The 51st The 50th
I. Net cash provided by operating activities 145,630,586,943 197,966,682,789
1. Cash flows from operating activities 148,235,320,906 201,277,416,546
(1)Net loss (105,926,819,944) (112,802,429,071)
(2)Adjustments 198,354,556,682 126,443,410,685
(3)Changes in net working capital 55,807,584,168 187,636,434,932
2. Interests received 6,144,629,203 4,122,822,107
3. Interests paid (8,898,450,761) (7,002,203,097)
4. Dividend income received 165,103,389 11,000,000
5. Corporate income tax (16,015,794) (442,352,767)
II. Net cash provided by investing activities (143,392,169,098) (104,730,465,974)
1. Cash inflows from investing activities 4,206,102,551 11,028,781,063
(1) Decrease in other receivables 3,796,290,529 2,615,425,652
(2) Disposal of property, plant and equipment 395,841,935 7,189,689,776
(3) Decrease in other assets 13,970,087 1,223,665,635
2. Cash outflows from investing activities (147,598,271,649) (115,759,247,037)
(1) Increase in other receivables 2,445,000,000 870,000,000
(2) Acquisition of property, plant and equipment 117,365,124,009 103,341,497,220
(3) Acquisition of intangible assets 27,788,147,640 8,327,999,817
(4) Increase in other assets - 3,219,750,000
III. Net cash provided by financing activities (6,671,810,449) 29,862,941,337
1. Cash inflows from financing activities 3,917,517,000 511,100,505,797
(1)Increase in borrowings - 40,932,185,210
(2)Issuance of debentures - 95,404,765,000
(3)Capital increase with consideration 3,917,517,000 374,763,555,587
2. Cash outflows from financing activities (10,589,327,449) (481,237,564,460)
(1)Redemption of borrowings 10,567,688,849 310,934,561,733
(2)Redemption of troubled debts - 170,294,152,483
(3)Stock issuance cost 21,638,600 8,850,244
IV. Effect of exchange rate changes on cash and cash equivalents (421,678,495) 264,733,027
V. Net increase in cash and cash equivalents (4,855,071,099) 123,363,891,179
VI. Cash and cash equivalents at the beginning of the period 208,521,613,156 85,157,721,977
VII. Cash and cash equivalents at the end of the period 203,666,542,057 208,521,613,156
33
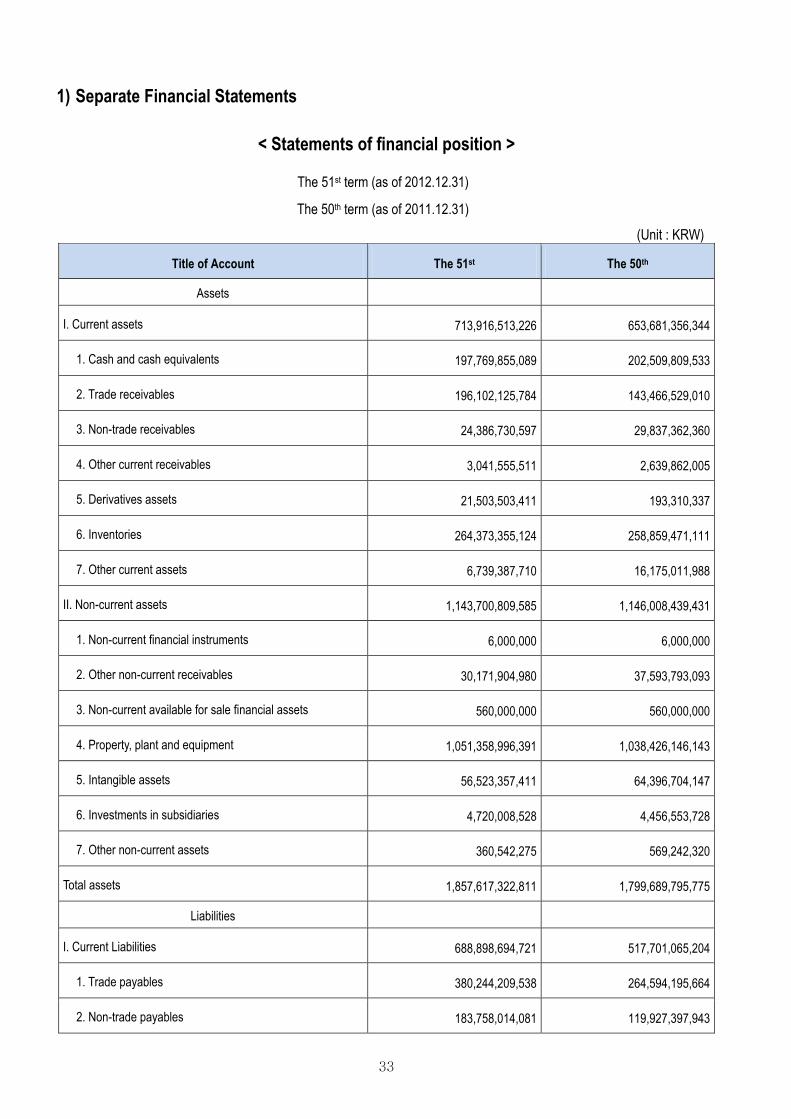
1) Separate Financial Statements
< Statements of financial position >
The 51st term (as of 2012.12.31)
The 50th term (as of 2011.12.31)
(Unit : KRW)
Title of Account The 51st The 50th
Assets
I. Current assets 713,916,513,226 653,681,356,344
1. Cash and cash equivalents 197,769,855,089 202,509,809,533
2. Trade receivables 196,102,125,784 143,466,529,010
3. Non-trade receivables 24,386,730,597 29,837,362,360
4. Other current receivables 3,041,555,511 2,639,862,005
5. Derivatives assets 21,503,503,411 193,310,337
6. Inventories 264,373,355,124 258,859,471,111
7. Other current assets 6,739,387,710 16,175,011,988
II. Non-current assets 1,143,700,809,585 1,146,008,439,431
1. Non-current financial instruments 6,000,000 6,000,000
2. Other non-current receivables 30,171,904,980 37,593,793,093
3. Non-current available for sale financial assets 560,000,000 560,000,000
4. Property, plant and equipment 1,051,358,996,391 1,038,426,146,143
5. Intangible assets 56,523,357,411 64,396,704,147
6. Investments in subsidiaries 4,720,008,528 4,456,553,728
7. Other non-current assets 360,542,275 569,242,320
Total assets 1,857,617,322,811 1,799,689,795,775
Liabilities
I. Current Liabilities 688,898,694,721 517,701,065,204
1. Trade payables 380,244,209,538 264,594,195,664
2. Non-trade payables 183,758,014,081 119,927,397,943
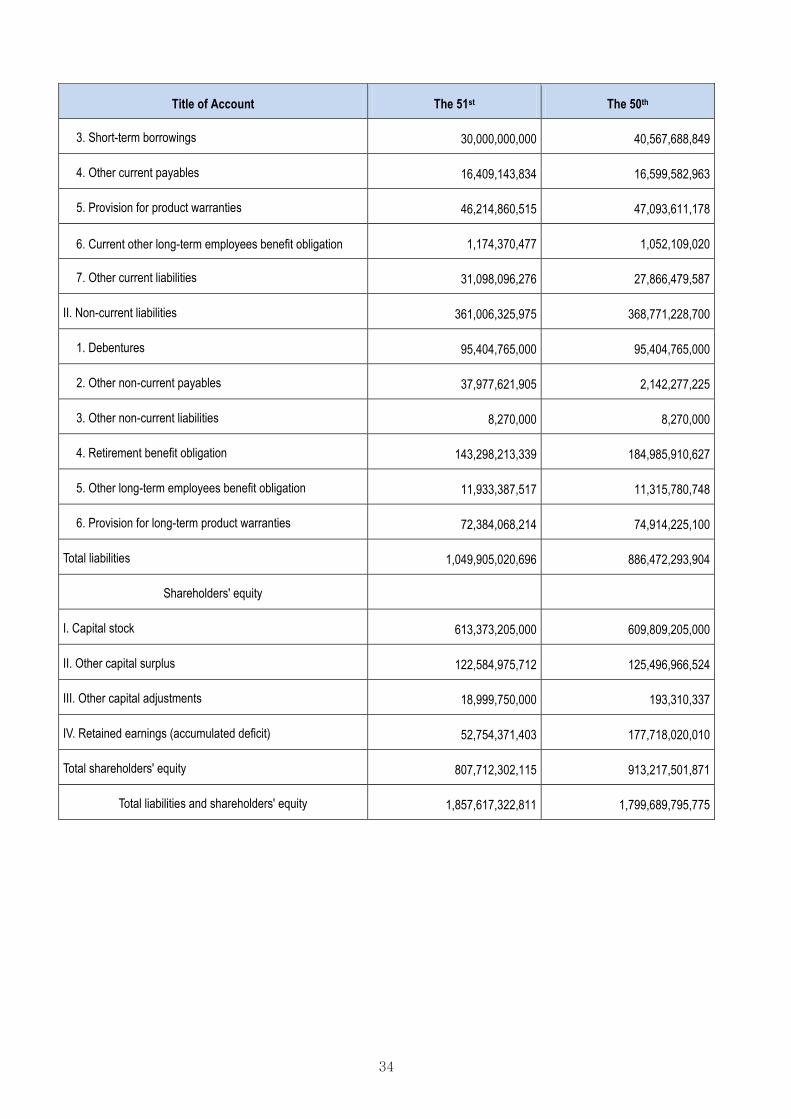
34
Title of Account The 51st The 50th
3. Short-term borrowings 30,000,000,000 40,567,688,849
4. Other current payables 16,409,143,834 16,599,582,963
5. Provision for product warranties 46,214,860,515 47,093,611,178
6. Current other long-term employees benefit obligation 1,174,370,477 1,052,109,020
7. Other current liabilities 31,098,096,276 27,866,479,587
II. Non-current liabilities 361,006,325,975 368,771,228,700
1. Debentures 95,404,765,000 95,404,765,000
2. Other non-current payables 37,977,621,905 2,142,277,225
3. Other non-current liabilities 8,270,000 8,270,000
4. Retirement benefit obligation 143,298,213,339 184,985,910,627
5. Other long-term employees benefit obligation 11,933,387,517 11,315,780,748
6. Provision for long-term product warranties 72,384,068,214 74,914,225,100
Total liabilities 1,049,905,020,696 886,472,293,904
Shareholders' equity
I. Capital stock 613,373,205,000 609,809,205,000
II. Other capital surplus 122,584,975,712 125,496,966,524
III. Other capital adjustments 18,999,750,000 193,310,337
IV. Retained earnings (accumulated deficit) 52,754,371,403 177,718,020,010
Total shareholders' equity 807,712,302,115 913,217,501,871
Total liabilities and shareholders' equity 1,857,617,322,811 1,799,689,795,775
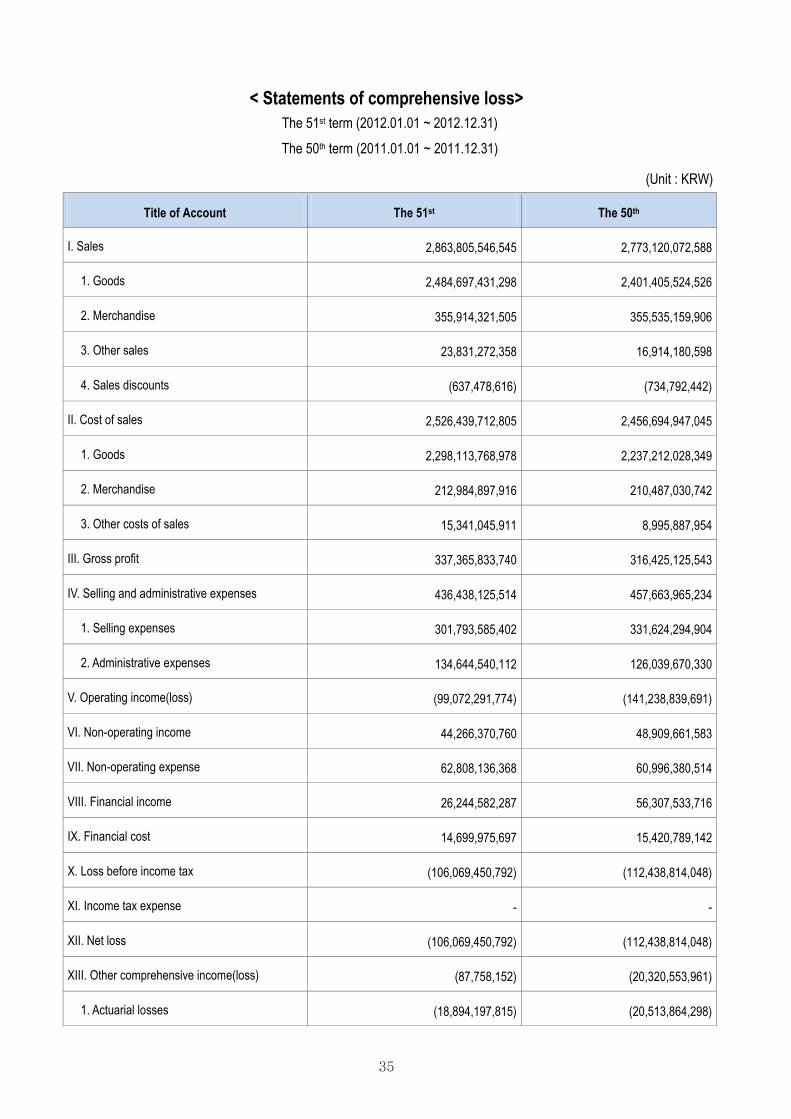
35
< Statements of comprehensive loss> The 51st term (2012.01.01 ~ 2012.12.31)
The 50th term (2011.01.01 ~ 2011.12.31)
(Unit : KRW)
Title of Account The 51st The 50th
I. Sales 2,863,805,546,545 2,773,120,072,588
1. Goods 2,484,697,431,298 2,401,405,524,526
2. Merchandise 355,914,321,505 355,535,159,906
3. Other sales 23,831,272,358 16,914,180,598
4. Sales discounts (637,478,616) (734,792,442)
II. Cost of sales 2,526,439,712,805 2,456,694,947,045
1. Goods 2,298,113,768,978 2,237,212,028,349
2. Merchandise 212,984,897,916 210,487,030,742
3. Other costs of sales 15,341,045,911 8,995,887,954
III. Gross profit 337,365,833,740 316,425,125,543
IV. Selling and administrative expenses 436,438,125,514 457,663,965,234
1. Selling expenses 301,793,585,402 331,624,294,904
2. Administrative expenses 134,644,540,112 126,039,670,330
V. Operating income(loss) (99,072,291,774) (141,238,839,691)
VI. Non-operating income 44,266,370,760 48,909,661,583
VII. Non-operating expense 62,808,136,368 60,996,380,514
VIII. Financial income 26,244,582,287 56,307,533,716
IX. Financial cost 14,699,975,697 15,420,789,142
X. Loss before income tax (106,069,450,792) (112,438,814,048)
XI. Income tax expense - -
XII. Net loss (106,069,450,792) (112,438,814,048)
XIII. Other comprehensive income(loss) (87,758,152) (20,320,553,961)
1. Actuarial losses (18,894,197,815) (20,513,864,298)

36
Title of Account The 51st The 50th
2. Gain on valuation of derivatives 18,806,439,663 193,310,337
XIV. Total comprehensive loss (106,157,208,944) (132,759,368,009)
XV. Loss per share - -
1. Basic and diluted loss per share (867) (1,000)
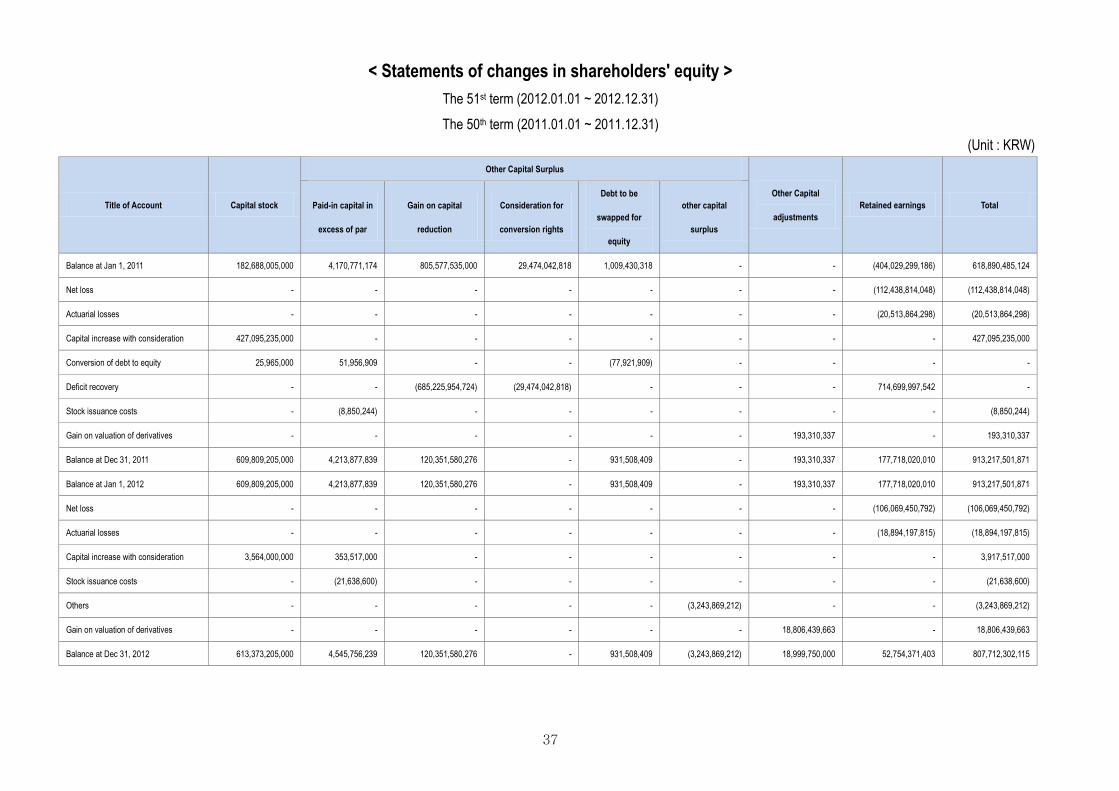
37
< Statements of changes in shareholders' equity > The 51st term (2012.01.01 ~ 2012.12.31) The 50th term (2011.01.01 ~ 2011.12.31)
(Unit : KRW)
Title of Account Capital stock
Other Capital Surplus
Other Capital
adjustments Retained earnings Total Paid-in capital in
excess of par
Gain on capital
reduction
Consideration for
conversion rights
Debt to be
swapped for
equity
other capital
surplus
Balance at Jan 1, 2011 182,688,005,000 4,170,771,174 805,577,535,000 29,474,042,818 1,009,430,318 - - (404,029,299,186) 618,890,485,124
Net loss - - - - - - - (112,438,814,048) (112,438,814,048)
Actuarial losses - - - - - - - (20,513,864,298) (20,513,864,298)
Capital increase with consideration 427,095,235,000 - - - - - - - 427,095,235,000
Conversion of debt to equity 25,965,000 51,956,909 - - (77,921,909) - - - -
Deficit recovery - - (685,225,954,724) (29,474,042,818) - - - 714,699,997,542 -
Stock issuance costs - (8,850,244) - - - - - - (8,850,244)
Gain on valuation of derivatives - - - - - - 193,310,337 - 193,310,337
Balance at Dec 31, 2011 609,809,205,000 4,213,877,839 120,351,580,276 - 931,508,409 - 193,310,337 177,718,020,010 913,217,501,871
Balance at Jan 1, 2012 609,809,205,000 4,213,877,839 120,351,580,276 - 931,508,409 - 193,310,337 177,718,020,010 913,217,501,871
Net loss - - - - - - - (106,069,450,792) (106,069,450,792)
Actuarial losses - - - - - - - (18,894,197,815) (18,894,197,815)
Capital increase with consideration 3,564,000,000 353,517,000 - - - - - - 3,917,517,000
Stock issuance costs - (21,638,600) - - - - - - (21,638,600)
Others - - - - - (3,243,869,212) - - (3,243,869,212)
Gain on valuation of derivatives - - - - - - 18,806,439,663 - 18,806,439,663
Balance at Dec 31, 2012 613,373,205,000 4,545,756,239 120,351,580,276 - 931,508,409 (3,243,869,212) 18,999,750,000 52,754,371,403 807,712,302,115
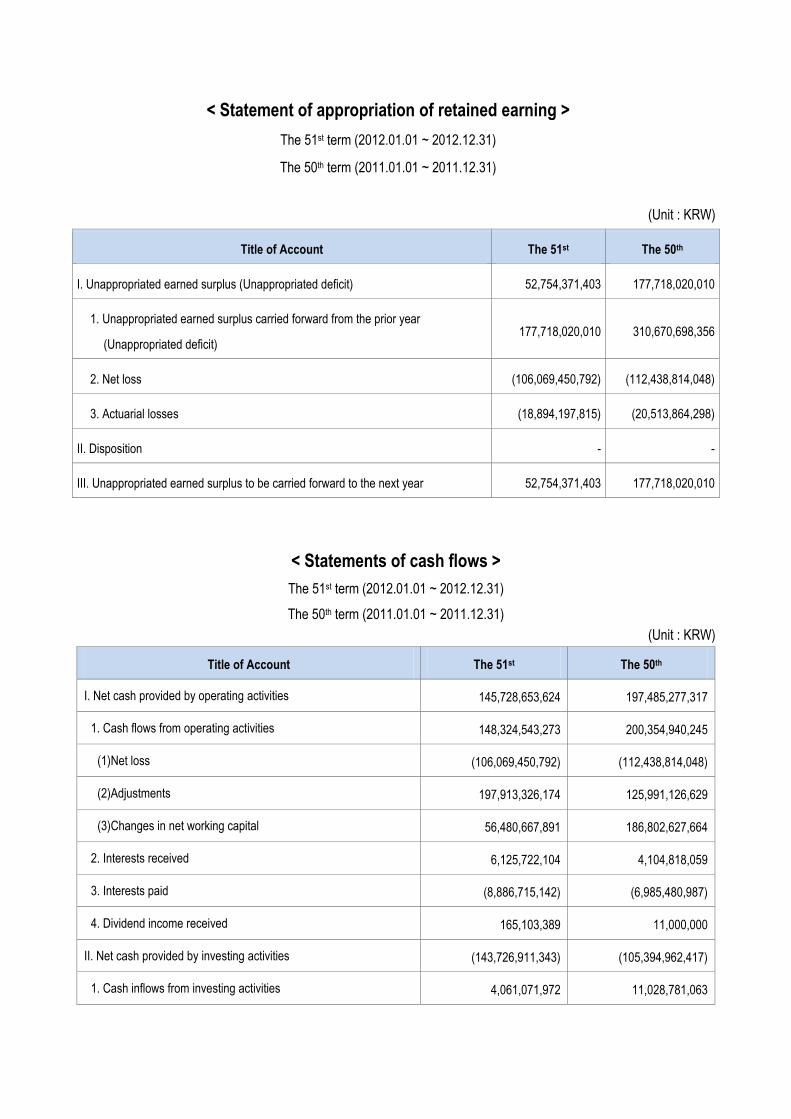
< Statement of appropriation of retained earning >
The 51st term (2012.01.01 ~ 2012.12.31) The 50th term (2011.01.01 ~ 2011.12.31)
(Unit : KRW)
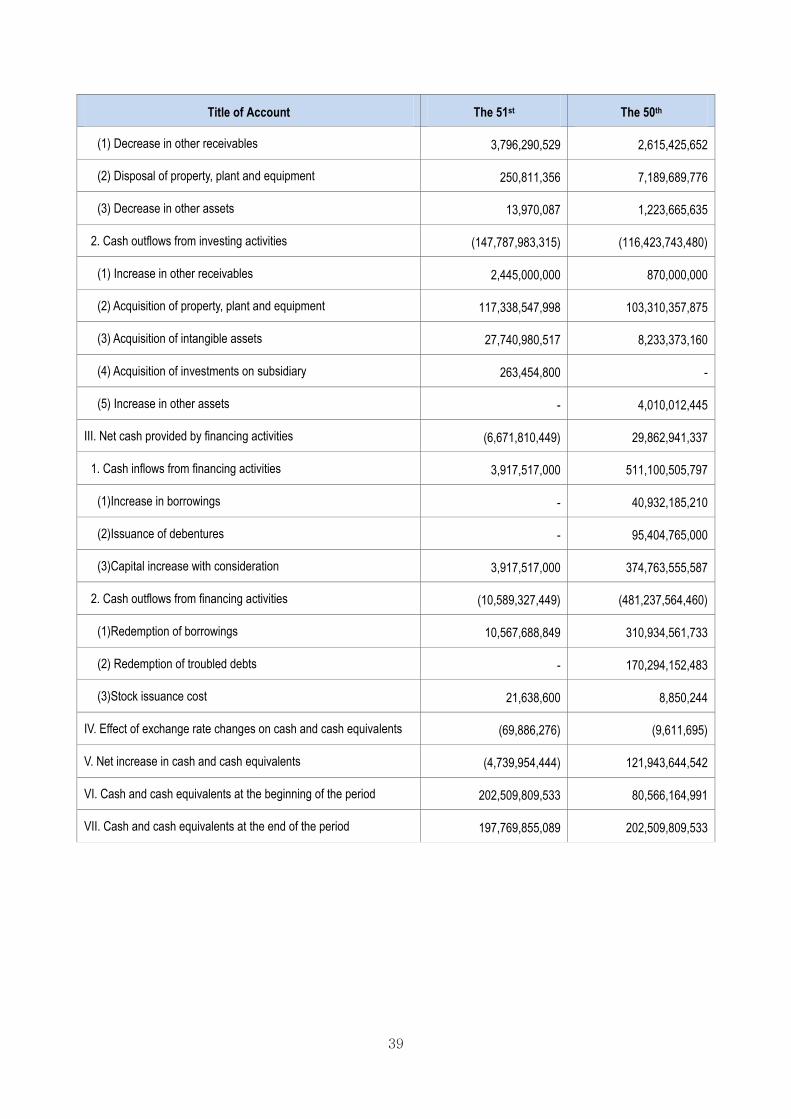
< Statements of cash flows > The 51st term (2012.01.01 ~ 2012.12.31) The 50th term (2011.01.01 ~ 2011.12.31)
(Unit : KRW)
Title of Account The 51st The 50th
I. Net cash provided by operating activities 145,728,653,624 197,485,277,317
1. Cash flows from operating activities 148,324,543,273 200,354,940,245
(1)Net loss (106,069,450,792) (112,438,814,048)
(2)Adjustments 197,913,326,174 125,991,126,629
(3)Changes in net working capital 56,480,667,891 186,802,627,664
2. Interests received 6,125,722,104 4,104,818,059
3. Interests paid (8,886,715,142) (6,985,480,987)
4. Dividend income received 165,103,389 11,000,000
II. Net cash provided by investing activities (143,726,911,343) (105,394,962,417)
1. Cash inflows from investing activities 4,061,071,972 11,028,781,063
Title of Account The 51st The 50th
I. Unappropriated earned surplus (Unappropriated deficit) 52,754,371,403 177,718,020,010
1. Unappropriated earned surplus carried forward from the prior year
(Unappropriated deficit) 177,718,020,010 310,670,698,356
2. Net loss (106,069,450,792) (112,438,814,048)
3. Actuarial losses (18,894,197,815) (20,513,864,298)
II. Disposition - -
III. Unappropriated earned surplus to be carried forward to the next year 52,754,371,403 177,718,020,010
39
Title of Account The 51st The 50th
(1) Decrease in other receivables 3,796,290,529 2,615,425,652
(2) Disposal of property, plant and equipment 250,811,356 7,189,689,776
(3) Decrease in other assets 13,970,087 1,223,665,635
2. Cash outflows from investing activities (147,787,983,315) (116,423,743,480)
(1) Increase in other receivables 2,445,000,000 870,000,000
(2) Acquisition of property, plant and equipment 117,338,547,998 103,310,357,875
(3) Acquisition of intangible assets 27,740,980,517 8,233,373,160
(4) Acquisition of investments on subsidiary 263,454,800 -
(5) Increase in other assets - 4,010,012,445
III. Net cash provided by financing activities (6,671,810,449) 29,862,941,337
1. Cash inflows from financing activities 3,917,517,000 511,100,505,797
(1)Increase in borrowings - 40,932,185,210
(2)Issuance of debentures - 95,404,765,000
(3)Capital increase with consideration 3,917,517,000 374,763,555,587
2. Cash outflows from financing activities (10,589,327,449) (481,237,564,460)
(1)Redemption of borrowings 10,567,688,849 310,934,561,733
(2) Redemption of troubled debts - 170,294,152,483
(3)Stock issuance cost 21,638,600 8,850,244
IV. Effect of exchange rate changes on cash and cash equivalents (69,886,276) (9,611,695)
V. Net increase in cash and cash equivalents (4,739,954,444) 121,943,644,542
VI. Cash and cash equivalents at the beginning of the period 202,509,809,533 80,566,164,991
VII. Cash and cash equivalents at the end of the period 197,769,855,089 202,509,809,533