the 2019 bleisure barometer - fivestarcities.economist.com · the 2019 bleisure barometer: asia’s...
TRANSCRIPT
THE 2019 BLEISURE BAROMETER: Asia’s best cities for work and recreation
Sponsored by:
1The 2019 bleisure barometerAsia’s best cities for work and recreation
© The Economist Intelligence Unit Limited 2019
Contents2 About the research and acknowledgments
3 Executive summary
6 Introduction. The utility of bleisure in the modern era
8 Chapter 1. Work and play in the urban jungle: Asia’s five-star bleisure destinations
13 Box. Bleisure v liveability: Key comparisons
15 Chapter 2. Assessing the ingredients and impact of bleisure
19 Conclusion. The blest of both worlds
20 Appendix I. Barometer and scoring methodology
22 Appendix II. Survey demographics
2 The 2019 bleisure barometerAsia’s best cities for work and recreation
© The Economist Intelligence Unit Limited 2019
About the research and acknowledgmentsThe 2019 bleisure barometer: Asia’s best cities for work and recreation is an Economist Intelligence Unit report, sponsored by All Nippon Airways. It measures the opinions of global corporate travellers toward various cities in Asia-Pacific with regard to their environment for both business and leisure, referred to as “bleisure” in this study. It is based on a survey of 1,500 people engaged in full-time employment, who have travelled for business to or within Asia-Pacific at least once within the past three years and incorporated leisure activities into their trip. The respondents hail from every continent and represent companies of various sizes and a range of seniority and age levels. See appendix II for full survey demographics.
The report also includes input from three experts in business travel trends. We would like to thank the following people for their time and insight:
• Jessica Collison, director of research, Global Business Travel Association, Alexandria, Virginia, US
• Brian King, associate dean and professor, School of Hotel and Tourism Management, Hong Kong Polytechnic University
• Jessica Lichy, international research professor, IDRAC Business School, Lyon, France
The report was written by Michael Gold and edited by Naka Kondo. Scott Aloysius conducted the data analysis and contributed research assistance.
3The 2019 bleisure barometerAsia’s best cities for work and recreation
© The Economist Intelligence Unit Limited 2019
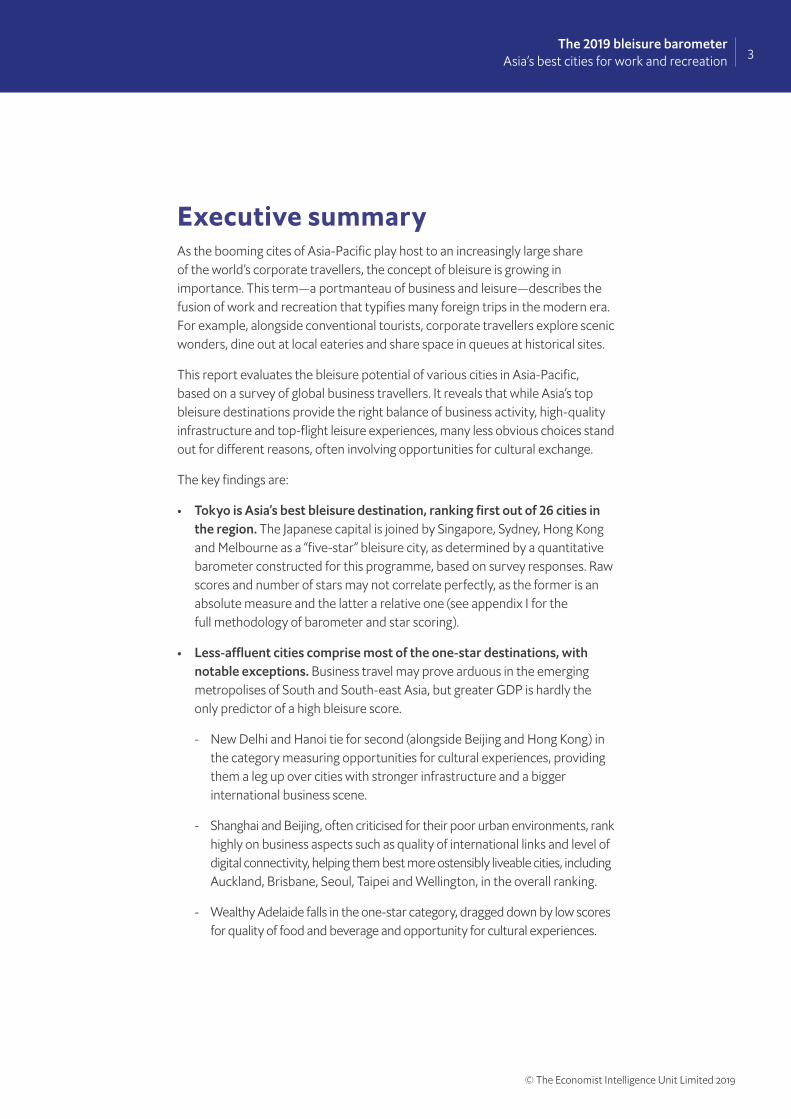
Executive summaryAs the booming cites of Asia-Pacific play host to an increasingly large share of the world’s corporate travellers, the concept of bleisure is growing in importance. This term—a portmanteau of business and leisure—describes the fusion of work and recreation that typifies many foreign trips in the modern era. For example, alongside conventional tourists, corporate travellers explore scenic wonders, dine out at local eateries and share space in queues at historical sites.
This report evaluates the bleisure potential of various cities in Asia-Pacific, based on a survey of global business travellers. It reveals that while Asia’s top bleisure destinations provide the right balance of business activity, high-quality infrastructure and top-flight leisure experiences, many less obvious choices stand out for different reasons, often involving opportunities for cultural exchange.
The key findings are:
• Tokyo is Asia’s best bleisure destination, ranking first out of 26 cities in the region. The Japanese capital is joined by Singapore, Sydney, Hong Kong and Melbourne as a “five-star” bleisure city, as determined by a quantitative barometer constructed for this programme, based on survey responses. Raw scores and number of stars may not correlate perfectly, as the former is an absolute measure and the latter a relative one (see appendix I for the full methodology of barometer and star scoring).
• Less-affluent cities comprise most of the one-star destinations, with notable exceptions. Business travel may prove arduous in the emerging metropolises of South and South-east Asia, but greater GDP is hardly the only predictor of a high bleisure score.
- New Delhi and Hanoi tie for second (alongside Beijing and Hong Kong) in the category measuring opportunities for cultural experiences, providing them a leg up over cities with stronger infrastructure and a bigger international business scene.
- Shanghai and Beijing, often criticised for their poor urban environments, rank highly on business aspects such as quality of international links and level of digital connectivity, helping them best more ostensibly liveable cities, including Auckland, Brisbane, Seoul, Taipei and Wellington, in the overall ranking.
- Wealthy Adelaide falls in the one-star category, dragged down by low scores for quality of food and beverage and opportunity for cultural experiences.
4 The 2019 bleisure barometerAsia’s best cities for work and recreation
© The Economist Intelligence Unit Limited 2019
Rank City Score Stars
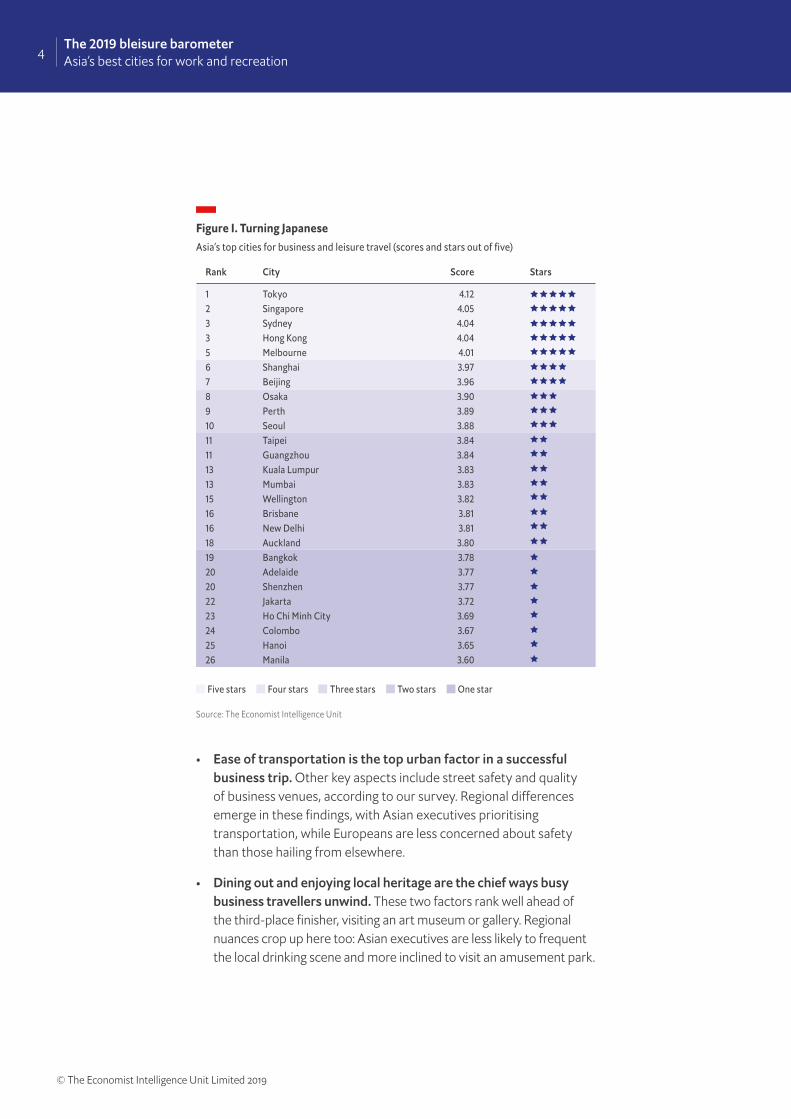
1 Tokyo 4.12 2 Singapore 4.05 3 Sydney 4.04 3 Hong Kong 4.04 5 Melbourne 4.01 6 Shanghai 3.97 7 Beijing 3.96 8 Osaka 3.90 9 Perth 3.89 10 Seoul 3.88 11 Taipei 3.84 11 Guangzhou 3.84 13 Kuala Lumpur 3.83 13 Mumbai 3.83 15 Wellington 3.82 16 Brisbane 3.81 16 New Delhi 3.81 18 Auckland 3.80 19 Bangkok 3.78 20 Adelaide 3.77 20 Shenzhen 3.77 22 Jakarta 3.72 23 Ho Chi Minh City 3.69 24 Colombo 3.67 25 Hanoi 3.65 26 Manila 3.60 Five stars Four stars Three stars Two stars One star
Figure I. Turning JapaneseAsia’s top cities for business and leisure travel (scores and stars out of five)
Source: The Economist Intelligence Unit
• Ease of transportation is the top urban factor in a successful business trip. Other key aspects include street safety and quality of business venues, according to our survey. Regional differences emerge in these findings, with Asian executives prioritising transportation, while Europeans are less concerned about safety than those hailing from elsewhere.
• Dining out and enjoying local heritage are the chief ways busy business travellers unwind. These two factors rank well ahead of the third-place finisher, visiting an art museum or gallery. Regional nuances crop up here too: Asian executives are less likely to frequent the local drinking scene and more inclined to visit an amusement park.
6 The 2019 bleisure barometerAsia’s best cities for work and recreation
© The Economist Intelligence Unit Limited 2019
Introduction. The utility of bleisure in the modern eraFor the modern business traveller, the mantra of “all work and no play” is quickly giving way to a greater equilibrium between the two. Companies are recognising the utility of relaxation and fun amid busy working trips, while technology is helping travellers find opportunities for leisure more readily. Experiencing a city—particularly an unfamiliar one—as a leisure tourist and as a business traveller can be different yet complementary; combining them can open up avenues and opportunities that one alone cannot. According to Jessica Lichy of France’s IDRAC Business School: “[Bleisure] helps us to be boundary spanners, it gives us skills that we might not have used frequently when we’re working in our home country, and it puts us in a position where we are testing our responses to normal, routine activities.”
Bleisure is hardly a niche phenomenon: one 2018 survey found that 60% of business trips among US-based executives incorporated a bleisure element, up from 43% in 2016.1 The term itself may look odd at first glance, but we have utilised it for this study out of both convenience and the fact that it has become a well-accepted part of the travel industry lexicon. As the lines between business and leisure blur ever further, particularly for younger travellers keen on maintaining a stronger work-life balance than their predecessors, how cities leverage bleisure could help them differentiate among an increasingly crowded market for urban tourism.
Bleisure helps us to be boundary spanners.
Jessica Lichy, IDRAC Business School
1 Unpacking Bleisure Traveler Trends, Expedia Group Media Solutions, January 2018

8 The 2019 bleisure barometerAsia’s best cities for work and recreation
© The Economist Intelligence Unit Limited 2019
In concert with the globalisation of business over the past several decades, corporate travel has seen startling growth. According to Jessica Collison of the Global Business Travel Association, business travel spending hit US$1.33trn globally in 2017, a 5.8% boost over 2016, with Asia-Pacific contributing 43% of this.2 This momentum is giving Asia’s major urban hubs greater impetus to improve infrastructure, enhance their international flavour and better integrate avenues for executives to take advantage of leisure activities in their destination cities.
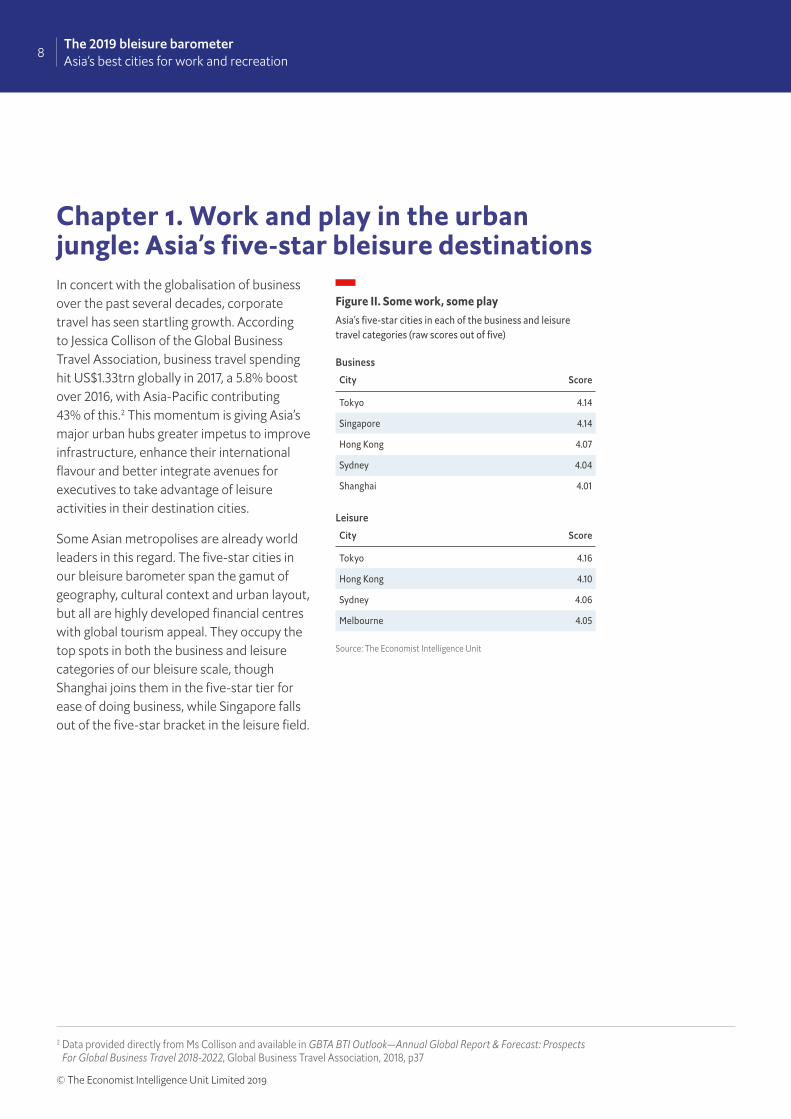
Some Asian metropolises are already world leaders in this regard. The five-star cities in our bleisure barometer span the gamut of geography, cultural context and urban layout, but all are highly developed financial centres with global tourism appeal. They occupy the top spots in both the business and leisure categories of our bleisure scale, though Shanghai joins them in the five-star tier for ease of doing business, while Singapore falls out of the five-star bracket in the leisure field.
Chapter 1. Work and play in the urban jungle: Asia’s five-star bleisure destinations
2 Data provided directly from Ms Collison and available in GBTA BTI Outlook—Annual Global Report & Forecast: Prospects For Global Business Travel 2018-2022, Global Business Travel Association, 2018, p37
City Score
Tokyo 4.14
Singapore 4.14
Hong Kong 4.07
Sydney 4.04
Shanghai 4.01
Figure II. Some work, some playAsia’s five-star cities in each of the business and leisure travel categories (raw scores out of five)
Business
City Score
Tokyo 4.16
Hong Kong 4.10
Sydney 4.06
Melbourne 4.05
Leisure
Source: The Economist Intelligence Unit
9The 2019 bleisure barometerAsia’s best cities for work and recreation
© The Economist Intelligence Unit Limited 2019
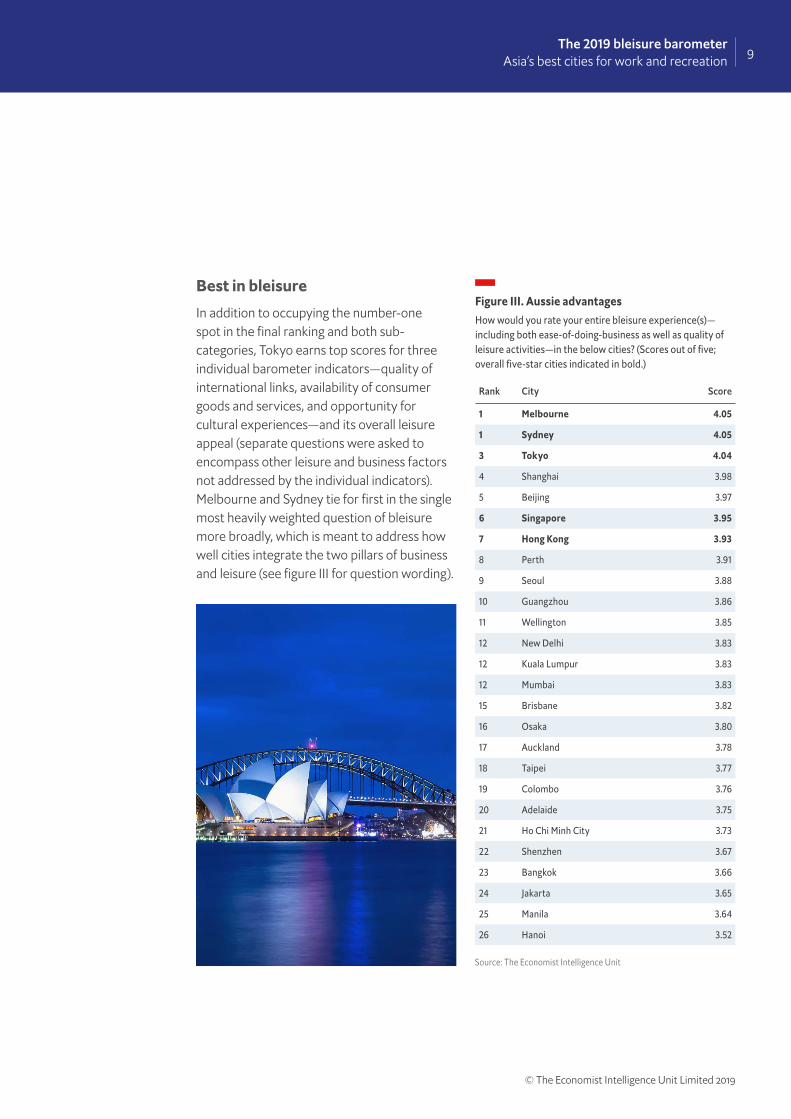
Best in bleisureIn addition to occupying the number-one spot in the final ranking and both sub-categories, Tokyo earns top scores for three individual barometer indicators—quality of international links, availability of consumer goods and services, and opportunity for cultural experiences—and its overall leisure appeal (separate questions were asked to encompass other leisure and business factors not addressed by the individual indicators). Melbourne and Sydney tie for first in the single most heavily weighted question of bleisure more broadly, which is meant to address how well cities integrate the two pillars of business and leisure (see figure III for question wording).
Rank City Score
1 Melbourne 4.05
1 Sydney 4.05
3 Tokyo 4.04
4 Shanghai 3.98
5 Beijing 3.97
6 Singapore 3.95
7 Hong Kong 3.93
8 Perth 3.91
9 Seoul 3.88
10 Guangzhou 3.86
11 Wellington 3.85
12 New Delhi 3.83
12 Kuala Lumpur 3.83
12 Mumbai 3.83
15 Brisbane 3.82
16 Osaka 3.80
17 Auckland 3.78
18 Taipei 3.77
19 Colombo 3.76
20 Adelaide 3.75
21 Ho Chi Minh City 3.73
22 Shenzhen 3.67
23 Bangkok 3.66
24 Jakarta 3.65
25 Manila 3.64
26 Hanoi 3.52
Figure III. Aussie advantagesHow would you rate your entire bleisure experience(s)—including both ease-of-doing-business as well as quality of leisure activities—in the below cities? (Scores out of five; overall five-star cities indicated in bold.)
Source: The Economist Intelligence Unit
10 The 2019 bleisure barometerAsia’s best cities for work and recreation
© The Economist Intelligence Unit Limited 2019
In the safety indicator, which was not included in either individual business or leisure categories but was included in the final ranking, Singapore claims the top spot. The city-state also sits atop the league tables for transportation, food and beverage, and overall business aspects. Hong Kong, although a strong performer across the board, nabs the number-one spot in only one field, digital connectivity.
Five-to-oneMany cities outperform in certain aspects of the bleisure experience. Beijing and Shanghai, the only two four-star cities in the list, have benefitted from China’s rapid infrastructure development in providing a more amenable environment for business travellers. Indian cities receive high marks for their cultural capital, despite relatively low overall scores.
Similarly, there are surprising laggards. Outside of Sydney and Melbourne, Australian cities underwhelm, with Brisbane ranking below average for transportation, regional/international links, and availability of consumer goods and services, and dead last for opportunity of cultural experiences. The only categories where Adelaide, by far the wealthiest one-star city in our list, ranks above average are in safety and transportation. New Zealand cities also disappoint: akin to Adelaide, Auckland falls below average in every category except safety and transport, with Wellington also making an underwhelming showing. This is despite these
cities’ long-standing reputations as the world’s most liveable (see box on page 13).
Brian King of the School of Hotel and Tourism Management at Hong Kong Polytechnic University is unsurprised by these findings. “There’s a reputation in Asia that second-tier Australian cities are provincial and lack a feeling of hustle-bustle,” he says.
11The 2019 bleisure barometerAsia’s best cities for work and recreation
© The Economist Intelligence Unit Limited 2019
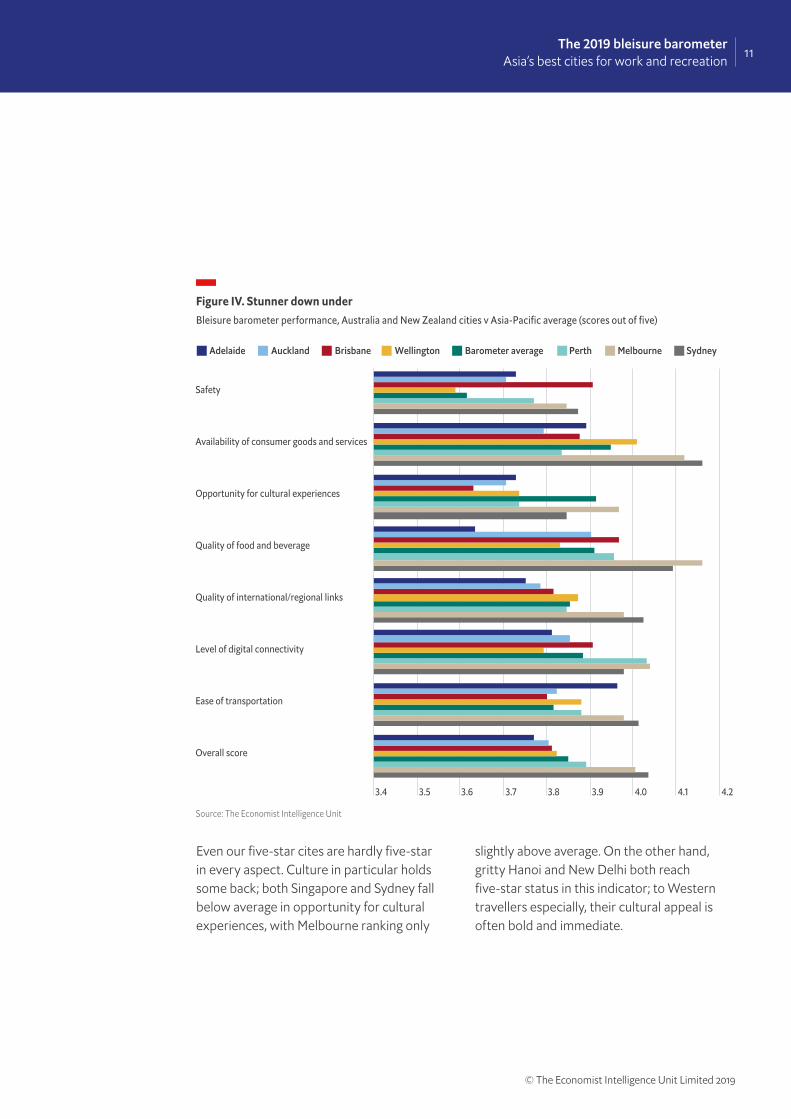
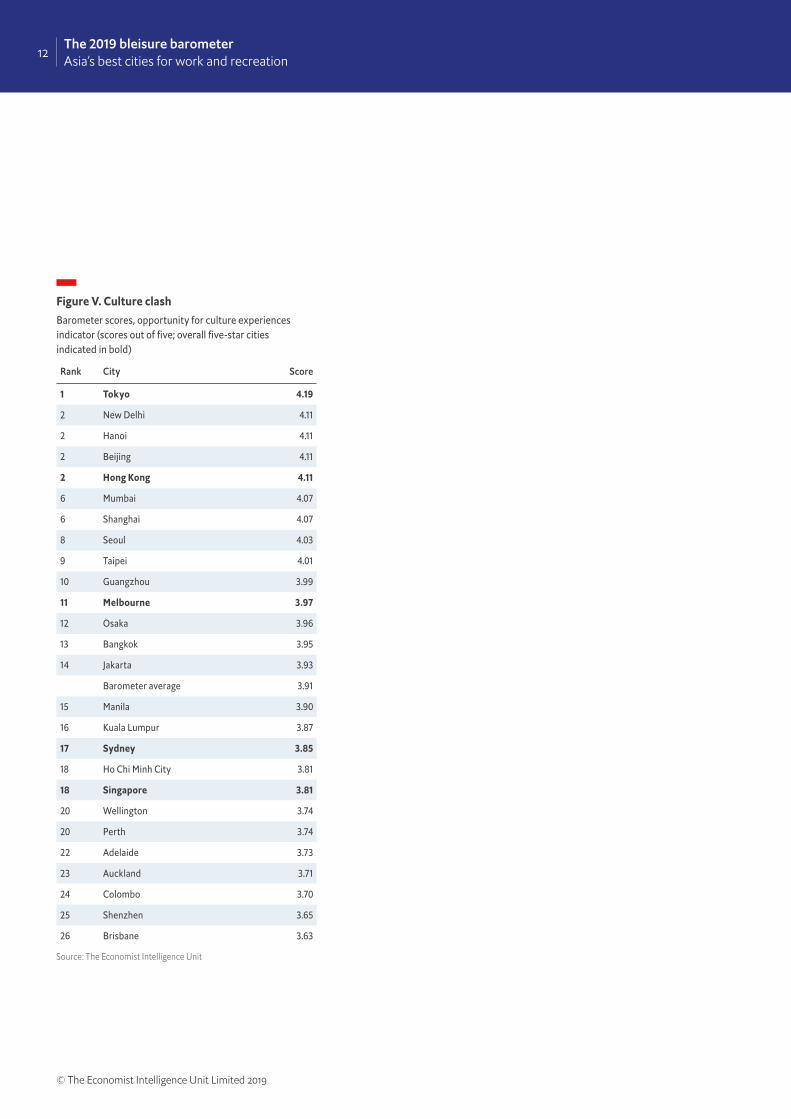
slightly above average. On the other hand, gritty Hanoi and New Delhi both reach five-star status in this indicator; to Western travellers especially, their cultural appeal is often bold and immediate.
Even our five-star cites are hardly five-star in every aspect. Culture in particular holds some back; both Singapore and Sydney fall below average in opportunity for cultural experiences, with Melbourne ranking only
Figure IV. Stunner down underBleisure barometer performance, Australia and New Zealand cities v Asia-Pacific average (scores out of five)
Source: The Economist Intelligence Unit
3.4 3.5 3.6 3.7 3.8 3.9 4.0 4.1 4.2
Safety
Availability of consumer goods and services
Opportunity for cultural experiences
Quality of food and beverage
Quality of international/regional links
Level of digital connectivity
Ease of transportation
Overall score
Adelaide Auckland Brisbane Wellington Barometer average Perth Melbourne Sydney
12 The 2019 bleisure barometerAsia’s best cities for work and recreation
© The Economist Intelligence Unit Limited 2019
Rank City Score
1 Tokyo 4.19
2 New Delhi 4.11
2 Hanoi 4.11
2 Beijing 4.11
2 Hong Kong 4.11
6 Mumbai 4.07
6 Shanghai 4.07
8 Seoul 4.03
9 Taipei 4.01
10 Guangzhou 3.99
11 Melbourne 3.97
12 Osaka 3.96
13 Bangkok 3.95
14 Jakarta 3.93
Barometer average 3.91
15 Manila 3.90
16 Kuala Lumpur 3.87
17 Sydney 3.85
18 Ho Chi Minh City 3.81
18 Singapore 3.81
20 Wellington 3.74
20 Perth 3.74
22 Adelaide 3.73
23 Auckland 3.71
24 Colombo 3.70
25 Shenzhen 3.65
26 Brisbane 3.63
Figure V. Culture clashBarometer scores, opportunity for culture experiences indicator (scores out of five; overall five-star cities indicated in bold)
Source: The Economist Intelligence Unit
13The 2019 bleisure barometerAsia’s best cities for work and recreation
© The Economist Intelligence Unit Limited 2019
* The use of “liveable/liveability” as referenced in this box is meant to refer specifically to the results of our Global Liveability Index; its use elsewhere throughout the report is meant in a more general sense
Australian cities] are trying to do that too, but it can be hard to build scale for a business travel sector in places that lack large corporate headquarters.”
The full table with bleisure and liveability scores for each city can be found on the next page; for comparability, scores for bleisure were rounded to the nearest tenth of a decimal point. As the final scores in both measures include other factors in addition to those presented here, we do not include aggregate scores. In addition, liveability scores for transport are presented as the average of two discrete indicators (quality of road network and quality of public transport); those for safety are also presented as an average, of prevalence of petty crime and prevalence of violent crime. See www.eiu.com/topic/liveability for more on the Liveability Index.
The old adage that “it’s a nice place to visit, but I wouldn’t want to live there” is thrown into stark relief by our study. Often, however, the reality is the opposite: aspects of cities that are amenable to full-time residents may prove difficult for travellers. In constructing our bleisure barometer, we found inspiration from several indicators in our Global Liveability Index, leveraging the fact that many aspects of full-time residency overlap with those of transient visits.
Many cities in South and South-east Asia outperform on the bleisure barometer versus liveability on culture and transport indicators. The culture discrepancy may result from the novelty of experiencing an “exotic” destination for the first time, rather than sheer diversity or the amount of cultural opportunities that may characterise a more liveable city (see chapter 1 for more on culture). When it comes to transport, cab-taking business travellers may be shielded from issues with public transit that bedevil full-time residents regularly.
Conversely, as noted in chapter 1, cities in Australia and New Zealand perform worse on the bleisure barometer than their liveability scores suggest. Brian King of the School of Hotel and Tourism Management at Hong Kong Polytechnic University says quantifying a city’s appeal as a travel destination—and thereby boosting it—can be difficult, even for highly liveable places. “When I was working on Melbourne tourism, we were trying to unlock issues of what we initially called ‘visitability’ and then ‘lovability’,” he says. “[Smaller
Bleisure v liveability: Key comparisons*
It can be hard to build scale for a business travel sector in places that lack large corporate headquarters.
Brian King, Hong Kong Polytechnic University
14 The 2019 bleisure barometerAsia’s best cities for work and recreation
© The Economist Intelligence Unit Limited 2019
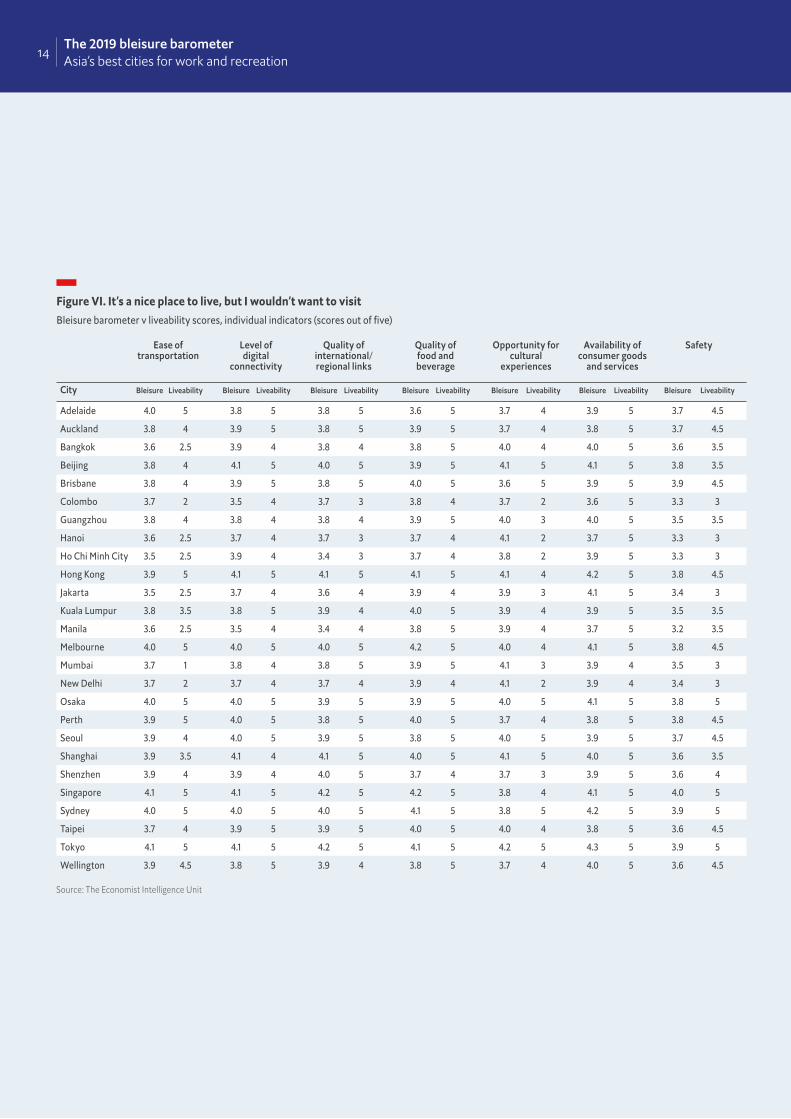
Figure VI. It’s a nice place to live, but I wouldn’t want to visitBleisure barometer v liveability scores, individual indicators (scores out of five)
Source: The Economist Intelligence Unit
Ease of Level of Quality of Quality of Opportunity for Availability of Safety transportation digital international/ food and cultural consumer goods connectivity regional links beverage experiences and services
City Bleisure Liveability Bleisure Liveability Bleisure Liveability Bleisure Liveability Bleisure Liveability Bleisure Liveability Bleisure Liveability
Adelaide 4.0 5 3.8 5 3.8 5 3.6 5 3.7 4 3.9 5 3.7 4.5
Auckland 3.8 4 3.9 5 3.8 5 3.9 5 3.7 4 3.8 5 3.7 4.5
Bangkok 3.6 2.5 3.9 4 3.8 4 3.8 5 4.0 4 4.0 5 3.6 3.5
Beijing 3.8 4 4.1 5 4.0 5 3.9 5 4.1 5 4.1 5 3.8 3.5
Brisbane 3.8 4 3.9 5 3.8 5 4.0 5 3.6 5 3.9 5 3.9 4.5
Colombo 3.7 2 3.5 4 3.7 3 3.8 4 3.7 2 3.6 5 3.3 3
Guangzhou 3.8 4 3.8 4 3.8 4 3.9 5 4.0 3 4.0 5 3.5 3.5
Hanoi 3.6 2.5 3.7 4 3.7 3 3.7 4 4.1 2 3.7 5 3.3 3
Ho Chi Minh City 3.5 2.5 3.9 4 3.4 3 3.7 4 3.8 2 3.9 5 3.3 3
Hong Kong 3.9 5 4.1 5 4.1 5 4.1 5 4.1 4 4.2 5 3.8 4.5
Jakarta 3.5 2.5 3.7 4 3.6 4 3.9 4 3.9 3 4.1 5 3.4 3
Kuala Lumpur 3.8 3.5 3.8 5 3.9 4 4.0 5 3.9 4 3.9 5 3.5 3.5
Manila 3.6 2.5 3.5 4 3.4 4 3.8 5 3.9 4 3.7 5 3.2 3.5
Melbourne 4.0 5 4.0 5 4.0 5 4.2 5 4.0 4 4.1 5 3.8 4.5
Mumbai 3.7 1 3.8 4 3.8 5 3.9 5 4.1 3 3.9 4 3.5 3
New Delhi 3.7 2 3.7 4 3.7 4 3.9 4 4.1 2 3.9 4 3.4 3
Osaka 4.0 5 4.0 5 3.9 5 3.9 5 4.0 5 4.1 5 3.8 5
Perth 3.9 5 4.0 5 3.8 5 4.0 5 3.7 4 3.8 5 3.8 4.5
Seoul 3.9 4 4.0 5 3.9 5 3.8 5 4.0 5 3.9 5 3.7 4.5
Shanghai 3.9 3.5 4.1 4 4.1 5 4.0 5 4.1 5 4.0 5 3.6 3.5
Shenzhen 3.9 4 3.9 4 4.0 5 3.7 4 3.7 3 3.9 5 3.6 4
Singapore 4.1 5 4.1 5 4.2 5 4.2 5 3.8 4 4.1 5 4.0 5
Sydney 4.0 5 4.0 5 4.0 5 4.1 5 3.8 5 4.2 5 3.9 5
Taipei 3.7 4 3.9 5 3.9 5 4.0 5 4.0 4 3.8 5 3.6 4.5
Tokyo 4.1 5 4.1 5 4.2 5 4.1 5 4.2 5 4.3 5 3.9 5
Wellington 3.9 4.5 3.8 5 3.9 4 3.8 5 3.7 4 4.0 5 3.6 4.5
15The 2019 bleisure barometerAsia’s best cities for work and recreation
© The Economist Intelligence Unit Limited 2019
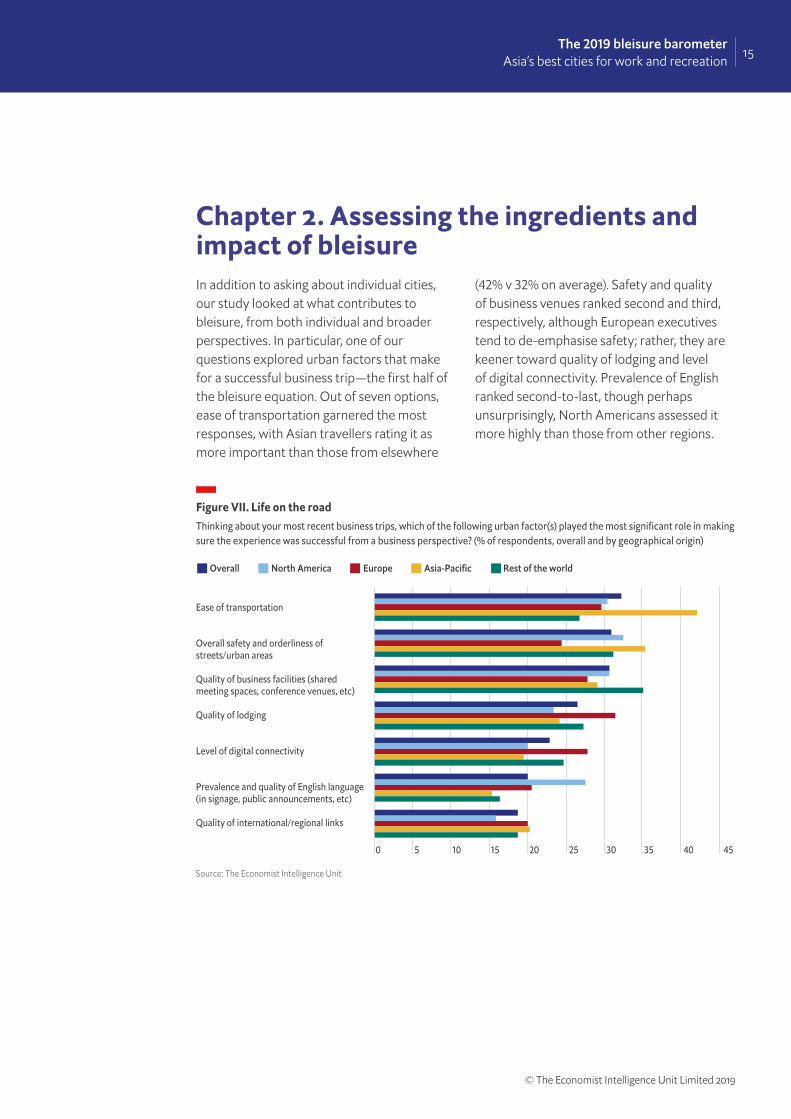
In addition to asking about individual cities, our study looked at what contributes to bleisure, from both individual and broader perspectives. In particular, one of our questions explored urban factors that make for a successful business trip—the first half of the bleisure equation. Out of seven options, ease of transportation garnered the most responses, with Asian travellers rating it as more important than those from elsewhere
(42% v 32% on average). Safety and quality of business venues ranked second and third, respectively, although European executives tend to de-emphasise safety; rather, they are keener toward quality of lodging and level of digital connectivity. Prevalence of English ranked second-to-last, though perhaps unsurprisingly, North Americans assessed it more highly than those from other regions.
Chapter 2. Assessing the ingredients and impact of bleisure
Figure VII. Life on the roadThinking about your most recent business trips, which of the following urban factor(s) played the most significant role in making sure the experience was successful from a business perspective? (% of respondents, overall and by geographical origin)
Source: The Economist Intelligence Unit
0 5 10 15 20 25 30 35 40 45
Ease of transportation
Overall safety and orderliness of streets/urban areas
Quality of business facilities (shared meeting spaces, conference venues, etc)
Quality of lodging
Level of digital connectivity
Prevalence and quality of English language (in signage, public announcements, etc)
Quality of international/regional links
Overall North America Europe Asia-Pacific Rest of the world
16 The 2019 bleisure barometerAsia’s best cities for work and recreation
© The Economist Intelligence Unit Limited 2019
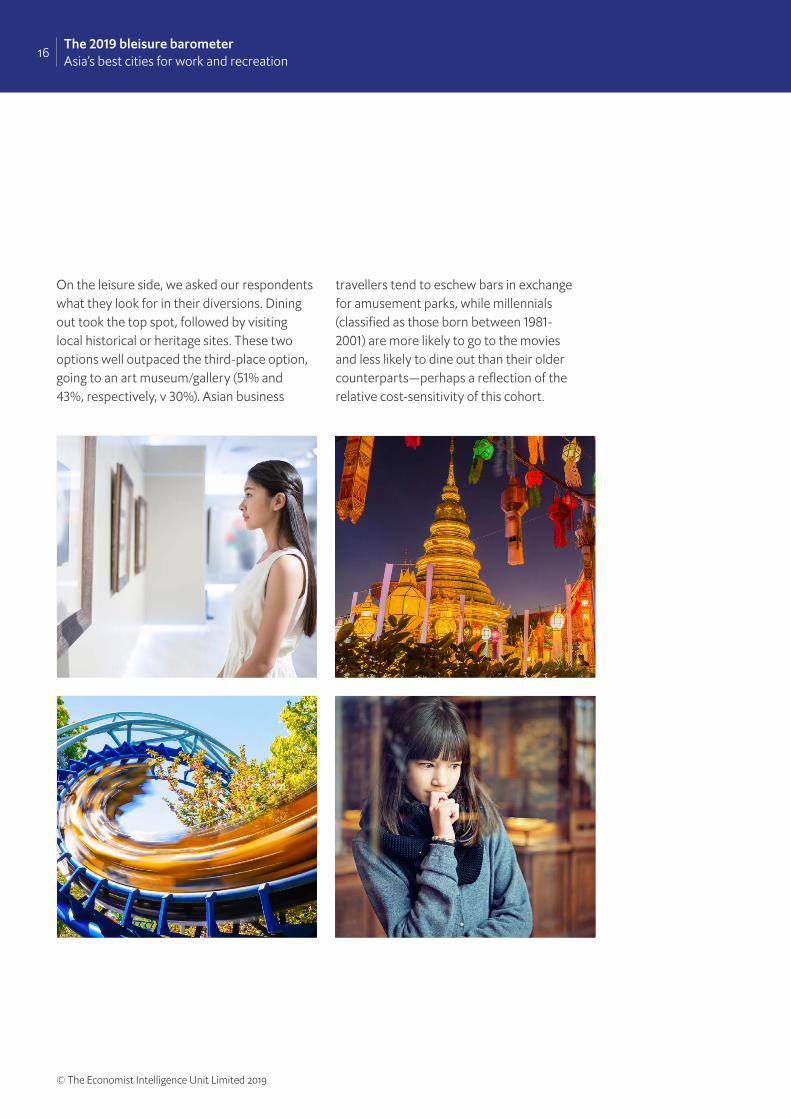
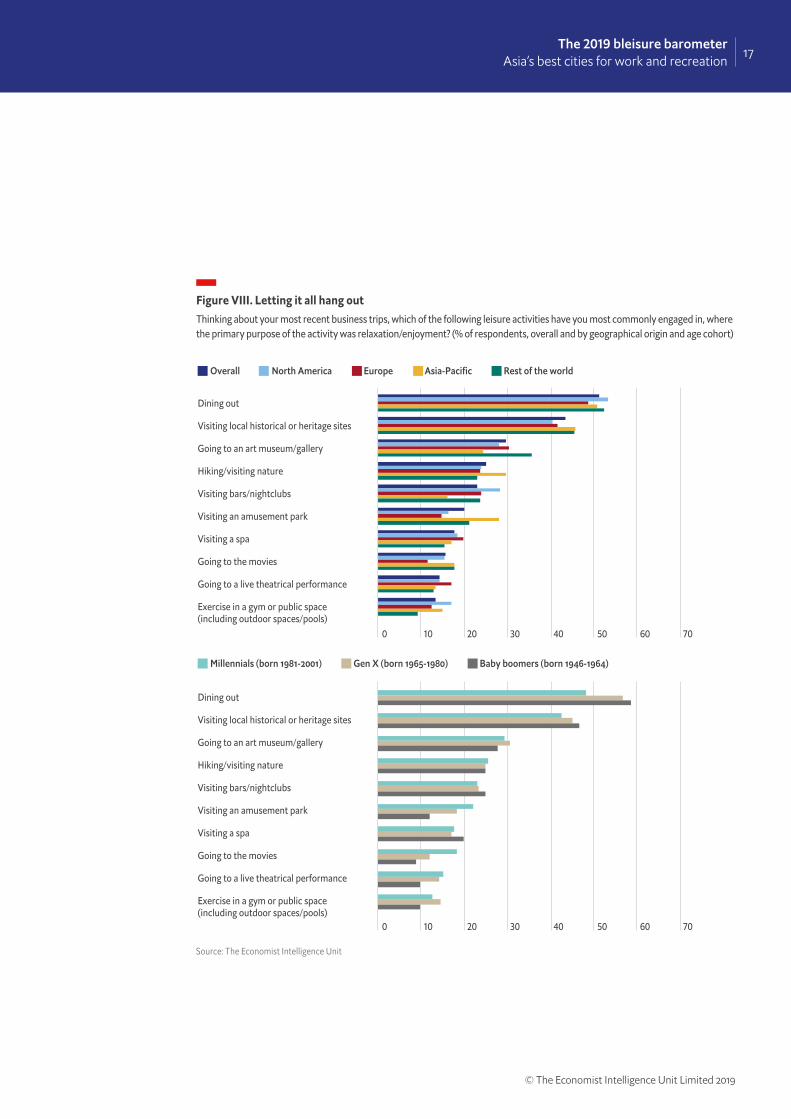
On the leisure side, we asked our respondents what they look for in their diversions. Dining out took the top spot, followed by visiting local historical or heritage sites. These two options well outpaced the third-place option, going to an art museum/gallery (51% and 43%, respectively, v 30%). Asian business
travellers tend to eschew bars in exchange for amusement parks, while millennials (classified as those born between 1981-2001) are more likely to go to the movies and less likely to dine out than their older counterparts—perhaps a reflection of the relative cost-sensitivity of this cohort.
17The 2019 bleisure barometerAsia’s best cities for work and recreation
© The Economist Intelligence Unit Limited 2019
Figure VIII. Letting it all hang outThinking about your most recent business trips, which of the following leisure activities have you most commonly engaged in, where the primary purpose of the activity was relaxation/enjoyment? (% of respondents, overall and by geographical origin and age cohort)
Source: The Economist Intelligence Unit
0 10 20 30 40 50 60 70
Dining out
Visiting local historical or heritage sites
Going to an art museum/gallery
Hiking/visiting nature
Visiting bars/nightclubs
Visiting an amusement park
Visiting a spa
Going to the movies
Going to a live theatrical performance
Exercise in a gym or public space (including outdoor spaces/pools)
Millennials (born 1981-2001) Gen X (born 1965-1980) Baby boomers (born 1946-1964)
Overall North America Europe Asia-Pacific Rest of the world
18 The 2019 bleisure barometerAsia’s best cities for work and recreation
© The Economist Intelligence Unit Limited 2019
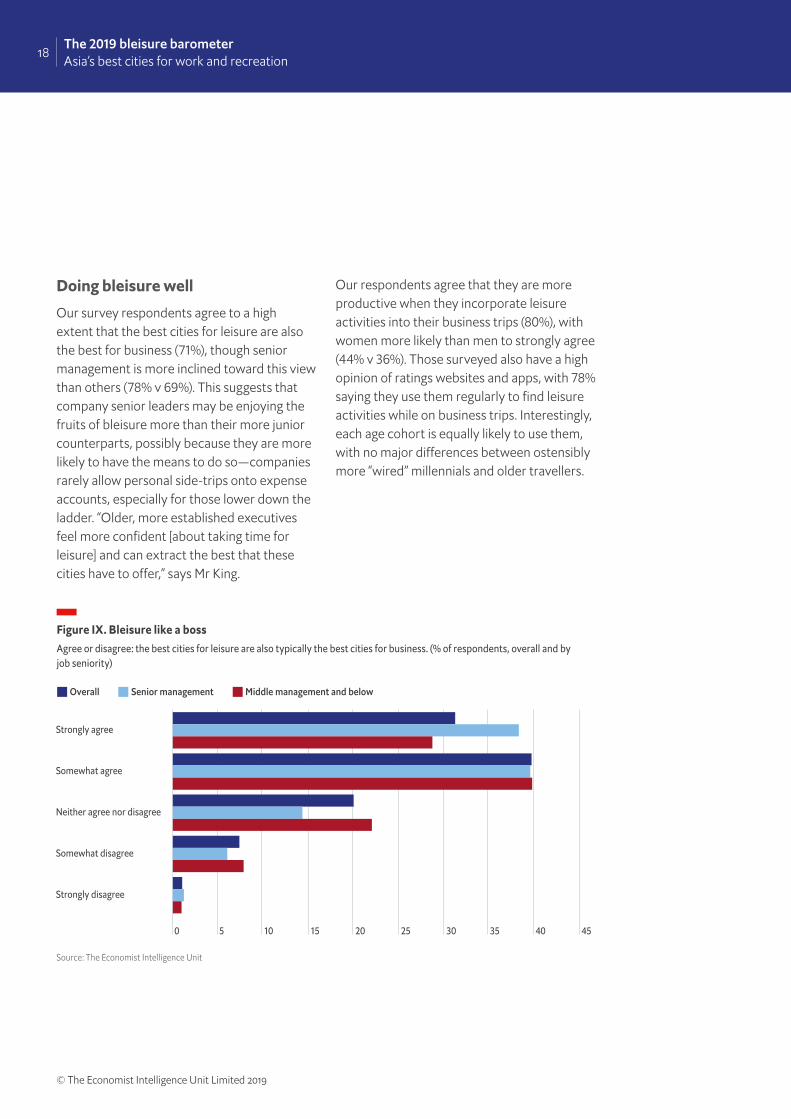
Doing bleisure wellOur survey respondents agree to a high extent that the best cities for leisure are also the best for business (71%), though senior management is more inclined toward this view than others (78% v 69%). This suggests that company senior leaders may be enjoying the fruits of bleisure more than their more junior counterparts, possibly because they are more likely to have the means to do so—companies rarely allow personal side-trips onto expense accounts, especially for those lower down the ladder. “Older, more established executives feel more confident [about taking time for leisure] and can extract the best that these cities have to offer,” says Mr King.
Our respondents agree that they are more productive when they incorporate leisure activities into their business trips (80%), with women more likely than men to strongly agree (44% v 36%). Those surveyed also have a high opinion of ratings websites and apps, with 78% saying they use them regularly to find leisure activities while on business trips. Interestingly, each age cohort is equally likely to use them, with no major differences between ostensibly more “wired” millennials and older travellers.
Figure IX. Bleisure like a bossAgree or disagree: the best cities for leisure are also typically the best cities for business. (% of respondents, overall and by job seniority)
Source: The Economist Intelligence Unit
0 5 10 15 20 25 30 35 40 45
Strongly agree
Somewhat agree
Neither agree nor disagree
Somewhat disagree
Strongly disagree
Overall Senior management Middle management and below
19The 2019 bleisure barometerAsia’s best cities for work and recreation
© The Economist Intelligence Unit Limited 2019
Conclusion. The blest of both worldsUntil recently, bleisure has largely been overlooked as a serious trend in both tourism and business travel. “People still tend to see it as having an international jolly,” says Mrs Lichy. Yet with the growing notion that finding space for fun can be beneficial to one’s working life, the bleisure phenomenon is quickly gaining steam. As cities in Asia jostle for a slice of the growing global business travel market, they may benefit from facilitating greater overlap in the business and leisure ends of the travel spectrum.
“If you’re travelling to a city for work and you have someone from the city helping you find leisure opportunities, that can definitely make you want to extend your trip or go back for vacation,” says Ms Collison. In this way, cities offering the best of this unique combination may be poised to succeed as top tourism destinations in the years and decades ahead.
20 The 2019 bleisure barometerAsia’s best cities for work and recreation
© The Economist Intelligence Unit Limited 2019
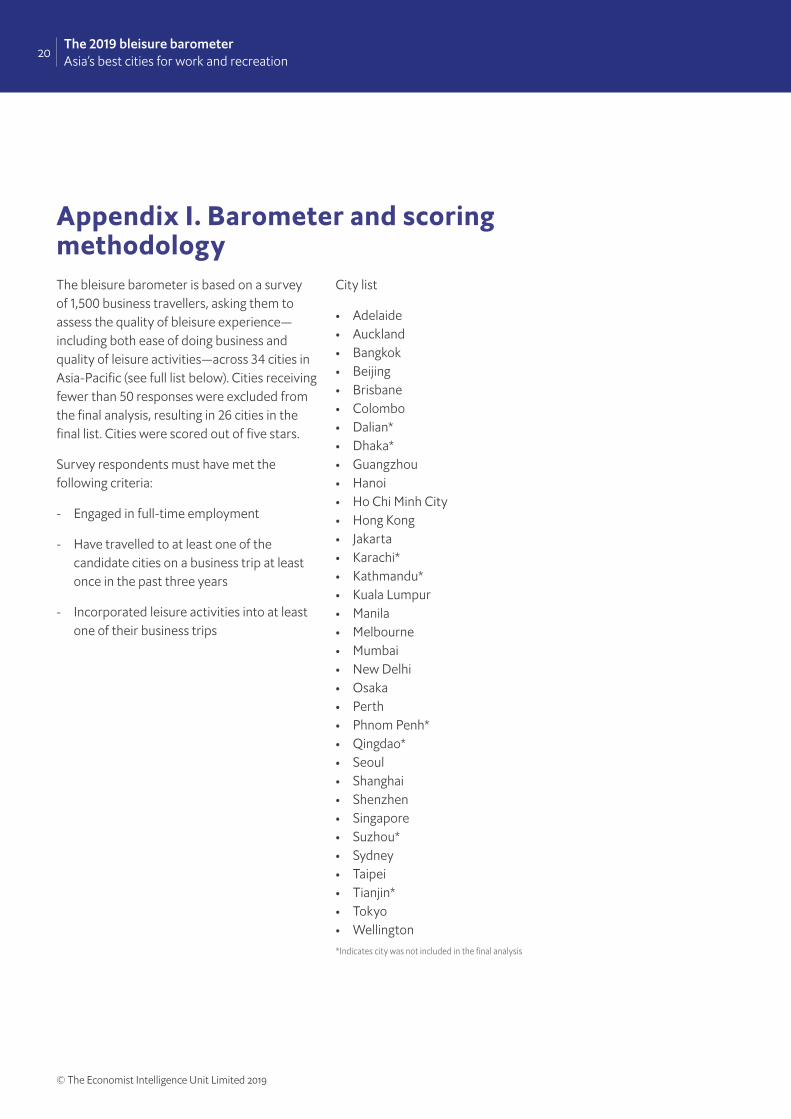
The bleisure barometer is based on a survey of 1,500 business travellers, asking them to assess the quality of bleisure experience—including both ease of doing business and quality of leisure activities—across 34 cities in Asia-Pacific (see full list below). Cities receiving fewer than 50 responses were excluded from the final analysis, resulting in 26 cities in the final list. Cities were scored out of five stars.
Survey respondents must have met the following criteria:
- Engaged in full-time employment
- Have travelled to at least one of the candidate cities on a business trip at least once in the past three years
- Incorporated leisure activities into at least one of their business trips
City list
• Adelaide• Auckland• Bangkok• Beijing• Brisbane• Colombo• Dalian*• Dhaka*• Guangzhou• Hanoi• Ho Chi Minh City• Hong Kong• Jakarta• Karachi*• Kathmandu*• Kuala Lumpur• Manila• Melbourne• Mumbai• New Delhi• Osaka• Perth• Phnom Penh*• Qingdao*• Seoul• Shanghai• Shenzhen• Singapore• Suzhou*• Sydney• Taipei• Tianjin*• Tokyo• Wellington *Indicates city was not included in the final analysis
Appendix I. Barometer and scoring methodology
21The 2019 bleisure barometerAsia’s best cities for work and recreation
© The Economist Intelligence Unit Limited 2019
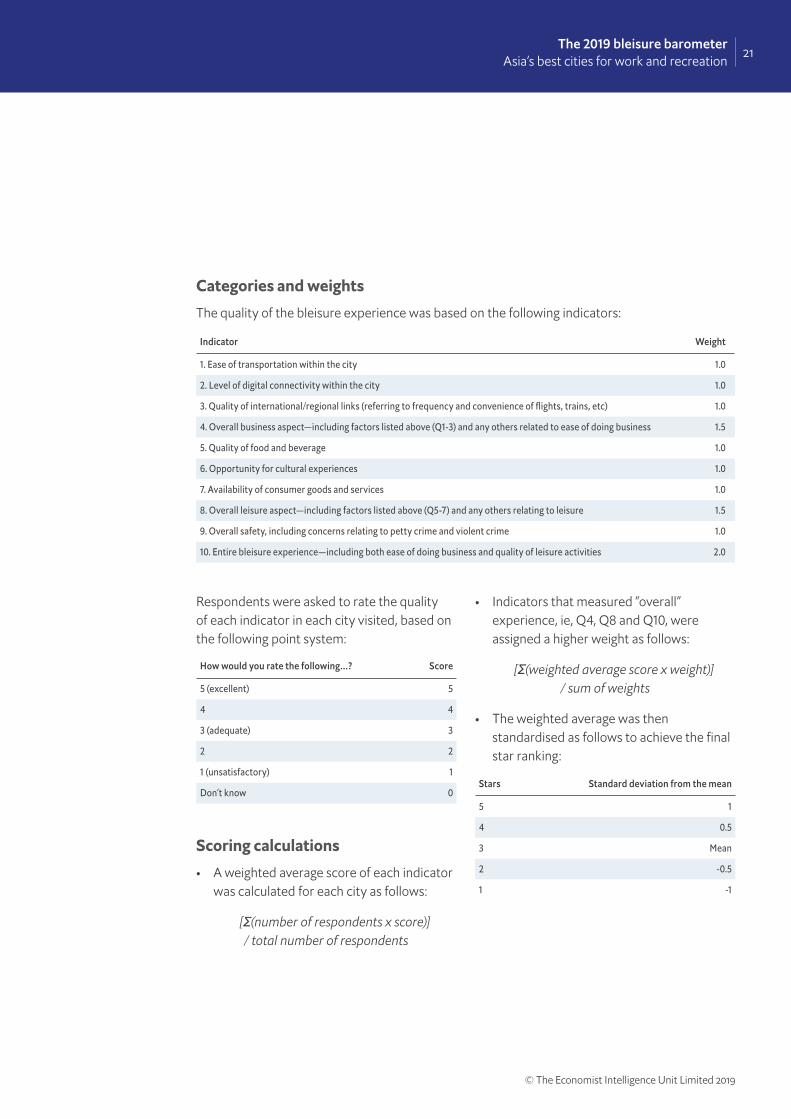
• Indicators that measured “overall” experience, ie, Q4, Q8 and Q10, were assigned a higher weight as follows:
[Σ(weighted average score x weight)] / sum of weights
• The weighted average was then standardised as follows to achieve the final star ranking:
Categories and weightsThe quality of the bleisure experience was based on the following indicators:
Respondents were asked to rate the quality of each indicator in each city visited, based on the following point system:
Scoring calculations• A weighted average score of each indicator
was calculated for each city as follows:
[Σ(number of respondents x score)] / total number of respondents
Indicator Weight
1. Ease of transportation within the city 1.0
2. Level of digital connectivity within the city 1.0
3. Quality of international/regional links (referring to frequency and convenience of flights, trains, etc) 1.0
4. Overall business aspect—including factors listed above (Q1-3) and any others related to ease of doing business 1.5
5. Quality of food and beverage 1.0
6. Opportunity for cultural experiences 1.0
7. Availability of consumer goods and services 1.0
8. Overall leisure aspect—including factors listed above (Q5-7) and any others relating to leisure 1.5
9. Overall safety, including concerns relating to petty crime and violent crime 1.0
10. Entire bleisure experience—including both ease of doing business and quality of leisure activities 2.0
How would you rate the following…? Score
5 (excellent) 5
4 4
3 (adequate) 3
2 2
1 (unsatisfactory) 1
Don’t know 0Stars Standard deviation from the mean
5 1
4 0.5
3 Mean
2 -0.5
1 -1
22 The 2019 bleisure barometerAsia’s best cities for work and recreation
© The Economist Intelligence Unit Limited 2019
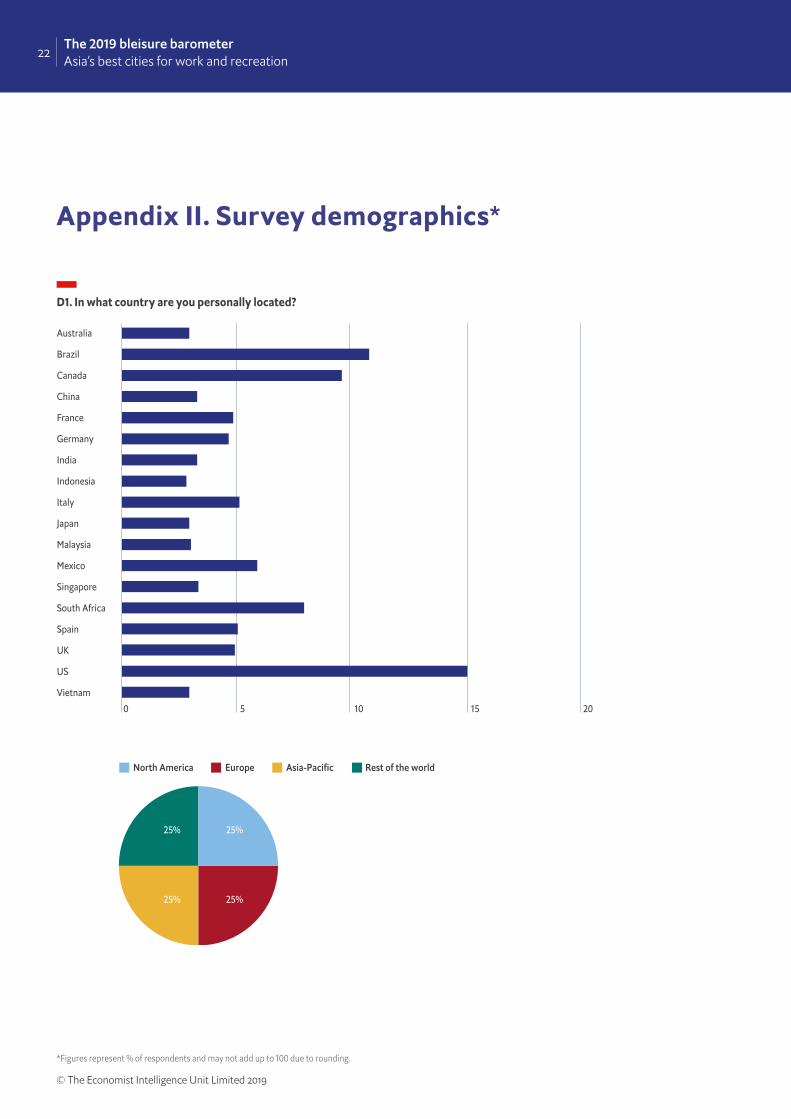
Appendix II. Survey demographics*
D1. In what country are you personally located?
0 5 10 15 20
Australia
Brazil
Canada
China
France
Germany
India
Indonesia
Italy
Japan
Malaysia
Mexico
Singapore
South Africa
Spain
UK
US
Vietnam
North America Europe Asia-Pacific Rest of the world
25% 25%
25% 25%
*Figures represent % of respondents and may not add up to 100 due to rounding.
23The 2019 bleisure barometerAsia’s best cities for work and recreation
© The Economist Intelligence Unit Limited 2019
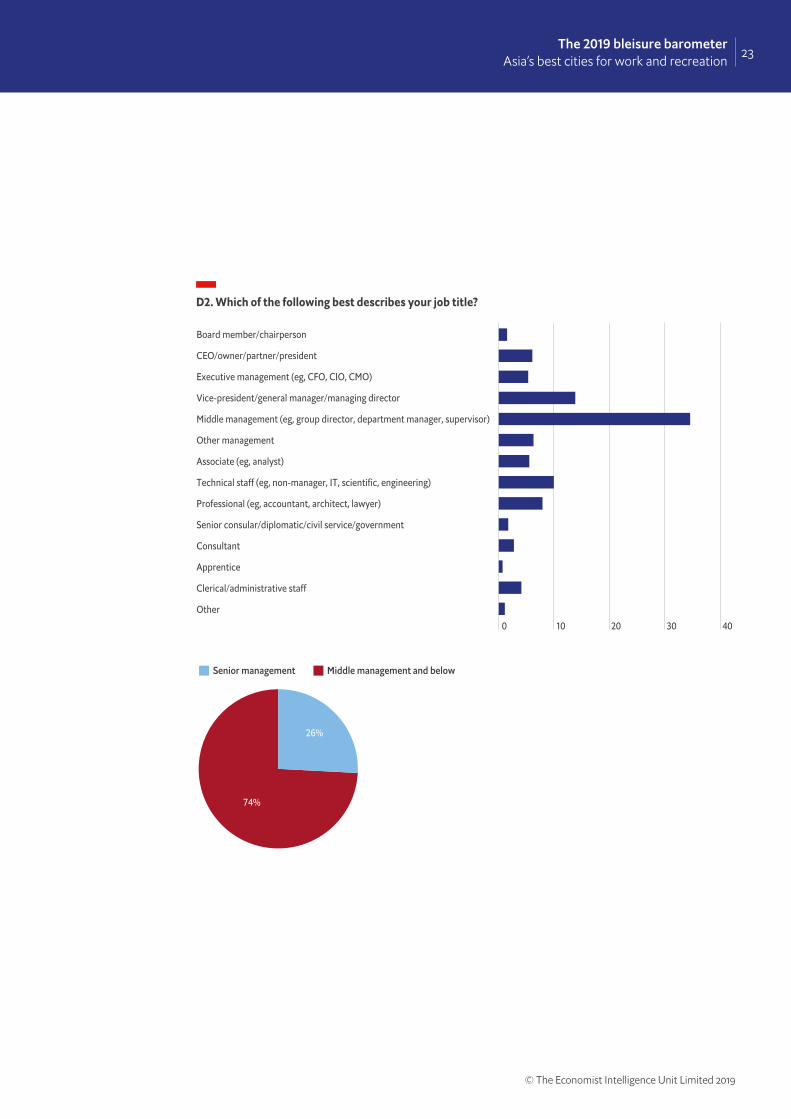
D2. Which of the following best describes your job title?
0 10 20 30 40
Board member/chairperson
CEO/owner/partner/president
Executive management (eg, CFO, CIO, CMO)
Vice-president/general manager/managing director
Middle management (eg, group director, department manager, supervisor)
Other management
Associate (eg, analyst)
Technical staff (eg, non-manager, IT, scientific, engineering)
Professional (eg, accountant, architect, lawyer)
Senior consular/diplomatic/civil service/government
Consultant
Apprentice
Clerical/administrative staff
Other
Senior management Middle management and below
26%
74%
24 The 2019 bleisure barometerAsia’s best cities for work and recreation
© The Economist Intelligence Unit Limited 2019
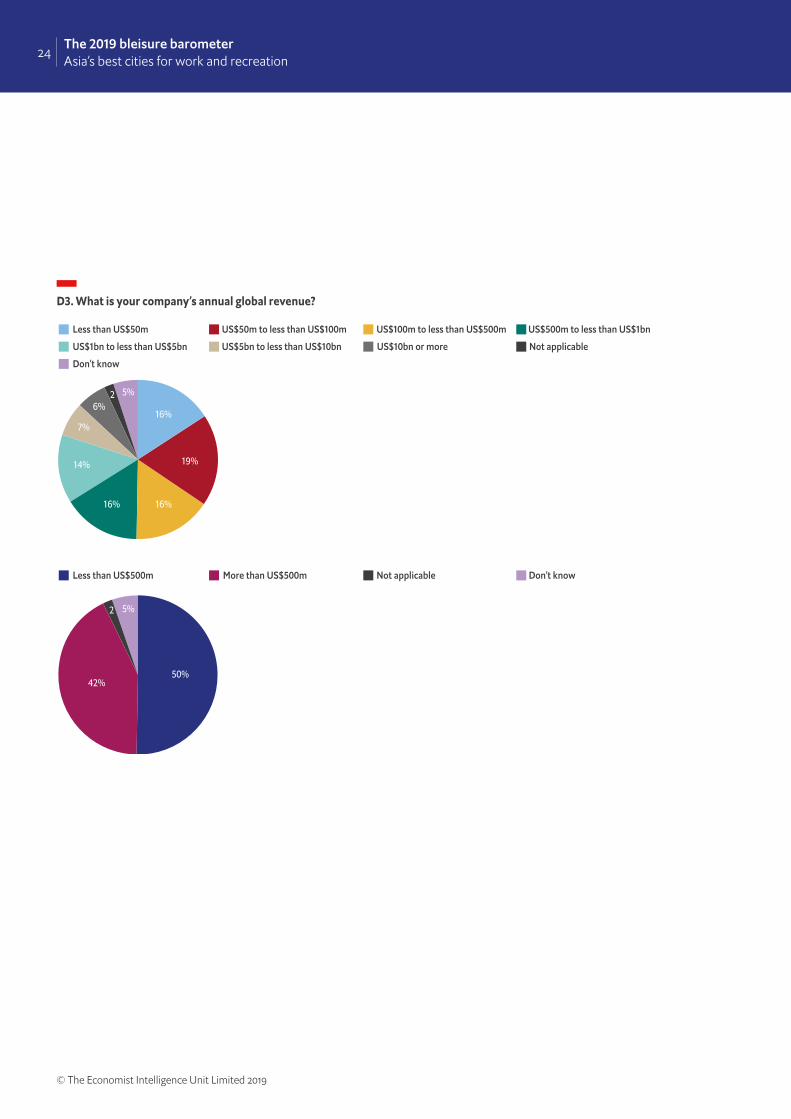
D3. What is your company’s annual global revenue?
Less than US$50m US$50m to less than US$100m US$100m to less than US$500m US$500m to less than US$1bn
US$1bn to less than US$5bn US$5bn to less than US$10bn US$10bn or more Not applicable
Don’t know
16%
14%
7%
6%5%2
16%
16%
19%
Less than US$500m More than US$500m Not applicable Don’t know
42%
5%2
50%
25The 2019 bleisure barometerAsia’s best cities for work and recreation
© The Economist Intelligence Unit Limited 2019
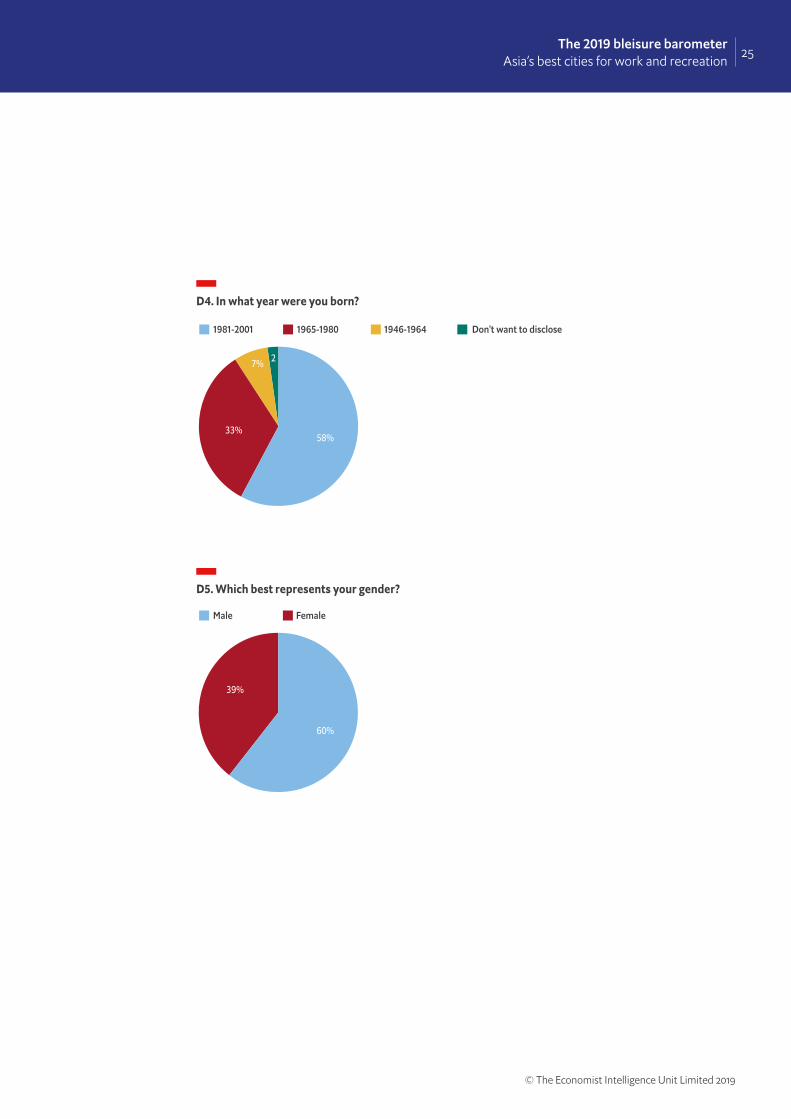
D4. In what year were you born?
D5. Which best represents your gender?
1981-2001 1965-1980 1946-1964 Don't want to disclose
2
58%
7%
33%
Male Female
60%
39%

LONDON20 Cabot SquareLondon, E14 4QWUnited KingdomTel: (44.20) 7576 8000Fax: (44.20) 7576 8500Email: [email protected]
NEW YORK750 Third Avenue5th FloorNew York, NY 10017United StatesTel: (1.212) 554 0600Fax: (1.212) 586 1181/2 Email: [email protected]
HONG KONG1301 Cityplaza Four12 Taikoo Wan RoadTaikoo ShingHong KongTel: (852) 2585 3888Fax: (852) 2802 7638 Email: [email protected]
GENEVARue de l’Athénée 321206 GenevaSwitzerlandTel: (41) 22 566 2470Fax: (41) 22 346 93 47Email: [email protected]
DUBAIOffice 1301aAurora TowerDubai Media CityDubaiTel: (971) 4 433 4202Fax: (971) 4 438 0224Email: [email protected]
SINGAPORE8 Cross Street#23-01 Manulife TowerSingapore 048424Tel: (65) 6534 5177Fax: (65) 6534 5077 Email: [email protected]