the 2017 value creators report: disruption and reinvention ... · 6 | disruption and reinvention in...
TRANSCRIPT

The 2017 Value Creators Report
Disruption and Reinvention in Value Creation

The Boston Consulting Group (BCG) is a global management consulting firm and the world’s leading advisor on business strategy. We partner with clients from the private, public, and not-for-profit sectors in all regions to identify their highest-value opportunities, address their most critical challenges, and transform their enterprises. Our customized approach combines deep insight into the dynamics of companies and markets with close collaboration at all levels of the client organization. This ensures that our clients achieve sustainable competitive advantage, build more capable organizations, and secure lasting results. Founded in 1963, BCG is a private company with offices in more than 90 cities in 50 countries. For more information, please visit bcg.com.

June 2018 | The Boston Consulting Group
DISRUPTION AND REINVENTION IN VALUE CREATION
GERRY HANSELL
JEFFREY KOTZEN
ALEXANDER ROOS
ERIC WICK
JODY FOLDESY
ERIC OLSEN
SAM FARLEY
MARTIN LINK
HADY FARAG
The 2017 Value Creators Report

2 | Disruption and Reinvention in Value Creation
CONTENTS
3 PREFACE
4 VALUE CREATION AND CORPORATE REINVENTIONWhen Disruption Your Way ComesThe Rules of Value Creation Still Apply
10 CREATING VALUE FROM DISRUPTION (WHILE OTHERS DISAPPEAR)
Long Odds……And High HurdlesHow Thrivers Create ValuePutting All the Pieces Together
15 HOW TOP VALUE CREATORS OUTPACE THE MARKET— FOR DECADES
The 2017 RankingsWhy TSR Is Important……And Difficult to SustainTales of 20-Year TSR
20 APPENDIX: THE 2017 VALUE CREATOR RANKINGS
39 FOR FURTHER READING
40 NOTE TO THE READER

The Boston Consulting Group | 3
Disruption and Reinvention in Value Creation is the 19th annual report in the Value Creators series published by The Boston
Consulting Group. Each year, we offer commentary on trends in the global economy and the world’s capital markets, share BCG’s latest research and thinking on value creation, and publish detailed empiri-cal rankings of the world’s top value creators.
This year’s report addresses two related themes. The first is how com-panies can create value in times of disruption by adjusting their strat-egies and business models on the fly. The second theme is how value creation leaders can outperform both in the near term and consistent-ly over time by adjusting the levers that deliver TSR. The report in-cludes three articles that were published during 2017. It also includes the rankings of the top ten value creators worldwide and in 32 indus-tries for the five-year period from 2012 through 2016.
PREFACE

4 | Disruption and Reinvention in Value Creation
VALUE CREATION AND CORPORATE REINVENTION
In the face of industry disruption, compa-ny owners focus on two questions: How will
the company navigate the changes taking place? And what should business look like on the far side of the storm? Disruption upends not only markets and models but also the paradigms within which companies operate. Traditional goals for stable times, such as near-term EPS growth, are rendered irrele-vant. Management teams need to shift gears, think like owners, and apply the fundamental tools of value creation with a reinvention mindset.
When Disruption Your Way ComesThere are plenty of causes of disruption to-day—market shifts, technology advances, reg-ulatory changes, and fluid trade policies, for example—and few industries are immune. Digital technology alone has upended multi-ple industries in recent years, and its impact is only beginning to be felt in others. Newer technologies such as artificial intelligence, augmented and virtual reality, and block-chain are gaining traction. According to CB Insights, some 215 “unicorns” (startups val-ued at $1 billion or more) are active in more than 20 industries today. More and more pub-licly held insurgents have surpassed incum-bents in value and are appearing regularly at the top of our value creator rankings. The ad-vent of fast-moving and powerfully backed
insurgents is a strong signal for incumbents to take a hard look at the likely future of their current models and portfolios.
To continue to outperform in disruptive times, leaders must change their strategies, portfolios, and sometimes their business models. But radical reinvention—revamping portfolios and rethinking how companies compete and how they create value for their shareholders—is a tall order. Most companies are not used to reinventing their business models. And because established organiza-tions are often hardwired to deny the need for disruptive change, they resist business models that upset the status quo.
As a result of these “reinvention barriers,” the odds against successful transformation in the face of disruption are really long—only about one in three companies emerges suc-cessfully. More important, though, is that the companies that do make the transition often create even more value than they did previ-ously—an average of 14 additional percent-age points of annual TSR than their peers.
The Rules of Value Creation Still ApplyThe same best-practice value creation tools that have been successful in stable times can be even more important in disruptive circum-stances. They provide invaluable focus and
The Boston Consulting Group | 5
insights into how to navigate the changes tak-ing place. They can also guide priority setting, from a long-term investor’s point of view, for the reinvention program.
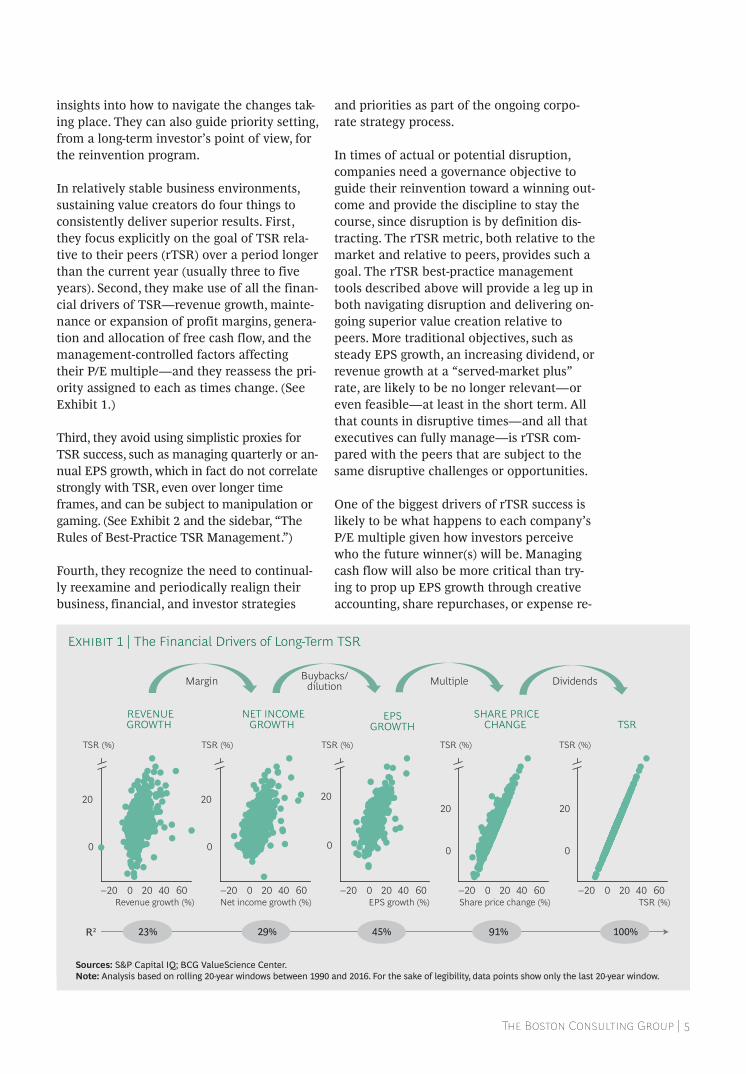
In relatively stable business environments, sustaining value creators do four things to consistently deliver superior results. First, they focus explicitly on the goal of TSR rela-tive to their peers (rTSR) over a period longer than the current year (usually three to five years). Second, they make use of all the finan-cial drivers of TSR—revenue growth, mainte-nance or expansion of profit margins, genera-tion and allocation of free cash flow, and the management-controlled factors affecting their P/E multiple—and they reassess the pri-ority assigned to each as times change. (See Exhibit 1.)
Third, they avoid using simplistic proxies for TSR success, such as managing quarterly or an-nual EPS growth, which in fact do not correlate strongly with TSR, even over longer time frames, and can be subject to manipulation or gaming. (See Exhibit 2 and the sidebar, “The Rules of Best-Practice TSR Management.”)
Fourth, they recognize the need to continual-ly reexamine and periodically realign their business, financial, and investor strategies
and priorities as part of the ongoing corpo-rate strategy process.
In times of actual or potential disruption, companies need a governance objective to guide their reinvention toward a winning out-come and provide the discipline to stay the course, since disruption is by definition dis-tracting. The rTSR metric, both relative to the market and relative to peers, provides such a goal. The rTSR best-practice management tools described above will provide a leg up in both navigating disruption and delivering on-going superior value creation relative to peers. More traditional objectives, such as steady EPS growth, an increasing dividend, or revenue growth at a “served-market plus” rate, are likely to be no longer relevant—or even feasible—at least in the short term. All that counts in disruptive times—and all that executives can fully manage—is rTSR com-pared with the peers that are subject to the same disruptive challenges or opportunities.
One of the biggest drivers of rTSR success is likely to be what happens to each company’s P/E multiple given how investors perceive who the future winner(s) will be. Managing cash flow will also be more critical than try-ing to prop up EPS growth through creative accounting, share repurchases, or expense re-
REVENUEGROWTH
NET INCOMEGROWTH
EPSGROWTH
SHARE PRICECHANGE TSR
200–20 60
0
40 200–20 6040 200–20 6040 200–20 6040 200–20 6040
20
Revenue growth (%)
TSR (%)
0
20
Net income growth (%)
TSR (%)
20
0
TSR (%)
EPS growth (%)
20
0
TSR (%)
Share price change (%)
20
0
TSR (%)
TSR (%)
Margin Buybacks/dilution Multiple Dividends
23% 100%91%45%29%R2
Sources: S&P Capital IQ; BCG ValueScience Center.Note: Analysis based on rolling 20-year windows between 1990 and 2016. For the sake of legibility, data points show only the last 20-year window.
Exhibit 1 | The Financial Drivers of Long-Term TSR

6 | Disruption and Reinvention in Value Creation
duction when the underlying people or capa-bilities may be needed to meet the disruption challenge.
The experience of two tech companies—Ado-be and Microsoft—illustrates the power of a focus on rTSR during disruptions. Adobe is one of only nine companies to have consis-tently outperformed over the past 20 years, with an annualized TSR of 16.8% from 1996 through 2016, compared with a median of about 10% for all the companies in BCG’s val-ue creation database and 11.5% for the tech sector. And during that period, it undertook a major transformation of its business model.
Over the past five years, Adobe has posted an annualized TSR of 29.5% (number 11 among all large-cap companies), compared with 16.1% for the overall database and 18.4% for the tech sector. Microsoft, which has also un-dergone significant business model transfor-mation, isn’t far behind, with 22.4% annual TSR over the past five years. The key reason for both companies’ strong TSR performance is the much-improved quality of their earn-ings, rather than their quantity, which high-lights the benefits of their transformations. Adobe’s EPS has grown by only 6.7% a year over the past five years, compared with 8.2% on average for tech companies. Microsoft’s EPS even contracted by 5% a year over the
same period. At the same time, both compa-nies’ trailing P/E multiples have expanded by more than 20% a year (from as low as 9.3x to 28.8x for Microsoft and from 16.7x to 43.8x for Adobe), reflecting investors’ positive reac-tion to the moves both management teams are making.
Companies facing disruption will also need to rethink the alignment of their business, financial, and investor strategy priorities. Legacy capital allocation priorities can be either strained by disruption, become barriers to confronting disruption, or both. But while rethinking the business strategy is an obvious high priority, it can’t be divorced from developing and communicating a clear value proposition to the kind of investors who will support management—and the company’s P/E—during the disruption period or from developing a revised set of financial policies that reduce risk, preserve flexibility, and provide confidence to the market that the changes underway will work.
When disruption is not occurring but the cloud is on the horizon, the rTSR metric pro-vides an early-warning signal that can help top management mobilize its organizations and boards. Companies should monitor the rTSR of their peer group versus the overall market as a routine exercise. When the peer
1 YEAR 5 YEARS 20 YEARS
100
200
0
–50
50
250
150
8006004002000EPS growth (%)
TSR (%)
–100 0 100 200
100
–50
0
50
Annual TSR (%)
–20 0 20 40
10
20
0
30
40
Annual TSR (%)
R2 4% 23% 45%
Annual EPS growth (%) Annual EPS growth (%)
Sources: S&P Capital IQ; BCG ValueScience Center.Note: Analysis based on rolling 1-, 5-, and 20-year windows between 1990 and 2016. For the sake of legibility, data points show only the last window for each time frame.
Exhibit 2 | EPS Growth Does Not Correlate Strongly with TSR

The Boston Consulting Group | 7
The right governance focus in both stable and disruptive times is rTSR success. There are four reasons.
First, rTSR is objective. The P/E multiple component puts the market in charge. Investors can evaluate not only earnings growth and earnings performance versus expectations but also the quality of the earnings and whether the underlying cash flow is sustainable. That said, our research in multiple sectors has shown that 80% of the factors that drive a company’s multiple relative to its peers (which is what counts from an rTSR perspective) are largely under management’s control. (See the exhibit “More Than 80% of the Factors Affecting the Valuation Multiple Can Be Quantified and Managed.”)
Second, the market is efficient. It has proven itself very good at reflecting all the known factors affecting a company and its
performance in the company’s stock price. Investors collectively do not leave value on the table. This creates a level playing field for all companies to compete in delivering superior rTSR looking forward—no one is advantaged or disadvantaged owing to past performance. It’s all about future perfor-mance improvements and/or continuing to beat the fade that is baked into market expectations for most companies.
Third, rTSR corrects for macroeconomic and broad industry trends and events that are beyond management’s control. In this way, the metric reflects the value that management, through strategy, planning, and execution, adds to (or subtracts from) the enterprise.
Finally, rTSR is the only thing that matters to the investors that own a company. They may have different priorities for how superior rTSR is achieved (a growth focus
THE RULES OF BEST-PRACTICE TSR MANAGEMENT
PROFIT-BASED(consumer durables)
ASSET-BASED(metals)
14
12
8
18
9
12
5 Dividend/Gross margin
EBIT margin
Credit grade
Gross investmentturnover
Change in Chinese steel price
(Debt/Assets)2
Forward revenue growth
Unexplained
GROWTH-FOCUSED(software)
28
7
15
12
10
95
Forward revenue growth(next 12 months)
Unexplained
EBITDA growth(next 12 months)
SG&A/Revenue
Total debt/assets
Cash gross margin
Financial crisis variable
Cash/Revenue
28
26
10
987
Unexplained
Capex % revenue
Debt/Assets
Opex % revenue
Gross margin
Dividends % EBITDA
Size
ROGI
Profit variables (%) Balance sheet variables (%) Growth expectations (%)
Payout variables (%) Other variables (%)
Sources: Compustat; BCG ValueScience Center. Note: All numbers shown are contributions to explanatory power (R2) for valuation multiples across a set of reference companies.
More Than 80% of the Factors Affecting the Valuation Multiple Can Be Quantified and Managed

8 | Disruption and Reinvention in Value Creation
versus a cash generation and payout focus), but in the end, rTSR success is what will keep them invested and supportive of management’s agenda.
An explicit rTSR governance focus needs to be based on a clear understanding of just how difficult it is to continuously win the rTSR competition with a company’s peers. Our analysis of the S&P 500, as well as of many specific industry sectors, shows that the odds of delivering above-average rTSR year in and year out are similar to a random coin toss: 50% in one period, 25% for two periods in a row, 12.5% for three periods in a row. These odds hold true even for top performers, because the valuation multiple component means that they typically revert back to average TSR over time. (See the exhibit “TSR Reverts to the Mean, Limiting Even Top Performers’ Upside.”)
For this reason, strategic plans should always be developed with an eye to winning on rTSR over the next three- to five-year period (and not every year in the period). Moreover, incentive program payouts should be based on realistic assessments of the frequency of delivering above- average rTSR and on the level and period of outperformance required to trigger a top incentive award. For example, delivering top-quartile TSR over five years typically requires performing 10 percentage points above the industry median, while delivering top-quartile TSR over a 20-year period typi- cally requires only about a 4 percentage- point spread over the median.
THE RULES OF BEST-PRACTICE TSR MANAGEMENT(continued)
11.7% 10.7%
0
10
20
30
Annual TSR
+3.7 points
+3.3 points+10.2 points
+9.6 points
20 years5 years
Median (50th percentile)
Top-quartile median (87.5th percentile)Top-quartile cutoff (75th percentile)
25.3
17.0
12.4
8.2
1.2
0 10 20Median annual
TSR (%)
Highestquintile
Lowestquintile
8.5
7.5
8.3
8.0
8.1
0 5 10
Median annualTSR (%)
MEAN REVERSION MAKES STRONGTSR PERFORMANCE HARD TO SUSTAIN …
… LEADING TO MODESTLONG-TERM TSR SPREADS
INITIAL 10-YEARTSR (1997–2006)
FOLLOWING 10-YEARTSR (2007–2016)
Sources: S&P Capital IQ; BCG ValueScience Center. Note: The data in the left-hand graph is based on the 1,309 companies in BCG’s value creators database that were publicly listed during the 20 years from 1997 to 2016. Data in the right-hand graph is based on rolling 5- and 20-year windows from 1991 to 2016 (and on companies that were publicly listed during that period).
TSR Reverts to the Mean, Limiting Even Top Performers’ Upside

The Boston Consulting Group | 9
group is underperforming the market (and the cause is not normal industry cyclicality), it may be a signal of impending disruption from a source such as regulatory change, new technology, or demographic shifts. When the peer group is underperforming the market and the company is underperforming its peers, that is an even stronger signal that re-invention is needed.
We examined the performance of 1,952 com-panies that attracted attention from activist investors from 2000 through 2017. These ac-tivist targets underperformed both the S&P 500 and their industry indices by more than 7 percentage points in the year before the ac-tivist arrived. They underperformed the S&P
500 by more than 3 percentage points, and the industry index by almost 6 percentage points, in the three years prior. Given a mar-ket and typical industry average TSR of about 9%, a 3 to 7 percentage-point gap is a clear call to action.
BCG has studied the patterns and drivers of rTSR success for almost three decades.
In stable times, as well as in times of finan-cial crisis, recession, technology change, or disruption, companies that win combine a willingness to embrace reinvention with the guidance and discipline of best-practice TSR management.

10 | Disruption and Reinvention in Value Creation
CREATING VALUE FROM DISRUPTION (WHILE OTHERS DISAPPEAR)
The odds are long, but the payoff is big. Only about one in three companies
successfully evolves in the face of industry disruption. Trillions of dollars of shareholder value have vaporized as once high-flying companies failed to navigate major shifts driven by technology, consumers, or regula-tion. But companies that do make the transi-tion often create even more value than they had previously.
About one in three companies successfully evolves in the face of industry disruption.
Disruption, including rapid technological change, is at the top of most companies’ agendas, and rightly so: more industries and companies than ever before are facing the need to adapt. As Cisco’s John Chambers told the Wall Street Journal in 2015, “Every compa-ny’s future is going to depend on whether they catch the market transitions right.” Here’s what successful companies did to catch those transitions right.
Long Odds…The track record is stark. Across a long list of industries (including agriculture, apparel, fi-
nancial services, food, media, pharmaceuti-cals, retail, technology, and travel), substan-tive industry shocks have hobbled, if not crippled, incumbents. For the relatively few that navigated the transition, five numbers stand out:
• 33: The percentage of companies that successfully steered through the change when industry disruption occurred. The other 67% went out of business, got bought, or stumbled through years of stagnating or declining value.
• 10: The percentage of market capitaliza-tion that constituted a sufficiently large bet. Companies need to bet big to over-come the drag of the old way of doing things and reach the critical mass that will enable the business to flourish in the new regime. Those that do not make bets of this magnitude or more are likely to fail.
• 20: The rough percentage (generally from 10% to 20%) of revenue that had to be generated by the new business model to overcome internal resistance and signal to investors that the change was significant and successful. Internal organizations will conspire against half-hearted transitions, and investors are unlikely to recognize or reward companies that do not identify a credible path to move a fifth of their business or more into the new paradigm.

The Boston Consulting Group | 11
• 5: There were five components to a successful response. The key for successful companies was that they almost always employed a coordinated agenda consisting of all five elements.
• 14: Doing all five things together delivered value—to be precise, an average of 14 ad- ditional percentage points of annual TSR if all five components of the transition agenda were successfully employed. Note that this was 14 points more than their peers. The spread over nonsurvivors was, of course, much higher. (See Exhibit 3.)
…And High HurdlesTraditional companies start with lots of built-in hurdles. Incumbents are not used to rein-venting their business models; after years of industry stability, their managerial skills and talent are generally honed toward methodical and incremental improvements within the ex-isting paradigm. Furthermore, longstanding beliefs about how the world works can blind these companies to challenges from insur-gents. Because established organizations are often hardwired to deny the need for disrup-tive change, they resist business models that upset the status quo. In addition, economic models based on scale positions or competi-tive capabilities usually convey substantial advantage—until they no longer do, and then they often actually work against a company’s
ability to transform. It’s a tough combination for management to overcome.
Even when companies recognize the need for change and take action, they’re likely to fall into one or more traps. Most often, they fail to understand the full scope of the changes necessary or the implications for their value chains and business models. Poor timing, act-ing half-heartedly, or waiting too long before they move decisively are also common pit-falls. While there are cases of companies moving overly aggressively toward a new re-gime before it’s taken shape, the more com-mon cause of failure is reacting too slowly or incompletely. Companies experiment without feeling the pressure to scale up. They adopt new technologies without evolving the busi-ness model. Or they make a single big bet without taking the time to fully understand how existing assets can be valuable in the endgame.
The initial response of newspaper and maga-zine publishers to the digital disruption of print media is an example. It took years of losing readers and, more critically, advertis-ers, before many companies responded effec-tively to the fundamental attack on their long-standing business models. The imaging industry is another example: remember Pola-roid and Kodak? Most of the failures follow a well-documented pattern: denial, derisking, and decline. Even technology has not been
14
7
3
0 5 10 15Average increase over average
TSR (pps)
Companies that successfullyexecuted all of the
transition components
Companies that successfullyexecuted most of thetransition components
Companies that successfullyexecuted some of thetransition components
Source: BCG analysis.Note: The following are companies that executed transition components. All components: Qantas,
Bristol-Myers Squibb, Netflix, Nvidia, Samsung, Domino’s Pizza, and Apple. Most of the components: Adobe, VF, Microsoft, Monsanto, and Gannett. Some components: IBM, Charles Schwab, and Best Buy.
Exhibit 3 | Comprehensive Execution of Five Key Transition Components Led to Greater Performance

12 | Disruption and Reinvention in Value Creation
immune: Wang Laboratories, Digital Equip-ment, and Gateway, among other major inno-vators, are no more.
How Thrivers Create ValueLess well documented are the thrivers: the one-third of companies that navigated an in-dustry inflection to remain—or become—leaders in the new regime. Situations and ac-tions differed enormously, but, in general, thrivers did five things well.
Bigger bets ensure that the “new way” has enough heft to command respect.
They engaged the threat. Thrivers under-stood the threat of disruption and its poten-tial effects on their business models early, took preemptive steps to prepare—and disrupted on their own. For example, as airline deregulation took hold in Australia in the late 1990s, giving rise to low-cost carriers (LCCs) with significant operating and cost advantages, legacy carrier Qantas moved to start its own LCC, Jetstar Airways, while its major prederegulation competitor collapsed. This involved building an entirely new organization on the basis of very different operating principles and processes. Success was far from certain: the history of the global airline industry since deregulation is littered with bankrupt legacy carriers and failed LCCs. In fiscal year 2016, Jetstar had revenue of A$3.6 billion and generated earnings before interest and taxes of A$452 million—almost 25% of Qantas’s total.
Similarly, when Adobe saw the transforma-tional potential of cloud-based services, such as software as a service, the company moved aggressively to a subscription-based product, revamping its engineering organization to function around one-month product cycles. Today, cloud-based products make up 85% of Adobe’s revenue, compared with 15% in 2012, and revenue is up by 33% by capturing share from those that did not make the transition as aggressively. Adobe’s shares have far out-
performed its software industry peers, many of which have been slower to embrace the cloud.
They bet decisively (and they got the timing right). The magnitude of the response mat-ters. When thrivers took action, they made investments equivalent to at least 10% of the company’s market cap, in the form of M&A or the capitalized value of internal invest-ments, such as R&D. Bigger bets are certainly riskier, but in the face of disruption, such bets provide two distinct benefits. First, they ensure that the “new way” has enough heft to command organizational respect. Second, they signal to capital markets that the compa-ny has momentum and that a significant and growing portion of their business is benefit-ing, rather than suffering, from the disrup-tion. BCG research has found material increases in the multiples awarded compa-nies that act decisively, compared with those that do not.
Consider Monsanto, for example. When big jumps in oil prices in the early 1980s disrupt-ed the company’s large chemicals businesses, it changed direction. It spent 3% to 5% of its revenue annually through the decade on the R&D of genetically modified organisms—which it paid for by spinning off legacy busi-nesses. Despite a tumultuous period in the 1990s, Monsanto emerged as an agricultural powerhouse with a genetic seed portfolio that helped the company more than triple its revenue in the first 15 years of this century.
They paid their way. Transformations take time and money, and investors are not known for their patience or charity. Companies that thrived found a way to fund their journey, either from substantive performance acceler-ation programs (which are often focused on cost) in the legacy business or through the disposal of assets that don’t fit the new world. In some cases, the magnitude of performance improvement and the clear skew of capital away from the core sent a clear and unmis-takable signal: the future is elsewhere, this business’s role now is to generate cash to fund the journey.
Facing increasing competitive intensity and changes in technology, Bristol-Myers Squibb

The Boston Consulting Group | 13
(BMS) set about transforming itself from a broad-based health care organization with an emphasis on pharmaceuticals into a high- margin biopharmaceutical leader focused on specialty drugs. It paid the way by shrinking to grow and executing a multibillion dollar productivity improvement initiative over a number of years. It also launched a targeted M&A strategy to acquire high-potential drugs.
One bet that paid off big was the $2.4 billion acquisition of Medarex in 2009. Two drugs developed at Medarex and acquired by BMS were among the first immuno- oncology drugs approved by the FDA, in 2011 and 2014, for use in treating certain cancers. The acquisi-tion was the start of an $8.3 billion bet on immuno-oncology. BMS’s market cap, which was $38 billion in 2007, increased 1.5 times, to $96 billion, at the end of 2016. (See “Bristol- Myers Squibb: Reshaping the Portfolio to Cre-ate Superior Shareholder Value,” BCG article, October 2016.)
Their top executives championed the new business. Thrivers all took decisive steps to protect and support the new business—and prevent the legacy organization from sabo-taging it—until the venture could reach maturity. They did this in one of two ways. Either the “new way” was personally champi-oned by the CEO, or the new business was kept independent from the legacy organiza-tion until sufficiently mature and successful. Under both approaches, strong leadership, well-designed incentives, and substantial top-down commitment were critical elements of success.
In 2011, the new CEO of Gannett—which, like many print media companies, had suffered major value erosion—launched a multifacet-ed transformation that has led to a four-fold increase in shareholder value as other pub-lishers have continued to struggle, been sold, or gone out of business. In addition to taking the steps described above, she invested in building an adjacent business, which led to splitting the company into two publicly trad-ed entities in 2015.
To help champion the changes and push the organization to pursue the transformation, she funded the building of an integrated digi-
tal capability at the corporate level and kept its budget isolated from the operating groups. She also personally approved the funding of key technology initiatives (such as a subscrip-tion paywall on the company’s websites and apps) to support the core business, sidestep-ping the usual financial analysis and approval process and accelerating execution by months.
They brought investors along for the ride. Investors that own stable businesses with predictable earnings typically value the large cash flows that such companies generate. And these investors often don’t appreciate the need for transformation—and the investment that accompanies such change—until the disruptive threat is affecting performance. Then they sell and move on, and the compa-ny’s valuation suffers the consequences.
Thrivers disrupted the company without disrupting the stock.
Thrivers solved this problem by continuing to provide stable earnings and increasing pay-outs while delivering a transformed business model. They disrupted the company without disrupting the stock. They also used highly transparent investor communications to clearly articulate the transformation plan and lay out the milestones that management must meet. They reported regularly on prog-ress. Some companies actively segmented their investor base and created outreach pro-grams to cultivate support from influential and vocal members of the financial commu-nity while they managed key existing and tar-get investors one-on-one.
Best Buy, which managed a wrenching trans-formation during the meltdown of the con-sumer electronics retail segment, kept inves-tors on board by talking the talk and walking the walk. The company aggressively commu-nicated revenue and customer retention strat-egies that included turning the “showroom-ing” trend to its advantage, rolling out the “store within a store” model with major sup-

14 | Disruption and Reinvention in Value Creation
pliers, such as Apple and Samsung, and ex-panding into digital and online retailing.
Best Buy had a simple message of customer focus and service, putting it this way in its 2008 annual report: “The core of our story, as we look to the future, is based on the hypoth-esis that we live in an age when technology is producing transformative change, enabling people to accomplish more with their lives than could have been dreamed possible two or three decades ago. We believe that to real-ize the many potential benefits of these changes, our customers will need a friend who can help them enable their dreams of digital connectivity—and that we will be that friend, through the talents of our employees.” Best Buy increased its dividends per share every year from 2003 to 2016 and is one of the few consumer electronics retailers to survive the shift online that brought about the demise of Circuit City and Radio Shack, among others.
Putting All the Pieces TogetherManaging disruption is hard. The odds are stacked against a company, and it’s tough to succeed by taking half steps. Thriving through disruption requires an orchestration of five individually bold moves that must be execut-ed concurrently.
At Microsoft, for instance, former CEO Steve Ballmer and Satya Nadella, acting as senior vice president of R&D for online services and then executive vice president of the servers and tools business, laid a significant amount of the foundation; as CEO, Nadella built the house. Ballmer recognized the disruption to Microsoft’s long-standing and fabulously suc-cessful license- and desktop-based business model. And he did not underestimate the ex-tent of the threat. He bet boldly, moving away from the Wintel model that had been at the root of the company’s success almost since its inception. He articulated and drove a vision of shifting from a software-sales to a cloud-based business model. He pulled top engineering talent from the server business and created a separate unit to build Azure, Microsoft’s cloud platform. Similarly, he set in motion the process of transforming Microsoft Office from a software product to a cloud-based service.
As reported in its 2010 letter to shareholders, approximately 70% of Microsoft’s engineers and most of its $8.7 billion R&D budget at that time were dedicated to cloud-related products and services. Microsoft paid its way with aggressive cuts to its cost structure and in 2010 began steadily increasing its quarter-ly dividend.
When Nadella took over as CEO in early 2014, he pushed organizational alignment through the senior team and the sales force using goals that were simple to define and measure. He also communicated these efforts to investors. Perhaps the most ambitious of the targets was achieving an annual revenue run rate of $20 billion from cloud services by 2018. (When he set the target in 2015, Micro-soft’s cloud revenue was a little more than $6 billion; today, the goal is well within sight.)
Nadella also freed Office from Windows, made sure that Azure was reintegrated with the company’s servers and tools, and gave leaders carte blanche to grab from other areas of the business whatever resources were need-ed for success. He increased investment in in-frastructure ahead of the curve and added an-other big bet with the acquisition of LinkedIn. He continued to make sure that investors were aware of and understood the transfor-mation that was underway. Microsoft’s stock price has doubled since the end of 2013, out-performing the S&P 500 by almost a factor of two at a time when many legacy technology companies, slow to invest in cloud-based ser-vices and infrastructure, have seen their valu-ations lag by a factor of two or more.
The road to ruin is paved with past success; value creators blaze their own trail. To
thrive in the face of disruption, companies must understand the scope of the change. They must also articulate a clear vision for their role in the disrupted future, make bold bets, fund the journey, champion the venture, and man-age investors—and pull it all off in a carefully orchestrated program. It’s hard work. As the pace of change accelerates, more management teams will have to rise to the challenge.

The Boston Consulting Group | 15
The Boston Consulting Group has been tracking value creation among large-
cap companies on a global basis for 19 years. Not surprisingly, a cursory look back reveals substantial turnover among the top compa-nies each year. But a deeper look uncovers an elite group of consistent outperformers—companies that have delivered outstanding value creation over a sustained period of two full decades. These companies are not always at the top of our annual value creators rankings, but more often than not they are among the strongest performers. They significantly outpace the market, and they manage to resist the fade that ultimately drags most outperformers back to average. How they do so provides some valuable lessons for others seeking to deliver strong and sustainable results for their shareholders.
The 2017 RankingsFirst, the new news. Among the world’s 200 largest companies, the top ten value cre-ators for the five years from 2012 through 2016 delivered an impressive average annual TSR of 41%, with a range of 66% to 30%. (See Exhibit 4.) By way of comparison, the aver-age annual TSR for the next ten best compa-nies was a still impressive 29%. The overall average annual TSR for the approximately 2,350 companies in this year’s value creators database was 16%, well above the long-term average of about 10% for the S&P 500.
The top ten companies represent six indus-tries, with a concentration in technology, media, and telecommunications (TMT)—and Amazon, despite being listed as a retailer, also qualifies as a megacap technology player. The results are a departure from the previous two years, when pharma dominated the top ten, holding down four places each year. Nevertheless, although pharma is absent this year, it has not fallen far: three companies in the industry—Gilead Sciences, Allergan, and Celgene—rank in the top 20 (and as we shall see, they are consistent long-term value creators). As an industry, large-cap pharma (more than $18 billion in market cap) ranks only 17th this year (17% median TSR), while mid-cap pharma ($4 bil-lion to $17 billion) still ranks first. Other top-five sectors are consumer durables, automo-tive components, financial infrastructure providers, and medical technology. (See Exhibit 5.)
At the other end of the spectrum, with the exception of the mining industry (which had a median TSR of –5%), even industries near the bottom (such as communication service providers, oil, and metals), which have been buffeted by sector-specific economic head-winds, still managed to deliver solid, if un-spectacular, median annual TSRs of 6% to 11%. And a challenging industry context does not rule out superior value creation—the top-performing companies in most industries
HOW TOP VALUE CREATORS OUTPACE THE MARKET—FOR DECADES

16 | Disruption and Reinvention in Value Creation
rank well above average, or even in the top quartile, across the full sample.
Why TSR Is Important…People sometimes criticize TSR for being a time frame-dependent metric, and certainly a company’s TSR performance depends on the starting point and length of the period mea-sured. Bank of America, for example, was a top TSR performer for the most recent five years, with an annual return of 33%; howev-er, it had a –35% annual TSR from 2006 through 2011.
That said, TSR (especially relative TSR) is valuable, because it reflects shareholders’ true bottom line (the total return they receive from the moment they buy the stock). A new CEO, a shift in strategy, a big acquisition or
divestiture—all such changes signal a new phase in a company’s life and a reason to start a new TSR clock ticking. Using TSR as a performance measure lets companies set goals and reward managers for delivering ac-tual value, rather than focusing on relatively narrow measures that may be arbitrarily se-lected or even subject to manipulation, such as EPS growth or return on equity. TSR helps managers and boards balance short-term moves and longer-term vision. It takes some of the weight off quarterly EPS and enables companies to incentivize longer-term perfor-mance—from the shareholder’s point of view.
…and Difficult to SustainFive years is hardly a short time frame, and delivering value at the level that top-ten com-panies do over such a period is a consider-
Sources: S&P Global Market Intelligence; Thomson Reuters Eikon; Bloomberg; company disclosures; BCG Value Creators report 2017; BCG analysis. Note: n = the world’s 200 largest global companies by market value as of December 31, 2016. n/a = not applicable.1Location of corporate headquarters.2As of December 31, 2016.3The contribution of each factor to the average annual TSR is shown in percentage points. Because of rounding, the numbers may not add up to the TSR figure shown.4Change in EBITDA multiple. See also footnote 7.5Share change refers to the change in the number of shares outstanding, not to the change in share price.6As of June 30, 2017.7Because both Bank of America and Charles Schwab are treated as financial institutions, the TSR disaggregation for these companies reflects the approach used for the banking industry, in which equity growth replaces sales growth, ROE change replaces margin change, and the P/E multiple replaces the EBITDA multiple. Change in net debt is not shown.
Exhibit 4 | The Top Ten Large-Cap Value Creators, 2012–2016
TSR Disaggregation (percentage-point contributions)3
Profit growth Valuation Cash flow contribution
Company Location1 Industry
Market value
($billions)2
Average annual TSR (%)
= Sales growth + Margin
change + Multiple change4 + Dividend
yield + Share change5 +
Net debt
change
2017 TSR (%)6
1 Netflix United States Media and publishing 53.1 65.7 22 –22 70 0 –2 –3 20.7
2 NVIDIA United States Technology 57.5 52.6 9 6 39 2 3 –6 35.7
3 Tencent Holdings China Media and publishing 229.5 47.0 40 –3 12 1 –1 –1 43.1
4 Broadcom Singapore Technology 70.5 46.1 41 5 12 2 –9 –6 33.0
5 Charter Communications United States Communication
service providers 77.4 35.5 32 0 11 0 –19 11 17.0
6 ASML Netherlands Technology 48.6 34.2 4 0 26 7 –0 –3 8.0
7 Amazon United States Retail 356.3 34.1 23 24 –10 0 –1 –2 29.1
8 Bank of America7 United States Banking 223.3 32.9 3 20 9 1 0 n/a 10.5
9 KDDI Japan Communication service providers 62.3 31.7 6 4 13 3 1 5 2.0
10 Charles Schwab7 United States Asset management and brokerage 52.3 30.0 12 3 15 1 –1 n/a 9.3

The Boston Consulting Group | 17
able accomplishment. Last year, we looked at how hard it was to sustain the exceptional performance of a global top-ten company for more than a few consecutive rolling five-year periods. For example, just three of the com-panies in the 2017 top ten also made the 2016 list—KDDI, Netflix, and Tencent. Last year, five companies—KDDI, MasterCard, Netflix, Regeneron, and Visa—were newcom-ers; this year, of those five, only KDDI and Netflix remain in the top ten. (See Creating Value Through Active Portfolio Management: The 2016 Value Creators Report, BCG report, Octo-ber 2016.)
The likelihood of beating the market—espe-cially by a wide margin—year in and year out (or over consecutive measurement periods) is low. For companies in mature industries, the challenge is even greater because growth is such an important driver of long-term TSR. That said, companies in mature industries still can drive value creation by improving ef-ficiency, allocating capital prudently, and re-turning cash to shareholders rather than in-vesting it in low-return growth opportunities. At the other extreme, the primary value cre-
ation priority for high-growth companies is to “beat the fade.” High-growth companies must significantly outperform expectations, because capital markets look forward and continually capitalize expected future earn-ings into today’s stock price. As growth slows, which it almost inevitably does, falling ex-pectations usually lead to lower valuation multiples, and this in turn reduces TSR. As a result, top-performing companies tend to move slowly to average market performance over time.
Successful companies also understand that every strategy has a useful life. Over the long term, they regularly adapt their strategies and their value delivery models to evolving circumstances. Some rebuild expectations by investing in the next wave of high-return growth opportunities. Others pursue a growth-focused model in a young or fast-growing industry, but over time, they shift to a more balanced mix of growth, margin improvement, and rising cash payouts in order to reap higher rewards for sharehold-ers. In the right circumstances, investors will pay up for a cash-focused, high-dividend
99
60 58 55 58
113
78
47 4755 53
65
49 44 49
95
46
82
4555
72
5040 45 50
3626
47 44
2224 23 22 22 21 20 20 19 19 19 18 17 17 17 17 16 16 16 16 16 15 15 14 14 14 11 10 7 6–5
–21
1 –1 5 –3–12
–3–11
–4 –10–17 –14
–7–17
0–8 –10 –15
–53–39
–8 –7 –5–12 –12 –8 –12 –11 –11
–24
Average annual TSR, 2012–2016 (%)
High
Low
Median
Chem
ical
s
Min
ing
Cons
umer
non
dura
bles
Met
als
Med
ia a
nd p
ublis
hing
Mid
-cap
pha
rma
Com
mun
icat
ion
serv
ice
prov
ider
s
Fash
ion
and
luxu
ry
Auto
mot
ive
OEM
Tech
nolo
gy
Cons
truc
tion
Auto
mot
ive
com
pone
nts
Cons
umer
dur
able
s
Med
ical
tech
nolo
gy
Tran
spor
tatio
n an
d lo
gist
ics
Mac
hine
ry Oil
50
13
–5
Mul
tibus
ines
s
Build
ing
mat
eria
ls
Fore
st p
rodu
cts
and
pack
agin
g
Bank
ingIn
sura
nce
Reta
il
Aero
spac
e an
d de
fens
e
Hea
lth c
are
serv
ices
Fina
ncia
l inf
rast
ruct
ure
prov
ider
s
Real
est
ate
Larg
e-ca
p ph
arm
a
Serv
ices
Gre
en e
nerg
y an
d en
viro
nmen
t
Pow
er a
nd g
as u
tiliti
es
19
82
–1
Ass
et m
anag
emen
t and
bro
kera
ge58
19
–18
Trav
el a
nd to
uris
m
Sources: S&P Global Market Intelligence; Thomson Reuters Eikon; Bloomberg; company disclosures; BCG Value Creators report 2017; BCG analysis.Note: n = 2,346.
Exhibit 5 | How Value Creation Compares Across Industries

18 | Disruption and Reinvention in Value Creation
model or a turnaround story that emphasizes improving margins. Senior management and boards of directors must regularly review and challenge current strategies and underlying assumptions regarding such issues as the market and the company’s competitive position, financial resources, and human capital.
Tales of 20-Year TSRFrom 1997 through 2016, nine companies that rank among the largest 200 have been top-quartile value creators in at least three of the four five-year periods. They top the con-sistent value creators list for the past two dec-ades by generating average annual TSR of 16% to 32% over 20 years. (See Exhibit 6.)
These are extraordinary levels of sustained value creation. Over 20 years, a 16% annual TSR results in a twenty-fold increase in abso-lute value, and a 33% annual TSR results in a three-hundred-fold increase in value.
The small number of consistent value cre-ation champions is not surprising; it’s close to what a statistical analysis of outperformers
versus underperformers would suggest. More interesting are the questions of where these nine companies come from and how they built their track records. Two are pharma companies, two are tech firms, and two are tobacco companies. One comes from media and publishing, and one from health care. Amazon straddles tech and retail. Seven are based in the US, one in the Netherlands, and one in South Africa.
What are these companies doing? Which val-ue delivery models do they follow? Three (Gilead, Celgene, and Amazon) are high-growth stories, with 20-year annual revenue growth rates of 52%, 41%, and 43%, respec-tively. The two pharma firms have ridden blockbuster-producing R&D programs to diz-zying heights, and along the way they have also used M&A strategically to reinforce their innovation efforts. They have managed to outperform even the outsized expectations that fairly consistently become priced into such companies’ stocks. (See “Innovation in 2015,” BCG article, December 2015, and “Bristol-Myers Squibb: Reshaping the Portfo-lio to Create Superior Shareholder Value,” BCG article, October 2016.)
Sources: S&P Global Market Intelligence; Thomson Reuters Eikon; Bloomberg; company disclosures; BCG Value Creators report 2017; BCG analysis.Note: List includes all large-cap companies that were top-quartile value creators in at least three of the past four five-year periods (1997–2001, 2002–2006, 2007–2011, 2012–2016).1In $billions as of December 31, 2016.2Average annual TSR from December 31, 1997 to December 31, 2016.3Number of times the company was ranked in the top quartile of the large-cap sample in the past four five-year periods (1997–2001, 2002–2006, 2007–2011, 2012–2016).4Amazon is classified as “retail,” consistent with previous Value Creators reports. Given Amazon’s portfolio, however, the company may be classified as “technology” in other publications.5TSR since IPO (Amazon and Reynolds were publicly listed for only part of the 20-year period).
Exhibit 6 | Consistent, Long-Term Large-Cap Value Creators
COMPANY MARKET CAP1 INDUSTRY COUNTRY 20-YEAR TSR2 5-YEAR TOP QUARTILES3
Celgene 89.7 Pharma United States 32% 3
Gilead Sciences 94.3 Pharma United States 26% 3
ASML 48.6 Technology Netherlands 19% 3
UnitedHealth Group 152.3 Health care services United States 19% 3
Adobe Systems 51.2 Technology United States 17% 3
Altria Group 131.9 Consumer nondurables United States 17% 3
Naspers 63.3 Media and publishing South Africa 16% 3
Amazon 356.3 Retail4 United States 33%5 3
Reynolds American 79.9 Consumer nondurables United States 22%5 3

The Boston Consulting Group | 19
Amazon generated its growth by fundamen-tally and continually disrupting one of the economy’s biggest sectors—retail—and championing the development of an entirely new, high-growth industry: cloud computing. Like the two pharma firms, Amazon has for a long time met or exceeded high expectations and rebuilt expectations that it can continue its rapid growth and thereby maintain a high multiple.
Two other top companies—Altria and Reyn-olds American—have taken a very different approach: they have hardly grown at all. Both are in the tobacco industry, which has long been in decline. But they have managed to beat expectations and expand margins (large-ly by raising prices), and they have consistent-ly returned cash to shareholders through gen-erous dividend yields.
Between these two extremes of high growth and no growth are several companies that have pulled multiple TSR levers over time. For the first decade or so of our time frame, ASML rode a steep growth curve. Then, as the semiconductor market changed and growth slowed, the company adjusted its capital allo-cation strategy to return more of its cash flows to shareholders, increasing its dividend
yield to 7% over the most recent five years. Similarly, Adobe, Naspers, and UnitedHealth Group have managed slowing growth, uncer-tain market conditions, and investor expecta-tions. All of these companies have achieved strong TSR and—in recent years—expanded multiples as they have repositioned them-selves for the future.
For consistent value creators, the strong tailwinds of a growth industry help, to be
sure. But far more important is management’s understanding of different value delivery models, its willingness to adapt its strategy and capital allocation to meet evolving condi-tions, and its ability to balance short-term tar-gets and longer-term TSR goals. (See “The Art of Capital Allocation,” BCG article, March 2017.) Regardless of time frame, top perform-ers set their sights on winning in their indus-try or peer group—and they deliver.
There are plenty of ways to create value in both the near term and the long term. Top performers are adept at selecting the most ef-fective ones for responding to the conditions they face.

20 | Disruption and Reinvention in Value Creation
APPENDIXTHE 2017 VALUE CREATORS RANKINGS
Since 1999, BCG has published annual rank-ings of top value creators based on total shareholder return over the previous five-year period. The 2017 rankings reflect our analysis of TSR at approximately 2,350 com-panies worldwide from 2012 through 2016.
To arrive at this sample, we began with TSR data provided by S&P Capital IQ—data that covers nearly 45,000 companies. We eliminat-ed all companies that either were not listed on a world stock exchange for the full five years of our study or did not trade at least 25% of their shares in public capital markets. We further refined the sample by organizing the remaining companies into 32 industry groups and by establishing an appropriate market- valuation hurdle to eliminate the smallest companies in each industry. (We identify the size of the market-valuation hur-dle for each industry in the tables under “In-dustry.”) For our global large-cap top-ten ranking, we focused on the 200 largest com-panies by market valuation.
We base the global and industry rankings on five-year TSR performance from 2012 through 2016.1 We also show TSR performance from
January 1 through June 30, 2017. In addition, for all but three of the industry rankings, we break down TSR performance into the six investor- oriented financial metrics used in the BCG TSR disaggregation model: sales growth, margin change, multiple change, divi-dend yield, change in the number of shares outstanding, and change in net debt. For three industries—asset management and bro-kerage, banking, and insurance—we use a slightly different approach to TSR disaggrega-tion because of the special analytical prob-lems involved in measuring value creation in those sectors.
Note1. TSR is a dynamic ratio that includes price gains and dividend payments for a specific stock during a given period. To measure performance from 2012 through 2016, we use 2011 end-of-year data as a starting point in order to capture the change from 2011 to 2012, which determines 2012 TSR.

The Boston Consulting Group | 21
Sources: S&P Global Market Intelligence; Thomson Reuters Eikon; Bloomberg; company disclosures; BCG Value Creators report 2017; BCG analysis. Note: n = the world’s 200 largest global companies by market value as of December 31, 2016. n/a = not applicable.1Location of corporate headquarters.2As of December 31, 2016.3The contribution of each factor to the average annual TSR is shown in percentage points. Because of rounding, the numbers may not add up to the TSR figure shown.4Change in EBITDA multiple. See also footnote 7.5Share change refers to the change in the number of shares outstanding, not to the change in share price.6As of June 30, 2017.7Because both Bank of America and Charles Schwab are treated as financial institutions, the TSR disaggregation for these companies reflects the approach used for the banking industry, in which equity growth replaces sales growth, ROE change replaces margin change, and the P/E multiple replaces the EBITDA multiple. Change in net debt is not shown.
Large-Cap Top Ten, 2012–2016
TSR Disaggregation (percentage-point contributions)3
Profit growth Valuation Cash flow contribution
Company Location1 Industry
Market value
($billions)2
Average annual TSR (%)
= Sales growth + Margin
change + Multiple change4 + Dividend
yield + Share change5 +
Net debt
change
2017 TSR (%)6
1 Netflix United States Media and publishing 53.1 65.7 22 –22 70 0 –2 –3 20.7
2 NVIDIA United States Technology 57.5 52.6 9 6 39 2 3 –6 35.7
3 Tencent Holdings China Media and publishing 229.5 47.0 40 –3 12 1 –1 –1 43.1
4 Broadcom Singapore Technology 70.5 46.1 41 5 12 2 –9 –6 33.0
5 Charter Communications United States Communication
service providers 77.4 35.5 32 0 11 0 –19 11 17.0
6 ASML Netherlands Technology 48.6 34.2 4 0 26 7 –0 –3 8.0
7 Amazon United States Retail 356.3 34.1 23 24 –10 0 –1 –2 29.1
8 Bank of America7 United States Banking 223.3 32.9 3 20 9 1 0 n/a 10.5
9 KDDI Japan Communication service providers 62.3 31.7 6 4 13 3 1 5 2.0
10 Charles Schwab7 United States Asset management and brokerage 52.3 30.0 12 3 15 1 –1 n/a 9.3
GLOBALLARGE-CAP COMPANIES

22 | Disruption and Reinvention in Value Creation
Aerospace and Defense Top Ten, 2012–2016
Asset Management and Brokerage Top Ten, 2012–2016
INDUSTRYAEROSPACE AND DEFENSE
ASSET MANAGEMENT AND BROKERAGE
Sources: S&P Global Market Intelligence; Thomson Reuters Eikon; Bloomberg; company disclosures; BCG Value Creators report 2017; BCG analysis.Note: n = 66 global companies with a market valuation greater than $1 billion as of December 31, 2016. n/m = not measurable.1Location of corporate headquarters.2As of December 31, 2016.3The contribution of each factor to the average annual TSR is shown in percentage points. Because of rounding, the numbers may not add up to the TSR figure shown.4Change in EBITDA multiple.5Share change refers to the change in the number of shares outstanding, not to the change in share price.6As of June 30, 2017.
Sources: S&P Global Market Intelligence; Thomson Reuters Eikon; Bloomberg; company disclosures; BCG Value Creators report 2017; BCG analysis.Note: n = 81 global companies with a market valuation greater than $2.0 billion as of December 31, 2016. n/m = not measurable.1Location of corporate headquarters.2As of December 31, 2016.3The contribution of each factor to the average annual TSR is shown in percentage points. Because of rounding, the numbers may not add up to the TSR figure shown.4Change in P/E multiple.5Share change refers to the change in the number of shares outstanding, not to the change in share price.6As of June 30, 2017.
TSR Disaggregation (percentage-point contributions)3
Profit growth Valuation Cash flow contribution
Company Location1
Market value
($billions)2
Average annual TSR (%)
= Sales growth + Margin
change + Multiple change4 + Dividend
yield + Share change5 +
Net debt
change
2017 TSR (%)6
1 Huntington Ingalls Industries United States 8.5 43.9 1 11 16 1 1 13 1.7
2 Axon (formerly TASER Intl.) United States 1.3 36.5 24 38 –26 0 1 –1 3.7
3 Leonardo Italy 8.1 36.1 –7 n/m n/m 0 0 25 10.1
4 Northrop Grumman United States 41.0 35.0 –1 1 25 3 8 –0 11.2
5 Thales France 20.5 33.5 3 4 21 3 –1 4 3.5
6 TransDigm Group United States 13.3 32.9 20 –1 5 12 –1 –2 8.0
7 Lockheed Martin United States 73.2 29.9 0 6 14 5 2 4 12.6
8 Orbital ATK United States 5.1 28.6 –1 0 22 2 –11 16 12.8
9 Aerojet Rocketdyne United States 1.3 27.5 14 5 6 0 –3 6 15.9
10 Raytheon United States 41.7 27.5 –1 3 16 3 3 3 14.3
TSR Disaggregation (percentage-point contributions)3
Profit growth Valuation Cash flow contribution
Company Location1
Market value
($billions)2
Average annual TSR (%)
= Equity growth + ROE
change + Multiple change4 + Dividend
yield + Share change5
2017 TSR (%)6
1 Magellan Financial Group Australia 3.0 81.9 25 56 –2 5 –2 23.3
2 BT Investment Management Australia 2.0 49.1 8 38 –2 7 –2 8.8
3 Dubai Investments United Arab Emirates 2.6 41.0 6 44 –15 6 0 –3.8
4 3i Group United Kingdom 8.3 36.7 17 n/m n/m 6 –0 30.9
5 Anxin Trust China 7.0 35.9 92 –23 –24 2 –11 27.8
6 E*TRADE Financial United States 9.5 34.2 4 26 4 0 1 9.8
7 Intermediate Capital Group United Kingdom 2.4 32.4 –4 7 14 14 2 21.6
8 Banca Generali Italy 2.8 32.3 20 –4 10 7 –1 19.5
9 Investment AB Latour Sweden 5.6 30.2 13 –1 15 4 –0 25.9
10 Charles Schwab United States 52.3 30.0 12 3 15 1 –1 9.3

The Boston Consulting Group | 23
Automotive Components Top Ten, 2012–2016
Automotive OEM Top Ten, 2012–2016
AUTOMOTIVE COMPONENTS
AUTOMOTIVE OEM
Sources: S&P Global Market Intelligence; Thomson Reuters Eikon; Bloomberg; company disclosures; BCG Value Creators report 2017; BCG analysis.Note: n = 52 global companies with a market valuation greater than $2.0 billion as of December 31, 2016.1Location of corporate headquarters.2As of December 31, 2016.3The contribution of each factor to the average annual TSR is shown in percentage points. Because of rounding, the numbers may not add up to the TSR figure shown.4Change in EBITDA multiple.5Share change refers to the change in the number of shares outstanding, not to the change in share price.6As of June 30, 2017.
Sources: S&P Global Market Intelligence; Thomson Reuters Eikon; Bloomberg; company disclosures; BCG Value Creators report 2017; BCG analysis.Note: n = 38 global companies with a market valuation greater than $2.0 billion as of December 31, 2016. n/m = not measurable.1Location of corporate headquarters.2As of December 31, 2016.3The contribution of each factor to the average annual TSR is shown in percentage points. Because of rounding, the numbers may not add up to the TSR figure shown.4Change in EBITDA multiple.5Share change refers to the change in the number of shares outstanding, not to the change in share price.6As of June 30, 2017.
TSR Disaggregation (percentage-point contributions)3
Profit growth Valuation Cash flow contribution
Company Location1
Market value
($billions)2
Average annual TSR (%)
= Sales growth + Margin
change + Multiple change4 + Dividend
yield + Share change5 +
Net debt
change
2017 TSR (%)6
1 Brembo Italy 3.9 58.0 13 12 18 4 0 11 13.0
2 Motherson Sumi Systems India 6.7 53.4 32 9 8 1 –1 5 41.2
3 MRF India 3.0 47.8 7 22 7 0 0 11 40.1
4 Plastic Omnium France 4.7 45.6 7 4 22 3 –0 10 6.7
5 Koito Manufacturing Japan 8.5 43.6 15 6 17 2 0 4 –6.1
6 Valeo France 13.6 43.5 9 3 21 4 –0 8 10.2
7 Calsonic Kansei (acquired by KKR) Japan 4.0 34.4 6 5 13 2 0 8 Delisted
8 Linamar Canada 2.8 33.9 16 10 2 1 –0 5 11.2
9 Minth Group China 3.5 33.4 19 2 19 4 –1 –10 35.7
10 Continental Germany 38.8 33.3 6 2 13 2 0 10 5.2
TSR Disaggregation (percentage-point contributions)3
Profit growth Valuation Cash flow contribution
Company Location1
Market value
($billions)2
Average annual TSR (%)
= Sales growth + Margin
change + Multiple change4 + Dividend
yield + Share change5 +
Net debt
change
2017 TSR (%)6
1 Eicher Motors India 8.7 72.4 21 16 39 1 –0 –4 23.8
2 Subaru (formerly Fuji Heavy Ind.) Japan 31.3 62.9 18 23 6 4 0 13 –19.3
3 Tesla United States 34.4 49.6 103 n/m n/m 0 –8 –3 69.2
4 Maruti Suzuki India India 23.7 42.9 9 12 23 1 –1 –2 35.6
5 Geely Automobile Holdings Hong Kong 8.5 38.4 21 3 7 1 –3 9 122.3
6 Chongqing Changan Automobile China 9.7 37.7 24 n/m n/m 3 0 4 –3.1
7 Fiat Chrysler Automobiles United Kingdom 14.0 29.8 13 1 –13 10 –4 22 6.5
8 Renault France 26.2 29.6 4 9 6 4 –2 9 –2.5
9 Toyota Motor Japan 173.8 25.1 9 15 –8 3 1 5 –12.8
10 Mazda Motor Japan 9.8 23.8 10 46 –49 1 –10 26 –16.9

24 | Disruption and Reinvention in Value Creation
Banking Top Ten, 2012–2016
Building Materials Top Ten, 2012–2016
BANKING
BUILDING MATERIALS
Sources: S&P Global Market Intelligence; Thomson Reuters Eikon; Bloomberg; company disclosures; BCG Value Creators report 2017; BCG analysis.Note: n = 131 global companies with a market valuation greater than $10.0 billion as of December 31, 2016. n/m = not measurable.1Location of corporate headquarters.2As of December 31, 2016.3The contribution of each factor to the average annual TSR is shown in percentage points. Because of rounding, the numbers may not add up to the TSR figure shown.4Change in P/E multiple.5Share change refers to the change in the number of shares outstanding, not to the change in share price.6As of June 30, 2017.
Sources: S&P Global Market Intelligence; Thomson Reuters Eikon; Bloomberg; company disclosures; BCG Value Creators report 2017; BCG analysis.Note: n = 70 global companies with a market valuation greater than $1.5 billion as of December 31, 2016.1Location of corporate headquarters.2As of December 31, 2016.3The contribution of each factor to the average annual TSR is shown in percentage points. Because of rounding, the numbers may not add up to the TSR figure shown.4Change in EBITDA multiple.5Share change refers to the change in the number of shares outstanding, not to the change in share price.6As of June 30, 2017.
TSR Disaggregation (percentage-point contributions)3
Profit growth Valuation Cash flow contribution
Company Location1
Market value
($billions)2
Average annual TSR (%)
= Sales growth + Margin
change + Multiple change4 + Dividend
yield + Share change5 +
Net debt
change
2017 TSR (%)6
1 Bestway Cement Pakistan 1.5 112.7 21 11 34 12 –0 35 –18.9
2 Lucky Cement Pakistan 2.7 67.5 24 2 31 4 0 6 –3.5
3 Dalmia Bharat India 1.8 64.4 26 –1 23 1 –2 16 81.9
4 Headwaters (acq. by Boral Ind.) United States 1.8 60.3 11 2 24 0 –4 27 Delisted
5 Shree Cement India 7.6 47.3 16 –1 28 1 0 4 15.8
6 Trex United States 2.0 41.2 12 30 –5 0 –0 5 5.1
7 Ramco Cements India 1.9 41.0 7 5 15 1 –0 13 26.8
8 Sanwa Holdings Japan 2.2 40.4 8 17 –2 3 1 12 7.5
9 Lennox International United States 6.6 37.1 2 15 11 2 4 3 20.2
10 Apogee Enterprises United States 1.5 36.1 11 35 –11 2 –0 0 6.7
TSR Disaggregation (percentage-point contributions)3
Profit growth Valuation Cash flow contribution
Company Location1
Market value
($billions)2
Average annual TSR (%)
= Equity growth + ROE
change + Multiple change4 + Dividend
yield + Share change5
2017 TSR (%)6
1 KBC Group Belgium 26.0 45.2 1 n/m n/m 2 –4 14.9
2 Macquarie Group Australia 20.2 36.7 7 13 8 9 1 4.8
3 Natixis France 17.7 33.3 –1 1 23 11 –0 15.9
4 Bank of America United States 223.3 32.9 3 20 9 1 0 10.5
5 Emirates NBD Bank UAE 12.8 30.1 9 13 2 6 0 0.5
6 Regions Financial United States 17.7 29.4 4 35 –12 2 0 2.9
7 Daiwa Securities Group Japan 10.4 28.9 11 n/m n/m 4 –0 –5.8
8 SunTrust Banks United States 26.9 27.5 3 22 –1 2 2 4.4
9 Kotak Mahindra Bank India 19.5 27.3 27 –3 7 0 –4 32.9
10 Nomura Holdings Japan 20.9 27.1 6 n/m n/m 3 1 –0.7

The Boston Consulting Group | 25
Chemicals Top Ten, 2012–2016
Communication Service Providers Top Ten, 2012–2016
CHEMICALS
COMMUNICATION SERVICE PROVIDERS
Sources: S&P Global Market Intelligence; Thomson Reuters Eikon; Bloomberg; company disclosures; BCG Value Creators report 2017; BCG analysis.Note: n = 56 global companies with a market valuation greater than $7.5 billion as of December 31, 2016.1Location of corporate headquarters.2As of December 31, 2016.3The contribution of each factor to the average annual TSR is shown in percentage points. Because of rounding, the numbers may not add up to the TSR figure shown.4Change in EBITDA multiple.5Share change refers to the change in the number of shares outstanding, not to the change in share price.6As of June 30, 2017.
Sources: S&P Global Market Intelligence; Thomson Reuters Eikon; Bloomberg; company disclosures; BCG Value Creators report 2017; BCG analysis.Note: n = 55 global companies with a market valuation greater than $7.5 billion as of December 31, 2016.1Location of corporate headquarters.2As of December 31, 2016.3The contribution of each factor to the average annual TSR is shown in percentage points. Because of rounding, the numbers may not add up to the TSR figure shown.4Change in EBITDA multiple.5Share change refers to the change in the number of shares outstanding, not to the change in share price.6As of June 30, 2017.
TSR Disaggregation (percentage-point contributions)3
Profit growth Valuation Cash flow contribution
Company Location1
Market value
($billions)2
Average annual TSR (%)
= Sales growth + Margin
change + Multiple change4 + Dividend
yield + Share change5 +
Net debt
change
2017 TSR (%)6
1 Nippon Paint Japan 8.7 45.1 22 20 –0 2 –4 5 33.4
2 EMS-Chemie Switzerland 11.9 30.5 3 9 16 4 –0 –1 36.6
3 Lonza Group Switzerland 9.0 29.7 9 0 6 4 0 11 28.6
4 Nitto Denko Japan 12.5 29.3 4 –0 25 3 0 –2 3.9
5 Asian Paints India 12.6 29.2 12 4 11 1 0 0 24.6
6 Braskem Brazil 7.8 27.7 8 11 2 6 –1 3 –0.1
7 LyondellBasell Industries United Kingdom 35.0 27.0 –11 14 11 6 7 –0 0.4
8 Sekisui Chemical Japan 7.6 26.8 2 6 9 3 2 5 9.0
9 Sherwin-Williams United States 25.0 26.1 6 9 6 1 2 1 31.3
10 Symrise Germany 7.9 25.2 13 1 10 2 –2 1 8.7
TSR Disaggregation (percentage-point contributions)3
Profit growth Valuation Cash flow contribution
Company Location1
Market value
($billions)2
Average annual TSR (%)
= Sales growth + Margin
change + Multiple change4 + Dividend
yield + Share change5 +
Net debt
change
2017 TSR (%)6
1 Charter Communications United States 77.4 35.5 32 0 11 0 –19 11 17.0
2 KDDI Japan 62.3 31.7 6 4 13 3 1 5 2.0
3 SoftBank Group Japan 65.8 29.2 23 –3 15 1 2 –9 17.5
4 PT Telekomunikasi Indonesia Indonesia 29.3 27.9 10 –1 12 5 –0 2 16.7
5 Level 3 Communications United States 20.3 27.1 14 12 –5 0 –10 17 5.2
6 Comcast United States 165.2 26.0 8 –0 8 2 3 6 13.2
7 Emirates Telecommunications (Etisalat) UAE 44.5 25.0 10 3 7 7 –0 –2 –5.9
8 Emirates Integrated Telecommunications UAE 7.7 24.6 8 6 2 8 0 1 –10.7
9 Nippon Telegraph and Telephone Japan 85.7 23.8 2 –1 10 4 2 7 9.4
10 Saudi Telecom Saudi Arabia 38.6 23.0 –1 –1 9 6 0 9 9.3

26 | Disruption and Reinvention in Value Creation
Construction Top Ten, 2012–2016
Consumer Durables Top Ten, 2012–2016
CONSTRUCTION
CONSUMER DURABLES
Sources: S&P Global Market Intelligence; Thomson Reuters Eikon; Bloomberg; company disclosures; BCG Value Creators report 2017; BCG analysis.Note: n = 91 global companies with a market valuation greater than $1.5 billion as of December 31, 2016.1Location of corporate headquarters.2As of December 31, 2016.3The contribution of each factor to the average annual TSR is shown in percentage points. Because of rounding, the numbers may not add up to the TSR figure shown.4Change in EBITDA multiple.5Share change refers to the change in the number of shares outstanding, not to the change in share price.6As of June 30, 2017.
Sources: S&P Global Market Intelligence; Thomson Reuters Eikon; Bloomberg; company disclosures; BCG Value Creators report 2017; BCG analysis.Note: n = 59 global companies with a market valuation greater than $2.0 billion as of December 31, 2016.1Location of corporate headquarters.2As of December 31, 2016.3The contribution of each factor to the average annual TSR is shown in percentage points. Because of rounding, the numbers may not add up to the TSR figure shown.4Change in EBITDA multiple.5Share change refers to the change in the number of shares outstanding, not to the change in share price.6As of June 30, 2017.
TSR Disaggregation (percentage-point contributions)3
Profit growth Valuation Cash flow contribution
Company Location1
Market value
($billions)2
Average annual TSR (%)
= Sales growth + Margin
change + Multiple change4 + Dividend
yield + Share change5 +
Net debt
change
2017 TSR (%)6
1 Pembangunan Perumahan Indonesia 1.8 54.6 21 11 21 4 –5 2 –16.4
2 Kyudenko Japan 1.9 49.1 5 27 –1 3 1 14 29.8
3 Norinco International China 2.0 38.9 27 –8 33 1 –6 –7 –12.3
4 AF Gruppen Norway 1.7 38.1 10 14 10 10 –4 –2 0.2
5 HASEKO Japan 3.1 36.8 10 20 –15 1 0 21 17.5
6 Taisei Japan 8.0 35.6 3 28 –22 2 –0 24 27.3
7 Wijaya Karya Indonesia 1.6 34.5 15 8 19 3 –8 –3 –5.0
8 Eiffage France 6.5 32.9 1 3 1 4 –2 27 22.4
9 Sweco Sweden 2.4 31.3 23 –1 12 6 –5 –2 17.9
10 Maeda Japan 1.5 31.2 8 20 –19 2 –0 20 23.0
TSR Disaggregation (percentage-point contributions)3
Profit growth Valuation Cash flow contribution
Company Location1
Market value
($billions)2
Average annual TSR (%)
= Sales growth + Margin
change + Multiple change4 + Dividend
yield + Share change5 +
Net debt
change
2017 TSR (%)6
1 Hanssem South Korea 3.0 59.9 22 5 31 2 1 –2 –7.5
2 TVS Motor India 2.5 50.5 12 3 26 3 0 6 52.8
3 Hangzhou Robam Appliances China 3.9 46.5 30 16 2 1 –0 –3 54.2
4 Man Wah Holdings Hong Kong 2.6 41.7 13 23 1 7 –0 –2 33.5
5 Suofeiya Home Collection China 3.6 41.0 35 8 2 2 –2 –4 52.1
6 Yamaha Japan 5.7 40.5 3 23 8 2 1 4 9.6
7 Shimano Japan 14.6 38.8 8 6 26 1 0 –2 –3.1
8 De’Longhi Italy 3.6 34.3 0 5 22 7 0 –0 25.2
9 Whirlpool United States 13.7 33.6 2 6 17 3 0 5 6.6
10 Thor Industries United States 5.3 33.5 13 11 8 4 1 –4 5.2

The Boston Consulting Group | 27
Consumer Nondurables Top Ten, 2012–2016
Fashion and Luxury Top Ten, 2012–2016
CONSUMER NONDURABLES
FASHION AND LUXURY
Sources: S&P Global Market Intelligence; Thomson Reuters Eikon; Bloomberg; company disclosures; BCG Value Creators report 2017; BCG analysis.Note: n = 83 global companies with a market valuation greater than $7.5 billion as of December 31, 2016.1Location of corporate headquarters.2As of December 31, 2016.3The contribution of each factor to the average annual TSR is shown in percentage points. Because of rounding, the numbers may not add up to the TSR figure shown.4Change in EBITDA multiple.5Share change refers to the change in the number of shares outstanding, not to the change in share price.6As of June 30, 2017.
Sources: S&P Global Market Intelligence; Thomson Reuters Eikon; Bloomberg; company disclosures; BCG Value Creators report 2017; BCG analysis.Note: n = 38 global companies with a market valuation greater than $4.5 billion as of December 31, 2016.1Location of corporate headquarters.2As of December 31, 2016.3The contribution of each factor to the average annual TSR is shown in percentage points. Because of rounding, the numbers may not add up to the TSR figure shown.4Change in EBITDA multiple.5Share change refers to the change in the number of shares outstanding, not to the change in share price.6As of June 30, 2017.
TSR Disaggregation (percentage-point contributions)3
Profit growth Valuation Cash flow contribution
Company Location1
Market value
($billions)2
Average annual TSR (%)
= Sales growth + Margin
change + Multiple change4 + Dividend
yield + Share change5 +
Net debt
change
2017 TSR (%)6
1 Constellation Brands United States 30.8 49.8 21 9 12 1 0 6 27.1
2 Marine Harvest Norway 8.1 46.1 11 26 –3 7 –4 9 –9.3
3 Meiji Holdings Japan 11.6 43.7 2 15 12 2 0 13 0.1
4 Vietnam Dairy Products Vietnam 8.0 35.2 17 3 11 5 –0 –1 27.2
5 Thai Beverage Thailand 14.8 33.1 7 2 19 4 0 1 8.4
6 Godrej Consumer Products India 7.6 32.2 16 1 13 1 –1 2 –35.4
7 Reynolds American United States 79.9 27.5 8 9 10 6 –4 –1 17.9
8 Tyson Foods United States 22.9 25.8 2 17 6 1 –0 –1 2.3
9 Amorepacific South Korea 17.4 25.6 17 1 7 1 0 0 –5.4
10 Kao Japan 23.4 24.0 4 2 12 3 1 1 20.4
TSR Disaggregation (percentage-point contributions)3
Profit growth Valuation Cash flow contribution
Company Location1
Market value
($billions)2
Average annual TSR (%)
= Sales growth + Margin
change + Multiple change4 + Dividend
yield + Share change5 +
Net debt
change
2017 TSR (%)6
1 Pandora Denmark 14.7 82.2 25 3 45 6 3 0 –32.6
2 Hanesbrands United States 8.2 33.0 5 7 11 1 1 8 8.9
3 ANTA Sports China 7.5 28.9 8 2 16 6 –0 –3 10.2
4 Foot Locker United States 9.4 26.8 7 10 6 2 3 –1 –29.9
5 Adidas Germany 31.7 26.5 8 –1 17 2 1 –0 13.9
6 Under Armour United States 11.9 26.5 27 –4 6 0 –1 –1 –25.1
7 Fast Retailing Japan 36.5 25.8 16 –8 18 1 –0 –1 –10.1
8 Ross Stores United States 25.9 23.7 9 3 8 1 3 –0 –11.6
9 Gildan Activewear Canada 5.9 23.1 8 2 12 1 1 –1 21.7
10 Industria de Diseño Textil Spain 106.6 22.7 11 –1 11 2 0 –0 4.5

28 | Disruption and Reinvention in Value Creation
Financial Infrastructure Providers Top Ten, 2012–2016
Forest Products and Packaging Top Ten, 2012–2016
FINANCIAL INFRASTRUCTURE PROVIDERS
FOREST PRODUCTS AND PACKAGING
Sources: S&P Global Market Intelligence; Thomson Reuters Eikon; Bloomberg; company disclosures; BCG Value Creators report 2017; BCG analysis.Note: n = 45 global companies with a market valuation greater than $2.0 billion as of December 31, 2016.1Location of corporate headquarters.2As of December 31, 2016.3The contribution of each factor to the average annual TSR is shown in percentage points. Because of rounding, the numbers may not add up to the TSR figure shown.4Change in EBITDA multiple.5Share change refers to the change in the number of shares outstanding, not to the change in share price.6As of June 30, 2017.
Sources: S&P Global Market Intelligence; Thomson Reuters Eikon; Bloomberg; company disclosures; BCG Value Creators report 2017; BCG analysis.Note: n = 75 global companies with a market valuation greater than $1.0 billion as of December 31, 2016. n/m = not measurable.1Location of corporate headquarters.2As of December 31, 2016.3The contribution of each factor to the average annual TSR is shown in percentage points. Because of rounding, the numbers may not add up to the TSR figure shown.4Change in EBITDA multiple.5Share change refers to the change in the number of shares outstanding, not to the change in share price.6As of June 30, 2017.
TSR Disaggregation (percentage-point contributions)3
Profit growth Valuation Cash flow contribution
Company Location1
Market value
($billions)2
Average annual TSR (%)
= Sales growth + Margin
change + Multiple change4 + Dividend
yield + Share change5 +
Net debt
change
2017 TSR (%)6
1 Paysafe Group United Kingdom 2.2 54.9 51 36 –12 16 –24 –13 44.8
2 MarketAxess Holdings United States 5.5 39.9 15 4 20 3 0 –3 37.4
3 FleetCor Technologies United States 13.1 36.5 29 1 11 0 –3 –1 1.9
4 London Stock Exchange United Kingdom 12.6 34.2 16 –7 21 4 –5 4 26.3
5 Euronet Worldwide United States 3.8 31.4 11 8 9 0 –1 4 20.6
6 Fiserv United States 23.1 29.3 5 2 14 0 5 3 15.1
7 Wirecard Germany 5.3 27.5 26 3 0 1 –4 2 36.6
8 Broadridge Financial Solutions United States 7.9 27.1 9 2 12 3 1 –0 15.0
9 Equifax United States 14.2 26.7 10 2 12 2 0 1 16.9
10 CBOE Holdings United States 6.0 26.2 5 –0 17 3 2 –1 24.5
TSR Disaggregation (percentage-point contributions)3
Profit growth Valuation Cash flow contribution
Company Location1
Market value
($billions)2
Average annual TSR (%)
= Sales growth + Margin
change + Multiple change4 + Dividend
yield + Share change5 +
Net debt
change
2017 TSR (%)6
1 CCL Industries Canada 6.8 55.0 26 0 26 2 –1 2 24.8
2 Corticeira Amorim Portugal 1.2 54.6 5 5 23 10 –1 11 54.0
3 Intertape Polymer Group Canada 1.1 45.7 1 9 19 4 0 13 3.0
4 Metsä Board Finland 2.5 42.3 –7 21 5 4 –2 21 –3.6
5 DeHua TB New Decoration Material China 1.4 40.1 18 18 6 1 –3 –0 20.0
6 Smurfit Kappa Group Ireland 5.4 39.9 2 2 12 4 –1 20 28.1
7 Stella-Jones Canada 2.2 35.1 23 –2 13 1 –2 1 2.1
8 Huhtamäki Finland 3.9 34.8 7 5 15 4 –0 4 –0.2
9 Neenah Paper United States 1.4 33.3 6 5 14 3 –2 8 –4.9
10 MCC Meili China 2.1 33.2 –12 n/m n/m 0 –15 12 –36.6

The Boston Consulting Group | 29
Green Energy and Environment Top Ten, 2012–2016
Health Care Services Top Ten, 2012–2016
GREEN ENERGY AND ENVIRONMENT
HEALTH CARE SERVICES
Sources: S&P Global Market Intelligence; Thomson Reuters Eikon; Bloomberg; company disclosures; BCG Value Creators report 2017; BCG analysis.Note: n = 70 global companies with a market valuation greater than $1.0 billion as of December 31, 2016. n/m = not measurable.1Location of corporate headquarters.2As of December 31, 2016.3The contribution of each factor to the average annual TSR is shown in percentage points. Because of rounding, the numbers may not add up to the TSR figure shown.4Change in EBITDA multiple.5Share change refers to the change in the number of shares outstanding, not to the change in share price.6As of June 30, 2017.
Sources: S&P Global Market Intelligence; Thomson Reuters Eikon; Bloomberg; company disclosures; BCG Value Creators report 2017; BCG analysis.Note: n = 45 global companies with a market valuation greater than $1.5 billion as of December 31, 2016. n/a = not applicable.1Location corporate headquarters. 2As of December 31, 2016. 3The contribution of each factor to the average annual TSR is shown in percentage points. Because of rounding, the numbers may not add up to the TSR figure shown. 4Change in EBITDA multiple (except for Centene and Cigna; see footnote 7).5Share change refers to the change in the number of shares outstanding, not to the change in share price. 6As of June 30, 2017.7Because both UnitedHealth and Cigna have large health-insurance businesses, the TSR disaggregation for these companies reflects the approach used for the insurance industry, in which equity growth replaces sales growth and the price-to-book multiple replaces the EBITDA multiple. Change in margin and net debt are not shown.
TSR Disaggregation (percentage-point contributions)3
Profit growth Valuation Cash flow contribution
Company Location1
Market value
($billions)2
Average annual TSR (%)
= Sales growth + Margin
change + Multiple change4 + Dividend
yield + Share change5 +
Net debt
change
2017 TSR (%)6
1 Superblock Thailand 1.2 95.2 61 n/m n/m 0 –28 5 –8.6
2 Zhonghua Geotechnical Engineering China 2.1 44.1 54 7 –1 0 –8 –9 49.3
3 Golden Dragon Development China 3.0 36.4 87 –16 –34 1 –7 5 –30.2 4 CITIC Envirotech Singapore 1.1 34.6 45 23 –21 1 –16 3 5.3 5 Shanghai Safbon Water Service China 1.1 32.5 45 14 –20 0 –4 –4 –10.6 6 Rentokil Initial United Kingdom 5.0 31.4 –3 6 19 3 –0 7 24.2 7 Saneamento do Paraná (SANEPAR) Brazil 1.4 28.9 15 –1 8 11 –4 0 1.3
8 Dongjiang Environmental Hong Kong 2.1 28.7 12 7 14 1 –4 –1 –10.9
9 Beijing OriginWater Technology China 7.9 28.3 54 –11 –9 0 –3 –2 6.8
10 China Everbright International Hong Kong 5.1 27.3 31 –2 2 2 –4 –1 12.3
TSR Disaggregation (percentage-point contributions)3
Profit growth Valuation Cash flow contribution
Company Location1
Market value
($billions)2
Average annual TSR (%)
= Sales growth + Margin
change + Multiple change4 + Dividend
yield + Share change5 +
Net debt
change
2017 TSR (%)6
1 Zhejiang Dian Diagnostics China 2.5 46.7 51 4 12 0 –14 –8 –1.6
2 Bumrungrad Hospital Thailand 3.7 33.5 10 5 13 2 –0 2 –4.4 3 HCA Healthcare United States 27.7 33.2 7 –0 5 6 3 13 17.8 4 Ramsay Health Care Australia 9.9 31.3 18 –0 10 3 0 1 8.6 5 Mouwasat Medical Services Saudi Arabia 2.0 28.3 13 –1 15 3 0 –1 8.8 6 UnitedHealth Group7 United States 152.3 27.9 6 n/a7 17 2 2 n/a7 16.8 7 Acadia Healthcare United States 2.9 27.1 66 40 –56 0 –18 –5 49.2 8 Ryman Healthcare New Zealand 2.8 26.8 14 –5 16 2 –0 –1 3.3 9 ORPEA France 4.9 26.8 18 –1 6 2 –3 5 27.1 10 Cigna7 United States 34.2 26.1 10 n/a7 13 0 2 n/a7 25.5

30 | Disruption and Reinvention in Value Creation
Insurance Top Ten, 2012–2016
Large-Cap Pharma Top Ten, 2012–2016
INSURANCE
LARGE-CAP PHARMA
Sources: S&P Global Market Intelligence; Thomson Reuters Eikon; Bloomberg; company disclosures; BCG Value Creators report 2017; BCG analysis.Note: n = 84 global companies with a market valuation greater than $5.0 billion as of December 31, 2016.1Location of corporate headquarters.2As of December 31, 2016.3The contribution of each factor to the average annual TSR is shown in percentage points. Because of rounding, the numbers may not add up to the TSR figure shown.4Change in price-to-book multiple.5Share change refers to the change in the number of shares outstanding, not to the change in share price.6As of June 30, 2017.
Sources: S&P Global Market Intelligence; Thomson Reuters Eikon; Bloomberg; company disclosures; BCG Value Creators report 2017; BCG analysis.Note: n = 30 global companies with a market valuation greater than $18 billion as of December 31, 2016. n/m = not measurable.1Location of corporate headquarters.2As of December 31, 2016.3The contribution of each factor to the average annual TSR is shown in percentage points. Because of rounding, the numbers may not add up to the TSR figure shown.4Change in EBITDA multiple.5Share change refers to the change in the number of shares outstanding, not to the change in share price.6As of June 30, 2017.
TSR Disaggregation (percentage-point contributions)3
Profit growth Valuation Cash flow contribution
Company Location1
Market value
($billions)2
Average annual TSR (%)
= Sales growth + Margin
change + Multiple change4 + Dividend
yield + Share change5 +
Net debt
change
2017 TSR (%)6
1 Actelion Switzerland 22.5 49.1 6 11 33 2 3 –6 21.5
2 Incyte United States 18.9 46.2 64 n/m n/m 0 –8 1 25.6
3 Regeneron Pharmaceuticals United States 39.4 46.0 61 n/m n/m 0 –3 –0 33.8
4 Gilead Sciences United States 94.3 29.4 29 7 –6 1 3 –4 0.4
5 Allergan Ireland 78.8 28.3 26 15 10 0 –19 –3 16.4
6 Celgene United States 89.7 27.9 18 –2 11 0 3 –2 12.2
7 Astellas Pharma Japan 29.5 23.7 6 5 11 3 2 –2 –14.4
8 Merck Germany 45.6 22.6 8 3 11 2 0 –1 7.5
9 Otsuka Holdings Japan 23.6 21.5 1 –7 31 3 1 –7 –5.9
10 Biogen United States 61.7 20.8 18 7 –5 0 2 –1 3.9
TSR Disaggregation (percentage-point contributions)3
Profit growth Valuation Cash flow contribution
Company Location1
Market value
($billions)2
Average annual TSR (%)
= Equity growth + Multiple
change4 + Dividend yield + Share
change52017
TSR (%)6
1 Bajaj Finserv India 6.8 47.1 29 19 1 –2 42.2
2 Swiss Life Switzerland 9.0 31.6 8 19 4 0 16.1
3 Ageas Belgium 8.2 31.2 4 18 6 3 –2.4
4 Qatar Insurance Qatar 5.6 30.1 20 7 10 –7 –7.2
5 Lincoln National United States 15.1 29.9 0 22 2 6 2.9
6 St. James’s Place United Kingdom 6.6 29.0 10 17 3 –1 18.9
7 Hannover Rück Germany 13.1 27.8 13 9 6 0 7.1
8 Sun Life Financial Canada 23.5 27.6 9 14 5 –1 –8.4
9 Hartford Financial Services Group United States 18.0 26.3 –5 26 2 3 11.4
10 Tokio Marine Holdings Japan 31.0 26.1 16 7 3 0 –1.5

The Boston Consulting Group | 31
Machinery Top Ten, 2012–2016
Media and Publishing Top Ten, 2012–2016
MACHINERY
MEDIA AND PUBLISHING
Sources: S&P Global Market Intelligence; Thomson Reuters Eikon; Bloomberg; company disclosures; BCG Value Creators report 2017; BCG analysis.Note: n = 80 global companies with a market valuation greater than $4.0 billion as of December 31, 2016.1Location of corporate headquarters.2As of December 31, 2016.3The contribution of each factor to the average annual TSR is shown in percentage points. Because of rounding, the numbers may not add up to the TSR figure shown.4Change in EBITDA multiple.5Share change refers to the change in the number of shares outstanding, not to the change in share price.6As of June 30, 2017.
Sources: S&P Global Market Intelligence; Thomson Reuters Eikon; Bloomberg; company disclosures; BCG Value Creators report 2017; BCG analysis.Note: n = 73 global companies with a market valuation greater than $4.0 billion as of December 31, 2016. n/m = not measurable.1Location of corporate headquarters.2As of December 31, 2016.3The contribution of each factor to the average annual TSR is shown in percentage points. Because of rounding, the numbers may not add up to the TSR figure shown.4Change in EBITDA multiple.5Share change refers to the change in the number of shares outstanding, not to the change in share price.6As of June 30, 2017.
TSR Disaggregation (percentage-point contributions)3
Profit growth Valuation Cash flow contribution
Company Location1
Market value
($billions)2
Average annual TSR (%)
= Sales growth + Margin
change + Multiple change4 + Dividend
yield + Share change5 +
Net debt
change
2017 TSR (%)6
1 Vestas Wind Systems Denmark 13.9 50.1 12 47 –20 1 –1 12 33.2
2 Melrose Industries United Kingdom 4.6 45.0 –5 –9 22 87 –53 3 23.6
3 Gamesa (acquired by Siemens Wind) Spain 5.6 44.3 9 14 7 1 –2 16 Delisted
4 SIASUN Robot & Automation China 4.8 42.4 21 –2 25 0 –2 –0 –8.8 5 Daikin Industries Japan 26.9 40.3 11 9 13 2 –0 5 7.5 6 A. O. Smith United States 8.2 38.1 9 13 12 2 1 1 19.6 7 The Toro United States 6.0 31.5 5 6 15 2 2 1 24.5 8 Trelleborg Sweden 5.4 28.1 –1 7 16 4 0 3 9.5 9 Ingersoll Rand Ireland 19.4 27.4 –2 2 12 8 4 3 23.0 10 ASSA ABLOY Sweden 20.7 26.3 11 5 6 2 –0 2 11.2
TSR Disaggregation (percentage-point contributions)3
Profit growth Valuation Cash flow contribution
Company Location1
Market value
($billions)2
Average annual TSR (%)
= Sales growth + Margin
change + Multiple change4 + Dividend
yield + Share change5 +
Net debt
change
2017 TSR (%)6
1 Hithink RoyalFlush Information Network China 5.3 77.7 52 44 –9 1 0 –10 –8.3
2 East Money Information China 8.7 67.0 54 4 17 0 –3 –6 –14.6
3 Netflix United States 53.1 65.7 22 –22 70 0 –2 –3 20.7
4 Leshi Internet Information & Technology China 10.2 58.7 106 –98 54 0 –2 –0 –14.3
5 Tencent Holdings China 229.5 47.0 40 –3 12 1 –1 –1 43.1
6 NetEase China 28.3 41.9 39 –10 15 2 –0 –5 37.3
7 M3 Japan 8.2 39.1 33 –8 14 1 –0 –1 5.5
8 Zillow Group United States 6.5 37.2 67 n/m n/m 0 –14 –2 34.0 9 REA Group Australia 5.3 36.7 21 5 11 2 0 –3 21.1
10 Zee Entertainment Enterprises India 6.4 31.9 17 1 13 1 0 –0 8.5
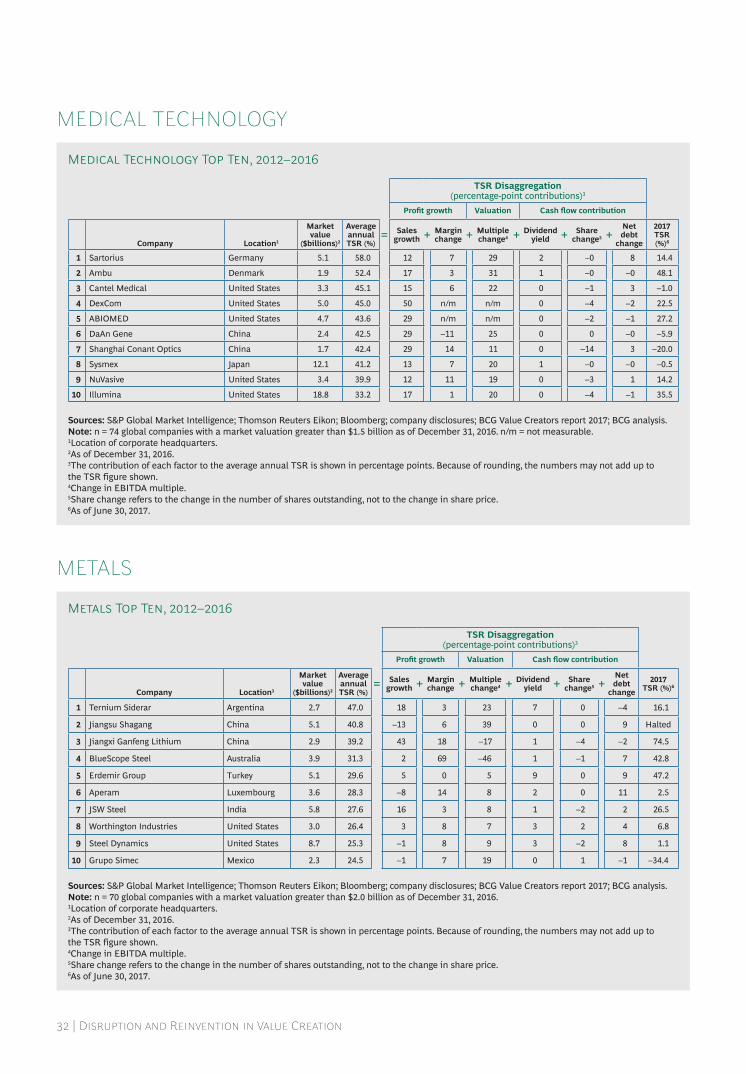
32 | Disruption and Reinvention in Value Creation
Medical Technology Top Ten, 2012–2016
Metals Top Ten, 2012–2016
MEDICAL TECHNOLOGY
METALS
Sources: S&P Global Market Intelligence; Thomson Reuters Eikon; Bloomberg; company disclosures; BCG Value Creators report 2017; BCG analysis.Note: n = 74 global companies with a market valuation greater than $1.5 billion as of December 31, 2016. n/m = not measurable.1Location of corporate headquarters.2As of December 31, 2016.3The contribution of each factor to the average annual TSR is shown in percentage points. Because of rounding, the numbers may not add up to the TSR figure shown.4Change in EBITDA multiple.5Share change refers to the change in the number of shares outstanding, not to the change in share price.6As of June 30, 2017.
Sources: S&P Global Market Intelligence; Thomson Reuters Eikon; Bloomberg; company disclosures; BCG Value Creators report 2017; BCG analysis.Note: n = 70 global companies with a market valuation greater than $2.0 billion as of December 31, 2016.1Location of corporate headquarters.2As of December 31, 2016.3The contribution of each factor to the average annual TSR is shown in percentage points. Because of rounding, the numbers may not add up to the TSR figure shown.4Change in EBITDA multiple.5Share change refers to the change in the number of shares outstanding, not to the change in share price.6As of June 30, 2017.
TSR Disaggregation (percentage-point contributions)3
Profit growth Valuation Cash flow contribution
Company Location1
Market value
($billions)2
Average annual TSR (%)
= Sales growth + Margin
change + Multiple change4 + Dividend
yield + Share change5 +
Net debt
change
2017 TSR (%)6
1 Sartorius Germany 5.1 58.0 12 7 29 2 –0 8 14.4
2 Ambu Denmark 1.9 52.4 17 3 31 1 –0 –0 48.1
3 Cantel Medical United States 3.3 45.1 15 6 22 0 –1 3 –1.0
4 DexCom United States 5.0 45.0 50 n/m n/m 0 –4 –2 22.5
5 ABIOMED United States 4.7 43.6 29 n/m n/m 0 –2 –1 27.2
6 DaAn Gene China 2.4 42.5 29 –11 25 0 0 –0 –5.9
7 Shanghai Conant Optics China 1.7 42.4 29 14 11 0 –14 3 –20.0
8 Sysmex Japan 12.1 41.2 13 7 20 1 –0 –0 –0.5
9 NuVasive United States 3.4 39.9 12 11 19 0 –3 1 14.2
10 Illumina United States 18.8 33.2 17 1 20 0 –4 –1 35.5
TSR Disaggregation (percentage-point contributions)3
Profit growth Valuation Cash flow contribution
Company Location1
Market value
($billions)2
Average annual TSR (%)
= Sales growth + Margin
change + Multiple change4 + Dividend
yield + Share change5 +
Net debt
change
2017 TSR (%)6
1 Ternium Siderar Argentina 2.7 47.0 18 3 23 7 0 –4 16.1
2 Jiangsu Shagang China 5.1 40.8 –13 6 39 0 0 9 Halted
3 Jiangxi Ganfeng Lithium China 2.9 39.2 43 18 –17 1 –4 –2 74.5
4 BlueScope Steel Australia 3.9 31.3 2 69 –46 1 –1 7 42.8
5 Erdemir Group Turkey 5.1 29.6 5 0 5 9 0 9 47.2
6 Aperam Luxembourg 3.6 28.3 –8 14 8 2 0 11 2.5
7 JSW Steel India 5.8 27.6 16 3 8 1 –2 2 26.5
8 Worthington Industries United States 3.0 26.4 3 8 7 3 2 4 6.8
9 Steel Dynamics United States 8.7 25.3 –1 8 9 3 –2 8 1.1
10 Grupo Simec Mexico 2.3 24.5 –1 7 19 0 1 –1 –34.4

The Boston Consulting Group | 33
Mid-Cap Pharma Top Ten, 2012–2016
Mining Top Ten, 2012–2016
MID-CAP PHARMA
MINING
Sources: S&P Global Market Intelligence; Thomson Reuters Eikon; Bloomberg; company disclosures; BCG Value Creators report 2017; BCG analysis.Note: n = 51 global companies with a market valuation greater than $4.0 billion as of December 31, 2016. n/m = not measurable.1Location of corporate headquarters.2As of December 31, 2016.3The contribution of each factor to the average annual TSR is shown in percentage points. Because of rounding, the numbers may not add up to the TSR figure shown.4Change in EBITDA multiple.5Share change refers to the change in the number of shares outstanding, not to the change in share price.6As of June 30, 2017.
Sources: S&P Global Market Intelligence; Thomson Reuters Eikon; Bloomberg; company disclosures; BCG Value Creators report 2017; BCG analysis.Note: n = 50 global companies with a market valuation greater than $3.0 billion as of December 31, 2016.1Location of corporate headquarters.2As of December 31, 2016.3The contribution of each factor to the average annual TSR is shown in percentage points. Because of rounding, the numbers may not add up to the TSR figure shown.4Change in EBITDA multiple.5Share change refers to the change in the number of shares outstanding, not to the change in share price.6As of June 30, 2017.
TSR Disaggregation (percentage-point contributions)3
Profit growth Valuation Cash flow contribution
Company Location1
Market value
($billions)2
Average annual TSR (%)
= Sales growth + Margin
change + Multiple change4 + Dividend
yield + Share change5 +
Net debt
change
2017 TSR (%)6
1 Genmab Denmark 10.1 99.0 39 n/m n/m 0 –6 –18 18.4
2 Aurobindo Pharma India 5.8 74.7 27 12 20 1 –0 15 2.4
3 Shanghai RAAS Blood Products China 16.5 66.6 33 5 35 1 –7 –0 –12.2
4 Ionis Pharmaceuticals United States 5.8 46.0 28 n/m n/m 0 –4 –4 6.4
5 Shionogi Japan 15.3 44.4 5 9 23 3 1 3 12.5
6 Recordati Italy 5.8 41.7 9 6 23 5 –1 0 33.4
7 CSPC Pharmaceutical Group China 6.5 38.9 11 17 25 2 –24 8 39.2
8 Piramal Enterprises India 4.1 38.7 33 n/m n/m 5 –1 –8 72.7
9 Tonghua Dongbao Pharmaceutical China 4.5 37.3 21 26 –11 2 –1 0 0.6
10 Guangzhou Baiyunshan Pharmaceutical China 5.4 31.3 30 9 –8 2 –13 11 3.8
TSR Disaggregation (percentage-point contributions)3
Profit growth Valuation Cash flow contribution
Company Location1
Market value
($billions)2
Average annual TSR (%)
= Sales growth + Margin
change + Multiple change4 + Dividend
yield + Share change5 +
Net debt
change
2017 TSR (%)6
1 Boliden Sweden 7.2 22.0 –0 8 9 3 0 2 –1.4
2 Imerys France 6.1 18.6 3 0 11 3 –1 3 8.3
3 China Molybdenum China 7.9 17.8 3 9 21 4 –3 –16 56.0
4 Shanxi Meijin Energy China 5.0 11.8 36 48 –37 0 –34 –1 –3.9
5 Franco-Nevada Canada 10.7 11.0 8 –0 9 2 –5 –3 21.3
6 Saudi Arabian Mining (Ma’aden) Saudi Arabia 12.1 10.8 44 –7 –16 2 –5 –8 24.9
7 Norilsk Nickel Russia 26.4 9.8 –10 –1 12 8 2 –1 –17.8 8 Wintime Energy China 7.2 8.8 46 –15 3 1 –25 –2 –11.0 9 Vedanta India 9.4 7.8 48 –21 27 2 –22 –26 23.2
10 Shandong Gold Mining China 9.8 5.6 5 –5 10 0 –5 0 –20.5
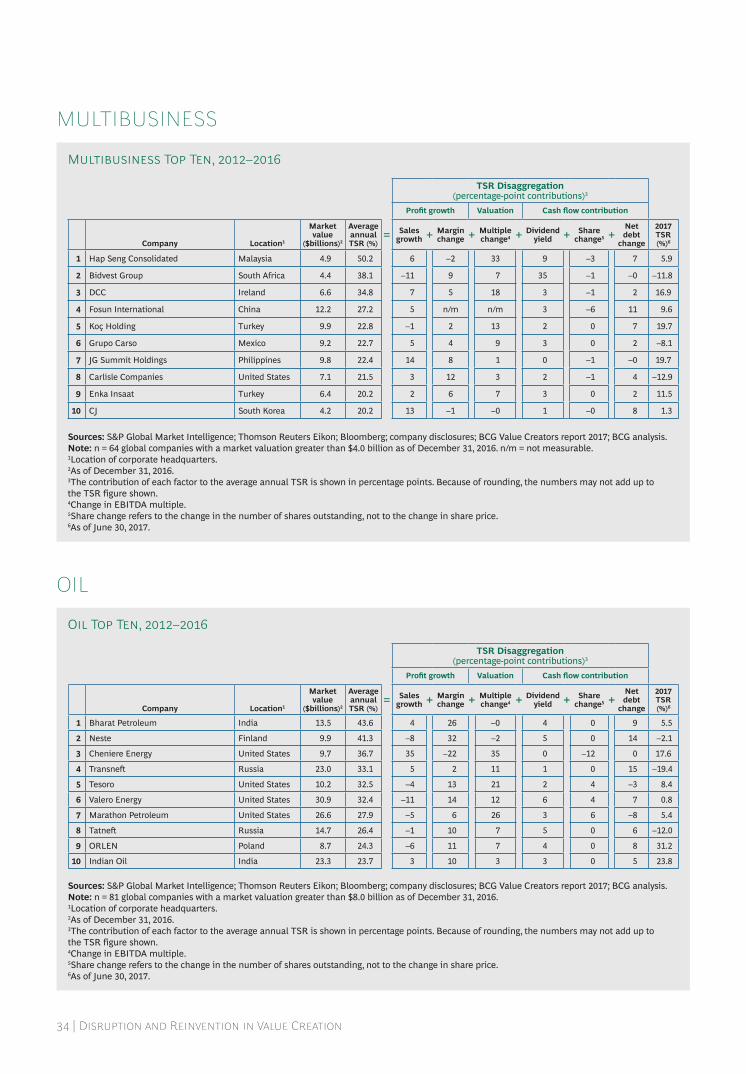
34 | Disruption and Reinvention in Value Creation
Multibusiness Top Ten, 2012–2016
Oil Top Ten, 2012–2016
MULTIBUSINESS
OIL
Sources: S&P Global Market Intelligence; Thomson Reuters Eikon; Bloomberg; company disclosures; BCG Value Creators report 2017; BCG analysis.Note: n = 81 global companies with a market valuation greater than $8.0 billion as of December 31, 2016.1Location of corporate headquarters.2As of December 31, 2016.3The contribution of each factor to the average annual TSR is shown in percentage points. Because of rounding, the numbers may not add up to the TSR figure shown.4Change in EBITDA multiple.5Share change refers to the change in the number of shares outstanding, not to the change in share price.6As of June 30, 2017.
Sources: S&P Global Market Intelligence; Thomson Reuters Eikon; Bloomberg; company disclosures; BCG Value Creators report 2017; BCG analysis.Note: n = 64 global companies with a market valuation greater than $4.0 billion as of December 31, 2016. n/m = not measurable.1Location of corporate headquarters.2As of December 31, 2016.3The contribution of each factor to the average annual TSR is shown in percentage points. Because of rounding, the numbers may not add up to the TSR figure shown.4Change in EBITDA multiple.5Share change refers to the change in the number of shares outstanding, not to the change in share price.6As of June 30, 2017.
TSR Disaggregation (percentage-point contributions)3
Profit growth Valuation Cash flow contribution
Company Location1
Market value
($billions)2
Average annual TSR (%)
= Sales growth + Margin
change + Multiple change4 + Dividend
yield + Share change5 +
Net debt
change
2017 TSR (%)6
1 Hap Seng Consolidated Malaysia 4.9 50.2 6 –2 33 9 –3 7 5.9
2 Bidvest Group South Africa 4.4 38.1 –11 9 7 35 –1 –0 –11.8
3 DCC Ireland 6.6 34.8 7 5 18 3 –1 2 16.9
4 Fosun International China 12.2 27.2 5 n/m n/m 3 –6 11 9.6
5 Koç Holding Turkey 9.9 22.8 –1 2 13 2 0 7 19.7
6 Grupo Carso Mexico 9.2 22.7 5 4 9 3 0 2 –8.1
7 JG Summit Holdings Philippines 9.8 22.4 14 8 1 0 –1 –0 19.7
8 Carlisle Companies United States 7.1 21.5 3 12 3 2 –1 4 –12.9
9 Enka Insaat Turkey 6.4 20.2 2 6 7 3 0 2 11.5
10 CJ South Korea 4.2 20.2 13 –1 –0 1 –0 8 1.3
TSR Disaggregation (percentage-point contributions)3
Profit growth Valuation Cash flow contribution
Company Location1
Market value
($billions)2
Average annual TSR (%)
= Sales growth + Margin
change + Multiple change4 + Dividend
yield + Share change5 +
Net debt
change
2017 TSR (%)6
1 Bharat Petroleum India 13.5 43.6 4 26 –0 4 0 9 5.5
2 Neste Finland 9.9 41.3 –8 32 –2 5 0 14 –2.1
3 Cheniere Energy United States 9.7 36.7 35 –22 35 0 –12 0 17.6
4 Transneft Russia 23.0 33.1 5 2 11 1 0 15 –19.4
5 Tesoro United States 10.2 32.5 –4 13 21 2 4 –3 8.4
6 Valero Energy United States 30.9 32.4 –11 14 12 6 4 7 0.8
7 Marathon Petroleum United States 26.6 27.9 –5 6 26 3 6 –8 5.4
8 Tatneft Russia 14.7 26.4 –1 10 7 5 0 6 –12.0
9 ORLEN Poland 8.7 24.3 –6 11 7 4 0 8 31.2
10 Indian Oil India 23.3 23.7 3 10 3 3 0 5 23.8

The Boston Consulting Group | 35
Power and Gas Utilities Top Ten, 2012–2016
Real Estate Top Ten, 2012–2016
POWER AND GAS UTILITIES
REAL ESTATE
Sources: S&P Global Market Intelligence; Thomson Reuters Eikon; Bloomberg; company disclosures; BCG Value Creators report 2017; BCG analysis.Note: n = 92 global companies with a market valuation greater than $5.0 billion as of December 31, 2016.1Location of corporate headquarters.2As of December 31, 2016.3The contribution of each factor to the average annual TSR is shown in percentage points. Because of rounding, the numbers may not add up to the TSR figure shown.4Change in EBITDA multiple.5Share change refers to the change in the number of shares outstanding, not to the change in share price.6As of June 30, 2017.
Sources: S&P Global Market Intelligence; Thomson Reuters Eikon; Bloomberg; company disclosures; BCG Value Creators report 2017; BCG analysis.Note: n = 92 global companies with a market valuation greater than $3.0 billion as of December 31, 2016. n/m = not measurable.1Location of corporate headquarters.2As of December 31, 2016.3The contribution of each factor to the average annual TSR is shown in percentage points. Because of rounding, the numbers may not add up to the TSR figure shown.4Change in P/E multiple.5Share change refers to the change in the number of shares outstanding, not to the change in share price.6As of June 30, 2017.
TSR Disaggregation (percentage-point contributions)3
Profit growth Valuation Cash flow contribution
Company Location1
Market value
($billions)2
Average annual TSR (%)
= Sales growth + Margin
change + Multiple change4 + Dividend
yield + Share change5 +
Net debt
change
2017 TSR (%)6
1 Huadian Power International China 6.6 25.8 3 17 –15 5 –7 23 –3.6
2 China Gas Holdings Hong Kong 6.6 25.6 10 5 6 1 –2 5 50.5
3 SDIC Power Holdings China 6.5 24.5 6 20 –13 3 –4 12 18.4
4 NiSource United States 7.1 22.5 –5 5 1 24 –3 1 16.3
5 Tenaga Malaysia 17.5 21.6 6 22 –12 3 –1 3 3.0
6 Red Eléctrica Spain 10.2 21.5 4 0 7 5 0 6 3.2
7 APA Group Australia 6.9 21.3 16 7 1 8 –7 –3 7.0
8 Atmos Energy United States 7.8 21.1 –4 11 8 4 –3 5 13.2
9 Tokyo Electric Power Japan 6.5 20.9 1 5 –9 0 0 25 –1.9
10 Endesa Spain 22.5 19.9 –10 –3 8 15 0 10 0.2
TSR Disaggregation (percentage-point contributions)3
Profit growth Valuation Cash flow contribution
Company Location1
Market value
($billions)2
Average annual TSR (%)
= Equity growth + ROE
change + Multiple change4 + Dividend
yield + Share change5
2017 TSR (%)6
1 Fastighets AB Balder Sweden 3.7 48.7 33 n/m n/m 0 –2 10.8
2 China Fortune Land Development China 10.2 47.9 56 –19 12 2 –2 43.2
3 Barratt Developments United Kingdom 5.7 41.7 7 69 –37 4 –1 23.4
4 Sunac China Holdings China 3.2 40.1 36 –39 42 5 –5 151.7
5 Persimmon United Kingdom 6.8 36.9 8 34 –12 6 –0 33.8
6 Taylor Wimpey United Kingdom 6.2 36.5 10 46 –23 4 –1 21.7
7 Shanghai Chengtou China 9.5 35.8 13 –0 23 1 –2 –48.3
8 Yango Group China 3.2 33.9 46 –15 11 1 –9 4.5
9 Bellway United Kingdom 3.8 32.2 13 35 –19 4 –0 21.7
10 Daiwa House Industry Japan 18.1 31.9 14 20 –2 4 –3 22.0

36 | Disruption and Reinvention in Value Creation
Retail Top Ten, 2012–2016
Services Top Ten, 2012–2016
RETAIL
SERVICES
Sources: S&P Global Market Intelligence; Thomson Reuters Eikon; Bloomberg; company disclosures; BCG Value Creators report 2017; BCG analysis.Note: n = 92 global companies with a market valuation greater than $4.5 billion as of December 31, 2016.1Location of corporate headquarters.2As of December 31, 2016.3The contribution of each factor to the average annual TSR is shown in percentage points. Because of rounding, the numbers may not add up to the TSR figure shown.4Change in EBITDA multiple.5Share change refers to the change in the number of shares outstanding, not to the change in share price.6As of June 30, 2017.
Sources: S&P Global Market Intelligence; Thomson Reuters Eikon; Bloomberg; company disclosures; BCG Value Creators report 2017; BCG analysis.Note: n = 82 global companies with a market valuation greater than $2.5 billion as of December 31, 2016.1Location of corporate headquarters.2As of December 31, 2016.3The contribution of each factor to the average annual TSR is shown in percentage points. Because of rounding, the numbers may not add up to the TSR figure shown.4Change in EBITDA multiple.5Share change refers to the change in the number of shares outstanding, not to the change in share price.6As of June 30, 2017.
TSR Disaggregation (percentage-point contributions)3
Profit growth Valuation Cash flow contribution
Company Location1
Market value
($billions)2
Average annual TSR (%)
= Sales growth + Margin
change + Multiple change4 + Dividend
yield + Share change5 +
Net debt
change
2017 TSR (%)6
1 Ryohin Keikaku Japan 5.2 46.0 13 7 26 2 0 –3 23.3
2 Rite Aid United States 8.6 45.6 5 4 10 0 –3 29 –64.2
3 Tsuruha Holdings Japan 4.6 40.7 13 3 27 2 –0 –4 8.3
4 Domino’s Pizza United States 7.7 39.7 8 3 16 3 4 6 33.5
5 Raia Drogasil Brazil 6.2 37.7 33 11 –6 1 0 –1 14.9
6 Dollarama Canada 8.6 35.5 13 6 11 1 5 –1 26.2
7 Alimentation Couche-Tard Canada 25.9 34.9 10 17 11 1 –1 –2 5.7
8 Amazon United States 356.3 34.1 23 24 –10 0 –1 –2 29.1
9 ASOS United Kingdom 5.1 32.1 30 –14 17 0 –2 1 15.8
10 Ulta Beauty United States 15.9 31.8 22 4 5 0 –0 –0 12.7
TSR Disaggregation (percentage-point contributions)3
Profit growth Valuation Cash flow contribution
Company Location1
Market value
($billions)2
Average annual TSR (%)
= Sales growth + Margin
change + Multiple change4 + Dividend
yield + Share change5 +
Net debt
change
2017 TSR (%)6
1 MonotaRO Japan 2.5 64.5 26 9 29 1 –1 –0 51.5
2 Temp Holdings Japan 3.7 52.6 20 16 39 2 –5 –20 16.7
3 Ashtead Group United Kingdom 9.7 49.7 22 10 9 2 0 6 0.9
4 Sohgo Security Services Japan 3.9 42.8 7 7 29 2 0 –2 13.3
5 Realcan Pharmaceutical China 3.1 38.2 37 11 1 0 –11 –0 9.3
6 Eternal Asia Supply Chain Management China 3.3 37.3 53 11 –20 1 –4 –3 –19.8
7 Unisplendour China 8.6 37.0 39 16 10 0 –28 –1 6.5
8 AMERCO United States 7.2 34.9 7 10 12 2 0 4 –0.7
9 SYNNEX United States 4.8 32.3 6 7 17 0 –2 3 –0.4
10 Pool United States 4.3 30.1 7 8 9 2 3 1 13.3

The Boston Consulting Group | 37
Technology Top Ten, 2012–2016
Transportation and Logistics Top Ten, 2012–2016
TECHNOLOGY
TRANSPORTATION AND LOGISTICS
Sources: S&P Global Market Intelligence; Thomson Reuters Eikon; Bloomberg; company disclosures; BCG Value Creators report 2017; BCG analysis.Note: n = 94 global companies with a market valuation greater than $9.0 billion as of December 31, 2016.1Location of corporate headquarters.2As of December 31, 2016.3The contribution of each factor to the average annual TSR is shown in percentage points. Because of rounding, the numbers may not add up to the TSR figure shown.4Change in EBITDA multiple.5Share change refers to the change in the number of shares outstanding, not to the change in share price.6As of June 30, 2017.
Sources: S&P Global Market Intelligence; Thomson Reuters Eikon; Bloomberg; company disclosures; BCG Value Creators report 2017; BCG analysis.Note: n = 99 global companies with a market valuation greater than $2.0 billion as of December 31, 2016. n/m = not measurable.1Location of corporate headquarters.2As of December 31, 2016.3The contribution of each factor to the average annual TSR is shown in percentage points. Because of rounding, the numbers may not add up to the TSR figure shown.4Change in EBITDA multiple.5Share change refers to the change in the number of shares outstanding, not to the change in share price.6As of June 30, 2017.
TSR Disaggregation (percentage-point contributions)3
Profit growth Valuation Cash flow contribution
Company Location1
Market value
($billions)2
Average annual TSR (%)
= Sales growth + Margin
change + Multiple change4 + Dividend
yield + Share change5 +
Net debt
change
2017 TSR (%)6
1 NVIDIA United States 57.5 52.6 9 6 39 2 3 –6 35.7
2 Largan Precision Taiwan 15.7 49.0 25 12 11 3 0 –1 28.0
3 Constellation Software Canada 9.6 46.2 22 5 16 3 0 –1 15.4
4 Broadcom Singapore 70.5 46.1 41 5 12 2 –9 –6 33.0
5 NXP Semiconductors Netherlands 32.9 44.9 18 2 22 0 –6 9 11.7
6 AAC Technologies China 11.2 37.5 31 1 4 3 0 –1 36.3
7 Keyence Japan 41.7 36.9 15 2 25 0 0 –5 23.2
8 Skyworks Solutions United States 13.9 36.6 17 11 8 1 0 –1 29.3
9 Acuity Brands United States 10.2 34.9 13 7 13 1 –1 2 –11.8
10 ASML Holding Netherlands 48.6 34.2 4 0 26 7 –0 –3 8.0
TSR Disaggregation (percentage-point contributions)3
Profit growth Valuation Cash flow contribution
Company Location1
Market value
($billions)2
Average annual TSR (%)
= Sales growth + Margin
change + Multiple change4 + Dividend
yield + Share change5 +
Net debt
change
2017 TSR (%)6
1 DFDS Denmark 2.6 40.0 3 8 12 5 5 7 8.4
2 National Shipping Saudi Arabia 4.6 34.0 28 8 –11 5 –4 8 –9.9
3 Macquarie Infrastructure United States 6.7 31.2 11 18 1 7 –11 5 –0.7
4 XPO Logistics United States 4.8 28.4 n/m n/m n/m n/m n/m n/m 49.7
5 Old Dominion Freight Line United States 7.1 26.0 10 6 8 –0 1 1 11.3
6 DSV Denmark 8.3 26.0 9 –1 13 1 0 4 28.0
7 Deutsche Post Germany 39.4 25.7 2 6 9 4 0 5 8.5
8 Sinotrans China 2.1 25.4 1 6 11 3 –2 6 14.7
9 Central Japan Railway Japan 32.4 25.2 3 3 6 1 0 12 –4.4
10 TFI International Canada 2.4 25.1 8 –2 12 3 1 3 –18.8

38 | Disruption and Reinvention in Value Creation
Travel and Tourism Top Ten, 2012–2016
TRAVEL AND TOURISM
Sources: S&P Global Market Intelligence; Thomson Reuters Eikon; Bloomberg; company disclosures; BCG Value Creators report 2017; BCG analysis.Note: n = 80 global companies with a market valuation greater than $3.0 billion as of December 31, 2016.1Location of corporate headquarters.2As of December 31, 2016.3The contribution of each factor to the average annual TSR is shown in percentage points. Because of rounding, the numbers may not add up to the TSR figure shown.4Change in EBITDA multiple.5Share change refers to the change in the number of shares outstanding, not to the change in share price.6As of June 30, 2017.
TSR Disaggregation (percentage-point contributions)3
Profit growth Valuation Cash flow contribution
Company Location1
Market value
($billions)2
Average annual TSR (%)
= Sales growth + Margin
change + Multiple change4 + Dividend
yield + Share change5 +
Net debt
change
2017 TSR (%)6
1 Hawaiian Holdings United States 3.0 57.9 8 24 11 0 –1 16 –17.6
2 Airports of Thailand Thailand 15.9 57.6 12 3 30 3 0 10 18.7
3 Aristocrat Leisure Australia 7.2 51.7 26 16 7 4 –3 2 46.5
4 Delta Air Lines United States 36.1 44.6 2 15 –1 1 3 24 10.1
5 Southwest Airlines United States 30.7 43.3 5 22 8 1 5 2 25.2
6 Alaska Air Group United States 10.9 37.6 7 12 14 1 3 1 1.8
7 Grupo Aeroportuario del Pacífico Mexico 4.3 36.4 14 7 10 7 1 –1 21.9
8 Ryanair Holdings Ireland 18.9 34.2 9 7 11 3 3 1 23.8
9 Grupo Aeroportuario del Sureste Mexico 4.3 34.1 16 1 14 3 0 –1 30.4
10 JetBlue Airways United States 7.3 33.9 8 16 –5 0 –2 16 1.8

The Boston Consulting Group | 39
The Boston Consulting Group publishes many reports and articles on corporate development and value creation that may be of interest to senior executives. Examples include the following.
How Digital CFOs Are Transforming FinanceAn article by The Boston Consulting Group, November 2017
How Premium Conglomerates Sustain Success An article by The Boston Consulting Group, November 2017
Total Societal Impact: A New Lens for StrategyA report by The Boston Consulting Group, October 2017
The 2017 M&A Report: The Technology TakeoverA report by The Boston Consulting Group, September 2017
Three Ways to Beat the Odds with Capex InvestmentsAn article by The Boston Consulting Group, September 2017
CFO Excellence Series: The Art of Performance ManagementA Focus by The Boston Consulting Group, April 2017
CFO Excellence Series: The Art of PlanningA Focus by The Boston Consulting Group, April 2017
CFO Excellence Series: The Art of Risk ManagementA Focus by The Boston Consulting Group, April 2017
CFO Excellence Series: The Art of Capital Allocation An article by The Boston Consulting Group, March 2017
The Real Deal on M&A, Synergies, and ValueAn article by The Boston Consulting Group, November 2016
The 2016 Value Creators Report: Creating Value Through Active Portfolio ManagementA report by The Boston Consulting Group, October 2016
Corporate Venturing Shifts Gears: How the Largest Companies Apply a Broad Set of Tools to Speed InnovationA Focus by The Boston Consulting Group, April 2016
Shareholder Activism in Silicon ValleyA Focus by The Boston Consulting Group, February 2016
To Centralize or Not to Centralize?An article by The Boston Consulting Group, December 2015
Winning Moves in the Age of Shareholder ActivismA Focus by The Boston Consulting Group, August 2015
The 2015 Value Creators Report: Value Creation for the Rest of UsA report by The Boston Consulting Group, July 2015
FOR FURTHER READING

40 | Disruption and Reinvention in Value Creation
NOTE TO THE READER
About the AuthorsGerry Hansell is a senior partner and managing director in the Chicago office of The Boston Consulting Group. Jeffrey Kotzen is a senior partner and managing director in the firm’s New Jersey office. Alexander Roos is a senior partner and managing director in BCG’s Berlin office. Eric Wick is a senior partner and managing director in the firm’s Chicago office. Jody Foldesy is a partner and managing director in BCG’s Los Angeles office. Eric Olsen is a senior advisor in the firm’s Chicago office. Sam Farley is a principal in BCG’s Los Angeles office. Martin Link is a knowledge expert in the firm’s Munich office. Hady Farag is a principal in BCG’s New York office.
AcknowledgmentsThe authors are grateful to Qiang Liu and Eva Klement for their assistance with this report. They thank David Duffy for his help writing the report and Tan Nguyen for her assistance with marketing. They are also grateful to Katherine Andrews, Gary Callahan, Angela DiBattista, Kim Friedman, Abby Garland, Gina Goldstein, Steven Gray, Sean Hourihan, Trudy Neuhaus, and David Purcell for their assistance with the report’s editing, design, and production.
For Further ContactFor further information about the report or to learn more about BCG’s capabilities in corporate develop-ment and value management, please contact one of the following authors.
Gerry Hansell Senior Partner and Managing DirectorBCG Chicago +1 312 993 [email protected]
Jeffrey KotzenSenior Partner and Managing DirectorBCG New Jersey +1 973 218 [email protected]
Alexander Roos Senior Partner and Managing DirectorBCG Berlin +49 30 28 87 [email protected]
Eric WickSenior Partner and Managing DirectorBCG Chicago +1 312 993 [email protected]
Hady Farag PrincipalBCG New York+1 212 446 [email protected]

© The Boston Consulting Group, Inc. 2018. All rights reserved.
For information or permission to reprint, please contact BCG at:E-mail: [email protected]: +1 617 850 3901, attention BCG/PermissionsMail: BCG/Permissions The Boston Consulting Group, Inc. One Beacon Street Boston, MA 02108 USA
To find the latest BCG content and register to receive e-alerts on this topic or others, please visit bcg.com. Follow The Boston Consulting Group on Facebook and Twitter.
6/18

Disruption
and R
einven
tion in
Value Creation
The 2017 Value Creators R
eport
bcg.com