th street/u street/new hampshire avenue · hcm signalized intersection capacity analysis 1100: u st...
TRANSCRIPT

Appendix A1 16th Street/U Street/New Hampshire Avenue:
Intersection LOS Reports

HCM Signalized Intersection Capacity Analysis1100: U ST & NEW HAMPSHIRE AVE 3/2/2012
U Street at 16th Street 8:00 am 5/21/2009 AM Peak Hour - Before Installation of Bicycle Facilities Synchro 7 - ReportSWA Page 1
Movement EBL2 EBL EBT EBR EBR2 WBL2 WBL WBT WBR WBR2 NBT NBR2Lane ConfigurationsVolume (vph) 14 1 324 36 2 42 43 635 58 2 313 31Ideal Flow (vphpl) 1900 1900 1900 1900 1900 1900 1900 1900 1900 1900 1900 1900Total Lost time (s) 3.0 3.0 3.0Lane Util. Factor 0.95 0.95 0.95Frpb, ped/bikes 0.94 0.97 0.99Flpb, ped/bikes 1.00 0.98 1.00Frt 0.98 0.99 0.99Flt Protected 1.00 0.99 1.00Satd. Flow (prot) 2943 2970 3111Flt Permitted 0.90 0.81 1.00Satd. Flow (perm) 2664 2407 3111Peak-hour factor, PHF 0.90 0.90 0.90 0.90 0.90 0.90 0.90 0.90 0.90 0.90 0.90 0.90Adj. Flow (vph) 16 1 360 40 2 47 48 706 64 2 348 34RTOR Reduction (vph) 0 0 0 0 0 0 0 0 0 0 8 0Lane Group Flow (vph) 0 0 419 0 0 0 0 867 0 0 375 0Confl. Peds. (#/hr) 150 139 211 247 211 247 150 139 167Confl. Bikes (#/hr) 24Turn Type Perm Perm pm+pt pm+ptProtected Phases 2 1 1 6 8Permitted Phases 2 2 6 6Actuated Green, G (s) 30.0 41.0 48.0Effective Green, g (s) 33.0 44.0 50.0Actuated g/C Ratio 0.33 0.44 0.50Clearance Time (s) 6.0 6.0 5.0Lane Grp Cap (vph) 879 1115 1556v/s Ratio Prot c0.08 0.12v/s Ratio Perm 0.16 0.26v/c Ratio 0.48 0.78 0.24Uniform Delay, d1 26.6 23.8 14.2Progression Factor 1.00 1.00 1.00Incremental Delay, d2 1.9 5.4 0.4Delay (s) 28.5 29.2 14.6Level of Service C C BApproach Delay (s) 28.5 29.2 14.6Approach LOS C C B
Intersection SummaryHCM Average Control Delay 56.2 HCM Level of Service EHCM Volume to Capacity ratio 0.91Actuated Cycle Length (s) 100.0 Sum of lost time (s) 6.0Intersection Capacity Utilization 115.8% ICU Level of Service HAnalysis Period (min) 15c Critical Lane Group

HCM Signalized Intersection Capacity Analysis1100: U ST & NEW HAMPSHIRE AVE 3/2/2012
U Street at 16th Street 8:00 am 5/21/2009 AM Peak Hour - Before Installation of Bicycle Facilities Synchro 7 - ReportSWA Page 2
Movement SBL SBT SBR SBR2Lane ConfigurationsVolume (vph) 1 1170 213 25Ideal Flow (vphpl) 1900 1900 1900 1900Total Lost time (s) 3.0Lane Util. Factor 0.95Frpb, ped/bikes 0.94Flpb, ped/bikes 1.00Frt 0.97Flt Protected 1.00Satd. Flow (prot) 2928Flt Permitted 0.95Satd. Flow (perm) 2796Peak-hour factor, PHF 0.90 0.90 0.90 0.90Adj. Flow (vph) 1 1300 237 28RTOR Reduction (vph) 0 2 0 0Lane Group Flow (vph) 0 1565 0 0Confl. Peds. (#/hr) 167 247 322Confl. Bikes (#/hr) 89Turn Type PermProtected Phases 4Permitted Phases 4Actuated Green, G (s) 48.0Effective Green, g (s) 50.0Actuated g/C Ratio 0.50Clearance Time (s) 5.0Lane Grp Cap (vph) 1398v/s Ratio Protv/s Ratio Perm c0.56v/c Ratio 1.12Uniform Delay, d1 25.0Progression Factor 1.00Incremental Delay, d2 63.8Delay (s) 88.8Level of Service FApproach Delay (s) 88.8Approach LOS F
Intersection Summary

HCM Signalized Intersection Capacity Analysis1100: U ST & NEW HAMPSHIRE AVE 3/2/2012
U Street at 16th Street 5:00 pm 5/21/2009 PM Peak Hour - Before Installation of Bicycle Facilities Synchro 7 - ReportPage 1
Movement EBL2 EBL EBT EBR EBR2 WBL2 WBL WBT WBR WBR2 NBL NBTLane ConfigurationsVolume (vph) 23 16 447 32 6 22 54 618 82 1 1 857Ideal Flow (vphpl) 1900 1900 1900 1900 1900 1900 1900 1900 1900 1900 1900 1900Total Lost time (s) 3.0 3.0 3.0Lane Util. Factor 0.95 0.95 0.95Frpb, ped/bikes 0.96 0.97 0.99Flpb, ped/bikes 0.99 0.99 1.00Frt 0.99 0.98 0.99Flt Protected 1.00 1.00 1.00Satd. Flow (prot) 2986 2973 3136Flt Permitted 0.83 0.76 0.95Satd. Flow (perm) 2486 2260 2993Peak-hour factor, PHF 0.90 0.90 0.90 0.90 0.90 0.90 0.90 0.90 0.90 0.90 0.90 0.90Adj. Flow (vph) 26 18 497 36 7 24 60 687 91 1 1 952RTOR Reduction (vph) 0 0 1 0 0 0 0 0 0 0 0 5Lane Group Flow (vph) 0 0 583 0 0 0 0 863 0 0 0 1008Confl. Peds. (#/hr) 138 83 290 231 290 231 138 83 127Confl. Bikes (#/hr) 34Turn Type Perm Perm pm+pt pm+pt PermProtected Phases 2 1 1 6 8Permitted Phases 2 2 6 6 8Actuated Green, G (s) 30.0 41.0 48.0Effective Green, g (s) 33.0 44.0 50.0Actuated g/C Ratio 0.33 0.44 0.50Clearance Time (s) 6.0 6.0 5.0Lane Grp Cap (vph) 820 1066 1497v/s Ratio Prot c0.08v/s Ratio Perm c0.23 0.28 c0.34v/c Ratio 0.71 0.81 0.67Uniform Delay, d1 29.3 24.4 18.8Progression Factor 1.00 1.00 1.00Incremental Delay, d2 5.2 6.7 2.4Delay (s) 34.5 31.0 21.3Level of Service C C CApproach Delay (s) 34.5 31.0 21.3Approach LOS C C C
Intersection SummaryHCM Average Control Delay 26.0 HCM Level of Service CHCM Volume to Capacity ratio 0.70Actuated Cycle Length (s) 100.0 Sum of lost time (s) 9.0Intersection Capacity Utilization 109.2% ICU Level of Service HAnalysis Period (min) 15c Critical Lane Group

HCM Signalized Intersection Capacity Analysis1100: U ST & NEW HAMPSHIRE AVE 3/2/2012
U Street at 16th Street 5:00 pm 5/21/2009 PM Peak Hour - Before Installation of Bicycle Facilities Synchro 7 - ReportPage 2
Movement NBR2 SBL SBT SBR SBR2Lane ConfigurationsVolume (vph) 53 4 686 24 134Ideal Flow (vphpl) 1900 1900 1900 1900 1900Total Lost time (s) 3.0Lane Util. Factor 0.95Frpb, ped/bikes 0.95Flpb, ped/bikes 1.00Frt 0.97Flt Protected 1.00Satd. Flow (prot) 2954Flt Permitted 0.95Satd. Flow (perm) 2812Peak-hour factor, PHF 0.90 0.90 0.90 0.90 0.90Adj. Flow (vph) 59 4 762 27 149RTOR Reduction (vph) 0 0 16 0 0Lane Group Flow (vph) 0 0 927 0 0Confl. Peds. (#/hr) 171 171 231 127Confl. Bikes (#/hr) 46Turn Type PermProtected Phases 4Permitted Phases 4Actuated Green, G (s) 48.0Effective Green, g (s) 50.0Actuated g/C Ratio 0.50Clearance Time (s) 5.0Lane Grp Cap (vph) 1406v/s Ratio Protv/s Ratio Perm 0.33v/c Ratio 0.66Uniform Delay, d1 18.6Progression Factor 1.00Incremental Delay, d2 2.4Delay (s) 21.1Level of Service CApproach Delay (s) 21.1Approach LOS C
Intersection Summary

HCM Signalized Intersection Capacity Analysis1100: U ST & NEW HAMPSHIRE AVE 3/2/2012
U Street at 16th Street 8:00 am 5/21/2009 AM Peak Hour - After Installation of Bicycle Facilities Synchro 7 - ReportA. May Page 1
Movement EBL2 EBL EBT EBR EBR2 WBL2 WBL WBT WBR WBR2 NBT NBR2Lane ConfigurationsVolume (vph) 14 1 324 36 2 42 43 635 58 2 313 31Ideal Flow (vphpl) 1900 1900 1900 1900 1900 1900 1900 1900 1900 1900 1900 1900Total Lost time (s) 3.0 3.0 3.0Lane Util. Factor 0.95 0.95 0.95Frpb, ped/bikes 0.94 0.97 0.99Flpb, ped/bikes 1.00 0.98 1.00Frt 0.98 0.99 0.99Flt Protected 1.00 0.99 1.00Satd. Flow (prot) 2943 2977 3111Flt Permitted 0.90 0.74 1.00Satd. Flow (perm) 2648 2207 3111Peak-hour factor, PHF 0.90 0.90 0.90 0.90 0.90 0.90 0.90 0.90 0.90 0.90 0.90 0.90Adj. Flow (vph) 16 1 360 40 2 47 48 706 64 2 348 34RTOR Reduction (vph) 0 0 0 0 0 0 0 0 0 0 7 0Lane Group Flow (vph) 0 0 419 0 0 0 0 867 0 0 375 0Confl. Peds. (#/hr) 150 139 211 247 211 247 150 139 167Confl. Bikes (#/hr) 24Turn Type Perm Perm pm+pt pm+ptProtected Phases 2 1 1 6 8Permitted Phases 2 2 6 6Actuated Green, G (s) 20.0 31.0 47.0Effective Green, g (s) 23.0 34.0 49.0Actuated g/C Ratio 0.23 0.34 0.49Clearance Time (s) 6.0 6.0 5.0Lane Grp Cap (vph) 609 827 1524v/s Ratio Prot c0.10 0.12v/s Ratio Perm 0.16 0.25v/c Ratio 0.69 1.05 0.25Uniform Delay, d1 35.2 33.0 14.8Progression Factor 1.00 1.00 1.00Incremental Delay, d2 6.2 44.7 0.4Delay (s) 41.5 77.7 15.2Level of Service D E BApproach Delay (s) 41.5 77.7 15.2Approach LOS D E B
Intersection SummaryHCM Average Control Delay 75.8 HCM Level of Service EHCM Volume to Capacity ratio 1.03Actuated Cycle Length (s) 100.0 Sum of lost time (s) 17.0Intersection Capacity Utilization 115.8% ICU Level of Service HAnalysis Period (min) 15c Critical Lane Group

HCM Signalized Intersection Capacity Analysis1100: U ST & NEW HAMPSHIRE AVE 3/2/2012
U Street at 16th Street 8:00 am 5/21/2009 AM Peak Hour - After Installation of Bicycle Facilities Synchro 7 - ReportA. May Page 2
Movement SBL SBT SBR SBR2Lane ConfigurationsVolume (vph) 1 1170 213 25Ideal Flow (vphpl) 1900 1900 1900 1900Total Lost time (s) 3.0Lane Util. Factor 0.95Frpb, ped/bikes 0.94Flpb, ped/bikes 1.00Frt 0.97Flt Protected 1.00Satd. Flow (prot) 2928Flt Permitted 0.95Satd. Flow (perm) 2796Peak-hour factor, PHF 0.90 0.90 0.90 0.90Adj. Flow (vph) 1 1300 237 28RTOR Reduction (vph) 0 1 0 0Lane Group Flow (vph) 0 1565 0 0Confl. Peds. (#/hr) 167 247 322Confl. Bikes (#/hr) 89Turn Type PermProtected Phases 4Permitted Phases 4Actuated Green, G (s) 47.0Effective Green, g (s) 49.0Actuated g/C Ratio 0.49Clearance Time (s) 5.0Lane Grp Cap (vph) 1370v/s Ratio Protv/s Ratio Perm c0.56v/c Ratio 1.14Uniform Delay, d1 25.5Progression Factor 1.00Incremental Delay, d2 73.3Delay (s) 98.8Level of Service FApproach Delay (s) 98.8Approach LOS F
Intersection Summary

HCM Signalized Intersection Capacity Analysis1100: U ST & NEW HAMPSHIRE AVE 3/2/2012
U Street at 16th Street 5:00 pm 5/21/2009 PM Peak Hour - After Installation of Bicycle Facilities Synchro 7 - ReportPage 1
Movement EBL2 EBL EBT EBR EBR2 WBL2 WBL WBT WBR WBR2 NBL NBTLane ConfigurationsVolume (vph) 23 16 447 32 6 22 54 618 82 1 1 857Ideal Flow (vphpl) 1900 1900 1900 1900 1900 1900 1900 1900 1900 1900 1900 1900Total Lost time (s) 3.0 3.0 3.0Lane Util. Factor 0.95 0.95 0.95Frpb, ped/bikes 0.96 0.97 0.99Flpb, ped/bikes 0.99 0.99 1.00Frt 0.99 0.98 0.99Flt Protected 1.00 1.00 1.00Satd. Flow (prot) 2987 2974 3136Flt Permitted 0.83 0.75 0.95Satd. Flow (perm) 2485 2230 2993Peak-hour factor, PHF 0.90 0.90 0.90 0.90 0.90 0.90 0.90 0.90 0.90 0.90 0.90 0.90Adj. Flow (vph) 26 18 497 36 7 24 60 687 91 1 1 952RTOR Reduction (vph) 0 0 1 0 0 0 0 0 0 0 0 5Lane Group Flow (vph) 0 0 583 0 0 0 0 863 0 0 0 1007Confl. Peds. (#/hr) 138 83 290 231 290 231 138 83 127Confl. Bikes (#/hr) 34Turn Type Perm Perm pm+pt pm+pt PermProtected Phases 2 1 1 6 8Permitted Phases 2 2 6 6 8Actuated Green, G (s) 29.0 39.0 39.0Effective Green, g (s) 32.0 42.0 41.0Actuated g/C Ratio 0.32 0.42 0.41Clearance Time (s) 6.0 6.0 5.0Lane Grp Cap (vph) 795 1004 1227v/s Ratio Prot c0.08v/s Ratio Perm c0.23 0.28 c0.34v/c Ratio 0.73 0.86 0.82Uniform Delay, d1 30.2 26.3 26.2Progression Factor 1.00 1.00 1.00Incremental Delay, d2 5.9 9.5 6.2Delay (s) 36.2 35.9 32.5Level of Service D D CApproach Delay (s) 36.2 35.9 32.5Approach LOS D D C
Intersection SummaryHCM Average Control Delay 33.8 HCM Level of Service CHCM Volume to Capacity ratio 0.79Actuated Cycle Length (s) 100.0 Sum of lost time (s) 20.0Intersection Capacity Utilization 109.2% ICU Level of Service HAnalysis Period (min) 15c Critical Lane Group

HCM Signalized Intersection Capacity Analysis1100: U ST & NEW HAMPSHIRE AVE 3/2/2012
U Street at 16th Street 5:00 pm 5/21/2009 PM Peak Hour - After Installation of Bicycle Facilities Synchro 7 - ReportPage 2
Movement NBR2 SBL SBT SBR SBR2Lane ConfigurationsVolume (vph) 53 4 686 24 134Ideal Flow (vphpl) 1900 1900 1900 1900 1900Total Lost time (s) 3.0Lane Util. Factor 0.95Frpb, ped/bikes 0.95Flpb, ped/bikes 1.00Frt 0.97Flt Protected 1.00Satd. Flow (prot) 2952Flt Permitted 0.95Satd. Flow (perm) 2809Peak-hour factor, PHF 0.90 0.90 0.90 0.90 0.90Adj. Flow (vph) 59 4 762 27 149RTOR Reduction (vph) 0 0 15 0 0Lane Group Flow (vph) 0 0 927 0 0Confl. Peds. (#/hr) 171 171 231 127Confl. Bikes (#/hr) 46Turn Type PermProtected Phases 4Permitted Phases 4Actuated Green, G (s) 39.0Effective Green, g (s) 41.0Actuated g/C Ratio 0.41Clearance Time (s) 5.0Lane Grp Cap (vph) 1152v/s Ratio Protv/s Ratio Perm 0.33v/c Ratio 0.80Uniform Delay, d1 26.0Progression Factor 1.00Incremental Delay, d2 6.0Delay (s) 32.0Level of Service CApproach Delay (s) 32.0Approach LOS C
Intersection Summary

Appendix A2 16th Street/U Street/New Hampshire Avenue: Bicycle
Count Data


U StreetU Street
16th
Str
eet
16th
Str
eet
[8](
0) 0
[1] (
0) 0
[2] (
10) 9
[0] (
1) 0
[3] (
12) 2
0 (2
) [2]
31 (1
2) [1
6]30
(4) [
40]
4 (2
) [1]
0 (0
) [0]
0 (0) [0]0 (0) [0]9 (10) [16]7 (1) [7]0 (0) [0]
[0](1) 1[0](0) 0
[0](8) 11[0] (6) 1[2] (0) 0
NXX (XX) [XX] - AM (PM) [SAT] Peak Hour Bicycle Volumes

Sabra-Wang & Associates, Inc.
1504 Joh Avenue, Suite 160
Baltimore, Maryland 21227
(410)-737-6564
File Name : BICYCLESSite Code : 00000000Start Date : 04/28/2010Page No : 1
Weather:SUNNYCounted By:MO, DEB, SN, HOTown: WASHINGTON D.C.County:
Groups Printed- BICYCLES
16th Street
From North
U STREET
From East
16th Street
From South
U STREET
From West
Start Time LeftThr
u
Rig
ht
Ped
s
App.
TotalLeft
Thr
u
Rig
ht
Ped
s
App.
TotalLeft
Thr
u
Rig
ht
Ped
s
App.
TotalLeft
Thr
u
Rig
ht
Ped
s
App.
Total
Int.
Total
Factor 1.0 1.0 1.0 1.0 1.0 1.0 1.0 1.0 1.0 1.0 1.0 1.0 1.0 1.0 1.0 1.0
07:00 0 2 1 0 3 0 0 0 0 0 0 0 1 0 1 0 0 0 0 0 4
07:15 0 0 0 0 0 0 1 0 0 1 0 1 1 0 2 0 1 0 0 1 4
07:30 0 6 0 0 6 0 1 0 0 1 0 1 2 0 3 0 2 1 0 3 13
07:45 0 6 0 0 6 0 0 0 0 0 0 0 0 0 0 0 4 0 0 4 10
Total 0 14 1 0 15 0 2 0 0 2 0 2 4 0 6 0 7 1 0 8 31
08:00 0 3 0 0 3 0 4 0 0 4 0 4 1 0 5 0 4 1 0 5 17
08:15 1 8 0 0 9 0 2 0 0 2 0 2 0 0 2 0 2 0 0 2 15
08:30 1 8 0 0 9 0 2 0 0 2 0 2 1 0 3 0 2 0 0 2 16
08:45 2 11 0 0 13 0 1 0 0 1 0 1 0 0 1 0 3 0 0 3 18
Total 4 30 0 0 34 0 9 0 0 9 0 9 2 0 11 0 11 1 0 12 66
*** BREAK ***
16:00 0 1 0 0 1 0 3 0 0 3 0 3 7 0 10 0 2 0 0 2 16
16:15 1 2 1 0 4 0 4 0 0 4 0 4 2 0 6 0 0 0 0 0 14
16:30 0 0 0 0 0 0 3 1 0 4 0 3 2 0 5 0 2 6 0 8 17
16:45 1 1 1 0 3 0 0 0 0 0 0 0 1 0 1 0 0 0 0 0 4
Total 2 4 2 0 8 0 10 1 0 11 0 10 12 0 22 0 4 6 0 10 51
17:00 1 1 0 0 2 0 2 0 0 2 0 2 3 0 5 0 4 0 0 4 13
17:15 1 1 0 0 2 0 3 0 0 3 0 3 3 0 6 0 0 0 0 0 11
17:30 0 1 0 0 1 0 5 0 0 5 0 5 2 0 7 0 1 0 0 1 14
17:45 0 2 0 0 2 0 3 1 0 4 0 3 2 0 5 0 1 0 0 1 12
Total 2 5 0 0 7 0 13 1 0 14 0 13 10 0 23 0 6 0 0 6 50
Grand
Total8 53 3 0 64 0 34 2 0 36 0 34 28 0 62 0 28 8 0 36 198
Apprch % 12.5 82.8 4.7 0.0 0.0 94.4 5.6 0.0 0.0 54.8 45.2 0.0 0.0 77.8 22.2 0.0
Total % 4.0 26.8 1.5 0.0 32.3 0.0 17.2 1.0 0.0 18.2 0.0 17.2 14.1 0.0 31.3 0.0 14.1 4.0 0.0 18.2

Sabra-Wang & Associates, Inc.
1504 Joh Avenue, Suite 160
Baltimore, Maryland 21227
(410)-737-6564
File Name : BICYCLESSite Code : 00000000Start Date : 04/28/2010Page No : 2
16th Street
U S
TR
EE
T U
ST
RE
ET
16th Street
Right3
Thru53
Left8
Peds0
InOut Total36 64 100
Rig
ht 2
Thru 3
4
Left 0
P
eds 0
Out
Tota
lIn
64
36
100
Left0
Thru34
Right28
Peds0
Out TotalIn61 62 123
Left0
Thru2
8
Rig
ht8
Peds0
Tota
lO
ut
In37
36
73
4/28/2010 7:00:00 AM4/28/2010 5:45:00 PM BICYCLES
North

Sabra-Wang & Associates, Inc.
1504 Joh Avenue, Suite 160
Baltimore, Maryland 21227
(410)-737-6564
File Name : BICYCLESSite Code : 00000000Start Date : 04/28/2010Page No : 3
16th Street
From North
U STREET
From East
16th Street
From South
U STREET
From West
Start Time LeftThr
u
Rig
ht
Ped
s
App.
TotalLeft
Thr
u
Rig
ht
Ped
s
App.
TotalLeft
Thr
u
Rig
ht
Ped
s
App.
TotalLeft
Thr
u
Rig
ht
Ped
s
App.
Total
Int.
Total
Peak Hour From 07:00 to 11:45 - Peak 1 of 1
Intersectio
n08:00
Volume 4 30 0 0 34 0 9 0 0 9 0 9 2 0 11 0 11 1 0 12 66
Percent 11.8 88.2 0.0 0.0 0.0100.
00.0 0.0 0.0 81.8 18.2 0.0 0.0 91.7 8.3 0.0
Volume 4 30 0 0 34 0 9 0 0 9 0 9 2 0 11 0 11 1 0 12 66
Volume 2 11 0 0 13 0 1 0 0 1 0 1 0 0 1 0 3 0 0 3 18
Peak
Factor
0.917
High Int. 08:45 08:00 08:00 08:00
Volume 2 11 0 0 13 0 4 0 0 4 0 4 1 0 5 0 4 1 0 5
Peak
Factor0.654 0.563 0.550 0.600
16th Street
U S
TR
EE
T U
ST
RE
ET
16th Street
Right0
Thru30
Left4
Peds0
InOut Total9 34 43
Rig
ht 0
Thru 9
Left 0
P
eds 0
Out
Tota
lIn
17
9
26
Left0
Thru9
Right2
Peds0
Out TotalIn31 11 42
Left0
Thru1
1
Rig
ht1
Peds0
Tota
lO
ut
In9
12
21
4/28/2010 8:00:00 AM4/28/2010 8:45:00 AM BICYCLES
North

Sabra-Wang & Associates, Inc.
1504 Joh Avenue, Suite 160
Baltimore, Maryland 21227
(410)-737-6564
File Name : BICYCLESSite Code : 00000000Start Date : 04/28/2010Page No : 4
16th Street
From North
U STREET
From East
16th Street
From South
U STREET
From West
Start Time LeftThr
u
Rig
ht
Ped
s
App.
TotalLeft
Thr
u
Rig
ht
Ped
s
App.
TotalLeft
Thr
u
Rig
ht
Ped
s
App.
TotalLeft
Thr
u
Rig
ht
Ped
s
App.
Total
Int.
Total
Peak Hour From 07:00 to 11:45 - Peak 1 of 1
By
Approach08:00 08:00 08:00 07:30
Volume 4 30 0 0 34 0 9 0 0 9 0 9 2 0 11 0 12 2 0 14
Percent 11.8 88.2 0.0 0.0 0.0100.
00.0 0.0 0.0 81.8 18.2 0.0 0.0 85.7 14.3 0.0
High Int. 08:45 08:00 08:00 08:00
Volume 2 11 0 0 13 0 4 0 0 4 0 4 1 0 5 0 4 1 0 5
Peak
Factor0.654 0.563 0.550 0.700
16th Street
U S
TR
EE
T U
ST
RE
ET
16th Street
Right0
Thru30
Left4
Peds0
In34
Rig
ht 0
Thru 9
Left 0
P
eds 0
In
9
Left0
Thru9
Right2
Peds0
In11
Left0
Thru1
2
Rig
ht2
Peds0
In14
BICYCLES
North

Sabra-Wang & Associates, Inc.
1504 Joh Avenue, Suite 160
Baltimore, Maryland 21227
(410)-737-6564
File Name : BICYCLESSite Code : 00000000Start Date : 04/28/2010Page No : 5
16th Street
From North
U STREET
From East
16th Street
From South
U STREET
From West
Start Time LeftThr
u
Rig
ht
Ped
s
App.
TotalLeft
Thr
u
Rig
ht
Ped
s
App.
TotalLeft
Thr
u
Rig
ht
Ped
s
App.
TotalLeft
Thr
u
Rig
ht
Ped
s
App.
Total
Int.
Total
Peak Hour From 12:00 to 17:45 - Peak 1 of 1
Intersectio
n16:00
Volume 2 4 2 0 8 0 10 1 0 11 0 10 12 0 22 0 4 6 0 10 51
Percent 25.0 50.0 25.0 0.0 0.0 90.9 9.1 0.0 0.0 45.5 54.5 0.0 0.0 40.0 60.0 0.0
Volume 2 4 2 0 8 0 10 1 0 11 0 10 12 0 22 0 4 6 0 10 51
Volume 0 0 0 0 0 0 3 1 0 4 0 3 2 0 5 0 2 6 0 8 17
Peak
Factor
0.750
High Int. 16:15 16:15 16:00 16:30
Volume 1 2 1 0 4 0 4 0 0 4 0 3 7 0 10 0 2 6 0 8
Peak
Factor0.500 0.688 0.550 0.313
16th Street
U S
TR
EE
T U
ST
RE
ET
16th Street
Right2
Thru4
Left2
Peds0
InOut Total11 8 19
Rig
ht 1
Thru 1
0
Left 0
P
eds 0
Out
Tota
lIn
18
11
29
Left0
Thru10
Right12
Peds0
Out TotalIn10 22 32
Left0
Thru
4
Rig
ht6
Peds0
Tota
lO
ut
In12
10
22
4/28/2010 4:00:00 PM4/28/2010 4:45:00 PM BICYCLES
North

Sabra-Wang & Associates, Inc.
1504 Joh Avenue, Suite 160
Baltimore, Maryland 21227
(410)-737-6564
File Name : BICYCLESSite Code : 00000000Start Date : 04/28/2010Page No : 6
16th Street
From North
U STREET
From East
16th Street
From South
U STREET
From West
Start Time LeftThr
u
Rig
ht
Ped
s
App.
TotalLeft
Thr
u
Rig
ht
Ped
s
App.
TotalLeft
Thr
u
Rig
ht
Ped
s
App.
TotalLeft
Thr
u
Rig
ht
Ped
s
App.
Total
Int.
Total
Peak Hour From 12:00 to 17:45 - Peak 1 of 1
By
Approach16:15 17:00 17:00 16:15
Volume 3 4 2 0 9 0 13 1 0 14 0 13 10 0 23 0 6 6 0 12
Percent 33.3 44.4 22.2 0.0 0.0 92.9 7.1 0.0 0.0 56.5 43.5 0.0 0.0 50.0 50.0 0.0
High Int. 16:15 17:30 17:30 16:30
Volume 1 2 1 0 4 0 5 0 0 5 0 5 2 0 7 0 2 6 0 8
Peak
Factor0.563 0.700 0.821 0.375
16th Street
U S
TR
EE
T U
ST
RE
ET
16th Street
Right2
Thru4
Left3
Peds0
In9
Rig
ht 1
Thru 1
3
Left 0
P
eds 0
In
14
Left0
Thru13
Right10
Peds0
In23
Left0
Thru
6
Rig
ht6
Pe
ds0
In12
BICYCLES
North

Sabra-Wang & Associates, Inc.
1504 Joh Avenue, Suite 160
Baltimore, Maryland 21227
(410)-737-6564
File Name : BICYCLES FROM N.H.AVE.Site Code : 00000000Start Date : 04/28/2010Page No : 1
Weather:SUNNYCounted By:MO, DEB, SN, HOTown: WASHINGTON D.C.County:
Groups Printed- BICYCLES FROM N.H. AVE
16th Street
From North
NEW HAMPSHIRE AVE.
From East
16th Street
From South
NEW HAMPSHIRE AVE.
From West
Start Time LeftThr
u
Rig
ht
Ped
s
App.
TotalLeft
Thr
u
Rig
ht
Left
to
East
App.
TotalLeft
Thr
u
Rig
ht
Ped
s
App.
TotalLeft
Thr
u
Rig
ht
Rig
ht to
Sou
th
App.
Total
Int.
Total
Factor 1.0 1.0 1.0 1.0 1.0 1.0 1.0 1.0 1.0 1.0 1.0 1.0 1.0 1.0 1.0 1.0
*** BREAK ***
07:15 0 0 0 0 0 0 6 0 0 6 0 0 0 0 0 1 0 1 0 2 8
07:30 0 0 0 0 0 0 4 0 0 4 0 0 0 0 0 0 0 0 0 0 4
07:45 0 0 0 0 0 0 8 0 0 8 0 0 0 0 0 0 0 0 1 1 9
Total 0 0 0 0 0 0 18 0 0 18 0 0 0 0 0 1 0 1 1 3 21
08:00 0 0 0 0 0 0 10 0 0 10 0 0 0 0 0 0 0 0 0 0 10
08:15 0 0 0 0 0 2 9 0 0 11 0 0 0 0 0 1 0 0 0 1 12
08:30 0 0 0 0 0 0 17 0 0 17 0 0 0 0 0 1 0 1 0 2 19
08:45 0 0 0 0 0 1 13 0 0 14 0 0 0 0 0 0 0 0 0 0 14
Total 0 0 0 0 0 3 49 0 0 52 0 0 0 0 0 2 0 1 0 3 55
*** BREAK ***
16:00 0 0 0 0 0 0 0 0 0 0 0 0 0 0 0 1 2 0 0 3 3
16:15 0 0 0 0 0 0 1 0 0 1 0 0 0 0 0 2 3 0 0 5 6
16:30 0 0 0 0 0 0 0 0 0 0 0 0 0 0 0 3 0 0 0 3 3
16:45 0 0 0 0 0 0 5 0 0 5 0 0 0 0 0 2 0 1 0 3 8
Total 0 0 0 0 0 0 6 0 0 6 0 0 0 0 0 8 5 1 0 14 20
17:00 0 0 0 0 0 0 2 0 0 2 0 0 0 0 0 1 2 1 0 4 6
17:15 0 0 0 0 0 0 1 0 0 1 0 0 0 0 0 3 3 0 0 6 7
17:30 0 0 0 0 0 0 2 0 0 2 0 0 0 0 0 3 0 0 0 3 5
17:45 0 0 0 1 1 0 5 0 1 6 0 0 0 0 0 1 2 1 0 4 11
Total 0 0 0 1 1 0 10 0 1 11 0 0 0 0 0 8 7 2 0 17 29
Grand
Total0 0 0 1 1 3 83 0 1 87 0 0 0 0 0 19 12 5 1 37 125
Apprch % 0.0 0.0 0.0100.
03.4 95.4 0.0 1.1 0.0 0.0 0.0 0.0 51.4 32.4 13.5 2.7
Total % 0.0 0.0 0.0 0.8 0.8 2.4 66.4 0.0 0.8 69.6 0.0 0.0 0.0 0.0 0.0 15.2 9.6 4.0 0.8 29.6

Sabra-Wang & Associates, Inc.
1504 Joh Avenue, Suite 160
Baltimore, Maryland 21227
(410)-737-6564
File Name : BICYCLES FROM N.H.AVE.Site Code : 00000000Start Date : 04/28/2010Page No : 2
16th Street
NE
W H
AM
PS
HIR
E A
VE
. N
EW
HA
MP
SH
IRE
AV
E.
16th Street
Right0
Thru0
Left0
Peds1
InOut Total19 1 20
Rig
ht 0
Thru 8
3
Left 3
Left
to E
ast 1
Out
Tota
lIn
12
87
99
Left0
Thru0
Right0
Peds0
Out TotalIn8 0 8
Left19
Thru1
2
Rig
ht5
Rig
ht
to S
outh1
Tota
lO
ut
In83
37
120
4/28/2010 7:00:00 AM4/28/2010 5:45:00 PM BICYCLES FROM N.H. AVE
North

Sabra-Wang & Associates, Inc.
1504 Joh Avenue, Suite 160
Baltimore, Maryland 21227
(410)-737-6564
File Name : BICYCLES FROM N.H.AVE.Site Code : 00000000Start Date : 04/28/2010Page No : 3
16th Street
From North
NEW HAMPSHIRE AVE.
From East
16th Street
From South
NEW HAMPSHIRE AVE.
From West
Start Time LeftThr
u
Rig
ht
Ped
s
App.
TotalLeft
Thr
u
Rig
ht
Left
to
East
App.
TotalLeft
Thr
u
Rig
ht
Ped
s
App.
TotalLeft
Thr
u
Rig
ht
Rig
ht to
Sou
th
App.
Total
Int.
Total
Peak Hour From 07:00 to 11:45 - Peak 1 of 1
Intersectio
n08:00
Volume 0 0 0 0 0 3 49 0 0 52 0 0 0 0 0 2 0 1 0 3 55
Percent 0.0 0.0 0.0 0.0 5.8 94.2 0.0 0.0 0.0 0.0 0.0 0.0 66.7 0.0 33.3 0.0
Volume 0 0 0 0 0 3 49 0 0 52 0 0 0 0 0 2 0 1 0 3 55
Volume 0 0 0 0 0 0 17 0 0 17 0 0 0 0 0 1 0 1 0 2 19
Peak
Factor
0.724
High Int. 6:45:00 AM 08:30 6:45:00 AM 08:30
Volume 0 0 0 0 0 0 17 0 0 17 0 0 0 0 0 1 0 1 0 2
Peak
Factor0.765 0.375
16th Street
NE
W H
AM
PS
HIR
E A
VE
. N
EW
HA
MP
SH
IRE
AV
E.
16th Street
Right0
Thru0
Left0
Peds0
InOut Total2 0 2
Rig
ht 0
Thru 4
9
Left 3
Left
to E
ast 0
Out
Tota
lIn
0
52
52
Left0
Thru0
Right0
Peds0
Out TotalIn4 0 4
Left2
Thru
0
Rig
ht1
Rig
ht
to S
outh0
Tota
lO
ut
In49
3
52
4/28/2010 8:00:00 AM4/28/2010 8:45:00 AM BICYCLES FROM N.H. AVE
North

Sabra-Wang & Associates, Inc.
1504 Joh Avenue, Suite 160
Baltimore, Maryland 21227
(410)-737-6564
File Name : BICYCLES FROM N.H.AVE.Site Code : 00000000Start Date : 04/28/2010Page No : 4
16th Street
From North
NEW HAMPSHIRE AVE.
From East
16th Street
From South
NEW HAMPSHIRE AVE.
From West
Start Time LeftThr
u
Rig
ht
Ped
s
App.
TotalLeft
Thr
u
Rig
ht
Left
to
East
App.
TotalLeft
Thr
u
Rig
ht
Ped
s
App.
TotalLeft
Thr
u
Rig
ht
Rig
ht to
Sou
th
App.
Total
Int.
Total
Peak Hour From 07:00 to 11:45 - Peak 1 of 1
By
Approach07:00 08:00 07:00 07:45
Volume 0 0 0 0 0 3 49 0 0 52 0 0 0 0 0 2 0 1 1 4
Percent - - - - 5.8 94.2 0.0 0.0 - - - - 50.0 0.0 25.0 25.0
High Int. - 08:30 - 08:30
Volume - - - - - 0 17 0 0 17 - - - - - 1 0 1 0 2
Peak
Factor- 0.765 - 0.500
16th Street
NE
W H
AM
PS
HIR
E A
VE
. N
EW
HA
MP
SH
IRE
AV
E.
16th Street
Right0
Thru0
Left0
Peds0
In0
Rig
ht 0
Thru 4
9
Left 3
Left
to E
ast 0
In
52
Left0
Thru0
Right0
Peds0
In0
Left2
Thru
0
Rig
ht1
Rig
ht
to S
outh1
In4
BICYCLES FROM N.H. AVE
North

Sabra-Wang & Associates, Inc.
1504 Joh Avenue, Suite 160
Baltimore, Maryland 21227
(410)-737-6564
File Name : BICYCLES FROM N.H.AVE.Site Code : 00000000Start Date : 04/28/2010Page No : 5
16th Street
From North
NEW HAMPSHIRE AVE.
From East
16th Street
From South
NEW HAMPSHIRE AVE.
From West
Start Time LeftThr
u
Rig
ht
Ped
s
App.
TotalLeft
Thr
u
Rig
ht
Left
to
East
App.
TotalLeft
Thr
u
Rig
ht
Ped
s
App.
TotalLeft
Thr
u
Rig
ht
Rig
ht to
Sou
th
App.
Total
Int.
Total
Peak Hour From 12:00 to 17:45 - Peak 1 of 1
Intersectio
n17:00
Volume 0 0 0 1 1 0 10 0 1 11 0 0 0 0 0 8 7 2 0 17 29
Percent 0.0 0.0 0.0100.
00.0 90.9 0.0 9.1 0.0 0.0 0.0 0.0 47.1 41.2 11.8 0.0
Volume 0 0 0 1 1 0 10 0 1 11 0 0 0 0 0 8 7 2 0 17 29
Volume 0 0 0 1 1 0 5 0 1 6 0 0 0 0 0 1 2 1 0 4 11
Peak
Factor
0.659
High Int. 17:45 17:45 17:15
Volume 0 0 0 1 1 0 5 0 1 6 0 0 0 0 0 3 3 0 0 6
Peak
Factor0.250 0.458 0.708
16th Street
NE
W H
AM
PS
HIR
E A
VE
. N
EW
HA
MP
SH
IRE
AV
E.
16th Street
Right0
Thru0
Left0
Peds1
InOut Total8 1 9
Rig
ht 0
Thru 1
0
Left 0
Left
to E
ast 1
Out
Tota
lIn
7
11
18
Left0
Thru0
Right0
Peds0
Out TotalIn2 0 2
Left8
Thru
7
Rig
ht2
Rig
ht
to S
outh0
Tota
lO
ut
In10
17
27
4/28/2010 5:00:00 PM4/28/2010 5:45:00 PM BICYCLES FROM N.H. AVE
North

Sabra-Wang & Associates, Inc.
1504 Joh Avenue, Suite 160
Baltimore, Maryland 21227
(410)-737-6564
File Name : BICYCLES FROM N.H.AVE.Site Code : 00000000Start Date : 04/28/2010Page No : 6
16th Street
From North
NEW HAMPSHIRE AVE.
From East
16th Street
From South
NEW HAMPSHIRE AVE.
From West
Start Time LeftThr
u
Rig
ht
Ped
s
App.
TotalLeft
Thr
u
Rig
ht
Left
to
East
App.
TotalLeft
Thr
u
Rig
ht
Ped
s
App.
TotalLeft
Thr
u
Rig
ht
Rig
ht to
Sou
th
App.
Total
Int.
Total
Peak Hour From 12:00 to 17:45 - Peak 1 of 1
By
Approach17:00 17:00 12:00 17:00
Volume 0 0 0 1 1 0 10 0 1 11 0 0 0 0 0 8 7 2 0 17
Percent 0.0 0.0 0.0100.
00.0 90.9 0.0 9.1 - - - - 47.1 41.2 11.8 0.0
High Int. 17:45 17:45 - 17:15
Volume 0 0 0 1 1 0 5 0 1 6 - - - - - 3 3 0 0 6
Peak
Factor0.250 0.458 - 0.708
16th Street
NE
W H
AM
PS
HIR
E A
VE
. N
EW
HA
MP
SH
IRE
AV
E.
16th Street
Right0
Thru0
Left0
Peds1
In1
Rig
ht 0
Thru 1
0
Left 0
Left
to E
ast 1
In
11
Left0
Thru0
Right0
Peds0
In0
Left8
Thru
7
Rig
ht2
Rig
ht
to S
outh0
In17
BICYCLES FROM N.H. AVE
North

Sabra-Wang & Associates, Inc.
1504 Joh Avenue, Suite 160
Baltimore, Maryland 21227
(410)-737-6564
File Name : BICYCLES TON.H. AVE.Site Code : 00000000Start Date : 04/28/2010Page No : 1
Weather:SUNNYCounted By:MO, DEB, SN, HOTown: WASHINGTON D.C.County:
Groups Printed- BICYCLES TO N.H. AVE
16th Street
From North
U STREET
From East
16th Street
From South
U STREET
From West
Start Time LeftThr
u
Rig
ht to
N.H
.
Ped
s
App.
TotalLeft
Thr
u
Rig
ht
Ped
s
App.
TotalLeft
Thr
u
Rig
ht
Ped
s
App.
TotalLeft
Thr
u
Rig
ht
Ped
s
App.
Total
Int.
Total
Factor 1.0 1.0 1.0 1.0 1.0 1.0 1.0 1.0 1.0 1.0 1.0 1.0 1.0 1.0 1.0 1.0
07:00 0 0 0 0 0 0 0 0 0 0 0 0 0 0 0 0 0 1 0 1 1
07:15 0 0 2 0 2 0 0 0 0 0 0 0 0 0 0 0 0 1 0 1 3
07:30 0 0 4 0 4 0 0 0 0 0 0 0 0 0 0 0 0 0 0 0 4
07:45 0 0 6 0 6 0 0 0 0 0 0 0 0 0 0 0 0 0 0 0 6
Total 0 0 12 0 12 0 0 0 0 0 0 0 0 0 0 0 0 2 0 2 14
08:00 0 0 1 0 1 0 0 0 0 0 0 0 0 0 0 0 0 0 0 0 1
08:15 0 0 10 0 10 0 0 0 0 0 0 0 0 0 0 0 0 0 0 0 10
08:30 0 0 8 0 8 0 0 0 0 0 0 0 0 0 0 0 0 0 0 0 8
08:45 0 0 12 0 12 0 0 0 0 0 0 0 0 0 0 0 0 0 0 0 12
Total 0 0 31 0 31 0 0 0 0 0 0 0 0 0 0 0 0 0 0 0 31
*** BREAK ***
16:15 0 0 2 0 2 0 0 0 0 0 0 0 0 0 0 0 0 0 0 0 2
16:30 0 0 5 0 5 0 0 0 0 0 0 0 1 0 1 0 0 1 0 1 7
16:45 0 0 2 0 2 0 0 0 0 0 0 0 0 0 0 0 0 0 0 0 2
Total 0 0 9 0 9 0 0 0 0 0 0 0 1 0 1 0 0 1 0 1 11
17:00 0 0 3 0 3 0 0 0 0 0 0 0 0 0 0 0 0 1 0 1 4
*** BREAK ***
17:30 0 0 1 0 1 0 0 0 0 0 0 0 0 0 0 0 0 0 0 0 1
17:45 0 0 0 0 0 0 0 0 0 0 0 0 1 0 1 0 0 0 0 0 1
Total 0 0 4 0 4 0 0 0 0 0 0 0 1 0 1 0 0 1 0 1 6
Grand
Total0 0 56 0 56 0 0 0 0 0 0 0 2 0 2 0 0 4 0 4 62
Apprch % 0.0 0.0100.
00.0 0.0 0.0 0.0 0.0 0.0 0.0
100.
00.0 0.0 0.0
100.
00.0
Total % 0.0 0.0 90.3 0.0 90.3 0.0 0.0 0.0 0.0 0.0 0.0 0.0 3.2 0.0 3.2 0.0 0.0 6.5 0.0 6.5

Sabra-Wang & Associates, Inc.
1504 Joh Avenue, Suite 160
Baltimore, Maryland 21227
(410)-737-6564
File Name : BICYCLES TON.H. AVE.Site Code : 00000000Start Date : 04/28/2010Page No : 2
16th Street
U S
TR
EE
T U
ST
RE
ET
16th Street
Rightto N.H.
56 Thru
0 Left
0 Peds
0
InOut Total0 56 56
Rig
ht 0
Thru 0
Left 0
P
eds 0
Out
Tota
lIn
2
0
2
Left0
Thru0
Right2
Peds0
Out TotalIn4 2 6
Left0
Thru
0
Rig
ht4
Peds0
Tota
lO
ut
In56
4
60
4/28/2010 7:00:00 AM4/28/2010 5:45:00 PM BICYCLES TO N.H. AVE
North

Sabra-Wang & Associates, Inc.
1504 Joh Avenue, Suite 160
Baltimore, Maryland 21227
(410)-737-6564
File Name : BICYCLES TON.H. AVE.Site Code : 00000000Start Date : 04/28/2010Page No : 3
16th Street
From North
U STREET
From East
16th Street
From South
U STREET
From West
Start Time LeftThr
u
Rig
ht to
N.H
.
Ped
s
App.
TotalLeft
Thr
u
Rig
ht
Ped
s
App.
TotalLeft
Thr
u
Rig
ht
Ped
s
App.
TotalLeft
Thr
u
Rig
ht
Ped
s
App.
Total
Int.
Total
Peak Hour From 07:00 to 11:45 - Peak 1 of 1
Intersectio
n08:00
Volume 0 0 31 0 31 0 0 0 0 0 0 0 0 0 0 0 0 0 0 0 31
Percent 0.0 0.0100.
00.0 0.0 0.0 0.0 0.0 0.0 0.0 0.0 0.0 0.0 0.0 0.0 0.0
Volume 0 0 31 0 31 0 0 0 0 0 0 0 0 0 0 0 0 0 0 0 31
Volume 0 0 12 0 12 0 0 0 0 0 0 0 0 0 0 0 0 0 0 0 12
Peak
Factor
0.646
High Int. 08:45 6:45:00 AM 6:45:00 AM 6:45:00 AM
Volume 0 0 12 0 12
Peak
Factor0.646
16th Street
U S
TR
EE
T U
ST
RE
ET
16th Street
Rightto N.H.
31 Thru
0 Left
0 Peds
0
InOut Total0 31 31
Rig
ht 0
Thru 0
Left 0
P
eds 0
Out
Tota
lIn
0
0
0
Left0
Thru0
Right0
Peds0
Out TotalIn0 0 0
Left0
Thru
0
Rig
ht0
Peds0
Tota
lO
ut
In31
0
31
4/28/2010 8:00:00 AM4/28/2010 8:45:00 AM BICYCLES TO N.H. AVE
North

Sabra-Wang & Associates, Inc.
1504 Joh Avenue, Suite 160
Baltimore, Maryland 21227
(410)-737-6564
File Name : BICYCLES TON.H. AVE.Site Code : 00000000Start Date : 04/28/2010Page No : 4
16th Street
From North
U STREET
From East
16th Street
From South
U STREET
From West
Start Time LeftThr
u
Rig
ht to
N.H
.
Ped
s
App.
TotalLeft
Thr
u
Rig
ht
Ped
s
App.
TotalLeft
Thr
u
Rig
ht
Ped
s
App.
TotalLeft
Thr
u
Rig
ht
Ped
s
App.
Total
Int.
Total
Peak Hour From 07:00 to 11:45 - Peak 1 of 1
By
Approach08:00 07:00 07:00 07:00
Volume 0 0 31 0 31 0 0 0 0 0 0 0 0 0 0 0 0 2 0 2
Percent 0.0 0.0100.
00.0 - - - - - - - - 0.0 0.0
100.
00.0
High Int. 08:45 - - 07:00
Volume 0 0 12 0 12 - - - - - - - - - - 0 0 1 0 1
Peak
Factor0.646 - - 0.500
16th Street
U S
TR
EE
T U
ST
RE
ET
16th Street
Rightto N.H.
31 Thru
0 Left
0 Peds
0
In31
Rig
ht 0
Thru 0
Left 0
P
eds 0
In
0
Left0
Thru0
Right0
Peds0
In0
Left0
Thru
0
Rig
ht2
Peds0
In2
BICYCLES TO N.H. AVE
North

Sabra-Wang & Associates, Inc.
1504 Joh Avenue, Suite 160
Baltimore, Maryland 21227
(410)-737-6564
File Name : BICYCLES TON.H. AVE.Site Code : 00000000Start Date : 04/28/2010Page No : 5
16th Street
From North
U STREET
From East
16th Street
From South
U STREET
From West
Start Time LeftThr
u
Rig
ht to
N.H
.
Ped
s
App.
TotalLeft
Thr
u
Rig
ht
Ped
s
App.
TotalLeft
Thr
u
Rig
ht
Ped
s
App.
TotalLeft
Thr
u
Rig
ht
Ped
s
App.
Total
Int.
Total
Peak Hour From 12:00 to 17:45 - Peak 1 of 1
Intersectio
n16:15
Volume 0 0 12 0 12 0 0 0 0 0 0 0 1 0 1 0 0 2 0 2 15
Percent 0.0 0.0100.
00.0 0.0 0.0 0.0 0.0 0.0 0.0
100.
00.0 0.0 0.0
100.
00.0
Volume 0 0 12 0 12 0 0 0 0 0 0 0 1 0 1 0 0 2 0 2 15
Volume 0 0 5 0 5 0 0 0 0 0 0 0 1 0 1 0 0 1 0 1 7
Peak
Factor
0.536
High Int. 16:30 16:30 16:30
Volume 0 0 5 0 5 0 0 0 0 0 0 0 1 0 1 0 0 1 0 1
Peak
Factor0.600 0.250 0.500
16th Street
U S
TR
EE
T U
ST
RE
ET
16th Street
Rightto N.H.
12 Thru
0 Left
0 Peds
0
InOut Total0 12 12
Rig
ht 0
Thru 0
Left 0
P
eds 0
Out
Tota
lIn
1
0
1
Left0
Thru0
Right1
Peds0
Out TotalIn2 1 3
Left0
Thru
0
Rig
ht2
Peds0
Tota
lO
ut
In12
2
14
4/28/2010 4:15:00 PM4/28/2010 5:00:00 PM BICYCLES TO N.H. AVE
North

Sabra-Wang & Associates, Inc.
1504 Joh Avenue, Suite 160
Baltimore, Maryland 21227
(410)-737-6564
File Name : BICYCLES TON.H. AVE.Site Code : 00000000Start Date : 04/28/2010Page No : 6
16th Street
From North
U STREET
From East
16th Street
From South
U STREET
From West
Start Time LeftThr
u
Rig
ht to
N.H
.
Ped
s
App.
TotalLeft
Thr
u
Rig
ht
Ped
s
App.
TotalLeft
Thr
u
Rig
ht
Ped
s
App.
TotalLeft
Thr
u
Rig
ht
Ped
s
App.
Total
Int.
Total
Peak Hour From 12:00 to 17:45 - Peak 1 of 1
By
Approach16:15 12:00 15:45 16:15
Volume 0 0 12 0 12 0 0 0 0 0 0 0 1 0 1 0 0 2 0 2
Percent 0.0 0.0100.
00.0 - - - - 0.0 0.0
100.
00.0 0.0 0.0
100.
00.0
High Int. 16:30 - 16:30 16:30
Volume 0 0 5 0 5 - - - - - 0 0 1 0 1 0 0 1 0 1
Peak
Factor0.600 - 0.250 0.500
16th Street
U S
TR
EE
T U
ST
RE
ET
16th Street
Rightto N.H.
12 Thru
0 Left
0 Peds
0
In12
Rig
ht 0
Thru 0
Left 0
P
eds 0
In
0
Left0
Thru0
Right1
Peds0
In1
Left0
Thru
0
Rig
ht2
Peds0
In2
BICYCLES TO N.H. AVE
North

Appendix A3 16th Street/U Street/New Hampshire Avenue: Crash Data

Pedestrian Action #ACC %In Crosswalk with Signal: 0.0%0In Crosswalk against Signal: 0.0%0In Crosswalk no Signal: 0.0%0In Unmarked Crosswalk: 0.0%0Not in Crosswalk: 0.0%0From Between Parked Cars: 0.0%0Unspecified: 0.0%0
Contributing Factor #VEH %Driver: Speed: 0.0%0Driver: Alcohol/Drug: 5.9%1Driver: Electronic Device: 0.0%0Driver: Others: 11.8%2Vehicle: 0.0%0Roadway: 0.0%0Unspecified: 82.4%14
Light Condition #ACC %Daylight: 37.5%3Dawn/Dusk: 0.0%0Dark(Lighted): 0.0%4Dark(Not Lighted): 0.0%0Dark(Unknown Lighting): 0.0%0Unspecified: 12.5%1
Accident Severity Type #ACC %Fatal Collision: 0.0%0Injury Collision: 0.0%0PDO Collision: 100.0%8
Type of Vehicle #VEH %Passenger Car: 76.5%13Bus: 0.0%0Truck: 5.9%1Taxi: 5.9%1Minivan: 0.0%0Police/Emergency Vehicle: 0.0%0Motorcycle/Moped: 0.0%0Bicycle: 0.0%0Fixed Object: 0.0%0Unspecified: 11.8%2
Surface Condition #ACC %Dry: 75.0%6Wet: 12.5%1Snow/Ice: 0.0%0Slush: 0.0%0Water/Sand: 0.0%0Repairing: 0.0%0Unspecified: 12.5%1
Weather Condition #ACC %Clear: 75.0%6Rain: 12.5%1Snow: 0.0%0Sleet/Hail: 0.0%0Fog/Mist: 0.0%0Crosswind/Blowing Sand: 0.0%0Unspecified: 12.5%1
Day of Week #ACC %Sunday: 25.0%2Monday: 12.5%1Tuesday: 0.0%0Wednesday: 0.0%0Thursday: 25.0%2Friday: 12.5%1Saturday: 25.0%2
Time of Day #ACC %
07:30 ~ 09:30: 0.0%009:30 ~ 11:30: 0.0%011:30 ~ 13:30: 0.0%013:30 ~ 16:00: 12.5%1
16:00 ~18:30: 25.0%218:30 ~ 07:30: 62.5%5Unspecified: 0.0%0
DC Department of Transportation - Traffic Accident Reporting and Analysis System
Accident Summary Report (R-7)
Total Number of Accident:
Total Number of Injuries:Total Number of Disabling Injuries:Total Number of NonDisabling Injuries:Total Number of Pedestrians Involved:Total Number of Bicycles Involved:Total Number of Motorcycles Involved:
Total Number of Fatalities:80000000
Time Period Covered:
Intersection:
Collision Type #ACC % Collision Type #ACC %Right Angle: 0 0.0% Fixed Object: 0 0.0%Left Turn: 0 0.0% Ran Off Road: 0 0.0%Right Turn: 0 0.0% Ped. Involved: 0 0.0%Rear End: 2 25.0% Backing: 0 0.0%Side Swiped: 4 50.0% Non Collision: 0 0.0%Head On: 0 0.0% Under/Over Ride: 0 0.0%Parked: 1 12.5% Unspecified: 1 12.5%
admin TARAS 12/15/2011
NEW HAMPSHIRE AVE and T ST, NW
From 08/01/2006 To 07/31/2010 Prepared Date:Prepared By:
1 Records are not approved as of 12/15/2011 8:51:05 AM

Pedestrian Action #ACC %In Crosswalk with Signal: 0.0%0In Crosswalk against Signal: 25.0%1In Crosswalk no Signal: 0.0%0In Unmarked Crosswalk: 0.0%0Not in Crosswalk: 50.0%2From Between Parked Cars: 0.0%0Unspecified: 25.0%1
Contributing Factor #VEH %Driver: Speed: 1.4%2Driver: Alcohol/Drug: 1.4%2Driver: Electronic Device: 0.0%0Driver: Others: 26.8%37Vehicle: 0.0%0Roadway: 0.7%1Unspecified: 69.6%96
Light Condition #ACC %Daylight: 45.2%33Dawn/Dusk: 6.8%5Dark(Lighted): 0.0%21Dark(Not Lighted): 0.0%0Dark(Unknown Lighting): 19.2%14Unspecified: 0.0%0
Accident Severity Type #ACC %Fatal Collision: 0.0%0Injury Collision: 24.7%18PDO Collision: 75.3%55
Type of Vehicle #VEH %Passenger Car: 63.0%87Bus: 7.2%10Truck: 1.4%2Taxi: 15.2%21Minivan: 0.0%0Police/Emergency Vehicle: 2.9%4Motorcycle/Moped: 0.7%1Bicycle: 2.9%4Fixed Object: 0.7%1Unspecified: 5.8%8
Surface Condition #ACC %Dry: 83.6%61Wet: 15.1%11Snow/Ice: 1.4%1Slush: 0.0%0Water/Sand: 0.0%0Repairing: 0.0%0Unspecified: 0.0%0
Weather Condition #ACC %Clear: 83.6%61Rain: 11.0%8Snow: 1.4%1Sleet/Hail: 0.0%0Fog/Mist: 1.4%1Crosswind/Blowing Sand: 0.0%0Unspecified: 2.7%2
Day of Week #ACC %Sunday: 24.7%18Monday: 9.6%7Tuesday: 5.5%4Wednesday: 16.4%12Thursday: 11.0%8Friday: 15.1%11Saturday: 17.8%13
Time of Day #ACC %
07:30 ~ 09:30: 5.5%409:30 ~ 11:30: 9.6%711:30 ~ 13:30: 4.1%313:30 ~ 16:00: 9.6%7
16:00 ~18:30: 16.4%1218:30 ~ 07:30: 54.8%40Unspecified: 0.0%0
DC Department of Transportation - Traffic Accident Reporting and Analysis System
Accident Summary Report (R-7)
Total Number of Accident:
Total Number of Injuries:Total Number of Disabling Injuries:Total Number of NonDisabling Injuries:Total Number of Pedestrians Involved:Total Number of Bicycles Involved:Total Number of Motorcycles Involved:
Total Number of Fatalities:73
025
46540
Time Period Covered:
Intersection:
Collision Type #ACC % Collision Type #ACC %Right Angle: 3 4.1% Fixed Object: 3 4.1%Left Turn: 15 20.5% Ran Off Road: 0 0.0%Right Turn: 5 6.8% Ped. Involved: 5 6.8%Rear End: 13 17.8% Backing: 1 1.4%Side Swiped: 21 28.8% Non Collision: 0 0.0%Head On: 1 1.4% Under/Over Ride: 0 0.0%Parked: 1 1.4% Unspecified: 5 6.8%
admin TARAS 12/15/2011
16TH ST and NEW HAMPSHIRE AVE, NW
From 08/01/2006 To 07/31/2010 Prepared Date:Prepared By:
9 Records are not approved as of 12/15/2011 8:47:40 AM
Pedestrian Action #ACC %In Crosswalk with Signal: 0.0%0In Crosswalk against Signal: 0.0%0In Crosswalk no Signal: 0.0%0In Unmarked Crosswalk: 0.0%0Not in Crosswalk: 0.0%0From Between Parked Cars: 0.0%0Unspecified: 0.0%0
Contributing Factor #VEH %Driver: Speed: 0.0%0Driver: Alcohol/Drug: 0.0%0Driver: Electronic Device: 0.0%0Driver: Others: 12.5%1Vehicle: 0.0%0Roadway: 12.5%1Unspecified: 75.0%6
Light Condition #ACC %Daylight: 25.0%1Dawn/Dusk: 0.0%0Dark(Lighted): 0.0%1Dark(Not Lighted): 0.0%0Dark(Unknown Lighting): 50.0%2Unspecified: 0.0%0
Accident Severity Type #ACC %Fatal Collision: 0.0%0Injury Collision: 25.0%1PDO Collision: 75.0%3
Type of Vehicle #VEH %Passenger Car: 87.5%7Bus: 0.0%0Truck: 0.0%0Taxi: 0.0%0Minivan: 0.0%0Police/Emergency Vehicle: 0.0%0Motorcycle/Moped: 0.0%0Bicycle: 12.5%1Fixed Object: 0.0%0Unspecified: 0.0%0
Surface Condition #ACC %Dry: 75.0%3Wet: 25.0%1Snow/Ice: 0.0%0Slush: 0.0%0Water/Sand: 0.0%0Repairing: 0.0%0Unspecified: 0.0%0
Weather Condition #ACC %Clear: 75.0%3Rain: 25.0%1Snow: 0.0%0Sleet/Hail: 0.0%0Fog/Mist: 0.0%0Crosswind/Blowing Sand: 0.0%0Unspecified: 0.0%0
Day of Week #ACC %Sunday: 25.0%1Monday: 0.0%0Tuesday: 25.0%1Wednesday: 25.0%1Thursday: 0.0%0Friday: 0.0%0Saturday: 25.0%1
Time of Day #ACC %
07:30 ~ 09:30: 0.0%009:30 ~ 11:30: 0.0%011:30 ~ 13:30: 0.0%013:30 ~ 16:00: 0.0%0
16:00 ~18:30: 50.0%218:30 ~ 07:30: 50.0%2Unspecified: 0.0%0
DC Department of Transportation - Traffic Accident Reporting and Analysis System
Accident Summary Report (R-7)
Total Number of Accident:
Total Number of Injuries:Total Number of Disabling Injuries:Total Number of NonDisabling Injuries:Total Number of Pedestrians Involved:Total Number of Bicycles Involved:Total Number of Motorcycles Involved:
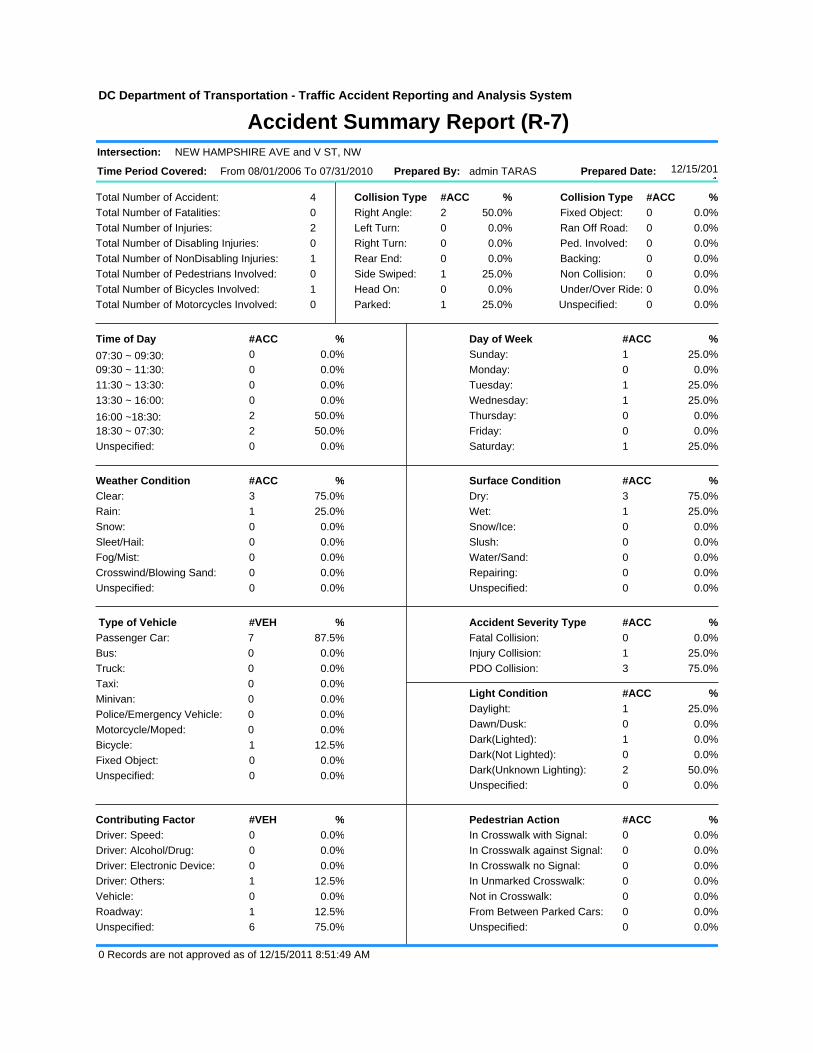
Total Number of Fatalities:40201010
Time Period Covered:
Intersection:
Collision Type #ACC % Collision Type #ACC %Right Angle: 2 50.0% Fixed Object: 0 0.0%Left Turn: 0 0.0% Ran Off Road: 0 0.0%Right Turn: 0 0.0% Ped. Involved: 0 0.0%Rear End: 0 0.0% Backing: 0 0.0%Side Swiped: 1 25.0% Non Collision: 0 0.0%Head On: 0 0.0% Under/Over Ride: 0 0.0%Parked: 1 25.0% Unspecified: 0 0.0%
admin TARAS 12/15/2011
NEW HAMPSHIRE AVE and V ST, NW
From 08/01/2006 To 07/31/2010 Prepared Date:Prepared By:
0 Records are not approved as of 12/15/2011 8:51:49 AM

Pedestrian Action #ACC %In Crosswalk with Signal: 0.0%0In Crosswalk against Signal: 0.0%0In Crosswalk no Signal: 0.0%0In Unmarked Crosswalk: 0.0%0Not in Crosswalk: 0.0%0From Between Parked Cars: 0.0%0Unspecified: 0.0%0
Contributing Factor #VEH %Driver: Speed: 0.0%0Driver: Alcohol/Drug: 2.3%1Driver: Electronic Device: 0.0%0Driver: Others: 20.9%9Vehicle: 0.0%0Roadway: 0.0%0Unspecified: 76.7%33
Light Condition #ACC %Daylight: 54.2%13Dawn/Dusk: 0.0%0Dark(Lighted): 0.0%11Dark(Not Lighted): 0.0%0Dark(Unknown Lighting): 0.0%0Unspecified: 0.0%0
Accident Severity Type #ACC %Fatal Collision: 0.0%0Injury Collision: 29.2%7PDO Collision: 70.8%17
Type of Vehicle #VEH %Passenger Car: 58.1%25Bus: 4.7%2Truck: 0.0%0Taxi: 11.6%5Minivan: 0.0%0Police/Emergency Vehicle: 2.3%1Motorcycle/Moped: 4.7%2Bicycle: 11.6%5Fixed Object: 0.0%0Unspecified: 7.0%3
Surface Condition #ACC %Dry: 87.5%21Wet: 4.2%1Snow/Ice: 0.0%0Slush: 0.0%0Water/Sand: 4.2%1Repairing: 0.0%0Unspecified: 4.2%1
Weather Condition #ACC %Clear: 100.0%24Rain: 0.0%0Snow: 0.0%0Sleet/Hail: 0.0%0Fog/Mist: 0.0%0Crosswind/Blowing Sand: 0.0%0Unspecified: 0.0%0
Day of Week #ACC %Sunday: 20.8%5Monday: 16.7%4Tuesday: 4.2%1Wednesday: 4.2%1Thursday: 25.0%6Friday: 8.3%2Saturday: 20.8%5
Time of Day #ACC %
07:30 ~ 09:30: 12.5%309:30 ~ 11:30: 16.7%411:30 ~ 13:30: 8.3%213:30 ~ 16:00: 0.0%0
16:00 ~18:30: 8.3%218:30 ~ 07:30: 54.2%13Unspecified: 0.0%0
DC Department of Transportation - Traffic Accident Reporting and Analysis System
Accident Summary Report (R-7)
Total Number of Accident:
Total Number of Injuries:Total Number of Disabling Injuries:Total Number of NonDisabling Injuries:Total Number of Pedestrians Involved:Total Number of Bicycles Involved:Total Number of Motorcycles Involved:
Total Number of Fatalities:24
0704052
Time Period Covered:
Intersection:
Collision Type #ACC % Collision Type #ACC %Right Angle: 4 16.7% Fixed Object: 0 0.0%Left Turn: 1 4.2% Ran Off Road: 0 0.0%Right Turn: 0 0.0% Ped. Involved: 1 4.2%Rear End: 2 8.3% Backing: 1 4.2%Side Swiped: 9 37.5% Non Collision: 1 4.2%Head On: 0 0.0% Under/Over Ride: 0 0.0%Parked: 3 12.5% Unspecified: 2 8.3%
admin TARAS 12/15/2011
16TH ST and NEW HAMPSHIRE AVE, NW
From 08/01/2010 To 09/30/2011 Prepared Date:Prepared By:
0 Records are not approved as of 12/15/2011 8:58:46 AM

Pedestrian Action #ACC %In Crosswalk with Signal: 0.0%0In Crosswalk against Signal: 0.0%0In Crosswalk no Signal: 0.0%0In Unmarked Crosswalk: 0.0%0Not in Crosswalk: 0.0%0From Between Parked Cars: 0.0%0Unspecified: 0.0%0
Contributing Factor #VEH %Driver: Speed: 0.0%0Driver: Alcohol/Drug: 25.0%1Driver: Electronic Device: 0.0%0Driver: Others: 25.0%1Vehicle: 0.0%0Roadway: 0.0%0Unspecified: 50.0%2
Light Condition #ACC %Daylight: 100.0%2Dawn/Dusk: 0.0%0Dark(Lighted): 0.0%0Dark(Not Lighted): 0.0%0Dark(Unknown Lighting): 0.0%0Unspecified: 0.0%0
Accident Severity Type #ACC %Fatal Collision: 0.0%0Injury Collision: 0.0%0PDO Collision: 100.0%2
Type of Vehicle #VEH %Passenger Car: 50.0%2Bus: 25.0%1Truck: 25.0%1Taxi: 0.0%0Minivan: 0.0%0Police/Emergency Vehicle: 0.0%0Motorcycle/Moped: 0.0%0Bicycle: 0.0%0Fixed Object: 0.0%0Unspecified: 0.0%0
Surface Condition #ACC %Dry: 100.0%2Wet: 0.0%0Snow/Ice: 0.0%0Slush: 0.0%0Water/Sand: 0.0%0Repairing: 0.0%0Unspecified: 0.0%0
Weather Condition #ACC %Clear: 100.0%2Rain: 0.0%0Snow: 0.0%0Sleet/Hail: 0.0%0Fog/Mist: 0.0%0Crosswind/Blowing Sand: 0.0%0Unspecified: 0.0%0
Day of Week #ACC %Sunday: 0.0%0Monday: 50.0%1Tuesday: 0.0%0Wednesday: 50.0%1Thursday: 0.0%0Friday: 0.0%0Saturday: 0.0%0
Time of Day #ACC %
07:30 ~ 09:30: 50.0%109:30 ~ 11:30: 50.0%111:30 ~ 13:30: 0.0%013:30 ~ 16:00: 0.0%0
16:00 ~18:30: 0.0%018:30 ~ 07:30: 0.0%0Unspecified: 0.0%0
DC Department of Transportation - Traffic Accident Reporting and Analysis System
Accident Summary Report (R-7)
Total Number of Accident:
Total Number of Injuries:Total Number of Disabling Injuries:Total Number of NonDisabling Injuries:Total Number of Pedestrians Involved:Total Number of Bicycles Involved:Total Number of Motorcycles Involved:
Total Number of Fatalities:20000000
Time Period Covered:
Intersection:
Collision Type #ACC % Collision Type #ACC %Right Angle: 0 0.0% Fixed Object: 0 0.0%Left Turn: 0 0.0% Ran Off Road: 0 0.0%Right Turn: 1 50.0% Ped. Involved: 0 0.0%Rear End: 0 0.0% Backing: 0 0.0%Side Swiped: 1 50.0% Non Collision: 0 0.0%Head On: 0 0.0% Under/Over Ride: 0 0.0%Parked: 0 0.0% Unspecified: 0 0.0%
admin TARAS 12/15/2011
NEW HAMPSHIRE AVE and V ST, NW
From 08/01/2010 To 09/30/2011 Prepared Date:Prepared By:
0 Records are not approved as of 12/15/2011 8:56:17 AM

Appendix A4 16th Street/U Street/New Hampshire Avenue: Field of
View Snapshots

Intersection of 16th Street, U Street, and New Hampshire Avenueand New Hampshire Avenue
Video Stills
Facing Southwest Facing NortheastFacing Southwest Facing Northeast