th annual report 2012-13 - tata motors motors ar 2012-13.pdfjaguar land rover despite tough market...
TRANSCRIPT

68th Annual Report 2012-13

ANNUAL GENERAL MEETING
Date: Wednesday, August 21, 2013 Time: 3.00 p.m.
Venue: Birla Matushri Sabhagar, 19, Sir Vithaldas Thackersey Marg, Mumbai 400 020
CONTENTS
CORPORATE OVERVIEW
02 Corporate Information
03 Mission, Vision and Values
04 Chairman’s Statement
08 Board of Directors
12 Delivering Experiences
14 Key Performance Indicators
16 Products and Brands
18 Global Presence
20 Milestones
22 Driving Accountability
24 Focusing on Customers &
Products
26 Emphasising Excellence
28 Delivering with Speed
30 Sustainability
34 Awards and Achievements
FINANCIAL HIGHLIGHTS
36 Financial Performance
40 Summarised Balance Sheet
and Statement of Profit and
Loss Standalone
42 Summarised Balance Sheet
and Statement of Profit and
Loss Consolidated
44 Fund Flow Statement
STATUTORY REPORTS
45 Notice
52 Directors’ Report
66 Management Discussion and
Analysis
98 Report on Corporate
Governance
115 Secretarial Audit Report
FINANCIAL STATEMENTS
Standalone Financial Statements 116 Independent Auditors’ Report
120 Balance Sheet
121 Profit and Loss Statement
122 Cash Flow Statement
124 Notes to Accounts
Consolidated Financial Statements 160 Independent Auditors’ Report
162 Balance Sheet
163 Profit and Loss Statement
164 Cash Flow Statement
166 Notes to Accounts
Subsidiary Companies197 Financial Highlights
200 Listed Securities
201 Financial Statistics
Attendance Slip &
Proxy Form

Our renewed commitment to these
pillars drives us to achieve our mission
of anticipating and providing the best
vehicles and experiences to excite our
customers. Not just in India, but across
the world. Our products span segments,
customers and geographies. Our
strengths in engineering, a deep-rooted
understanding of customers and markets
help us deliver best-in-class products and
superior driving experiences.
Our customers are at the heart of all we
do. We are gearing up and igniting our
passion to offer products that meet the
ANTICIPATING NEEDS. DELIVERING EXCITEMENT.
At Tata Motors, we believe that our
strengths stem from an organisation-
wide culture which rests on four
pillars – Accountability, Customer &
Product Focus, Excellence and
Speed (ACES).
mobility needs of our customers. We are
engaging with them at our dealerships
and adopting processes to ensure that
industry-leading practices form a key part
of our service proposition.
As we move ahead, we will continue to
anticipate the needs of our customers
and remain committed to deliver
excitement.

2
68th ANNUAL REPORT 2012-13
REGISTERED OFFICEBombay House
24, Homi Mody Street, Mumbai 400 001
Tel: +91-22-6665 8282
Fax: +91-22-6665 7799
Email: [email protected]
Website: www.tatamotors.com
WORKSJamshedpur
Pune
Lucknow
Pantnagar
Sanand
Dharwad
SHARE REGISTRARSTSR Darashaw Private Limited
6-10, Haji Moosa Patrawala Industrial Estate
20, Dr. E. Moses Road, Mahalaxmi, Mumbai 400 011
Tel: +91-22-6656 8484
Fax: +91-22-6656 8494
Email: [email protected]
AUDITORSDeloitte Haskins & Sells (Registration No. 117366W)
CORPORATE IDENTITY NUMBER (CIN)L28920MH1945PLC004520
BOARD OF DIRECTORSMr Cyrus P MistryNon Executive Director and Chairman
Mr Ravi KantNon Executive Director and Vice Chairman
Mr Nusli N WadiaNon Executive, Independent Director
Mr Sam M PaliaNon Executive, Independent Director
(retired on April 25, 2013)
Dr Raghunath A MashelkarNon Executive, Independent Director
Mr Subodh BhargavaNon Executive, Independent Director
Mr Nasser MunjeeNon Executive, Independent Director
Mr Vinesh K JairathNon Executive, Independent Director
Ms Falguni S Nayar Non Executive, Independent Director
(appointed on May 29, 2013)
Dr Ralf SpethNon Executive Director
Mr Karl J Slym Managing Director
Mr Ravindra PisharodyExecutive Director (Commercial Vehicles)
Mr Satish B BorwankarExecutive Director (Quality)
COMPANY SECRETARYMr H K Sethna
Mr Ratan N Tata
Chairman Emeritus
CORPORATE INFORMATION
EXECUTIVE COMMITTEEMr Karl SlymManaging Director
Mr Ravindra PisharodyExecutive Director and Head,
Commercial Vehicle Business Unit
Mr Satish B BorwankarExecutive Director and Head, Quality
Mr C RamakrishnanPresident and Chief Financial Officer
Dr Tim LevertonPresident and Head,
Engineering Research Centre
Mr Ranjit YadavPresident and Head,
Passenger Vehicles Business Unit
Mr Prabir JhaSr Vice President and
Chief Human Resources Officer
Mr Ankush AroraSr Vice President, Commercial -
Passenger Vehicle Business Unit
Mr Venkatram MamillapalleSr Vice President and Head,
Purchasing & Supply Chain
BANKERSAllahabad Bank
Andhra Bank
Bank of America
Bank of Baroda
Bank of India
Bank of Maharashtra
Central Bank of India
Citibank N.A.
Corporation Bank
Deutsche Bank
Federal Bank
HDFC Bank
HSBC
ICICI Bank
IDBI Bank
Indian Bank
ING Vysya Bank
Karur Vysya Bank
Punjab National Bank
Standard Chartered Bank
State Bank of India
State Bank of Mysore
State Bank of Patiala
Union Bank of India
United Bank of India

3
FINANCIAL HIGHLIGHTS STATUTORY REPORTS FINANCIAL STATEMENTSCORPORATE OVERVIEW
MISSION, VISION AND VALUES
Mission, Vision and Values (3)

4
68th ANNUAL REPORT 2012-13
CHAIRMAN’S MESSAGE
Dear Shareholder,
The world continues to be in the midst of a very
challenging economic environment. While the global
economic meltdown in 2008 had relatively limited
impact on India and other emerging markets, we are
currently buffeted by headwinds caused by global
as well as domestic circumstances. The impact of the
slowdown has been felt across the board in India, with
all sectors of the economy being affected.
Tata Motors is privileged to
have a strong parent brand,
a rich commercial vehicle
pedigree, international
design centres of global
standards, and last but
not the least, committed
employees and a strong
dealer and vendor base.
CYRUS P MISTRY
CHAIRMAN
4

5
FINANCIAL HIGHLIGHTS STATUTORY REPORTS FINANCIAL STATEMENTSCORPORATE OVERVIEW
Amongst the few bright spots in the performance of the
global automobile industry has been the rebound of the
US auto industry. Vehicle sales have once been rising in
the US, after the nearly 22 percent collapse in volumes
that followed the 2008 economic crash. Auto factories are
reportedly running at 95 percent capacity in the US, and
several of the large US manufacturers have now become
profitable.
Europe, however, continues to see stagnant demand,
with a number of auto makers reporting large losses.
Demand for new vehicles is at a record low in many
nations. With domestic demand having dropped back
to levels last seen more than a generation ago, this has
left European manufacturers dependent on exports to
survive. And in fact, premium vehicle manufacturers have
been less affected by the European sales crisis; although
their sales within the European Union have declined, they
are benefitting from the pickup in demand in markets
like China and the US. With German manufacturers
outsourcing capacity to Asia, so as to be closer to local
markets, in 2012 several of the German premium vehicle
manufacturers sold more cars worldwide than ever before.
Great Britain was one of the few countries in this region to
register an increase in car sales.
In China as well, luxury manufacturers are doing well,
thanks to booming demand. China has advanced as the
largest vehicle market in the world and will continue to
grow, even though the rate of growth might slow. Amidst
slower growth in China, Chinese vehicle manufacturers
shipped more than one million cars to other markets, with
the majority of Chinese car exports going to emerging
markets in Africa, the Middle East and South America.
Chinese exports are expected to double in volumes by
2016.
INDIAN AUTO INDUSTRY AND TATA MOTORS
The year saw passenger vehicle sales in India grow by a
mere 0.9 percent, while overall commercial vehicles sales
registered a growth of 1.7 percent. Diesel price hikes
resulted in lower demand for diesel vehicles, thereby
dampening growth in both the personal and commercial
vehicle segments. Small commercial vehicles and pick-ups
witnessed continued strong demand, and small SUVs and
luxury brands saw significant increase in interest.
The financial year 2013 has been a challenging one for
Tata Motors. Nonetheless, despite difficult economic
conditions and increasing competition, the Company
retained its market leadership in commercial vehicles, on
the back of new offerings and introduction of innovative
technologies. Its highly successful and reliable Ace and
Magic vehicles crossed the sales mark of one million units,
achieved in seven years since these products were first
introduced in the market. The sales performance of the
Company’s passenger vehicles, however, was significantly
lower as compared to expectation; rapid changes in
customer preferences along with the de-regulation of
diesel pricing both took their toll.
As we look ahead, we see a year of continuing challenges
– but at the same time, full of opportunities. Tata Motors
is privileged to have a strong parent brand, a rich
5
Chairman’s Message (4-7)

6
68th ANNUAL REPORT 2012-13
commercial vehicle pedigree, international design centres
of global standards, and last but not the least, committed
employees and a strong dealer and vendor base. With
changes in the organisation structure, the Company is
determined to improve its customer understanding to
better meet market needs, and deliver products swiftly
through optimised operational processes. The Company
has launched its ACES programme, with a renewed
focus on Accountability, Customer and Product Focus,
Excellence and Speed.
Building on its DNA, Tata Motors recently announced
HORIZONEXT, based on intense product focus, world-class
quality and manufacturing, enriched customer purchase
experience and a consistent, robust after-sales service.
The Company is working on a slew of new products,
with a plan running up to 2020; this includes appropriate
focus on alternate fuels, hybrids and electric vehicles. The
organisation is resolved to foster a culture of customer
Building on its DNA, Tata Motors recently
announced HORIZONEXT, based on intense
product focus, world-class quality and
manufacturing, enriched customer purchase
experience and a consistent, robust after-
sales service.
centricity and innovation, so that the Company’s products
and services consistently exceed customer expectations.
In the commercial vehicles segment, Tata Motors expects
to remain the preferred brand for customers. Given the
Company’s scale, it is in the best position to efficiently
integrate its products and services and deliver the
maximum value to its customers at the best prices. The
Company continues to anticipate market demand and is
well-positioned to address competition with its product
portfolio that includes global-standard products and an
extensive dealer network.
As an industry, the shape of things to come will be
a function of how the economy performs, as well as
government policies that will drive the larger picture of
how India sees transportation in its metros and rural areas.
JAGUAR LAND ROVER
Despite tough market conditions, it was a good year for
Jaguar Land Rover (JLR), which registered record volumes
and revenues on the back of the launches of some of the
most exciting and awaited new products. Volumes for the
year were nearly 375,000 units with revenues reaching an
all-time high of £15.8 billion. JLR is a healthy and vibrant
Company, strongly positioned across key global markets
for future growth. Technical innovation and engineering
excellence have stood JLR in good stead for sustained,
profitable growth and the Company plans to launch eight
new or refreshed products this year.
CHAIRMAN’S MESSAGE
6

7
FINANCIAL HIGHLIGHTS STATUTORY REPORTS FINANCIAL STATEMENTSCORPORATE OVERVIEW
JLR has underlined its commitment to expanding its
presence in China, a long-term strategic market for the
Company. In November 2012, JLR and Chery Automobile
Company laid the foundation stone for their joint venture
in China, with a new plant to be built at Changshu, in
Jiangshu Province.
JLR also continues to explore further opportunities in
other growing markets, including Brazil, India and Saudi
Arabia. It has developed a number of industry best
practices, and is a company we should be proud of.
LOOKING AHEAD
The health of the automobile industry has traditionally
been an important indicator of the economic strength of a
nation. I have no doubt that the industry will play a critical
role in the growing prosperity of India.
Tata Motors has all the capabilities and strengths to
navigate through the challenges presented by dynamic
and evolving customer preferences. The Company has
an exciting future, and is well placed to strengthen its
position as a respected and viable competitor in the
global auto industry. The Company will continue to be a
responsible corporate citizen wherever it operates, and is
committed to delivering long-term value creation for all its
stakeholders.
The Board joins me in expressing our deep appreciation
to the employees, the Unions and the management
team and all our partners for their support, co-operation
and understanding. I would also like to express our
appreciation to you, our shareholders, for your support
and understanding in good times and in challenging
times.
Finally, I would like to thank Mr Ratan Tata for his visionary
leadership during his tenure as Chairman of Tata Motors,
which has transformed Tata Motors into a complete
automobile company with a global footprint.
Chairman
Mumbai, June 24, 2013
7
Chairman’s Message (4-7)

8
68th ANNUAL REPORT 2012-13
MR CYRUS P MISTRY Non Executive Director and Chairman
Mr Mistry was appointed as a Director
of Tata Motors with effect from May 29,
2012, and as Deputy Chairman of the
Company with effect from November 7,
2012. Mr Mistry took over as Chairman
from Mr Ratan N Tata on his retirement
with effect from December 28, 2012. Mr
Mistry was earlier Managing Director of
the Shapoorji Pallonji group and was also
responsible for building the infrastructure
development vertical in the Shapoorji
Pallonji group.
Mr Mistry is a Graduate of Civil
Engineering from the Imperial College
London (1990) and has an MSc in
Management from the London Business
School (1997). He was recently bestowed
with the Alumni Achievement Award by
the London Business School.
MR RAVI KANT Non Executive Director and Vice Chairman
Mr Kant has been with the Company
since February 1999, joining as Senior Vice
President (Commercial Vehicles), and was
inducted on the Board as an Executive
Director in July 2000 and became the
Managing Director in July 2005. Upon
retiring from his Executive position on
June 1, 2009, Mr Ravi Kant continues to
be on the Company’s Board of Directors
as Vice-Chairman.
Prior to joining the Company, he was
with Philips India Limited as Director
of Consumers Electronics business and
prior to which with LML Ltd. as Senior
Executive Director (Marketing) and Titan
Watches Limited as Vice President (Sales &
Marketing).
Mr Ravi Kant holds a Bachelor of
Technology degree in Metallurgical
Engineering from the Institute of
Technology, Kharagpur and a Masters
degree in Science from the University of
Aston, Birmingham, UK.
MR NUSLI N WADIA Non Executive, Independent Director
Educated in the UK, Mr Wadia is the
Chairman of The Bombay Dyeing &
Manufacturing Company Limited and
heads the Wadia Group.
He is also the Chairman/Trustee of various
charitable institutions and non-profit
organisations.
Mr Wadia has been on the Company’s
Board since December 1998 as an
Independent Director.
Mr Mistry with the Safari Storme Mr Kant with the Ultra Mr Wadia with the Range Rover Evoque
BOARD OF DIRECTORS

9
FINANCIAL HIGHLIGHTS STATUTORY REPORTS FINANCIAL STATEMENTSCORPORATE OVERVIEW
DR RAGHUNATH A MASHELKARNon Executive, Independent Director
Dr Mashelkar is an eminent chemical
engineering scientist retired from the post
of Director General from the CSIR and is
the President of Indian National Science
Academy (INSA), National Innovation
Foundation, Institution of Chemical
Engineers, UK and Global Research
Alliance. The President of India honoured
Dr Mashelkar with the Padmashri (1991)
and the Padmabhushan (2000).
Dr Mashelkar holds a Ph.D in Chemical
Engineering from the Bombay University.
He was appointed as an Independent
Director of the Company w.e.f.
August 28, 2007.
MR NASSER MUNJEENon Executive, Independent Director
Mr Nasser Munjee served with HDFC
for over 20 years at various positions
including as its Executive Director. He was
the Managing Director of Infrastructure
Development Finance Co. Ltd. (IDFC)
up to March 2004. Presently he is the
Chairman of Development Credit Bank
(DCB) since June 2005 and is also on the
Board of various Multinational Companies
and Trusts. Mr Munjee is a Technical
Advisor on the World Bank-Public Private
Partnership Infrastructure and Advisory
Fund.
Mr Munjee holds a Bachelor’s degree
and a Master’s degree from the London
School of Economics, UK.
He was appointed as an Independent
Director w.e.f. June 27, 2008.
MR SUBODH BHARGAVANon Executive, Independent Director
Mr Bhargava retired from Eicher Group
of Companies as Group Chairman and
Chief Executive in March 2000. He was
the past President of the Confederation of
Indian Industry (CII) and the Association
of Indian Automobile Manufacturers;
and the Vice President of the Tractor
Manufacturers Association. He is currently
associated as a Director of several
Indian corporates, including Tata
Communications Limited and Tata Steel
Limited.
Mr Bhargava holds a degree in
Mechanical Engineering from the
University of Roorkee.
He was appointed as an Independent
Director of the Company w.e.f.
June 27, 2008.
Dr Mashelkar with the Super Ace Mr Munjee with the Xenon Mr Bhargava with the Prima
Board of Directors (8-11)
10
68th ANNUAL REPORT 2012-13
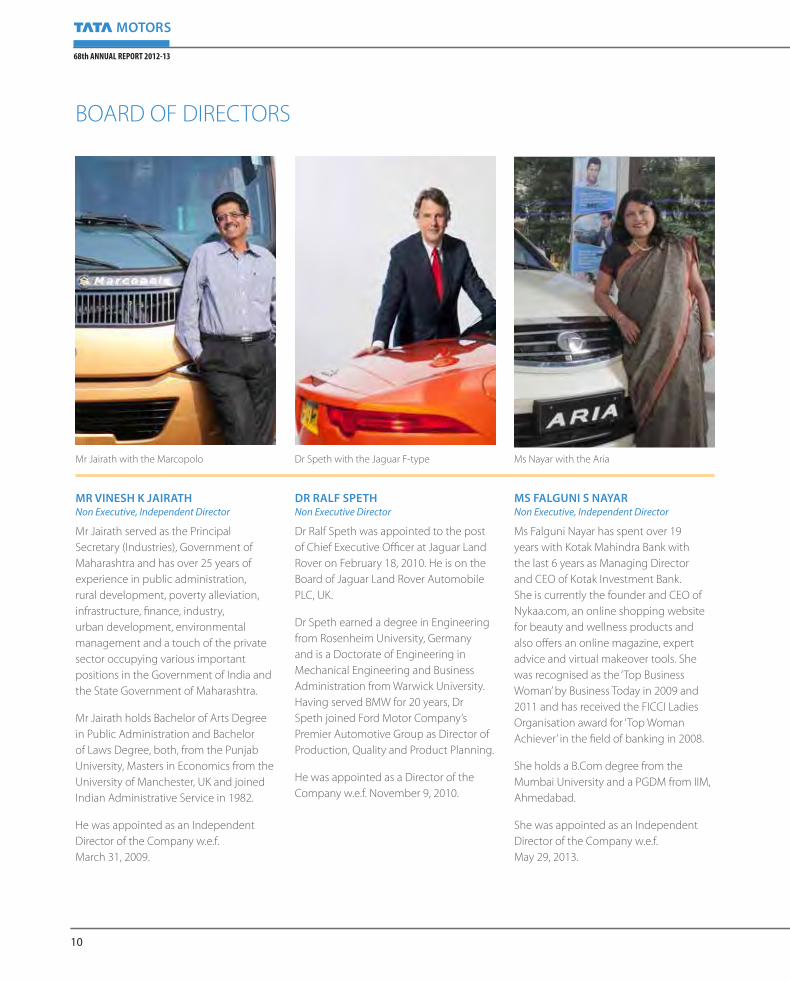
MR VINESH K JAIRATHNon Executive, Independent Director
Mr Jairath served as the Principal
Secretary (Industries), Government of
Maharashtra and has over 25 years of
experience in public administration,
rural development, poverty alleviation,
infrastructure, finance, industry,
urban development, environmental
management and a touch of the private
sector occupying various important
positions in the Government of India and
the State Government of Maharashtra.
Mr Jairath holds Bachelor of Arts Degree
in Public Administration and Bachelor
of Laws Degree, both, from the Punjab
University, Masters in Economics from the
University of Manchester, UK and joined
Indian Administrative Service in 1982.
He was appointed as an Independent
Director of the Company w.e.f.
March 31, 2009.
MS FALGUNI S NAYAR Non Executive, Independent Director
Ms Falguni Nayar has spent over 19
years with Kotak Mahindra Bank with
the last 6 years as Managing Director
and CEO of Kotak Investment Bank.
She is currently the founder and CEO of
Nykaa.com, an online shopping website
for beauty and wellness products and
also offers an online magazine, expert
advice and virtual makeover tools. She
was recognised as the ‘Top Business
Woman’ by Business Today in 2009 and
2011 and has received the FICCI Ladies
Organisation award for ‘Top Woman
Achiever’ in the field of banking in 2008.
She holds a B.Com degree from the
Mumbai University and a PGDM from IIM,
Ahmedabad.
She was appointed as an Independent
Director of the Company w.e.f.
May 29, 2013.
DR RALF SPETHNon Executive Director
Dr Ralf Speth was appointed to the post
of Chief Executive Officer at Jaguar Land
Rover on February 18, 2010. He is on the
Board of Jaguar Land Rover Automobile
PLC, UK.
Dr Speth earned a degree in Engineering
from Rosenheim University, Germany
and is a Doctorate of Engineering in
Mechanical Engineering and Business
Administration from Warwick University.
Having served BMW for 20 years, Dr
Speth joined Ford Motor Company’s
Premier Automotive Group as Director of
Production, Quality and Product Planning.
He was appointed as a Director of the
Company w.e.f. November 9, 2010.
Mr Jairath with the Marcopolo Dr Speth with the Jaguar F-type Ms Nayar with the Aria
BOARD OF DIRECTORS

11
FINANCIAL HIGHLIGHTS STATUTORY REPORTS FINANCIAL STATEMENTSCORPORATE OVERVIEW
MR KARL J SLYM Managing Director
Mr Karl Slym joined Tata Motors as the
Managing Director in 2012. He leads
operations of Tata Motors in India and
international markets, excluding Jaguar
and Land Rover business.
Before joining Tata Motors, Mr Slym was
the Executive Vice President & Board
Member, SGMW Motors, China (a General
Motors Joint Venture), prior to which he
was President, Managing Director and
Board Member of General Motors in India.
For over two decades, Mr Slym has been
with Toyota and General Motors in various
positions across geographies.
Mr Slym is an alumnus of Stanford
University and a Sloan Fellow.
MR RAVINDRA PISHARODY Executive Director (Commercial Vehicles)
Mr Ravindra Pisharody is the Executive
Director (Commercial Vehicles) since June
21, 2012 having joined Tata Motors as Vice
President Commercial Vehicles (Sales &
Marketing), in 2007.
He is also on the board of various Tata
Motors Group Companies.
Before joining Tata Motors, he worked
with Castrol Ltd., a subsidiary of BP, and
with Philips India, a subsidiary of the
Dutch company in various roles.
Mr Pisharody is an alumnus of IIT,
Kharagpur and IIM, Kolkata.
MR SATISH B BORWANKARExecutive Director (Quality)
Mr Satish Borwankar started his career
with Tata Motors in 1974, as a Graduate
Engineer Trainee and is currently the
Executive Director (Quality) w.e.f.
June 21, 2012.
He has worked in various executive
positions, for overseeing and
implementing product development,
manufacturing operations and quality
control initiatives of the Commercial
Vehicles Business Unit. He has played a
significant role in setting up greenfield
projects of the Company.
Mr Borwankar is a Mechanical Engineer
from IIT, Kanpur.
Mr Slym with the Nano Mr Pisharody with the Ultra Mr Borwankar with the Sumo Gold
Board of Directors (8-11)

12
68th ANNUAL REPORT 2012-13
DELIVERING EXPERIENCES
LeaderIn commercial vehicles manufacturing in India
LargestAutomobile company in India
Over 8 millionVehicles rolled out on Indian roads since inception

13
FINANCIAL HIGHLIGHTS STATUTORY REPORTS FINANCIAL STATEMENTSCORPORATE OVERVIEW
4thLARGEST MANUFACTURER OF BUSES GLOBALLY
5thLARGEST MANUFACTURER OF TRUCKS IN THE WORLD
62,000 +CONSOLIDATED WORKFORCE
182 countriesPRESENCE ACROSS THE WORLD
2004LISTED ON NYSE
Established in 1945, Tata Motors’
presence cuts across the length and
breadth of India. Over 8 million Tata
vehicles ply on Indian roads, since the
first rolled out in 1954. The Company’s
manufacturing base in India is spread
across Jamshedpur (Jharkhand), Pune
(Maharashtra), Lucknow (Uttar Pradesh),
Pantnagar (Uttarakhand), Sanand
(Gujarat) and Dharwad (Karnataka). The
Company’s dealership, sales, services
and spare parts network comprises
over 6,600 touch points. Through
subsidiaries and associate companies,
Tata Motors has operations in the UK,
South Korea, Thailand, Spain, South Africa
and Indonesia. Among them is Jaguar
Land Rover, acquired in 2008.
SETTING BENCHMARKS
Tata Motors Limited is India’s largest
automobile company. It is the leader in
commercial vehicles and among the leaders
in passenger vehicles in India with winning
products in the compact, midsize car and
utility vehicle segments. It is also the world’s
fourth largest bus and fifth largest truck
manufacturer.
Delivering Experiences (12-13)

14
68th ANNUAL REPORT 2012-13
4,500+ENGINEERING TEAM STRENGTH
TATA MOTORS GROUP
` 1,89,,629 croresCONSOLIDATED TOTAL REVENUE IN 2012-13
` 79,2744 croresMARKET CAPITALISATION (AS ON MARCH 31, 2013)
(Domestic & International) Units produced Units Sold
Commercial Vehicles (CV) 606,963 593,897
Passenger Vehicles (PV) 580,334 598,082
PRODUCTION CAPABILITIES
KEY PERFORMANCE INDICATORS
` 99,893 croresCONSOLIDATED PROFIT FOR THE YEAR 2012-13

15
FINANCIAL HIGHLIGHTS STATUTORY REPORTS FINANCIAL STATEMENTSCORPORATE OVERVIEW
25+NUMBER OF NEW PRODUCT LAUNCHES IN 2012-13
12NUMBER OF R&D CENTRES ACROSS THE WORLD
6,600+SALES AND SERVICE TOUCH POINTS ACROSS THE WORLD
14..07%%EBITDA MARGIN
`̀ 22,0062 crorresNET CASH FROM OPERATIONS
11.442 tiimessDEBT EQUITY RATIO
Key Performance Indicators (14-15)

16
68th ANNUAL REPORT 2012-13
COMMERCIAL VEHICLES
SMALL COMMERCIAL VEHICLES (SCV)Ace | Super Ace | Ace Zip Magic (Passenger) | Magic Iris (Passenger)
PICKUPSRX Pickup | Xenon Pickup
PRODUCTS AND BRANDS
LCV PASSENGERWinger | Winger Platinum | City Ride LP709
BUSESGlobus | Starbus | Starbus Ultra | Hispano | Marcopolo | Divo
LIGHT COMMERCIAL VEHICLES (LCV)407 | 1109 | Ultra range
MEDIUM AND HEAVY COMMERCIAL VEHICLES (MHCV)LPT 2523 | LPT 3723 | Novus | Prima trucks | Construck tippers and tractors

17
FINANCIAL HIGHLIGHTS STATUTORY REPORTS FINANCIAL STATEMENTSCORPORATE OVERVIEW
PASSENGER VEHICLES
MICRONano
COMPACTIndica (eV2, Vista) | Indigo (eCS) | Vista D 90
VANSVenture
PREMIUM AND LUXURYJaguar (XF, XJ, XK) | Land Rover (Freelander, Defender, Discovery, Range Rover, Range Rover Sport, Evoque)
MIDSIZEIndigo | Manza
UTILITY VEHICLES (UV)Sumo Gold | Sumo Grande | Safari Storme | Safari Dicor | Aria | Xenon XT
Products and Brands (16-17)

18
68th ANNUAL REPORT 2012-13
NORTH AMERICA
5 COUNTRIESUUNITEDD STATTES Canada | Guam | Mexico | Puerto Rico
CENTRAL AND SOUTH AMERICA
Antigua and Barbuda | Argentina | Aruba |
Bahamas | Barbados | Belize | Bermuda |
Brazil | British Virgin Islands |
Cayman Islands | Chile | Colombia |
Costa Rica | Dominica | Dominican Republic |
Ecuador | El Salvador | Falkland Isles | Guatemala |
Grenada | Guyana | Haiti | Honduras | Jamaica |
Netherland Antilles | Nicaragua | Panama |
Paraguay | Peru | Saint Barthelemy | St. Kitts and
Nevis | St. Lucia, West Indies | Suriname | Trinidad
and Tobago | Turks and Caicos Islands | Uruguay |
Venezuela
AFRICA
43 COUNTRIESAlgeria | Angola | Benin | Botswana | Burkina Faso | Burundi | Chad | Congo, Democratic Republic |
Congo, Republic | Djibouti | Egypt | Eritrea | Ethiopia | Gabon | Gambia | Ghana | Guinea | Guinea-Bissau |
Ivory Coast | Kenya | Liberia | Libya | Madagascar | Malawi | Malta | Mauritania | Mauritius | Morocco |
Mozambique | Namibia | Nigeria | Rwanda | Senegal | Seychelles | Sierra Leone | South Africa | Sudan |
Tanzania | Togo | Tunisia | Uganda | Zambia | Zimbabwe
MANUFACTURING FACILITIES:
SSOUTH AAFRICAMMOROCCCO
TTata Motors leveerages a compreehensive global distribution network operating
inn 182 countries and over 6,6000 sales and servicce touch points.
GLOBAL PRESENCE
37 COUNTRIES

19
FINANCIAL HIGHLIGHTS STATUTORY REPORTS FINANCIAL STATEMENTSCORPORATE OVERVIEW
EUROPE
51 COUNTRIESUUKAlbania | Andorra | Armenia | Austria | Azerbaijan | Belarus | Belgium | Bulgaria | Croatia | Cyprus|
Czech Republic | Denmark | Estonia | Faroe Islands | Finland | France | Georgia | Germany |
Gibraltar | Gran Canaria | Greece | Guadeloupe | Hungary | Iceland | Ireland | Israel | Italy |
Kazakhstan | Latvia | Lithuania | Luxembourg | Macedonia | Malta | Martinique | Moldova |
Monaco | Montenegro | Netherlands | Norway | Poland | Portugal | Reunion | Romania | Serbia |
Slovakia | Slovenia | Spain | Sweden | Switzerland | Tenerife | Turkey | Ukraine
MANUFACTURING FACILITIES:
UUKSPAIN
R&D CENTRES:
UUK ITTALY SPAIN
ASIA AND OCEANIA
46 COUNTRIES
INDIA | CHINAAfghanistan | Australia | Bahrain | Bangladesh | Bhutan | Brunei |
Cambodia | Fiji | Hong Kong | Indonesia | Iraq | Israel | Japan | Jordan|
Korea | Kuwait | Laos | Lebanon | Macau | Malaysia | Maldives |
Mongolia | Myanmar | Nepal | New Caledonia | New Zealand | Oman|
Pakistan | Palestine | Papua New Guinea | Philippines | Qatar | Russia |
Saudi Arabia | Singapore | Sri Lanka | South Korea | Syria | Tahiti |
Taiwan | Thailand | UAE | Vietnam | Yemen
MANUFACTURING FACILITIES:
INNDIA TTHAILANDSSOUTH KOREEA
R&D CENTRES:
INNDIASSOUTH KOREEA
Global Presence (18-19)

20
68th ANNUAL REPORT 2012-13
MILESTONES
Tata Motors enters into distribution agreement in Myanmar
Launch of Tata Ace in South Africa
Tata Motors enters Bangladesh’s new car market
1961-62 TO 1970-71 1971-72 TO 1980-81
FIRST TRUCK ROLL-OUT IN 1954The first diesel truck from the Tata-Mercedes Benz partnership
19
61
-62
19
62
-63
19
63
-64
19
64
-65
19
65
-66
19
66
-67
19
67
-68
19
68
-69
19
69
-70
19
70
-71
Turnover (Standalone) Profits (Standalone)
150 5
4
3
2
1
0
100
50
0
Tu
rno
ve
r (`
cro
res)
Pro
fits
(`
cro
res)
19
71
-72
19
72
-73
19
73
-74
19
74
-75
19
75
-76
19
76
-77
19
77
-78
19
78
-79
19
79
-80
19
80
-81
Turnover (Standalone) Profits (Standalone)
500
750
20
30
10
0
250
0
Tu
rno
ve
r (`
cro
res)
Pro
fits
(`
cro
res)
1945-46 to 1960-61
Turnover (Standalone) Profits (Standalone)
19
45
-46
19
49
-50
19
53
-54
19
54
-55
19
55
-56
19
56
-57
19
57
-58
19
58
-59
19
59
-60
19
60
-61
2.5
2.0
1.5
1.0
0.5
0
40
30
20
10
0
Tu
rno
ve
r (`
cro
res)
Pro
fits
(`
cro
res)
HIGHLIGHTS 2012-13

21
FINANCIAL HIGHLIGHTS STATUTORY REPORTS FINANCIAL STATEMENTSCORPORATE OVERVIEW
Tata Motors plant at Dharwad comes on stream
Tata Safari Storme, the Real SUV, hits the road
Tata Ace races through the one-million mark in just 2,680 days
PRIMA CONSTRUCK TIPPERLaunched in 2010-11
1981-82 TO 1991-92
2003-04 TO 2012-13
YEAR 1945-46 TO 1960-611992-93 TO 2002-03
Milestones (20-21)
Turnover (Standalone) Profits (Standalone)
4
100
150
50
0
3
2
1
0
19
81
-82
19
82
-83
19
83
-84
19
84
-85
19
85
-86
19
86
-87
19
87
-88
19
88
-89
19
89
-90
19
90
-91
19
91
-92
Tu
rno
ve
r (`
‘00
0 c
rore
s)
Pro
fits
(`
cro
res)
20
03
-04
20
04
-05
20
05
-06
20
06
-07
20
07
-08
20
08
-09
20
09
-10
20
10
-11
20
11
-12
20
12
-13
Turnover (Standalone)
Profits (Standalone)
Turnover (Consolidated)
Profits (Consolidated)
225 15
12.5
10
7.5
5
2.5
0
-2.5
-5
200
175
150
125
100
75
50
25
0
Tu
rno
ve
r (`
‘00
0 c
rore
s)
Pro
fits
(`
‘00
0 c
rore
s)
19
92
-93
19
93
-94
19
94
-95
19
95
-96
19
96
-97
19
97
-98
19
98
-99
19
99
-00
20
00
-01
20
01
-02
20
02
-03
Turnover (Standalone)
Profits (Standalone)
Turnover (Consolidated)
Profits (Consolidated)
16
12
8
4
0
1200
800
400
0
-400
-800
Tu
rno
ve
r (`
‘00
0 c
rore
s)
Pro
fits
(`
cro
res)

22
68th ANNUAL REPORT 2012-13
DRIVING ACCOUNTABILITY

23
FINANCIAL HIGHLIGHTS STATUTORY REPORTS FINANCIAL STATEMENTSCORPORATE OVERVIEW
Within the Company, accountability
stems from every individual. A culture
of accountability is inculcated within
each member of our team to achieve
our overall goal of delivering world-
class products and experiences to our
customers. This is in turn, is underscored
by our philosophy of working together as
one team with one vision.
Our value of accountability extends
towards our dealers as well. Our
dealers are an important part of
our stakeholder group and we have
taken measures to ensure that their
goals growth and profitability are not
compromised.
At Tata MMMotoorsss wwwe beelieevvve thhatttt aaacccouunnnntaabilittty towardds aaall ourrrr stttakkeehooooldddeers – cuuusttomeerrs, dealerss, eeemmploooyyeeeess, iinvvvveeestorrs aaaannnd commuunnnitiiess –––– ddrivves uuuus too aachhhhieeevee nneeewwwerr heightss ooof eexxceeeelleeenncee.
These measures include regular financial
audits of dealers, reduction of interest
costs and trade inventories. By limiting
inventories to one month’s reserves, we
ensure that our dealers are able to swiftly
respond to changing market demand.
Additionally, our Tata Genuine Parts
(TGP) programme enables our customers
to use original Tata Motors spares.
These spares, easily identifiable by
holograms, ensures that our customers
benefit from our quality assurance and
guarantee of better products.
DISPLAYING ACCOUNTABILITY AT WORKTo drive accountability across the
organisation, as a team, we:
> Demonstrate integrity and respect for
others at all times
> Go the extra mile to support the
customer and deliver great business
results
> Speak up and take ownership to help
drive the success of decisions
> Look beyond your own immediate role
and take a stand for what will deliver
both short and long-term success
> Accept responsibility to learn and
improve, not rationalise and explain
> Raise the bar on others to enhance
the culture of accountability in the
Company
Driving Accountability (22-23)

24
68th ANNUAL REPORT 2012-13
FOCUSING ON CUSTOMERS & PRODUCTS
COMMERCIAL VEHICLES
> Tata Xenon Pick-up, a stylish and rugged workhorse
> Tata LPT 3723, the first 5-axle rigid truck in the country, in the 10x4 configuration
> Tata PRIMA 4938 tractor
> Tata PRIMA 3138K tipper
> Tata PRIMA 4923
> Tata PRIMA 4023 tractor
> Tata LPK 3118 tipper
PASSENGER VEHICLES
> Tata Vista D90, a sportier, powerful hatchback
> Tata Safari Storme, the Real SUV
> Tata Manza, a Club Class sedan
> Tata Aria Pure LX
> Nano Special Edition
> Tata Indica eV2, the most fuel efficient hatchback in its class
MAJOR LAUNCHES DURING THE YEAR

25
FINANCIAL HIGHLIGHTS STATUTORY REPORTS FINANCIAL STATEMENTSCORPORATE OVERVIEW
In addition to improving our operational
efficiencies, we enhanced customer
engagement through focused marketing
campaigns and refreshing showroom
decor and the sales experience.
Moreover, a system of key account
management allows us to reach out to
customers to address specific concerns
and gain insights into their experience
with their vehicles.
In the Commercial Vehicle segment we
cemented our leadership through a
series of launches. These launches were
supported by:
> the launch of a telematics programme
to enhance productivity
> an increased focus on AMC and our
non-vehicle business
> a best-in-class warranty assurance and
> an increase in our service network by
adding 400 new touchpoints
In our Passenger Vehicle segment
attractive offers of select models such as
the Manza Club Class and the Indica
eV2 drove increased mindshare
among customers.
Additionally, we revamped the Concorde
showrooms in Prabhadevi, Mumbai, and
South Extension, New Delhi and Pune to
engage our customers and improve their
purchase experience.
In order to remain relevant to our
customers, we launched HORIZONEXT.
An aggressive customer-focused strategy,
HORIZONEXT aims to provide the best
customer experience
> from best vehicle experience to
superlative purchase experience
> technology-intense after-market
service support.
Even as we work towards our next-
generation product pipeline, we
are bringing best-in-class vehicle
experiences across different categories
to enhance some of our great brands.
With HORIZONEXT, we begin this exciting
journey that will see several pioneering
products and services for the ever-
evolving customer.
At Tata Motooorss, ouuur fffocccus onnn adddddrrressinnng ccccussstommmeer requiremeenttts ttthrooougggh a ssslewww oooof ppproduct aaanddd servviceeee offerings is paramoounnnt to ooourrr buuusinnnessss oooopeeeratttions.. Attt Taaata Mooootoors,, we embraacinnng beeetteeeer wwwayyys ooof wwwworrkinnng anndd sssmaaarteer wwwways of satisfying ouuur cccusssttommmeeers. Evveeryyy daaay. Thhhhe TTTatta bbrannnd has brougghttt thhhe bbbesssst eeever cooommmmbinnnatttionnn ooof teeechhhnooloogggy,, space, commffoorttt, fuuuel effiffifficieeencccy ttto proooviddde annn exxxcittingggg vvaluue propositioon to custoooomeersss in thee Innndiiiannn paaaassenggerr vehicle markkkett.
Focusing on Customers &
Products (24-25)

26
68th ANNUAL REPORT 2012-13
EMPHASISING EXCELLENCE
27
FINANCIAL HIGHLIGHTS STATUTORY REPORTS FINANCIAL STATEMENTSCORPORATE OVERVIEW
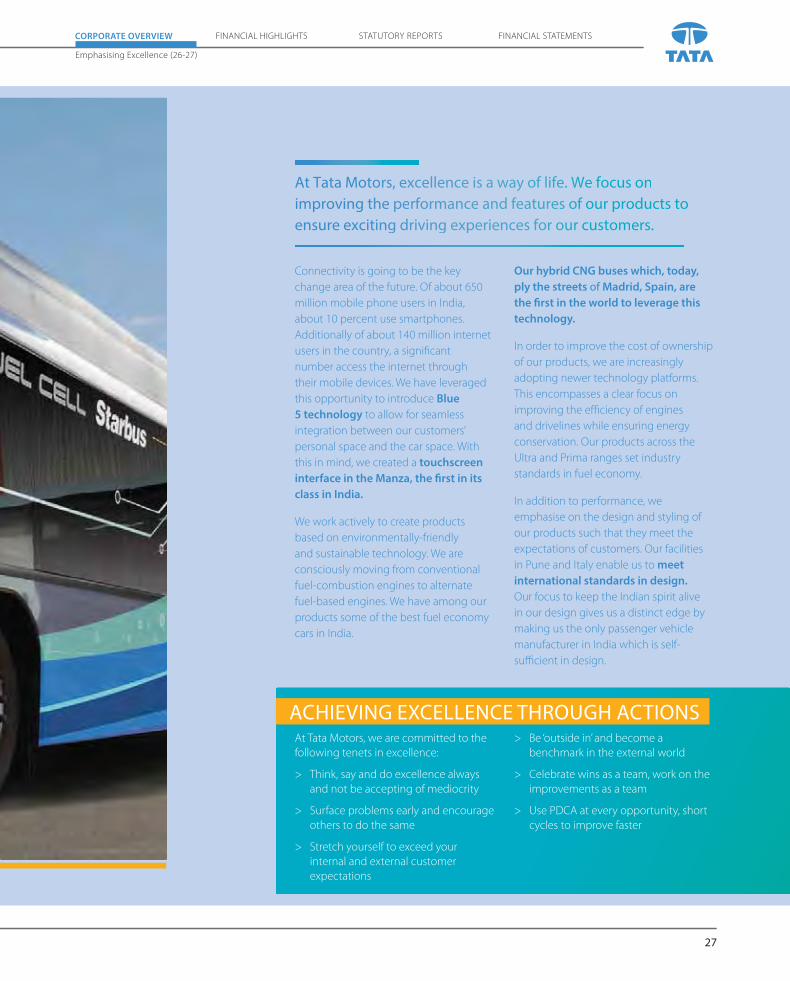
Connectivity is going to be the key
change area of the future. Of about 650
million mobile phone users in India,
about 10 percent use smartphones.
Additionally of about 140 million internet
users in the country, a significant
number access the internet through
their mobile devices. We have leveraged
this opportunity to introduce Blue
5 technology to allow for seamless
integration between our customers’
personal space and the car space. With
this in mind, we created a touchscreen
interface in the Manza, the first in its
class in India.
We work actively to create products
based on environmentally-friendly
and sustainable technology. We are
consciously moving from conventional
fuel-combustion engines to alternate
fuel-based engines. We have among our
products some of the best fuel economy
cars in India.
Our hybrid CNG buses which, today,
ply the streets of Madrid, Spain, are
the first in the world to leverage this
technology.
In order to improve the cost of ownership
of our products, we are increasingly
adopting newer technology platforms.
This encompasses a clear focus on
improving the efficiency of engines
and drivelines while ensuring energy
conservation. Our products across the
Ultra and Prima ranges set industry
standards in fuel economy.
In addition to performance, we
emphasise on the design and styling of
our products such that they meet the
expectations of customers. Our facilities
in Pune and Italy enable us to meet
international standards in design.
Our focus to keep the Indian spirit alive
in our design gives us a distinct edge by
making us the only passenger vehicle
manufacturer in India which is self-
sufficient in design.
At Tata Motooorss, exxxceeeelleeence isss a waaay ooof life... WWWe fffocus oonn improvingg thhhe peerfoooormmmannnce annnnd fffeaaaturrress offf ouuur pproodduuctss too ensure exxcitttinggg drivviinggg exxxpeeerieeeenccces forr ouuur cussstoomeeeers.
ACHIEVING EXCELLENCE THROUGH ACTIONSAt Tata Motors, we are committed to the
following tenets in excellence:
> Think, say and do excellence always
and not be accepting of mediocrity
> Surface problems early and encourage
others to do the same
> Stretch yourself to exceed your
internal and external customer
expectations
> Be ‘outside in’ and become a
benchmark in the external world
> Celebrate wins as a team, work on the
improvements as a team
> Use PDCA at every opportunity, short
cycles to improve faster
Emphasising Excellence (26-27)

28
68th ANNUAL REPORT 2012-13
DELIVERING WITH SPEED

29
FINANCIAL HIGHLIGHTS STATUTORY REPORTS FINANCIAL STATEMENTSCORPORATE OVERVIEW
At Tata MMotttorss, wwe aree innnteenssssifyyinggg ooourr accctivvitieees ttto briingg our produucttts tto ttheeee mmarrkett faaaaster. Laaast yyyeaar, weee innnntrooducedd over 25 nnewww andd reeeefreeshhhedd prrrodducccts acccrosss ssegggmmmennnts to address cchaaangging nnnneeedsss off cuuuusttommmerrs. AAsss thhe mmmaarrkeeets slowed ovver thhe paaast yeaaar, weeee reesppponnndeeeed byy reeepoooositttionninng our produucttts ffromm oour raaangge of veeehicccleess.
As the markets realign to a newer
economic reality, both in India and across
the world, our robust pipeline of products
which anticipate customer requirements
will allow us to capture a strong foothold
in key market segments. Our offerings in
the Commercial Vehicle division span a comprehensive range of products built
to address the specific requirements of
functionality, load, comfort and engine
capability.
In our commercial vehicle business,
we anticipate market movement and
recognise latent customer needs. For
example, we introduced the Ace Zip,
Tata Magic IRIS to cater to the Light
Commercial Vehicle segment. We also
anticipated arrival of international players
and accordingly launched globally
benchmarked products like the Tata
Prima, the World Standard Range of
Trucks. We are similarly anticipating the
move to fully-built vehicles for trucks
and buses. Our newly launched products
showcase a best-in-class features, clear
evolution of technology for a more
refined drive, interiors defined by
ergonomics and aesthetics, performance,
design and human-machine interface.
Our focus on extending our pipeline
of products in the Passenger Vehicle division is based on a separate set of requirements, driven by evolving technology platforms and intensifying competition. In order to meet and
surpass the very precise customer
requirements, our offerings from this
division are constantly refreshed. As
such, we have introduced lighter models
providing space efficiency and better
engine performance at preferred price
points.
INCORPORATING SPEED IN OPERATIONS> Prioritise and focus on the things that
matter most
> Make balanced decisions based on
the facts we have and the facts we
absolutely need (use the 80% rule)
> Engage others up front and encourage
diverse perspectives to enable better
decisions
> Test ideas, experiment, recognise
mistakes and course correct as
necessary
> Take informed risks by evaluating both
short and long term costs and benefits
Delivering with Speed (28-29)

30
68th ANNUAL REPORT 2012-13
OOur community develoopment proggramme evolved to fulfill
the most preessing needs of the commmunity that are regularly
aassessed in consultatioon with varioous internal and external
sstakeholder groups. Ouur Communitty Developmment Strategy
iss periodicallly reviewed keeping pacce with changing times.
We realise the value of inclusive growth
and position our strategy to compliment
Company’s business objectives. We have
adopted Tata Group Affirmative Action
(AA) Policy towards inclusive growth
of marginalised sections of society, the
Scheduled Castes (SC) and Scheduled
Tribes (ST). Every year, we participate in
TAAP (Tata Affirmative Action Program)
Assessment, developed on the lines of
TBEM (Tata Business Excellence Model).
Since inception, our AA Program has
been top ranked and this year we also
received TAAP Jury Award.
AROGYA
We provide curative and preventive
medical facilities in communities with
special focus on maternal and child
health care. Our medical clinics not only
provide necessary medicine but they also
carry various social messages. Moreover,
in the premises of this hospital, we have
established a state-of-art 16 bedded
Malnutrition Treatment Centre (MTC),
in partnership with UNICEF Jharkhand.
Since, inception this centre has saved
lives of over 400 children.
AMRUTDHARA
Availability of clean, potable drinking
water becomes an issue particularly
during summer season and it adversely
affects health of vulnerable sections –
women, children and elderly. To bridge
this gap, in 2010-11 we instituted
Safe Drinking Water project under
aegis of SMDF (Sumant Moolgaonkar
Development Foundation). Till March
2013, we have provided drinking water
solutions in 68 villages.
VIDYADHANAM
Our education programme envisions
bringing a meaningful and positive
impact on the lives of children residing in
rural areas through effective, case based
holistic approach. As a result of these
focussed initiatives, students associated
with our education initiative continuously
posted more than 90% result in senior
secondary examination.
KAUSHALYA
We have partnered with 135 ITIs across
19 states and focussed initiatives have
been undertaken in these ITIs in terms of
upgrading the in-house training facilities,
improving the quality of training by
Training the Trainer etc.
AROGYA
- Medical Camps in villages
- Malnutrition treatment and
construction of low-cost toilets
- Safe Drinking Water
VIDYADHANAM
- Scholarship programme
- Extra-coaching classes for weak
students
- Infrastructure development
KAUSHALYA
- Training in Agriculture and Allied
Activities
- Driver Training Program
- ITI adoption programme - training
of youth in automotive trades
VASUNDHARA
- Sapling plantation
- Soil and Water Conservation
- Awareness Building on
environmental issues
COMMUNITY DEVELOPMENT
SUSTAINABILITY

31
FINANCIAL HIGHLIGHTS STATUTORY REPORTS FINANCIAL STATEMENTSCORPORATE OVERVIEW
PROFESSIONAL DRIVER TRAINING
PROGRAMME
Our Professional Driver Training
Programme is aligned with the business
needs of the organisation. We recognise
that drivers are the primary customers of
our commercial vehicles and to sustain
business growth, more drivers will be
required in upcoming years. During the
year, we have trained 564 novice drivers
through seven centres spread across the
country. The initiative has developed
strong governmental linkages particularly
for the training fees subsidy of the
candidates.
VASUNDHARA
In the present era of ever-increasing
energy consumption, the importance
of fuel such as biogas and biomass
based power generation has greatly
increased. At Sanand, as pilot project,
we have installed 5 biogas units as pilot
in 2 villages of Manipur and Melasana.
At Pantnagar, we mentored community
clubs to protect environment. Through
these community clubs, we sensitised
villagers about climate change and green
environment.
In 2012-13, we have planted 230,000
trees in partnership with NGOs,
Government Line departments and
communities.
Sustainability (30-33)

32
68th ANNUAL REPORT 2012-13
INTERNATIONAL CSR INITIATIVESJAGUAR LAND ROVER
In order to help the local community
and strengthen JLR’s reputation as a
responsible business, JLR encourages
its employees to volunteer their
time, as an individual or as team, for
education, youth development and
environment. Volunteering projects offer
personal development opportunities
including the development of skills and
competencies including leadership,
team working, project management and
communication.
In 2012, JLR donated over 17,000 hours of
employee time on community projects
and volunteering.
Inspiring Tomorrow’s Engineers -
School Education Programme
Jaguar Land Rover’s ‘Inspiring Tomorrow’s
Engineers’ programme is working
closely with schools across UK to
promote learning and engagement
with STEM subjects and to help create
the next generation of engineers and
technologists. In 2012, more than
22,000 school children and 2,000
teachers visited JLR Education Business
Partnership Centres. A further 300 young
people participated in work experience
placements
National Schools Challenge Projects
As part of its programme to support
the Government’s STEM Agenda, JLR
has worked in conjunction with other
automotive, engineering and academic
organisations to develop three national
challenge programmes for schools. These
educational challenges help to develop
knowledge, skills and understanding of
STEM subjects and promote engineering
careers by providing pupils with hands-
on projects that enable them to explore
different aspects of the automotive
industry in a stimulating and exciting way.
In 2012, more than 200,000 young people
directly participated in ITE.
TATA DAEWOO COMMERCIAL
VEHICLE COMPANY
Tata Daewoo Commercial Vehicle
Company (TDCV) has donated KRW 46.5
Million towards Scholarship, Delivery
SUSTAINABILITY

33
FINANCIAL HIGHLIGHTS STATUTORY REPORTS FINANCIAL STATEMENTSCORPORATE OVERVIEW
of coal briquette, donation of goods.
The Company also conducted Training
Program for Teachers in Jeobuk and
adopted Gunsan Youngkwang Girls’
Middle School under Company – School
alliance program. TDCV Employees
volunteered 2,424 hours towards helping
in children and senior citizen shelters,
building houses and blood donation.
TDCV also won Nanum-nation grand
prize Award with the Minister of Health
and Welfare and Award a gold prize with
the Republic of Korea National Red Cross.
TATA MOTORS SOUTH AFRICA
Tata Motors South Africa (TMSA)
partnered with two organisations for
reaching the poor community in Pretoria
South Africa. TMSA donated wood to
partner organisations. Earlier the packing
wood generated out of the vehicle kits
were sold at Rand 400 per tonne to the
scrap buyers. Now this wood goes to
underprivileged people living in
low-cost housing areas.
GHANA
As a part of Joy of Giving Week, Tata
Motors International Business Team
Ghana and their family members visited
country side orphanage in a remote
location at Bawjaise, 2 hour drive from
Accra. The orphanage was started in 1981
by Madam Emma Boafo with mission to
provide parental care and training for the
needy children to prepare them for the
challenges of life with confidence. The
orphanage currently supports more than
150 children with newborns and infants
up to age of twelve. The team organised
lunch and donated rice, books, notebooks
and stationery to children.
Sustainability (30-33)
Note: Tata Motors has published a detailed Business Responsibility Report. This is available for download on our website www.tatamotors.com

34
68th ANNUAL REPORT 2012-13
TATA MOTORSCORPORATE
> India’s 2nd Most Reputed Company in the Nielsen
Corporate Image Monitor (CIM) Study 2012-13
> India’s Most Valuable Corporate Brand in the annual study
done by Brand Finance
> Accredited with the ‘Sustainable Plus’ marque (Gold
category) – the world’s first Corporate Sustainability label
by CII
> Forbes Fab50 list of the best publicly traded companies in
Asia-Pacific, for thriving amid decelerating growth in Asia
> Star Performer Award 2011-12 by Indian Engineering
Export Promotion Council (EEPC)
> Bankers Choice Award at the Asian Banker Leadership
Awards 2012
> Golden Peacock Global Award for Sustainability 2012 for
significant contribution towards corporate sustainability
> ET Now World CSR Award for Best CSR Practice
> Only Indian company to feature among top 15 in R&D
in emerging economies – OECD Inclusive Development
Report
> Best Learning Organisations of Asia (2011-12)
> Annual Gartner Top 25 Asia Pacific Supply Chain
Organisations 2012
> Most Preferred CV of the Year at the Northeast Consumer
Awards 2012
> IT Business Excellence Award by the Computer Society of
India
AWARDS AND ACHIEVEMENTS

35
FINANCIAL HIGHLIGHTS STATUTORY REPORTS FINANCIAL STATEMENTSCORPORATE OVERVIEW
Awards and Achievements (34-35)
> Rural Marketing Association of India Award for Best CSR by
a Brand & Best Long-term Rural Communication Initiative
> Champions of the Champions trophy at the Association of
Business Communicators of India (ABCI) Awards
BRANDS
> The Tata Indigo eCS enters Limca Book of Records for a
non-stop nation-wide endurance drive, across 19 states,
covering over 14,000 kms, in just 15 days
> Tata Nano rated Most Trusted 4-wheeler brand - Brand
Trust Report India Study 2013 and 2nd most trusted brand
(4-wheeler) - ET Brand Equity Survey 2012.
JAGUAR LAND ROVER> No. 1 manufacturer in the J.D. Power & Associates & What
Car? UK Vehicle Ownership Satisfaction Study (VOSS) 2012
> Platinum Big Tick In BITC’S CR Index for outstanding CSR
> Jaguar F-Type declared 2013 World Car Design of the Year
> Range Rover declared What Car? - Luxury Car of the Year
> Range Rover Evoque wins Best Compact SUV at 2012 Auto
Express Awards
> Land Rover Discovery 4 3.0 SDV6 SE - Australia’s Best Cars
Best All Terrain 4WD Award
MANUFACTURING
> Tata Motors PVBU plants, Pune & Ahmedabad were
conferred the pinnacle Safety Award - Sword of Honour
Award - by the British Safety Council (UK).
> Tata Motors Pantnagar plant received LEED India Gold
rating
Mr. Karl Slym, Managing Director, Tata Motors, receiving the
Indian Multinational of the Year award from the Hon’ble
President of India, Mr Pranab Mukherjee.

36
68th ANNUAL REPORT 2012-13
FINANCIAL PERFORMANCE (Company Standalone)
R&D EXPENDITURE
09 1311 1210
1,7
59
1,5
49
1,1
67
1,1
87 1,4
37
R&D EXPENDITURE (` crores)
VEHICLE SALES (DOMESTIC)
AND MARKET SHARE
09
208 26
0
320 33
3
229
265
374 45
9
530
536
13121110
CV VOLUMES (IN THOUSANDS)
PV VOLUMES (IN THOUSANDS)
CV MARKET SHARE (%)
PV MARKET SHARE (%)
64
1414 14
13
8.9
6462
59.8 59.5
NET INCOME, EBITDA MARGIN,
NET MARGIN
25,
115
34,
835
47,
088
54,
307
44,
766
NET INCOME* (` crores)
EBITDA MARGIN (%)
PAT AS A % OF TURNOVER
09 13121110
4.0
6.4
3.8
2.3 0.7
7.0
12.0
10.2
8.1
4.8
* Excludes Other Income
VOLUME GROWTH
CV Domestic
PV Domestic
Export Total
2013 (IN THOUSANDS)
2012 (IN THOUSANDS)
GROWTH
229
816
926
51 63
333
530
1.2% -31.1% -19.1% -11.8%
536
PRODUCT MIX (VOLUMES)
09 13121110
CV (%)
PV (%)
530
58
42
6040
6139
63
71
37
29
PROFITS (EBITDA, PBT, PAT)
EBITDA (` crores)
PBT
PAT
1,7
52
09 10 11 12 13
2,8
30
2,2
40
2,2
40
2,1
97
1,8
12
1,3
41
1,2
42
2,1
44
175
302
4,1
78 4
,806
4,4
12
1,0
14
1,0
01
DIVIDEND & EPS
4.54
8.47
6.06
0.93
09 10 11 12 13
60
200 200
100
35 44
81
118
240
EPS (`) DIVIDEND %
DIVIDEND PAYOUT
AS % TO PAT
150
3.90
BORROWINGS ( NET OF SURPLUS
CASH ) & INTEREST AS % OF SALES
BORROWINGS (NET ) (` crores)
INTEREST AS A % OF TOTAL INCOME
DEBT EQUITY RATIO
DEBT (NET OF SURPLUS CASH) EQUITY RATIO
09 13121110
12,
659
14,4
40
14,3
61
16,
593
1.08 1.12
0.79 0.82
0.88
3.1
3.4
2.9
2.2
3.0 1.04
1.05
0.72 0.74
0.85
15,
488

37
FINANCIAL HIGHLIGHTS STATUTORY REPORTS FINANCIAL STATEMENTSCORPORATE OVERVIEW
TOTAL ASSETS & ASSET
TURNOVER RATIO
TOTAL ASSETS (` crores)
TOTAL ASSETS TURNOVER (TIMES)
09 13121110
37,
101
54,
190
50,
280
54,
261
52,
185
1.12
1.16
1.02
0.92
1.08
NET CASH FROM OPERATIONS
NET CASH FROM OPERATIONS
(` crores)
09 13121110
6,4
00
1,2
95
1,5
06
3,6
54
2,2
58
DISTRIBUTION OF REVENUE
` crores %
1 Materials 32,965.13 64.1
2 Operations & Other Exp 7,500.54 14.6
3 Taxes And Duties 4,677.10 9.1
4 Employees 2,837.00 5.5
5 Interest 1,387.76 2.7
6 Depreciation 1,817.62 3.5
7 Shareholders 645.20 1.3
8 Reserves (422.42) -0.8
Total 51,407.93
2012-13` crores %
1 Materials 39,704.93 66.4
2 Operations & Other Exp 8,132.12 13.6
3 Taxes and Duties 5,381.95 9
4 Employees 2,691.45 4.5
5 Interest 1,218.62 2.0
6 Depreciation 1,606.74 2.7
7 Shareholders 1,280.70 2.1
8 Reserves (221.49) -0.4
Total 59,795.02
2011-12
SOURCES OF REVENUE
` crores %
1 Domestic Vehicle Sale 40,781.40 79.3
2 Exports 3,419.50 6.7
3 Domestic Spare Part Sales 2,883.53 5.6
4 Dividend/Other Income 2,088.20 4.1
5 Vehicle Financing 39.48 0.1
6 Others 2,195.82 4.3
Total 51,407.93 100
2012-13` crores %
1 Domestic Vehicle Sale 50,857.13 85.1
2 Exports 3,598.22 6.0
3 Domestic Spare Part Sales 2,609.26 4.4
4 Dividend/Other Income 574.08 1.0
5 Vehicle Financing 74.25 0.1
6 Others 2,082.08 3.5
Total 59,795.02 100
2011-12
Financial Performance (36-39)

38
68th ANNUAL REPORT 2012-13
FINANCIAL PERFORMANCE (Jaguar Land Rover Group)
TURNOVER
TURNOVER (` crores)
39,
245
08-09
49,
369
09-10
70,
304
10-11
1,0
3,63
5
11-12
1,35
,993
12-13
PROFITS
EBITDA (` crores)
PBT (` crores)
PAT (` crores)
08-09 09-10 10-11 11-12 12-13
-63
-2,5
34 -2
,720 2
,860
11,
478
17,
035
11,
820
12,
279
21,4
9814
,773
11,0
99
7,6
65 7
,073
-108
-322
R&D EXPENDITURE
R&D EXPENDITURE (` crores)
3,7
57
08-09
3,8
81
09-10
5,4
74
10-11
8,0
32
11-12
10,0
37
12-13
FINANCE COST
FINANCE COST (` crores)
675
08-09
406
09-10
222
10-11
591
11-12
862
12-13
ASSETS
FIXED ASSETS (` crores)
TOTAL ASSETS (` crores)
17,
397 3
2,26
7
37,
749
32,
920
84,
186
45,5
18 1
,02,
500
21,
448
-233
16,
584
08-09 09-10 10-11 11-12 12-13
BORROWINGS
BORROWINGS (` crores)
BORROWINGS (NET OF
SURPLUS CASH) (` crores)
14,
193
13,
259
08-09
8,7
31 4
,103
09-10
9,0
07 1
,658
10-11
15,
065
-5,8
26
11-12
16,5
69 -7
,454
12-13

39
FINANCIAL HIGHLIGHTS STATUTORY REPORTS FINANCIAL STATEMENTSCORPORATE OVERVIEW
FINANCIAL PERFORMANCE (Tata Motors Group)
NET REVENUE,
EBITDA MARGIN
TOTAL REVENUE (` crores)
EBITDA MARGIN %
08 1312111009
35,
266
70,
397
91,
810
1,2
2,12
8
1,6
5,65
4
1,8
8,81
8
12.05
9.38
14.5614.31
3.12
14.07
PROFIT FOR THE YEAR
PROFIT (` crores )
-250
5
08 1312111009
2,16
8
2,57
1
9,27
4
13,5
17
9,89
3
NET CASH FROM OPERATIONS
NET CASH FROM OPERATIONS
(` crores )
08 1312111009
22,0
62
18,3
84
11,
240
9,3
27
750
5,5
96
RETURN ON EQUITY
RETURN ON EQUITY %
08 1312111009
26
-34
36
68
52
28
TOTAL ASSETS & ASSETS
TURNOVER RATIO
TOTAL ASSETS (` crores)
TOTAL ASSETS TURNOVER
(TIMES)
08 1312111009
34,
561
73,
262
1,0
1,01
4
1,4
4,93
1
1,7
0,02
6
86,
726
0.84
0.77
0.87
0.77 0.74
0.83
BORROWINGS ( NET OF SURPLUS
CASH ) & INTEREST AS % OF SALES
BORROWINGS (NET ) (` crores)
INTEREST AS A % OF TOTAL INCOME
DEBT EQUITY RATIO
DEBT (NET OF SURPLUS CASH) EQUITY RATIO
8,3
84
32,
511
27,
514
21,
578
23,
636 2
6,84
9
2.6
08 1312111009
3.1
2.7
2
1.81.9
1.33
0.96
5.47
3.35
1.130.72 0.71
5.89
4.28
1.711.44 1.42
Financial Performance (36-39)

40
68th ANNUAL REPORT 2012-13
COMPANY (STANDALONE)
SUMMARISED BALANCE SHEET (` crores)
As at31 March 2013
As at
31 March 2012
WHAT THE COMPANY OWNED
1. Fixed assets 20,208.54 19,056.19
2. Non-current investments 18,171.71 17,903.29
3. Long-term loans and advances 3,575.24 3,488.11
4. Other non-current assets 94.32 100.42
5. Current assets 10,134.96 13,712.92
6. Total Assets 52,184.77 54,260.93
WHAT THE COMPANY OWED
1. Long-term borrowings 8,051.78 8,004.50
2. Other long-term liabilities 1,238.44 1,959.63
3. Long-term provisions 691.19 685.56
4. Net worth
Share capital 638.07 634.75
Reserves and surplus 18,496.77 18,732.91
5. Deferred tax liabilities (net) 1,963.91 2,105.41
6. Current liabilities 21,104.61 22,138.17
7. Total liabilities 52,184.77 54,260.93

41
FINANCIAL HIGHLIGHTS STATUTORY REPORTS FINANCIAL STATEMENTSCORPORATE OVERVIEW
SUMMARISED PROFIT AND LOSS STATEMENT (` crores)
FY 2012-13 FY 2011-12
1. INCOME
Revenue from operations 49,319.73 59,220.94
Less : excise duty 4,554.01 4,914.38
44,765.72 54,306.56
Other income 2,088.20 574.08
46,853.92 54,880.64
2. EXPENDITURE
Cost of materials consumed 27,244.28 33,894.82
Purchase of products for sale 5,864.45 6,433.95
Changes in inventories of finished goods, work-in-progress and products for sale (143.60) (623.84)
Employee cost / benefits expense 2,837.00 2,691.45
Finance cost 1,387.76 1,218.62
Depreciation and amortisation expense 1,817.62 1,606.74
Product development expense/ engineering expenses 425.76 234.25
Other expenses 7,773.65 8,405.51
Expenditure transferred to capital and other accounts (953.80) (907.13)
Total expenses 46,253.12 52,954.37
Profit before exceptional items, extraordinary items and tax 600.80 1,926.27
Exchange loss (net) including on revaluation of foreign currency
Borrowings, deposits and loans 263.12 455.24
Provision for loan given to a subsidiary 245.00 130.00
Profit on sale of a division (82.25) -
3. PROFIT BEFORE TAX FROM CONTINUING OPERATIONS 174.93 1,341.03
Tax (Credit) / expense (126.88) 98.80
4. PROFIT AFTER TAX FROM CONTINUING OPERATIONS (3-4) 301.81 1,242.23
Summarised Balance Sheet and
Statement of Profit and Loss
Standalone (40-41)

42
68th ANNUAL REPORT 2012-13
TATA MOTORS GROUP (CONSOLIDATED)
SUMMARISED BALANCE SHEET (` crores)
As at31 March 2013
As at
31 March 2012
WHAT THE COMPANY OWNED
1. Fixed assets 69,483.61 56,212.50
2. Goodwill (on consolidation) 4,102.37 4,093.74
3. Non current investments 1,515.40 1,391.54
4. Deferred tax assets (net) 4,428.93 4,539.33
5. Long-term loans and advances 15,465.46 13,657.95
6. Other non-current assets 1,023.95 574.68
7. Current assets 74,006.73 64,461.47
8. Total assets 1,70,026.45 1,44,931.21
WHAT THE COMPANY OWED
1. Long term borrowings 32,110.07 27,962.48
2. Other long-term liabilities 3,284.06 2,297.57
3. Long -term provisions 8,319.15 6,232.39
4. Net worth
Share capital 638.07 634.75
Reserves and surplus 36,999.23 32,063.75
5. Minority interest 370.48 307.13
6. Deferred tax liability (net) 2,019.49 2,165.07
7. Current liabilities 86,285.90 73,268.07
8. Total liabilities 1,70,026.45 1,44,931.21
43
FINANCIAL HIGHLIGHTS STATUTORY REPORTS FINANCIAL STATEMENTSCORPORATE OVERVIEW
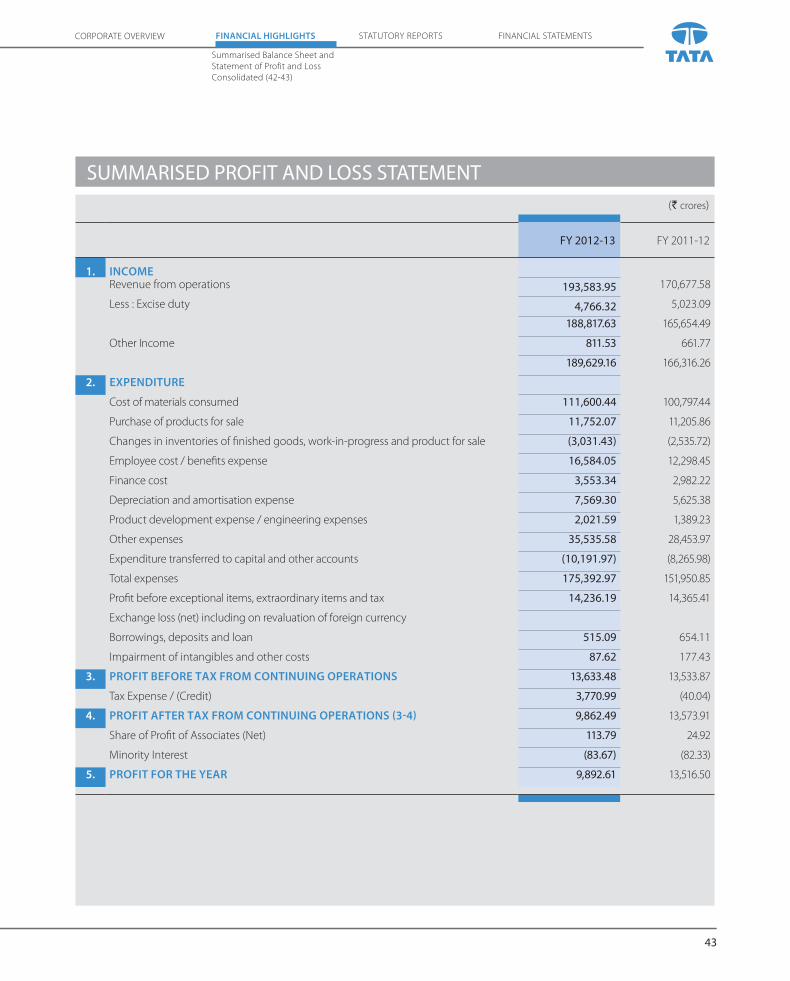
SUMMARISED PROFIT AND LOSS STATEMENT (` crores)
FY 2012-13 FY 2011-12
1. INCOMERevenue from operations 193,583.95 170,677.58
Less : Excise duty 4,766.32 5,023.09
188,817.63 165,654.49
Other Income 811.53 661.77
189,629.16 166,316.26
2. EXPENDITURE
Cost of materials consumed 111,600.44 100,797.44
Purchase of products for sale 11,752.07 11,205.86
Changes in inventories of finished goods, work-in-progress and product for sale (3,031.43) (2,535.72)
Employee cost / benefits expense 16,584.05 12,298.45
Finance cost 3,553.34 2,982.22
Depreciation and amortisation expense 7,569.30 5,625.38
Product development expense / engineering expenses 2,021.59 1,389.23
Other expenses 35,535.58 28,453.97
Expenditure transferred to capital and other accounts (10,191.97) (8,265.98)
Total expenses 175,392.97 151,950.85
Profit before exceptional items, extraordinary items and tax 14,236.19 14,365.41
Exchange loss (net) including on revaluation of foreign currency
Borrowings, deposits and loan 515.09 654.11
Impairment of intangibles and other costs 87.62 177.43
3. PROFIT BEFORE TAX FROM CONTINUING OPERATIONS 13,633.48 13,533.87
Tax Expense / (Credit) 3,770.99 (40.04)
4. PROFIT AFTER TAX FROM CONTINUING OPERATIONS (3-4) 9,862.49 13,573.91
Share of Profit of Associates (Net) 113.79 24.92
Minority Interest (83.67) (82.33)
5. PROFIT FOR THE YEAR 9,892.61 13,516.50
Summarised Balance Sheet and
Statement of Profit and Loss
Consolidated (42-43)

44
68th ANNUAL REPORT 2012-13
(` crores)
FY 2012-13 FY2011-12 FY 2010-11 FY2009-10 FY 2008-09
SOURCES OF FUNDS 1. Funds generated from operations
A. Profit after tax 301.81 1,242.23 1,811.82 2,240.08 1,001.26
B. Depreciation (including Lease Equalisation) 1,813.10 1,602.23 1,356.26 1,029.36 870.05
C. Provision / (Reversal) for diminution in value of investments (net) (9.67) - 34.00 61.05 (1.96)
D. Net deferred tax charge (127.44) 98.24 376.30 589.46 (2.50)
E. Credit for Dividend Distribution Tax of Subsidiary Companies 1.48 1.48 - - 15.29
F. Exchange gain (net) on Long term Foreign currency monetary items deferred consequent to amendment to AS-11 [Note b(iii)] 43.35 (258.35) 161.69 (325.81) 106.23
G. Marked to Market Exchange loss on Forward contracts transferred to Hedging Reserve Account on adoption of principles of hedge accounting under AS30 [Note b(v)] - - - 132.57 (132.57)
H. Profit on sale of a division (82.25) - - - -
Total 1,940.38 2,685.83 3,740.07 3,726.71 1,855.80
2. Proceeds from Rights issue of Ordinary shares and ‘A’ Ordinary shares - - - - 4,139.333. Proceeds from issue of Global Depository Shares - - - 1,794.19 -
4. Proceeds from QIP issue - - 3,351.01 - - 5. Proceeds from FCCN, Warrants and Convertible Debentures converted into Ordinary Shares
and premium thereon 233.00 0.02 1,493.32 1,555.76 8.52
6. (a) Decrease in Working Capital 292.96 - - 2,145.94 -
(b) Decrease in Finance receivables 64.77 144.96 366.41 1,393.58 406.22
7. Increase in Borrowings (net of repayments) 918.38 - - 3,460.35 6,885.04
8. Investment sold (net of investment made) 568.83 2,130.66 - - -
9. Decrease in short term deposits with banks 576.08 525.86 - - 1,081.8510. Proceeds from sale of a division 110.00 - - - -
4,704.40 5,487.33 8,950.81 1,4076.53 14,376.76
APPLICATION OF FUNDS 11. Capital Expenditure (net) 2,952.38 3,346.88 2,396.29 2,873.33 5,118.13
12. Repayment of Borrowings (net of additional borrowings) - 34.86 695.79 - -
13. Investments made (net of sales) - - 321.31 9,429.82 8,055.90
14. Payment of Redemption Premium on NCD 96.55 - 71.96 - -
15. Increase in short term deposits with banks - - 804.66 490.67 -
16 Increase in Working Capital - 571.38 3,000.57 - 830.47
17. Dividends (including tax thereon) 724.23 1,463.72 1,467.03 991.94 345.70
18. Premium paid on redemption of CARS 843.37 - - - -
19. Miscellaneous Expenditure (to the extent not written off or adjusted) and utilisation of Securities Premium Account [Note (a) below]
87.87 70.49 193.20 290.77 26.56
4,704.40 5,487.33 8,950.81 1,4076.53 14,376.76
NOTES :(a) Utilisation of Securities Premium Account includes FCCN / CARS / Rights issue expenses and
premium on redemption of Debentures 87.87 70.49 193.20 292.79 30.59
(b) The Sources and Application of funds does not include
(i) Provision for premium on redemption of CARS / FCCN 83.19* 929.46* 941.08* 1,001.46* 835.19*
(ii) Liability towards premium on redemption of NCD (1,577.28) 1,673.83 1,673.83 1,745.79 -
(iii) Exchange gain (net) adjusted from General Reserve to Foreign Currency Monetary Item Translation Difference Account relating to FY 2007-08 consequent to amendment to AS11
- - - - 57.89*
(iv) Exchange loss (net) on forward contracts adjusted to General Reserve on adoption of principles of hedge accounting under AS30
- - - - 6.87*
(v) Deferred Tax on account of item 1(G)
*net of deferred tax
- - - (45.06) 45.06
(c) Figures for the previous years have been regrouped wherever necessary.
COMPANY (STANDALONE)
FUNDS FLOW - LAST FIVE YEARS

Notice (45-51)
45
CORPORATE OVERVIEW FINANCIAL HIGHLIGHTS FINANCIAL STATEMENTSSTATUTORY REPORTS
NOTICE IS HEREBY GIVEN THAT THE SIXTY-EIGHTH ANNUAL
GENERAL MEETING OF TATA MOTORS LIMITED will be held
on Wednesday, August 21, 2013 at 3:00 p.m., at Birla Matushri
Sabhagar, 19, Sir Vithaldas Thackersey Marg, Mumbai 400 020 to
transact the following business:
Ordinary Business
1. To receive, consider and adopt the Audited Statement of
Profit and Loss for the year ended March 31, 2013 and the
Balance Sheet as at that date together with the Reports of
the Directors and the Auditors thereon.
2. To declare a dividend on Ordinary Shares and ‘A’ Ordinary
Shares.
3. To appoint a Director in place of Mr Nusli N Wadia, who retires
by rotation and is eligible for re-appointment.
4. To appoint a Director in place of Dr Raghunath A Mashelkar,
who retires by rotation and is eligible for re-appointment.
5. To appoint Auditors and fix their remuneration.
Special Business
6. Appointment of Ms Falguni S Nayar as a Director
To consider and, if thought fit, to pass with or without
modification, if any, the following resolution as an Ordinary
Resolution:-
“RESOLVED that Ms Falguni S Nayar who was appointed
by the Board of Directors as an Additional Director of the
Company on May 29, 2013 and who holds office upto the
date of this Annual General Meeting of the Company, in
terms of Section 260 of the Companies Act, 1956 (“the Act”),
but who is eligible for appointment and in respect of whom
the Company has received a notice in writing from a Member
under Section 257 of the Act proposing her candidature
for the office of Director of the Company, be and is hereby
appointed a Director of the Company.”
7. Appointment of Mr Karl J Slym as a Director
To consider and, if thought fit, to pass with or without
modification, if any, the following resolution as an Ordinary
Resolution:-
“RESOLVED that Mr Karl J Slym, who was appointed by the
Board of Directors as an Additional Director of the Company
with effect from September 13, 2012 and who holds office
upto the date of this Annual General Meeting of the Company,
in terms of Section 260 of the Companies Act, 1956 (“the
Act”), but who is eligible for appointment and in respect of
whom the Company has received a notice in writing from
a Member under Section 257 of the Act proposing his
candidature for the office of Director of the Company, be and
is hereby appointed a Director of the Company.”
8. Appointment of Mr Karl J Slym as the Managing Director
To consider and, if thought fit, to pass with or without
modification, if any, the following resolution as an Ordinary
Resolution:-
“RESOLVED that pursuant to the provisions of Sections
198, 269, 309, and other applicable provisions, if any, of the
Companies Act, 1956 (“the Act”), as amended or re-enacted
from time to time, read with Schedule XIII of the Act and
subject to the approval of the Central Government, the
Company hereby approves of the appointment and terms
of remuneration of Mr Karl J Slym as the Managing Director
of the Company for the a period of 5 years with effect
from September 13, 2012, upon the terms and conditions,
including the remuneration to be paid in the event of
inadequacy of profits in any financial year as set out in the
Explanatory Statement annexed to the Notice convening
this meeting, with liberty to the Directors to alter and vary
the terms and conditions of the said appointment in such
manner as may be agreed to between the Directors and Mr
Slym.”
“RESOLVED FURTHER that the Board of Directors or a
Committee thereof of the Company, be and is hereby
authorised to take all such steps as may be necessary, proper
and expedient to give effect to this Resolution.”
9. Commission to non Whole-time Directors
To consider and, if thought fit, to pass with or without
modification, if any, the following resolution as a Special
Resolution:-
“RESOLVED that pursuant to the provisions of Section 309
and other applicable provisions, if any, of the Companies
Act, 1956 (“the Act”), (including any statutory modification or
re-enactment thereof for the time being in force) a sum not
exceeding one percent per annum of the net profits of the
Company calculated in accordance with the provisions of
Sections 198, 349 and 350 of the Act, be paid to and distributed
amongst the non whole-time Directors of the Company or
some or any of them in such amounts or proportions and
in such manner and in all respects as may be decided and
directed by the Board of Directors and such payments shall
be made in respect of the profits of the Company for each
year, for a period of five financial years commencing from
April 1, 2013.”
NOTICE

68th ANNUAL REPORT 2012-13
46
10. Increase in the limit for holding by registered Foreign
Institutional Investors (FIIs) for ‘A’ Ordinary Shares
To consider and, if thought fit, to pass with or without
modification, if any, the following resolution as a Special
Resolution:-
“RESOLVED that in partial modification to the resolution
passed by the Shareholders vide postal ballot dated January
22, 2004 and pursuant to the applicable provisions of Foreign
Exchange Management Act, 1999, the Foreign Exchange
Management (Transfer or Issue of Security by a Person
Resident Outside India) Regulations, 2000, as amended
from time to time and all other applicable rules, regulations,
guidelines and laws (including any statutory modifications
or re-enactment thereof, from time to time) and subject
to all applicable approvals, permissions and sanctions and
subject to such conditions as may be prescribed by any of
the concerned authorities while granting such approvals,
permissions and sanctio ns, which may be agreed to by the
Board of Directors of the Company (the ’Board’, which term
shall be deemed to include any committee which the Board
may have constituted or hereinafter constitute to exercise its
powers including the powers conferred by this Resolution),
consent to the Company be and is hereby accorded to
the Board to permit Foreign Institutional Investors (“FIIs”)
registered with the Securities and Exchange Board of India
(“SEBI”) to acquire and hold, on their own account and/or on
behalf of the their SEBI approved sub-accounts under the
Portfolio Investment Scheme (PIS), ‘A’ Ordinary Shares (AOS)
of the Company, upto 75% of the paid-up AOS Capital of the
Company and that FIIs continue to be permitted to acquire
and hold on their account and/or on behalf of their sub-
accounts under the PIS, Ordinary Shares (OS) of the Company
upto 35% of the total paid-up Ordinary Share Capital of the
Company; provided however that the shareholdings of each
FIIs on its own account and on behalf of each of the SEBI
approved sub-accounts in the Company shall not exceed
such limits as may be permitted by applicable law and
approved by the Board.”
“RESOLVED FURTHER that the Board be and is hereby
authorized to do all such acts, deeds and things and execute
all documents or writings as may be necessary, proper or
expedient for the purpose of giving effect to this Resolution
and for any matter connected therewith or incidental thereto
and delegating all or any of the powers conferred herein to
any Committee, Directors or Officers of the Company.”
“RESOLVED FURTHER that the Board be and is hereby
authorized to settle all questions, difficulties or doubts that
may arise in relation to the above matter without being
required to seek any further consent or approval of the
Members or otherwise and the Members shall be deemed to
have given their approval thereto expressly by the authority
of this resolution.”
By Order of the Board of Directors
H K SETHNA
Company Secretary
Mumbai, May 29, 2013
Registered Office:
Bombay House, 24, Homi Mody Street, Mumbai 400 001
NOTES:
a. The relative Explanatory Statement pursuant to Section 173
of the Companies Act, 1956 in respect of the business under
Item Nos. 6 to 10 set out above and details as required under
Clause 49 of the Listing Agreement entered into with the
Stock Exchanges in respect of Directors seeking appointment/
reappointment at this Annual General Meeting are annexed
hereto.
b. A MEMBER ENTITLED TO ATTEND AND VOTE IS ENTITLED TO
APPOINT A PROXY TO ATTEND AND VOTE ON A POLL INSTEAD
OF HIMSELF AND THE PROXY NEED NOT BE A MEMBER. The
instrument appointing Proxy as per the format included in
the Annual Report should be returned to the Registered
Office of the Company not less than FORTY-EIGHT HOURS
before the time for holding the Meeting. Proxies submitted
on behalf of limited companies, societies, partnership firms,
etc. must be supported by appropriate resolution/authority,
as applicable, issued by the member organization.
c. Corporate Members intending to send their authorised
representatives to attend the meeting are requested to send
to the Company, a certified copy of the Board Resolution
authorising their representative to attend and vote in their
behalf at the Meeting.
d. Only registered Members (including the holders of ‘A’ Ordinary
Shares) of the Company may attend and vote at the Annual
General Meeting. The holders of the American Depositary
Receipts (the ‘ADRs’) and Global Depositary Receipts (the
‘GDRs’) of the Company shall not be entitled to attend the
said Annual General Meeting. However, the ADR holders are
entitled to give instructions for exercise of voting rights at
the said meeting through the Depositary, to give or withhold
such consents, to receive such notice or to otherwise take
action to exercise their rights with respect to such underlying
shares represented by each such American Depositary Share.
A brief statement as to the manner in which such voting
instructions may be given is being sent to the ADR holders
by the Depositary.
In respect of ‘A’ Ordinary Shares, if any resolution at the
Notice (45-51)
47
CORPORATE OVERVIEW FINANCIAL HIGHLIGHTS FINANCIAL STATEMENTSSTATUTORY REPORTS
meeting is put to vote by a show of hands, each ‘A’ Ordinary
Shareholder shall be entitled to one vote, i.e., the same
number of votes as available to holders of Ordinary Shares.
If any resolution at the meeting is put to vote on a poll, or if
any resolution is put to vote by postal ballot, each ‘A’ Ordinary
Shareholder shall be entitled to one vote for every ten ‘A’
Ordinary Shares held.
e. In case of joint holder attending the Meeting, only such joint
holder who is higher in the order of names will be entitled to
vote.
f. The Register of Members and Transfer Books of the Company
will be closed from Thursday, August 1, 2013 to Wednesday,
August 21, 2013, both days inclusive. If the dividend as
recommended by the Board of Directors is approved at the
Annual General Meeting, payment of such dividend will be
made on or after August 23, 2013 as under:
i. To all Beneficial Owners in respect of shares held in
electronic form, as per the data made available by the
National Securities Depository Limited and the Central
Depository Services (India) Limited, as of the close of
business hours on July 31, 2013.
ii. To all Members in respect of shares held in physical
form, after giving effect to valid transfers in respect of
transfer requests lodged with the Company on or before
the close of business hours on July 31, 2013.
iii. The ‘A’ Ordinary Shareholders will receive dividend for
any financial year at five percentage points more than
the aggregate rate of dividend declared on Ordinary
Shares for that financial year.
g. Members whose e-mail id is not registered with the Company,
have been sent a copy of this notice alongwith the abridged
annual report at their registered address. Soft copies of the
full annual report have been sent to the members who have
registered their email ids for the said purpose. A hard copy
of the full annual report will be provided to any member
requesting for the same.
h. Securities and Exchange Board of India (SEBI) has mandated all
listed companies to update bank details of their shareholders
to enable usage of the electronic mode of remittance such as
ECS [ LECS (Local ECS) / RECS (Regional ECS) / NECS (National
ECS) ], NEFT for distributing dividends and other cash benefits
to its shareholders. Further in cases where either the bank
details such as MICR (Magnetic Ink Character Recognition),
IFSC (Indian Financial System Code), etc. that are required for
making electronic payment are not available or the electronic
payment instructions have failed or have been rejected by the
bank, the companies may use physical payment instruments
for making cash payments to their investors. Companies shall
mandatorily print the bank account details of the investors
on such payment instruments.
Payment of dividend and other cash benefits through
electronic mode has many advantages like prompt credit,
elimination of fraudulent encashment, delay in transit. We
request you to spare a few minutes of your valuable time in
updating your bank details as under:
- In case your holding is in dematerialized form, please
instruct your Depository Participant to update your
bank details in your demat account.
- In case your holding is in physical form, please inform
the Company’s Registrars and Transfer Agents alongwith
a photocopy of a blank cancelled cheque of your bank
account.
In case you do not avail of the said electronic mode for
payments, the Company will print the bank details provided
by you on the payment instrument.
i. SEBI has mandated the submission of Permanent Account
Number (PAN) for participating in the securities market,
deletion of name of deceased holder, transmission/
transposition of shares. Members are requested to submit
the PAN details to their Depository Participant in case
of holdings in dematerialised form or to the Company’s
Registrars and Transfer Agents, in case of holdings in physical
form, mentioning your correct reference folio number.
j. Members holding shares in dematerialised mode are
requested to intimate all changes pertaining to their bank
details, NECS, mandates, nominations, power of attorney,
change of address/name, PAN details, etc. to their Depository
Participant only and not to the Company’s Registrars and
Transfer Agents. Changes intimated to the Depository
Participant will then be automatically reflected in the
Company’s records which will help the Company and its
Registrars and Transfer Agents to provide efficient and better
service to the Members.
k. Members’ attention is particularly drawn to the “Corporate
Governance” section in respect of unclaimed and unpaid
dividends.
l. Members desiring any information as regards the Accounts
are requested to write to the Company at an early date so as
to enable the Management to keep the information ready at
the Meeting.
m. As an austerity measure, copies of the Annual Report will not
be distributed at the Annual General Meeting. Members are
requested to bring their attendance slip alongwith a copy of
Annual Report to the Meeting.

68th ANNUAL REPORT 2012-13
48
Explanatory Statement
The following Explanatory Statement, pursuant to Section 173
of the Companies Act, 1956 (“the Act”), sets out all material facts
relating to the business mentioned at Item Nos. 6 to 10 of the
accompanying Notice dated May 29, 2013:
Item No.6: The Board of Directors (‘the Board’) appointed Ms
Falguni S Nayar as an Additional Director of the Company on May
29, 2013, pursuant to Section 260 of the Act and Article 132 of the
Articles of Association of the Company. Under Section 260 of the
Act, Ms Nayar ceases to hold office at this Annual General Meeting
but is eligible for appointment as a Director. Notice under Section
257 of the Act has been received from a Member signifying his
intention to propose Ms Nayar’s appointment as a Director. Ms
Nayar holds a B.Com, PGDM (from IIM, Ahmedabad) and has
been an investment banker having spent over 19 years with
Kotak Mahindra Bank with the last 6 years as Managing Director
and CEO of Kotak Investment Bank. Prior to this, she was with A
F Ferguson & Co. as Manager. She is currently the founder and
CEO of Nykaa.com, an online shopping website for beauty and
wellness products. Brief Information of Ms Nayar is given in the
Annexure attached to the Notice.
The Board considers it desirable that the Company should continue
to avail of the services of Ms Nayar and accordingly commends
the Resolution at Item No. 6 for approval by the Members.
Ms Nayar is not related to any other Director of the Company. Ms
Nayar is concerned or interested in Item No. 6 of the Notice.
Item Nos. 7 and 8: Mr Karl Slym was appointed as Additional
Director and the Managing Director of the Company w.e.f.
September 13, 2012 and was entrusted with the overall
responsibility of Tata Motors’ operations in India and international
markets which, inter alia, included South Korea, Thailand, Spain,
Indonesia and South Africa. Jaguar Land Rover would continue to
be managed independently.
Mr Slym has been the Executive Vice President and Board member
of SGMW Motors China, (a General Motors Joint Venture), prior
to which, he was the President, Managing Director and Board
Member of General Motors in India from 2007 to 2011. He has
had a 17 years’ career in General Motors in various positions in
different geographies. Before joining General Motors, Mr Slym,
worked for Toyota U.K. He is an alumnus of Stanford University and
a Sloan Fellow. Mr Slym, a British resident and national, holds a
valid employment Visa and registration certification issued by the
Foreigners Regional Registration Office, Mumbai. Brief information
of Mr Slym is given in the Annexure attached to the Notice.
Taking into consideration the size and complexity of the
Company’s global operations, the enormous responsibility for
oversight of the Tata Motors’ Group (excluding Jaguar Land Rover
business) and the qualifications and accomplishments of Mr Slym,
the Board vide Resolution dated August 14, 2012 subject to the
approval of the Members and the Central Government, appointed
Mr Slym as an Additional Director and also the Managing Director
(“Mr Slym or the Managing Director”) of the Company.
Under Section 260 of the Act, Mr Slym ceases to hold office at
this Annual General Meeting but is eligible for appointment as
Director. Notice under Section 257 of the Act has been received
from a Member signifying his intention to propose Mr Slym’s
appointment as a Director and the Members’ approval is sought
for the said proposal, vide Resolution at Item No.7.
Pursuant to Section 302 of the Act, an Abstract of the main terms
and conditions of Mr Slym’s appointment dated August 28, 2012
was sent to the Members for their information. An application has
also been made to the Central Government in respect of the said
appointment and remuneration to be paid to Mr Slym and the
appointment is subject to receipt of the said approval..
The terms of appointment and remuneration as approved by the
Board include:-
(1) Tenure of Appointment: 5 years commencing from
September 13, 2012, the date of appointment.
(2) Nature of duties: The Managing Director shall, devote his
whole time and attention to the business of the Company
and carry out such duties as may be entrusted to him by the
Board from time to time and separately communicated to him.
Subject to the superintendence, control and directions of the
Board, the Managing Director be entrusted with substantial
powers of management which are in connection with and
in the best interest of the business of the Company and the
business of any one or more of its associated companies
and/or subsidiaries, including performing duties as assigned
by the Board from time to time by serving on the boards of
such associated companies and/or subsidiaries or any other
executive body or any committee of such a company.
(3) Remuneration:
(a) Salary: US$18,500/- p.m. (rupee equivalent at the
applicable rate on the date of payment); (b) Bonus,
incentive remuneration, if any, and/or commission
based on certain performance criteria to be laid down
by the Board; (c) Benefits, perquisites, allowances as may
be determined by the Board from time to time.
Minimum Remuneration: Notwithstanding anything to the
contrary herein contained, wherein any financial year during
the currency of the tenure of the Managing Director, the
Company has no profits or its profits are inadequate, the
Company will pay to the Managing Director remuneration

Notice (45-51)
49
CORPORATE OVERVIEW FINANCIAL HIGHLIGHTS FINANCIAL STATEMENTSSTATUTORY REPORTS
by way of salary, bonus, incentive remuneration, perquisites
and allowances, as specified above.
(4) Other terms of appointment:
(i) The Managing Director, so long as he functions as such,
shall not become interested or otherwise concerned,
directly or through his spouse and/or children, in any
selling agency of the Company.
(ii) The terms and conditions of appointment of Managing
Director may be altered and varied from time to time by
the Board as it may, in its discretion deem fit, irrespective
of the limits stipulated under Schedule XIII to the Act or
any amendments made hereafter in this regard in such
manner as may be agreed to between the Board and
the Managing Director, subject to such approvals as
may be required.
(iii) This appointment may be terminated by either party
by giving to the other party six months’ notice of
such termination or the Company paying six months’
remuneration in lieu of the Notice.
(iv) The employment of the Managing Director may be
terminated by the Company without notice or payment
in lieu of notice:
a. if the Managing Director is found guilty of any gross
negligence, default or misconduct in connection
with or affecting the business of the Company or
any subsidiary or associated company to which he
is required by the Agreement to render services; or
b. in the event of any serious repeated or continuing
breach (after prior warning) or non-observance by
the Managing Director of any of the stipulations
contained in the Agreement executed between
the Company and the Managing Director; or
c. in the event the Board expresses its loss of
confidence in the Managing Director.
(v) In the event the Managing Director is not in a position
to discharge his official duties due to any physical
or mental incapacity, the Board shall be entitled to
terminate his contract on such terms as the Board may
consider appropriate in the circumstances.
(vi) Upon termination by whatever means of the Managing
Director’s employment:
a. the Managing Director shall immediately tender
his resignation from offices held by him in any
subsidiaries, associated companies and other
entities without claim for compensation for loss of
office.
b. the Managing Director shall not without the
consent of the Company at any time thereafter
represent himself as connected with the Company
or any of its subsidiaries or associated companies.
(vii) Mr Slym’s appointment shall be subject to the provisions
of Section 283(1)(l) of the Act.
(viii) If and when the Agreement expires or is terminated
for any reason whatsoever, Mr Slym will cease to be
the Managing Director and also cease to be a Director.
If at any time, Mr Slym ceases to be a Director of the
Company for any reason whatsoever, he shall cease
to be the Managing Director and the Agreement shall
forthwith terminate. If at any time, the Managing Director
ceases to be in the employment of the Company for any
reason whatsoever, he shall cease to be a Director and
Managing Director of the Company.
(ix) The terms and conditions of appointment with the
Managing Director also include clauses pertaining to
adherence with the Tata Code of Conduct, no conflict
of interest with the Company and maintenance of
confidentiality.
In compliance with the provisions of Sections 269, 309 and other
applicable provisions of the Act read with Schedule XIII of the Act,
the terms of remuneration specified above are now being placed
before the Members for their approval vide Resolution at Item
No. 8.
The Board commends the Resolutions at Item Nos. 7 and 8 for
approval by the Members.
Mr Slym is not related to any other Director of the Company.
Mr Slym is concerned or interested in Item Nos. 7 and 8 of the
Notice.
Item No. 9: The Members had, at the Annual General Meeting held
on July 24, 2008 approved, under the provisions of Section 309
of the Act, the payment of remuneration by way of commission
to the non whole-time Directors of the Company, of a sum not
exceeding 1% per annum of the net profits of the Company,
calculated in accordance with the provisions of the Act, for a
further period of five years commencing April 1, 2008.
Taking into account the responsibilities of the Directors, it
is proposed that in terms of Section 309(4) of the Act, the
non whole-time Directors be paid for each of the five financial years
of the Company commencing from April 1, 2013, remuneration
not exceeding 1% per annum of the net profits of the Company
computed in accordance with the provisions of the Act. This
remuneration will be distributed amongst all or some of the
Directors in accordance with the directions given by the Board.

68th ANNUAL REPORT 2012-13
50
Accordingly, a fresh approval of the Members is sought by
way of a Special Resolution for payment of commission to the
non whole-time Directors for a period of five years commencing
from April 1, 2013 as set out in the Resolution at Item No.9 of the
Notice.
All the Directors of the Company except the Managing Director
and the Executive Directors of the Company may be deemed to
be concerned or interested in the Resolution mentioned at Item
No. 9 of the Notice to the extent of the remuneration that may be
received by them.
Item No. 10: As per the norms pertaining to investments in
India by persons resident outside India issued by the Reserve
Bank of India vide notification No. FEMA 20/2000-RB dated May
3, 2000 under Foreign Exchange Management Act, 1999 (FEMA),
investment in equity shares by FIIs, including their sub-accounts
is limited to 24% of the Company’s paid-up Share Capital. This
limit can be increased to the sectoral cap/statutory ceiling by a
company by passing a Special Resolution of its Members with
a prior intimation to the Reserve Bank of India. Further, the RBI
permits increase in limits to 100% in class-wise/category-wise
share subject to demonstration of monitoring mechanism.
Consequent upon the approval of the Members vide postal ballot
dated January 22, 2004, the Company had increased the said limit
of 24% to 35% of paid-up ordinary share capital of the Company.
Subsequent to the above, the Company had through a rights
issue in September 2008 and a Qualified Institutions’ Placement
in October 2010, inter alia, issued ‘A’ Ordinary Shares (AOS) which
have a differential right on voting (one-tenth voting power as
compared to Ordinary Shares) and dividend (5% more than the
dividend declared on Ordinary Shares per annum). Considerable
interest has been evinced by the FIIs in the AOS as may be
observed from the table below:
(as on May 24, 2013)
Paid Up Share Capital
No. of Shares No. of Shares
held by FIIs
% of FII holdings
Ordinary Share Capital
2,719,945,846 750,560,995 27.59
‘A’ Ordinary Share Capital
481,959,620 249,039,832 51.67
Total 3,201,905,466 999,600,827 31.22
Currently, the limit of FII holdings in the Company is calculated on
the Company’s combined Ordinary Share and AOS Capital as per
the said Members’ Resolution. The Board had, at its meeting held
on May 29, 2013, recommended that the limit on holdings by FIIs
in the AOS Capital of the Company be increased to 75%.
The limit for FII holdings in the Ordinary Share Capital of the
Company would continue to be retained at 35% of the Ordinary
Share capital of the Company. Based on current paid-up capital
and assuming the utilisation of the full limit of Ordinary Share
and AOS capital, the holding of Flls would be around 41% of the
Company’s Paid-up Share Capital and 36% of the agreegate voting
rights of the Company.
The above increase in limit will enable further investment by FIIs
in India and thereby increase the foreign exchange inflow into the
country.
Accordingly, the Board commends the resolution at Item No.10
for approval by the Members.
By Order of the Board of Directors
H K SETHNA
Company Secretary
Mumbai, May 29, 2013
Registered Office:
Bombay House,
24, Homi Mody Street,
Mumbai 400 001

Notice (45-51)
51
CORPORATE OVERVIEW FINANCIAL HIGHLIGHTS FINANCIAL STATEMENTSSTATUTORY REPORTS
DIRECTORS RETIRING BY ROTATION SEEKING RE-ELECTION AND APPOINTMENT OF DIRECTORS
AT THIS ANNUAL GENERAL MEETING:
Particulars Mr Nusli N Wadia Dr Raghunath A
Mashelkar
Ms Falguni S Nayar Mr Karl J Slym
Date of Birth February 15, 1944 January 1, 1943 February 19, 1963 February 9, 1962
Appointed on December 22, 1998 August 28, 2007 May 29, 2013 September 13, 2012
Qualifications Educated in UK. Chemical Engineering
Scientist, Ph. D from
Bombay University.
B.Com, PGDM –
Indian Institute
of Management,
Ahmedabad.
M.Sc. - Stanford
University,
Sloan Fellow.
Expertise in specific
functional areas
Industrialist with rich
business experience.
Wide experience and
renowned knowledge
in Scientific Areas.
Wide and varied
experience in
investment banking.
Wide and varied global
experience in the
automobile industry.
Directorships held
in other Public
companies (excluding
foreign and private
companies)
& Mfg. Co. Limited
(Chairman)
Engineering Services
Limited
Trading Corporation
Limited (Chairman)
Limited
Limited (Chairman)
Limited (Chairman)
Limited
Limited
Limited
Infosystems Limited
Limited
NIL
Limited
Automobiles Limited
Memberships/
Chairmanships of
Audit Committees and
Investors’ Grievance
Committees across
public companies
NIL Audit
Limited
Limited
Limited
Audit
Investors’ Grievance
Investors’ Grievance
Shareholding NIL NIL NIL NIL

68th ANNUAL REPORT 2012-13
52
DIRECTORS’ REPORT
TO THE MEMBERS OF TATA MOTORS LIMITED
The Directors present their Sixty-Eighth Annual Report and the Audited Statement of Accounts for FY 2012-13.
FINANCIAL PERFORMANCE SUMMARY (` in crores)
Company
(Standalone)
Tata Motors Group
(Consolidated)
FY 2012-13 FY 2011-12 FY 2012-13 FY 2011-12
FINANCIAL RESULTS
Gross revenue 49,319.73 59,220.94 193,583.95 170,677.58
Net revenue (excluding excise duty) 44,765.72 54,306.56 188,817.63 165,654.49
Total expenditure 42,621.98 49,894.76 162,248.74 141,954.02
Operating profit 2,143.74 4,411.80 26,568.89 23,700.47
Other income 2,088.20 574.08 811.53 661.77
Profit before interest, depreciation, amortization, exceptional item and tax 4,231.94 4,985.88 27,380.42 24,362.24
Finance cost 1,387.76 1,218.62 3,553.34 2,982.22
Cash profit 2,844.18 3,767.26 23,827.08 21,380.02
Depreciation, amortization and product development / engineering expenses 2,243.38 1,840.99 9,590.89 7,014.61
Profit for the year before exceptional items and tax 600.80 1,926.27 14,236.19 14,365.41
Exceptional items - loss (net) 425.87 585.24 602.71 831.54
Profit before tax 174.93 1,341.03 13,633.48 13,533.87
Tax expense / (credit) (126.88) 98.80 3,770.99 (40.04)
Profit after tax 301.81 1,242.23 9,862.49 13,573.91
Share of minority interest and share of profit of associates (net) - - 30.12 (57.41)
Profit for the year 301.81 1,242.23 9,892.61 13,516.50
APPROPRIATIONS
Profit for the year 301.81 1,242.23 9,892.61 13,516.50
Balance brought forward from previous year 1,663.91 2,078.92 18,195.96 6,461.49
Amount available for appropriations 1,965.72 3,321.15 28,088.57 19,977.99
Less: appropriations / (transfer from)
Debenture Redemption Reserve (130.00) 70.00 (130.00) 70.00
General Reserve 30.18 125.00 59.48 158.03
Other Reserves - - 63.14 65.38
Dividend (including dividend distribution tax) 722.75 1,462.24 756.14 1,488.62
Balance carried to Balance Sheet 1,342.79 1,663.91 27,339.81 18,195.96

53
Directors’ Report (52-65)
CORPORATE OVERVIEW FINANCIAL HIGHLIGHTS FINANCIAL STATEMENTSSTATUTORY REPORTS
DIVIDEND
Considering the Company’s financial performance, the Directors
recommended a dividend of ̀ 2/- per share (100%) on the capital of
2,719,945,846 Ordinary Shares of ̀ 2/- each [previous year: ̀ 4/- per
share (200%) of face value of ̀ 2/- each] and ̀ 2.10 per share (105%)
on 481,959,620 ‘A’ Ordinary Shares of `2/- each [previous year:
`4.10 per share (205%) of face value of ̀ 2/- each] fully paid-up and
any further Ordinary Shares and/or ‘A’ Ordinary Shares that may be
allotted by the Company prior to August 1, 2013 (being the book
closure date for the purpose of the said dividend entitlement) and
will be paid on or after August 23, 2013. Based on the current paid-
up capital, the said dividend, if approved by the Members, would
involve a cash outflow of ̀ 724 crores (previous year: ̀ 1,464 crores)
including dividend distribution tax, resulting in a payout of 240%
(previous year: 118%) of the standalone profits for FY 2012-13
and 7% (previous year: 11%) of the consolidated profits of the
Company.
OPERATING RESULTS AND PROFITS
FY 2012-13 was a challenging year for the economy – both
globally and in India. The world economy grew by a mere 3.1%
in 2012 as compared to 3.9% in the previous year. The domestic
situation in India was influenced by these global trends and the
ripple effect of a global slowdown was felt. After years of strong
positive growth, the Indian economy slowed down to a GDP of
5% from 6.5% in the previous year.
The Tata Motors Group recorded a 13.4% growth in gross
turnover from `170,678 crores in the previous year to `193,584
crores in FY 2012-13. This is the highest turnover recorded by the
Group. The consolidated revenues (net of excise) for FY 2012-13 of
`188,818 crores grew by 14% over last year on the back of strong
growth in volumes across products and markets at Jaguar Land
Rover. The consolidated EBITDA margins for FY 2012-13 stood at
14.1%. Consequently, Profit Before Tax and Profit After Tax were
`13,633 crores and `9,893 crores, respectively.
Tata Motors Limited recorded a gross turnover of `49,320 crores,
16.7% lower from `59,221 crores in the previous year. Weak macro
economic factors leading to a continued slow-down in the Medium
and Heavy Commercial Vehicles (M&HCV), stiff competition,
mainly in Passenger Vehicles business, severely affected the
standalone operations and profitability. Additionally, the need to
increase marketing expenses to protect and grow market share
has resulted in EBITDA margins reducing from 8.1% to 4.8% for
FY 2012-13. The reduction of profits from operations was offset by
dividend from subsidiary companies of `1,584 crores (including
dividend from JLR) as compared to `114 crores for the previous
year. The Profit Before Tax and Profit After Tax for the FY 2012-
13 were lower at `175 crores and `302 crores, respectvely, as
compared to `1,341 crores and `1,242 crores in the previous year,
respectively.
Jaguar Land Rover recorded a turnover of GB£ 15,784 million,
a growth of 17% from GB£ 13,512 million in the previous year.
Volume growth was driven not only by a full year of the Range
Rover Evoque, but also by increasing sales of existing models.
EBITDA growth also benefitted from a favourable market mix,
operating exchange rates due to the strengthening US$ against
the GB£ and the Euro. Further, cost efficiency improvements in
material costs and manufacturing costs supported by increased
production volume levels also attributed to improved results of
operations. These resulted in a higher EBITDA and Profit Before
Tax of GB£ 2,402 million and GB£ 1,675 million, respectively, as
compared to GB£ 2,027 million and GB£ 1,507 million, respectively
in the previous year. The effective tax rate was higher than the
previous year, since last year it benefitted from recognition of
previously unrecognised tax losses in the last year. The Profit After
Tax for FY 2012-13 stood at GB£ 1,215 million as compared to
GB£ 1,481 million last year (Jaguar Land Rovers’ figures as per IFRS).
Tata Motors Finance Limited, the Company’s captive financing
subsidiary, registered total revenue of `2,890 crores higher by
43% in the previous year and reported a Profit After Tax of `309
crores in FY 2012-13 (previous year: `240 crores). Tata Motors
Finance Limited proposed a dividend of 7% per equity share for
FY 2012-13.
Tata Daewoo Commercial Vehicle Company Limited, South
Korea registered revenues of KRW 823.9 billion (`4,017 crores),
a growth of 8% over the previous year. However, the positive
impact of higher volumes and various cost control initiatives
were negated by a provision of KRW 18.9 billion (`92 crores) on
account of a Court verdict in an ordinary wage suit filed by its
Union employees resulting in a loss of KRW 9.2 billion (`45 crores)
(previous year: profit of `8.74 crores).

68th ANNUAL REPORT 2012-13
54
VEHICLE SALES AND MARKET SHARES
The Tata Motors Group sales for the year stood at 11,91,968
vehicles, lower by 6% as compared to the previous year. Global
sales of all Commercial Vehicles were 593,897 vehicles, while sales
of Passenger Vehicles were at 598,071 vehicles.
TATA MOTORS
The Company recorded sales of 765,557 vehicles, a decline of 11%
over last year. Industry growth during the year was also muted at
1.1%, resulting in the Company’s market share decreasing to 22%
in the Indian automotive industry from 25.1% in the previous year.
The Company exported 50,938 vehicles during the year, lower by
19%, as compared to the previous year.
Commercial Vehicles
Within the domestic market, the Company continued to
strengthen its presence in Commercial Vehicles, with sales of
5,36,232 vehicles, an all time high for the Company, growing 1.1%
from the previous year. This represented a market leadership share
of 59.5% in the domestic CV market which was mainly supported
by steep growth in the LCV segment.
Some of the highlights for the year were:
� Sales in the LCV segment continued to drive performance,
growing by a 21.8% during the year to 3,93,468
vehicles. Market share in the LCV segment expanded
by 200 basis points registering a 62.2% market share in
FY 2012-13. The Company has grown and consolidated its
position in the LCV segment, leading to expansion of the
market share, especially in the Ace Segment. Sales of the
Tata ACE reached highest ever at over 3,25,000 during
FY 2012-13. The Tata Ace family crossed 10,00,000 sales
since its launch. During this year, the Company launched
‘Tata Xenon’, a stylish and rugged pick-up, offering both
single cab and dual cab versions, with best in class looks,
operating economies and fuel efficiency.
� Slowdown in economic activity, sluggish infrastructure
spending and weak macro outlook coupled with higher
operating costs for transport operators, adversely impacted
demand in the M&HCV industry. The M&HCV segment
which is the harbinger for growth in the economy de-grew
by 23.3% in the year. The Company’s sales in the M&HCVs
segment were 1,42,764 vehicles. The depressed market
scenario combined with new player entry resulted in very
high competitive intensity. Several new products and
variants across the traditional, Prima and Construck range
focusing on ‘best in class’ performance, reliability and fuel
efficiency, were introduced.
� The year also marked the roll-out of the two millionth
truck from the Company’s manufacturing facility at
Jamshedpur. The plant manufactures the Company’s entire
range of M&HCV trucks, including the Tata Prima, both for
civilian and defence applications. Many first of its class heavy
trucks designed and built specifically to offer best in class
performance, reliability and fuel efficiency were introduced
viz - Tata LPT 3723 – the first 5 axle rigid truck in the country
in the 10 x 4 configuration, the Tata Prima 3138.K Tipper,
the Tata Prima 4938.S tractor and the Tata Prima 230 HP
– LX range consisting of Tata Prima LX 4923.S, Tata Prima
LX4023.S and Tata LPK 3118 tipper. Launches of buses
such as MCV buses for intercity (AC – 45 Seater) and staff
transportation (Non AC – 41 Seater), LP/ LPO Starbus Ultra
with best in class features and fuel efficiency tailored to suit
Indian conditions with highest capacity school bus in ICV
platform in India (56 seats).
In January 2013, Tata Motors became the first company in India
to introduce warranty period of four years on heavy trucks. The
Company also introduced a Telematics and Fleet Management
Service, branded “Tata FleetMan’’ an intelligent vehicle and driver
management solution.
Passenger Vehicles
The domestic passenger car industry was affected mainly by weak
sentiments, high cost of ownership, high interest rates, fuel prices
and reduction in discretionary spends. Overall growth in Domestic
Passenger vehicle industry was flat in FY 2012-13, within which
Utility Vehicles recorded a robust growth of 51.5% on the back
of new launches catering not only to the traditional rugged SUV
customers but also to the customer preferring the more car-like
soft roader utility vehicles and cars segment de-grew by 6.9%.
During the year, the Company’s Passenger Vehicles sales were
lower by 31.1% at 2,29,325 vehicles, registering an 8.9% market
share. The Company sold 1,80,520 cars and 48,805 utility vehicles
and vans, lower by 34.6% and 14.4% respectively, over the previous
year. The Company’s sales in the mid-size segment suffered as
competitive activity intensified with multiple new launches

55
Directors’ Report (52-65)
CORPORATE OVERVIEW FINANCIAL HIGHLIGHTS FINANCIAL STATEMENTSSTATUTORY REPORTS
in this segment. The Company has taken various initiatives to
improve its product refreshes/launch programmes, operational
efficiency, dealer effectiveness, working capital management and
restructuring customer facing functions.
The Company sold 2,294 vehicles of Jaguar Land Rover brands
during FY 2012-13. Network for these brands continued to
grow with 17 operational outlets across 15 cities in the Country
by the year end. The plant in Pune expanded its capacity and
commenced operations to roll out locally built Jaguar XF in India
from November 2012.
Some of the highlights of this year’s performance were:
� Launches of the Vista D90; and refreshed Tata Indica eV2,
the most efficient car in its class with a mileage of 25 kmpl,
with new exteriors and additional convenience features.
� Launched the Manza Club Class with first in class features
like 6.5’’ infotainment screen with voice enabled GPS
guidance system, infinity roof, premium Italian leather
seating system and plush interiors.
� Launched the Tata Safari Storme with new interiors
and improved performance - disc brake on all wheel and
projector lens head lamp - first time in its class and Tata
Aria Pure LX - a new variant with a bouquet of features, at
a stunning price.
� Launched the Nano MY13 with features like music system
with Bluetooth/USB, glove box, refreshed interiors, etc., in
an array of colours.
The above launches of the Nano MY13, Manza, Vista D90
and the Safari Storme were in-line with the Company’s
objective of taking the brand to a higher level, while making
it relevant for the younger buyer.
� Showcased the Vista Extreme, a concept that combines
the package efficiency of a hatch with the usability of the
modern urban Utility Vehicle.
� The Company continued to focus on building brand
strengths, refreshing the products and enhancing sales
and service experience. The Company also introduced a
new look, stylish, tech savvy best in class flagship Passenger
Vehicle showrooms, for superior customer experience at
pilot dealership in Mumbai and Delhi and this initiative will
now be replicated to other setups across the country.
A new leadership team in the Passenger Vehicle business was
in place towards the latter half of the year with rich experience
not only from the automotive but from other sectors as well. The
Company is working on a customer-centric strategy for providing
the best customer experience with focus on products, world class
manufacturing practices, purchase experience and consistent
quality of services. As a precursor to future launches, the Company
would be shortly unveiling improved and enhanced vehicles
across its key brands.
Exports
For Tata Motors, traditionally strong markets in South Asia such as
Bangladesh and Sri Lanka also were affected by internal conflict,
political unrest and regulatory changes. As a result, export sales of
the Company de-grew by 19.3% to 50,938 vehicles. With a view
to expand its International Business, the Company re-entered the
market of Saudi Arabia to re-establish its business in the Kingdom
and launched its brand at the Jakarta Auto Show to address
the Indonesian market - a key growth market. The Company
introduced a host of new products on existing and new platforms
in existing and new markets and showcased its vehicles in major
auto shows in strategically important markets.
The Company continued to outperform competition in terms of
exports of Commercial Vehicles and enjoyed a total exports share
of 57% in FY 2012-13, exporting 44,109 Commercial Vehicles.
The Company exported 6,829 Passenger Vehicles. Aria witnessed
growth in shipments led by a strong push into European markets.
Indica grew due to strong fleet and entry level customer demand
and Manza grew albeit over a low base, in South Africa. Other UVs
- Safari, Sumo and Grande, showed growth led by the revival
of demand in Nepal and Sub-Saharan Africa. Nano and Indigo
were the only significant under-performers due to economic and
political upheavals in key markets - Sri Lanka and Nigeria.
Some of the highlights of this year’s performance were:
� Inaugurated its first 3S (Sales, Service and Spares) setup in
Yangon, Myanmar.
� Won a tender for supplying 449 vehicles to Kuwait
Municipality, Prestigious order for supply of 715 Xenon’s
from the US Army.
� Started Driver Training School in Bangladesh and Mechanic
Training Centre in South Africa and Kenya.

68th ANNUAL REPORT 2012-13
56
JAGUAR LAND ROVER
Jaguar Land Rover has had a successful year of continued growth
in all markets, despite uncertain trading conditions globally.
Jaguar Land Rover sold 372,062 vehicles in FY 2012-13, an increase
of 18.3% over the previous year. At the brand level, wholesale
volumes were 57,812 vehicles for Jaguar and 314,250 vehicles
for Land Rover, growing 7% and 20.7%, over the previous year,
respectively. All market regions have grown, led by China where
retail sales at 77,075 vehicles were up by 48% over previous year.
Retail volumes in Europe were 80,994 vehicles, 18% increase over
the previous year. UK retail volumes were 72,270 vehicles, a 20%
increase, whilst the North American retail volumes were 62,959
vehicles, an increase of 9% over the previous year. Retail sales for
the Asia Pacific region at 17,849 vehicles, were higher by 27% and
for the rest of the world were 19% higher at 63,489 vehicles over
the previous year.
Jaguar Land Rover has a multifaceted strategy to position itself as
a leading manufacturer of premium vehicles offering high-quality
products tailored to specific markets. The company’s success is tied
to its investment in product development and market expansion
which drives the strategic focus on product design and quality.
Jaguar Land Rover operates three major production facilities and
two advanced design and engineering facilities all in the United
Kingdom. Jaguar Land Rover markets products in 178 countries,
through a global network of 17 national sales companies (NSCs),
85 importers, 62 export partners and 2,485 franchise sales dealers,
of which 689 are joint Jaguar and Land Rover dealers.
With the objective of increasing its marketing and dealer
networks in emerging markets, Jaguar Land Rover established a
National Sales company in China in 2010 to expand its presence
and has plans to increase its network of dealers in China. Similar
plans of increasing its dealer network are also underway in India.
Jaguar Land Rover also aims to establish new manufacturing
facilities, assembly points and suppliers in select markets. The joint
venture with Chery Automobiles, China as also an established
manufacturing operation for some of its products and product
development activities in India are examples of these initiatives.
Some of the highlights of this year’s performance were:
� Launch of the all new aluminum Range Rover in December
2012, with a world-wide roll-out in the last quarter of the
year, recording sales of over 13,000 vehicles in the first four
months. The Range Rover has already received over 10
global awards including WhatCar? ‘Best Luxury Car’.
� Launch of the all new aluminum Range Rover Sport in
March 2013, with a world wide roll out in the first half of
FY 2013-14.
� Expanded the Jaguar XF range with an all wheel drive
version and a new Sportbrake and introduced a more fuel
efficient, 2.0l XF with an 8 speed automatic gear box.
� Introduction of new variants of the Jaguar XF, the launch of
the new Range Rover, as well as the continued strength of
the Evoque, were key contributors to the overall success.
� Jaguar Land Rover’s joint venture with Chery Automobiles,
China has been formalised to develop, manufacture and sell
certain Jaguar and Land Rover vehicles and jointly branded
vehicles for the Chinese market.
� Continued investment in new state-of-the-art facility at
Wolverhampton, UK, to manufacture new advanced low
emission engines.
Jaguar Land Rover and Tata Motors participated in various
international autoshows displaying its range of products, including
at Geneva, New York, Detroit and Jakarta, wherein the displayed
products won accolades and a positive response.
TATA DAEWOO COMMERCIAL VEHICLES COMPANY
LIMITED
Tata Daewoo Commercial Vehicles Company Limited (TDCV)
sold 10,100 vehicles- higher by 6% over the previous year. TDCV
exported 4,700 vehicles in FY 2012-13, which is the highest ever
in its history, registering a growth of 57.8% as compared to 2,979
vehicles exported in the previous year. However, in the domestic
market, sales decreased by 17.6% to 5,400 vehicles as against 6,552
vehicles sold in the previous year, due to economic slowdown.
TATA MOTORS (THAILAND) LIMITED
Tata Motors (Thailand) Ltd. (TMTL) sold 4,905 vehicles in
FY 2012-13. These included Tata Xenon pickups, Super Ace and
heavy commercial vehicles. During FY 2012-13, TMTL launched
three additional variants of the pickup, tailor-made for the Thailand
commercial vehicle market. In the single cab segment, which is
used predominantly by the commercial users, Xenon continues
to be ranked fourth amongst eight players in the segment.

57
Directors’ Report (52-65)
CORPORATE OVERVIEW FINANCIAL HIGHLIGHTS FINANCIAL STATEMENTSSTATUTORY REPORTS
TATA MOTORS (SA) (PROPRIETARY) LIMITED
Tata Motors (SA) (Proprietary) Limited (TMSA) sold 864 vehicles
during FY 2012-13. During the year, TMSA introduced four new
models of commercial vehicles and crossed a major milestone of
rolling out its 1,000th vehicle since start of operations last year.
TATA MOTORS FINANCE LIMITED
The vehicle financing activity under the brand “Tata Motors
Finance” (TMF) of Tata Motors Finance Limited (TMFL) – a wholly
owned subsidiary company, continued to show improved
financial results inspite of challenging market conditions and
rising costs of funds.
With the Company’s increased focus on financing of small
commercial vehicles, the total disbursements for the year were at
`11,180 crores - 6% higher than disbursements of `10,505 crores
in the previous year. A total of 2,51,936 vehicles were financed
representing an increase of 9.3% over the previous year. The
disbursals for commercial vehicle were `8,816 crores (1,81,374
vehicles) in FY 2012-13 compared to `7,204 crores (1,20,032
vehicles) for previous year. For passenger cars, disbursals were
`2,364 crores (70,562 vehicles) in FY 2012-13 compared to `3,301
crores (1,10,556 vehicles) in the previous year. The overall market
share in terms of the Tata vehicle unit sales in India financed by
Tata Motors Finance increased from 27% to 33% - led by significant
increase in commercial vehicle market share from 23% to 34%.
Tata Motors Finance Limited continued to expand its reach in the
market place by growing its branch network and expanding its
support to Tata Motors dealership network. Significant increase
in its manpower resources as well as driving IT technology to
improve productivity and output, ensures that Tata Motor Finance
now reaches to over 75% of the dealers. With greater attention
being placed on further enhancing customer experience through
its “Office of the Customer”, TMFL is confident of continuing to
deliver profitable growth in the future.
HUMAN RESOURCES
The Tata Motors Group employed 62,716 permanent employees
(previous year: 58,618 employees) as of the year end out of which
56,393 employees were engaged in automotive operations. The
increase over last year was mainly at Jaguar Land Rover in view
of volume and product development activity. The Company
employed 29,965 permanent employees (previous year: 29,217
employees) as of the year end. The Tata Motors Group has generally
enjoyed cordial relations with its employees and workers.
All employees in India belonging to the operative grades are
members of labour unions except at Sanand and Dharwad
plants. All the wage agreements have been renewed in a timely
manner and are all valid and subsisting. Operatives and Unions
support in implementation of reforms that impact quality, cost
erosion and improvements in productivity across all locations is
commendable.
SAFETY & HEALTH - PERFORMANCE & INITIATIVES
Safety is an integral part of the Company’s operations and is
reviewed at the highest levels including the Board, Executive
Committee, and the Safety, Health and Environment (SHE) Council.
The Board constituted a SHE Committee and also adopted its
charter during the year. The senior leadership is fully committed
to the ultimate goal of zero injury to its employees and all those
who work in our facilities. In its 3 year journey with DuPont,
the organization is progressing aggressively with the vision of
“Excellence in Safety”. In association with DuPont 489 internal
trainers have been developed and 2,058 employees are trained
on leading safety efforts, safety management fundamentals,
incident investigations, contractor safety management and safety.
Defensive Driving Training was imparted to more than 8,000
employees and contractors who drive on business purpose or
who are involved in operations.
A revised Safety & Health Policy has been cascaded which reflects
an increased commitment towards our visitors, contractors and
business partners. A structured review mechanism of safety
performance is in place with ‘‘Lead and Lag’’ indicators, major
incidents and High Potential Incidents (HIPO) announcements
being made monthly to the senior management and leaders.
The Lost Time Injury (LTI) rate for the year under review is lower
at 0.68%, a reduction of 37% over the previous year. Improved
governance in incident reporting with speedy investigations and
corrections, and a collaborative functioning of Safety Committees
across plants have led to an integrated organisation structure.
The Company, in a collaborative initiative with Castrol India
Limited, is integrating safety expertise and knowledge in dealer
workshops and a safety manual has been released with the
objective of reducing potential risks and improve SHE practices.
This year has witnessed a significant improvement in ‘Areas
Beyond Factory Gates’ including warehouses, offices and channel
partners, wherein structured audits, trainings and reporting have
been initiated.

68th ANNUAL REPORT 2012-13
58
At Jaguar Land Rover, the health and safety management
system is based on the UK Health and Safety Executive’s guidance
for Health and Safety Management - HSG65. Jaguar Land Rover’s
Occupational Health Department achieved re-accreditation to
the SEQOH Standard (Safe Effective Quality Occupational Health
Standard) for its activities and management systems. Jaguar Land
Rover’s growth plans have resulted in an increased headcount
and a larger number of contractors are involved in civil and
engineering activities requiring extensive inputs from a health and
safety perspective. This has been met with an incremental rise in
Health and Safety training, induction programmes and continued
focused events around skilled workers being recruited into relevant
functions. The business has continued its programme of proactive
health promotion events for employees and has launched several
Wellbeing Centres to aid in worker assessment, rehabilitation and
piloted electronic ‘WellPoint’ kiosks to allow employees to monitor
their own health data and seek further advice.
At TDCV, Korea, the accident rate and the safety index at 0.18%
and 2.9 were lower than 0.48% and 2.40, respectively, for the
previous year. At TMTL, Thailand, the performance has been
improving with increased safety trainings and reduction in the
number of incidents. At TMSA, South Africa, 5 LTIs were reported,
Safety Management Systems were deployed and several initiatives
taken to improve safety and working conditions.
FINANCE
During the year, the free cash flows for Tata Motors Group were
`3,342 crores, post spend on capex, design and development of
`18,720 crores. Tata Motors Group’s borrowing as on March 31,
2013, stood at ` 53,591 crores (previous year: ` 47,149 crores).
Cash and bank balances stood at ` 21,113 crores (previous year:
`18,238 crores).
Cash flows from operations were `2,258 crores for standalone
operations of the Company. Spend on capex, design and
development were `2,588 crores (net). The borrowings of the
Company as on March 31, 2013 stood at `16,799 crores (previous
year: ̀ 15,881 crores). Cash and bank balances stood at ̀ 463 crores
(previous year: `1,841 crores).
During the year, the Company repaid the Zero Coupon Convertible
Alternate Reference Securities (CARS) amounting to US$ 623.38
million, (`3,493.83 crores) inclusive of a redemption premium
of US$ 150.38 million. Consequent upon exercise of conversion
option by the holders of 4% Foreign Currency Convertible
Notes, aggregating `342 crores (including `141.62 crores in May
2013), the Company allotted 28,308,896 Ordinary Shares/ Shares
represented by ADSs (including 11,789,695 Ordinary Shares/
Shares represented by ADSs in May 2013).
The Company also repaid Tranche 2 of `446 crores of Secured,
Rated, Credit Enhanced, Listed, 2% Coupon Non-Convertible
Debentures (NCDs) inclusive of premium on redemption of `96
crores. Further, the Company also repaid `1,747 crores forming
part of the public fixed deposit scheme launched in December
2008.
The Company issued rated, listed, unsecured, non-convertible
debentures of `2,100 crores. Further `900 crores were issued in
April and May 2013.
Due to significant reduction in volumes, the Company had to
deploy short term funds to support critical long term finance
needs. The Company is in the process of taking appropriate steps
to increase the long term funds.
At Jaguar Land Rover, post spend on capex, design and
development of GB£ 1,846 million (`16,814 crores), the free
cash flows were GB£ 583 million (`4,885 crores) for FY 2012-13.
The borrowings of the Jaguar Land Rover as on March 31, 2013,
stood at GB£ 2,167 million (`17,791 crores) [previous year: GB£
1,974million (`16,206 crores)]. Cash and bank balances stood
at GB£ 2,847million (`23,373 crores) [previous year: GB£ 2,430
million (`19,950 crores)] resulting in negative net debt position.
Additionally, JLR has undrawn committed bank lines of GB£ 865
million (as per IFRS).
In January 2013, Jaguar Land Rover issued US$ 500 million Senior
Notes due 2023, at a coupon of 5.625% per annum. This was an
opportunistic fund raising which enabled Jaguar Land Rover to
reinforce its market acceptance and demonstrated the continued
confidence of the investors. This was a further step taken towards
strengthening capital structure and enhancing the debt maturity
profile.
TML Holdings Pte Ltd, Singapore, a 100% subsidiary of the
Company, holding the investment in Jaguar Land Rover raised
Senior Notes aggregating SG$ 350 million in May 2013.
Tata Motors Finance Limited raised `100 crores by an issue of
unsecured, non-convertible, subordinated perpetual debentures
towards Tier 1 and Tier 2 Capital and `90.40 crores by an issue
of unsecured, non-convertible, subordinated debentures towards
Tier 2 Capital in order to meet its growth strategy and improve its
Capital Adequacy ratio.

59
Directors’ Report (52-65)
CORPORATE OVERVIEW FINANCIAL HIGHLIGHTS FINANCIAL STATEMENTSSTATUTORY REPORTS
With healthy profitability and cash flow generation, the
Consolidated Net Automotive Debt to Equity Ratio stood at
0.24:1on March 31, 2013, as compared to 0.25:1 on March 31,
2012.
Tata Motors Group has undertaken and will continue to implement
suitable steps for raising long term resources to match fund
requirements and to optimise its loan maturity profile.
During the year, the Company’s rating for foreign currency
borrowings was revised upwards by Standard & Poors to “BB”/
Positive and was retained at existing levels by Moodys at “Ba3”/
Stable. For borrowings in the local currency, the outlook on the
ratings was improved from “Stable” to “Positive” and the rating
stood at “AA-”/Positive by Crisil and at “AA-”/Positive by ICRA. The
Non Convertible Debentures are rated by CARE at “AA”.
During the year, Jaguar Land Rover’s rating for was revised upwards
by Standard & Poors to “BB-“/Positive. As on March 2013, the other
ratings stood “B1”/Stable by Moodys and “BB-”/Stable by Fitch.
For Tata Motors Finance, CRISIL revised its rating outlook on long-
term debt instruments and bank facilities to ‘CRISIL AA - Positive’
from ‘CRISIL AA - Stable’. The ratings on the short-term debt
instruments and bank facilities were reaffirmed at ‘CRISIL A1+’.
FIXED DEPOSITS
The Company has not accepted any public deposits during
FY 2012-13. As on March 31, 2013, the Company had deposits
aggregating `314.14 crores from 11,338 investors. There were no
overdues on account of principal or interest on public deposits
other than the unclaimed deposits as at the year end.
INFORMATION TECHNOLOGY INITIATIVES
The Company continues to leverage Information Technology (IT) as
a key enabler of its strategy, business growth and competitiveness.
IT provides employees, customers, suppliers, dealers and business
partners with best in class technology solutions. IT leverages
strong partnerships with product and services companies to
support business growth and innovation.
The Company and JLR entered into a major long term outsourcing
agreement with Tata Consultancy Services Ltd (TCS) after a
rigorous two year long competitive process. This will harmonise
and standardise the IT services, service level agreements and
standards across the Tata Motors Group and lead to efficiencies in
operations and lower IT costs.
Other major highlights of IT at group level are –
� The Company’s unique CRM solution crossed 4,000
channel partner locations and 40,000 users interacting with
customers, augumented by 1,000+ agent call centers.
� TDCV Korea implementing CRM, leveraging TML CRM
capabilities.
� Tata Motors Indonesia implementing SAP and CRM
leveraging base capabilities.
� JLR global expansion to China is being ably supported by IT
capabilities.
� JLR SAP implementation is progressing smoothly, including
implementation in NSCs in major markets.
� Developing key business capability enhancement initiatives
like Analytics, Telematics, and Mobility solutions.
In addition, product development processes in the Company
continue to grow on best of the breed tools and technology
solutions, for enhancing product development capabilities,
addressing quality and speed. Digital product validation processes
have evolved to provide solutions in key areas:
� Enhanced Digital Manufacturing Planning capabilities.
� In-house developed productivity improvement tools like
‘Digital Vault’ were rolled out.
� In-house ‘Knowledge Based Engineering’ (KNEXT) applications
spread and enhanced in various product design functions.
� State-of-the-art visualization capabilities in digital product
engineering review process is implemented.
Tata Motors Group continue their collaboration in various
Information Technology areas with synergies being explored
for cross utilization of IT capabilities. The Group companies are
working together in areas of ERP, outsourcing and technologies.
Tata Technologies continues to be a strategic partner in
strengthening Tata Motors Groups’ IT capabilities in process
transformation through technology.
TECHNOLOGY AND ENVIRONMENT FRIENDLY
INITIATIVES
The Tata Motors Group continues to innovate, with a view to

68th ANNUAL REPORT 2012-13
60
enhance the market share and aims at products, which cater
to the changing needs of the customer for both fleet owners
and individual customers. Besides new product developments
covered above, some of the key initiatives on Environment friendly
technologies include:
� Fuel efficiency improvement through development of
advanced oil formulation.
� Fuel efficiency improvement initiatives on 4 cylinder and 6
cylinder engines of LCV, M&HCVs through various engine
measures such as Exhaust Gas Recirculation (EGR), common
rail including latest software features in engine management
system.
� 1.2 L Bi-fuel CNG engine development for passenger car.
� Bi-fuel CNG and Gasoline 273 MPFI engine for Nano.
� Demonstrated a Mild Hybrid technology on Nano with
advance engineering functions for enhancing the CO2
emission.
� Nano Diesel variant is being developed with Electric Power
Assist Steering (EPAS) for enhancing the ease of driving and
good fuel economy.
� Vista has been made compliant to the Euro V emission
requirement with better drivability and higher technology
features.
� CNG variant of the Indigo CS is ready for launch in the
market.
SUBSIDIARY AND ASSOCIATE COMPANIES
Tata Motors announces consolidated financial results on a
quarterly basis. As required under the Listing Agreement with the
Stock Exchanges, Consolidated Financial Statements of the Tata
Motors Group are attached.
Pursuant to the provisions of Section 212(8) of the Companies Act,
1956 (the Act), the Ministry of Corporate Affairs vide its General
Circular No 2/2011 dated February 8, 2011, has granted a general
exemption subject to certain conditions to holding companies
from complying with the provisions of Section 212 of the Act,
which requires the attaching of the Balance Sheet, Profit & Loss
Account and other documents of its subsidiary companies to its
Balance Sheet. Accordingly, the said documents are not being
included in this Annual Report. The main financial summaries
of the subsidiary companies are provided under the section
‘Subsidiary Companies: Financial Highlights for FY 2012-13’ in the
Annual Report. The Company will make available the said annual
accounts and related detailed information of the subsidiary
companies upon the request by any member of the Company or
its subsidiary companies. These accounts will also be kept open
for inspection by any member at the Registered Office of the
Company and the subsidiary companies.
SUBSIDIARY COMPANIES
Tata Motors had 64 (direct and indirect) subsidiaries (10 in India
and 54 abroad) as on March 31, 2013, as disclosed in the accounts.
During the year, the following changes have taken place in
subsidiary companies:
Subsidiary companies formed/acquired
� Jaguar Land Rover India Limited - an indirect subsidiary of
Jaguar Land Rover Automotive PLC
� PT Tata Motors Distribusi Indonesia - a wholly owned
subsidiary of PT Tata Motors Indonesia
Companies ceasing to be subsidiary companies
� Tata Engineering Services (Pte) Ltd. - struck off from the
Register of Accounting and Corporate Regulatory Authority
(ACRA).
� Miljobil Greenland AS, upon liquidation of TMETC’s
shareholding
Name changes
� Jaguar Cars Limited to Jaguar Land Rover Limited
� Jaguar Land Rover PLC to Jaguar Land Rover Automotive Plc
Besides the above, Jaguar Land Rover continued to integrate /
restructure legal entities for manufacturing and for exporting
globallly as combined brand legal entities. Other than the above,
there has been no material change in the nature of the business
of the subsidiary companies.
ASSOCIATE COMPANIES
As at March 31, 2013, Tata Motors had 8 associate companies and
4 Joint Ventures as disclosed in the accounts.
ENERGY, TECHNOLOGY & FOREIGN EXCHANGE
Details of energy conservation and research and development
activities undertaken by the Tata Motors alongwith the
information in accordance with the provisions of Section 217(1)(e)
of the Companies Act, 1956, read with the Companies (Disclosure
of Particulars in the Report of Board of Directors) Rules, 1988, are
given as an Annexure to the Directors‘ Report.

61
Directors’ Report (52-65)
CORPORATE OVERVIEW FINANCIAL HIGHLIGHTS FINANCIAL STATEMENTSSTATUTORY REPORTS
DIRECTORS
Mr Ratan N Tata stepped down as the Chairman and Director of the
Company on December 28, 2012, in accordance with the ‘Policy
for Retirement Age of Non-Executive Directors’ adopted by the
Company. Mr Tata who was appointed on the Company’s Board
in 1981 and later as the Executive Chairman in 1988, had through
his bold vision and strategic leadership and commitment to the
Company transformed it from a domestic truck company to a
complete automobile company with path breaking products such
as the Indica and the Nano. Thereafter it was his understanding of
the global dimensions and dynamics of the automobile business
and his vision that led to the Company deciding to takeover
Jaguar Land Rover in the UK. The transformation of Jaguar Land
Rover through the change in its culture and the approach to its
business led by Mr Tata has resulted in transforming Jaguar Land
Rover into a profitable and successful company.
Mr Tata was on the Board for more than 30 years and was the
Chairman of the Executive Committee of the Board and a member
of the Remuneration and Nominations Committees. The Directors
place on record the immeasurable debt the Company owes
to Mr Tata for the visionary leadership, strategic direction and
stewardship so liberally given to the Company and in recognition
of his immense contribution and great service to the Company,
the Board conferred upon Mr Tata the title of ‘Chairman Emeritus’.
The traditions and values that he strove to imbibe will remain the
guiding principles for this Company in the coming years.
Mr Sam M Palia, Non Executive, Independent Director of the
Company since May 2006, on completing the age of 75 years
on April 25, 2013, retired as per the ‘‘Policy for Retirement Age
of Non-Executive Directors’’ adopted by the Company. Besides
being a Board member, Mr Palia was also an active member of the
Audit Committee and Nominations Committee and Chairman of
the Investors’ Grievance Committee and Ethics and Compliance
Committee. Mr Palia was also designated as the ‘Audit Committee
financial expert’ as required under the Sarbanes Oxley Act
and NYSE Listing Agreement. Mr Palia had by his counsel and
guidance, significantly contributed to deliberations at the Board
and Committee meetings. The Board also placed on record its
appreciation for the contributions made and the role played by
Mr Palia as an independent director of the Company.
Mr Ranendra Sen, Non Executive, Independent Director of the
Company since June 2010, resigned from the Board of Directors
of the Company with effect from October 16, 2012, due to
personal reasons. The Board placed on record its appreciation
of the contributions made by Mr Sen during his tenure on the
Company’s Board as an independent director of the Company.
Mr Cyrus P Mistry was appointed as the Chairman of the Company
with effect from December 28, 2012, consequent upon Mr Ratan
N Tata’s retirement. Tata Steel had vide their letter dated March 28,
2013, nominated Mr Cyrus P Mistry as the ‘Steel Director’ pursuant
to Article 127 of the Company’s Articles of Association in place of
Mr Ratan N Tata.
Mr Karl J Slym and Ms Falguni S Nayar were appointed as an
Additional Directors w.e.f. September 13, 2012 and May 29, 2013,
respectively. In accordance with Section 260 of the Companies
Act, 1956 (the Act) and Article 132 of the Company’s Articles of
Association, they will cease to hold office at the forthcoming
Annual General Meeting and are eligible for appointment. Mr Slym
was also appointed as the Managing Director of the Company for
a period of 5 years with effect from September 13, 2012, subject
to the approval of the Members and the Central Government. An
abstract and memorandum of interest under Section 302 of the
Act, has been sent to the Members of the Company.
In accordance with the provisions of the Act and the Articles of
Association of the Company, Mr Nusli N Wadia and Dr Raghunath
A Mashelkar are liable to retire by rotation and are eligible for re-
appointment. Attention of the Members is invited to the relevant
items in the Notice of the Annual General Meeting and the
Explanatory Statement thereto.
CORPORATE GOVERNANCE
A separate section on Corporate Governance forming part of the
Directors’ Report and the certificate from the Practicing Company
Secretary confirming compliance of Corporate Governance
norms as stipulated in Clause 49 of the Listing Agreement with
the Indian Stock Exchanges is included in the Annual Report.
PARTICULARS OF EMPLOYEES
The Information on employees who were in receipt of
remuneration of not less than `60 lakhs during the year or `5
lakhs per month during any part of the said year as required
under Section 217(2A) of the Companies Act, 1956 and the Rules
made thereunder is provided in the Annexure forming part of
the Report. In terms of Section 219(1)(b)(iv) of the Act, the Report
and Accounts are being sent to the shareholders excluding the
aforesaid Annexure. Any member interested in obtaining a copy
of the same may write to the Company Secretary.

68th ANNUAL REPORT 2012-13
62
CORPORATE SOCIAL RESPONSIBILITY INITIATIVES
A separate section on initiatives taken by the Tata Motors Group
to fulfil its Corporate Social Responsibilities is included in the
Annual Report.
BUSINESS RESPONSIBILITY REPORT
Vide its Circular dated August 13, 2012, Securities and Exchange
Board of India (SEBI) mandated the inclusion of Business
Responsibility Report (BRR) as a part of the Annual Report for
top 100 listed entities based on their market capitalisation on
BSE Limited and National Stock Exchange of India Limited, as on
March 31, 2012. The said reporting requirement is in line with
the ‘National Voluntary Guidelines on Social, Environmental and
Economic Responsibilities of Business (NVGs)’ notified by Ministry
of Corporate Affairs, Government of India, in July, 2011. Pursuant to
the above, the Stock Exchanges amended the Listing Agreement
by inclusion of Clause 55 providing a suggested framework
of a BRR, describing initiatives taken by the Company from an
environmental, social and governance perspective. In line with
the press release and FAQs dated May 10, 2013, issued by SEBI,
the Company’s BRR is hosted on its website www.tatamotors.
com. Any shareholder interested in obtaining a physical copy of
the same may write to the Company Secretary at the Registered
Office of the Company.
AUDIT
M/s Deloitte Haskins & Sells (DHS), Registration No. 117366W,
who are the Statutory Auditors of the Company, hold office
until the conclusion of the ensuing Annual General Meeting. It is
proposed to re-appoint them to examine and audit the accounts
of the Company for the FY 2013-14. DHS have, under Section
224(1) of the Act, furnished a certificate of their eligibility for
re-appointment.
Cost Audit
As per the requirement of the Central Government and pursuant
to Section 233B of the Act, the audit of the cost accounts relating
to motor vehicles is carried out every year. Pursuant to the approval
of Ministry of Corporate Affairs, M/s Mani and Company having
registration No. 00004 were appointed as the Cost Auditors for
auditing the Company’s cost accounts relating to the Company’s
products for FY 2012-13. An application has been made to the
Central Government seeking their approval, for the appointment
of M/s Mani and Company for auditing the Company’s cost
accounts relating to the Company’s products for FY 2013-14.
The cost audit report and compliance report for FY 2011-12 were
filed by the Company on December 28, 2012, well within the
prescribed due date of February 28, 2013. The cost audit report
and compliance report for FY 2012-13 is expected to be filed
within the prescribed time.
DIRECTORS’ RESPONSIBILITY STATEMENT
Pursuant to Section 217 (2AA) of the Act, the Directors, based on
the representation received from the Operating Management,
confirm that:-
- in the preparation of the annual accounts, the applicable
accounting standards have been followed and that there
are no material departures;
- they have, in the selection of the accounting policies,
consulted the Statutory Auditors and have applied them
consistently and made judgments and estimates that are
reasonable and prudent so as to give a true and fair view of
the state of affairs of the Company at the end of the financial
year and of the profit of the Company for that period;
- they have taken proper and sufficient care, to the best of their
knowledge and ability, for the maintenance of adequate
accounting records in accordance with the provisions of
the Act, for safeguarding the assets of the Company and for
preventing and detecting fraud and other irregularities;
- they have prepared the annual accounts on a going concern
basis.
ACKNOWLEDGEMENTS
The Directors wish to convey their appreciation to all of the
Company’s employees for their enormous personal efforts as well
as their collective contribution to the Company’s performance.
The Directors would also like to thank the employee unions,
shareholders, fixed deposit holders, customers, dealers, suppliers,
bankers, Government and all the other business associates for the
continuous support given by them to the Company and their
confidence in its management.
On behalf of the Board of Directors
CYRUS P MISTRY
Chairman
Mumbai, May 29, 2013

63
Directors’ Report (52-65)
CORPORATE OVERVIEW FINANCIAL HIGHLIGHTS FINANCIAL STATEMENTSSTATUTORY REPORTS
Particulars of Conservation of energy, Technology absorption
and Foreign exchange earnings and outgo in terms of Section
217(1)(e) of the Companies Act, 1956 read with the Companies
(Disclosure of particulars in the Report of Directors) Rules, 1988
forming part of the Directors’ Report for FY 2012-13:
A. CONSERVATION OF ENERGY
The Company has always been conscious of the need for
conservation of energy and has been sensitive in making
progress towards this end. Energy conservation measures
have been implemented at all the plants and offices of the
Company and special efforts are being made on undertaking
specific energy conservation projects like:
� Installation of Waste heat recovery for paint baking oven
flue gas to heat water of process, improvement in burning
efficiency of burners by controlling the air - fuel ratio with
the help of flue gas analysis.
� Conversion of electrical heating into Natural Gas heating
system of washing machines, Conversion of electrical
heating into LPG heating of Endogas generators.
� Installation of Variable Frequency Drives for various
applications like Blower’s and Pump’s Motors as a flow
control strategy for energy conservation.
� Installation of CFL, LED bus bar indicators, Use of 54Wx4 T5
lamps for high bay lights, Installation of energy savers in
lighting circuits, Installation of LED street lights.
� Installation of Light pipes and Transparent Polycarbonate
sheets, Installation of Solar water heating system for
Crèche.
� Modification in electrical logic for automatic switching
On-Off operation of hydraulic motors, coolant pumps,
blowers etc. Optimization of AC plant operations, removal
of unwanted AC systems.
� Wind Ventilators, downsizing of motors, trimming of
impeller of oversized water recirculation pump, Delta to star
connection of motors etc.
� Installation of Biogas plant for canteen waste and generation
of electrical energy from biogas and used for pumps at ETP.
These changes have resulted in energy saving of 1.93 crores
units of electricity, 275KL of LDO, 5.95KL of HSD and 124MT
of Propane. The whole effort resulted in cost savings for the
Company of around ̀ 14.04 crores and annual CO2 reduction
of 17,265 tCO2.
New initiative has been taken for implementation of ISO:
50001 Energy Management System (EnMS) across all
Plants of the Company in India. Company’s Dharwad Plant,
Pantnagar Plant and Sanand Plant are certified for ISO: 50001
Energy Management System (EnMS) by M/s Bureau Veritas
Certification. The certification work for Pune, Jamshedpur
and Lucknow Plants is in progress.
The Company’s Endeavour for tapping wind energy has
also made significant contributions.
� Energy is being generated from existing captive wind
power. Further initiatives have been taken up to make
Pimpri Plant “carbon neutral” by purchase of wind power
from Third Party through open access. Towards this end, a
Power Purchase Agreements (PPA) have been signed with 4
parties for an additional `7.40 crores wind units. Presently,
Commercial Vehicle plant at Pune annually utilised Wind
Power (Green Power) of `8.04 crore wind units (equivalent
CO2 Reduction of 75,242 tCO
2) and this resulted in savings
in electricity charges of Company’s Pune plant of `25.89
crores.
� Company’s 20.85MW Wind power project: United Nations
Framework Convention for Climate Change (UNFCCC)
issued 24,432 CERs on April 5, 2013, for the wind power
generation period 2010 to 17th April-11.
� Initiative towards Renewable Energy Certificate (REC)
Creation: As per CERC guidelines, Company has got
its’ 21.95MW Wind Power REC project accredited by
Maharashtra Energy Development Agency (MEDA) and
registered by National Load Dispatch Centre (NLDC) New
Delhi on 3rd July 2012. Total 16,976 RECs have been issued
by NLDC since July 2012 and total 12,480 RECs sold through
auction resulted into accrued benefit of `1.81 crores.
� Initiatives towards Carbon Neutral Manufacturing Plant have
been implemented at Company’s Sanand Plant by using
Green Power (Wind Power). PPA was signed with a wind
power supplier, which will allow tCO2 emission reduction
of 9,500 tCO2 per annum, resulting in energy cost savings of
`0.78 crore.
Award / Recognition received during the year:
The Company’s Lucknow Plant was awarded the Certificate of
Merit in National Energy Conservation Award 2012, in Automobile
Manufacturing category by Bureau of Energy Efficiency (BEE),
Ministry of Power, Government of India.
B. RESEARCH AND DEVELOPMENT (R & D)
Specific areas in which R & D carried out by the
Company
The Company has continued its endeavor to adopt
technologies for its product range to meet the requirements
of a globally competitive market. All Company products
and engines are compliant with the prevalent regulatory
norms. The Company has also undertaken programs for
development of vehicles which run on alternate fuels such
as LPG, CNG, bio-diesel, electric traction and hydrogen.
Benefits derived as a result of the above R&D
In keeping with the requirement of technological
up-gradation of its engine development facility, the
Company has added facilities enabling compliance of
regulations and reducing product development time to
meet market requirements.
During the year, the Company filed 83 Patent Applications
and 38 Design applications. In respect of applications filed
ANNEXURE TO THE DIRECTORS’ REPORT

68th ANNUAL REPORT 2012-13
64
in earlier years, 16 Patents were granted and 68 Designs
were registered.
Future Plan of Action:
The Company continues its effort on developing new
products and technologies to meet growing customer
expectations. The existing products will be refreshed at
regular intervals to suit upcoming trends. In the long term,
the Company is focusing on improving driving comfort, fuel
efficiency, performance and aesthetics.
Major technology absorption projects undertaken during the last year include:
Sr. No. Technology For Status
1 Development of Infotainment system Development in Progress
2 Brushless DC Motor for Engine Cooling Module Development in Progress
3 Development of Low Carbon Vehicle Technology Program Development in Progress
4 Development of Electric Traction Motor Technology Under Implementation
5 Hydrogen re-circulation blower system on Fuel cell Battery-Hybrid Bus (4x2) family Development in Progress
6 Battery Management System on Bus and Car Hybrids Development in Progress
7 Jute Fiber Composite for Headliners Implemented
8Development of a Hydra-mount for vibration reduction of vehicles at a particular frequency
of resonance of an engine or a cabDevelopment in Progress
Expenditure on R & D
(` in crores)
Expenditure incurred on research and development : 2012-13 2011-12
(a) Revenue Expenditure - charged to Profit and Loss Statement 500.15 243.30
(b) Revenue Expenditure - capitalised 1,142.38 1,127.86
(c) Capital Expenditure 116.78 177.53
1,759.31 1,548.69
R & D cost as a % to Revenue from Operations 3.9% 2.9%
C. TECHNOLOGY ABSORPTION, ADAPTATION
AND INNOVATION
Efforts made towards technology absorption,
adaptation and innovation
Initiatives on technological changes with an emphasis on
customer orientation has been sharpened. The Company
is putting continuous efforts in acquisition, development,
assimilation, and utilization of technological knowledge. The
Company, in its constant endeavor to improve processes
in design and planning in the manufacturing domain, has
implemented integration of digital product data into digital
manufacturing planning system. Substantial progress has
been achieved on various advanced engineering projects.
Projects in this portfolio include development of vehicles
running on alternative fuels including CNG, LPG, Ethanol,
Bio-Diesel and Hydrogen. The Company focuses on
alternate fuels, greenhouse gas reduction and fuel efficiency
improvements. The Company is actively working on various
hybrid and electric power trains for hybrid, electric and fuel
cell electric vehicles for both commercial and passenger
car applications. Various initiatives for power trains were
taken up during the year which consisted of performance
improvement, development to meet stringent emission
norms and refinement. Development of new generation
power trains was also initiated during the year. The Company
is focusing on new technologies to enhance the safety of
the occupants. Safety performance target setting is also
done through Computer-Aided-Engineering and testing
capabilities.
Benefits derived as a result of the above efforts
These initiatives supported the Company’s endeavour
in bringing about improvements in existing products
and developing new products. The Company was able
to emphasize on value analysis / value engineering and
innovative cost reduction ideas to cut down the cost.

65
Directors’ Report (52-65)
CORPORATE OVERVIEW FINANCIAL HIGHLIGHTS FINANCIAL STATEMENTSSTATUTORY REPORTS
D. FOREIGN EXCHANGE EARNINGS & OUTGO
Activities relating to exports
The Company exported 50,938 vehicles during the year.
Export initiatives such as goods, products and services
exported include
� The Company introduced a host of new products in
existing and new markets and showcased our vehicles
in major auto shows in strategically important markets.
� The Company executed some big and prestigious
Government orders in Kuwait and US.
� Driver Training School started in Bangladesh.
� Mechanic Training Centre started in South Africa and
Kenya.
� Body Repair Manual launched.
� Mobile Website launched.
� Electronic Parts Catalogue started.
� Monthly Product Update e-newsletter started.
Development of export markets
The Company focused on introducing various products in
new / existing markets of Indonesia, Myanmar, Bangladesh,
Saudi Arabia and Tanzania.
Export Plans
The Company plans to export various vehicles in future
considering socio-political and macro economic conditions
worldwide.
Foreign Exchange Earnings and Outgoings (` in crores)
Earning in foreign currency 4,885.83
Expenditure in foreign currency
(including dividend remittance)
3,190.41
9 Development of CNG Turbo Technology for M& HCV Development in Progress
10 Touch Screen Infotainment System with text messaging and navigation capabilities Development in Progress
11 Fully automatic temperature control system for Vista Family Implemented
12 Stain Resistant Fabrics Under Implementation
13 A 2-way intake silencer and a surge tank for reduction of vehicle In-cab noise Under Implementation
Major Technology imports include:
Sr. No. Technology for Year of Import Status
1 Development of Fuel Cell Bus 2011-12 Development and testing in progress
2 Gas Injection technology for LCV, MCV and HCV engines 2009-10Completed for NA Engines and
Productionised
3 Engine Management for Series Hybrid Technology for Buses 2009-10 Under Development
4
Design and Development of infinitely variable transmission
based on full toriodal traction-drive variators for various
vehicle platforms.
2007-08 Under Development
5 Stop - Start feature for various vehicle Platforms 2009-10 Under Implementation
6ESP (Electronic Stability Program) for Xenon Euro V
Vehicles2012-13 Under Development
7 Average fuel economy Display for HCV and LCV platforms 2012-13 Under Development
On behalf of the Board of Directors
CYRUS P MISTRY
Chairman
Mumbai, May 29, 2013

66
68th ANNUAL REPORT 2012-13
BUSINESS OVERVIEW
The Indian economy continued its downward slide throughout
FY 2012-13, recording a lower GDP growth of 5% compared to
6.5% for FY 2011-12. The downward trend was also pronounced
on a quarterly basis, as it could be seen in the charts below.
Growth rate in GDP (% change over corresponding period
of the previous year)
FY 2011-12 FY 2012-13
Q1 7.5 5.4
Q2 6.5 5.2
Q3 6.0 4.7
Q4 5.1 4.8
6.2 5.0
Source: Ministry of Statistics and Programme implementation
After achieving growth rates of 8.6% in FY 2009-10 and 9.3% in
FY 2010-11, the inflationary pressures started mounting. The RBI
started tightening the monetary policy, resulting in lower growth
rate in the last two years. The moderation in growth is primarily
attributable to weakness in industry. The growth in agriculture has
also been weak in FY 2012-13, following lower than normal rainfall.
All the three major segments, agriculture and allied, industry and
services, have displayed softening trend, quarter over quarter
during the last two years.
As the pace of growth started slowing, the Government revenues
started shrinking, exposing the economy to a higher fiscal deficit.
The current account deficit also widened. Beginning FY 2011-12,
the corporate and infrastructure investment started slowing
mainly due to investment bottlenecks and tight monetary policy.
FY 2012-13 was marked by the challenge to the Government to
MANAGEMENT DISCUSSION AND ANALYSIS
contain the fiscal deficit, and the Government expenditure on
infrastructure and other key sectors suffered.
While there were monetary policy changes and limited Repo Rate
revisions downwards in an effort to stimulate growth, (100 bps drop
from the rate of April 2012), the RBI policy hinted limited headroom
for further reduction in the light of the inflationary pressures, which
dampened the prospects.
As a result, as compared to prior years, the domestic auto industry
has recorded insignificant growth on an overall basis. With the
continued high interest rates and inflation, households were
forced to spend more on essentials and discretionary spend
reduced, leading to deferring of purchase decisions. The consistent
stagnation of the industrial growth mainly in the areas of mining
and quarrying, manufacturing and infrastructure, adversely-
impacted the domestic auto industry. In March (2013), a month
which traditionally sees large volumes, car sales declined by 22.5%,
despite heavy discounts being offered.
On the global economy front, both US and Europe were struggling
with a stall in fundamental sectoral growth. The European economy
continued to move sluggishly mainly due to the sovereign debt
crisis. The pace of economic expansion in emerging countries has
slowed down. On the other hand, there was an eruption of political
crises in the Middle East and Africa, which continues even till today.
Unrelated political unrest also emerged in North Korea. The net
impact of all these global events was that growth took a backseat as
controlling unemployment, monitoring government expenditures
and maintaining political stability, became priorities for regional
governments. The world economy grew by 3.2% in 2012.
In terms of outlook for the year 2013, the advanced economies
are likely to grow by 1.2% as compared to 1.1% in the year 2012.
Slowdown is expected for developing and emerging economies,
with growth falling in China from 7.8% to 7.5% in 2012.
The automobile industry has shown progress in a steady manner,
especially in the US and emerging countries such as Asia. The
demand for products with advanced green technology has
remained strong throughout all the markets worldwide. However,
the automotive industry continues to face a very competitive
pricing environment, driven in part by industry excess capacity,
particularly in mature markets such as North America and Europe.
The Chinese economy has continued to grow strongly throughout
2012. GDP growth is likely to slow in future, although remain above
7.5%.

67
Management Discussion and
Analysis (66-97)
CORPORATE OVERVIEW FINANCIAL HIGHLIGHTS FINANCIAL STATEMENTSSTATUTORY REPORTS
Tata Motors Business:
Consequent to the macro economic factors as explained above, the Indian automobile industry posted growth of 1.1% in FY 2012-13,
as compared to 7.2% in the last fiscal. The commercial vehicles, grew by 1.7% (last year 19.2%) and passenger vehicles by 0.9% (last year
3.6%).
The industry performance in the domestic market during FY 2012-13 and the Company’s market share are given below:-
Category Industry Sales Company Sales Market Share
FY 2012-13 FY 2011-12 Growth FY 2012-13 FY 2011-12 Growth FY 2012-13 FY 2011-12
Commercial Vehicles 901,120 886,362 1.7% 536,232 530,204 1.1% 59.5% 59.8%
Passenger Vehicles 2,578,538 2,556,035 0.9% 229,325 333,044 -31.1% 8.9% 13.0%
Total 3,479,658 3,442,397 1.1% 765,557 863,248 -11.3% 22.0% 25.1%
Source: Society of Indian Automobile Manufacturers report and Company Analysis
Commercial vehicles Include V2 Van sales; Passenger vehicles include Fiat and Jaguar Land Rover branded cars
INDUSTRY STRUCTURE AND DEVELOPMENTS
Commercial Vehicles:
Within the overall Commercial Vehicles (CV) growth of modest 1.7%, the Medium and Heavy Commercial Vehicles (M&HCV) segment
recorded a negative growth of 23.3%, as compared to a growth of 6.5% in last fiscal. The ban on mining in Karnataka and Goa, coupled
with the slowdown in infrastructure spending, curtailed the growth significantly. In general, slowing industrial growth across many key
segments adversely impacted the demand. The Light Commercial Vehicles (LCV) segment, however, grew by 17.9%.
The Company registered a marginal growth of 1.1% to 536,232 units, reflecting falling demand in M&HCV, and growth in volumes in
LCVs.
The domestic industry performance during FY 2012-13 and the Company’s market share are given below:-
The Company’s commercial vehicle sales in the domestic and
international markets at 580,341 units, were 0.8% lower than the
previous year.
The thrust this year was increasing penetration in LCV segments
while retaining market share in the heavy segment, as competition
actions increased in a shrinking market.
This was possible through targeted / structured financing activities
coupled with key product actions to address niches in the market.
Another key area has been to focus on solution offerings over and
above the product, such as Annual Maintenance contracts, 24x7 service
Category Industry Sales Company Sales Market Share
FY 2012-13 FY 2011-12 Growth FY 2012-13 FY 2011-12 Growth FY 2012-13 FY 2011-12
M&HCV 268,055 349,288 -23.3% 142,764 207,086 -31.1% 53.3% 59.3%
LCVs 633,065 537,074 17.9% 393,468 323,118 21.8% 62.2% 60.2%
Total 901,120 886,362 1.7% 536,232 530,204 1.1% 59.5% 59.8%
Source: Society of Indian Automobile Manufacturers report and Company Analysis
LCVs includes V2 Van sales
support, Tata Alert assistance and telematics solutions. These initiatives
were aimed at enhancing life cycle value to the customers.
During the year, the Company introduced a Telematics and
Fleet Management Service, branded ‘Tata FleetMan’. Targeted at
commercial vehicle fleet owners and large consignors of goods,
the service offers advanced telematics solutions, which will result in
improved fleet utilization and logistics, and reduce track downtimes.
The Tata FleetMan Telematics and Fleet management service
has been designed to address pressing needs of the transport
industry.

68
68th ANNUAL REPORT 2012-13
Through advanced telematics solutions like fuel management, driver management, remote diagnostics, real time fleet tracking, SMS
Alerts, Geo-fencing and trip management, Tata FleetMan combines state-of-the-art IT and Telecom equipment and software, and offers
one of the most advanced telematics solutions in the country.
The Company continued to make progress in the high growth pick up market. New product offerings addressing gaps in the portfolio
combined with finance schemes, facilitated increased penetration in the pick up segment.
While the Company has further consolidated its position and enhanced the market share in LCVs, it has lost market share in the M&HCV
segment due to competitive pricing pressures. With the launch of high performance products and variants in this segment, and value-
add services to the customers, demonstrating the quality and reliability of its products and services and focussed marketing efforts, the
Company is confident of maintaining and enhancing its premium brand positions and grow the market share.
Passenger Vehicles:
During FY 2012-13, the domestic passenger vehicle industry continued its downward momentum, recording a lower growth of less
than 1% as compared to 3.6% for the last year. The demand was mainly affected by high interest rates, hike in fuel prices and reduction
in discretionary spends.
One of the notable features during the year has been shift in demand for Utility Vehicles (UV), which recorded 21.8% contribution of the
total industry, representing an all-time high in India, and registered a healthy growth of 51.5%, with every other segment registering a
significant decline. The demand was also driven by a host of new launches in this segment, creating a customer class for car-like, soft
roader UV’s and emphasizing traditional rugged SUV offerings.
The domestic industry performance and the Company’s performance in the passenger vehicle segment are given below:-
Category Industry Sales Company Sales Market Share
FY 2012-13 FY 2011-12 Growth FY 2012-13 FY 2011-12 Growth FY 2012-13 FY 2011-12
Micro 53,847 74,521 -27.7% 53,847 74,521 -27.7% 100.0% 100.0%
Compact 794,627 856,381 -7.2% 117,377 176,104 -33.3% 14.8% 20.6%
Mid-size 200,007 204,733 -2.3% 7,410 19,645 -62.3% 3.7% 9.6%
Executive 23,256 37,275 -37.6% 1,061 4,796 -77.9% 4.6% 12.9%
Premium and Luxury 5,183 7,414 -30.1% 825 985 -16.2% 15.9% 13.3%
Utility Vehicles 560,992 370,286 51.5% 45,841 49,035 -6.5% 8.2% 13.2%
Vans (Note a) 123,152 152,019 -19.0% 2,964 7,958 -62.8% 2.4% 5.2%
Total (Note b) 2,578,538 2,556,035 0.9% 229,325 333,044 -31.1% 8.9% 13.0%
Source: Society of Indian Automobile Manufacturers report and Company Analysis
Note (a) Excludes V2 Van sales
Note (b) Total Industry nos. include sales in other segments
The negative growth in the industry in segments the Company
operates in, and lack of an appropriate soft roader offering in the
growth segment, contributed significantly to the less than market
performance of the Company.
During the year, the Company recorded sales of 229,325 vehicles
(including Jaguar Land Rover) in the domestic market; a decline
of 31.1% over last year. The overall market share was lower at 8.9%
as compared to 13.0% during the last fiscal year.
The Company introduced a host of new products in the year. The
new Safari Storme, the Manza Club class and the Vista D90, drove
volumes in their respective segments. The new launches focused
on enhancing the Brand positioning, while making it relevant for
the younger buyer.
The Company also worked on improving the décor and ambience
of its showrooms to make them world class. This effort has been
completed at pilot dealerships and workshops in Mumbai and
Delhi, with encouraging results, and the initiative will now be
carried forward to other setups across the country.
Nano registered volumes of 53,847 units for the year. With a
focus on moving brand Nano to make it further appealing to the
youth, a series of activities such as ‘Art in Motion’, ‘Campus Brand
Ambassador’ etc., were launched with encouraging results. The
69
Management Discussion and
Analysis (66-97)
CORPORATE OVERVIEW FINANCIAL HIGHLIGHTS FINANCIAL STATEMENTSSTATUTORY REPORTS
Company continues its drive to identify newer markets for the Nano.
Currently it is sold in Nepal and Sri Lanka and is also evaluating
other markets in South Asia.
The Company’s sales in the mid-size segment suffered as
competitive activity intensified with multiple new launches from
competition in this segment.
Although, the UV market recorded a healthy growth of 51.5%
during the year with industry sales of 560,992 units, the Company
has registered decline of 6.5% in this segment. The decline is mainly
attributable to absence of a product in the fast growing soft roader
UV segment. The Safari Storme was launched in October 2012, at
an aggressive price and has received a positive response from the
market with 6,050 units sold in FY 2012-13. This segment with its
tremendous growth potential, will continue to be a focus area.
The Company sold 2,494 Jaguar and Land Rover vehicles through
its exclusive dealerships in India, registering an impressive growth
of 9.7%. The Company launched the globally popular Range
Rover Sport and Jaguar XF 3.0 litre D during the year. The activity
of assembling JLR vehicles at Pune continues to grow and is part
of the Company’s plan for sharing knowledge and best practices
between Tata Motors and JLR. The Jaguar XF was the latest model
to be rolled out from the Pune assembly plant and will be followed
soon by other variants as well.
Tata Motors Sales, Distribution and Support : The sales and
distribution network in India as of March 31, 2013, comprises 2,609
sales contact points for the Passenger and Commercial Vehicle
businesses. The Company has deployed a Customer Relations
Management (CRM) system at all our dealerships and offices across
the country. The system is certified by Oracle as the largest Siebel
deployment in the automotive market. The combined online CRM
system supports users both within the Company and among the
distributors in India and abroad.
The Company’s 100% subsidiary, TML Distribution Company Ltd
(TDCL), acts as a dedicated distribution and logistics management
company to support the sales and distribution operations of
vehicles in India. TDCL provides distribution and logistics support
for vehicles manufactured at the Company’s facilities. TDCL helps us
improve planning, inventory management, transport management
and timely delivery.
The Company provides financing support through its wholly-
owned subsidiary, Tata Motors Finance Ltd (TMFL). (Refer discussion
on TMFL).
In addition to dealer service workshops, the Company uses a
network of service centers on highways and a toll-free customer
assistance center to provide 24-hour on-road maintenance
(including replacement of parts) to vehicle owners. The Company
believes that the reach of the sales, service and maintenance
network, provides us with a significant advantage over the
competitors.
Tata Motors Competition: The Company faces competition from
various domestic and foreign automotive manufacturers in the
Indian automotive market. Improving infrastructure and robust
growth prospects compared to other mature markets, given the
comparative low penetration of vehicles per thousand population,
are now attracting a number of automotive OEM’s to India. These
companies have either formed joint-ventures with local partners
or have established independently-owned operations in India.
The global competitors bring international experience, global
scale, advanced technology and significant financial support, for
the operations in India. The competition continues to intensify
every year.
The Company has designed its products to suit the requirements
of the Indian market based on specific customer needs such as
safety, driving comfort, fuel efficiency and durability. The Company
believes that its vehicles are suited to the general conditions of
Indian roads, driving habits and the local climate. The Company
also offers a wide range of optional configurations to meet the
specific needs of its customers. The Company is developing
products to strengthen its product portfolio in order to meet
customer expectations.
Tata Motors Exports: The Company continues to focus on its
export operations. The Company markets its commercial and
passenger vehicles in several countries in Europe, Africa, the Middle
East, South East Asia and South Asia. However, the Company’s
export of vehicles manufactured in India decreased by 19.3% in FY
2012-13 to 50,938 units from 63,105 units in FY 2011-12. Commercial
vehicles exports sales declined by19.9% to 44,109 units, impacted
by the economic and general environment in Europe, the Middle
East, and South Asia. The Passenger vehicle sales declined by 19.2%
to 6,829 units.
For FY 2012-13, the Company’s top five export destinations
accounted for approximately 51% and 92% of the exports of
commercial vehicles and passenger vehicle units, respectively. The
Company continues to strengthen its position in the geographic
areas it is currently operating in and exploring possibilities of
entering new markets with similar market characteristics to the
Indian market.
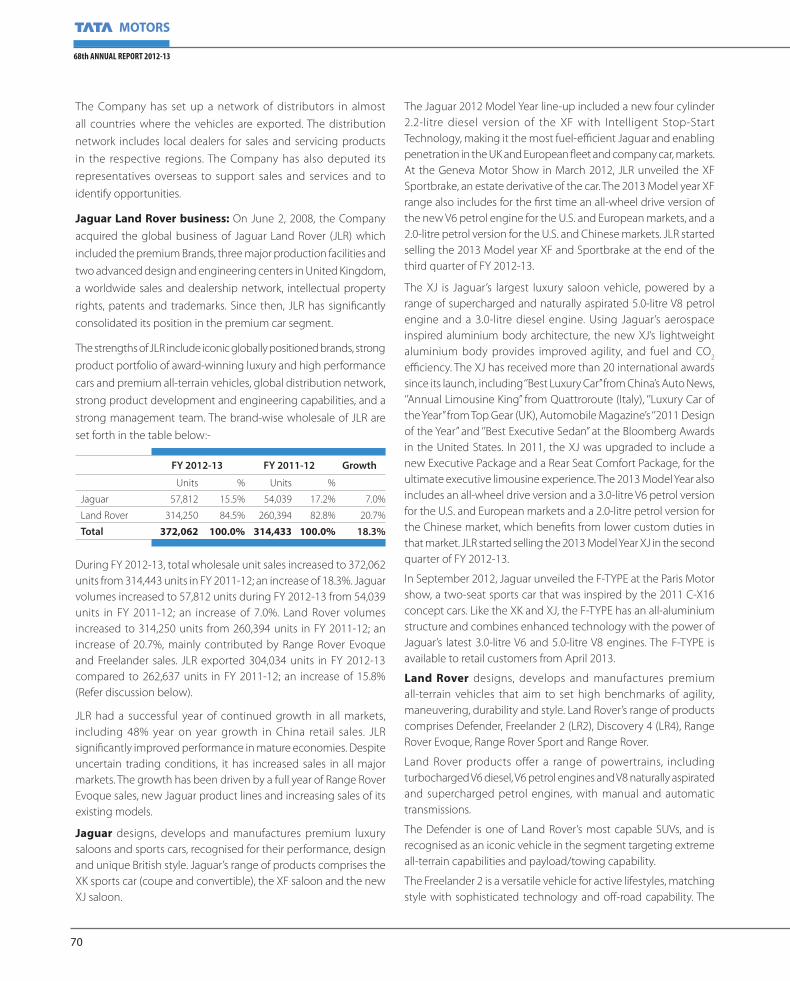
70
68th ANNUAL REPORT 2012-13
The Company has set up a network of distributors in almost
all countries where the vehicles are exported. The distribution
network includes local dealers for sales and servicing products
in the respective regions. The Company has also deputed its
representatives overseas to support sales and services and to
identify opportunities.
Jaguar Land Rover business: On June 2, 2008, the Company
acquired the global business of Jaguar Land Rover (JLR) which
included the premium Brands, three major production facilities and
two advanced design and engineering centers in United Kingdom,
a worldwide sales and dealership network, intellectual property
rights, patents and trademarks. Since then, JLR has significantly
consolidated its position in the premium car segment.
The strengths of JLR include iconic globally positioned brands, strong
product portfolio of award-winning luxury and high performance
cars and premium all-terrain vehicles, global distribution network,
strong product development and engineering capabilities, and a
strong management team. The brand-wise wholesale of JLR are
set forth in the table below:-
FY 2012-13 FY 2011-12 Growth
Units % Units %
Jaguar 57,812 15.5% 54,039 17.2% 7.0%
Land Rover 314,250 84.5% 260,394 82.8% 20.7%
Total 372,062 100.0% 314,433 100.0% 18.3%
During FY 2012-13, total wholesale unit sales increased to 372,062
units from 314,443 units in FY 2011-12; an increase of 18.3%. Jaguar
volumes increased to 57,812 units during FY 2012-13 from 54,039
units in FY 2011-12; an increase of 7.0%. Land Rover volumes
increased to 314,250 units from 260,394 units in FY 2011-12; an
increase of 20.7%, mainly contributed by Range Rover Evoque
and Freelander sales. JLR exported 304,034 units in FY 2012-13
compared to 262,637 units in FY 2011-12; an increase of 15.8%
(Refer discussion below).
JLR had a successful year of continued growth in all markets,
including 48% year on year growth in China retail sales. JLR
significantly improved performance in mature economies. Despite
uncertain trading conditions, it has increased sales in all major
markets. The growth has been driven by a full year of Range Rover
Evoque sales, new Jaguar product lines and increasing sales of its
existing models.
Jaguar designs, develops and manufactures premium luxury
saloons and sports cars, recognised for their performance, design
and unique British style. Jaguar’s range of products comprises the
XK sports car (coupe and convertible), the XF saloon and the new
XJ saloon.
The Jaguar 2012 Model Year line-up included a new four cylinder
2.2-litre diesel version of the XF with Intelligent Stop-Start
Technology, making it the most fuel-efficient Jaguar and enabling
penetration in the UK and European fleet and company car, markets.
At the Geneva Motor Show in March 2012, JLR unveiled the XF
Sportbrake, an estate derivative of the car. The 2013 Model year XF
range also includes for the first time an all-wheel drive version of
the new V6 petrol engine for the U.S. and European markets, and a
2.0-litre petrol version for the U.S. and Chinese markets. JLR started
selling the 2013 Model year XF and Sportbrake at the end of the
third quarter of FY 2012-13.
The XJ is Jaguar’s largest luxury saloon vehicle, powered by a
range of supercharged and naturally aspirated 5.0-litre V8 petrol
engine and a 3.0-litre diesel engine. Using Jaguar’s aerospace
inspired aluminium body architecture, the new XJ’s lightweight
aluminium body provides improved agility, and fuel and CO2
efficiency. The XJ has received more than 20 international awards
since its launch, including ‘’Best Luxury Car’’ from China’s Auto News,
‘’Annual Limousine King’’ from Quattroroute (Italy), ‘’Luxury Car of
the Year’’ from Top Gear (UK), Automobile Magazine’s ‘’2011 Design
of the Year’’ and ‘’Best Executive Sedan’’ at the Bloomberg Awards
in the United States. In 2011, the XJ was upgraded to include a
new Executive Package and a Rear Seat Comfort Package, for the
ultimate executive limousine experience. The 2013 Model Year also
includes an all-wheel drive version and a 3.0-litre V6 petrol version
for the U.S. and European markets and a 2.0-litre petrol version for
the Chinese market, which benefits from lower custom duties in
that market. JLR started selling the 2013 Model Year XJ in the second
quarter of FY 2012-13.
In September 2012, Jaguar unveiled the F-TYPE at the Paris Motor
show, a two-seat sports car that was inspired by the 2011 C-X16
concept cars. Like the XK and XJ, the F-TYPE has an all-aluminium
structure and combines enhanced technology with the power of
Jaguar’s latest 3.0-litre V6 and 5.0-litre V8 engines. The F-TYPE is
available to retail customers from April 2013.
Land Rover designs, develops and manufactures premium
all-terrain vehicles that aim to set high benchmarks of agility,
maneuvering, durability and style. Land Rover’s range of products
comprises Defender, Freelander 2 (LR2), Discovery 4 (LR4), Range
Rover Evoque, Range Rover Sport and Range Rover.
Land Rover products offer a range of powertrains, including
turbocharged V6 diesel, V6 petrol engines and V8 naturally aspirated
and supercharged petrol engines, with manual and automatic
transmissions.
The Defender is one of Land Rover’s most capable SUVs, and is
recognised as an iconic vehicle in the segment targeting extreme
all-terrain capabilities and payload/towing capability.
The Freelander 2 is a versatile vehicle for active lifestyles, matching
style with sophisticated technology and off-road capability. The

71
Management Discussion and
Analysis (66-97)
CORPORATE OVERVIEW FINANCIAL HIGHLIGHTS FINANCIAL STATEMENTSSTATUTORY REPORTS
Freelander 2, offering was significantly enhanced for the 2013
Model Year with the introduction of a turbocharged 2.0-litre petrol
engine, giving superior performance as compared to the 3.2-litre
engine it replaces, while also reducing CO2 emissions.
The Discovery 4 is a mid-size SUV that features genuine all-terrain
capability and versatility, including full seven-seat capacity. Recent
power train innovations for the 2012 Model Year have delivered an
improvement in CO2 for the 3.0-litre LR-TDV6 engine. The Discovery
has won more than 200 awards since its introduction in 1989.
The Range Rover Evoque is the smallest, lightest and most fuel-
efficient Range Rover to date. The Evoque is available in 5-door and
coupe body styles and in both front-wheel drive and all-wheel drive
derivatives. Since its launch in September 2011, consumer interest
and demand have been consistent across the globe. In its first full
year of sales, JLR sold 103,269 total retail units of the Range Rover
Evoque. The Evoque has also won over 120 international awards
since its launch, reflecting its blend of design and capability.
The Range Rover Sport combines the performance of a sports
tourer with the versatility of a Land Rover. The 2012 Model Year
Range Rover Sport introduced a new version of the TDV6 diesel
engine with an eight-speed transmission to reduce CO2 emissions.
At the 2013 New York International Auto Show, Land Rover debuted
the All New 2014 MY Range Rover Sport built on a weight saving
aluminium architecture. The Sport’s all-new, aluminium architecture
achieves a weight saving of up to 420kg (on a comparable basis) for
agility and exceptional performance, with 15% CO2 reduction and
24% improved fuel economy. The All New Range Rover Sport is the
fastest, most agile and most responsive Land Rover ever.
The Range Rover is the flagship product under the Land Rover
brand with a unique blend of British luxury, classic design, high-
quality interiors and outstanding all-terrain ability. The new all-
aluminium version was launched in the third quarter of FY 2012-13,
the world’s first SUV with a lightweight all-aluminium body, the
new Range Rover has enhanced performance and handling on all
terrains, and significant advances in environmental sustainability.
The all-aluminium body shell has helped reduce the weight of the
car substantially. A diesel hybrid Range Rover is currently being
developed for introduction later in 2013. The new Range Rover was
declared the world’s top SUV by The Sunday Times, won Top Gear
magazine’s ‘’Luxury Car of the Year’’ and was recently awarded the
maximum 5-star safety rating by Euro NCAP.
Jaguar Land Rover’s performance in key geographical
markets on retail basis
United States: The US economy has recovered more favourably
than other mature economies since the economic downturn.
United States premium car segment volumes increased by 11%
compared to FY 2011-12, whilst premium SUV segment volumes
were up 3%. United States retail volumes for FY 2012-13 for the
combined brands were 62,959 units. Jaguar retail volumes for FY
2012-13 fell by 6% compared to FY 2011-12, leading to a decrease
in market share. Land Rover retail volumes for FY 2012-13 increased
by 13% compared to FY 2011-12, and market share increased
slightly.
United Kingdom: In FY 2012-13, the UK economy has been broadly
flat. In the UK, the premium car segment fell by 2% compared to
FY 2011-12, whilst SUV segment decreased by 16% in FY 2012-13
compared to FY 2011-12. UK retail volumes for FY 2012-13 for the
combined brands were 72,270 units. Jaguar retail volumes for FY
2012-13 increased by 10% compared to FY 2011-12, increasing
market share. Land Rover retail volumes for FY 2012-13, increased
by 24% compared to FY 2011-12, increasing market share.
Europe (excluding Russia): The European economy continues to
struggle, with austerity measures in place in a number of countries.
The economic situation continues to create uncertainty around
European zone stability, the Euro and financial market liquidity.
With financing support for customers continuing to be difficult, the
outlook remains volatile. The German premium car segment volume
increased by 5% and the premium SUV segment volume fell by 9%
compared to FY 2011-12. European retail volumes for FY 2012-13
for the combined Jaguar Land Rover brands were 80,994 units,
representing a 18% increase compared to FY 2011-12. Jaguar retail
volume for FY 2012-13 grew by 5%, and Land Rover retail volume
for FY 2012-13 increased by 21% compared to FY 2011-12.
China: The Chinese economy continued to grow strongly
throughout FY 2012-13. GDP growth is likely to slowdown in future,
although expected to remain above 7.5%.
The China premium car segment volumes (for imports) increased
by 12% in FY 2012-13, compared to FY 2011-12, whereas SUV
segment volumes (for imports) increased by 8% in FY 2012-13 as
compared to FY 2011-12. The China retail volumes for FY 2012-13
for the combined brands were 77,075 units. Jaguar retail volume for
FY 2012-13, increased by 28% compared to FY 2011-12 and Land
Rover retail volume for FY 2012-13, increased by 51% compared to
FY 2011-12; both brands improving market share.
The Joint Venture to manufacture cars in China with Chery
Automobile Co., Ltd (Chery), a Chinese auto manufacturer, is
approved and GBP70 million was invested in FY 2012-13. JLR
and Chery will now accelerate plans to build a joint venture
manufacturing plant in Changshu, near Shanghai, as part of a
10.9 billion RMB (equivalent ` 9,540 crores) investment, which will
also include a new research and development centre and engine
production facility. The project envisages manufacturing of certain
JLR vehicles, and also includes the creation of a new JV brand,
specifically for the Chinese market, including the marketing and
distribution. The two companies plan to complete the Changshu
facility in Jiangsu province during FY 2013-14.

72
68th ANNUAL REPORT 2012-13
Asia Pacific: The Asia Pacific region main markets are Japan,
Australia and New Zealand. These regions were less affected by
the economic crisis when compared to western economies and
are recovering faster, due to increased trade with China and other
growth economies. The Asia Pacific retail volumes for FY 2012-13
for the combined brands were 17,849 units. Jaguar retail volume
for FY 2012-13 increased by 27% compared to FY 2011-12. Land
Rover retail volume for FY 2012-13 increased by 34% compared
to FY 2011-12.
Other markets: The major constituents in other markets are
Russia, South Africa and Brazil, alongside the rest of Africa and
South America. These economies were not as badly affected by
the economic crisis as the western economies and have continued
growth in the last few years, partially on the back of increased
commodity and oil prices. The retail volumes for FY 2012-13 for
the combined brands were 63,489 units, up by 19%. Jaguar retail
volume for FY 2012-13 was 6,402, up 17%, whilst Land Rover retail
volume was 57,087, an increase of 19%.
Jaguar Land Rover’s Sales & Distribution: JLR markets products
in 178 countries, through a global network of 17 national sales
companies (‘‘NSCs’’), 85 importers, 62 export partners and 2,485
franchise sales dealers, of which 689 are dealers for both Jaguar
and Land Rover. JLR has established robust business processes and
systems to ensure that its production plans meet anticipated retail
sales demand and to enable the active management of its inventory
of finished vehicles and dealer inventory throughout its network.
JLR has entered into arrangements with independent partners to
provide financing to its customers, including FGA Capital, a joint
venture between Fiat Auto and Credit Agricole, Chase Auto Finance
for its key markets, and local finance providers in a number of other
markets. JLR’s financing partners offer its customers a full range of
consumer financing options.
Jaguar Land Rover’s Competition: JLR operates in a globally
competitive environment and faces competition from established
premium and other vehicle manufacturers, who aspire to move
into the premium performance car and premium SUV markets.
Jaguar vehicles compete primarily with other European brands
such as Audi, BMW and Mercedes Benz. Land Rover and Range
Rover vehicles compete mainly with SUVs manufactured by Audi,
BMW, Infiniti, Lexus, Mercedes Benz, Porsche and Volkswagen. The
Land Rover Defender competes with vehicles manufactured by
Isuzu, Nissan and Toyota.
Tata Daewoo Commercial Vehicles (TDCV): FY 2012-13 was a
very challenging but at the same time encouraging year for TDCV.
On one hand, domestic volumes decreased by 17.6% as a result
of slowdown in the Korean economy, on the other hand Export
volumes (including Knocked Down (KD)) grew by 57.8%, with
higher demand from oil driven economies like Algeria, Russia, etc.
TDCV’s total sales volume increased by 6% in FY 2012-13, compared
to FY 2011-12.
TDCV sold 2,383 units of Heavy Commercial Vehicles (HCV) in FY
2012-13, as compared to 2,549 units in the previous financial year.
The Company’s volume for Medium Duty Trucks was 3,017 units
in FY 2012-13, as compared to 4,003 units in FY 2011-12. The sales
declined mainly due to slowdown in the Korean economy. TDCV
exported 4,700 units in FY 2012-13, which is highest ever in its
history and registered a growth of 57.8%, as compared to 2,979
units sold in the previous year. Its sales increased significantly in
some of its traditional export markets like Algeria, Russia, Laos,
South Africa, Vietnam, etc., coupled with entry into some new
markets like Indonesia, Ecuador, Ghana, etc., with a view to diversify
its market.
Tata Motors Finance Ltd (TMFL): Despite strained market
conditions due to contraction of vehicle volumes, TMFL was able
to grow its new vehicles disbursements by 6% from ̀ 10,505 crores
to `11,180 crores. TMFL financed a total of 2,51,936 new vehicles
reflecting a growth of 9% over the 2,30,588 vehicles financed in the
previous year. Disbursals for commercial vehicles were at `8,816
crores (1,81,374 units) as compared to ̀ 7,204 crores (1,20,032 units)
of the previous year. Disbursements of passenger vehicles declined
by 28% to ̀ 2,364 crores (70,562 units) from a level of ̀ 3,301 crores
(1,10,556 units).
During FY 2012-13, approximately 33% of Tata vehicle unit
sales in India were made by the dealers through financing
arrangements provided by TMFL. The total vehicle finance
receivables (consolidated) outstanding as at March 31, 2013
and 2012, amounted to `18,226.78 crores and `15,747.67 crores,
respectively
In the current environment of sluggish growth and consequent
lower demand of medium/ heavy trucks and passenger vehicles,
TMFL has been able to show overall stability in its operations
and has increased its disbursements as well as market share by
over 6%. A highly motivated employee workforce, significantly
greater customer orientation, increased branch network and
field infrastructure, ensures that TMFL is poised for significant and
sustainable growth.
TMFL’s new initiative of Channel Finance to dealers and fee based
Insurance support business, will significantly help improve the
Company’s profitability in the coming period. It has also stepped
up significantly its “Office of the Customer initiative” as well as its
branch network and infrastructure.

73
Management Discussion and
Analysis (66-97)
CORPORATE OVERVIEW FINANCIAL HIGHLIGHTS FINANCIAL STATEMENTSSTATUTORY REPORTS
Tata Technologies Ltd (TTL): TTL is a key strategic partner in
several of the information technology initiatives for the Tata Motors
Group. The broad scope of TTL activities are as follows:
1. Engineering Automation Group [EAG]: EAG addresses the
engineering and design needs of manufacturers through
services for all stages of the product development and
manufacturing process.
2. Enterprise Solutions Group [ESG]: ESG addresses the
Information Technology needs of manufacturers including
business solutions, strategic consulting, ERP implementation,
systems integration, IT networking and infrastructure solutions
and program management.
3. Product Lifecycle Management [PLM]: PLM addresses the
product development technology solution requirements
of manufacturers including end-to-end implementation of
PLM technology, best practices and PLM consulting. PLM
also includes the TTL’s proprietary applications iGETIT® and
iCHECKIT®.
The consolidated revenue for FY 2012-13 of TTL was `2,045.42
crores, an increase of 22.8% as compared to ̀ 1,665.95 crores in the
previous year. The Services/Products business mix was a 76:24 split
as compared to 73:27 mix for FY 2011-12. The Americas revenue
was `608.95 crores with Asia Pacific recording `867.00 crores and
Europe generating `820.45 crores.
FINANCIAL PERFORMANCE ON A CONSOLIDATED BASIS
The financial information discussed in this section is derived from
the Company’s Audited Consolidated Financial Statements.
Tata Motors Group primarily operates in the automotive segment.
The acquisition of JLR enabled the Company to enter the premium
car market. The Company continues to focus on profitable growth
opportunities in global automotive business, through new products
and market expansion. The Company and JLR, continue to focus on
integration, and synergy through sharing of resources, platforms,
facilities for product development and manufacturing, sourcing
strategy, mutual sharing of best practices.
The business segments are (i) automotive operations and (ii) all
other operations. The automotive operations include all activities
relating to development, design, manufacture, assembly and sale
of vehicles including financing thereof, as well as sale of related
parts and accessories. The Company provides financing for vehicles
sold by the dealers in India. The vehicle financing is intended
to drive sale of vehicles by providing financing to the dealers’
customers and as such, is an integral part of automotive business.
Automotive operations segment accounted for 98.81% and 98.83%
of total revenues in FY 2012-13 and FY 2011-12, respectively. For FY
2012-13, revenue from automotive operations before inter-segment
eliminations was ̀ 187,648.85 crores compared to ̀ 164,604.28 crores
for FY 2011-12.
The automotive operations segment is further divided into Tata
Motors and other brand vehicles (including spares and vehicle
financing) and Jaguar Land Rover. (A reference may be made to
review of performance of TML and Jaguar Land Rover business as
discussed above). For FY 2012-13, Jaguar Land Rover contributed
72.9% (63.6% for FY 2011-12) of the total automotive revenue
(before intra segment elimination) and the remaining 27.1% (36.4%
for FY2011-12) was contributed by Tata and other brand vehicles.
Revenue and segment results for automotive operations is given
below :
FY 2012-13 FY 2011-12
(` in crores)
Total Revenues
Tata vehicles / spares and
financing thereof 50,919.99 59,921.24
Jaguar and Land Rover 136,822.17 104,750.93
Intra-segment eliminations (93.31) (67.89)
Total 187,648.85 164,604.28
Segment results before other income, finance cost, tax and
exceptional items
Tata vehicles / spares and
financing thereof 1,736.89 4,152.00
Jaguar and Land Rover 14,975.61 12,359.45
Intra-segment eliminations - -
Total 16,712.50 16,511.45
The other operations business segment includes information
technology, machine tools and factory automation solutions, and
investment business. For FY 2012-13, revenue from other operations
before inter-segment eliminations was `2,265.92 crores compared
to `1,948.58 crores for FY 2011-12. Segment results before other
income, finance cost, tax and exceptional items (before inter-
segment eliminations) was ̀ 375.68 crores as compared to ̀ 294.88
crores for FY 2011-12.
The revenue from operations net of excise duty on a consolidated
basis, has grown by14.0% in FY 2012-13 to `188,817.63 crores. The
increase is mainly attributable to growth in automotive revenue

74
68th ANNUAL REPORT 2012-13
mainly at Jaguar Land Rover business. The analysis of performance
on consolidated basis is given below:-
Percentage to Revenue from operations
FY 2012-13 FY 2011-12
Revenue from operations net of excise
duty 100 100
Expenditure:
Cost of material consumed (including
change in stock)
63.7 66.1
Employee Cost 8.8 7.4
Manufacturing and other expenses (net) 18.8 17.2
Amount Capitalised (5.4) (5.0)
Total Expenditure 85.9 85.7
Other Income 0.4 0.4
Profit before Exceptional Items,
Depreciation, Interest and Tax 14.5 14.7
Depreciation and Amortisation
(including product development /
engineering expenses written off )
5.1 4.2
Finance costs 1.9 1.8
Exceptional Item – Loss 0.3 0.5
Profit before Tax 7.2 8.2
Cost of materials consumed (including change in stock)
FY 2012-13 FY 2011-12
( ` in crores)
Consumption of raw materials and
components 111,600.44 100,797.44
Purchase of product for sale 11,752.07 11,205.86
Change in finished goods and
Work-in-progress (3,031.43) (2,535.72)
Total 120,321.08 109,467.58
Cost of material consumed decreased from 66.9% to 64.7% of total
revenue (excluding income from vehicle financing). At TML RM cost
was 73.6% of net revenue as compared to 73.1%, representing a
marginal increase of 50 basis points, mainly attributable to product
mix (reduction in M&HCV sales). For JLR the RM cost was 62.8%
of revenue (FY 2011-12 64.5%), representing a reduction of 169
basis points. The reduction is mainly attributable to product mix,
cost reduction programmes and reduction in input price of major
metals consumed. On a consolidated basis, JLR operations have
significantly contributed to reduction in material cost in terms of
% to revenue.
Employee Cost was ̀ 16,584.05 crores in FY 2012-13 as compared
to `12,298.45 crores in FY 2011-12; an increase of `4,285.60
crores. Of the increase `1,055.87 crores (approximately) relates to
translation impact of JLR from UK Pounds to Indian Rupee. At JLR
the increase in employee cost is attributable to increases in the
permanent and contractual head count to support the volume
increases/new launches and product development projects. At TML
the employee cost increased to `2,837.00 crores from `2,691.45
crores in FY 2011-12, which mainly related to normal yearly revisions
and wage settlements, at certain locations. Due to lower volumes
at TML, salary cost as a % to revenue is higher at 6.3% as compared
to 5.0% in FY 2011-12.
Manufacturing and Other Expenses include all works operation,
indirect manufacturing expenses, freight cost, fixed marketing costs
and other administrative costs. These expenses have increased to
`35,535.58 crores from ̀ 28,453.97 crores in FY 2011-12. As explained
above, each line item includes the element of translation impact
of JLR (approximately `2,363 crores).
The breakup is given below-
FY 2012-13 FY 2011-12
( ` in crores)
Processing charges 1,450.56 1,539.14
Stores, spare parts and tools consumed 1,393.89 1,217.24
Freight, transportation,
port charges, etc. 4,798.01 3,734.55
Repairs to buildings 120.25 101.51
Repairs to plant, machinery, etc. 195.10 175.42
Power and fuel 1,069.06 1,017.19
Rent 161.28 128.84
Rates and taxes 202.61 259.15
Insurance 225.30 227.18
Publicity 6,607.14 5,398.40
Works operation and other expenses 19,196.88 14,538.55
Excise Duty on change in
Stock-in-trade 115.50 116.80
Manufacturing and Other
Expenses 35,535.58 28,453.97
The increases are mainly driven by volumes, size of operations and
also include inflation impact. These increased from 17.2% to 18.8%
in the current year, in terms of % to revenue.
i. Processing charges were mainly incurred by TML, where
mainly due to volume contraction, the expenditure was
lower.
ii. Freight, transportation, port charges etc. have increased,
mainly at JLR, in view of increase in volumes in the overseas
markets.
75
Management Discussion and
Analysis (66-97)
CORPORATE OVERVIEW FINANCIAL HIGHLIGHTS FINANCIAL STATEMENTSSTATUTORY REPORTS
iii. The publicity expenses increase, mainly related to new
product launches and ongoing product / brand campaigns.
iv. The works operation and other expenses have increased
to 10.2% from 8.8% of net revenue. While a part of revenue
relates to volumes, the major increases were in IT costs and
exchange loss on trading activities at JLR.
Amount capitalised represents expenditure transferred to
capital and other accounts allocated out of employee cost and
other expenses, incurred in connection with product development
projects and other capital items. The expenditure transferred to
capital and other accounts has increased to `10,191.97 crores
from ̀ 8,265.98 crores of FY 2011-12, mainly on account of various
product development projects undertaken by the Company and
JLR, for introduction of new products, development of engine
and products variants.
Other Income increased to `811.53 crores from `661.77 crores in
FY 2012-13 and mainly includes interest income of `693.90 crores
(FY 2011-12 ̀ 487.64 crores). The increase is fully attributable to JLR,
which relates to surplus cash invested on short-term basis.
Profit before Interest, Depreciation, Exceptional Items and
Tax has increased from ̀ 24,362.24 crores in FY 2011-12 to ̀ 27,380.42
crores in FY 2012-13, and represented 14.5% of revenue.
Depreciation and Amortization (including product
development / engineering expenses written off): During FY
2012-13, expenditure increased to ̀ 9,590.89 crores from ̀ 7,014.61
crores in FY 2011-12. The increase in depreciation of ̀ 629.04 crores
is on account of plant and equipment (mainly towards capacity
and new products) installed in last year, the full effect of which
is reflected in the current year. The amortization expenses have
gone up from `2,276.24 crores in FY 2012-13 to `3,591.12 crores
in FY 2011-12, attributable to new product introduced during the
last year. The expenditure on product development / engineering
cost written off has increased by `632.36 crores. As explained
above, there was an element of increase representing translation
impact.
Finance Cost increased by 19.2% to `3,553.34 crores from
`2,982.22 crores in FY 2011-12. The increase mainly represented
borrowings for the short term and long term needs of the Group
and in particular increased vehicle financing activity by TMFL.
In FY 2012-13, the Company issued rated, listed, unsecured
non-convertible debentures of ̀ 2,100 crores with maturities of 2-7
years to raise long term resources and optimize the loan maturity
profile. JLR issued US$ 500 million Senior Notes due 2023 at a
coupon of 5.625% per annum. The notes are callable at a premium
for the present value of future interest rates, if called before a
specified date and thereafter are callable at fixed premiums. Further,
TMFL raised ̀ 100 crores by issue of Subordinated Unsecured Non-
convertible Perpetual debentures towards Tier I Capital to meet
its growth strategy and improve its capital adequacy ratio and
`90.40 crores by issue of Subordinated Unsecured, Non-convertible
debentures towards Tier 2 Capital.
Exceptional Items
FY 2012-13 FY 2011-12 Change
(` in crores)
Exchange loss (net)
including on revaluation
of foreign currency
borrowings, deposits
and loans 515.09
654.11
(139.02)
Impairment of intangibles
and other costs
87.62
177.43
(89.81)
Total 602.71 831.54 (228.83)
i. The exchange loss (net) relates foreign currency borrowings,
deposits and loans and derivatives. Foreign exchange loss
(net) represents impact on account of revaluation of foreign
currency borrowings, deposits and loans, and amortisation of
loss / gain, on such foreign currency monetary items which
was deferred in last year.
ii. Impairment of intangibles and other costs are in respect
of subsidiary companies, triggered by continuous under
performance, mainly attributed by challenging market
conditions in which the subsidiaries operate.
Consolidated Profit Before Tax (PBT) increased to `13,633.48
crores in FY 2012-13, compared to ̀ 13,533.87 crores in FY 2011-12,
representing an increase of ̀ 99.61 crores. Due to severe contraction
in domestic volumes, TML’s contribution to PBT was negative. JLR
by virtue of its strong performance, contributed to PBT. Hence,
despite increase in consolidated revenue, the PBT has marginally
improved. The increase also includes translation impact.
Tax Expense represents a net charge of ̀ 3,770.99 crores in FY 2012-
13, as compared to net credit of ̀ 40.04 crores in FY 2011-12. During
FY 2011-12, JLR accounted for credit of GB£225 million (`1,793.66
crores) in respect of carried forward past tax losses. The tax expense
is not comparable with the profit before tax, since it is consolidated
on a line-by-line addition for each subsidiary company and no tax
effect is recorded in respect of consolidation adjustments.
Consolidated Profit After Tax decreased to `9,892.61 crores

76
68th ANNUAL REPORT 2012-13
compared to `13,516.50 crores in FY 2011-12, after considering
the profit from associate companies and share of minority. The
lower PAT as compared to last year is attributable to tax credit
accounted in FY 2011-12, by JLR as explained above.
Consolidated Balance Sheet
Shareholders’ fund was ̀ 37,637.30 crores and `32,698.50 crores
as at March 31, 2013 and 2012, respectively.
Reserves increased from `32,063.75 crores as at March 31, 2012
to `36,999.23 crores as of March 31, 2013. The increase represents
strong performance on a consolidated basis as explained above.
� Balance in Profit & Loss Account and General Reserve has gone
up by ̀ 9,227.64 crores, representing results from operations for
the year, net of distribution of dividend and transfer to other
reserves.
These increase in reserves was offset by -
� The pension reserve of JLR, which increased by `2,354.13
crores (net), due to changes of actuarial assumptions (discount
rate and inflations rate); and
� An amount of `1,416.90 crores (as at March 31, 2012 `369.93
crores), being debit balance in hedging reserves account,
representing marked to market impact on the derivative
financial instruments.
Borrowings:
As at March 31, 2013
As at March 31, 2012
( ` in crores)
Long term borrowings 32,110.07 27,962.48
Short term borrowings 11,612.21 10,741.59
Current maturities of long term
borrowings9,869.10 8,444.89
Total 53,591.38 47,148.96
i. Current maturities of Long term borrowings represents
amount of loan repayable within one year.
ii. Long term borrowings including the current portion increased
by `5,571.80 crores to `41,979.17 crores.
� Jaguar Land Rover Automotive Plc has issued US$500
million (approximately ̀ 2,691 crores), 5.625% Senior Notes
due 2023 in FY 2012-13.
� In FY 2012-13, the Company issued rated, listed, unsecured
non-convertible debentures of `2,100 crores with
maturities of 2-7 years as a step to raise long term resources
and optimize the loan maturity profile.
� Vehicle Financing - TMFL has raised funds by issue of
Secured Non-convertible debentures of `2,696 crores.
iii. Increase in the short term borrowings were by way of
commercial paper of `2,755.30 crores as at March 31, 2013
as compared to `1,252.95 crores as at March 31, 2012.
Other Long term liabilities were `3,284.06 crores as at
March 31, 2013, as compared to `2,297.57 crores as at March
31, 2012. These included `1,733.50 crores of derivative financial
instruments, mainly JLR as at March 31, 2013 (`271.31 crores
as at March 31, 2012), reflecting increased notional liability
consequent to valuation of derivative contracts.
Trade payables were `44,780.15 crores as at March 31, 2013, as
compared to `36,686.32 crores as at March 31, 2012. The increase
is attributable to increase in volumes, mainly at JLR.
Provisions (current and non-current) were towards warranty,
employee benefit schemes, premium on redemption of FCCN
and proposed dividend. Short term provisions are those which
are expected to be settled during next financial year. The details
are as follows:
As at March 31, 2013
As at March 31, 2012
( ` in crores)
Long term provisions (Non-current) 8,319.15 6,232.39
Short term provisions (Current) 7,752.58 6,770.38
Total 16,071.73 13,002.77
i. Provision for warranty and product liability increased by
`1,418.29 crores mainly on account of volumes at JLR.
ii. The provision for employee benefit schemes have mainly
increased on account of change in actuarial factors at JLR
(`2,962.74 crores)
iii. The short term provision included ̀ 855.73 crores as at March
31, 2012, towards premium on redemption of CARS, which
has been fully paid / settled in FY 2012-13.
iv. The provision for dividend has gone down by `732.30
crores, consequent to lower rate of proposed dividend.
Other current liabilities were `22,140.96 crores as at March 31,
2013 as compared to ̀ 19,069.78 crores as at March 31, 2012. These
mainly included liability towards vehicles sold under repurchase
arrangements, liability for capital expenditure, statutory dues, and
current liability of long term debt and advance / progress payment
from customers. The increase was mainly due to increase in current
maturities of long term debt (explained above), increase in liability

77
Management Discussion and
Analysis (66-97)
CORPORATE OVERVIEW FINANCIAL HIGHLIGHTS FINANCIAL STATEMENTSSTATUTORY REPORTS
for capital expenditure and derivative financial instruments.
Fixed Assets:
As at March 31,
2013
As at March 31,
2012Change
(` in crores)
Tangible assets (including
capital work-in-progress) 36,695.02 30,240.09 6,454.93
Intangible assets
(including assets under
development) 32,788.59 25,972.41 6,816.18
Total 69,483.61 56,212.50 13,271.11
The increase (net of depreciation) in the tangible assets mainly
represented additions towards capacity / new product plans of
the Company. The increase (net of amortization) in the intangible
assets was `6,816.16 crores, mainly attributable to new product
developments projects at TML and JLR.
Investments (Current + Non-current) were `9,057.72 crores as
at March 31, 2013, as compared to ̀ 8,917.71 crores as at March 31,
2012. The break-up is as follows:
As at March 31, 2013
As at March 31, 2012
( ` in crores)
Mutual Funds 7,509.50 7,530.05
Investments in equity accounted
investees (associate companies)744.73 668.55
Quoted Equity shares 299.11 297.98
Unquoted Equity shares 383.03 354.42
Others 129.85 74.80
Provision for diminution in value of
investments (net) (8.50) (8.09)
Total 9,057.72 8,917.71
Deferred tax assets / liability :
As at March 31, 2013
As at March 31, 2012
( ` in crores)
Deferred tax assets4,428.93 4,539.33
Deferred tax liability (2,019.49) (2,165.07)
Deferred tax assets, represents timing differences for which there
will be future current tax benefits by way of unabsorbed tax losses
and expenses allowable on payment basis in future years.
Deferred tax liabilities represent timing differences where
current benefit in tax will be off-set by debit in the Profit and
Loss Statement.
Loans and Advances
As at March 31, 2013
As at March 31, 2012
( ` in crores)
Long term loans and advances 15,465.46 13,657.95
Short term loans and advances 12,608.46 11,337.22
Total 28,073.92 24,995.17
Loans and advances include
i. Credit entitlement of Minimum Alternate Tax (MAT ) of
`1,513.34 crores as at March 31, 2013 (`1,451.45 crores as at
March 31, 2012), relating to Tata Motors. The credit / refund
will be against tax paid at normal rate, within time limit as per
the Income Tax Act.
ii. Receivables towards vehicle financing by Tata Motors Finance
Ltd `18,226.78 crores as at March 31, 2013, as compared to
`15,747.67 crores as at March 31, 2012; and
iii. VAT, other taxes recoverable, statutory deposits and dues
of `5,659.37 crores as at March 31, 2013, as compared to
`5,626.70 crores as at March 31, 2012.
Inventories as of March 31, 2013, stood at `20,969.01 crores as
compared to `18,216.02 crores as at March 31, 2012. Inventory at
TML was `4,455.03 crores as compared to `4,588.23 crores as at
March 31, 2012. Inventory at JLR was ̀ 14,726.76 crores as compared
to `12,174.64 crores as at March 31, 2012. The increase at JLR is
consistent with the volume growth. In terms of number of days of
sales, finished goods represented 29 inventory days in FY 2012-13;
same as FY 2011-12.
Trade Receivables (net of allowance for doubtful debts) were
`10,942.66 crores as at March 31, 2013, representing an increase
of `2,705.82 crores, which was attributable to increase in sales, at
JLR. Trade Receivables have decreased in TML by `890.28 crores.
The allowances for doubtful debts were ̀ 321.68 crores as at March
31, 2013 against `326.21 crores as at March 31, 2012.
Cash and bank balances were `21,112.67 crores, as at March
31, 2013 compared to `18,238.13 crores as at March 31, 2012.
The Company holds cash and bank balances in Indian Rupees,
GB£, and Chinese Renminbi etc. The cash balances include bank
deposits maturing within one year of ̀ 11,369.21 crores; compared
to `9,500.48 crores as at March 31, 2012. It included `4,320 crores
as at March 31, 2013 (`3,697crores as at March 31, 2012) held by

78
68th ANNUAL REPORT 2012-13
a subsidiary that operates in a country where exchange control
restrictions potentially restrict the balances being available for
general use by Tata Motors Limited and other subsidiaries.
Consolidated Cash Flow
The following table sets forth selected items from consolidated
cash flow statement:
FY 2012-13 FY 2011-12 Change
(` in crores)
Net Cash from Operating
Activities 22,062.23 18,384.32 3,677.91
Profit for the year 9,892.61 13,516.50
Adjustments for cash flow
from operations14,460.64 8,915.84
Changes in working capital (67.95) (2,280.08)
Direct taxes paid (2,223.07) (1,767.94)
Net Cash used in Investing
Activities (23,412.58) (20,542.85) (2,869.73)
Payment for fixed assets (Net) (18,720.34) (13,782.85)
Net investments, short term
deposit, margin money and
loans given (5,498.44) (7,297.58)
Dividend and interest received 806.20 537.58
Net Cash from / (used in)
Financing Activities (1,655.79) 6,567.18 (8,222.97)
Proceeds from issue of share to
minority shareholders 0.56 138.54
Dividend Paid (including paid
to minority shareholders (1,508.73) (1,503.11)
Interest paid (4,655.99) (3,373.69)
Net Borrowings (net of issue
expenses) 4,508.37 11,305.44
Net (decrease) / increase in
cash and cash equivalent (3,006.14) 4,408.67
Effect of exchange fluctuation
on cash flows 521.94 1,078.96
Cash and cash equivalent,
beginning of the year 14,833.02 9,345.41
Cash and cash equivalent,
end of the year 12,348.82 14,833.04
Analysis:
a. Cash generated from operations before working capital
changes and change in finance receivable was `24,353.25
crores as compared to `22,432.34 crores in the previous
year, representing an increase in cash generated through
consolidated operations, consistent with the growth in
revenue on a consolidated basis. After considering the impact
of working capital changes and net movement of vehicle
financing portfolio, the net cash generated from operations
was `24,285.30 crores as compared to `20,152.26 crores in
the previous year. The following factors contributed to net
increase in working capital for the year:-
� Increase in vehicle financing receivables by `2,479.10 crores,
consequent to increase in financing activity to support sales
in India.
� Increase in trade and other receivables amounting `2,727.65
crores mainly due to increase in sales to importers at JLR.
� Increase in inventories amounting to ̀ 2,693.24 crores (mainly
in finished goods) due to higher volumes / activity at JLR.
� The above increases were offset by increase in trade and other
payables by ̀ 7,508.61 crores (due to revenue growth) and net
increase in provisions of `1,322.46 crores.
b. The net cash outflow from investing activity increased during
the current year to `23,412.58 crores from `20,542.85 crores
for the last year.
� Capital expenditure was at `18,720.34 crores during the year
as against ̀ 13,782.85 crores for the last year, related mainly to
capacity / expansion of facilities, quality and reliability projects
and product development projects.
� The change in net investments mainly represents deposits/
restricted deposits (net) `6,135.57 crores against `1,683.25
crores in the last year. Further, in FY 2011-12, the Company
parked surplus cash in mutual funds net `5,840.09 crores.
c. The net change in financing activity was an outflow of ̀ 1,655.79
crores against net inflow `6,567.18 crores for last year.
� During FY 2012-13, `5,615.83 crores were raised from long
term borrowings (net) as compared to `14,365.91 crores.
During FY 2011-12, JLR raised funds by issued of Senior Notes
of GB£1,500 million (`12,327.19 crores) (net), resulting in
increase (net) in borrowings during FY 2011-12.
� Net increase in short term borrowings of `1,837.51 crores as
compared to decrease of `1,913.58 crores.
As of March 31, 2013, Tata Motors Group borrowings (including
short term debt) were ̀ 53,591.38 crores compared with ̀ 47,148.96
crores as of March 31, 2012.
The Company believes that it has sufficient resources available
to meet planned capital requirements. However, the sources of
funding could be adversely affected by an economic slowdown
as was witnessed in FY 2008-09 or other macroeconomic factors in
India and abroad such as Europe and markets where the Company is
present such as China. A decrease in the demand for the Company
products and services could lead to an inability to obtain funds from
external sources on acceptable terms or in a timely manner. In order
to refinance the Company acquisition related borrowings and for
supporting long term fund needs, the Company continued to raise
funds in FY 2011-12 and FY 2012-13, through issue of various equity,
equity linked and debt securities described below.

79
Management Discussion and
Analysis (66-97)
CORPORATE OVERVIEW FINANCIAL HIGHLIGHTS FINANCIAL STATEMENTSSTATUTORY REPORTS
In May 2011, JLR issued GB£1,000 million equivalent Senior Notes
(Notes). The Notes issued included GB£500 million Senior Notes
due 2018 at a coupon of 8.125% per annum, US$ 410 million Senior
Notes due 2018 at a coupon of 7.75% per annum and US$ 410
million Senior Notes due 2021 at a coupon of 8.125% per annum.
The proceeds are / will be used to refinance existing debt and for
general corporate purposes. The notes are callable at a premium
for the present value of future interest rates, if called before a
specified date for each series of notes and thereafter are callable
at fixed premiums.
In September 2011, the Company raised Syndicated Foreign
currency term loans of US$ 500 million in two tranches with
tenors between four to seven years towards financing its general
capital expenditure and investments in its overseas subsidiaries in
accordance with guidelines on External Commercial Borrowings
(ECB) issued by the Reserve Bank of India.
In March 2012, JLR issued GB£500 million Senior Notes due 2020,
at a coupon of 8.25% per annum. The proceeds will be used for
general corporate purposes. The notes are callable at a premium for
the present value of future interest rates, if called before a specified
date and thereafter are callable at fixed premiums.
During FY 2011-12, TMFL raised `154.50 crores by an issue of
unsecured, non-convertible, debentures towards Tier 2 Capital to
meet its growth strategy and improve its capital adequacy ratio.
In FY 2012-13, the Company issued rated, listed, unsecured non-
convertible debentures of `2,100 crores with maturities of 2-7
years as a step to raise long term resources and optimize the loan
maturity profile.
In January 2013, JLR issued US$ 500 million Senior Notes due 2023,
at a coupon of 5.625% per annum. The proceeds will be used for
general corporate purposes, including, to support ongoing growth
and capital spending plans. The notes are callable at a premium for
the present value of future interest rates, if called before a specified
date and thereafter are callable at fixed premiums.
During FY 2012-13, TMFL raised `90.40 crores by issue of
Subordinated Unsecured, Non-convertible debentures towards
Tier 2 Capital and `100 crores was raised by issue of Subordinated
Unsecured Non-convertible Perpetual debentures towards Tier
I Capital to meet its growth strategy and improve its capital
adequacy ratio.
The Tata Motors Group fund its short-term working capital
requirements with cash generated from operations, overdraft
facilities with banks, short and medium term borrowings from
lending institutions, banks and commercial paper. The maturities
of these short and medium term borrowings and debentures are
generally matched to particular cash flow requirements. During
April 2012, Tata Motors received approvals from the Board to
increase the working capital limits to `14,000 crores from the
existing `12,000 crores from banks in India.
The working capital limits are secured by hypothecation of certain
existing current assets of the Company. The working capital limits
are renewed annually.
In December 2011, JLR established 3-5 year committed Revolving
Credit Facility amounting to GB£710 million from a syndicate of
13 banks. During July and August 2012, JLR received approvals for
additional GB£85 million limits taking the facility to GB£795 million
as of March 31, 2013.
The Tata Motors Group cash and bank balances were `21,112.67
crores as at March 31, 2013, as compared to ̀ 18,238.13 crores as at
March 31, 2012. These enable the Group to cater to business needs
in the event of changes in market conditions.
Some of the Company’s financing agreements and debt
arrangements set limits on and / or require prior lender consents
for, among other things, undertaking new projects, issuing new
securities, changes in management, mergers, sale of undertakings
and investment in subsidiaries. In addition, certain financial
covenants may limit the Company’s ability to borrow additional
funds or to incur additional liens. Certain of the Company financing
arrangements also include covenants to maintain certain debt-
to-equity ratios, debt-to-earnings ratios, liquidity ratios, capital
expenditure ratios and debt coverage ratios.
In respect of one of the borrowings, aggregating `4,200.00 crores
(`3,050.00 crores outstanding as at March 31, 2013), the Company
has not met two of the covenants, due to extremely difficult market
conditions affecting the performance and redemption of CARS
of `3,493.83 crores (including redemption premium) resulting in
depletion of long term funds. This entails incremental effective cost
of borrowing by100 basis points per annum, in respect of which
the Company has sought waiver and is confident of obtaining
the same.
The cash and liquidity is located at various locations in its subsidiaries
along with balances in India. Jaguar Land Rover’s subsidiary in China
is subject to foreign exchange controls and thereby has some
restrictions on transferring cash to other companies of the group
outside of China.
There may also be legal or economic restrictions on the ability of
subsidiaries to transfer funds to the Company in the form of cash
dividends, loans, or advances, however such restrictions have not
had and are not estimated to have significant impact on the ability
of the Company to meet its cash obligations.

80
68th ANNUAL REPORT 2012-13
FINANCIAL PERFORMANCE ON A STANDALONE BASIS
The financial information discussed in this section is derived from
the Company’s Audited Standalone Financial Statements.
As explained in the business section, the domestic economic
environment deteriorated further, in the current fiscal. As a result,
the automotive industry shrunk significantly.
Revenues (net of excise duty) were `44,765.72 crores in FY 2012-
13, as compared to `54,306.56 crores, representing a decrease of
17.6%. As explained above, the total number of vehicles sold during
the year decreased by 11.9%. The domestic volumes decreased by
11.3% to 765,557 vehicles from 863,248 vehicles in FY 2012-13 and
export volumes decreased by 19.3% to 50,938 vehicles from 63,105
vehicles in FY 2011-12. The sale of spare parts / aggregates increased
by12.5% to `3,273.80 crores from `2,910.61 crores in FY 2011-12.
Significant volumes reduction, adverse product mix, more
particularly in the commercial vehicles, and intense competition
amongst all product segments, impacted the operating margin,
recording a level of 4.8% of sales (8.1% for FY 2011-12). As a
result. the Profit after tax was `301.81 crores, as compared to
`1,242.23 crores in FY 2011-12. The analysis of performance is
given below:-
Percentage to revenue from operations
FY 2012-13 FY 2011-12
Revenue from operations net of excise
duty 100 100
Expenditure:
Cost of material consumed (including
change in stock)
73.6 73.1
Employee Cost 6.3 5.0
Manufacturing and other
expenses (net) 17.4 15.5
Amount Capitalised (2.1) (1.7)
Total Expenditure 95.2 91.9
Other Income 4.7 1.1
Profit before Exceptional Item,
Depreciation, Interest and Tax
9.5 9.2
Depreciation and Amortisation
(including product development/
engineering expenses written off )
5.0 3.4
Finance costs 3.1 2.2
Exceptional Item – Loss 1.0 1.1
Profit before Tax 0.4 2.5
Cost of materials consumed (including change in stock):
FY 2012-13 FY 2011-12
(` in crores)
Consumption of raw materials and
components 27,244.28
33,894.82
Purchase of product for sale 5,864.45 6,433.95
Change in Stock-in-trade, finished
goods and Work-in-progress
(143.60) (623.84)
Total 32,965.13 39,704.93
% of revenue 73.6 % 73.1 %
The increase in terms of % to revenue, from 73.1% to 73.6% was
mainly due to adverse product mix.
Employee Cost: There was an overall increase to `2,837.00
crores from `2,691.45 crores in FY 2011-12 (5.4% over last year).
The increase was mainly attributable to normal yearly increases,
promotions, wage agreements (one of the major unit) . The
Company has taken steps to contain the manpower cost, by
reduction in head count both permanent and temporary. Due to
lower volumes, the employee cost to revenue has increased from
5.0% to 6.3%.
Manufacturing and Other Expenses: These expenses relate
to manufacturing, operations and incidental expenses other
than raw materials and employee cost. This expenditure mainly
included job work charges, advertisement & publicity and other
selling and administrative costs. The expenses were `7,773.65
crores during current fiscal, as compared to `8,405.51 crores for
FY 2011-12, representing 17.4% of revenue for FY 2012-13 (15.5%
for FY 2011-12).
a) There been decrease in expenses in terms of absolute terms on
account of lower volumes and cost reduction initiative taken
by the Company.
b) Increase is partly attributable to write off of items held in work
in process product development projects of `169 crores and
IT costs.
Amount capitalised represents expenditure transferred to
capital and other accounts allocated out of employee cost and
other expenses incurred in connection with product development
projects and other capital items. The expenditure transferred to
capital and other accounts increased to ̀ 953.80 crores from ̀ 907.13
crores of FY 2011-12, and mainly related to ongoing product
development for new products and variants.
Other Income was ̀ 2,088.20 crores (`574.08 crores for FY 2011-12).

81
Management Discussion and
Analysis (66-97)
CORPORATE OVERVIEW FINANCIAL HIGHLIGHTS FINANCIAL STATEMENTSSTATUTORY REPORTS
For FY 2012-13, it included dividends from subsidiary companies
of `1,583.58 crores (including dividend from JLR), as compared to
`113.83 crores for FY 2011-12. Other income also include interest
income of `383.64 crores), as compared to `363.67 crores for FY
2011-12. (The dividend from subsidiary companies is eliminated
in the consolidated income statement, being income from
subsidiaries).
Profit before Exceptional Item, Depreciation, Interest and Tax
(PBDIT) was ̀ 4,231.94 crores in FY 2012-13, compared to ̀ 4,985.88
crores in FY 2011-12. Lower volumes and adverse product mix,
resulted in lower operating profit. This was partly offset by dividend
from JLR and higher dividend from other subsidiaries.
Depreciation and Amortization (including product
development / engineering expenses written off) increased
by ̀ 402.39 crores (21.9% increase over last year) to ̀ 2,243.38 crores
from `1,840.99 crores in FY 2011-12.
a) Depreciation increased by `72.13 crores, reflecting impact
of additions to fixed assets towards plant and facilities for
expansion and new products introduction.
b) Amortization increase by `138.75 crores related to product
development projects capitalized for products launched in
recent years.
c) Product development / engineering expenses written off
increased by `191.51 crores to `425.76 crores in FY 2012-13.
Finance Costs increased to ̀ 1,387.76 crores from ̀ 1,218.62 crores
in FY 2011-12. The increase reflects increase in rates and borrowing
levels, mainly due to lower cash from operations. Post redemption
of CARS and repayment of fixed deposits, the weighted average
borrowing cost (gross) has increased to 7.25% from 6.09% in
FY 2011-12.
Exceptional Items
a) During FY 2012-13, the Company further provided ̀ 245 crores
for the loan given to a subsidiary company, Hispano Carrocera
SA. Impairment triggered by continuous under performance,
mainly attributed to extremely difficult market conditions in
Spain. The Company is in the process of evaluating various
options and business prospects of Hispano.
b) As per the accounting policy followed by the Company the
exchange gain / loss on foreign currency long term monetary
items, is amortised over the tenor of such monetary item. The
net exchange loss including on revaluation of foreign currency
borrowings, deposits and loans and amortisation, was ̀ 263.12
crores for the year (last year `455.24 crores).
c) The Company sold forge division at Jamshedpur, to one of its
subsidiary on a slump sale basis, at a profit of `82.25 crores.
Profit before Tax (PBT) of `174.93 crores represented a steep
reduction of `1,166.10 crores from `1,341.03 crores in FY 2011-12.
The reduction of PBT was mainly attributable to lower M&HCV
volumes and severe contraction of passenger car volumes, resulting
in lower operating margin, increase in depreciation/amortization.
Further there was write off of product development costs / items.
The loss from operation was offset by increased dividend form
subsidiary companies, lower exchange loss (net) in respect of
foreign currency borrowings, deposits and loans and profit on
sale of division.
Tax expenses -There was tax credit of ̀ 126.88 crores as compared
to tax expense of `98.80 for FY 2011-12. The tax expenses was
after considering the tax benefit on R&D expenditure, provision of
disallowances and tax treatment of foreign exchange differences.
Profit After Tax (PAT) decreased to ̀ 301.81 crores from ̀ 1,242.23
crores in FY 2011-12. Consequently, basic Earnings Per Share (EPS)
decreased to `0.93 as compared to `3.90 for the previous year for
Ordinary Shares and to `1.03 as compared to `4.00 for ‘A’ Ordinary
Shares for the previous year.
Standalone Balance Sheet
Shareholders’ funds were ̀ 19,134.84 crores and ̀ 19,367.66 crores
as at March 31, 2013 and 2012, respectively.
Reserves decreased to `18,496.77 crores as at March 31, 2013
from ̀ 18,732.91 crores as at March 31, 2012, reflecting a reduction
of `236.14 crores
`301.81 crores and ̀ 141.81
crores (net) were added to the Securities Premium account by
way of premium on shares issued on conversion of convertible
notes / securities (net of utilization for debt issue cost, etc.).
`724.23
crores.
Borrowings:
As at March 31, 2013
As at March 31, 2012
(` in crores)
Long term borrowings 8,051.78 8,004.50
Short term borrowings 6,216.91 3,007.13
Current maturities of long term
borrowings 2,530.26 4,868.94
Total 16,798.95 15,880.57
During FY 2012-13, the Company repaid fixed deposits from public
and shareholders `1,747.12 crores and CARS `2,406.74 crores.
These were offset by increase in the short term borrowing by way
of commercial paper of `1,986.56 crores as at March 31, 2013 (as
compared to ̀ 131.27 crores as at March 31, 2012) and net increase
in loan, cash credit, overdraft accounts by `1,905.48 crores in FY
2012-13, to support the funding needs. The debt/equity ratio after
considering cash / investment in mutual fund was 0.85 as compared

82
68th ANNUAL REPORT 2012-13
to 0.74 as at March 31, 2012. Due to significant reduction in volumes,
the Company had to deploy short term funds to support critical
long term finance needs, The Company is in the process of taking
appropriate steps to increase the long term funds.
Trade payables were `8,455.02 crores as at March 31, 2013 as
compared to `8,705.53 crores as at March 31, 2012.
Provisions (current and non-current) as at March 2013 and
2012 were `2,200.77 crores and `3,640.12 crores, respectively.
The provisions are mainly towards warranty, employee retirement
benefits, premium payable of redemption of debentures / FCCNs,
delinquency and proposed dividends. The reduction mainly
comprise (i) lower dividend provision of `739.49 crores; and (ii)
payment of redemption premium of CARS `886.95 crores in FY
2012-13.
Fixed Assets: The tangible assets (net of depreciation and
including capital work in progress) increased from ̀ 13,656.77 crores
as at March 31, 2012 to `13,795.55 crores. The intangible assets
(net of amortisation, including the projects under development),
increased from `5,399.42 crores as at March 31, 2012 to `6,412.99
crores. The intangible assets under development were `3,244.96
crores as at March 31, 2013, which relate to new products planned
in the future.
Investments (Current + Non-current) decreased to `19,934.39
crores as at March 31, 2013 as compared to `20,493.55 crores as
at March 31, 2012.
� There was redemption of 6.25% Cumulative Redeemable
Preference Shares of US$ 100 each at par of TML Holdings Pte
Ltd, Singapore, of `1,378.95 crores, resulting in reduction of
investments.
� This was partly offset by increase in investments in subsidiaries
`258.27 crores (Tata Motors Finance Ltd `150 crores, Tata
Motors European Technical Centre Plc `62.37 crores, and PT
Tata Motors, Indonesia of `45.90 crores), and investments in
mutual fund of `359.42 crores.
Inventories stood at `4,455.03 crores as compared to `4,588.23
crores as at March 31, 2012. The Company achieved reduction
in stocks of raw material & components, work in progress and
transit inventory of `327.67 crores. However, due to difficult
market scenario, the finished goods stock and traded inventory
has increased by `181.90 crores. The total inventory therefore
has increased to 33 days of sales as compared to 28 days in last
year.
Trade Receivables (net of allowance for doubtful debts) were
`1,818.04 crores as at March 31, 2013, as compared to `2,708.32
crores as at March 31, 2012. The reduction reflects lower volumes
and steps taken by the Company to control the credit. The
receivable represented 15 days as at March 31, 2013, compared to
18 days as at March 31, 2012. The amount outstanding for more
than six month has gone up to ̀ 682.82 crores as at March 31, 2013
from `452.53 crores as at March 31, 2012. These represented dues
from Government owned transport companies and some of the
dealers. The overdues are monitored and the Company has taken
steps to recover these dues. The allowances for doubtful debts
were `240.59 crores as at March 31, 2013 against `181.23 crores
as at March 31, 2012.
Cash and bank balances were ̀ 462.86 crores as at March 31, 2013
compared to `1,840.96 crores as at March 31, 2012. The decrease
was due to (i) utilisation of deposits held in foreign currency for
redemption of CARS (`759.19 crores) and (ii) utilization of bank
deposits of `626.08 crores for business purposes.
Standalone Cash Flow
FY 2012-13 FY 2011-12 Change
(` in crores)
Net Cash from Operating
Activities 2,258.44
3,653.59
(1,395.15)
Profit for the year 301.81 1,242.23
Adjustments for cash flow
from operations 1,346.51 3,061.36
Changes in working capital 502.79 (313.52)
Direct taxes paid / (credit)(net) 107.33 (336.48)
Net Cash from Investing
Activities
991.50
144.72
846.78
Payments for fixed assets (Net) (2,588.44) (2,835.47)
Proceeds from sale of a
division
110.00
-
Net investments, short term
deposit, margin money and
loans given
402.58
262.21
Redemption of preference
shares in subsidiary
1,378.95
4,146.98
Investments / loans in subsid-
iary / associates / JV (net)
(376.31)
(1,940.74)
Dividend and interest received 2,064.72 511.74
Net Cash used in Financing
Activities (4,045.69) (4,235.59)
189.90
Interest and dividend paid (3,269.83) (2,944.63)
Net Borrowings (net of issue
expenses) (775.86) (1,290.96)
Net decrease in cash and
cash equivalent (795.75) (437.28)
Effect of exchange fluctuation
on cash flows 81.68 4.78
Cash and cash equivalent,
beginning of the year 919.64 1,352.14
Cash and cash equivalent,
end of the year 205.57 919.64

83
Management Discussion and
Analysis (66-97)
CORPORATE OVERVIEW FINANCIAL HIGHLIGHTS FINANCIAL STATEMENTSSTATUTORY REPORTS
a. Reduction in net cash generated from operations reflects
impact of reduction in sales and profitability. The cash
generated from operations before working capital changes
was `1,648.32 crores as compared to `4,303.59 crores in the
previous year. There was a net inflow of `502.79 towards
working capital changes mainly attributable to decrease
in trade receivables and partly offset by increase of trade
payables.
b. The net cash inflow from investing activity was ̀ 991.50 crores
as compared to `144.72 crores for the previous year and was
mainly attributable to:
� Redemption of preference shares by TML Holdings Singapore,
resulting in cash inflow of `1,378.95 crores as compared to
`4,146.98 crores in FY 2011-12.
� Inflow by way of dividend was ̀ 1,660.95 crores (`180.63 crores
for FY 2011-12).
� The cash used for payments for fixed assets was `2,588.44
crores (net) (`2,852.56 crores for FY 2011-12),
� There was an outflow (net) of `203.00 crores (`1,806.87
crores for FY 2011-12) towards investments in subsidiary
companies.
c. The net change in financing activity was an outflow of
`4,045.69 crores against `4,235.59 crores for last year. The
outflow is attributable to the following:
i. The Company repaid fixed deposits - `1,868.38 crores
(`1,069.25 crores for FY 2011-12).
ii. The long term borrowings (net) repayment was ̀ 814.63 crores
(last year there was inflow of `2,423.30 crores).
iii. Short term borrowings – net increase of ̀ 2,983.74 crores (last
year `2,567.37 crores). As explained, the Company is in the
process of raising long term funds.
FINANCIAL PERFORMANCE OF JLR (AS PER IFRS)
The financial statement of JLR are prepared as per International
Financial Reporting Standards (IFRS) applicable in the UK. This
information is given to enable the readers to understand the
performance of JLR
Revenue: During the year, JLR generated a record revenue and
profits. This was primarily driven by increased demand for both
brands as well as a strong product and market mix. Consolidated
revenues for FY 2012-13 were GB£15,784 million, an increase of
16.8% compared to FY 2011-12.
EBITDA: Consolidated EBITDA for FY 2012-13 was GB£2,402
million, an increase of 19% compared to FY 2011-12, a significant
improvement mainly driven by increased volume, a favourable
exchange rate environment and richer model and market mix.
The introduction of the new Range Rover, a full year of the Range
Rover Evoque and the new variants of the Jaguar XF, as well as the
continued strength of the Range Rover Sport, were key contributors
to the profitable growth.
JLR also experienced a change in market mix, in particular the
continued strengthening of business in China, which is now its
largest single market. Further, JLR’s performance was also supported
by the positive impact of the continuing strength of the US Dollar
against the Pound Sterling and the Euro, improving its revenues
against the backdrop of a largely pound sterling and euro cost base.
The improvement in JLR’s results of operations in FY 2012-13 was
also partially attributable to further cost efficiency improvements
in material costs and manufacturing costs, supported by increased
production volume levels.
Material cost of sales for FY 2012-13 were GB£9,904 million, an
increase of GB£1,172 million (13%) compared to FY 2011-12 and,
as a percentage of revenue, was 63%, a decrease of 2% compared
to FY 2011-12. The main drivers of the decrease were product and
market mix and material cost improvements.
Employee costs: There was an increase of GB£322 million (32%)
compared to FY 2011-12. This reflects increase in permanent
and agency headcount, to support product development and
manufacturing in view of increased volumes.
Other expense for FY 2012-13 were GB£3,075 million, an increase
of GB£546 million (22%) compared to FY 2011-12. These costs
include manufacturing and launch costs, freight and distribution
costs, warranty costs, product development / engineering expense,
selling and fixed marketing expenses. Some of these costs were
attributable to launch expenses for new / variants introduced
during the year.
Development costs of GB£1,058 million represent an increase of
GB£158 million (18%). This reflected the increased spend on future
model development for both brands. Of the total spending, GB£860
million was capitalised (last year GB£ 751 million).
Profit before tax (PBT) for FY 2012-13 was GB£1,675 million,
an increase of GB£168 million (11%) compared to FY 2011-12.
Depreciation and amortisation costs were GB£622 million, an
increase of GB£157 million (34%) compared to FY 2011-12, reflecting
the growing product development and facilities investment.

84
68th ANNUAL REPORT 2012-13
The net foreign exchange loss was GB£108 million, an impact of
GB£122 million, compared to FY 2011-12 (£14 million gain). This
was as a result in the mark to market of hedging instruments and
revaluation of loans and other balance sheet items.
Finance income was GB£34 million, an increase of GB£18 million
compared to FY 2011-12, as a result of an increase in cash generated
by JLR during FY 2012-13. Finance expense (net of capitalised
interest) was GB£65 million, a reduction of GB£20 million compared
to FY 2011-12.
During the year, JLR invested £70 million in the China joint venture,
established with Chery Automobile Company Ltd. Due to initial
start-up costs; JLR has recognised a loss of £12 million on the JV
in the current year.
The effective tax rate was 27% compared to 2% in FY 2011-12.
This reflects the recognition of GB£217 million of previously
unrecognised deferred tax assets.
Cash Flow
Net cash provided by operating activities was GB£2,429 million in
FY 2012-13 compared to GB£2,500 million during FY 2011-12. This
was primarily attributable to the improvement in JLR’s profits offset
by higher tax paid and working capital changes.
Net cash used in investing activities increased significantly to
GB£2,609 million in FY 2012-13, compared with GB£1,542 million
in FY2011-12. Purchase of property, plant and equipment and
expenditure on intangible assets (product development projects)
was GB£1,846 million in FY 2012-13 against GB£1,410 million in
FY 2011-12. JLR’s capital expenditure related mostly to capacity
expansion of its production facilities and investment in new
and future products, including the costs associated with the
development of the all new Range Rover and Range Rover Sport.
Net cash used in financing activities was GB£178 million in FY
2012-13 compared to net cash generated in financing activities
of GB£444 million in FY 2011-12. Cash used in financing activities
in FY 2012-13 includes a maiden dividend paid of GB£150 million
and reflects long term unsecured bond proceeds of GB£317 million
and repayment of short term debt (GB£250 million). Also including
interest and fees of GB£179 million.
Financial performance of TMFL : During FY 2012-13, TMFL earned
a total income of `2,889.81 crores, against an income of `2,096.66
crores earned during the previous year, reflecting an increase of
38%. The Profit Before Tax grew by 27% to ̀ 449.59 crores (Previous
year: ̀ 355.12 crores). The Profit After Tax at ̀ 309.30 crores was 29%
higher than that in the previous year (`239.90 crores).
Financial performance of TDCV (as per Korean GAAP) : During FY
2012-13, TDCV’s total revenue was at KRW 823.92 billion (`4,024.00
crores) higher by 7.9 % compared to KRW 763.47 billion (`3,288.18
crores) in FY 2011-12. TDCV reported Loss before Tax was at KRW
10.44 billion (`51.00 crores) as compared to Income before tax of
KRW 6.43 billion (`27.67 crores) in FY 2011-12. After providing for
tax, the Loss for the year stood at KRW 9.21 billion (`44.96 crores),
against profit of KRW 2.03 billion (`8.74 crores) in FY 2011-12. The
positive impact of higher volume and various cost control initiatives,
were negated by provision of KRW 18.9 Billion ̀ 92.27 crores) made
on account of court verdict in the Ordinary Wage Lawsuit filed by
the Union Employees of TDCV.
Financial performance of TTL : The consolidated revenue was
`2,045.42 crores, an increase of 22.7% against `1,666.95 crores in
the previous year. The Profit Before Tax was ̀ 392.59 crores as against
`271.83 crores in the previous year, recording a growth of 44.4%.
The Profit After Tax stood at ̀ 300.89 crores as against ̀ 208.37 crores
recording a growth of 44.3%.
Opportunities and Risks – JLR and Tata Motors businesses
constitute a significant portion of Revenue, Income and assets
/ liabilities. Accordingly, we have given below key opportunities
and risks.
OPPORTUNITIES
Infrastructure Growth: While the growth in this sector in India
has been below expectations last year, there are encouraging
signs of improvement in this sector going forward. In the recently
announced Annual Budget for FY 2013-14, the Finance Minister
announced under the Jawaharlal Nehru National Urban Renewal
Mission scheme (JNNURM) and a spend of in the infrastructure
sector.
The Government of India has been focusing on improving road
infrastructure through two main umbrella programs – National
Highway Development Project (NHDP) and Pradhan Mantri Gram
Sadak Yojna (PMGSY).
While National Highway Authority of India (NHAI) has till date
awarded 66% of the projects by road length (the plan is to upgrade,
widen and strengthen 55,000 km of road network), 34% still remains
to be awarded. Of the awarded projects, 39% of the work has been
completed and work on the remaining 28% is underway.
In the FY 2013-14 budget, the Government has planned to award a
further 8,270 km of projects, higher than originally planned.
Under the PMGSY, the Government aims to develop 470,761 km
of rural roads. Of this, till date about 72% of network has been

85
Management Discussion and
Analysis (66-97)
CORPORATE OVERVIEW FINANCIAL HIGHLIGHTS FINANCIAL STATEMENTSSTATUTORY REPORTS
completed (including up gradation). Of the sanctioned road work
for new connectivity, 66% has been completed and 82% of that
for upgraded connectivity has been completed.
This improved and new connectivity presents a significant
opportunity for the Company with its wide product range in
commercial, utility and passenger vehicles. Also, there is potential
requirement of both cargo and passenger small commercial
vehicles from newly connected rural areas.
Increase in connectivity has also resulted in urbanization of towns
and villages thus boosting local economy and leading to increased
demand. It is expected, the above initiatives will boost the demand
for construction equipment and tippers.
Rural market penetration: In India, growth in FY 2013-14
is expected to come from reach and penetration in tier 2 and
tier 3 markets. With growing connectivity and increased rural
affluence, the demand for automobiles in rural areas has increased
significantly. For FY 2013-14 as well, with indications of a normal
monsoon and a robust growth in agriculture, the demand from the
rural segment is likely to sustain. With a product range catering to
even the buyer of smallest commercial vehicle or a fun-to-drive yet
affordable passenger car offering, the Company is appropriately
placed to encash the opportunity. Along with the product range,
the Company is working on increasing reach and penetration
of the sales and service network to be able to serve this market
better. During FY 2012-13, the Company increased sales touch
points by 35% and service touch points by 26%. With aggressive
plans to further increase penetration this year, the Company has
potential opportunity to leverage its wide product range and large
distribution network, to accelerate growth.
Non-cyclical business growth: In order to better insulate
against the cyclicality of the automobile industry in the event of
a downturn, specifically in the MHCV segment, the Company has
also focused on lines of business and customer solutions which
are inherently less cyclic in nature, e.g. the sale of spares and the
after sales business. The spares business of the Company’s Indian
operations has grown by 20% CAGR in the last five years.
Similarly, the Annual Maintenance Contracts enable the Company
to continue revenue streams from a customer even after sale of
the vehicle, while enhancing the value to the customers during
lifetime of product.
The Company has also taken initiative of increasing focus on the
Defence business which is also independent of the cyclicality of the
other segments in the automobile sector. While the Government
has announced increased private participation in Defence sector,
the progress is quite slow in this direction. The Company is targeting
moving from pure logistics solutions to tactical and combat
solutions, thus garnering a greater share of this market.
The Defence business has increasing relevance in international
markets, as well and the Company is now focusing on developing
this business beyond India. We have appointed exclusive Defence
distributors in certain key markets such as Thailand, Malaysia etc.
to penetrate this business.
Exports from India: India has emerged as a major hub for global
manufacturing with its advantage of lower input costs, availability
of local supplier base and high domestic demand. As an established
domestic manufacturer, the Company is ideally placed to take
advantage for targeting lucrative international markets, either
through the fully built export or CKD route.
In addition to the above, the Company also has the advantage of a
strong in-house design and development facility and professionals.
Thus the Company’s R &D group is capable of developing solutions
for different regulatory and emission norms as per market
specifications in minimal time.
As demand slows down in the domestic market, growing and
consolidating presence in select international markets will be a
key priority for the Company.
Currently, the Company is present in Africa and ASEAN markets
through manufacturing facilities. The Company is also actively
considering expanding its global manufacturing footprint in key
international markets to take advantage of import duty differentials
and local sourcing benefits.
Jaguar Land Rover Opportunities through products and
markets : JLR offers products in the premium performance car and
all-terrain vehicle segments, and it intends to grow the business
by diversifying the product range within these segments with
both new products as well as product derivatives. The new Range
Rover Evoque has helped expansion into a market segment that
is attracted by a smaller, lighter and more ‘urban’ off-road vehicle,
as compared to domain market segment in which Range Rover
models traditionally compete. All-wheel drive Jaguars and the XF
Sportbrake, cater a much wider group of potential customers.
In addition, JLR has a strategy of expanding regional coverage
into geographic locations where it has identified an opportunity
to grow within its core segments. As a producer of distinctive and
premium cars, JLR believes it is well positioned to increase revenues
in emerging countries with growing sales potential. There are

86
68th ANNUAL REPORT 2012-13
three specific aspects to the company’s strategy of geographic
expansion:
i. JLR aims to increase its marketing and dealer network in
emerging markets. In China, the presence in this key market
and plans to increase the network of sales dealerships across
the country. At March 31, 2013, JLR had increased to 135 Land
Rover dealers and 134 Jaguar dealers in China. Similarly, JLR
plans to continue to grow its presence in the Indian market
by opening additional dealerships across the country.
ii. JLR aims to establish new manufacturing facilities, assembly
points and suppliers in selected markets. In China, joint
venture with Cherry Automobiles has been formed. In India,
the Company has already established a CKD assembly facility.
JLR will continue to look for opportunities to source materials
and components in a cost-efficient manner and, in pursuit of
that objective, JLR has already opened purchasing offices in
China and India.
iii. JLR aims to leverage its relationship with Tata Motors and the
synergies it can achieve in the areas of research and product
development, supply sourcing, manufacturing and assembly
and other vital operations, including the co-development of
a family of small efficient diesel and petrol engines.
RISKS:
Interest rates and other inflationary trends: In India, with
inflation moderating in FY 2012-13, RBI reduced the Repo and
Reverse Repo rate by 100 bps during the year (50 bps in April 2012,
25 bps in January 2013 and further 25 bps in March 2013). However,
with relatively higher inflation levels, the interest rates continue to
be higher and there by impacting growth. In May 2013, RBI reduced
the Repo and Reverse Repo Rate by 25 bps. Although interest
rate and inflation have shown some signs of easing in the recent
months, any upside risk to inflation, could stop further softening
of interest rate cycle by RBI and could have an adverse impact on
the demand and consequently growth in India.
Fuel Prices: In January 2013, the Government has allowed the
Oil Marketing Companies to revise the diesel price from time-
to-time considering the movement in global crude prices and
foreign exchange movement. Any increase in fuel price compels
the consumer to shift to an alternate transport or defer their
purchases. The Company’s product programs initiatives are aimed
at improving fuel efficiency of its products and development of
alternate fuel solutions. The fuel prices or levies could adversely
impact the demand of automotive vehicles in India, particularly
passenger cars.
Deterioration in global economic conditions: Tata Motor’s has
automotive operations in the UK, South Africa, South Korea, Spain,
Thailand, and Indonesia and JLR has significant presence across
the world markets.
The global economic downturn in 2008, significantly impacted the
global automotive markets, particularly in the United States and
Europe, including the UK, where JLR operations have significant
sales exposure. The Company’s strategy with respect to JLR
operations includes new product launches and expansion into
growing markets such as China, Russia and Brazil, may not be
sufficient to mitigate the decrease in demand for its products
in established markets and this could have a significant adverse
impact on our financial performance. JLR business, while increasing
its investments towards products, capacity expansion and other
initiatives, is also exploring opportunities to reduce cost base
through increased sourcing of materials from low cost countries,
reduction in number of suppliers, reduction in number of platforms,
reduction in engineering change costs, increased use of off-shoring
and several other initiatives. While markets in the United States have
shown signs of recovery and stability, UK and Europe continue
to struggle. If industry demand softens because of the impact
of the debt crisis, or lower or negative economic growth in key
markets, including China, or other factors, the company’s results
of operations and financial condition could be substantially and
adversely affected.
The impact of the US fiscal cliff, European sovereign debt crisis and
economic challenges in the UK and Europe continue to be a cause
of concern, despite concerted efforts to contain the adverse effect
of these events on global recovery.
Economic outlook in India: The Indian automotive industry
is affected substantially by the general economic conditions in
India and around the world. The demand for automobiles in the
Indian market is influenced by factors including the growth rate
of the Indian economy, easy availability of credit, and increase in
disposable income among Indian consumers, interest rates, freight
rates and fuel prices. During the global financial crisis, RBI had
eased its monetary policy stance to stimulate economic activity.
Subsequently, as the Indian economy started recovering from the
downturn, inflation pressures increased substantially followed by
several interest rate hikes by RBI in 2011. With inflation moderating
in 2012, RBI reduced the repo rate and reverse repo rate by 50
basis points in April 2012, 25 bps in January 2013 and further 25
bps in March 2013. However, muted industrial growth along with
widening Current Account Deficit, continuing higher inflation

87
Management Discussion and
Analysis (66-97)
CORPORATE OVERVIEW FINANCIAL HIGHLIGHTS FINANCIAL STATEMENTSSTATUTORY REPORTS
and higher interest rates, still pose risks to overall growth. The
automotive industry in general is cyclical and economic slowdowns
in the past have affected the manufacturing sector including the
automotive and related industries. Deterioration in key economic
factors such as growth rate, interest rates and inflation as well as
reduced availability of financing for vehicles at competitive rates
may adversely affect the Company’s automotive sales in India and
results of operations.
Input Costs / Supplies: Prices of commodity items used in
manufacturing automobiles, including steel, aluminium, copper,
zinc, rubber, platinum, palladium and rhodium have become
increasingly volatile over the past two years. While the Company
continues to pursue cost reduction initiatives, an increase in price
of input materials could severely impact the Company’s profitability
to the extent such increase cannot be absorbed by the market
through price increases and / or could have a negative impact on
the demand. In addition, because of intense price competition in
India and the Tata Motor’s Group high level of fixed costs, the Group
may not be able to adequately address changes in commodity
prices even if they are foreseeable. Increases in fuel costs also pose
a significant challenge to automobile manufacturers worldwide,
especially in the commercial and premium vehicle segments where
increased fuel prices have an impact on demand.
In addition, an increased price and supply risk could arise from
the supply of rare and frequently sought raw materials for which
demand is high, especially those used in vehicle electronics such
as rare earths, which are predominantly found in China.
Restrictive covenants in financing agreements: Some of the
Company’s financing agreements and debt arrangements set
limits on and/or require the Company to obtain lender consents
before, among other things, pledging assets as security. In addition,
certain financial covenants may limit the Company’s ability to
borrow additional funds or to incur additional liens. In the past, the
Company has been able to obtain required lender consents for such
activities. If the financial or growth plans require such consents and
such consents are not obtained, the Company may be forced to
forego or alter plans, which could adversely affect the Company’s
results of operations and financial condition.
In the event that the Company breaches these covenants, the
outstanding amounts under such financing agreements could
become due and payable immediately and/or resulting in increased
costs. A default under one of these financing agreements may also
result in cross-defaults under other financing agreements and
result in the outstanding amounts under such other financing
agreements becoming due and payable immediately. Defaults
under one or more of our financing agreements could have a
material adverse effect on the Company’s results of operations
and financial condition.
Environmental Regulations: The automotive industry is subject
to extensive governmental regulations regarding vehicle emission
levels, noise, safety and levels of pollutants generated by the
production facilities. These regulations are likely to become more
stringent and compliance costs may significantly impact the future
results of operations. In particular, the US, Europe and China have
stringent regulations relating to vehicular emissions. The proposed
tightening of vehicle emissions regulations will require significant
costs for compliance. While the Company is pursuing various
technologies in order to meet the required standards in the various
countries in which the Company sell our vehicles, the costs for
compliance with these required standards can be significant to the
operations and may adversely impact the results of operations.
To comply with current and future environmental norms, the
Company may have to incur additional capital expenditure
and R&D expenditure to upgrade products and manufacturing
facilities, which would have an impact on the Company’s cost of
production and the results of operations and may be difficult to
pass through to its customers. If the Company is unable to develop
commercially viable technologies within the time frames set by the
new standards, the Company could face significant civil penalties
or be forced to restrict product offerings drastically to remain in
compliance. Moreover, meeting government mandated safety
standards is difficult and costly because crash worthiness standards
tend to conflict with the need to reduce vehicle weight in order to
meet emissions and fuel economy standards.
The Company’s product development plan is structured to allow it
to develop vehicles which comply with current and expected future
environmental regulations particularly in the United States covered
by the CAFÉ and in other countries such as China.
Intensifying Competition: The global automotive industry
is highly competitive and competition is intense in view of the
continuing globalization and consolidation in the worldwide
automotive industry. Competition is especially likely to increase in
the premium automotive categories as each market participant
intensifies its efforts to retain its position in established markets
while also developing a presence in emerging markets, such as
China. The factors affecting competition include product quality
and features, innovation and time to introduce new product, ability
to control costs, pricing, reliability, safety, fuel economy, customer
service and financing terms.

88
68th ANNUAL REPORT 2012-13
The Company faces strong competition in the Indian market
from domestic as well as foreign automobile manufacturers.
Improving infrastructure and robust growth prospects compared
to other mature markets, have attracted a number of international
companies to India either through joint ventures with local partners
or through independently owned operations in India. International
competitors bring with them decades of international experience,
global scale, advanced technology and significant financial
resources. Consequently, domestic competition is likely to further
intensify in the future.
Exchange and interest rate fluctuations: The Company’s
operations are subject to risk arising from fluctuations in exchange
rates with reference to countries in which it operates.
Exchange fluctuation risks primarily stem from the relative
movements of the GBP, the US dollar, the Euro, the Chinese Yuan,
the Russian Ruble and the Indian Rupee.
In India, the Company imports capital equipment, raw materials and
components from, and also sells its vehicles in various countries.
These transactions are denominated primarily in US dollars, GBP
and Euros. Moreover, the Company has outstanding foreign
currency denominated debt and is sensitive to fluctuations in
foreign currency exchange rates. During the year, the depreciation
of the Indian Rupee against the US dollar adversely impacted the
borrowing cost and consequently, the results of operations.
JLR operations have significant exposure considering the vehicle
sales in the US, Europe and China. In addition, JLR sources a
significant portion of input material from European suppliers.
These transactions are denominated primarily in US dollars and
Euros. Moreover, JLR has outstanding USD denominated debt and
is sensitive to fluctuations in foreign currency exchange rates
Although Tata Motors Group engages in currency hedging in order
to decrease its foreign exchange exposure, adverse exchange
movements could impact the cost of borrowing and consequently
may increase the financing costs, which could have a significant
adverse impact on its results of operations.
Tata Motor Group also has interest-bearing assets (including cash
balances) and interest-bearing liabilities, which earn interest at
variable rates and is therefore exposed to changes in interest rates
in the various markets in which it borrows.
In India, the Company is exposed to increase rates due to macro
economic factors. Apart from increasing borrowing cost, there is
risks of impact on demand for products.
New products, emissions and technology: Intensifying
competition, reducing product life cycles and breadth of the
Company’s product portfolio, necessitates the Company to
continuously invest in new products, upgrades and capacity
enhancement programme. Though the Company employs
sophisticated techniques and processes to forecast the demand of
new products yet the same is subject to margin of error.
Further, the competitors can gain significant advantages if they are
able to offer products satisfying customer needs earlier than the
company is able to and this could adversely impact the Company’s
sales and results of operations. Unanticipated delays or cost
overruns in implementing new product launches, expansion plans
or capacity enhancements could adversely impact the Company’s
results of operations. Timely introduction of new products, their
acceptance in the market place and managing the complexity of
operations across various manufacturing locations, would be the
key to sustain competitiveness.
Customer preferences especially in many of the developed markets
seem to be moving in favour of more fuel efficient vehicles. Further,
in many countries there has been significant pressure on the
automotive industry to reduce carbon dioxide emissions. In many
markets these preferences are driven by increased government
regulation and rising fuel prices. The Company’s operations may be
significantly impacted if there is a delay in developing fuel efficient
products that reflect changing customer preferences, especially
in the premium automotive category. The Company endeavors
to take account of climate protection and the ever more stringent
laws and regulations that have been and are likely to be adopted.
The Company focuses on researching, developing and producing
new drive technologies, such as hybrid engines and electric cars.
The Company is also investing in development programs to
reduce fuel consumption through the use of lightweight materials,
reducing parasitic losses through the driveline and improvements
in aerodynamics.
In addition, the climate debate and promotion of new technologies
are increasingly resulting in the automotive industry’s customers
no longer looking for products only on the basis of the current
standard factors, such as price, design, performance, brand image
or comfort / features, but also on the basis of the technology used
in the vehicle or the manufacturer or provider of this technology.
This could lead to shifts in demand and the value added parameters
in the automotive industry.
One of the Company’s principal goals is to enhance its status as a
leading manufacturer of premium passenger vehicles by investing
89
Management Discussion and
Analysis (66-97)
CORPORATE OVERVIEW FINANCIAL HIGHLIGHTS FINANCIAL STATEMENTSSTATUTORY REPORTS
in products, R&D, quality improvement and quality control. The
Company’s strategy is to maintain and improve its competitive
position by developing technologically advanced vehicles. Over
the years, the Company has enhanced its technological strengths
through extensive in-house R&D activities, particularly through
the Company’s advanced engineering and design centers. These
centralise the Company’s capabilities in product design and
engineering. Further, the Company is pursuing various quality
improvement programmes, both internally and its suppliers’
operations, in an effort to enhance customer satisfaction and reduce
future warranty costs.
Underperformance of distribution channels and supply
chains: The Company products are sold and serviced through
a network of authorized dealers and service centers across
the domestic market, and a network of distributors and local
dealers in international markets. The Company monitors the
performance of its dealers and distributors and provides them
with support to enable them to perform to the expectations. Any
under-performance by the dealers or distributors could adversely
affect the Company’s sales and results of operations.
The Company relies on third parties to supply raw materials, parts and
components used in the manufacture of products. Furthermore, for
some of these parts and components, the Company is dependent
on a single source. The Company’s ability to procure supplies in a
cost effective and timely manner is subject to various factors, some
of which are not within its control. While the Company manages
its supply chain as part of the vendor management process, any
significant problems with supply chain in the future could affect
the results of operations. Impact of natural disasters and man-made
accidents, adverse economic conditions, decline in automobile
demand, lack of access to sufficient financing arrangements, could
have a negative financial impact on the Company’s suppliers and
distributors, in turn impairing timely availability of components, or
increases in costs of components.
In managing a complex supply chain, the Company has developed
close relationships with both direct and indirect suppliers. The
Company continues to develop long-term strategic relationships
with suppliers to support the development of parts, technology
and production facilities.
With respect to JLR operations, as part of a separation agreement
from Ford, the Company entered into supply agreements with
Ford and certain other third parties for critical components. Any
disruption of such transitional services could have a material
adverse impact on the operations and financial condition.
Changes in tax, tariff or fiscal policies and regulations:
Imposition of any additional taxes and levies designed to limit
the use of automobiles could adversely affect the demand for
the Company‘s vehicles and the results of operations. Changes in
corporate and other taxation policies as well as changes in export
and other incentives given by the various governments could
also adversely affect the results of operations. For example, the
Company is availing excise duty exemptions for manufacturing
facilities in the State of Uttarakhand and other incentives in certain
states of India either through subsidies or loans from such states
where it has manufacturing operations. The Government of India
had proposed a comprehensive national goods and services tax, or
GST, regime that will combine taxes and levies by the central and
state governments into one unified rate structure. While both the
Government of India and other state governments of India have
publicly announced that all committed incentives will be protected
following the implementation of the GST, there is no clarity
regarding all aspects of the tax regime following implementation
of the GST. The implementation of this rationalized tax structure
might be affected by any disagreement between certain state
governments, which could create uncertainty. The timelines of the
proposed transition is uncertain at this point of time.
The Direct Tax Code Bill 2010, or DTC, proposes to replace the
existing Income Tax Act, 1961 and other direct tax laws, with a view
to simplify and rationalize the tax provisions into one unified code.
The various proposals included in DTC bill are subject to review by
Indian parliament and as such impact if any, is not quantifiable at
this stage.
Further, Brazil has recently increased import duty for foreign build
vehicles which has impacted margins. The Company is considering
a number of options to counter this issue, including discussions
with the Brazilian government to exempt a number of imported
vehicles from the increased tariff.
Political instability, wars, terrorism, multinational conflicts,
natural disasters, fuel shortages / prices, epidemics, labour
strikes: The Company’s products are exported to a number
of geographical markets and the Company plans to expand
international operations further. Consequently, the Company is
subject to various risks associated with conducting the business
both within and outside the domestic market and the operations
may be subject to political instability, wars, terrorism, regional and /
or multinational conflicts, natural disasters, fuel shortages, epidemics
and labour strikes. In addition, conducting business internationally,
especially in emerging markets, exposes the Company to additional

90
68th ANNUAL REPORT 2012-13
risks, including adverse changes in economic and government
policies, unpredictable shifts in regulation, inconsistent application
of existing laws and regulations, unclear regulatory and taxation
systems and divergent commercial and employment practices
and procedures
Product liability, warranty and recall: The Company is subject
to risks and costs associated with product liability, warranties and
recalls, should the Company supply defective products, parts,
or related after-sales services, including by generating negative
publicity, which may adversely affect the Company’s business,
results of operations and financial conditions. Such events also
require the Company, expend considerable resources in correcting
these problems and could adversely affect the demand for the
products. Furthermore, the Company may also be subject to class
actions or other large scale product liability or other lawsuits in
various jurisdictions in which it has a significant presence.
Jaguar Land Rover Pension obligations: The Company
provides post-retirement and pension benefits to its employees,
some of which are defined benefit plans. The pension liabilities
are generally funded and the pension plan assets are particularly
significant. The Company has stopped the JLR defined benefit
pension plan to new joiners as at April 19, 2010. All new employees
in the operations from April 19, 2010, have joined a new defined
contribution pension plan.
Lower return on pension fund assets, changes in market conditions,
changes in interest rates, changes in inflation rates and adverse
changes in other critical actuarial assumptions, may impact its
pension liabilities and consequently increase funding requirements,
which will adversely affect the Company’s financial condition and
results of operations.
Automobile financing business and selling arrangements:
The Company is subject to risks associated with its automobile
financing business carried out by its subsidiary Tata Motor Finance
Ltd. Any defaults by the customers or inability to repay installments
as due, could adversely affect the business, results of operations and
cash flows. In addition, any downgrades in the Company’s credit
ratings may increase the borrowing costs and restrict the access
to the debt markets. Over time, and particularly in the event of
any credit rating downgrades, market volatility, market disruption,
regulatory changes or otherwise, the Company may need to reduce
the amount of financing receivables it originates, which could
adversely affect the ability to support the sale of vehicles.
Further, JLR offers residual value guarantees on the purchase of
certain vehicles in some markets. The value of these guarantees is
dependent on used car valuations in those markets at the end of
the lease, which is subject to change. Consequently, the Company
may be adversely affected by movements in used car valuations in
these markets. Also, JLR has arrangements in place with FGA Capital,
a joint venture between Fiat Auto and Credit Agricole (FGAC) for the
UK and European consumer finance, Chase Auto Finance in North
America, and has similar arrangements with local providers in a
number of other key markets. The Company works closely with its
commercial finance providers to minimize the risk around residual
values which in turn reduces the level of lease subvention.
Labour unrest: The Company’s permanent employees, other
than officers and managers, in India and most of the permanent
employees in South Korea and the United Kingdom, including
certain officers and managers, in relation to automotive business,
are members of labour unions. They are covered by wage
agreements, where applicable with those labour unions.
In general, the Company considers labour relations with all of
employees to be good. However, in the future the Company may be
subject to labour unrest, which may delay or disrupt the operations
in the affected regions, including the acquisition of raw materials
and parts, the manufacture, sales and distribution of products
and the provision of services. If work stoppages or lock-outs at the
facilities or at the facilities of the major vendors occur or continue
for a long period of time, the business, financial condition and
results of operations may be adversely affected.
JLR operations in key mature market: JLR, which contributes
approximately 72% of the Company’s consolidated revenues, has
a significant presence in the United Kingdom, North American,
continental European markets and China. The global economic
downturn significantly impacted the automotive industry in
FY 2008-09. Even though sales of passenger cars were aided by
government-sponsored car-scrap incentives, these incentives
primarily benefited the compact and micro-compact car segments
and had virtually no slowing effect on the sales declines in the
premium car or all-terrain vehicle segments, in which JLR operates.
Although demand in these markets has recovered strongly, any
decline in demand for the Company’s vehicles in these major
markets may in the future significantly impair the Company’s
business, financial position and results of operations. The strategy,
which includes new product launches and expansion into growing
markets, such as China, India, Russia and Brazil, may not be sufficient
to mitigate a decrease in demand for the Company’s products in
mature markets in the future.

91
Management Discussion and
Analysis (66-97)
CORPORATE OVERVIEW FINANCIAL HIGHLIGHTS FINANCIAL STATEMENTSSTATUTORY REPORTS
Growing business through mergers and acquisitions: The
Company believes that its acquisitions provide opportunities to
grow significantly in the global automobile markets by offering
premium brands and products. The acquisitions have provided
access to technology and additional capabilities while also offering
potential synergies. However, the scale, scope and nature of the
integration required in connection with acquisitions, present
significant challenges, and the Company may be unable to integrate
the relevant subsidiaries, divisions and facilities effectively within our
expected schedule. An acquisition may not meet the Company’s
expectations and the realization of the anticipated benefits may be
blocked, delayed or reduced as a result of numerous factors, some
of which are outside the Company’s control.
The Company will continue to evaluate growth opportunities
through suitable mergers and acquisitions in the future. Growth
through mergers and acquisitions involves business risks, including
unforeseen contingent risks or latent business liabilities that may
only become apparent after the merger or acquisition is completed.
The key success factors will be seamless integration and effective
management of the merged/acquired entity, retention of key
personnel, and generating cash flow from synergies in engineering
and sourcing, joint sales and marketing efforts, and management
of a larger business.
Business is seasonal in nature: The sales volumes and prices
for the Company’s vehicles are influenced by the cyclicality and
seasonality of demand for these products. In the Indian market,
demand for vehicles generally peaks between January and
March, although there is a decrease in demand in February just
before release of the Indian fiscal budget. Demand is usually lean
from April to July and picks up again in the festival season from
September onwards, with a decline in December due to year-end.
The automotive industry has been cyclical in the past and this
cyclicality is likely to continue.
JLR business is impacted by the bi-annual registration of vehicles
in the UK where the vehicle registration number changes every
six months, which in turn has an impact on the resale value of
vehicles. This leads to an increase in sales during the period when
the aforementioned change occurs. Most other markets such
as the United States are driven by introduction of new model
year products which typically occurs in the autumn of each year.
Furthermore, western European markets tend to be impacted by
the summer and winter holidays. Markets in China tend to show
higher demand for vehicles around the Chinese New Year. The
resulting sales profile influences operating results on a quarter-
to-quarter basis.
Inability to protect or preserve intellectual property: With
respect to JLR, the Company owns or otherwise has rights to a
number of patents relating to the products we manufacture, which
have been obtained over a period of years. In connection with the
design and engineering of new vehicles and the enhancement
of existing models, the Company seeks to regularly develop new
technical designs for use in its vehicles. The Company also uses
technical designs which are the intellectual property of third parties
with such third parties’ consent. These patents and trademarks have
been of value in the growth of the business and may continue to
be of value in the future. Although the Company does not regard
any of its businesses as being dependent upon any single patent
or related group of patents, an inability to protect this intellectual
property generally, or the illegal breach of some or a large group
of our intellectual property rights, would have a materially adverse
effect on the Company’s operations, business and / or financial
condition. The Company may also be affected by restrictions on
the use of intellectual property rights held by third parties and it
may be held legally liable for the infringement of the intellectual
property rights of others in its products.
Inability to manage growing international business: The
Company’s growth strategy relies on the expansion of its operations
by introducing certain automotive products in other parts of
the world, including Europe, China, Russia, Brazil, the US, Africa,
and other parts of Asia. The costs associated with entering and
establishing in new markets, and expanding such operations,
may be higher than expected, and the Company may face
significant competition in those regions. In addition, the Company’s
international business is subject to many actual and potential risks
and challenges, including language barriers, cultural differences
and other difficulties in staffing and managing overseas operations,
inherent difficulties and delays in contract enforcement and the
collection of receivables under the legal systems of some foreign
countries, the risk of non-tariff barriers, other restrictions on foreign
trade or investment sanctions, and the burdens of complying with
a wide variety of foreign laws and regulations.
Insurance coverage may not be adequate to protect us
against all potential losses: While the Company believes that
the insurance coverage that it maintain is reasonably adequate to
cover all normal risks associated with the operation of business.
To the extent that the Company, suffer loss or damage that is not
covered by insurance or which exceeds our insurance coverage,
the Company’s financial condition may be affected.
Manufacturing and engineering: The Company has
manufacturing facilities and design and engineering centres,

92
68th ANNUAL REPORT 2012-13
located in India, the UK, South Korea, Thailand, Spain and South
Africa and have established a presence in Indonesia. The Company
could experience disruption to its manufacturing, design and
engineering capabilities for a variety of reasons, including,
among others, extreme weather, fire, theft, system failures, natural
calamities, mechanical or equipment failures and similar risks. Any
significant disruptions could adversely affect the Company’s ability
to design, manufacture and sell the Company’s products and, if any
of those events were to occur, the Company cannot be certain that
the Company would be able to shift its design, engineering and
manufacturing operations to alternative sites in a timely manner
or at all. Any such disruption could therefore materially affect the
company’s business, financial condition or results of operations.
Regulation of production facilities: The Company’s production
facilities are subject to a wide range of environmental, health and
safety requirements. These requirements address, among other
things, air emissions, wastewater discharges, accidental releases
into the environment, human exposure to hazardous materials,
storage, treatment, transportation and disposal of wastes and
hazardous materials, investigation and cleanup of contamination,
process safety and maintenance of safe conditions in the workplace.
Many of the Company’s operations require permits and controls
to monitor or prevent pollution. The Company has incurred, and
will continue to incur, substantial on-going capital and operating
expenditures to ensure compliance with current and future
environmental, health and safety laws and regulations or their more
stringent enforcement. Other environmental, health and safety laws
and regulations could impose restrictions or onerous conditions on
the availability or the use of raw materials the company need for the
company’s manufacturing process. The Company’s manufacturing
process results in the emission of greenhouse gases such as carbon
dioxide.
For JLR operations, the EU Emissions Trading Scheme, an EU-wide
system in which allowances to emit greenhouse gases are issued
and traded, is anticipated to cover more industrial facilities and
become progressively more stringent over time, including by
reducing the number of allowances that will be allocated free of
cost to manufacturing facilities. In addition, a number of further
legislative and regulatory measures to address greenhouse gas
emissions, including national laws and the Kyoto Protocol, are in
various phases of discussion or implementation. These measures
could result in increased costs to: (i) operate and maintain the
Company’s production facilities; (ii) install new emissions controls;
(iii) purchase or otherwise obtain allowances to emit greenhouse
gases; and (iv)administer and manage the Company’s greenhouse
gas emissions programme.
Inability to attract and retain skills: The Company believes that
the Company’s growth and future success depend largely on the
skills of the Company’s workforce, including executives and officers,
as well as the designers and engineers and the attraction of critical
skills. The loss of the services of one or more of these employees
could impair the Company’s ability to continue to implement its
business strategy. The Company’s success also depends, on its
continued ability to attract and retain experienced and qualified
employees, particularly qualified engineers with expertise in
automotive design and production. In view of intense competition,
the Company’s inability to continue to attract, retain and motivate
employees could adversely affect its business and plans to invest
in the development of new designs and products.
OUTLOOK
While the start of the new fiscal has continued from the moderate
performance of last year, there is a cautious optimism that FY 2013-
14 would see the start of the revival in the global and domestic
economies. The Indian economy is also expected to look up
marginally from growth in GDP of 5% in the last year.
Within the market however, there are certain segments which
would react quicker to a revival in sentiment than others. The
M&HCV segment would recover later than others and is expected
to see an upswing only after a few more conscious monetary and
fiscal policy moves from the Government and RBI, as well as growth
in infrastructure projects spending.
While current account deficit and fiscal deficit will continue to
be priorities for the Government, striking a balance between
controlling expenditure and encouraging growth will be key for
this year.
On the background of pressure on volumes in India and limited
headroom in pricing due to the intensely competitive market
dynamics, the focus will be on effective cost management- both
direct and indirect to maintain margins. Even in this challenging
environment, as envisioned in its Mission statement, the Company
is looking to ‘passionately anticipate’ and provide vehicles and
solutions that ‘excite customers globally’. The objective remains to
be the ‘most admired’ Company by all our stakeholders.
One of the key elements of this strategy would be to improve the
relationship with the customer – the experience the customer has
with the Company at each touch point from sale to service and
replacement sales experiences. This would include improving the

93
Management Discussion and
Analysis (66-97)
CORPORATE OVERVIEW FINANCIAL HIGHLIGHTS FINANCIAL STATEMENTSSTATUTORY REPORTS
physical look of the setup, setting up right processes and forums
for speedy resolution of customer issues.
The Company will also actively pursue growth in the right
International markets and look to consolidate its position in markets
where it is already present.
While Europe remains uncertain in the short term, JLR will continue
to focus on growth from other markets, in particular the emerging
markets. With entry been established in China last year, growing and
consolidating presence in this market would be key to JLR’s strategy
for the coming year. Investment in new products and technologies
along with enhancing capacity as required in the right geographies
would continue for both Jaguar and Land Rover.
INTERNAL CONTROL SYSTEMS AND THEIR ADEQUACY
The Company has an adequate system of internal controls in
place. It has documented procedures covering all financial and
operating functions. These controls have been designed to provide
a reasonable assurance with regard to maintaining of proper
accounting controls, monitoring of operations, protecting assets
from unauthorized use or losses, compliances with regulations
and for ensuring reliability of financial reporting. The Company
has continued its efforts to align all its processes and controls with
global best practices in these areas as well.
Some significant features of the internal control of systems are:
� Preparation and monitoring of annual budgets for all operating
and service functions;
� State-of-the-art ERP, Supplier Relations Management and
Customer Relations Management, connect its different
locations, dealers and vendors for efficient and seamless
information exchange;
� An on-going program for reinforcement of the Tata Code of
Conduct. The Code covers integrity of financial reporting,
ethical conduct, regulatory compliance, conflict of interests
review and reporting of concerns.
� A well-established multi-disciplinary Internal Audit team,
which reviews and reports to management and the Audit
Committee about the compliance with internal controls and
the efficiency and effectiveness of operations and the key
process risks. The scope and authority of the Internal Audit
division is derived from the Audit Charter approved by the
Audit Committee;
� Audit Committee of the Board of Directors, comprising
independent directors, which is functional since August 1988,
regularly reviews the audit plans, significant audit findings,
adequacy of internal controls, compliance with Accounting
Standards as well as reasons for changes in accounting policies
and practices, if any;
� A comprehensive information security policy and continuous
upgrades to IT system;
� Documenting of major business processes and testing thereof
including financial closing, computer controls and entity level
controls. as part of compliance programme towards Sarbanes-
Oxley Act, as required by the listing requirements at New York
Stock Exchange;
� Anti-fraud programmes.
The Board takes responsibility for the overall process of risk
management in the organisation. Through an Enterprise
Risk Management programme, each Business Unit addresses
opportunities and the attendant risks through an institutionalized
approach aligned to the Company’s objectives. This is also facilitated
by internal audit. The business risk is managed through cross
functional involvement and communication across businesses.
The results of the risk assessment and residual risks are presented
to the senior management. The Audit Committee reviews reports
covering operational, financial and other business risk areas.
HUMAN RESOURCES / INDUSTRIAL RELATIONS
Tata Motor’s Group considers its human capital as a critical factor to
its success. Under the aegis of Tata Sons and the Tata Sons promoted
entities, the Company has drawn up a comprehensive human
resource strategy (the “Human Resource” strategy) which addresses
key aspects of human resource development such as:
� Code of conduct and fair business practices.
� A fair and objective performance management system
linked to the performance of the businesses which identifies
and differentiates high performers while offering separation
avenues for non-performers.
� Creation of a common pool of talented managers across
Tata Sons and the Tata Sons promoted entities with a view
to increasing their mobility through inter-company job
rotation.
� Evolution of performance based compensation packages to
attract and retain talent within Tata Sons and the Tata Sons
promoted entities.
� Development of comprehensive training programs to
impart and continuously upgrade the industry/function
specific skills.
In line with the Human Resource strategy, the Company, in

94
68th ANNUAL REPORT 2012-13
turn, has implemented various initiatives in order to build
organizational capability that will enable the Company to sustain
competitiveness in the global market place. The focus is to attract
talent, retain the better and advance the best. Some of the
initiatives to meet this objective include:
� Extensive process mapping exercise to benchmark and align
the human resource processes with global best practices.
� Introduction of a globally benchmarked employee
engagement programme.
� Succession planning through identification of second level of
managers for all units, locations, functions.
� Implementation of a “Fast Track Selection Scheme”, which is a
system for identifying potential talent in the areas of general,
commercial and operations management and offering
them opportunities for growth within the organization.
The Company’s human resources team has been invited to
replicate this system in other Tata Companies.
� The Company “Talent Management Scheme” which includes
the identification of high performers and high potentials
through various routes such as our Performance Management
System and Development Centers. Subsequent to the
identification process, we provide them with challenging
assignments for faster development.
� Introduction of performance rating based salary review
and quality linked variable payment for supervisory
category of employees.
� Restructuring the top level organization and creation of new
verticals for greater functional focus and moving towards
creating a matrix organization.
� Creation of a powerful employer brand to attract talent - “Lead
the Future” has become the Company’s Employee Value
Proposition statement.
� Driving cultural transformation - The Company has reframed
the mission, vision, values and culture of the organization and
introduced the concept of ACES - Accountability, Customer
& Product focus, Excellence and Speed.
� Extensive brand building initiatives at university campuses to
increase recruiting from premium universities.
� JLR launched a new “Team Talk Online” portal to its production
workers, which provides them with business updates
alongside information on employee benefits, training and
development.
We employed approximately 62,716 and 58,618 (includes Tata
Motor Group) permanent employees as of March 31, 2013 and
2012 respectively. The average number of temporary employees
for the FY 2012-13, was approximately 39,009.
The following table set forth a breakdown of persons employed
by our business segments and by geographic location as of
March 31, 2013.
Segment No. of Employees
Automotive 56,393
Other 6,323
Total 62,716
Location No. of Employees
Location 41,597
Abroad 21,119
Total 62,716
Training and Development: The Company is committed to
building the competencies of its employees and improving their
performance through training and development. The Company
focus is on identifying gaps in its employees’ competencies and
preparing employees for changes in competitive environments,
as well as to meet organizational challenges.
Some of the focus areas in training in the last year centered on
leadership, innovation management and internationalization
besides other training programmes to drive a change in the
Company’s employees’ outlook as it continue to develop as a
global competitor. Developmental initiatives for the Company’s
senior leadership were undertaken through international
programs at various premier institutions around the world.
Certain employees have also been selected for the Fulbright
fellowships for leadership in management. In addition, in
order to emphasize the sharing of skills across our locations
and functions extensive technical training programs were
organized in Pune, Jamshedpur and Lucknow. The technical
exposure was enhanced further through international training
and participation at international seminars.
At Jamshedpur, Pune and Lucknow in India, the Company has
also established training divisions that impart basic skills in various
trades like milling, grinding and welding to its young apprentices.
The Company received the National Best Training Establishment
award from the Government of India for the eighth time.

95
Management Discussion and
Analysis (66-97)
CORPORATE OVERVIEW FINANCIAL HIGHLIGHTS FINANCIAL STATEMENTSSTATUTORY REPORTS
The Tata Motors Academy has created a couple of path-breaking
branded initiatives in the Learning and Development space.
“iTeach” which was created as an innovative practice of getting
line managers to take ownership in sharing their knowledge and
experience gained a lot of traction. The Company has switched to
e-enabled learning through LMS (Learning Management System).
Programs like “Autonova”, “Project Leap” were introduced in the
last fiscal.
JLR launched a new Higher Apprenticeship programme offering
55 places this year in key pathways, in addition to its current
intermediate and advanced apprenticeship portfolio, which
currently has over 1,500 apprentices on programme in 2012. JLR
has excelled in its rating movement in the Times Top 100 Graduate
Employers, moving from 60th ranking in 2011 to 26th in 2012. This
was then followed by a move in the Guardian Top 300 Graduate
Employers from a position of 127th in 2011 to 30th in 2012.
Union Wage Settlements: All employees in India belonging
to the operative grades are members of labor unions except
at Sanand & Dharwad plants. The Company has generally
enjoyed cordial relations with its employees at its factories
and offices.
Employee wages are paid in accordance with wage agreements
that have varying terms (typically three years) at different locations.
The expiration dates of the wage agreements with respect to
various locations/subsidiaries are as follows:
Location/subsidiaries Wage Agreement valid until
Pune CVBU August 31, 2015
Pune PCBU March 31, 2013*
Jamshedpur March 31, 2013*
Mumbai December 31, 2015
Lucknow March 31, 2014
Pantnagar March 31, 2015
Jaguar Land Rover October 31, 2014
Tata Hispano December 31, 2012*
*Under negotiation
A cordial industrial relations environment has been maintained in
all the Company’s manufacturing units.
The variability in wage settlements was built in by introducing
vehicles and profit linked payment scheme based on the index of
various parameters such as quality, productivity, operating profit
and individual’s performance and attendance.
Operatives and Union support in implementation of programmes
towards quality, cost and productivity improvements across all
locations is commendable.
TDCV Union Employees had filed a lawsuit against TDCV in March
2011, for including some elements of non- ordinary salary and
bonus as part of ordinary wages. The District Court gave a judgment
in their favour on January 2013, and raised a demand on TDCV for
the period December 2007 to May 2011, for KRW 17.2 billion and
interest for the unpaid period. TDCV has filed an appeal to the High
Court against the order.
RESEARCH AND DEVELOPMENT:
Over the years, the Company has devoted significant resources
towards our research and development activities. The Company’s
research and development activities focus on product development,
environmental technologies and vehicle safety. The Company’s
Engineering Research Centre, or ERC, established in 1966, is
one of the few in-house automotive research and development
centers in India recognized by the government. ERC is integrated
with all of the Tata Motors Global Automotive Product Design
and Development Centers in South Korea, Spain, Italy and the
United Kingdom. In addition to this, the Company leverages key
competencies through various engineering service suppliers and
design teams of its suppliers.
The Company has a state of the art crash test facility for evaluating
occupant safety. The Company has a full vehicle level crash test
facility, sled test facility for simulating the crash environment
on subsystems, a pedestrian safety testing facility, a pendulum
impact test facility for goods carrier vehicles. This facility is also
supported with CAE Infrastructure to simulate tests in digital
environment. The Company has a hemi-anechoic chamber
testing facility for developing vehicles with lower noise and
vibration levels and an engine emission and performance
development facilities, to develop products meeting international
standards. The Company also has an eight poster road load
simulator for vehicle structural durability validation of M&HCV.
Other key facilities include a full vehicle environmental testing
facility, heavy duty dynamometers and aggregate endurance
test rigs.
The Company’s product design and development centers are
equipped with sophisticated hardware, software and other
information technology infrastructure, designed to create a
digital product development and virtual testing and validation
environment, resulting in reduction of product development cycle-
time. These centers are growing with increased vehicle development

96
68th ANNUAL REPORT 2012-13
programs in breadth and depth of technology. Rapid prototype
development systems, testing cycle simulators, advanced
emission test laboratories and styling studios are also a part
of our product development infrastructure. The Company
has aligned our end-to-end digital product development
objectives and infrastructure, with its business goals and have
made significant investments to enhance the capabilities
especially in the areas of product development through
Computer Aided Design / Computer Aided Manufacturing /
Computer Aided Engineering / Knowledge Based Engineering
/ Product Lifecycle Management and specific engineering
review processes like Digital Mockup (DMU). In order to track
various issues arising in vehicle design and development
processes, the Company has institutionalized ‘issue tracking’
work flow based systems in various domains to manage them
effectively.
The Company’s research and development activities also focus
on developing vehicles running on alternative fuels, including
CNG, liquefied petroleum gas, bio-diesel and compressed air
and electric cars. The Company is continuing to develop green
vehicles. The Company is pursuing alternative fuel options
such as ethanol blending for development of vehicles fuelled
by hydrogen.
The Company is also pursuing various initiatives, such as the
introduction of Premium Lightweight Architecture (PLA), to
enable its business to comply with the existing and evolving
emissions legislations in the developed world, which it
believes will be a key enabler of both reduction in CO2 and
further efficiencies in manufacturing and engineering.
Initiatives in the area of vehicle electronics such as engine
management systems, in-vehicle network architecture
and Multiplexed Wiring, Electronic Stability programs,
Automated and Automatic transmission systems, telematics
for communication and tracking and other emerging
technological areas are also being pursued, which could
possibly be deployed on our future range of vehicles. Likewise
various new technologies and systems that would improve
safety, performance and emissions of our product range are
under implementation on our passenger cars and commercial
vehicles.
For providing prompt service to the customer, development
of enterprise level vehicle diagnostics system for achieving
speedy diagnostics of complex electronics of modern vehicles
has been underway. Also the initiative in telematics has further
spanned into a fleet management, driver information and navigation
systems, and vehicle tracking system using GNSS (Global Navigation
Satellite Systems).
The Company established a wholly owned subsidiary, TMETC, in
2006, to augment the abilities of its Engineering Research Centre
with an objective to obtain access to leading-edge technologies
to support the product development activities. In October 2010,
the Company also acquired a design house in Italy, Trilix Srl, that
has been working with the Company on many of its projects and
are now a part of Tata Motors Design organization.
The Company endeavors to absorb the best of technologies for its
product range to meet the requirements of a globally competitive
market. All of its vehicles and engines are compliant with the
prevalent regulatory norms in the respective countries in which
they are sold. The Company’s strategy to invest and develop its
development capabilities have helped the Company in attaining
significant achievements such as the design and development
of India’s first indigenously developed compact car, the segment
creating mini- truck – the ‘Tata Ace’ and the world’s most affordable
family car — the Tata Nano. In collaboration with its subsidiary TDCV,
the Company developed the “World Truck”, now referred to as ‘Prima’,
a sophisticated and contemporary M&HCV range with performance
standards similar to those in developed markets.
JLR’s vehicles are designed and developed by award-winning
design teams, and it is committed to a programme of regular
enhancements in product design. JLR’s two design and
development centres are equipped with computer-aided design,
manufacturing and engineering tools, and are configured for
competitive product development cycle time and efficient data
management. In recent years, JLR has refreshed the entire Jaguar
range under a unified concept and design language and continued
to enhance the design of Land Rover’s range of all-terrain vehicles.
JLR’s R&D operations look for synergies through sharing premium
technologies, powertrain designs and vehicle architecture. All of
JLR’s products are designed and engineered primarily in the United
Kingdom. JLR endeavours to implement the best technologies
into its product range to meet the requirements of a globally
competitive market. JLR is currently developing vehicles which will
run on alternative fuels and hybrids and is also investing in other
programmes for the development of technologies to improve the
environmental performance of its vehicles including the reduction
of CO2 emissions.
INTELLECTUAL PROPERTY
The Company creates, owns, and maintains a wide array of

97
Management Discussion and
Analysis (66-97)
CORPORATE OVERVIEW FINANCIAL HIGHLIGHTS FINANCIAL STATEMENTSSTATUTORY REPORTS
intellectual property assets that are among its valuable assets
throughout the world. The Company’s intellectual property
assets include patents, trademarks, copyrights designs, trade
secrets and other intellectual property rights. Patents relate
to innovations and products; trademarks secured relate to
brands and products; copyrights are secured for creative
content; and designs are secured for aesthetic features
of products/components. The Company proactively and
aggressively seeks to protect its intellectual property in India
and other countries.
The Company owns a number of patents and has applied
for new patents which are pending for grant in India as well
as in other countries. It has also filed a number of patent
applications outside India under the Patent Cooperation
Treaty, which will be effective in different countries going
forward. The Company obtains new patents as part of our
ongoing research and development activities.
The Company own registrations for number of trade-
marks and have pending applications for registration of
these in India as well as other countries. The registrations
mainly include trademarks for its vehicle models and other
promotional initiatives. The Company uses the “Tata” brand,
which has been licensed to us by Tata Sons Limited. The
Company’s believes that establishment of the “Tata” word
mark and logo mark in India and world over, is material to our
operations. As part of acquisition of TDCV, the Company has
the perpetual and exclusive use of the “Daewoo” brand and
trademarks in Korea and overseas markets for the product
range of TDCV.
As part of the acquisition of Jaguar Land Rover business,
ownership /co-ownership of core intellectual property were
transferred to the Company. Additionally, perpetual royalty
free licenses to use other essential intellectual properties have
been licensed to the Company for use in Jaguar and Land
Rover vehicles. Jaguar and Land Rover own registered designs,
to protect the design of their vehicles in several countries.
In varying degrees, all its intellectual property is important
to the Company. In particular, the Tata brand is integral to
the conduct of our business, a loss of which could lead to
dilution of our brand image and have a material adverse
effect on our business.
CAUTIONARY STATEMENT
Statements in the Management Discussion and Analysis
describing the Company’s objective, projections, estimates, expectations may be “forward-looking statements” within the meaning of applicable securities laws and regulations. Actual results could differ materially from those expressed or implied. Important factors that could make a difference to the Company’s operations include, among others, economic conditions affecting demand /supply and price conditions in the domestic and overseas markets in which the Company operates, changes in the Government regulations, tax laws and other statutes and incidental factors.

68th ANNUAL REPORT 2012-13
98
COMPANY’S PHILOSOPHY ON CORPORATE GOVERNANCE
TATA’s principal purpose is to improve the quality of life of the
communities it serves. The values and ideals, the way that it
functions, helps it do that. As a Tata Company, the Company’s
philosophy on Corporate Governance is founded upon a rich legacy
of fair, ethical and transparent governance practices, many of which
were in place even before they were mandated by adopting highest
standards of professionalism, honesty, integrity and ethical behavior.
As a global organization, the Corporate Governance practices
followed by the Company and its subsidiaries are compatible with
international standards and best practices. Through the Governance
mechanism in the Company, the Board along with its Committees
undertakes its fiduciary responsibilities to all its stakeholders by
ensuring transparency, fairplay and independence in its decision
making.
The Corporate Governance philosophy is further strengthened with
the adherence to the Tata Business Excellence Model as a means to
drive excellence, the Balanced Scorecard methodology for tracking
progress on long term strategic objectives and the Tata Code of
Conduct which articulates the values, ethics and business principles
and serves as the ethical road map for the Company, its directors
and employees supplemented with an appropriate mechanism
to report any concern pertaining to non-adherence to the said
Code. The Company is in full compliance with the requirements of
Corporate Governance under Clause 49 of the Listing Agreement
with the Indian Stock Exchanges (“the Listing Agreement”). The
Company’s Depositary Programme is listed on the New York Stock
Exchange and the Company also complies with US regulations as
applicable to Foreign Private Issuers (non-US listed companies)
which cast upon the Board of Directors and the Audit Committee,
onerous responsibilities to improve the Company’s operating
efficiencies. Risk management and internal control processes focus
areas continue to meet the progressive governance standards.
As a good corporate governance practice, the Company has
voluntarily undertaken an Audit by M/s Parikh & Associates,
Practising Company Secretaries, of the secretarial records and
documents for the period under review in respect of compliance
with the Companies Act, 1956 (“The Act”), Listing Agreement with
the Indian Stock Exchanges and the applicable regulations and
guidelines issued by Securities and Exchange Board of India.
BOARD OF DIRECTORS
The Board of Directors alongwith its Committees provides
REPORT ON CORPORATE GOVERNANCE
leadership and guidance to the Company’s management and
directs, supervises and controls the performance of the Company.
The Board currently comprises of twelve Directors out of which
nine Directors (75%) are Non Executive Directors. The Company
has a Non Executive Chairman and the six Independent Directors
comprise at least one half of the total strength of the Board. All
the Independent Directors have confirmed that they meet the
‘independence’ criteria as mentioned under Clause 49 of the Listing
Agreement.
None of the Directors on the Company’s Board is a Member of more
than ten Committees and Chairman of more than five Committees
(Committees being, Audit Committee and Investors’ Grievance
Committee) across all the Indian Public limited companies in which
he is a Director. All the Directors have made necessary disclosures
regarding Committee positions held by them in other companies
and do not hold the office of Director in more than fifteen public
companies. None of the Directors of the Company are related
to each other. All Non Executive Directors, excluding the ‘Steel
Director’ (Tata Steel representative), are liable to retire by rotation.
The appointment of the Managing Director and Executive Directors
including the tenure and terms of remuneration are also approved
by the members at the first meeting after their appointment.
The required information as enumerated in Annexure IA to Clause
49 of the Listing Agreement is made available to the Board of
Directors for discussions and consideration at Board Meetings.
The Board reviews the declaration made by the Managing Director
regarding compliance with all applicable laws on a quarterly basis
as also steps taken to remediate instances of non-compliance.
The Managing Director and the Chief Financial Officer (CFO) have
certified to the Board in accordance with Clause 49 V of the Listing
Agreement pertaining to CEO and CFO certification for the Financial
Year ended March 31, 2013.
During the year under review, nine Board Meetings were held
on April 10, 2012, May 29, 2012, July 13, 2012, August 9, 2012,
October 16, 2012, November 7, 2012, December 13, 2012, February
14, 2013 and March 28, 2013. The maximum time-gap between
any two consecutive meetings did not exceed four months. The
composition of the Board, attendance at Board Meetings held
during the Financial Year under review and at the last Annual
General Meeting, number of directorships (including Tata Motors),
memberships/chairmanships of the Board and Committees of
public companies and their shareholding as on March 31, 2013 in
the Company are as follows:

Corporate Governance (98-114)
99
CORPORATE OVERVIEW FINANCIAL HIGHLIGHTS FINANCIAL STATEMENTSSTATUTORY REPORTS
Name of the
Director
Director
Identification
Number
CategoryNo. of Board
Meetings
attended
in the year
Attendance
at the
last AGM
Directorships(1) Committee positions(2) Shareholding(12)
Chairman Member Chairman Member Ordinary Shares ‘A’ Ordinary Shares
Ratan N Tata(3)(10) 00000001 Chairman Emeritus 7 Yes - - - - 1361730 109180
Cyrus P Mistry(4) 00010178 Non Executive, Chairman 7 Yes 10 1 - 1 - -
Ravi Kant 00016184 Non Executive, Vice Chairman
9 Yes 2 2 - 1 - -
N N Wadia 00015731 Non Executive, Independent 8 Yes 4 4 - - - -
S M Palia(5)(10) 00031145 Non Executive, Independent 9 Yes - 7 2 5 1500 12500
R A Mashelkar 00074119 Non Executive, Independent 8 Yes - 7 - 4 - -
S Bhargava 00035672 Non Executive, Independent 8 Yes 2 6 2 3 - -
N Munjee 00010180 Non Executive, Independent 8 Yes 3 12 5 4 - -
V K Jairath 00391684 Non Executive, Independent 9 Yes - 1 - 2 250 -
Ralf Speth 03318908 Non Executive 7 Yes - 1 - - - -
Karl Slym(6) 01875188 Managing Director 5 NA - 3 - 1 - -
Ravindra Pisharody(11)
01875848 Executive Director (Commercial Vehicles)
7 Yes - 5 - - - 50
Satish B Borwankar(11)
01793948 Executive Director (Quality) 7 Yes - 7 - 1 710 -
R Sen(7)(10) 03043868 Non Executive, Independent 4 Yes - - - - - -
P M Telang(8)(10) 00012562 Managing Director – India Operation
2 NA - - - - 6600 11000
Details of Additional Director appointed after March 31, 2013 is as under:
Falguni Nayar(9) 00003633 Non Executive, Independent NA NA - 1 - 2 - -
(1) excludes alternate directorship and directorship in private companies, foreign companies, associations and section 25 companies
(2) includes only Audit and Investors’ Grievance Committees
(3) ceased to be a Director and Chairman w.e.f. December 28, 2012. The Board of Directors designated him as “Chairman Emeritus.”
(4) appointed as Non Executive Director w.e.f May 29, 2012 and appointed as Chairman w.e.f. December 28, 2012. He is also the ‘Steel Director’ w.e.f. March 28, 2013.
(5) stepped down as Director w.e.f. April 25, 2013, in accordance with the Company’s retirement policy
(6) appointed as Managing Director w.e.f. September 13, 2012
(7) stepped down as Director w.e.f. October 16, 2012
(8) stepped down as Managing Director- India Operations w.e.f. June 21, 2012
(9) appointed as Non Executive, Independent Director w.e.f. May 29, 2013
(10) the memberships/chairmanships of the Board and Committees of public companies and shareholding are as of the date when they ceased to be the Directors
(11) appointed as Executive Directors w.e.f. June 21, 2012
(12) Shareholding as on March 31, 2013 / date of cessation
THE COMMITTEES OF THE BOARD
The Board has constituted a set of Committees with specific terms
of reference/scope to focus effectively on the issues and ensure
expedient resolution of diverse matters. The Committees operate
as empowered agents of the Board as per their Charter/terms of
reference. Targets set by them as agreed with the management
are reviewed periodically and mid-course corrections are also
carried out. The Board of Directors and the Committees also take
decisions by circular resolutions which are noted at the next
meeting. The minutes of meetings of all Committees of the Board
are placed before the Board for discussions/noting.

68th ANNUAL REPORT 2012-13
100
AUDIT COMMITTEE
The Audit Committee functions according to its Charter that
defines its composition, authority, responsibility and reporting
functions in accordance with the Act, listing requirements and
US regulations applicable to the Company and is reviewed from
time to time. Whilst, the full Charter is available on the Company’s
website, given below is a gist of the responsibilities of the Audit
Committee:
a. Reviewing the quarterly financial statements before
submission to the Board, focusing primarily on:
� Compliance with accounting standards and changes in
accounting policies and practices;
� Major accounting entries involving estimates based on
exercise of judgment by management;
� Audit qualifications and significant adjustments arising
out of audit;
� Analysis of the effects of alternative GAAP methods on
the financial statements;
� Compliance with listing and other legal requirements
concerning financial statements;
� Review Reports on the Management Discussion and
Analysis of financial condition, Results of Operations and
the Directors’ Responsibility Statement;
� Overseeing the Company’s financial reporting process
and the disclosure of its financial information, including
earnings press release, to ensure that the financial
statements are correct, sufficient and credible; and
� Disclosures made under the CEO and CFO certification and
related party transactions to the Board and Shareholders.
b. Reviewing with the management, external auditor and
internal auditor, adequacy of internal control systems and
recommending improvements to the management.
c. Reviewing, with the management, the statement of uses/
application of funds raised through an issue (public issue,
rights issue, preferential issue, etc.), the statement of funds
utilized for purposes other than those stated in the offer
document/ prospectus/ notice and the report submitted by
the monitoring agency monitoring the utilisation of the said
proceeds and making appropriate recommendations to the
Board to take up steps in this matter.
An Organisation Chart depicting the relationship between the Board of Directors, the Committees and the senior management as on
March 31, 2013 is illustrated below:

Corporate Governance (98-114)
101
CORPORATE OVERVIEW FINANCIAL HIGHLIGHTS FINANCIAL STATEMENTSSTATUTORY REPORTS
d. Recommending the appointment/removal of the statutory
auditor, cost auditor, fixing audit fees and approving non-
audit / consulting services provided by the statutory
auditors’ firms to the Company and its subsidiaries; Auditors’
(including Cost Auditors) qualifications and independence as
also performance evaluation of the statutory auditors.
e. Reviewing the adequacy of internal audit function, coverage
and frequency of internal audit, appointment, removal,
performance and terms of remuneration of the chief internal
auditor. Approving the appointment of CFO after assessing
the qualification, experience and background etc of the
candidate.
f. Discussing with the internal auditor and senior management
significant internal audit findings and follow-up thereon.
g. Reviewing the findings of any internal investigation by the
internal auditor into matters involving suspected fraud or
irregularity or a failure of internal control systems of a material
nature and report the matter to the Board.
h. Discussing with the external auditor before the audit
commences, the nature and scope of audit, as well as conduct
post-audit discussions to ascertain any areas of concern.
i. Reviewing the Company’s financial and risk management
policies.
j. Reviewing the functioning of the Whistle-Blower Policy and
the legal compliance mechanism.
k. Reviewing the financial statements and investments made
by subsidiary companies and subsidiary oversight relating to
areas such as adequacy of the internal audit structure and
function of the subsidiaries, their status of audit plan and its
execution, key internal audit observations, risk management
and the control environment.
l. Look into the reasons for any substantial defaults in payment
to the depositors, debenture holders, shareholders (in case of
non-payment of declared dividend) and creditors, if any.
During the year, the Committee reviewed key audit findings
covering operational, financial and compliance areas. Management
personnel of the subsidiaries presented their internal control
system, risk mitigation plan to the Committee. The Committee,
through self-assessment, annually evaluates its performance,
reviews the status on compliance of its obligations under the
Charter and confirms that it fulfills its duties and responsibilities.
The Chairman of the Audit Committee briefs the Board on
significant discussions at Audit Committee meetings.
During the year under review, the Committee comprised of four
Independent Directors, all of whom are financially literate and
have relevant finance and/or audit exposure. Mr S M Palia, who
was the Financial Expert, stepped down as Director w.e.f. April 25,
2013. Mr Munjee has been appointed as the Financial Expert in his
place. The quorum of the Committee is two members or one-third
of its members, whichever is higher. The Chairman of the Audit
Committee also attended the last Annual General Meeting of the
Company. During the year under review, nine Audit Committee
meetings were held on April 18, 2012, May 26, 2012, July 17, 2012,
August 7, 2012, September 7, 2012, November 5, 2012, December
1, 2012, January 16/17, 2013 and February 13, 2013. .
The composition of the Audit Committee and attendance at its
meetings is as follows:
Composition Meetings attended
N Munjee (Chairman) 9
S M Palia* 7
R A Mashelkar 8
V K Jairath 9
Falguni Nayar** NA
* Ceased to be member w.e.f. April 25, 2013
** Appointed as member w.e.f. May 29, 2013
The Committee meetings are held at the Company’s Corporate
Headquarters or at its plant locations and are attended by
Managing Director, Executive Directors, Chief Financial Officer,
Chief Internal Auditor, Statutory Auditors and Cost Auditors. The
Audit Committee meetings considering financial statements is
preceded by an ½ hour meeting of the Audit Committee members
alongwith the Auditors only. The Business and Operation Heads
are invited to the meetings, as and when required. The Company
Secretary acts as the Secretary of the Audit Committee. The
Chief Internal Auditor reports to the Audit Committee to ensure
independence of the Internal Audit function.
The Committee relies on the expertise and knowledge of
the management, the internal auditors and the independent
Statutory Auditor in carrying out its oversight responsibilities.
It also uses external expertise, if required. The management is
responsible for the preparation, presentation and integrity of
the Company’s financial statements including consolidated
statements, accounting and financial reporting principles. The
management is also responsible for internal control over financial
reporting and all procedures are designed to ensure compliance
with accounting standards, applicable laws and regulations as
well as for objectively reviewing and evaluating the adequacy,
effectiveness and quality of the Company’s system of internal
control.
Deloitte Haskins & Sells, Mumbai (Registration Number 117366W),
the Company’s Statutory Auditors are responsible for performing
an independent audit of the Financial Statements and expressing
an opinion on the conformity of those financial statements with
accounting principles generally accepted in India.

68th ANNUAL REPORT 2012-13
102
REMUNERATION COMMITTEE
The Remuneration Committee is empowered to review the
remuneration of the Managing Director, Executive Directors of the
Company and the CEOs of certain significant subsidiary companies,
retirement benefits to be paid to them under the Retirement
Benefit Guidelines approved by the Board, recommending the
amount and distribution of commission to the non Executive
Directors based on criteria fixed by the Board and to deal with
matters pertaining to Employees’ Stock Option Scheme, if any.
The Remuneration Committee comprises two Independent
Directors (including the Chairman of the Committee) and two
non Executive Directors. During the year under review, a meeting
of the Committee was held on May 29, 2012. The decisions
are taken by the Committee at meetings or by passing circular
resolutions. The composition of the Remuneration Committee
and attendance at its meeting is as follows:
Composition Meetings attended
N N Wadia (Chairman) 1
Ratan N Tata(1) 1
Cyrus P Mistry(2) -
S Bhargava 1
Ravi Kant 1
(1) Ceased to be member w.e.f. December 28, 2012
(2) Appointed as member w.e.f. February 14, 2013
Mr S M Palia attended the meeting as a special invitee.
Remuneration Policy
a. The remuneration of the Managing Director and Executive
Directors of the Company and CEOs of certain significant
subsidiaries is recommended by the Remuneration
Committee based on criteria such as industry benchmarks,
the Company’s performance vis-à-vis the industry,
responsibilities shouldered, performance/track record, macro
economic review on remuneration packages of heads of
other organisations and is decided by the Board of Directors.
The Company pays remuneration by way of salary, perquisites
and allowances (fixed component), incentive remuneration
and/or commission (variable components) to its Managing
Director and Executive Directors. Annual increments are
decided by the Remuneration Committee within the salary
scale approved by the Members and are effective from April
1, every year.
b. A sitting fee of ` 20,000/- for attendance at each meeting
of the Board, Audit Committee, Executive Committee,
Remuneration Committee and Nominations Committee
and ` 5,000/- for Safety, Health and Environment Committee,
Investors’ Grievance Committee and Ethics & Compliance
Committee is paid to its Members (excluding Managing
Director and Executive Directors) and also to Directors
attending as Special Invitees. The sitting fees paid/payable
to the non Executive Directors is excluded whilst calculating
the above limits of remuneration in accordance with Section
198 of the Act. The Company also reimburses out-of-pocket
expenses to Directors attending meetings held at a city other
than the one in which the Directors reside.
c. A remuneration by way of commission to the Non Executive
Directors is decided by the Board of Directors, based on
recommendation of the Remuneration Committee and
distributed to them based on their participation and
contribution at Board/certain Committee meetings as
well as time spent on matters other than at meetings. The
Members had, at the Annual General Meeting held on
July 24, 2008, approved the payment of remuneration by
way of commission to the non Executive Directors of the
Company, of a sum not exceeding 1% per annum of the net
profits of the Company, calculated in accordance with the
provisions of the Act, for a period of 5 years commencing
April 1, 2008. A Special Resolution is included in the notice
of the forthcoming Annual General Meeting for payment of
Commission to non Executive Directors for another period of
5 years w.e.f. April 1, 2013.
d. Remuneration of employees largely consists of basic
remuneration, perquisites, allowances and performance
incentives. The components of remuneration vary for
different employee grades and are governed by industry
patterns, qualifications and experience of the employee,
responsibilities handled by him, his individual performances,
etc. The annual variable pay of senior managers is linked to
the Company’s performance in general and their individual
performance for the relevant year is measured against
specific major performance areas which are closely aligned
to the Company’s objectives.
The Company dose not have a stock option scheme for its
Executive Directors and employees.
The Directors’ remuneration and sitting fees paid/payable by
the Company in respect of the Financial Year 2012-13, are given
below:
Non Executive Directors (` in Lakhs)
Name Commission Sitting Fees
Ratan N Tata(1) 133 2.40
Cyrus P Mistry(2) - 2.00
Ravi Kant(3) 67 3.30
N N Wadia 25 2.60
S M Palia(4) 60 4.10
R A Mashelkar 20 3.20

Corporate Governance (98-114)
103
CORPORATE OVERVIEW FINANCIAL HIGHLIGHTS FINANCIAL STATEMENTSSTATUTORY REPORTS
N Munjee 45 4.00
S Bhargava 25 2.80
V K Jairath 20 3.80
R Sen(5) 5 1.00
R Speth(6) - -
Falguni Nayar(7) - -
(1) Ceased to be Director and Chairman w.e.f December 28, 2012. Apart from the above, Mr Ratan N Tata, who was formerly the Executive Chairman of the Company is paid/provided `36.73 lakhs p.a. as retirement benefits as per Company’s policy.
(2) Appointed as Director w.e.f. May 29, 2012.(3) Mr Ravi Kant, who was formerly the Managing Director of the Company is paid/provided
`76.80 lakhs p.a. as retirement benefits as per Company’s policy. As advisor to the Company for overseeing Jaguar Land Rover operations of the Company, Mr Ravi Kant was paid a fee equivalent to GB£ 75,000 p.a. and use of a Company car. Both of these are not included in the above table.
(4) Ceased to be a Director w.e.f. April 25, 2013.(5) Ceased to be a Director w.e.f. October 16, 2012.(6) Dr Ralf Speth is not paid any commission or sitting fees for attending Board meetings of the
Company in view of his appointment as Chief Executive Officer and Director of Jaguar Land Rover Automotive PLC.
(7) Appointed as Additional Director w.e.f. May 29, 2013
Managing & Executive Directors
Terms of appointment and remuneration
Terms of
Agreement
Mr Karl Slym,
Managing
Director*
Mr R Pisharody,
Executive Director
(Commercial Vehicles)
Mr S B Borwankar,
Executive Director (Quality)
Period of
Contract
Sept 13, 2012 –
Sept 12, 2017
June 21, 2012 – June 20,
2017
Severance
Fees
The Contracts with the Managing Director,
Executive Directors may be terminated by either
party giving the other party six months’ notice
or the Company paying six months’ salary in
lieu thereof. There is no separate provision for
payment of Severance fees.
* An item on the appointment and remuneration of Managing Director is also included in the
notice of forthcoming annual general meeting of the Company.
The Remuneration paid to the Managing Director and Executive
Directors in FY 2012-13 is as under:
(` in Lakhs)
Name P M Telang Karl Slym R Pisharody S B Borwankar
Salary 18.23 65.95 42.00 33.13
Perquisites &
Allowances(1)82.16 628.20 40.25 47.02
Commission/Bonus 56.00 (2) 394.80 160.00 (2) 85.00 (2)
Retirement
Benefits(3)4.92 (4) 7.91 11.34 8.95
(1) Includes leave encashment
(2) Payable in FY 13-14
(3) Excludes provision for encashable leave and gratuity as separate actuarial valuation is not
available
(4) Does not include exgratia and gratuity paid on retirement
Retirement Policy for Directors
The Company has adopted the Guidelines for retirement age
wherein Managing and Executive Directors retire at the age of 65
years. Any Executive Director, who is retained on the Company’s
Board beyond the age of 65 years as non Executive Director for
special reasons may continue as a Director at the discretion of
Board but in no case beyond the age of 70 years. The retirement
age for Independent Directors is 75 years. The Company has also
adopted a Policy for offering special retirement benefits including
pension, ex-gratia and medical to Managing and Executive
Directors which has also been approved by the Members of the
Company. In addition to the above, the retiring Managing Director
is entitled to residential accommodation or compensation in lieu
of accommodation on retirement. The quantum and payment of
the said benefits are subject to an eligibility criteria of the retiring
director and is payable at the discretion of the Board in each
individual case on the recommendation of the Remuneration
Committee.
INVESTORS’ GRIEVANCE COMMITTEE
During the year under review, the Investors’ Grievance Committee
comprised of two Independent Directors (including the
Chairman of the Committee), one non Executive Director and
the Managing Director. The Investors’ Grievance Committee of
the Board is empowered to oversee the redressal of investors’
complaints pertaining to share/debenture transfers, non-receipt
of annual reports, interest/dividend payments, issue of duplicate
certificates, transmission (with and without legal representation)
of shares and debentures, matters pertaining to Company’s fixed
deposit programme and other miscellaneous complaints. During
the year under review, three Investors’ Grievance Committee
meetings were held on April 18, 2012, August 9, 2012 and March
28, 2013. The composition of the Investors’ Grievance Committee
and attendance at its meetings is as follows:
Composition Meetings attended
S M Palia (Chairman)(1) 3
Ravi Kant 3
V K Jairath 2
Karl Slym(2) 1
Falguni Nayar(3) NA
(1) Ceased to be member w.e.f. April 25, 2013
(2) Appointed as member w.e.f. February 14, 2013
(3) Appointed as member w.e.f. May 29, 2013
Compliance Officer
Mr H K Sethna, Company Secretary, who is the Compliance Officer,
can be contacted at:
Tata Motors Limited, Bombay House, 24, Homi Mody Street,
Mumbai - 400 001, India.
Tel: 91 22 6665 8282, 91 22 6665 7824 / Fax: 91 22 6665 7260
Email: [email protected].

68th ANNUAL REPORT 2012-13
104
Complaints or queries relating to the shares and/or debentures
can be forwarded to the Company’s Registrar and Transfer Agents –
M/s TSR Darashaw Pvt. Ltd. at [email protected], whereas
complaints or queries relating to the public fixed deposits can
be forwarded to the Registrars to the Fixed Deposits Scheme –
M/s TSR Darashaw Pvt. Ltd. at [email protected].
The status on the total number of investors’ complaints during
FY 2012-13 is as follows:
Type Nos.
Complaints regarding non-receipt of dividend,
shares lodged for transfer and resolved
101
Complaints received from the shareholders through
SEBI and other statutory bodies and resolved*
67
Other queries received from shareholders and
replied
11996
* One SEBI complaint has been replied within 4 days but the same has been reflected as
unresolved as on March 31, 2013, as per the condition for complete resolution defined by SEBI.
All letters received from the investors are replied to and the
response time for attending to investors’ correspondence during
FY2012-13 is shown in the following table:
Number %
Correspondence received during
2012-201312164 100.00
Replied within 1 to 4 days of receipt 8177 67.22
Replied within 5 to 7 days of receipt 1464 12.04
Replied within 8 to 15 days of receipt 2365 19.44
Replied after 15 days of receipt (1)115 0.95
Received in last week of March 2013
have been replied in April 201343 0.35
(1) These correspondence pertained to court cases which involved retrieval of case files and very old records, co-ordination with the Company/Advocates, partial documents awaited from the Investors, cases involving registration of legal documents, executed documents received for issue of duplicate certificates and transmission of shares without legal representation which involved checking of the documents, sending notices to Stock Exchange and issue of duplicate certificates/transmission of shares after approval from the Company. However, all these cases have been attended to within the statutory limit of 30 days.
There were 16 pending share transfers pertaining to the Financial
Year ended March 31, 2013, which were received in the last
week of March 2013. Out of the total number of complaints
mentioned above, 75 complaints pertained to letters received
through Statutory/Regulatory bodies and those related to Court/
Consumer forum matters, fraudulent encashment and non-
receipt of dividend amounts.
TSR Darashaw Private Limited (TSRDPL), the Company’s Registrar
and Transfer Agents, are also the Registrar for the Company’s
Fixed Deposits Scheme (FD). TSRDPL is the focal point of contact
for investor services in order to address various FD related
matters mainly including repayment / revalidation, issue of
duplicate FD receipts / warrants, TDS certificates, change in bank
details/ address and PAN corrections. In view of increase in the
correspondence, TSRDPL have increased their investor interface
strength (telephone and counter departments), and have taken
other steps for rendering speedy and satisfactory services to the
FD holders.
On recommendations of the Investors’ Grievance Committee,
the Company has taken various investor friendly initiatives like
organising Shareholders’ visit to Company Works at Pune, sending
reminders to investors who have not claimed their dues, sending
nominations forms, etc.
OTHER COMMITTEES
The Executive Committee of the Board reviews capital and
revenue budgets, long-term business strategies and plans,
the organisational structure of the Company, real estate and
investment transactions, allotment of shares and/or debentures,
borrowing and other operational matters. The Committee also
discusses matters pertaining to legal cases, acquisitions and
divestment, new business forays and donations. During the
year under review, four Committee meetings were held on April
3, 2012, July 10, 2012, October 1, 2012 and March 19, 2013. At
present, the Executive Committee of the Board comprises three
Independent Directors, two non Executive Directors and three
Executive Directors.
The composition of the Executive Committee of the Board and
attendance at meetings is given hereunder:
Composition Meetings attended
Ratan N Tata (1) 3
Cyrus P Mistry (2) 3
Ravi Kant 4
N N Wadia 3
N Munjee (3) 4
S Bhargava 4
P M Telang (4) 1
Karl Slym (5) 2
R Pisharody (6) 2
S B Borwankar (6) 2
(1) Ceased to be member w.e.f. December 28, 2012 (2) Appointed as member w.e.f. May 29, 2012 and Chairman w.e.f. February 14, 2013 (3) Attended 1 meeting through webex and audio conference(4) Ceased to be a Member w.e.f. June 21, 2012(5) Appointed as a member w.e.f. September 13, 2012(6) Appointed as member w.e.f. July 13, 2012
Mr S M Palia and Mr R Sen attended a meeting as special invitees.

Corporate Governance (98-114)
105
CORPORATE OVERVIEW FINANCIAL HIGHLIGHTS FINANCIAL STATEMENTSSTATUTORY REPORTS
The Executive Committee of the Board formed a Donations
Committee in September 2003 and a Corporate Social
Responsibility (CSR) Committee in January 2006, comprising
the Managing Director and the Senior Management which
meets from time to time / approve proposal through circular
resolutions to fulfill the community and social responsibilities of
its stakeholders.
The Nominations Committee of the Board was constituted with
the objective of identifying independent directors to be inducted
on the Board and to take steps to refresh the constitution of the
Board from time to time. During the year under review, a meeting
was held on May 29, 2012 and attended by all the members.
Mr S Bhargava attended the meeting as a special invitee. At
present, the Nominations Committee comprises Mr N N Wadia
as the Chairman, Mr Cyrus P Mistry (appointed w.e.f. February 14,
2013), Mr Ravi Kant and Mr S M Palia (stepped down w.e.f. April
25, 2013).
The Ethics and Compliance Committee was constituted to
formulate policies relating to the implementation of the Tata
Code of Conduct for Prevention of Insider Trading (the Code), take
on record the monthly reports on dealings in securities by the
“Specified Persons” and decide penal action in respect of violations
of the applicable regulations/the Code. During the year under
review, three meetings of the Committee were held on April 18,
2012, August 9, 2012 and March 28, 2013. The composition of the
Ethics and Compliance Committee and attendance at meetings,
is given hereunder:
Composition Meetings attended
S M Palia (Chairman)(1) 3
Ravi Kant 3
V K Jairath 2
Karl Slym(2) 1
Falguni Nayar(3) NA
(1) Ceased to be member w.e.f. April 25, 2013(2) Appointed as member w.e.f. February 14, 2013(3) Appointed as member w.e.f. May 29, 2013
Mr C Ramakrishnan, Chief Financial Officer, acts as the Compliance
Officer under the said Code.
The Safety, Health & Environment (SHE) Committee was
constituted by the Board of Directors in its meeting held on
February 14, 2013 with the objective of reviewing Safety, Health
and Environment practices. The Board also adopted a Charter for
the Committee. The SHE Committee comprises Dr R A Mashelkar
as Chairman, Mr V K Jairath, Mr Karl Slym, Mr R Pisharody and Mr S
B Borwankar as Members of the said Committee.
Apart from the above, the Board of Directors also constitutes
Committee(s) of Directors and/or Executives with specific terms
of reference, as it deems fit.
CODE OF CONDUCT
Whilst the Tata Code of Conduct is applicable to all Executive
Directors and employees of the Company, the Board has also
adopted a Code of Conduct for non Executive Directors, both
of which are available on the Company’s website. All the Board
members and senior management of the Company as on March
31, 2013 have affirmed compliance with their respective Codes of
Conduct. A Declaration to this effect, duly signed by the Managing
Director is annexed hereto.
SUBSIDIARY COMPANIES
The Company does not have any material non-listed Indian
subsidiary company and hence, it is not required to have an
Independent Director of the Company on the Board of such
subsidiary company. An Independent Director of the Company
is on the Board of Jaguar Land Rover Automotive Plc and Tata
Motors Finance Limited. The Audit Committee also has a meeting
wherein the CEO and CFO of the subsidiary companies make a
presentation on significant issues in audit, internal control, risk
management, etc. Significant issues pertaining to subsidiary
companies are also discussed at the Executive Committee of the
Board and Audit Committee meetings of the Company. Apart from
disclosures made in the Directors’ Report, there were no strategic
investments made by the Company’s non-listed subsidiaries
during the year under review.
The minutes of the subsidiary companies are placed before the
Board of Directors of the Company and the attention of the
Directors is drawn to significant transactions and arrangements
entered into by the subsidiary companies. The performance of its
subsidiaries is also reviewed by the Board periodically.
GENERAL BODY MEETINGS
Date Year Special
Resolutions
passed
Venue
and Time
August 10, 2012 2011-12 NIL Birla Matushri
Sabhagar, 19,
Sir Vithaldas
Thackersey Marg,
Mumbai - 400 020
at 3:00 p.m.
August 12, 2011 2010-11 NIL*
September 1, 2010 2009-10 NIL
* In August, 2010, Company had obtained the approval of its
members under Section 192A of the Companies Act, 1956
pertaining to following Special Resolutions which were approved
with the requisite majority:
a) Raising of additional long term resources upto a limit of
`4700 crores.
b) Issuance of ‘A’ Ordinary Shares on exercise of conversion

68th ANNUAL REPORT 2012-13
106
option by holders of Zero Coupon Convertible Alternative
Reference Securities (CARS).
c) Payment of Advisory Fees to Mr Ravi Kant.
All resolutions moved at the last Annual General Meeting were
passed by a show of hands by the requisite majority of members
attending the meeting. None of the items to be transacted at the
ensuing meeting is required to be passed by postal ballot.
DISCLOSURES
� Details of related party transactions entered into by the
Company are included in the Notes to Accounts. Material
individual transactions with related parties are in the normal
course of business on an arm’s length basis and do not
have potential conflict with the interests of the Company at
large. Transactions with related parties entered into by the
Company in the normal course of business are periodically
placed before the Audit Committee for review.
� The Company has complied with various rules and regulations
prescribed by Stock exchanges, Securities and Exchange
Board of India or any other statutory authority relating to
the capital markets during the last 3 years. No penalties or
strictures have been imposed by them on the Company.
� The Audit Committee has adopted a Whistle-Blower Policy
which provides a formal mechanism for all employees of the
Company to approach the Management of the Company
(Audit Committee in case where the concern involves the
Senior Management) and make protective disclosures to the
Management about unethical behaviour, actual or suspected
fraud or violation of the Company’s Code of Conduct. The
disclosures reported are addressed in the manner and within
the time frames prescribed in the Policy. The Company
affirms that no employee of the Company has been denied
access to the Audit Committee.
The status of compliance in respect of each of the non-
mandatory requirements under Clause 49 of Listing
Agreement is as follows:
The Board: The non Executive Chairman maintains a separate
office, for which the Company does not reimburse expenses.
As per the Guidelines regarding retirement age of Directors as
adopted by the Board of Directors in its meeting held on July
13, 2012, tenure of 9 years may be considered a threshold for
granting further tenure for independent directors based, inter
alia, on the merit and contribution of each Director. In line with
the best practice to continuously refresh the Board’s membership,
the Board is encouraged to seek a balance between change and
continuity. Mr Ravi Kant, Vice Chairman, continued on the Board,
subsequent to his retirement in an Executive capacity. Except as
mentioned above, the Ex-Managing Directors/Executive Directors
may be invited to rejoin the Board as non Executive Directors,
but preferably after an interval of 3 years. The Nomination
Committee takes into consideration criteria such as qualifications
and expertise whilst recommending induction of non Executive
Directors on the Board as also recommending to the shareholders
re-appointment of eligible directors retiring by rotation.
Remuneration Committee: Details are given under the heading
“Remuneration Committee”.
Shareholder Rights: Details are given under the heading “Means
of Communications”.
Audit Qualifications: During the year under review, there was
no audit qualification in the Auditors’ Report on the Company’s
financial statements. The Company continues to adopt best
practices to ensure a regime of unqualified financial statements.
Training of Board Members: The Directors interact with the
management in a very free and open manner on information
that may be required by them. Orientation and factory visits are
arranged for new Non- Executive Directors. The Independent
Directors are encouraged to attend training programmes that
may be of relevance and interest to the Directors in discharging
their responsibilities to the Company’s stakeholders.
Mechanism for evaluating non Executive Board members:
The performance evaluation of non Executive members is done
by the Board annually based on criteria of attendance and
contributions at Board/Committee Meetings as also for the role
played other than at Meetings.
Whistle Blower Mechanism: The Company has adopted a
Whistle-Blower Policy. Please refer to ‘DISCLOSURES’ given above.
MEANS OF COMMUNICATION
The Quarterly, Half Yearly and Annual Results are regularly
submitted to the Stock Exchanges in accordance with the Listing
Agreement and are generally published in Indian Express, Financial
Express and Loksatta (Marathi). The information regarding the
performance of the Company is shared with the shareholders
every six months through a Half Yearly Communiqué and the
Annual Report. The official news releases, including on the quarterly
and annual results and presentations made to institutional
investors and analysts are also posted on the Company’s website
(www.tatamotors.com) in the ‘Investors’ Section.
The Annual Report, Quarterly Results, Shareholding Pattern, Press
Releases, Intimation of the Board Meeting and Issuance of shares
and other required details of the Company are posted through
Corporate Filing and Dissemination System (CFDS) and NSE
Electronic Application Processing System (NEAPS) portals to view
information filed by listed companies.

Corporate Governance (98-114)
107
CORPORATE OVERVIEW FINANCIAL HIGHLIGHTS FINANCIAL STATEMENTSSTATUTORY REPORTS
Green Initiative:
In support of the “Green Initiative” undertaken by the Ministry of
Corporate Affairs, the Company had during the year 2012-13 sent
various communications including intimation of dividend and
Half Yearly Communiqué by email to those shareholders whose
email addresses were made available to the depositories or the
Registrar and Transfer Agents. Physical copies were sent to only
those shareholders whose email addresses were not available and
for the bounced email cases.
As prescribed under the Listing Agreement with the Stock
exchanges, companies can send soft copies of the Annual Reports
to all those shareholders who have registered their email address
for the said purpose. The Company has sent electronic intimations
to shareholders having email ids requesting for their consent to
receive various communications including Annual Reports in
electronic form. However, the Company has not made much
progress as only around 16,000 shareholders have opted for this
mode of communication.
As a responsible citizen, your Company strongly urges you
to support the Green Initiative by giving positive consent
by registering/updating your email addresses with the
Depository Participants or the Registrar and Transfer
Agents for the purpose of receiving soft copies of various
communications including the Annual Reports.
As an austerity measure and in furtherance of this Green Initiative,
the Company has in accordance with Clause 32 of the Listing
Agreement sent an Abridged Report to the shareholders for the
FY 2012-13. Member may request for a full copy of the Annual
Report for FY 2012-13.
GENERAL INFORMATION FOR MEMBERS
The Company is registered with the Registrar of Companies,
Mumbai, Maharashtra. The Corporate Identity Number (CIN)
allotted to the Company by the Ministry of Corporate Affairs
(MCA) is L28920MH1945PLC004520.
Annual General Meeting
Date and Time Wednesday, August 21, 2013 at 3:00 p.m.
Venue Birla Matushri Sabhagar, 19, Sir Vithaldas
Thackersey Marg, Mumbai 400 020
Date of Book
ClosureThursday, August 1 to Wednesday,
August 21, 2013 (both days inclusive)
Dividend
Payment Date
August 23, 2013. The Dividend warrants
will be posted/dividend amount will be
remitted into the shareholders account
on or after August 23, 2013
Financial Calendar (Tentative)
Financial Year ending March 31
Results for the Quarter
ending:
June 30, 2013 On or before August 14, 2013
September 30, 2013 On or before November 14, 2013
December 31, 2013 On or before February 14, 2014
March 31, 2014 On or before May 30, 2014
Listing
The Company’s securities are listed on the BSE Ltd. (BSE) and
National Stock Exchange of India Ltd. (NSE). The following are the
details of the Company’s shares:
Type Ordinary Shares ‘A’ Ordinary Shares
ISIN INE155A01022 IN9155A01020
BSE Stock Code 500570 570001
BSE Address Phiroze Jeejeebhoy Towers, Dalal Street
Mumbai 400 001 www.bseindia.com
NSE Stock Code TATAMOTORS TATAMTRDVR
NSE Adresss “Exchange Plaza” Bandra Kurla Complex,
Bandra (E), Mumbai 400 051
www.nseindia.com
Attention is also drawn to the Section “Outstanding Securities”
below for foreign listing and listing of debt securities of the
Company.
Beside the above, certain subsidiaries of the Company have also
issued non convertible listed securities. Attention of the investors
is also drawn to a seperate section in the Annual Report.
Payment of Listing Fees
The Company has paid Annual Listing fees for FY 2013-14 to all
the Stock Exchanges (both domestic and international) where the
Company’s securities are listed.

68th ANNUAL REPORT 2012-13
108
The Performance of the Company’s Stock Price vis-à-vis Sensex, Auto Index, ADR and GDR
The monthly high and low of the Company’s ADRs and GDRs is
given below: (in US $)
Month ADRs GDRs
High Low High Low
Apr-12 30.28 27.00 30.68 26.94
May-12 29.88 20.79 30.06 20.79
Jun-12 22.25 20.07 22.05 19.94
Jul-12 22.42 18.94 22.24 18.37
Aug-12 22.13 19.88 22.34 19.81
Sept-12 25.68 20.72 25.76 20.46
Oct-12 26.81 22.94 27.05 22.94
Nov-12 25.73 23.88 26.11 23.46
Dec-12 28.72 25.02 28.43 24.83
Jan-13 30.74 26.99 30.59 27.33
Feb-13 29.12 26.73 28.31 26.45
Mar-13 28.49 24.41 28.27 24.79
Each Depositary Receipt represents 5 underlying Ordinary Shares of face value of
`2/- each w.e.f. September 14, 2012.
Ordinary Shares
BSE NSE
Month High
(`)
Low
(`)
No. of
Shares
High
(`)
Low
(`)
No. of
Shares
Apr-12 319.35 275.75 25043607 319.25 275.60 163701926
May-12 308.30 233.20 37413229 308.40 233.00 283618258
Jun-12 248.10 221.55 46738975 248.20 221.65 289260266
Jul-12 246.40 204.85 31575184 246.50 205.10 210468042
Aug-12 247.90 220.90 29362600 248.10 220.95 213842587
Sep-12 277.65 228.70 25896096 277.85 228.70 207335990
Oct-12 280.35 247.70 18502941 280.55 247.65 155919611
Nov-12 284.10 258.85 22457418 283.95 258.75 250544006
Dec-12 312.40 271.30 27719928 312.65 271.55 194959202
Jan-13 333.40 293.55 27448667 333.70 293.45 223487576
Feb-13 306.90 285.00 18455001 306.75 281.65 173106255
Mar-13 309.25 269.30 18414465 309.40 269.15 192404425
‘A’ Ordinary Shares
Month BSE NSE
High
(`)
Low
(`)
No. of
Shares
High
(`)
Low
(`)
No. of
Shares
Apr-12 185.70 154.60 13037856 185.85 153.90 99252057
May-12 172.15 136.10 13588963 171.85 135.95 105515589
Jun-12 142.05 130.07 9470168 142.00 130.60 65251923
Jul-12 136.85 117.65 7718792 136.95 117.05 63569467
Aug-12 145.40 123.40 6185418 145.85 123.50 58469018
Sep-12 161.05 136.35 7079753 161.10 136.20 53281827
Oct-12 171.15 153.70 6420595 171.55 153.70 45941262
Nov-12 172.15 157.00 9938128 172.10 157.10 51261988
Dec-12 174.20 162.50 3872666 174.20 162.45 50857178
Jan-13 187.10 166.25 5020492 187.60 166.45 51277347
Feb-13 170.80 159.10 2946589 170.75 158.90 41426277
Mar-13 173.20 152.95 3964196 173.40 152.75 41629801
Market Information
Market price data - monthly high/low of the closing price and trading volumes on BSE/NSE depicting liquidity of the Company’s Ordinary
Shares and ‘A’ Ordinary Shares on the said exchanges is given hereunder:-
Registrar and Transfer Agents
For share related matters, Members are requested to correspond
with the Company’s Registrar and Transfer Agents – M/s TSR
Darashaw Private Limited quoting their folio no./DP ID & Client ID
at the following addresses:
1. For transfer lodgement, delivery and correspondence :
TSR Darashaw Private Limited, Unit: Tata Motors Limited,
6-10, Haji Moosa Patrawala Industrial Estate, 20, Dr. E Moses
Road, (Nr. Famous Studios) Mahalaxmi, Mumbai – 400 011.
Tel: 022-6656 8484; Fax: 022- 6656 8494;
e-mail : [email protected];
website : www.tsrdarashaw.com
2. For the convenience of investors based in the following
cities, transfer documents and letters will also be accepted
at the following branches / agencies of TSR Darashaw Private
Limited:

Corporate Governance (98-114)
109
CORPORATE OVERVIEW FINANCIAL HIGHLIGHTS FINANCIAL STATEMENTSSTATUTORY REPORTS
(i) Bangalore: 503, Barton Centre, 5th Floor, 84,
Mahatma Gandhi Road, Bangalore – 560 001.
Tel: 080 – 25320321, Fax: 080 – 25580019,
e-mail: [email protected]
(ii) Jamshedpur: Bungalow No.1, “E” Road, Northern Town,
Bistupur, Jamshedpur – 831 001.
Tel: 0657 – 2426616, Fax: 0657 – 2426937,
email : [email protected]
(iii) Kolkata: Tata Centre, 1st Floor, 43,
Jawaharlal Nehru Road, Kolkata – 700 071.
Tel: 033 – 22883087, Fax: 033 – 22883062,
e-mail: [email protected]
(iv) New Delhi: Plot No.2/42, Sant Vihar, Ansari Road,
Daryaganj, New Delhi – 110 002.
Tel : 011 – 23271805, Fax : 011 – 23271802,
e-mail : [email protected]
(v) Ahmedabad: Agent of TSRDPL – Shah Consultancy
Services Pvt Limited: 3-Sumathinath Complex, Pritam
Nagar Akhada Road, Ellisbridge,
Ahmedabad -380 006. Tel: 079-2657 6038,
e-mail: [email protected]
For Fixed Deposits, the investors are requested to correspond with
the Registrars to the Fixed Deposits Scheme – TSR Darashaw Pri-
vate Limited at the same addresses as mentioned above or send
an e-mail at [email protected]. Tel: 022-6656 8484
Share Transfer System
Securities lodged for transfer at the Registrar’s address are
normally processed within 15 days from the date of lodgement,
if the documents are clear in all respects. All requests for
dematerialization of securities are processed and the confirmation
is given to the depositories within 15 days. Senior Executives of
the Company are empowered to approve transfer of shares and
debentures and other investor related matters.
Reconciliation of Share Capital Audit/ Compliance of Share
Transfer Formalities
� Pursuant to Clause 47(c) of the Listing Agreement with
the Stock Exchanges, certificates, on half-yearly basis, have
been issued by a Company Secretary-in-Practice for due
compliance of share transfer formalities by the Company.
� A Company Secretary-in-Practice carried out a Reconciliation
of Share Capital Audit to reconcile the total admitted capital
with NSDL and CDSL and the total issued and listed capital.
The audit confirms that the total issued/paid-up capital is
in agreement with the aggregate of the total number of
shares in physical form and the total number of shares in
dematerialized form (held with NSDL and CDSL).
Shareholding pattern as on March 31, 2013
Ordinary Shares ‘A’ Ordinary Shares
Month As on
March 31, 2013
As on
March 31, 2012
As on
March 31, 2013
As on
March 31, 2012
No. of shares % No. of shares % variance
13 v/s 12
%
No.
of shares
% o. of
shares
% variance
13 v/s 12
%
Promoters and Promoter Group# *940056205 34.72 *937056205 34.82 (0.10) 4253587 0.88 18600448 3.86 (2.98)
Mutual Funds and Unit Trust of India 34499261 1.27 44355749 1.65 (0.37) 169152392 35.09 182545509 37.88 (2.78)
Government Companies,
Financial Institutions,
Banks and Insurance Cos.
255756154 9.44 315505382 11.72 (2.28) 288936 0.06 44883879 9.31
Foreign Institutional Investors 762192951 28.14 743765001 27.63 0.51 236915544 49.16 188323828 39.08 10.08
NRIs, Foreign Companies and
ADRs/GDRs515634863 19.04 454827555 16.90 2.14 2197642 0.46 2920334 0.60 (0.14)
Others 200016717 7.39 196103563 7.28 0.10 69151519 14.35 44659117 9.27 5.08
Total 2708156151 100 2691613455 100 481959620 100 481933115 100
* Out of the Promoter holding, 71,000,000 shares of face value of `2/- each, aggregating 2.62% of the paid-up capital were pledged. #TATA AIA LIFE INSURANCE COMPANY LIMITED (TALIC) does not act in concert with Tata Sons Limited or any of its group companies for acquisition of shares, voting rights or control over the Company. However TALIC held 5657335 Ordinary Shares representing 0.21% of the paid up Ordinary Share Capital. Accordingly, their holding is included under Public Shareholding under the head “Instutitions”-Insurance Companies
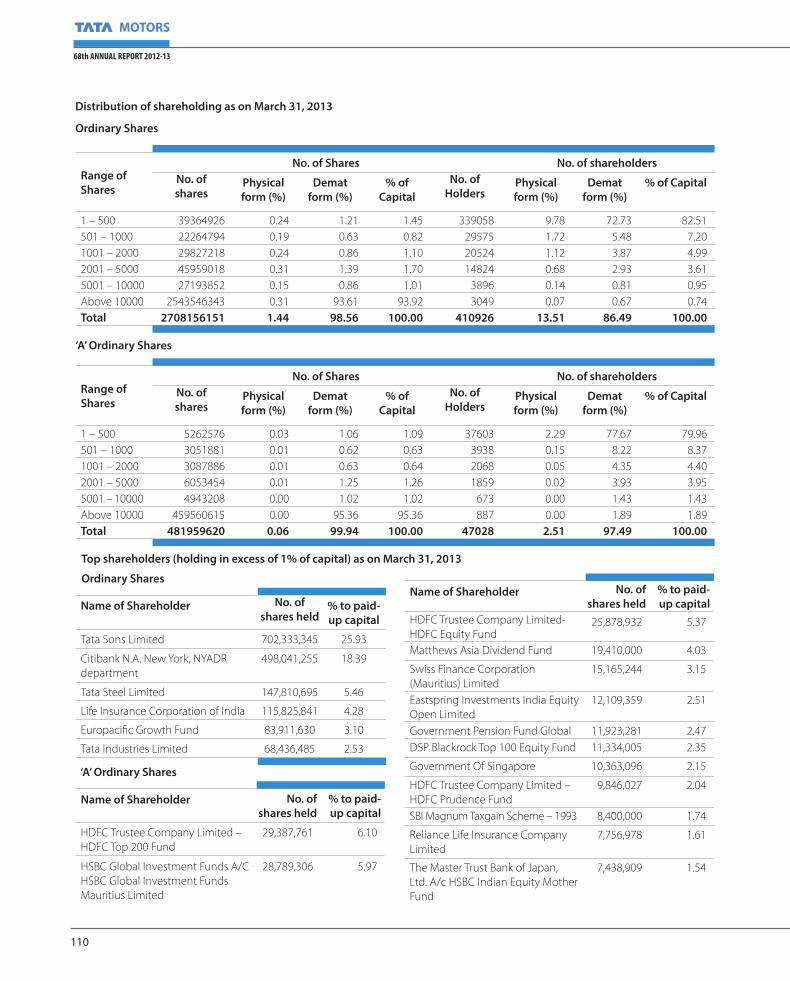
68th ANNUAL REPORT 2012-13
110
Ordinary Shares
Name of Shareholder No. of
shares held% to paid-
up capital
Tata Sons Limited 702,333,345 25.93
Citibank N.A. New York, NYADR
department
498,041,255 18.39
Tata Steel Limited 147,810,695 5.46
Life Insurance Corporation of India 115,825,841 4.28
Europacific Growth Fund 83,911,630 3.10
Tata Industries Limited 68,436,485 2.53
‘A’ Ordinary Shares
Name of Shareholder No. of
shares held
% to paid-
up capital
HDFC Trustee Company Limited –
HDFC Top 200 Fund
29,387,761 6.10
HSBC Global Investment Funds A/C
HSBC Global Investment Funds
Mauritius Limited
28,789,306 5.97
Name of Shareholder No. of
shares held
% to paid-
up capital
HDFC Trustee Company Limited-
HDFC Equity Fund25,878,932 5.37
Matthews Asia Dividend Fund 19,410,000 4.03
Swiss Finance Corporation
(Mauritius) Limited
15,165,244 3.15
Eastspring Investments India Equity
Open Limited
12,109,359 2.51
Government Pension Fund Global 11,923,281 2.47
DSP Blackrock Top 100 Equity Fund 11,334,005 2.35
Government Of Singapore 10,363,096 2.15
HDFC Trustee Company Limited –
HDFC Prudence Fund
9,846,027 2.04
SBI Magnum Taxgain Scheme – 1993 8,400,000 1.74
Reliance Life Insurance Company
Limited
7,756,978 1.61
The Master Trust Bank of Japan,
Ltd. A/c HSBC Indian Equity Mother
Fund
7,438,909 1.54
Distribution of shareholding as on March 31, 2013
Ordinary Shares
Range of
Shares
No. of Shares No. of shareholders
No. of
sharesPhysical
form (%)
Demat
form (%)
% of
Capital
No. of
HoldersPhysical
form (%)
Demat
form (%)
% of Capital
1 – 500 39364926 0.24 1.21 1.45 339058 9.78 72.73 82.51
501 – 1000 22264794 0.19 0.63 0.82 29575 1.72 5.48 7.20
1001 – 2000 29827218 0.24 0.86 1.10 20524 1.12 3.87 4.99
2001 – 5000 45959018 0.31 1.39 1.70 14824 0.68 2.93 3.61
5001 – 10000 27193852 0.15 0.86 1.01 3896 0.14 0.81 0.95
Above 10000 2543546343 0.31 93.61 93.92 3049 0.07 0.67 0.74
Total 2708156151 1.44 98.56 100.00 410926 13.51 86.49 100.00
‘A’ Ordinary Shares
Range of
Shares
No. of Shares No. of shareholders
No. of
sharesPhysical
form (%)
Demat
form (%)
% of
Capital
No. of
HoldersPhysical
form (%)
Demat
form (%)
% of Capital
1 – 500 5262576 0.03 1.06 1.09 37603 2.29 77.67 79.96
501 – 1000 3051881 0.01 0.62 0.63 3938 0.15 8.22 8.37
1001 – 2000 3087886 0.01 0.63 0.64 2068 0.05 4.35 4.40
2001 – 5000 6053454 0.01 1.25 1.26 1859 0.02 3.93 3.95
5001 – 10000 4943208 0.00 1.02 1.02 673 0.00 1.43 1.43
Above 10000 459560615 0.00 95.36 95.36 887 0.00 1.89 1.89
Total 481959620 0.06 99.94 100.00 47028 2.51 97.49 100.00
Top shareholders (holding in excess of 1% of capital) as on March 31, 2013

Corporate Governance (98-114)
111
CORPORATE OVERVIEW FINANCIAL HIGHLIGHTS FINANCIAL STATEMENTSSTATUTORY REPORTS
Name of Shareholder No. of
shares held
% to paid-
up capital
HSBC Global Investment Funds A/C
HSBC Global Investment Funds
BRIC Equity
7,376,534 1.53
ICICI Prudential Focused Bluechip
Equity Fund
7,345,749 1.52
Birla Sun Life Insurance Company
Limited
7,268,868 1.51
HDFC Trustee Company Limited –
HDFC Tax Saverfund
6,685,418 1.39
Dragon Peacock Investments
Limited
6,460,573 1.34
The Royal Bank Of Scotland Asia
Merchant Bank (Singapore) Limited
6,340,959 1.32
DSP Blackrock Equity Fund 5,940,623 1.23
Robeco Capital Growth Funds 5,720,000 1.19
Franklin Templeton Mutual Fund
A/C Franklin India Bluechip Fund
5,000,000 1.04
DEMATERIALISATION OF SHARES
The electronic holding of the shares as on March 31, 2013 through
NSDL and CDSL are as follows:
Particulars Ordinary ‘A’ Ordinary
Shares (%) Shares (%)
2013 2012 2013 2012
NSDL 97.45 97.28 97.78 96.59
CDSL 1.11 1.17 2.16 3.35
Total 98.56 98.22 99.94 99.94
OUTSTANDING SECURITIES
Outstanding Depositary Receipts/Warrants or Convertible
instruments, conversion date and likely impact on equity as on
March 31, 2013:
ADRs/GDRs
There are two separate programs for the Company’s Depositary
Receipts. Each Depository Receipt represents 5 underlying
Ordinary Shares of `2/- each post subdivision of face value in
September, 2011.
- The American Depositary Shares (ADSs) through the
conversion of its International Global Depositary Shares into
American Depositary Shares (ADSs) are listed on the New York
Stock Exchange (NYSE) since September, 27, 2004. 99,604,051
ADSs were outstanding as on the year end.
- The Global Depositary Shares (GDSs) issued in October
2009 are listed on the Luxembourg Stock Exchange and the
GDSs were also traded on IOB platform of the London Stock
Exchange. 9,972 GDSs were outstanding as on the year end.
In view of the very few GDSs outstanding and as there was
no trading the Company had deregistered the GDSs from the
said IOB trading platform w.e.f. May 23, 2013.
The following are the details of the Company’s ADSs/GDSs:
Type ADS GDS
Stock Exchange
& Address
New York SE,
20 Broad Street
New York
NY 100 005
Luxembourg SE,
11, Avenue de
la porte- Neuve,
L- 2227
Luxembourg
Ticker Symbol TTM TTMT LX
Description Common Shares Common Shares
ISIN US8765685024 US8765686014
CUSIP 876568502 876568601
SEDOL B02ZP96 B4YT1P2
Two-way Fungibility of Depositary Receipts
The Company offers foreign investors a limited facility for
conversion of Ordinary Shares into American Depositary Receipts/
Global Depository Receipts within the limits permissible for two-
way Fungibility, as announced by the Reserve Bank of India vide
its operative guidelines for the limited two way fungibility under
the “Issue of Foreign Currency Convertible Bond and Ordinary
Shares (through Depository Receipt Mechanism) Scheme, 1993”,
circular dated February 13, 2002.
Foreign Currency Convertible Notes
The following are the relevant details of the notes:
Security
Type
ISIN CUSIP Listing at
4% Notes
(due 2014)
XS0457793510 045779351 Luxembourg
Stock
Exchange, 1,
Avenue de la
porte – Neuve,
L – 2227,
Luxembourg
741-4% Convertible Notes (due 2014) of US$100,000
each aggregating US$74.1 million issued in October 2009
were outstanding as on the year end and may, at the
option of the Note holders, be converted into Ordinary
Shares of `2/- each at `120.119 per share or ADS/GDS of
`10/- each (each ADS represents five Ordinary Shares of ̀ 2/- each)
at `600.595 (Reset Price) at any time into GDSs before October 16,
2014.
(... contd for Top Shareholders ‘A’ Ordinary Shares)

68th ANNUAL REPORT 2012-13
112
Overseas Depositary Domestic Custodian
Citibank N.A., 388 Greenwich
Street, 14th Floor,
New York, NY 10013
Citibank N.A., Trent House,
3rd Floor, G-60, Bandra Kurla
Complex, Bandra (East),
Mumbai 400 051
On April 16, 2013 the Company has announced an early redemption
of outstanding notes on June 10, 2013 at a redemption price
equal to US $106,572.52 for every note of US $100,000 each as per
the terms of its issue. As on date 435 Notes remained outstanding
consequent upon 306 Notes being converted into 11,789,695
Ordinary Shares / Shares represented by ADSs, as per the terms of
issue.
Other Securities
There are no outstanding warrants issued by the Company.
Apart from the said Shares and Convertible Instruments, the
following Non Convertible Debentures (NCDs) are listed on
the National Stock Exchange under Wholesale Debt Market
segment*:
Series
No.
ISIN Principal
Amount
(` crores)
Redemption
Premium
(` crores)
Yield to
Maturity
(%)
Date of
Maturity
E 21 INE155A07185 1,800 658.05 8.45 March 31, 2014
INE155A07193 1,250 919.23 10.03 March 31, 2016
E 22 INE155A07219 200 Nil 9.95 March 2, 2020
E 22A INE155A07227 500 Nil 10.25 `100 crores
each on
April 30, 2022,
April 30, 2023;
`150 crores
each on
April 30, 2024,
April 30, 2025
E 23A INE155A08043 150 Nil 9.90 May 7, 2020
E 23B INE155A08050 100 Nil 9.75 May 24, 2020
E 23C INE155A08068 150 Nil 9.70 June18, 2020
E 24A INE155A08076 250 Nil 10.00 May 26, 2017
E 24B INE155A08084 250 Nil 10.00 May 28, 2019
E 24C INE155A08092 300 Nil 9.85 March 30, 2015
E 24D INE155A08100 300 Nil 9.84 March 10, 2017
E 24E INE155A08118 200 Nil 9.69 March 29, 2019
E 24F INE155A08126 200 Nil 9.45 March 29, 2018
E 25A INE155A08134 300 Nil 9.22 December 1, 2015
E 25B INE155A08142** 300 Nil 9.15 June 3, 2015
E 25C INE155A08159** 300 Nil 9.05 October 30, 2015
E 25D INE155A08167** 300 Nil 8.95 April 29, 2016
E 25E INE155A08175** 300 Nil 8.73 May 17, 2016
*Detailed information on the above debentures is included in the ‘Notes to Accounts’.** Listed after March 31, 2013.
The Trustees for all the above debentures is Vijaya Bank, Merchant
Banking Division, Head Office, 41/2, M.G. Road, Trinity Circle,
Bangalore – 560 001
PLANT LOCATIONS
Location Range of Products
Produced
Pimpri, Pune – 411 018;
Chikhali, Pune – 410 501;
Chinchwad, Pune – 411 033
Medium and Heavy
Commercial Vehicles
(M&HCVs), Light
Commercial Vehicles (LCVs),
Utility Vehicles (UVs) and Cars
Jamshedpur – 831 010 M&HCVs
Chinhat Industrial Area,
Lucknow – 226 019
M&HCVs and LCVs
Plot No. 1, Sector 11 and
Plot No. 14, Sector 12,
I.I.E., Pantnagar, District
Udhamsingh Nagar,
Uttarakhand – 263 145
LCVs
Revenue Survey No. 1, Village
Northkotpura, Tal, Sanand,
Dist. Ahmedabad – 380 015
Cars
KIADB Block II, Belur Industrial
Area, Mummigatti Post,
Dharwad – 580 011
LCVs
Action required regarding non-receipt of dividends,
proceeds of matured deposits and interest as also redeemed
debentures and interest thereon:
(i) Pursuant to Sections 205A and 205C of the Act, all unclaimed/
unpaid dividend, application money, debenture interest
and interest on deposits as well as principal amount of
debentures and deposits pertaining to the Company and
erstwhile Tata Finance Limited (TFL) remaining unpaid or
unclaimed for a period of 7 years from the date they became
due for payment, have been transferred to the Investors
Education and Protection Fund (IEPF) established by the
Central Government.
(ii) In case of non receipt/non encashment of the dividend
warrants, Members are requested to correspond with
the Company’s Registrars/the Registrar of Companies, as
mentioned hereunder:
Dividend for
Whether it can be claimed
Contact Office
Action to be taken
2006-07 to 2011-12
Yes TSR Darashaw Private Limited
Letter on plain paper.
2002-03 to 2005-06
No - None. Already transferred to IEPF. In respect of 2005-06, would be transferred in July 2013

Corporate Governance (98-114)
113
CORPORATE OVERVIEW FINANCIAL HIGHLIGHTS FINANCIAL STATEMENTSSTATUTORY REPORTS
Dividend for
Whether it can be claimed
Contact Office
Action to be taken
2000-01 and 2001-02
N.A. - Not Applicable due to non declaration of dividend.
1995-96 to 1999-2000
No - None. Already transferred to IEPF.
1978-79 to 1994-95
Yes Office of the Registrar of Companies, CGO Complex,
Claim in Form No. II of the Companies Unpaid Dividend
‘A’ Wing, 2nd floor, Next to RBI, CBD – Belapur, Navi Mumbai – 400614. Maharashtra 91 22 2757 6802
(Transfer to General Revenue Account of the Central Government) Rules, 1978.
(iii) Following table gives information relating to outstanding
dividend accounts and due dates for claiming dividend:
Financial
Year
Date of Declaration Last date for
claiming dividend *
2005-06 July 11, 2006 July 10, 2013
2006-07 July 9, 2007 July 8, 2014
2007-08 July 24, 2008 July 23, 2015
2008-09 August 25, 2009 August 24, 2016
2009-10 September 1, 2010 August 31, 2017
2010-11 August 12, 2011 August 11, 2018
2011-12 August 10, 2012 August 9, 2019
*Indicative dates. Actual dates may vary.
(iv) The Company transferred `165,657,427.34 to IEPF including
the following amounts during the year.
(in `)
Particulars FY 12-13
Unpaid dividend amounts of the Company 14,034,638
Application moneys received for allotment of
any securities and due for refund
0
Unpaid matured deposit with the Company 24,000
Unpaid matured debentures with the Company 0
Interest accrued on matured deposits with the
Company
14,760
Interest accrued on matured debentures with
the Company
0
Total 14,073,398
(v) While the Company’s Registrar has already written to the Members, Debenture holders and Depositors informing them about the due dates for transfer to IEPF for unclaimed dividends/interest payments, attention of the stakeholders is again drawn to this matter through the Annual Report.
(vi) Investors of the Company and of the erstwhile TFL who have not yet encashed their unclaimed/unpaid amounts are requested to do so at the earliest.
(vii) Other facilities / issues of interest to shareholders holding shares in physical form:
� As per Clause 5A of the Listing Agreement, the Company has sent 9915 reminders in February 2013 to those shareholders whose certificates have been returned undelivered. These certificates are currently lying with the Registrar and Transfer Agents of the Company. Members, holding Company’s shares in physical form, are requested to tally their holding with the certificates in their possession and revert in case of any discrepancy in holdings. In case there is no response after three reminders, the unclaimed shares shall be transferred to one folio in the name of ”Unclaimed Suspense Account” and the voting rights on such shares shall remain frozen till the rightful owner claims the shares.
� Nomination facility: Shareholders, who hold shares in
single name or wish to make / change the nomination in
respect of their shares as permitted under Section 109A
of the Act, may submit to the Registrars and Transfer
Agents, the prescribed Form 2B.

68th ANNUAL REPORT 2012-13
114
DECLARATION BY THE CEO UNDER CLAUSE 49 OF THE LISTING AGREEMENT REGARDING ADHERENCE TO THE CODE OF
CONDUCT
In accordance with Clause 49 sub-clause I(D) of the Listing Agreement with the Stock Exchanges, I hereby confirm that, all the Directors
and the Senior Management personnel of the Company have affirmed compliance to their respective Codes of Conduct, as applicable
to them for the Financial Year ended March 31, 2013.
For Tata Motors Limited
Karl Slym
Managing Director
Mumbai, May 29, 2013
PRACTISING COMPANY SECRETARIES’ CERTIFICATE ON CORPORATE GOVERNANCE
TO THE MEMBERS OF TATA MOTORS LIMITED
We have examined the compliance of the conditions of Corporate Governance by Tata Motors Limited (the Company) for the year
ended on March 31, 2013, as stipulated in clause 49 of the Listing Agreement of the company with the Stock Exchanges.
The compliance of the conditions of Corporate Governance is the responsibility of the management. Our examination was limited
to a review of procedures and implementation thereof, adopted by the company for ensuring the compliance of the conditions of
Corporate Governance. It is neither an audit nor an expression of opinion on the financial statements of the company.
In our opinion and to the best of our information and according to the explanations given to us, and the representations made by the
Directors and the Management, we certify that the Company has complied with the conditions of Corporate Governance as stipulated
in the above mentioned Listing Agreement.
We state that such compliance is neither an assurance as to the future viability of the company nor of the efficiency or effectiveness with
which the management has conducted the affairs of the company.
For Parikh & Associates
Practising Company Secretaries
P N PARIKH
(Partner)
FCS: 327 CP: 1228
Mumbai, May 29, 2013

Secretarial Audit Report (115)
115
CORPORATE OVERVIEW FINANCIAL HIGHLIGHTS FINANCIAL STATEMENTSSTATUTORY REPORTS
To
The Board of Directors
TATA MOTORS LIMITED
Bombay House, 24 Homi Modi Street, Mumbai 400001
Company No.: L28920MH1945PLC004520
Authorised Capital: Rs. 3900 Crores
We have examined the registers, records, books and papers of
TATA MOTORS LIMITED (“the Company”) as required to be
maintained under the Companies Act, 1956, (the Act) and the rules
made there under and the provisions contained in the Memorandum
and Articles of Association of the Company as also under the listing
agreement with the Stock Exchange and the regulations of SEBI as
applicable for the year ended March 31, 2013:
1. In our opinion and to the best of our information and according
to the examinations carried out by us and explanations furnished
and representations made to us by the Company, its officers
and agents, we report that the Company has complied with
the provisions of the Act, the Rules made thereunder and the
Memorandum and Articles of Association of the Company with
regard to:
a) maintenance of various statutory registers and documents
and making necessary entries therein;
b) closure of Register of Members/record date for debenture
holders;
c) forms, returns, documents and resolutions required to be filed
with the Registrar of Companies, Regional Director, Central
Government, Company Law Board or other authorities;
d) service of documents by the Company on its Members,
Debenture holders, Stock Exchanges, Auditors and the
Registrar of Companies;
e) notice of Board and various Committee meetings of
Directors;
f ) meetings of Directors and all the Committees of Directors
and passing of circular resolutions;
g) notice and convening of Annual General Meeting held on
10th August 2012;
h) minutes of the proceedings of the Board Meetings,
Committee Meetings and General Meetings;
i) approvals of the Board of Directors, Committee of Directors,
Members and government authorities, wherever required;
j) constitution of the Board of Directors, Committees of
Directors and appointment, retirement and reappointment
of Directors including Managing Directors and Executive
Directors;
k) payment of remuneration to Directors, Managing Directors
and Executive Directors;
l) appointment and remuneration of Statutory Auditors and
Cost Auditors;
m) transfer and transmission of the Company’s shares, issue and
allotment of shares and issue and delivery of certificates of
shares;
n) declaration and payment of dividend;
o) transfer of amounts as required under the Act to the Investor
Education and Protection Fund;
p) borrowings and registration of charges;
q) report of the Board of Directors;
r) investment of the Company’s funds including inter corporate
loans and investments;
s) generally, all other applicable provisions of the Act and the
Rules there under.
2. We further report that:
a) the Directors have complied with the requirements as
to disclosure of interests and concerns in contracts and
arrangements, shareholdings and directorships in other
Companies and interest in other entities;
b) the Directors have complied with the disclosure requirements
in respect to their eligibility of appointment, their being
independent, compliance with the code of conduct for
Directors and Senior Management Personnel as per clause
49 of the listing agreement and with the Insider Trading code
of conduct and;
c) the Company has obtained all necessary approvals under
various provisions of the Act where necessary;
d) there was no prosecution initiated against or show cause
notice received by the Company during the year under
review under the Companies Act, SEBI Act, Depositories
Act, Listing Agreement and rules, regulations and guidelines
under these Acts.
3. We further report that:
a) the Company has complied with the requirements under the
Equity Listing Agreements entered into with the BSE Limited
and the National Stock Exchange of India Limited;
b) the Company has complied with the requirements under the
Debt Listing Agreement for the securities listed on Wholesale
Debt Market segment of National Stock Exchange of India
Limited;
c) the Company has complied with the provisions of the
Securities and Exchange Board of India (Substantial
Acquisition of Shares and Takeovers) Regulations, 2011
including the provisions with regard to disclosures and
maintenance of records required under the Regulations;
d) the Company has complied with the provisions of the
Securities and Exchange Board of India (Prohibition of Insider
Trading) Regulations, 1992 including the provisions with
regard to disclosures and maintenance of records required
under the Regulations;
e) the Company has complied with the provisions of the SEBI
(Depositories and Participants) Regulations, 1996 including
submitting of Reconciliation of Share Capital Audit Reports;
f ) there were no issues during the year which required specific
compliance of the provisions of the Securities and Exchange
Board of India (Issue of Capital and Disclosure Requirements )
Regulations, 2009;
g) there were no issues during the year which required specific
compliance of the provisions of the Securities Contracts
(Regulation) Act,1956 (SCRA) and the Rules made under that Act.
For Parikh & Associates
Practising Company Secretaries
P N Parikh
(Partner)
C. P. No. : 1228
Mumbai, May 29, 2013
SECRETARIAL AUDIT REPORT

116
68th ANNUAL REPORT 2012-13
INDEPENDENT AUDITORS’ REPORT
TO THE MEMBERS OF
TATA MOTORS LIMITED
Report on the Financial Statements
We have audited the accompanying financial statements of TATA MOTORS LIMITED (“the Company”), which comprise the Balance Sheet as at March
31, 2013, the Profit and Loss Statement and the Cash Flow Statement for the year then ended, and a summary of the significant accounting policies and
other explanatory information.
Management’s Responsibility for the Financial Statements
The Company’s Management is responsible for the preparation of these financial statements that give a true and fair view of the financial position,
financial performance and cash flows of the Company in accordance with the Accounting Standards referred to in Section 211(3C) of the Companies Act,
1956 (“the Act”) and in accordance with the accounting principles generally accepted in India. This responsibility includes the design, implementation
and maintenance of internal control relevant to the preparation and presentation of the financial statements that give a true and fair view and are free
from material misstatement, whether due to fraud or error.
Auditors’ Responsibility
Our responsibility is to express an opinion on these financial statements based on our audit. We conducted our audit in accordance with the Standards
on Auditing issued by the Institute of Chartered Accountants of India. Those Standards require that we comply with ethical requirements and plan and
perform the audit to obtain reasonable assurance about whether the financial statements are free from material misstatement.
An audit involves performing procedures to obtain audit evidence about the amounts and the disclosures in the financial statements. The procedures
selected depend on the auditor’s judgment, including the assessment of the risks of material misstatement of the financial statements, whether due to
fraud or error. In making those risk assessments, the auditor considers internal control relevant to the Company’s preparation and fair presentation of
the financial statements in order to design audit procedures that are appropriate in the circumstances, but not for the purpose of expressing an opinion
on the effectiveness of the Company’s internal control. An audit also includes evaluating the appropriateness of the accounting policies used and the
reasonableness of the accounting estimates made by the Management, as well as evaluating the overall presentation of the financial statements.
We believe that the audit evidence we have obtained is sufficient and appropriate to provide a basis for our audit opinion.
Opinion
In our opinion and to the best of our information and according to the explanations given to us, the aforesaid financial statements give the information
required by the Act in the manner so required and give a true and fair view in conformity with the accounting principles generally accepted in India:
(a) in the case of the Balance Sheet, of the state of affairs of the Company as at March 31, 2013;
(b) in the case of the Profit and Loss Statement, of the profit of the Company for the year ended on that date; and
(c) in the case of the Cash Flow Statement, of the cash flows of the Company for the year ended on that date.
Report on Other Legal and Regulatory Requirements
1. As required by the Companies (Auditor’s Report) Order, 2003 (“the Order”) issued by the Central Government in terms of Section 227(4A) of the
Act, we give in the Annexure a statement on the matters specified in paragraphs 4 and 5 of the Order.
2. As required by Section 227(3) of the Act, we report that:
(a) We have obtained all the information and explanations which to the best of our knowledge and belief were necessary for the purposes of
our audit.
(b) In our opinion, proper books of account as required by law have been kept by the Company so far as it appears from our examination of
those books.
(c) The Balance Sheet, the Profit and Loss Statement, and the Cash Flow Statement dealt with by this report are in agreement with the books
of account.
(d) In our opinion, the Balance Sheet, the Profit and Loss Statement, and the Cash Flow Statement comply with the Accounting Standards
referred to in Section 211(3C) of the Act.
(e) On the basis of the written representations received from the directors as on March 31, 2013 taken on record by the Board of Directors,
none of the directors is disqualified as on March 31, 2013 from being appointed as a director in terms of Section 274(1)(g) of the Act.
For DELOITTE HASKINS & SELLS
Chartered Accountants
(Firm Registration No. 117366W)
N. VENKATRAM
Partner
MUMBAI, May 29, 2013 (Membership No. 71387)

117
Standalone Financials (116-159)
CORPORATE OVERVIEW FINANCIAL HIGHLIGHTS FINANCIAL STATEMENTSSTATUTORY REPORTS
(Referred to in paragraph 1 under “Report on Other Legal and Regulatory Requirements” section of our report of even date)
(i) Having regard to the nature of the Company’s business / activities / results during the year, clauses (xiii) and (xiv) of paragraph 4 of the Order are
not applicable to the Company.
(ii) In respect of its fixed assets:
(a) The Company has maintained proper records showing full particulars, including quantitative details and situation of fixed assets;
(b) The fixed assets were physically verified during the year by the Management in accordance with a regular programme of verification
which, in our opinion, provides for physical verification of all the fixed assets at reasonable intervals. According to the information and
explanations given to us, no material discrepancies were noticed on such verification;
(c) The fixed assets disposed off during the year, in our opinion, do not constitute a substantial part of the fixed assets of the Company and
such disposal has, in our opinion, not affected the going concern status of the Company.
(iii) In respect of its inventories:
(a) As explained to us, the stock of finished goods (other than a significant part of the spare parts held for sale) and work-in-progress in the
Company’s custody have been physically verified by the Management as at the end of the financial year, before the year-end or after the
year-end, and in respect of stocks of stores and spares, the aforesaid spare parts held for sale and raw materials in the Company’s custody,
there is a perpetual inventory system and a substantial portion of the stocks have been verified during the year. In our opinion, the
frequency of verification is reasonable. In case of materials and spare parts held for sale lying with the third parties, certificates confirming
stocks have been received in respect of a substantial portion of the stocks held during the year or at the year-end;
(b) In our opinion and according to the information and explanations given to us, the procedures of physical verification of inventories
followed by the Management were reasonable and adequate in relation to the size of the Company and the nature of its business;
(c) In our opinion and according to the information and explanations given to us, the Company has maintained proper records of its inventories
and no material discrepancies were noticed on physical verification.
(iv) In respect of loans, secured or unsecured, granted by the Company to companies, firms or other parties covered in the Register maintained under
Section 301 of the Companies Act, 1956, according to the information and explanations given to us:
(a) The Company has granted unsecured loans aggregating ` 194.36 crores to two parties during the year. At the year-end, the outstanding
balances of such loans granted aggregated ` 711.07 crores (number of parties - three) and the maximum amount involved during the year
was ` 794.46 crores (number of parties - four).
(b) The rate of interest and other terms and conditions of such loans are, in our opinion, prima facie not prejudicial to the interest of the
Company having regard to the business relationship with the Company to whom loans have been granted.
(c) The receipts of principal amount have been as per stipulations. However, there have been delays in receipts of interest.
(d) There are no overdue amounts in respect of principal amount outstanding. In respect of overdue interest amounts of more than rupees
one lakh remaining outstanding as at the year-end, except in respect of interest outstanding from a subsidiary company for which the
provision has been made, the Management has taken reasonable steps for the recovery of the overdue interest amounts.
In respect of loans, secured or unsecured, taken by the Company from companies, firms or other parties covered in the Register maintained under
Section 301 of the Companies Act, 1956, according to the information and explanations given to us:
(a) The Company has not taken loans from parties during the year. At the year-end, the outstanding balances of such loans taken aggregated
` Nil (number of parties Nil) and the maximum amount involved during the year was ` 0.26 crores (number of parties - one).
(b) The rate of interest and other terms and conditions of such loans taken are, in our opinion, prima facie not prejudicial to the interests of
the Company.
(c) The payments of principal amounts and interest in respect of such loans are regular.
(v) In our opinion and according to the information and explanations given to us, having regard to the explanations that some of the items purchased
are of special nature and suitable alternative sources are not readily available for obtaining comparable quotations, there exists an adequate
internal control system commensurate with the size of the Company and the nature of its business with regard to purchases of inventory and
fixed assets and with regard to the sale of goods and services. During the course of our audit, we have not observed any major weakness in such
internal control system.
(vi) In respect of contracts or arrangements entered in the Register maintained in pursuance of Section 301 of the Companies Act, 1956, to the best
of our knowledge and belief and according to the information and explanations given to us:
(a) The particulars of contracts or arrangements referred to in Section 301 that needed to be entered in the Register maintained under the
said Section have been so entered.
ANNEXURE TO THE INDEPENDENT AUDITORS’ REPORT

118
68th ANNUAL REPORT 2012-13
(b) Where each of such transaction is in excess of rupees five lakhs in respect of any party, and having regard to the para (v) above, the
transactions have been made at prices which are prima facie reasonable having regard to the prevailing market prices at the relevant
time.
(vii) In our opinion and according to the information and explanations given to us, the Company has complied with the provisions of Sections 58A,
58AA or any other relevant provisions of the Companies Act, 1956 and the Companies (Acceptance of Deposits) Rules, 1975 with regard to the
deposits accepted from the public. According to the information and explanations given to us, no order has been passed by the Company Law
Board or the National Company Law Tribunal or the Reserve Bank of India or any Court or any other Tribunal.
(viii) In our opinion, the Company has an adequate internal audit system commensurate with the size and the nature of its business.
(ix) We have broadly reviewed the cost records maintained by the Company pursuant to the Companies (Cost Accounting Records) Rules, 2011
prescribed by the Central Government under Section 209 (1)(d) of the Companies Act, 1956 and are of the opinion that prima facie, the prescribed
cost records have been maintained. We have, however, not made a detailed examination of the cost records with a view to determine whether
they are accurate or complete.
(x) According to the information and explanations given to us in respect of statutory dues:
(a) The Company has generally been regular in depositing undisputed statutory dues, including Provident Fund, Investor Education and
Protection Fund, Employees’ State Insurance, Income-tax, Sales Tax, Wealth Tax, Service Tax, Customs Duty, Excise Duty, Cess and other
material statutory dues applicable to it with the appropriate authorities. With regard to the contribution under the Employees’ Deposit
Linked Insurance Scheme, 1976 (the Scheme), we are informed that the Company has its own Life Cover Scheme, and consequently, an
application has been made seeking an extension of exemption from contribution to the Scheme, which is awaited.
(b) There were no undisputed amounts payable in respect of Provident Fund, Investor Education and Protection Fund, Employees’ State
Insurance, Income-tax, Sales Tax, Wealth Tax, Service Tax, Customs Duty, Excise Duty, Cess and other material statutory dues in arrears as at
March 31, 2013 for a period of more than six months from the date they became payable.
(c) Details of dues of Income-tax, Sales Tax, Wealth Tax, Service Tax, Customs Duty, Excise Duty and Cess which have not been deposited as on
March 31, 2013 on account of disputes are given below:
Name of
Statute
Nature of Dues Forum where
Dispute is Pending
Period to which the Amount Relates Amount Involved
(` in crores.)
Income tax Income tax Commissioner (Appeals) 2003-04 to 2009-10 44.97
Income tax Appellate Tribunal 2007-08 3.40
Central Excise Excise Duty & Service Tax Tribunal 1993-94, 1999-00, 2002-03, 2004-05 to 2012-13 2249.15
Laws Excise Duty & Service Tax Commissioner (Appeals) 1984-85, 1995-96, 2003-04, 2006-07, 2010-11,
2011-12, 2012-13
83.13
Excise Duty & Service Tax Additional Commissioner 2012-13 0.66
Excise Duty & Service Tax Joint Commissioner 2012-13 0.21
Excise Duty & Service Tax Deputy Commissioner 2012-13 0.04
Excise Duty & Service Tax Asst. Commissioner 2012-13 0.09
Sales Tax Laws Sales Tax Supreme Court 1995-96 13.01
Sales Tax High Court 1984-85 to 1988-89, 1990-91, 1993-94, 1994-95,
1997-98, 1999-00, 2005-06 to 2007-08
18.83
Sales Tax Tribunal 1988-89, 1989-90, 1995-96, 1998-99, 1999-00,
2000-01, 2004-05, 2007-08, 2010-11
7.21
Sales Tax Commissioner (Appeals) 1996-97, 1998-99, 2001-02 0.20
Sales Tax Joint Commissioner 1997-98, 1999-00, 2001-02 to 2008-09 222.33
Sales Tax Additional Commissioner 1988-89, 1989-90, 1995-96, 1997-98, 2005-06 to
2009-10, 2012-13
19.46
Sales Tax Deputy Commissioner 1979-80, 1986-87, 1991-92, 1992-93, 1994-95 to
1997-98, 2000-01, 2003-04, 2005-06, 2008-09
3.68
Sales Tax Assistant Commissioner 1986-87, 1988-89, 1990-91, 1995-96, 1997-98,
1999-00, 2010-11
1.06
Sales Tax Trade Tax Officer 1995-96, 1996-97, 1998-99 to 2000-01, 2006-07 1.83
ANNEXURE TO THE INDEPENDENT AUDITORS’ REPORT

119
Standalone Financials (116-159)
CORPORATE OVERVIEW FINANCIAL HIGHLIGHTS FINANCIAL STATEMENTSSTATUTORY REPORTS
(xi) The Company does not have any accumulated losses at the end of the financial year and has not incurred cash losses during the financial year
covered by our audit and the immediately preceding financial year.
(xii) In our opinion and according to the information and explanations given to us, the Company has not defaulted in the repayment of dues to
financial institutions, banks and debenture holders.
(xiii) Based on our examination of the records and the information and explanations given to us, the Company has not granted any loans and advances
on the basis of security by way of pledge of shares, debentures and other securities.
(xiv) In our opinion and according to the information and explanations given to us, the Company has not given any guarantee for loans taken by others
from banks or financial institutions.
(xv) In our opinion and according to the information and explanations given to us, the term loans have been applied by the Company during the year
for the purposes for which they were obtained.
(xvi) In our opinion and according to the information and explanations given to us and on an overall examination of the Balance Sheet of the Company,
as at March 31, 2013, we report that funds raised on short term basis of ̀ 8,439.39 crores have been used during the year for long-term investment.
Further the Company has explained that steps are being taken to augment long term funds.
(xvii) According to the information and explanations given to us, the Company has not made any preferential allotment of shares to parties and
companies covered in the Register maintained under Section 301 of the Companies Act, 1956.
(xviii) According to the information and explanations given to us, during the period covered by our audit report, the Company has not issued any
secured debentures.
(xix) According to the information and explanations given to us, during the year covered by our audit report, the Company has not raised any money
by public issue.
(xx) To the best of our knowledge and according to the information and explanations given to us, no fraud by the Company and no material fraud on
the Company has been noticed or reported during the year.
For DELOITTE HASKINS & SELLS
Chartered Accountants
(Firm Registration No. 117366W)
N. VENKATRAM
Partner
(Membership No. 71387)
MUMBAI, May 29, 2013
ANNEXURE TO THE INDEPENDENT AUDITORS’ REPORT
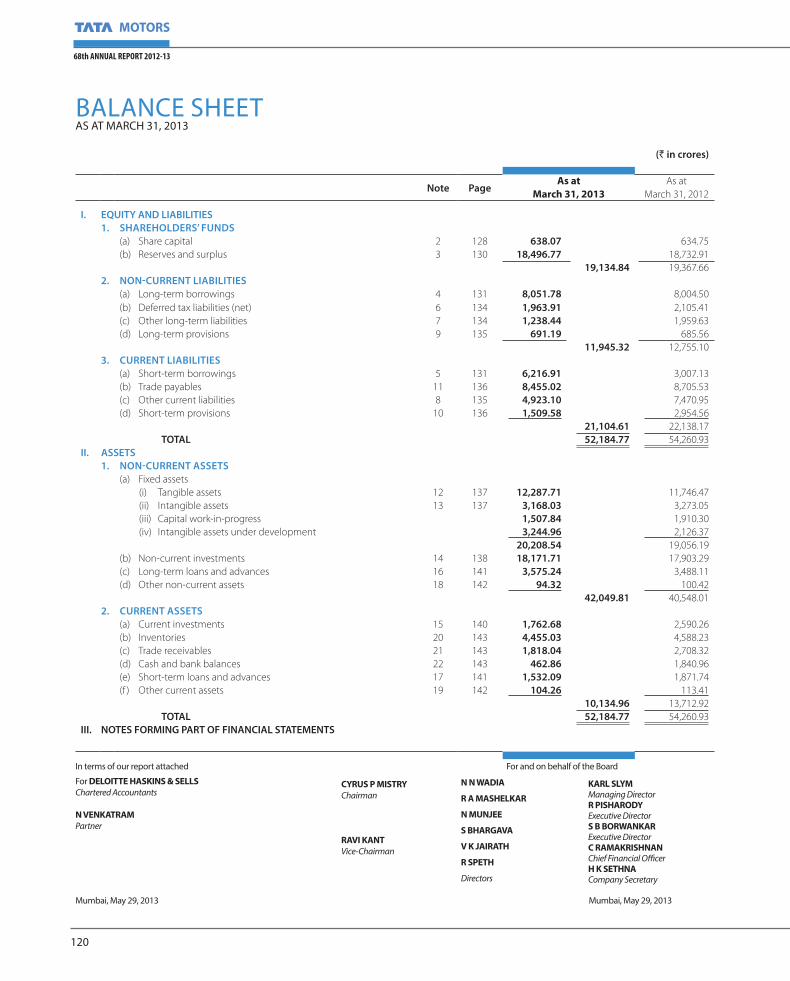
120
68th ANNUAL REPORT 2012-13
BALANCE SHEET AS AT MARCH 31, 2013
In terms of our report attached For and on behalf of the Board
For DELOITTE HASKINS & SELLS Chartered Accountants
N VENKATRAM
Partner
Mumbai, May 29, 2013 Mumbai, May 29, 2013
N N WADIA
R A MASHELKAR
N MUNJEE
S BHARGAVA
V K JAIRATH
R SPETH
Directors
CYRUS P MISTRY
Chairman
RAVI KANT
Vice-Chairman
KARL SLYM
Managing Director R PISHARODY
Executive DirectorS B BORWANKAR
Executive DirectorC RAMAKRISHNAN
Chief Financial OfficerH K SETHNA
Company Secretary
(` in crores)
Note PageAs at
March 31, 2013
As at
March 31, 2012
I. EQUITY AND LIABILITIES
1. SHAREHOLDERS’ FUNDS
(a) Share capital 2 128 638.07 634.75
(b) Reserves and surplus 3 130 18,496.77 18,732.91
19,134.84 19,367.66
2. NON-CURRENT LIABILITIES
(a) Long-term borrowings 4 131 8,051.78 8,004.50
(b) Deferred tax liabilities (net) 6 134 1,963.91 2,105.41
(c) Other long-term liabilities 7 134 1,238.44 1,959.63
(d) Long-term provisions 9 135 691.19 685.56
11,945.32 12,755.10
3. CURRENT LIABILITIES
(a) Short-term borrowings 5 131 6,216.91 3,007.13
(b) Trade payables 11 136 8,455.02 8,705.53
(c) Other current liabilities 8 135 4,923.10 7,470.95
(d) Short-term provisions 10 136 1,509.58 2,954.56
21,104.61 22,138.17
TOTAL 52,184.77 54,260.93
II. ASSETS
1. NON-CURRENT ASSETS
(a) Fixed assets
(i) Tangible assets 12 137 12,287.71 11,746.47
(ii) Intangible assets 13 137 3,168.03 3,273.05
(iii) Capital work-in-progress 1,507.84 1,910.30
(iv) Intangible assets under development 3,244.96 2,126.37
20,208.54 19,056.19
(b) Non-current investments 14 138 18,171.71 17,903.29
(c) Long-term loans and advances 16 141 3,575.24 3,488.11
(d) Other non-current assets 18 142 94.32 100.42
42,049.81 40,548.01
2. CURRENT ASSETS
(a) Current investments 15 140 1,762.68 2,590.26
(b) Inventories 20 143 4,455.03 4,588.23
(c) Trade receivables 21 143 1,818.04 2,708.32
(d) Cash and bank balances 22 143 462.86 1,840.96
(e) Short-term loans and advances 17 141 1,532.09 1,871.74
(f ) Other current assets 19 142 104.26 113.41
10,134.96 13,712.92
TOTAL 52,184.77 54,260.93
III. NOTES FORMING PART OF FINANCIAL STATEMENTS

121
Standalone Financials (116-159)
CORPORATE OVERVIEW FINANCIAL HIGHLIGHTS FINANCIAL STATEMENTSSTATUTORY REPORTS
In terms of our report attached For and on behalf of the Board
For DELOITTE HASKINS & SELLS Chartered Accountants
N VENKATRAM
Partner
Mumbai, May 29, 2013 Mumbai, May 29, 2013
N N WADIA
R A MASHELKAR
N MUNJEE
S BHARGAVA
V K JAIRATH
R SPETH
Directors
CYRUS P MISTRY
Chairman
RAVI KANT
Vice-Chairman
KARL SLYM
Managing Director R PISHARODY
Executive DirectorS B BORWANKAR
Executive DirectorC RAMAKRISHNAN
Chief Financial OfficerH K SETHNA
Company Secretary
PROFIT AND LOSS STATEMENT FOR THE YEAR ENDED MARCH 31, 2013
(` in crores)
Note Page 2012-2013 2011-2012
I. REVENUE FROM OPERATIONS 23 (1) 144 49,319.73 59,220.94
Less : Excise duty (4,554.01) (4,914.38)
44,765.72 54,306.56
II. OTHER INCOME 23 (2) 144 2,088.20 574.08
III. TOTAL REVENUE (I + II) 46,853.92 54,880.64
IV. EXPENSES :
(a) Cost of materials consumed 39 157 27,244.28 33,894.82
(b) Purchase of products for sale 33 155 5,864.45 6,433.95
(c) Changes in inventories of finished goods, work-in-progress,
and products for sale (143.60) (623.84)
(d) Employee cost / benefits expense 24 145 2,837.00 2,691.45
(e) Finance cost 25 145 1,387.76 1,218.62
(f ) Depreciation and amortisation expense 137 1,817.62 1,606.74
(g) Product development expense / Engineering expenses 425.76 234.25
(h) Other expenses 26 145 7,773.65 8,405.51
(i) Expenditure transferred to capital and other accounts (953.80) (907.13)
TOTAL EXPENSES 46,253.12 52,954.37
V. PROFIT BEFORE EXCEPTIONAL ITEMS,
EXTRAORDINARY ITEMS AND TAX (III - IV) 600.80 1,926.27
VI. EXCEPTIONAL ITEMS
(a) Exchange loss (net) including on revaluation of foreign
currency borrowings, deposits and loans 263.12 455.24
(b) Provision for loan given to a subsidiary 245.00 130.00
(c) Profit on sale of a division 43 (ii) 159 (82.25) -
425.87 585.24
VII. PROFIT BEFORE EXTRAORDINARY ITEMS AND TAX (V - VI) 174.93 1,341.03
VIII. Extraordinary items - -
IX. PROFIT BEFORE TAX FROM CONTINUING OPERATIONS (VII - VIII) 174.93 1,341.03
X. Tax (credit) / expense 6 (b) 134 (126.88) 98.80
XI. PROFIT AFTER TAX FOR THE YEAR
FROM CONTINUING OPERATIONS (IX - X) 301.81 1,242.23
XII. EARNINGS PER SHARE 27 146
A. Ordinary shares (Face value of ` 2 each)
a. Basic ` 0.93 3.90
b. Diluted ` 0.93 3.77
B. ‘A’ Ordinary shares (Face value of ` 2 each)
a. Basic ` 1.03 4.00
b. Diluted ` 1.03 3.87
XIII. NOTES FORMING PART OF FINANCIAL STATEMENTS

122
68th ANNUAL REPORT 2012-13
CASH FLOW STATEMENTFOR THE YEAR ENDED MARCH 31, 2013
(` in crores)
2012-2013 2011-2012
A. Cash flows from Operating Activities
Profit after tax 301.81 1,242.23
Adjustments for:
Depreciation / amortisation 1,817.62 1,606.74
Lease equalisation adjusted in income (4.52) (4.52)
Loss / (profit) on sale of assets (net) (including assets scrapped / written off ) 2.96 (1.79)
Profit on sale of investments (net) (43.91) (29.78)
Profit on sale of a division (82.25) -
Provision for loan given to a subsidiary 245.00 130.00
Provision for loans and inter-corporate deposits (net) 5.29 -
Reversal of Provision for diminution in value of long-term investments (9.67) -
Tax (credit) / expense (126.88) 98.80
Interest / dividend (net) (656.52) 674.32
Exchange differences 199.39 587.59
1,346.51 3,061.36
Operating Profit before working capital changes 1,648.32 4,303.59
Adjustments for:
Inventories 129.42 (696.84)
Trade receivables 890.28 (92.79)
Finance receivables 64.76 144.97
Other current and non-current assets (138.30) 33.80
Trade payables and acceptances (249.93) (78.02)
Other current and non-current liabilities (381.50) 171.32
Provisions 188.06 204.04
502.79 (313.52)
Cash generated from operations 2,151.11 3,990.07
Income taxes credit / (paid) (net) 107.33 (336.48)
Net cash from operating activities 2,258.44 3,653.59
B. Cash flows from Investing Activities Payments for fixed assets (2,605.39) (2,852.56)
Proceeds from sale of fixed assets 16.95 17.09
Proceeds from sale of a division 110.00 -
Loans to associates and subsidiaries (194.36) (86.92)
Advance towards investments in subsidiary companies (16.82) (122.86)
Advance towards investments in other companies - (25.00)
Investments in joint venture - (42.50)
Investments in subsidiary companies (186.12) (1,684.01)
Investments in associate companies (0.01) (4.45)
Investments - others (0.84) -
Investments in mutual funds (purchased) / sold (net) (315.51) 114.78
Decrease in Investments in retained interests in securitisation transactions 0.63 0.18
Redemption of investments in subsidiary companies 1,378.95 4,146.98
Redemption of investments in associate companies 21.00 -
Redemption of investments - others 10.75 0.75
Decrease in short term inter-corporate deposits 43.53 16.04
Deposits of margin money / cash collateral (1.38) (5.85)
Realisation of margin money / cash collateral 91.25 364.24
Fixed / restricted deposits with scheduled banks made (205.85) (868.44)
Fixed / restricted deposits with scheduled banks realised 780.00 665.51
Interest received 404.07 331.11
Dividend received 1,660.65 180.63
Net cash from investing activities 991.50 144.72

123
Standalone Financials (116-159)
CORPORATE OVERVIEW FINANCIAL HIGHLIGHTS FINANCIAL STATEMENTSSTATUTORY REPORTS
CASH FLOW STATEMENTFOR THE YEAR ENDED MARCH 31, 2013
(` in crores)
2012-2013 2011-2012
C. Cash flows from Financing Activities
Expenses on Foreign Currency Convertible Notes (FCCN) / Convertible Alternative
Reference Securities (CARS) conversion (0.23) -
Premium on redemption of FCCN / CARS (including tax) (886.95) (0.97)
Brokerage and other expenses on Non-Convertible Debentures (NCD) (93.02) (76.69)
Premium paid on redemption of NCD (96.55) -
Proceeds from issue of shares held in abeyance 0.16 0.02
Repayment of fixed deposits (1,868.38) (1,069.25)
Proceeds from long term borrowings 2,562.84 2,498.24
Repayment of long term borrowings (3,377.47) (74.94)
Proceeds from short term borrowings 11,873.79 4,442.26
Repayment of short term borrowings (10,177.80) (7,326.24)
Net change in other short term borrowings (with maturity up to three months) 1,287.75 316.61
Dividend paid (including dividend distribution tax) (1,460.41) (1,462.28)
Interest paid [including discounting charges paid, ` 345.06 crores
(2011-2012 ` 365.62 crores)]
(1,809.42) (1,482.35)
Net cash used in financing activities (4,045.69) (4,235.59)
Net decrease in cash and cash equivalents (795.75) (437.28)
Cash and cash equivalents as at March 31, (opening balance) 919.64 1,352.14
Exchange fluctuation on foreign currency bank balances 81.68 4.78
Cash and cash equivalents as at March 31, (closing balance) 205.57 919.64
Non-cash transactions :
Foreign Currency Convertible Notes / Convertible Alternative Reference Securities
converted to ordinary shares 232.83 -
In terms of our report attached For and on behalf of the Board
For DELOITTE HASKINS & SELLS Chartered Accountants
N VENKATRAM
Partner
Mumbai, May 29, 2013 Mumbai, May 29, 2013
N N WADIA
R A MASHELKAR
N MUNJEE
S BHARGAVA
V K JAIRATH
R SPETH
Directors
CYRUS P MISTRY
Chairman
RAVI KANT
Vice-Chairman
KARL SLYM
Managing Director R PISHARODY
Executive DirectorS B BORWANKAR
Executive DirectorC RAMAKRISHNAN
Chief Financial OfficerH K SETHNA
Company Secretary

124
NOTES FORMING PART OF FINANCIAL STATEMENTS
68th ANNUAL REPORT 2012-13
1. Significant accounting policies
(a) Basis of preparation
The financial statements are prepared under the historical cost convention on an accrual basis of accounting in accordance with the generally
accepted accounting principles, Accounting Standards notified under Section 211 (3C) of the Companies Act, 1956 and the relevant provisions
thereof.
(b) Use of estimates
The preparation of financial statements requires management to make judgments, estimates and assumptions, that affect the application of
accounting policies and the reported amounts of assets, liabilities, income, expenses and disclosures of contingent liabilities at the date of
these financial statements and Profit and Loss statement for the years presented. Actual results may differ from these estimates. Estimates and
underlying assumptions are reviewed at each Balance Sheet date. Revisions to accounting estimates are recognised in the period in which the
estimate is revised and future periods affected.
(c) Revenue recognition
The Company recognises revenues on the sale of products, net of discounts and sales incentives, when the products are delivered to the dealer/
customer or when delivered to the carrier for export sales, which is when risks and rewards of ownership pass to the dealer / customer.
Sales include income from services, and exchange fluctuations relating to export receivables. Sales include export and other recurring and
non-recurring incentives from the Government at the national and state levels. Sale of products is presented gross of excise duty where
applicable, and net of other indirect taxes.
Revenues are recognised when collectability of the resulting receivables is reasonably assured.
Dividend from investments is recognised when the right to receive the payment is established and when no significant uncertainty as to
measurability or collectability exists.
Interest income is recognised on the time basis determined by the amount outstanding and the rate applicable and where no significant
uncertainty as to measurability or collectability exists.
(d) Depreciation and amortisation
(i) Depreciation is provided on Straight Line Method (SLM), at the rates and in the manner prescribed in Schedule XIV to the Companies
Act, 1956 except in the case of :
● Leasehold Land - amortised over the period of the lease
● Technical know-how - at 16.67% (SLM)
● Laptops - at 23.75% (SLM)
● Cars - at 23.75% (SLM)
● Assets acquired prior to April 1, 1975 - on Written Down Value basis at rates specified in Schedule XIV to the Companies Act, 1956.
● Software in excess of ` 25,000 is amortised over a period of 60 months or on the basis of estimated useful life whichever is lower.
● Assets taken on lease are amortised over the period of lease.
(ii) Product development costs are amortised over a period of 36 months to 120 months or on the basis of actual production to planned
production volume over such period.
(iii) In respect of assets whose useful life has been revised, the unamortised depreciable amount has been charged over the revised remaining
useful life.
(iv) Depreciation is not recorded on capital work-in-progress until construction and installation are complete and asset is ready for its
intended use.
(e) Fixed assets
(i) Fixed assets are stated at cost of acquisition or construction less accumulated depreciation / amortization and accumulated impairment,
if any.
(ii) Product development cost incurred on new vehicle platform, engines, transmission and new products are recognised as fixed assets,
when feasibility has been established, the Company has committed technical, financial and other resources to complete the development
and it is probable that asset will generate probable future benefits.
(iii) Cost includes purchase price, taxes and duties, labour cost and directly attributable overhead expenditure for self constructed assets
incurred up to the date the asset is ready for its intended use. Borrowing cost incurred for qualifying assets is capitalised up to the date
the asset is ready for intended use, based on borrowings incurred specifically for financing the asset or the weighted average rate of
all other borrowings, if no specific borrowings have been incurred for the asset. The cost of acquisition is further adjusted for exchange
differences relating to long term foreign currency borrowings attributable to the acquisition of depreciable asset w.e.f. April 1, 2007.
(iv) Software not exceeding ` 25,000 and product development costs relating to minor product enhancements, facelifts and upgrades are
charged off to the Profit and Loss Statement as and when incurred.

125
NOTES FORMING PART OF FINANCIAL STATEMENTS
Standalone Financials (116-159)
CORPORATE OVERVIEW FINANCIAL HIGHLIGHTS FINANCIAL STATEMENTSSTATUTORY REPORTS
(f) Impairment
At each Balance Sheet date, the Company assesses whether there is any indication that the fixed assets with finite lives may be impaired. If any
such indication exists, the recoverable amount of the asset is estimated in order to determine the extent of the impairment, if any. Where it is
not possible to estimate the recoverable amount of individual asset, the Company estimates the recoverable amount of the cash-generating
unit to which the asset belongs.
As per the assessment conducted by the Company at March 31, 2013, there were no indications that the fixed assets have suffered an
impairment loss.
(g) Leases
(i) Finance lease
Assets acquired under finance leases are recognised as an asset and a liability at the commencement of the lease, at the lower of the fair
value of the assets and the present value of minimum lease payments. The finance expense is allocated to each period during the lease
term so as to produce a constant periodic rate of interest on the remaining balance of the liability. Assets given under finance leases are
recognised as receivables at an amount equal to the net investment in the lease and the finance income is based on a constant rate of
return on the outstanding net investment.
(ii) Operating lease
Leases other than finance lease, are operating leases, and the leased assets are not recognised on the Company’s Balance Sheet. Payments
under operating leases are recognised in the Profit and Loss Statement on a straight-line basis over the term of the lease.
(h) Transactions in foreign currencies and accounting of derivatives
(i) Exchange differences
Transactions in foreign currencies are recorded at the exchange rates prevailing on the date of the transaction. Foreign currency monetary
assets and liabilities are translated at year end exchange rates.
(1) Exchange differences arising on settlement of transactions and translation of monetary items other than those covered by (2)
below are recognised as income or expense in the year in which they arise. Exchange differences considered as borrowing cost are
capitalised to the extent these relate to the acquisition / construction of qualifying assets and the balance amount is recognised in
the Profit and Loss Statement.
(2) Exchange differences relating to long term foreign currency monetary assets / liabilities are accounted for with effect from April 1,
2007 in the following manner:
- Differences relating to borrowings attributable to the acquisition of the depreciable capital asset are added to / deducted
from the cost of such capital assets.
- Other differences are accumulated in Foreign Currency Monetary Item Translation Difference Account, to be amortized over
the period, beginning April 1, 2007 or date of inception of such item, as applicable, and ending on March 31, 2011 or the date
of its maturity, whichever is earlier.
- Pursuant to notification issued by the Ministry of Corporate Affairs on December 29, 2011, the exchange differences on long
term foreign currency monetary items (other than those relating to acquisition of depreciable assets) are amortised over the
period till the date of maturity or March 31, 2020, whichever is earlier.
(ii) Hedge accounting
The Company uses foreign currency forward contracts to hedge its risks associated with foreign currency fluctuations relating to highly
probable forecast transactions. With effect from April 1, 2008, the Company designates such forward contracts in a cash flow hedging
relationship by applying the hedge accounting principles set out in Accounting Standard 30- Financial Instruments: Recognition and
Measurement.
These forward contracts are stated at fair value at each reporting date. Changes in the fair value of these forward and option contracts
that are designated and effective as hedges of future cash flows are recognized directly in Hedging Reserve Account under Reserves and
Surplus, net of applicable deferred income taxes and the ineffective portion is recognised immediately in the Profit and Loss Statement.
Amounts accumulated in Hedging Reserve Account are reclassified to Profit and Loss Statement in the periods during which the
forecasted transaction occurs.
Hedge accounting is discontinued when the hedging instrument expires or is sold, terminated, or exercised, or no longer qualifies for
hedge accounting. For forecasted transactions, any cumulative gain or loss on the hedging instrument recognised in Hedging Reserve
Account is retained there until the forecasted transaction occurs.
If the forecasted transaction is no longer expected to occur, the net cumulative gain or loss recognised in Hedging Reserve Account is
immediately transferred to the Profit and Loss Statement.
(iii) Premium or discount on forward contracts other than those covered in (ii) above is amortised over the life of such contracts and is
recognised as income or expense. Foreign currency options and other derivatives are stated at fair value as at the year end with changes
in fair value recognised in the Profit and Loss Statement.

126
NOTES FORMING PART OF FINANCIAL STATEMENTS
68th ANNUAL REPORT 2012-13
(i) Product warranty expenses
The estimated liability for product warranties is recorded when products are sold. These estimates are established using historical information
on the nature, frequency and average cost of warranty claims and management estimates regarding possible future incidence based on
corrective actions on product failures. The timing of outflows will vary as and when warranty claim will arise - being typically up to 3 to 4
years.
(j) Income on vehicle loan
Interest income from loan contracts are accounted for by using the Internal Rate of Return method. Consequently, a constant rate of return
on the net outstanding amount is accrued over the period of contract. The Company provides an allowance for hire purchase and loan
receivables that are in arrears for more than 11 months, to the extent of an amount equivalent to the outstanding principal and amounts due
but unpaid, considering probable inherent loss including estimated realisation based on past performance trends. In respect of loan contracts
that are in arrears for more than 6 months but not more than 11 months, allowance is provided to the extent of 10% of the outstanding and
amount due but unpaid.
(k) Inventories
Inventories are valued at the lower of cost and net realisable value. Cost of raw materials and consumables are ascertained on a moving
weighted average / monthly moving weighted average basis. Cost, including variable and fixed overheads, are allocated to work-in-progress,
stock-in-trade and finished goods determined on full absorption cost basis. Net realisable value is estimated selling price in the ordinary
course of business less estimated cost of completion and selling expenses.
(l) Employee benefits
(i) Gratuity
The Company has an obligation towards gratuity, a defined benefit retirement plan covering eligible employees. The plan provides for
a lump sum payment to vested employees at retirement, death while in employment or on termination of employment of an amount
equivalent to 15 to 30 days salary payable for each completed year of service. Vesting occurs upon completion of five years of service. The
Company makes annual contributions to gratuity fund established as trust. The Company accounts for the liability for gratuity benefits
payable in future based on an independent actuarial valuation as at Balance Sheet date.
(ii) Superannuation
The Company has two superannuation plans, a defined benefit plan and a defined contribution plan. An eligible employee on April 1,
1996 could elect to be a member of either plan.
Employees who are members of the defined benefit superannuation plan are entitled to benefits depending on the years of service and
salary drawn. The monthly pension benefits after retirement range from 0.75% to 2% of the annual basic salary for each year of service.
The Company accounts for the liability for superannuation benefits payable in future under the plan based on an independent actuarial
valuation as at Balance Sheet date.
With effect from April 1, 2003, this plan was amended and benefits earned by covered employees have been protected as at March 31,
2003. Employees covered by this plan are prospectively entitled to benefits computed on a basis that ensures that the annual cost of
providing the pension benefits would not exceed 15% of salary.
The Company maintains a separate irrevocable trust for employees covered and entitled to benefits. The Company contributes up to
15% of the eligible employees’ salary to the trust every year. The Company recognizes such contributions as an expense when incurred.
The Company has no further obligation beyond this contribution.
(iii) Bhavishya Kalyan Yojana (BKY)
Bhavishya Kalyan Yojana is an unfunded defined benefit plan for employees of the Company. The benefits of the plan include pension in
certain case, payable up to the date of normal superannuation had the employee been in service, to an eligible employee at the time of
death or permanent disablement, while in service, either as a result of an injury or as certified by the appropriate authority. The monthly
payment to dependents of the deceased / disabled employee under the plan equals 50% of the salary drawn at the time of death or
accident or a specified amount, whichever is higher. The Company accounts for the liability for BKY benefits payable in future based on
an independent actuarial valuation as at Balance Sheet date.
(iv) Post-retirement medicare scheme
Under this scheme, employees of the Company receive medical benefits subject to certain limits of amount, periods after retirement
and types of benefits, depending on their grade and location at the time of retirement. Employees separated from the Company as part
of Early Separation Scheme, on medical grounds or due to permanent disablement are also covered under the scheme. The liability for
post-retirement medical scheme is based on an independent actuarial valuation as at Balance Sheet date.
(v) Provident fund
The eligible employees of the Company are entitled to receive benefits in respect of provident fund, a defined contribution plan, in
which both employees and the Company make monthly contributions at a specified percentage of the covered employees’ salary
(currently 12% of employees’ salary). The contributions as specified under the law are made to the provident fund and pension fund set
up as irrevocable trust by the Company . The Company is generally liable for annual contributions and any shortfall in the fund assets
based on the government specified minimum rates of return or pension and recognises such contributions and shortfall, if any, as an
expense in the year incurred.

127
NOTES FORMING PART OF FINANCIAL STATEMENTS
Standalone Financials (116-159)
CORPORATE OVERVIEW FINANCIAL HIGHLIGHTS FINANCIAL STATEMENTSSTATUTORY REPORTS
(vi) Compensated absences
The Company provides for the encashment of leave or leave with pay subject to certain rules. The employees are entitled to accumulate
leave subject to certain limits, for future encashment. The liability is provided based on the number of days of unutilised leave at each
balance sheet date on the basis of an independent actuarial valuation.
(m) Investments
Long term investments are stated at cost less other than temporary diminution in value, if any. Current investments are stated at lower of cost
and fair value. Fair value of investments in mutual funds are determined on a portfolio basis.
(n) Income taxes
Tax expense comprises of current and deferred taxes.
Current tax is the amount of tax payable on the taxable income for the year as determined in accordance with the provisions of the Income
Tax Act, 1961. Current tax is net of credit for entitlement for Minimum Alternative Tax (MAT).
Deferred tax is recognised, on timing differences, being the difference between taxable income and accounting income that originate in one
period and are capable of reversal in one or more subsequent periods.
Deferred tax assets in respect of unabsorbed depreciation and carry forward of losses are recognised if there is virtual certainty that there will
be sufficient future taxable income available to realise such losses.
Deferred tax assets and liabilities are measured based on the tax rates that are expected to apply in the period when asset is realised or the
liability is settled, based on tax rates and tax laws that have been enacted or substantially enacted by the balance sheet date.
(o) Redemption premium on Foreign Currency Convertible Notes (FCCN) / Non Convertible Debentures (NCD)
Premium payable on redemption of FCCN / NCD as per the terms of issue, is provided fully in the year of issue by adjusting against the
Securities Premium Account (SPA) (net of tax). Any change in the premium payable, consequent to conversion or exchange fluctuations is
adjusted to the SPA. Discount on redemption of FCCN, if any, will be recognised on redemption.
(p) Borrowing costs
Fees towards structuring / arrangements and underwriting and other incidental costs incurred in connection with borrowings are amortised
over the period of the loan.
(q) Liabilities and contingent liabilities
The Company records a liability for any claims where a potential loss is probable and capable of being estimated and discloses such matters
in its financial statements, if material. For potential losses that are considered possible, but not probable, the Company provides disclosure in
the financial statements but does not record a liability in its accounts unless the loss becomes probable.
(r) Business segments
The Company is engaged mainly in the business of automobile products consisting of all types of commercial and passenger vehicles
including financing of the vehicles sold by the Company. These, in the context of Accounting Standard 17 on Segment Reporting, as specified
in the Companies (Accounting Standards) Rules, 2006, are considered to constitute one single primary segment. Further, there is no reportable
secondary segment i.e. Geographical Segment.

128
NOTES FORMING PART OF FINANCIAL STATEMENTS
68th ANNUAL REPORT 2012-13
(` in crores)
As at As at
March 31,
2013
March 31,
2012
2. Share Capital
(a) Authorised :350,00,00,000 Ordinary shares of ` 2 each (as at March 31, 2012: 350,00,00,000 Ordinary shares of ` 2 each) 700.00 700.00
100,00,00,000 ‘A’ Ordinary shares of ` 2 each (as at March 31, 2012: 100 ,00,00,000 ‘A’ Ordinary shares of ` 2 each) 200.00 200.00
30,00,00,000 Convertible Cumulative Preference shares of ` 100 each (as at March 31, 2012: 30,00,00,000 shares of ` 100 each) 3,000.00 3,000.00
3,900.00 3,900.00 (b) Issued, subscribed and fully paid :
270,81,56,151 Ordinary shares of ` 2 each (as at March 31, 2012: 269,16,13,455 Ordinary shares of ` 2 each) 541.63 538.32 48,19,59,620 ‘A’ Ordinary shares of ` 2 each
(as at March 31, 2012: 48,19,33,115 ‘A’ Ordinary shares of ` 2 each) 96.40 96.39
638.03 634.71
(c) Calls unpaid - Ordinary shares (0.01) (0.01)(d) Forfeited Shares - Ordinary shares 0.05 0.05
638.07 634.75
(e) Movement of number of shares and share capital :
2012-2013 2011-2012
No. of shares (` in crores) No. of shares (` in crores)
(i) Ordinary shares
Shares as on April 1 269,16,13,455 538.32 53,82,72,284 538.27
Add: Shares issued out of held in abeyance - - 50,199 0.05
269,16,13,455 538.32 53,83,22,483 538.32
Subdivision of Ordinary shares of
` 10 each into 5 shares of ` 2 each
- - 269,16,12,415 538.32
Add: Shares issued out of held in abeyance 1,125 -* 1,040 -*
Add: Shares issued through conversion of Foreign Currency
Convertible Notes (FCCN) / Convertible Alternative Reference
Securities (CARS) 1,65,41,571 3.31 - -
Shares as on March 31 270,81,56,151 541.63 269,16,13,455 538.32
(ii) ‘A’ Ordinary shares
Shares as on April 1 48,19,33,115 96.39 9,63,41,706 96.34
Add: Shares issued out of held in abeyance - - 44,765 0.05
48,19,33,115 96.39 9,63,86,471 96.39
Subdivision of ‘A’ Ordinary shares of
` 10 each into 5 shares of ` 2 each - - 48,19,32,355 96.39 Add: Shares issued out of held in abeyance 26,505 0.01 760 -*
Shares as on March 31 48,19,59,620 96.40 48,19,33,115 96.39
* Less than ` 5,000/-
(f) Rights, preferences and restrictions attached to shares :
(i) Ordinary shares of ` 2 each :
� In respect of every Ordinary share (whether fully paid or partly paid), voting right shall be in the same proportion as the capital paid upon such Ordinary
share bears to the total paid up ordinary capital of the Company.
� The dividend proposed by the Board of Directors is subject to the approval of the shareholders in the ensuing Annual General Meeting. Further, the Board
of Directors may also announce an interim dividend.
� In the event of liquidation, the shareholders of Ordinary shares are eligible to receive the remaining assets of the Company after distribution of all preferential
amounts, in proportion to their shareholdings.
(ii) ‘A’ Ordinary shares of ` 2 each :
� The holders of ‘A’ Ordinary shares shall be entitled to receive dividend for each financial year at five percentage point more than the aggregate rate of
dividend declared on Ordinary shares for that financial year.
� If any resolution at any general meeting of shareholders is put to vote on poll, or if any resolution is put to vote by postal ballot, each ‘A’ Ordinary shareholders
shall be entitled to one vote for every ten ‘A’ Ordinary shares held as per the terms of its issue.
� In the case there is a resolution put to vote in the shareholders meeting and is to be decided on a show of hands, the holders of ‘A’ Ordinary shares shall be
entitled to the same number of votes as available to holders of Ordinary shares.

129
NOTES FORMING PART OF FINANCIAL STATEMENTS
Standalone Financials (116-159)
CORPORATE OVERVIEW FINANCIAL HIGHLIGHTS FINANCIAL STATEMENTSSTATUTORY REPORTS
(iii) American Depository Shares (ADSs) and Global Depositary Shares (GDSs) :
� Holders of ADS and GDS are not entitled to attend or vote at shareholders meetings. Holders of ADS may exercise voting rights with respect to the Ordinary
shares represented by ADS only in accordance with the provisions of the Company’s ADS deposit agreement and Indian Law. The depository for the holders
of the Global Depository Receipts (GDRs) shall exercise voting rights in respect of the GDS by issue of an appropriate proxy or power of attorney in terms of
the deposit agreement pertaining to the GDRs.
� Shares issued upon conversion of ADSs will rank pari passu with existing Ordinary shares of ` 2 each in all respects, including entitlement of the dividend
declared.
(g) Number of shares held by each shareholder holding more than 5 percent of the issued share capital
As at March 31, 2013 As at March 31, 2012
% of Issued
share capital
No. of shares % of Issued
share capital
No of shares
(i) Ordinary shares :
(a) Tata Sons Limited 25.93% 70,23,33,345 25.96% 69,88,33,345
(b) Tata Steel Limited 5.46% 14,78,10,695 5.49% 14,78,10,695
(c) Life Insurance Corporation of India * - 6.75% 18,17,10,232
(d) Citibank N A as Depository # 49,80,91,115 # 43,54,28,360
(ii) ‘A’ Ordinary shares :
(a) HDFC Trustee Co Limited - HDFC Top 200 Fund 6.10% 2,93,87,761 6.67% 3,21,37,761
(b) HSBC Global Investment Funds a/c HSBC Global Investment Funds
Mauritius Ltd
5.97% 2,87,89,306 - -
(c) HDFC Trustee Co Limited - HDFC Equity Fund 5.37% 2,58,78,932 6.07% 2,92,46,932
# held by Citibank, N.A. as depository for American Depository Shares (ADSs) and
Global Depository Shares (GDSs)
* Less than 5%
(h) Information regarding issue of shares in the last five years
(i) The Company has not issued any shares without payment being received in cash.
(ii) There has been no issue of bonus shares.
(iii) The Company has not undertaken any buy-back of shares.
(i) Other notes
(i) The Company has issued the Foreign Currency Convertible Notes (FCCNs) which are convertible into Ordinary shares or ADSs. The terms of issue along with the
earliest dates of conversion are given on page 133 note (iv).
(ii) The entitlements to 4,91,875 Ordinary shares of ` 2 each (as at March 31, 2012 : 4,93,000 Ordinary shares of ` 2 each) and 2,46,895 ‘A’ Ordinary shares of ` 2
each (as at March 31, 2012: 2,73,400 ‘A’ Ordinary shares of ` 2 each) are subject matter of various suits filed in the courts / forums by third parties for which
final order is awaited and hence kept in abeyance.
(iii) Subsequent to the year ended March 31, 2013, the Company has alloted :
1,17,89,695 Ordinary shares upon conversion of 306, 4% Foreign Currency Convertible Notes (FCCN) due 2014.

130
NOTES FORMING PART OF FINANCIAL STATEMENTS
68th ANNUAL REPORT 2012-13
(` in crores)
As at Additions Deductions As at
March 31, March 31,
2012 2013
3. Reserves and surplus
(a) Capital Redemption Reserve 2.28 - - 2.28
2 .28 - - 2 .28
(b) Securities Premium Account [Note (i) and (ii)] 11,186.76 233.31 91.50 11,328.57
11,350.68 9.18 173.10 11,186.76
(c) Debenture Redemption Reserve 1,172.15 - 130.00 1,042.15
1 ,102 .15 70.00 - 1 ,172 .15
(d) Revaluation Reserve [Note (iii)] 23.75 - 0.44 23.31
24.19 - 0.44 23.75
(e) Amalgamation Reserve 0.05 - - 0.05
0.05 - - 0.05
(f ) General Reserve [Note (iv)] 4,942.36 30.26 - 4,972.62
4 ,817.32 125.04 - 4 ,942 .36
(g) Foreign Currency Monetary Item Translation Difference (258.35) (355.02) (398.37) (215.00)
Account (net) [Note (v)] - (630.47) (372 .12) (258.35)
(h) Profit and Loss Account (Surplus) [Note (vi)] 1,663.91 433.29 754.41 1,342.79
2,078.92 1 ,243.71 1 ,658.72 1 ,663.91
18,732.91 341.84 577.98 18,496.77
19 ,375.59 817.46 1 ,460.14 18 ,732 .91
Notes
2012-2013 2011-2012
Additions Deductions Additions Deductions
(i) The opening and closing balances of Securities Premium Account are net of calls in
arrears of ` 0.03 crores
(ii) Securities Premium Account :
(a) Premium on shares issued on conversion of Foreign Currency Convertible
Notes (FCCN) / Convertible Alternative Reference Securities (CARS) and held in
abeyance out of rights issue of shares [previous year premium on shares issued
which were held in abeyance out of rights issue of shares] 229.68 - 2.98 -
(b) Share issue expenses and brokerage, stamp duty and other fees on Non-
Convertible Debentures [net of tax of ` 1.75 crores (2011-12 ` Nil)] - 91.50 - 76.69
(c) Premium on redemption of FCCN / CARS, exchange differences and withholding
tax [net of tax of ` 12.31 crores (2011-12 ` 15.99 crores)] 3.63 - - 96.41
(d) Profit on sale of plant items written off in earlier years - - 6.20 -
233.31 91.50 9.18 173.10
(iii) Revaluation Reserve :
Depreciation on revalued portion of assets taken over on amalgation of a company - 0.44 - 0.44
- 0.44 - 0.44
(iv) General Reserve :
(a) Amount recovered (net) towards indemnity relating to business amalgamated
in prior year0.08 - 0.04 -
(b) Amount transferred from Profit and Loss Account (Surplus) 30.18 - 125.00 -
30.26 - 125.04 -
(v) Foreign Currency Monetary Item Translation Difference Account (net) :
(a) Exchange loss during the year (net) (355.02) - (630.47) -
(b) Amortisation of exchange fluctuation for the year - (398.37) - (372.12)
(355.02) (398.37) (630.47) (372.12)
(vi) Profit and Loss Account (Surplus) :
(a) Profit after tax for the year 301.81 - 1,242.23 -
(b) Credit for dividend distribution tax 1.48 - 1.48 -
(c) Proposed dividend - 645.20 - 1,280.70
(d) Tax on proposed dividend - 79.03 - 183.02
(e) Debenture Redemption Reserve 130.00 - - 70.00
(f ) General Reserve - 30.18 - 125.00
433.29 754.41 1,243.71 1,658.72
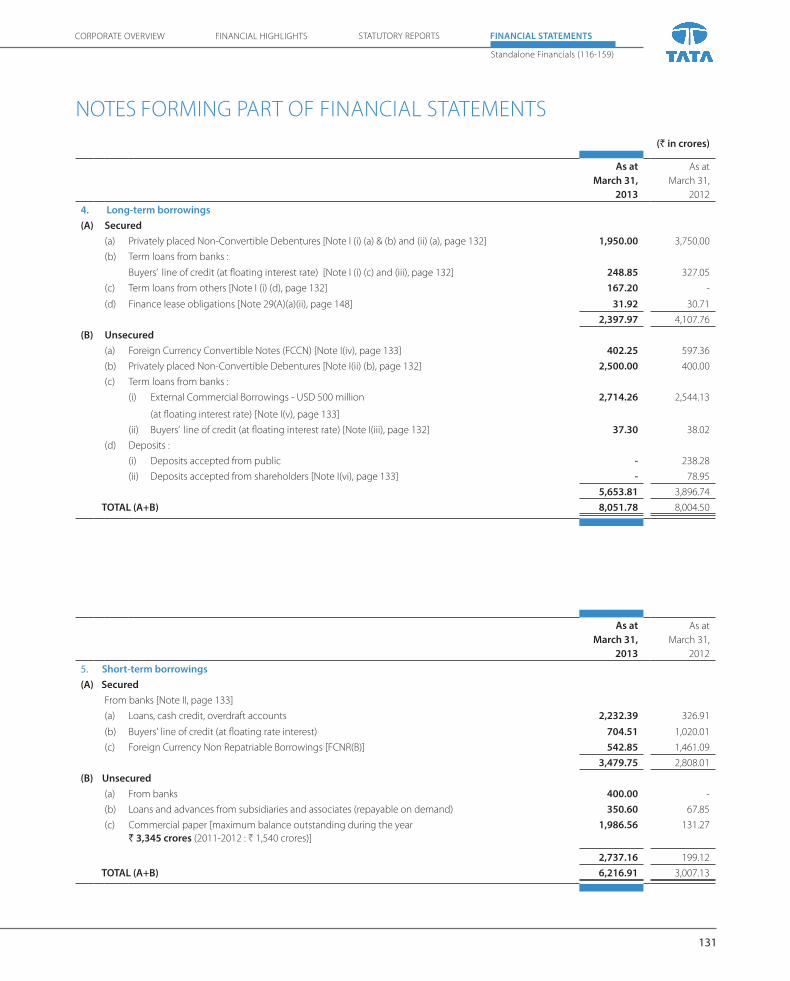
131
NOTES FORMING PART OF FINANCIAL STATEMENTS
Standalone Financials (116-159)
CORPORATE OVERVIEW FINANCIAL HIGHLIGHTS FINANCIAL STATEMENTSSTATUTORY REPORTS
(` in crores)
As at As at
March 31, March 31,
2013 2012
4. Long-term borrowings
(A) Secured
(a) Privately placed Non-Convertible Debentures [Note I (i) (a) & (b) and (ii) (a), page 132] 1,950.00 3,750.00
(b) Term loans from banks :
Buyers’ line of credit (at floating interest rate) [Note I (i) (c) and (iii), page 132] 248.85 327.05
(c) Term loans from others [Note I (i) (d), page 132] 167.20 -
(d) Finance lease obligations [Note 29(A)(a)(ii), page 148] 31.92 30.71
2,397.97 4,107.76
(B) Unsecured
(a) Foreign Currency Convertible Notes (FCCN) [Note I(iv), page 133] 402.25 597.36
(b) Privately placed Non-Convertible Debentures [Note I(ii) (b), page 132] 2,500.00 400.00
(c) Term loans from banks :
(i) External Commercial Borrowings - USD 500 million
(at floating interest rate) [Note I(v), page 133]
2,714.26 2,544.13
(ii) Buyers’ line of credit (at floating interest rate) [Note I(iii), page 132] 37.30 38.02
(d) Deposits :
(i) Deposits accepted from public - 238.28
(ii) Deposits accepted from shareholders [Note I(vi), page 133] - 78.95
5,653.81 3,896.74
TOTAL (A+B) 8,051.78 8,004.50
As at As at
March 31, March 31,
2013 2012
5. Short-term borrowings
(A) Secured
From banks [Note II, page 133]
(a) Loans, cash credit, overdraft accounts 2,232.39 326.91
(b) Buyers' line of credit (at floating rate interest) 704.51 1,020.01
(c) Foreign Currency Non Repatriable Borrowings [FCNR(B)] 542.85 1,461.09
3,479.75 2,808.01
(B) Unsecured
(a) From banks 400.00 -
(b) Loans and advances from subsidiaries and associates (repayable on demand) 350.60 67.85
(c) Commercial paper [maximum balance outstanding during the year
` 3,345 crores (2011-2012 : ` 1,540 crores)]
1,986.56 131.27
2,737.16 199.12
TOTAL (A+B) 6,216.91 3,007.13

132
NOTES FORMING PART OF FINANCIAL STATEMENTS
68th ANNUAL REPORT 2012-13
I. Information regarding long term borrowings
(i) Nature of security (on loans including interest accrued thereon) :
(a) During the year 2009-10, the Company issued 2% secured non-convertible credit enhanced rupee debentures in four tranches, having
tenor upto seven years, aggregating ` 4,200 crores on a private placement basis. These are secured by a second charge in favour of Vijaya
Bank, Debenture Trustee and first ranking pari passu charge in favour of State Bank of India as security trustee on behalf of the guarantors,
by way of English mortgage of the Company’s lands, freehold and leasehold, together with all buildings, constructions and immovable
and movable properties situated at Chinchwad, Pimpri, Chikhali and Maval in Pune District and plant and machinery and other movable
assets situated at Pantnagar in the state of Uttarakhand and at Jamshedpur in the state of Jharkhand. As at March 31, 2013 ` 3,050 crores
is outstanding, of which `1,800 crores are classified as current liabilities being maturing before March 31, 2014.
(b) Rated, Listed, Secured, 9.95% Coupon, Non-Convertible Debentures amounting to ` 200 crores and 10.25% Coupon, Non-Convertible
Debentures amounting to ` 500 crores are secured by a pari passu charge by way of an English mortgage of the Company’s freehold
land together with immovable properties, plant and machinery and other movable assets (excluding stock and book debts) situated at
Sanand in the State of Gujarat.
(c) Buyers line of credit from banks are secured by hypothecation of existing current assets of the Company viz. stock of raw materials, stock
in process, semi-finished goods, stores and spares not relating to plant and machinery (consumable stores and spares), bills receivable
and book debts including receivable from hire purchase / leasing and all other moveable current assets except cash and bank balances,
loans and advances of the Company both present and future.
(d) The term loan is repayable during the quarter ended March 31, 2033, along with simple interest at the rate of 0.10 % p.a. The loan
is secured by a second and subservient charge (creation of charge is under process) over Company’s freehold land together with
immovable properties, plant and machinery and other movable assets (excluding stock and book debts) situated at Sanand plant in the
State of Gujarat.
(ii) Schedule of repayment and redemption for Non-Convertible Debentures : (` in crores)
Non Convertible Debentures (NCDs) Redeemable on Principal Premium Total
(a) Secured :
10.25% Non-Convertible Debentures (2025) # April 30, 2025 150.00 - 150.00
10.25% Non-Convertible Debentures (2024) # April 30, 2024 150.00 - 150.00
10.25% Non-Convertible Debentures (2023) # April 30, 2023 100.00 - 100.00
10.25% Non-Convertible Debentures (2022) # April 30, 2022 100.00 - 100.00
9.95% Non-Convertible Debentures (2020) March 2, 2020 200.00 - 200.00
2% Non-Convertible Debentures (2016) March 31, 2016 1,250.00 919.23 2,169.23
2% Non-Convertible Debentures (2014) * March 31, 2014 1,800.00 658.05 2,458.05
# The Company has a call option to redeem, either in part or full, at the end of 8th year from the date of allotment i.e. April 30, 2018.
* Classified as current liabilities
(b) Unsecured :
9.70% Non-Convertible Debentures (2020) June 18, 2020 150.00 - 150.00
9.75% Non-Convertible Debentures (2020) May 24, 2020 100.00 - 100.00
9.90% Non-Convertible Debentures (2020) May 7, 2020 150.00 - 150.00
10.00% Non-Convertible Debentures (2019) May 28, 2019 250.00 - 250.00
9.69% Non-Convertible Debentures (2019) March 29, 2019 200.00 - 200.00
9.45% Non-Convertible Debentures (2018) March 29, 2018 200.00 - 200.00
10.00% Non-Convertible Debentures (2017) May 26, 2017 250.00 - 250.00
9.84% Non-Convertible Debentures (2017) March 10, 2017 300.00 - 300.00
9.22% Non-Convertible Debentures (2015) December 1, 2015 300.00 - 300.00
9.15% Non-Convertible Debentures (2015) June 3, 2015 300.00 - 300.00
9.85% Non-Convertible Debentures (2015) March 30, 2015 300.00 - 300.00
(iii) The buyers line of credit from banks is repayable within a maximum period of three years from the drawdown dates. All the repayments are due
from 2013-14 to 2015-16.

133
NOTES FORMING PART OF FINANCIAL STATEMENTS
Standalone Financials (116-159)
CORPORATE OVERVIEW FINANCIAL HIGHLIGHTS FINANCIAL STATEMENTSSTATUTORY REPORTS
(iv) Foreign Currency Convertible Notes (FCCN) and Convertible Alternative Reference Securities (CARS) :
The Company issued the FCCN and CARS which are convertible into Ordinary shares or ADSs. The particulars, terms of issue and the status of
conversion as at March 31, 2013 are given below :
Issue 0% CARS (due 2012) 4% FCCN (due 2014)
Issued on July 11, 2007 October 15, 2009
Issue amount (in INR at the time of the issue) US $ 490 million
(` 1,992.71 crores)
US $ 375 million
(` 1,794.19 crores)
Face value US $ 100,000 US $ 100,000
Conversion price per share ` 960.96 ` 623.88
at fixed exchange rate US $ 1 = ` 40.59 US $ 1 = ` 46.28
Reset conversion price (Due to rights issue, GDS
Issue and subdivision of shares)
` 181.43 ` 120.12
US $ 1 = ` 40.59 US $ 1 = ` 46.28
Exercise period October 11, 2011
to June 12, 2012
November 25, 2009 (for conversion into
shares or GDSs) and October 15, 2010 (for
conversion into ADSs) to October 9, 2014
Early redemption at the option of the Company
subject to certain conditions
i) after October 11, 2011 at our
option (in whole but not in part)
i) any time on or after October 15, 2012 (in
whole but not in part) at our option
or or
ii) any time (in whole but not in
part) in the event of certain changes
affecting taxation in India
ii) any time (in whole but not in part) in
the event of certain changes affecting
taxation in India
Redeemable on July 12, 2012 October 16, 2014
Redemption percentage of the principal amount 131.820% 108.505%
Amount converted US $ 0.10 million US $ 300.90 million
Aggregate conversion into ADRs (in terms of
equivalent shares) and shares
22,370 11,36,37,871
Aggregate notes redeemed 4,729 Nil
Aggregate notes bought back Nil Nil
Notes outstanding as at March 31, 2013 Nil 741
Amount outstanding as at March 31, 2013 Nil US $ 74.10 million
(` 402.25 crores)
Aggregate amount of shares that could be issued on
conversion of outstanding notes
Nil 2,85,49,588 @
@ Increased due to cash dividend distribution antidilution adjustment as per terms of issue.
(v) During the year 2011-12, the Company raised Syndicated Foreign currency term loans of US$ 500 million in two tranches with tenors between
four to seven years, in accordance with guidelines on External Commercial Borrowings (ECB) issued by the Reserve Bank of India. Schedule of
repayment of ECB is as under :
Date Repayment Amount Repayment Amount
(USD Million) (` crores)*
September 12, 2018 150 814.28
September 12, 2017 150 814.28
September 12, 2016 100 542.85
September 14, 2015 100 542.85
* at exchange rate of 1 US $ = ` 54.2850 as at March 31, 2013.
(vi) Fixed deposits from public and shareholders :
These are unsecured deposits for a fixed tenor of up to three years from the date of acceptance / renewal bearing interest rates ranging from 8%
to 12.5%. The entire balance is classified as current liabilities since maturing before March 31, 2014.
II. Information regarding short-term borrowings
Loans, cash credits, overdrafts and buyers line of credit from banks and Foreign Currency Non Repatriable Borrowings (FCNR(B)) are secured
by hypothecation of existing current assets of the Company viz. stock of raw materials, stock in process, semi-finished goods, stores and spares
not relating to plant and machinery (consumable stores and spares), bills receivable and book debts including receivable from hire purchase /
leasing and all other moveable current assets except cash and bank balances, loans and advances of the Company both present and future.

134
NOTES FORMING PART OF FINANCIAL STATEMENTS
68th ANNUAL REPORT 2012-13
(` in crores)
As at As at
March 31, March 31,
2013 2012
6. Deferred tax liabilities (Net)
(a) Major components of deferred tax arising on account of timing differences are:
Liabilities:
Depreciation (1,395.69) (1,237.11)
Product development cost (2,128.49) (1,808.58)
Others (40.37) (50.35)
(3,564.55) (3,096.04)
Assets:
Employee benefits / expenses allowable on payment basis 133.11 101.82
Provision for doubtful debts 193.36 171.29
Premium on redemption of CARS
(including exchange fluctuation on premium) - 126.74
Unabsorbed depreciation and business losses 1,248.16 566.99
Others 26.01 23.79
1,600.64 990.63
Net deferred tax liability (1,963.91) (2,105.41)
(b) Tax expense :
(i) Current tax
Current tax 62.50 289.44
Less : Minimum Alternate Tax (MAT credit) (61.94) (288.88)
0.56 0.56
(ii) Deferred tax
Opening deferred tax 2,105.41 2,023.16
Debited /(credited) to Securities Premium Account (14.06) (15.99)
2,091.35 2,007.17
Closing Deferred tax 1,963.91 2,105.41
Deferred tax charge for the period (127.44) 98.24
Total (126.88) 98.80
The Company has recognised deferred tax asset of ` 1,003.12 crores on unabsorbed depreciation and ` 245.04 crores on brought forward
business losses, considering the deferred tax liability on timing differences that will reverse in the future.
As at As at
March 31, March 31,
2013 2012
7. Other Long-term liabilities
(a) Liability towards premium on redemption of Non-Convertible Debentures 919.23 1,577.28
(b) Deferred payment liabilities 237.00 286.25
(c) Interest accrued but not due on borrowings - 33.24
(d) Derivative financial instruments 23.57 -
(e) Others 58.64 62.86
1,238.44 1,959.63
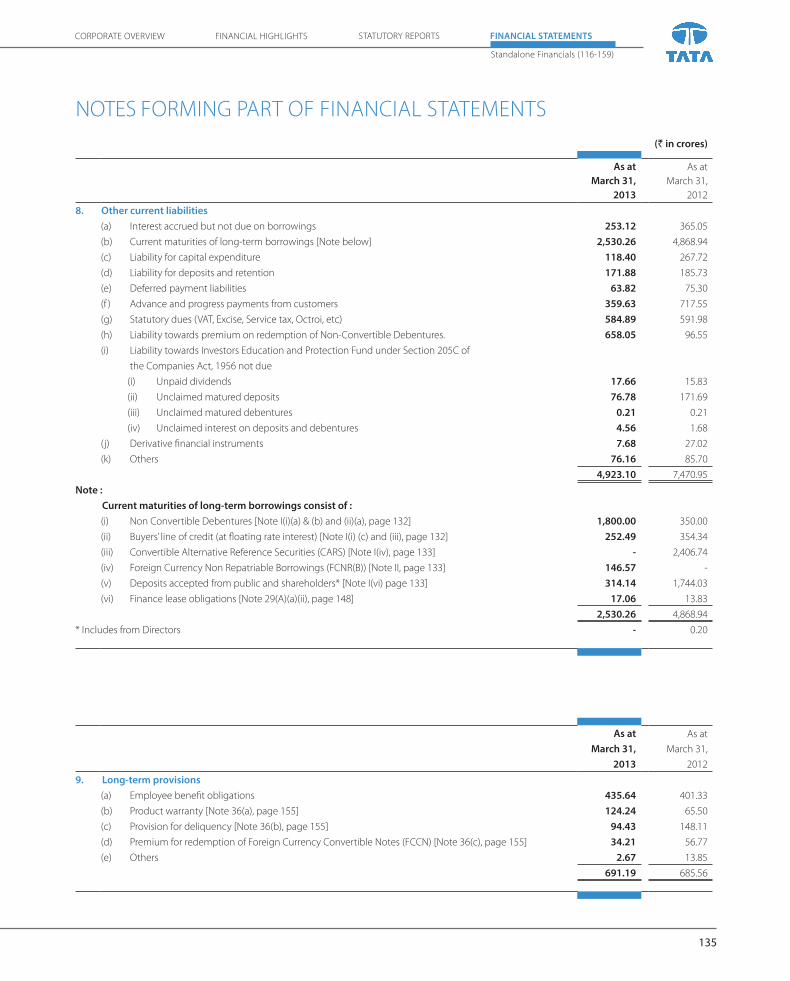
135
NOTES FORMING PART OF FINANCIAL STATEMENTS
Standalone Financials (116-159)
CORPORATE OVERVIEW FINANCIAL HIGHLIGHTS FINANCIAL STATEMENTSSTATUTORY REPORTS
(` in crores)
As at As at
March 31, March 31,
2013 2012
8. Other current liabilities
(a) Interest accrued but not due on borrowings 253.12 365.05
(b) Current maturities of long-term borrowings [Note below] 2,530.26 4,868.94
(c) Liability for capital expenditure 118.40 267.72
(d) Liability for deposits and retention 171.88 185.73
(e) Deferred payment liabilities 63.82 75.30
(f ) Advance and progress payments from customers 359.63 717.55
(g) Statutory dues (VAT, Excise, Service tax, Octroi, etc) 584.89 591.98
(h) Liability towards premium on redemption of Non-Convertible Debentures. 658.05 96.55
(i) Liability towards Investors Education and Protection Fund under Section 205C of
the Companies Act, 1956 not due
(i) Unpaid dividends 17.66 15.83
(ii) Unclaimed matured deposits 76.78 171.69
(iii) Unclaimed matured debentures 0.21 0.21
(iv) Unclaimed interest on deposits and debentures 4.56 1.68
(j) Derivative financial instruments 7.68 27.02
(k) Others 76.16 85.70
4,923.10 7,470.95
Note :
Current maturities of long-term borrowings consist of :
(i) Non Convertible Debentures [Note I(i)(a) & (b) and (ii)(a), page 132] 1,800.00 350.00
(ii) Buyers’ line of credit (at floating rate interest) [Note I(i) (c) and (iii), page 132] 252.49 354.34
(iii) Convertible Alternative Reference Securities (CARS) [Note I(iv), page 133] - 2,406.74
(iv) Foreign Currency Non Repatriable Borrowings (FCNR(B)) [Note II, page 133] 146.57 -
(v) Deposits accepted from public and shareholders* [Note I(vi) page 133] 314.14 1,744.03
(vi) Finance lease obligations [Note 29(A)(a)(ii), page 148] 17.06 13.83
2,530.26 4,868.94
* Includes from Directors - 0.20
As at As at
March 31, March 31,
2013 2012
9. Long-term provisions
(a) Employee benefit obligations 435.64 401.33
(b) Product warranty [Note 36(a), page 155] 124.24 65.50
(c) Provision for deliquency [Note 36(b), page 155] 94.43 148.11
(d) Premium for redemption of Foreign Currency Convertible Notes (FCCN) [Note 36(c), page 155] 34.21 56.77
(e) Others 2.67 13.85
691.19 685.56

136
NOTES FORMING PART OF FINANCIAL STATEMENTS
68th ANNUAL REPORT 2012-13
(` in crores)
As at As at
March 31, March 31,
2013 2012
10. Short-term provisions
(a) Employee benefit obligation 34.37 38.17
(b) Product warranty [Note 36(a), page 155] 309.38 387.26
(c) Provision for deliquency [Note 36(b), page 155] 242.81 -
(d) Current income tax (net of payment) 171.46 181.08
(e) Premium on redemption of Convertible Alternative Reference Securities (CARS)
[ Note 36(c), page 155] - 855.73
(f ) Proposed dividend 645.20 1,280.70
(g) Provision for tax on dividends 79.03 183.02
(h) Others 27.33 28.60
1,509.58 2,954.56
As at As at
March 31, March 31,
2013 2012
11. Trade payables
(a) Acceptances 4,098.96 3,808.24
(b) Other than acceptances* [ Note 43 (iii), page 159] 4,356.06 4,897.29
8,455.02 8,705.53
* Includes payable to subsidiary companies :
Concorde Motors (India) Ltd 4.73 -
TAL Manufacturing Solutions Ltd 8.53 16.09
Tata Motors European Technical Centre Plc 60.00 7.91
Tata Motors Finance Ltd 146.90 84.84
Tata Technologies Ltd 37.42 18.15
TML Distribution Company Ltd - 102.22
Jaguar Cars Ltd 20.05 6.44
Land Rover - 41.10
Trilix Srl, Turin (Italy) 15.32 14.02
Tata Daewoo Commercial Vehicle Co. Ltd 0.10 -

137
NOTES FORMING PART OF FINANCIAL STATEMENTS
Standalone Financials (116-159)
CORPORATE OVERVIEW FINANCIAL HIGHLIGHTS FINANCIAL STATEMENTSSTATUTORY REPORTS
12. Tangible assets (` in crores)
Particulars Cost as at
April 1,
2012
Additions /
adjustments
[Note (iv)]
Deductions /
adjustments
Cost
as at
March 31,
2013
Accumulated
depreciation
as at April 1,
2012
Depreciation
for the year
Deductions /
adjustments
for the
year
Accumulated
depreciation
up to
March 31,
2013
Net book
value
as at
March 31,
2013
[I] Owned assets :
(i) Land 519.76 - - 519.76 - - - - 519.76
519.76 - - 519.76 - - - - 519.76
(ii) Buildings [Note (i) & (ii) a] 2,352.11 186.11 4.40 2,533.82 474.97 71.01 2.48 543.50 1,990.32
2,063.46 289.23 0.58 2,352 .11 411.90 63.35 0.28 474.97 1 ,877.14
(iii) Plant, machinery and eqipment 15,825.26 1,484.74 175.81 17,134.19 7,071.44 1,060.66 142.40 7,989.70 9,144.49
[Note (ii) (a) & (iii)] 14 ,345.53 1 ,554.42 74.69 15 ,825.26 6 ,124.39 1 ,016.73 69.68 7 ,071.44 8 ,753.82
(iv) Furniture and fixtures [Note (iii)] 109.85 13.47 1.63 121.69 44.46 6.62 1.02 50.06 71.63
78.88 31.19 0.22 109.85 39.68 4.98 0.20 44.46 65.39
(v) Vehicles [Note (iii)] 139.54 34.49 15.47 158.56 78.36 23.00 12.06 89.30 69.26
133.29 26.43 20.18 139.54 75.59 19.52 16.75 78.36 61.18
(vi) Office equipment 46.27 3.83 0.85 49.25 18.11 2.22 0.76 19.57 29.68
45.05 2 .58 1.36 46.27 15.77 2 .52 0.18 18.11 28.16
(vii) Computers and other IT assets 553.87 24.94 9.34 569.47 437.33 38.97 8.94 467.36 102.11
524.17 43.34 13.64 553.87 415.50 34.74 12 .91 437.33 116.54
(vii) Water system and sanitation 164.31 41.08 0.09 205.30 46.72 8.51 0.08 55.15 150.15
[Note (ii)(a)] 141.36 22 .95 - 164.31 40.06 6.66 - 46.72 117.59
[II] Assets given on lease :
(i) Plant, machinery and eqipment 392.79 - - 392.79 377.00 4.52 4.52 377.00 15.79
395.81 - 3.02 392 .79 379.09 4.86 6.95 377.00 15.79
[III] Assets taken on lease :
(i) Leasehold land [Note (ii)(b)] 118.73 - - 118.73 11.26 1.18 - 12.44 106.29
118.73 - - 118.73 10.08 1.18 - 11.26 107.47
(ii) Buildings 31.28 - - 31.28 3.73 0.08 (0.44) 4.25 27.03
31.28 - - 31.28 3.21 0.08 (0.44) 3.73 27.55
(iii) Plant, machinery and eqipment 36.43 - - 36.43 29.94 1.83 - 31.77 4.66
36.43 - - 36.43 27.86 2 .08 - 29.94 6.49
(iv) Computers and other IT assets 113.21 38.22 - 151.43 63.62 31.27 - 94.89 56.54
63.92 49.29 - 113.21 42 .58 21.04 - 63.62 49.59
Total Tangible assets 20,403.41 1,826.88 207.59 22,022.70 8,656.94 1,249.87 171.82 9,734.99 12,287.71
18 ,497.67 2,019.43 113.69 20 ,403.41 7 ,585.71 1 ,177.74 106.51 8 ,656.94 11 ,746.47
Notes :
(i) Buildings include ` 8,631 (as at March 31, 2012 ` 8,631) being value of investments in shares of Co-operative Housing Societies.(ii) (a) Buildings, water system and sanitation and plant and machinery include gross block of ` 4.76 crores, ` 18.15 crores and ` 25.31 crores (as at March 31, 2012 ` 4.76 crores, ` 1.93 crores
and ` 8.83 crores) and net block of ` 0.08 crore, ` 15.74 crores and ` 18.50 crores respectively (as at March 31, 2012 ` 0.08 crore, ` 0.18 crore and ` 4.69 crores) in respect of expenditure incurred on capital assets, ownership of which does not vest in the Company.
(b) The registration of leasehold land of ` 10.80 crores (as at March 31, 2012 ` 10.80 crores) is in process. (iii) Includes plant, machinery and equipment, furniture fixtures, office equipment, vehicles and computers and other IT assets having gross block of ` 189.08 crores, ` 0.15 crore and ` 0.66 crore,
` 1.49 crores and ` 165.64 crores (as at March 31, 2012 ` 142.84 crores, ` 0.14 crore, ` 1.27 crores, ` 1.39 crores and ` 119.46 crores), and net block of ` 5.69 crores, ` 0.01 crore, ` 0.06 crore, ` 0.02 crore and ` 0.53 crore (as at March 31, 2012 ` 5.24 crores, ` 0.01 crore, ` 0.07 crore, ` 0.02 crore and ` 0.28 crore) respectively, held for disposal.
(iv) Additions / adjustments include capitalisation of exchange loss mainly on plant, machinery and equipment of ` 169.22 crores (2011-2012 capitalisation of exchange loss of ` 165.08 crores).(v) Depreciation excludes : (a) Lease equalisation of ` 4.52 crores (2011-2012 ` 4.52 crores) adjusted in lease rental income. (b) Depreciation of ` 0.44 crore (2011-2012 ` 0.44 crore) on revalued portion of gross block transferred to Revaluation Reserve.
13. Intangible assets (` in crores)
Particulars Cost as at
April 1,
2012
Additions /
adjustments
**
Deductions /
adjustments
Cost as at
March 31,
2013
Accumulated
amortisation
as at April 1,
2012
Amortisation
for the year
Deductions /
adjustments
for the year
Accumulated
amortisation
up to March
31, 2013
Net book
value as at
March 31,
2013
(i) Technical Know-how # 34.51 - - 34.51 34.51 - - 34.51 -
34.51 - - 34.51 34.51 - - 34.51 -
(ii) Computer software # 382.32 34.95 0.23 417.04 276.86 41.21 0.23 317.84 99.20
307.56 75.63 0.87 382 .32 235.79 41.63 0.56 276.86 105.46
(iii) Product development cost * 4,165.15 427.78 - 4,592.93 997.56 526.54 - 1,524.10 3,068.83
3 ,043.58 1 ,121.57 - 4 ,165.15 610.24 387.37 0.05 997.56 3 ,167.59
Total Intangible assets 4,581.98 462.73 0.23 5,044.48 1,308.93 567.75 0.23 1,876.45 3,168.03
3 ,385.65 1 ,197.20 0.87 4 ,581.98 880.54 429.00 0.61 1 ,308.93 3 ,273.05
Notes : * internally generated intangible asset# other than internally generated intangible asset** Additions / adjustments include capitalisation of exchange loss mainly on product development cost of ` 19.50 crores (2011-2012 capitalisation of exchange gain of ` 25.47 crores).

138
NOTES FORMING PART OF FINANCIAL STATEMENTS
68th ANNUAL REPORT 2012-13
(` in crores)
As at March 31, 2013
As at March 31, 2012
14. Non-current investmentsNumber Face value
per unit Description
I. Long-term investments (at cost)(A) Trade investments(1) Fully paid Ordinary / Equity shares (quoted)(i) Associates
29,82,214 10 Automobile Corporation of Goa Ltd. 108.22 108.21 (465 shares acquired during the year)
(ii) Others44,32,497 10 Tata Steel Ltd 245.04 245.04
70,249 10 Tata Chemicals Ltd. 0.24 0.24 353.50 353.49
(2) Fully paid Ordinary / Equity shares (unquoted) (i) Subsidiaries
75,00,000 100 Sheba Properties Ltd 75.00 75.00 3,03,00,600 10 Tata Technologies Ltd 224.10 224.10
36,98,120 10 Concorde Motors (India) Ltd 49.63 49.63 6,50,00,000 10 TAL Manufacturing Solutions Ltd 150.00 150.00 7,70,00,000 10 TML Drivelines Ltd 448.85 448.85
25,00,000 10 Tata Motors Insurance Broking and Advisory Services Ltd 19.31 19.31 [Note 5 page 139]
30,16,060 (KRW) 5,000 Tata Daewoo Commercial Vehicle Co. Ltd (Korea) 245.41 245.41 2,72,48,427 (GBP) 1 Tata Motors European Technical Centre Plc, UK
[Note 6, page 139]
220.94 25.89
(1,58,34,205 shares acquired during the year, 67,88,104 shares issued on conversion of loan and 13,63,624 shares issued on conversion of preference shares during the year)
7,900 - Tata Technologies Inc 0.63 0.63
123,00,00,000 10 Tata Motors Finance Ltd 2,200.00 2,050.00
(6,00,00,000 shares acquired during the year)
8,67,00,000 10 Tata Marcopolo Motors Ltd [Note 7, page 139] 86.70 86.70
22,50,00,000 10 TML Distribution Company Ltd 225.00 225.00
1,48,69,900 (THB) 100 Tata Motors (Thailand) Ltd [Note 8, page 139] 209.89 209.89
1,19,02,200 (ZAR) 1 Tata Motors (SA) (Proprietary) Ltd 7.81 7.81
254,66,59,318 (USD) 1 TML Holdings Pte Ltd, (Singapore) [Note 9, page 139] 11,816.76 11,816.76
1,34,523 (EUR) 31.28 Tata Hispano Motors Carrocera S.A. [Note 10, page 139] 17.97 17.97
1,83,59,203 (SGD) 1 Tata Precision Industries Pte. Ltd (Singapore) 40.53 40.53
59,71,315 (USD) 1 PT Tata Motors Indonesia 30.38 -
(59,71,315 shares acquired during the year)
Trilix Srl., Turin (Italy) [Note 11, page 139] 11.94 11.94
16,080.85 15,705.42
(ii) Associates
16,000 (TK) 1,000 NITA Co. Ltd (Bangladesh) 1.27 1.27
9,00,00,000 10 Tata Cummins Ltd 90.00 90.00
5,23,33,170 10 Tata AutoComp Systems Ltd 77.47 77.47
3,97,50,000 10 Tata Hitachi Construction Machinery Company Ltd
(formerly known as Telco Construction Equipment Co. Ltd) 79.50 79.50
248.24 248.24
(iii) Joint venture (JV)
8,97,57,980 100 Fiat India Automobiles Ltd [Note 12, page 139] 1,242.04 1,242.04
(iv) Others
50,000 1,000 Tata International Ltd 28.85 3.85
(25,000 shares acquired during the year)
1,383 1,000 Tata Services Ltd 0.14 0.14
350 900 The Associated Building Company Ltd 0.01 0.01
1,03,10,242 100 Tata Industries Ltd. 183.19 183.19
1,35,000 100 Tata Projects Ltd 4.68 4.68
33,600 100 Kulkarni Engineering Associates Ltd 0.67 0.67
12,375 1,000 Tata Sons Ltd 68.75 68.75
2,25,00,001 10 Haldia Petrochemicals Ltd. 22.50 22.50
2,40,000 10 Oriental Floratech (India) Pvt. Ltd 0.24 0.24
43,26,651 10 Tata Capital Ltd 6.70 5.86
(4,21,027 shares acquired during the year) 315.73 289.89
(3) Fully paid Cumulative Redeemable Preference shares
(unquoted)
Subsidiaries
13,54,195 100 7% Concorde Motors (India) Ltd 13.54 13.54
- - 6% Tata Motors European Technical Centre Plc, UK (13,63,624 shares converted into equity shares during the year)
- 11.12
13.54 24.66
Carried forward 18,253.90 17,863.74

139
NOTES FORMING PART OF FINANCIAL STATEMENTS
Standalone Financials (116-159)
CORPORATE OVERVIEW FINANCIAL HIGHLIGHTS FINANCIAL STATEMENTSSTATUTORY REPORTS
(` in crores)
Number Face value
per unit
Description As at
March 31, 2013
As at
March 31, 2012
I. Long-term investments (at cost) (contd.)
Brought forward 18,253.90 17,863.74
(B) Other investments
Fully paid Equity shares (unquoted)
50,000 10 NICCO Jubilee Park Ltd. 0.05 0.05
18,253.95 17,863.79
Less : Provision for Diminution in value of long term
investments
99.06 108.73
II. Retained interest in securitisation transactions
(unquoted)
- 0.37
III. Advance towards investments
Tata Motors European Technical Centre Plc, UK - 121.56
Tata International Ltd. - 25.00
PT Tata Motors Indonesia 16.82 1.30
16.82 147.86
Total Non-current investments 18,171.71 17,903.29
Notes :
(1) Face Value per unit is in Rupees unless stated otherwise
(2) Book value of quoted investments 353.50 353.49
(3) Book value of unquoted investments 17,818.21 17,549.80
(4) Market value of quoted investments 204.82 299.54
(5) The Company has given a letter of comfort to HDFC Bank amounting to ` 1 crore against working capital facility to Tata Motors Insurance Broking and Advisory Services Ltd
(TMIBASL). Also the Company has given an undertaking to HDFC Bank that it will not dilute its stake below 51% during the tenor of the loan.
(6) The Company has given a letter of comfort to Standard Chartered Bank, London for GBP 15 million (` 123.16 crores as on March 31, 2013) against loan extended by the bank
to Tata Motors European Technical Centre Plc, UK (TMETC). Also the Company has given an undertaking to Standard Chartered Bank, London to retain 100% ownership of
TMETC at all times during the tenor of the loan.
(7) The Company has given a letter of comfort to HDFC Bank against the short term and long term loans aggregating ̀ 235 crores given by HDFC Bank to Tata Marcopolo Motors
Ltd (TMML). The letter of comfort is restricted to 51% of loan amount i.e. ` 120 crores. Also the Company has given an undertaking to HDFC Bank that it will not dilute its stake
below 51% during the tenor of the loan.
(8) The Company has given a letter of comfort to Citibank NA towards the short term and long term loans aggregating THB 1,055 million (` 195.41 crores as on March 31, 2013)
given by Citibank NA to Tata Motors (Thailand) Ltd (TMTL). The Company has also given letter of comfort to ICICI Bank towards Working Capital Facility aggregating THB 300
million (` 55.57 crores as on March 31,2013) given by ICICI Bank to Tata Motors (Thailand) Ltd (TMTL). Further the Company has given an undertaking to Citibank NA as well
as to ICICI Bank for non-disposal of its shareholding in TMTL below 51% during the tenor of the loan.
(9) The Company has given a letter of comfort to GE Commercial Distribution Finance Europe Ltd for revolving syndicated loan facility to Jaguar Cars Ltd and Land Rover for
outstanding balance of GBP 50 million (` 410.54 crores as on March 31, 2013). Also the Company has given an undertaking to GE Commercial Distribution Finance Europe
Ltd to retain ultimate 100% ownership of Jaguar Cars Ltd and Land Rover at all times during the tenor of the loan.
(10) The Company has given a letter of comfort to Citibank NA against working capital loans extended by the bank to Tata Hispano Motors Carrocera, S.A. (Hispano) aggregating
Euro 30 million (` 208.64 crores as on March 31, 2013). The Company has also given a letter of comfort to Banco de Valencia against bill discounting facility extended by the
bank to Hispano aggregating Euro 2 million (` 13.91 crores as on March 31, 2013).The Company has also given an undertaking to Citibank NA and Banco de Valencia for non-
disposal of its shareholding in Hispano during the tenor of the loan.
(11) Trilix Srl., Turin (Italy) is a limited liability company.
(12) (a) The Company has given letter of comfort to certain banks and other lenders against credit facilities extended to Fiat India Automobiles Ltd for ` 1,600 crores and Euro 130
million (` 904.13 crores as on March 31, 2013). The Letter of Comfort is restricted to 50% of the value of credit facilities extended i.e. ` 1,252.06 crores.
(b) The Company has an investment of ` 1,242.04 crores in Fiat India Automobiles Ltd. During the period, Fiat India Automobiles Ltd has effected reduction of its equity share
capital as per the scheme approved by the High Court of Judicature at Mumbai. Consequent to such reduction of share capital, the Company holds 8,97,57,980 shares of face
value of ` 10 each in Fiat India Automobiles Ltd in place of 9,59,96,395 shares of face value of ` 10 each.
(13) Trade Investments also include :
Number Face value
per unit
Description ` `
(i) Investments in subsidiary companies
100 (SGD) 1 TML Holdings Pte Ltd, (Singapore) 2,778.73 2,778.73
(ii) Investments in other companies
5,000 10 Metal Scrap Trade Corporation Ltd 25,000 25,000
50 5 Jamshedpur Co-operative Stores Ltd 250 250
16,56,517 (M$) 1 Tatab Industries Sdn. Bhd. Malaysia 1 1
4 25,000 ICICI Money Multiplier Bond 1 1
100 10 Optel Telecommunications 1,995 1,995
200 10 Punjab Chemicals 1 1

140
NOTES FORMING PART OF FINANCIAL STATEMENTS
68th ANNUAL REPORT 2012-13
(` in crores)
As at
March 31, 2013
As at
March 31, 2012
15. Current investments
Number Face value
per unit
Description
I Current investments - others (at cost or fair value whichever is lower)
(A) Trade investments
(1) Fully paid Cumulative Redeemable Preference shares (unquoted)
(i) Subsidiaries
25,85,463 (USD) 100 6.25% TML Holdings Pte Ltd, (Singapore) [Note 5 below] 1,403.26 2,558.25
(24,43,536 shares redeemed during the year)
(ii) Associates
- - 8% Tata AutoComp Systems Ltd - 21.00
(2,10,00,000 shares redeemed during the year)
(iii) Others
- - 7.5% Tata Sons Ltd - 10.00
(1,00,000 shares redeemed during the year) - 31.00
1,403.26 2,589.25
(B) Other invetments
(1) Investments in mutual fund (unquoted)
Liquid/liquid plus schemes
1,16,339 1,000 Tata Liquid Fund Plan A-Growth 25.00 -
3,95,524 1,000 Kotak Floater Short Term-Growth 75.41 -
7,62,02,139 10 DWS Ultra Short Term Fund-Institutional Plan-Growth 102.01 -
10,59,53,037 10 Templeton India Ultra - Short Bond Fund - Super Institutional - Growth 157.00 -
359.42 -
(2) Investments in Equity shares (unquoted)
35,000 10 Elcot Power Control Ltd 0.37 0.37
91,800 10 Munis Forge Ltd. 0.37 0.37
30,997 10 Roofit Industries Ltd. 0.19 0.19
0.93 0.93
(3) Investments in Preference shares (unquoted)
1,00,000 100 15.50% Pennar Paterson Securities Ltd 1.00 1.00
2,00,000 100 15.00% Atcom Technologies Ltd. - Cumulative Preference Shares 2.00 2.00
3.00 3.00
(4) Non-Convertible Debentures (unquoted)
- - 8% Tata Projects Ltd - 0.75
(2,500 debentures redeemed during the year)
363.35 4.68
Less : Provision for Diminution in value of current investments 3.93 3.93
359.42 0.75
(C) Retained interest in securitisation transactions (unquoted) - 0.26
Total current investments 1,762.68 2590.26
Notes:
(1) Face value per unit is in Rupees unless stated otherwise
(2) Book value of quoted investments - -
(3) Book value of unquoted investments 1,762.68 2,590.26
(4) Market value of quoted investments - -
(5) Subsequent to the year ended March 31, 2013, TML Holdings Pte Ltd, (Singapore), a wholly owned subsidiary of the Company, redeemed 25,85,463 Cumulative Redeemable Preference shares of USD 100 each at par, for a consideration of ` 1415.17 crores.

141
NOTES FORMING PART OF FINANCIAL STATEMENTS
Standalone Financials (116-159)
CORPORATE OVERVIEW FINANCIAL HIGHLIGHTS FINANCIAL STATEMENTSSTATUTORY REPORTS
(` in crores)
As at As at
March 31, March 31,
2013 2012
16. Long-term loans and advances
Unsecured (considered good unless stated otherwise)
(a) Loans to employees 39.20 43.10
(b) Loan to a Joint Venture (FIAT India Automobile Ltd) 265.00 265.00
(c) Loans to subsidiaries :
Considered good 303.61 407.51
Considered doubtful 398.95 153.95
702.56 561.46
Less : Allowances for doubtful loans (398.95) (153.95)
303.61 407.51
(d) Dues from subsidiary (Tata Hispano Motors Carrocera S.A.) 47.92 -
(e) Taxes recoverable, statutory deposits and dues from government 694.54 723.76
(f ) Capital advances 127.32 163.66
(g) Credit entitlement of Minimum Alternate Tax (MAT) 1,508.98 1,447.04
(h) Non-current income tax assets (net of provisions) 472.86 321.89
(i) Others :
Considered good 115.81 116.15
Considered doubtful 12.29 -
128.10 116.15
Less : Allowances for doubtful loans and advances (12.29) -
115.81 116.15
3,575.24 3,488.11
As at As at
March 31, March 31,
2013 2012
17. Short-term loans and advances
(A) Secured
(a) Finance receivables [Note (iii) page 142]
Vehicle loans*
Considered good 37.18 101.95
Considered doubtful 238.00 313.23
275.18 415.18
Less : Allowances for doubtful loans** (238.00) (313.23)
37.18 101.95
(B) Unsecured (considered good unless stated othewise)
(a) Advances and other receivables recoverable [Note (i) page 142]
Considered good 173.60 173.77
Considered doubtful 70.99 59.63
244.59 233.40
Less : Allowances for doubtful loans and advances (70.99) (59.63)
173.60 173.77
(b) Inter corporate deposits
Considered good - 48.82
Considered doubtful 6.51 1.22
6.51 50.04
Less : Allowances for doubtful loans (6.51) (1.22)
- 48.82
(c) Dues from subsidiary companies [Note (ii) page 142] 107.80 79.53
(d) VAT, other taxes recoverable, statutory deposits and dues from Government 1,173.24 1,102.92
(e) Current income tax assets (net of provisions) 27.41 357.83
(f ) Others 12.86 6.92
1,494.91 1,769.79
Total (A + B) 1,532.09 1,871.74

142
NOTES FORMING PART OF FINANCIAL STATEMENTS
68th ANNUAL REPORT 2012-13
(iii) Finance receivables (Secured) ***
Current portion 37.18 101.95
Non-current portion - -
* Includes ` 1.17 crores (as at March 31, 2012 ` 204.84 crores) on account of overdue securitised receivables
** Includes ` Nil (as at March 31, 2012 ` 159.50 crores) towards securitised receivables.
*** Loans are secured against hypothecation of vehicles.
As at As at
March 31, March 31,
2013 2012
18. Other non-current assets
(a) Prepaid debt issue cost 33.27 53.55
(b) Prepaid expenses 0.80 -
(c) Interest accrued on deposits / loans 60.14 46.87
(d) Derivative financial instruments 0.11 -
94.32 100.42
As at As at
March 31, March 31,
2013 2012
19. Other current assets
(a) Prepaid debt issue cost 12.71 13.96
(b) Prepaid expenses 63.58 39.65
(c) Interest accrued on deposits / loans 25.63 59.34
(d) Derivative financial instruments 2.34 0.46
104.26 113.41
(i) Loans and advances due from Directors & officers - 0.09
(ii) Dues from subsidiary companies
(a) TML Drivelines Ltd 14.47 7.07
(b) Tata Daewoo Commercial Vehicle Co. Ltd 1.50 0.24
(c) Tata Marcopolo Motors Ltd. 51.04 10.87
(d) Tata Motors (Thailand) Ltd 25.28 24.91
(e) TML Distribution Company Ltd 0.01 -
(f ) Tata Motors (SA) (Proprietary) Ltd 3.57 2.32
(g) TAL Manufacturing Solutions Ltd - 0.27
(h) Tata Motors European Technical Centre Plc 0.42 -
(i) Tata Motors Finance Ltd 0.01 -
(j) Jaguar Land Rover Ltd 8.06 -
(k) PT Tata Motors Indonesia 3.44 -
(i) Tata Hispano Motors Carrocera S.A. - 33.85
107.80 79.53
(` in crores)
As at As at
March 31, March 31,
Note : 2013 2012

143
NOTES FORMING PART OF FINANCIAL STATEMENTS
Standalone Financials (116-159)
CORPORATE OVERVIEW FINANCIAL HIGHLIGHTS FINANCIAL STATEMENTSSTATUTORY REPORTS
As at As at
March 31, March 31,
2013 2012
21. Trade receivables
(a) Due over six months :
Considered good (unsecured) 461.32 274.23
Considered doubtful 221.50 178.30
682.82 452.53
Less : Allowances for doubtful debts (221.50) (178.30)
461.32 274.23
(b) Others :
Considered good (unsecured) 1,356.72 2,434.09
Considered doubtful 19.09 2.93
1,375.81 2,437.02
Less : Allowances for doubtful debts (19.09) (2.93)
1,356.72 2,434.09
1,818.04 2,708.32
As at As at
March 31, March 31,
2013 2012
22. Cash and bank balances
(A) Cash and cash equivalents
(a) Cash on hand 1.22 1.76
(b) Cheques on hand 46.84 54.25
(c) Current account with banks # 157.51 863.50
(d) Bank deposits with upto 3 months maturity - 0.13
205.57 919.64
(B) Other bank balances (with more than 3 months but less than 12 months maturity)
(a) Earmarked balance with banks 247.38 195.57
(b) Bank deposits 0.21 600.07
(c) Margin money / cash collateral with banks 5.77 0.02
253.36 795.66
(C) Other bank balances (with more than 12 months maturity)
(a) Margin money / cash collateral with banks 0.02 95.66
(b) Bank deposits 3.91 30.00
3.93 125.66
462.86 1,840.96
# Includes
- Remittances in transit 116.17 43.56
- In foreign currencies 0.29 759.19
(` in crores)
As at As atMarch 31, March 31,
2013 2012
20. Inventories
(a) Stores and spare parts 152.26 140.89
(b) Consumable tools 20.10 18.90
(c) Raw materials and components 1,283.78 1,462.14
(d) Work-in-progress 389.25 427.55
(e) Finished goods 2,310.90 2,189.58
(f ) Stock-in-trade (in respect of goods acquired for trading) 153.96 93.38
(g) Goods-in-transit
(i) Raw materials and components 83.44 132.82
(ii) Stock-in-trade 61.34 122.97
4,455.03 4,588.23

144
NOTES FORMING PART OF FINANCIAL STATEMENTS
68th ANNUAL REPORT 2012-13
(` in crores)
2012-2013 2011-2012
23. Total revenue
1. Revenue from operations
(a) Sale of products (Note 1 below) [Note 38, page 157] 48,665.28 58,650.42
(b) Sale of services 222.29 195.11
(c) Income from vehicle loan contracts 39.48 74.25
48,927.05 58,919.78
(d) Other operating revenues 392.68 301.16
49,319.73 59,220.94
2. Other income
(a) Interest income 383.64 363.67
(b) Dividend income [Note 2 below] 1,660.65 180.63
(c) Profit on sale of investments (current) (net) 43.91 29.78
2,088.20 574.08
Note :
(1) Includes exchange gain / (loss) (net) 101.35 (52.48)
(2) Includes dividend on
(a) Trade investments (non-current) 77.07 65.56
(b) Dividend from subsidiary companies 1,583.58 113.83
(c) Other investments (current) - 1.24

145
NOTES FORMING PART OF FINANCIAL STATEMENTS
Standalone Financials (116-159)
CORPORATE OVERVIEW FINANCIAL HIGHLIGHTS FINANCIAL STATEMENTSSTATUTORY REPORTS
(` in crores)
2012-2013 2011-2012
24. Employee cost/ benefits expense
(a) Salaries, wages and bonus 2,312.15 2,193.80
(b) Contribution to provident fund and other funds 207.53 210.55
(c) Staff welfare expenses 317.32 287.10
2,837.00 2,691.45
2012-2013 2011-2012
25. Finance cost
(a) Interest 1,378.78 1,058.61
Less: Transferred to capital account (327.33) (209.17)
1,051.45 849.44
(b) Discounting charges 336.31 369.18
1,387.76 1,218.62
2012-2013 2011-2012
26. Other expenses
(a) Processing charges 1,743.64 2,057.51
(b) Consumption of stores and spare parts 655.67 753.02
(c) Power and fuel 484.66 550.89
(d) Rent 84.11 65.34
(e) Repairs to buildings 91.97 80.43
(f ) Repairs to plant, machinery etc. 95.61 95.15
(g) Insurance 74.80 68.35
(h) Rates and taxes 32.01 34.03
(i) Freight, transportation, port charges, etc. 929.63 1,052.87
(j) Publicity 792.67 948.65
(k) Excise duty on closing stock 58.41 89.34
(l) Works operation and other expenses [note below] 2,730.47 2,609.93
7,773.65 8,405.51
Note :
Works operation and other expenses include
(a) Warranty expenses 353.05 368.92
(b) Computer expenses 529.43 432.93
(c) Consultancy 189.96 275.23
(d) Provisions and write off for sundry debtors, vehicle loans and advances 35.80 103.04

146
NOTES FORMING PART OF FINANCIAL STATEMENTS
68th ANNUAL REPORT 2012-13
2012-2013 2011-2012
27. Earnings Per Share :
(a) Profit after tax ` crores 301.81 1,242.23
(b) The weighted average number of Ordinary shares for Basic EPS Nos. 270,60,14,707 269,15,42,867
(c) The weighted average number of ‘A’ Ordinary shares for Basic EPS Nos. 48,19,58,717 48,19,00,898
(d) The nominal value per share (Ordinary and ‘A’ Ordinary) ` 2.00 2.00
(e) Share of profit for Ordinary shares for Basic EPS ` crores 252.09 1,049.50
(f ) Share of profit for ‘A’ Ordinary shares for Basic EPS * ` crores 49.72 192.73
(g) Earnings Per Ordinary share (Basic) ` 0.93 3.90
(h) Earnings Per ‘A’ Ordinary share (Basic) ` 1.03 4.00
(i) Profit after tax ` crores 301.81 1,242.23
(j) Add: Interest payable on outstanding Foreign Currency Convertible Notes ` crores - -
(k) Profit after tax for Diluted EPS ` crores 301.81 1,242.23
(l) The weighted average number of Ordinary shares for Basic EPS Nos. 270,60,14,707 269,15,42,867
(m) Add: Adjustment for Options relating to warrants, shares held in abeyance,
Foreign Currency Convertible Notes and Convertible Alternative Reference
Securities Nos. 4,92,722 10,63,47,857
(n) The weighted average number of Ordinary shares for Diluted EPS Nos. 270,65,07,429 279,78,90,724
(o) The weighted average number of ‘A’ Ordinary shares for Basic EPS Nos. 48,19,58,717 48,19,00,898
(p) Add: Adjustment for ‘A’ Ordinary shares held in abeyance Nos. 2,47,798 3,05,518
(q) The weighted average number of ‘A’ Ordinary shares for Diluted EPS Nos. 48,22,06,515 48,22,06,416
(r) Share of profit for Ordinary shares for Diluted EPS ` crores 252.08 1,055.50
(s) Share of profit for ‘A’ Ordinary shares for Diluted EPS * ` crores 49.73 186.73
(t) Earnings Per Ordinary share (Diluted) ` 0.93 3.77
(u) Earnings Per ‘A’ Ordinary share (Diluted) ` 1.03 3.87
* ‘A’ Ordinary shareholders are entitled to receive dividend @ 5% points more on Face value, than the aggregate rate of dividend determined
by the Company on Ordinary shares for the financial year.

147
NOTES FORMING PART OF FINANCIAL STATEMENTS
Standalone Financials (116-159)
CORPORATE OVERVIEW FINANCIAL HIGHLIGHTS FINANCIAL STATEMENTSSTATUTORY REPORTS
(` in crores)
As at As at
March 31, March 31,
2013 2012
28. Contingent liabilities, commitments (to the extent not provided for) :
Description of claims and assertions where a potential loss is possible, but not probable is reported under
note (1) and (2) below :
1 Claims against the Company not acknowledged as debts -
(i) Sales tax - Gross 353.54 413.12
- Net of tax 238.84 279.08
(ii) Excise duty - Gross 867.35 197.54
- Net of tax 585.94 133.45
(iii) Others - Gross 173.90 157.02
- Net of tax 117.48 106.07
(iv) Income Tax in respect of matters :
(a) Decided in the Company’s favour by Appellate Authorities and for which the Department is
in further appeal - 2.38
(b) Pending in appeal / other matters 95.20 95.20
2 The claims / liabilities in respect of excise duty, sales tax and other matters where the issues were decided
in favour of the Company for which the Department is in further appeal 70.80 69.77
3 Other money for which the Company is contingently liable -
(i) In respect of bills discounted and export sales on deferred credit
The Company has given guarantees for liability in respect of receivables assigned by way of
securitisation
Cash margins / collateral [Note 22, page 143]
In respect of subordinated receivables
Others
204.30 139.21
(ii)
- 107.80
(iii) - 90.29
(iv) - 9.51
(v) - 6.64
4 Estimated amount of contracts remaining to be executed on capital account and not provided for 1,526.11 1,536.25
5 Purchase commitments 12,142.44 12,527.63

148
NOTES FORMING PART OF FINANCIAL STATEMENTS
68th ANNUAL REPORT 2012-13
(` in crores)
As at As at
March 31, March 31,
2013 2012
29. Disclosure in respect of leases :
(A) Finance leases :
Assets taken on lease :
(a) (i) Total of minimum lease payments 52.32 48.47
The total of minimum lease payments for a period :
Not later than one year 21.02 14.11
Later than one year and not later than five years 31.30 34.36
(ii) Present value of minimum lease payments 48.98 44.54
Present value of minimum lease payments for a period :
Not later than one year 17.06 13.83
Later than one year and not later than five years 31.92 30.71
(b) A general description of the significant leasing arrangements -
The Company has entered into Finance lease arrangements for computers
and data processing equipments from a vendor. The finance lease obligation
is secured by a charge against the said assets.
(B) Operating leases
Assets given on lease :
(a) Total of minimum lease payments 58.95 66.65
The total of minimum lease payments for a period :
Not later than one year 4.41 4.71
Later than one year and not later than five years 17.63 18.83
Later than five years 36.91 43.11
(b) Gross block 79.68 78.52
Accumulated Depreciation 18.83 14.75
Depreciation for the year ` 4.02 crores (2011-12 ` 4.30 crores)
(c) A general description of significant leasing arrangements-
The Company has entered into Operating lease arrangements
for buildings and plant and machinery.
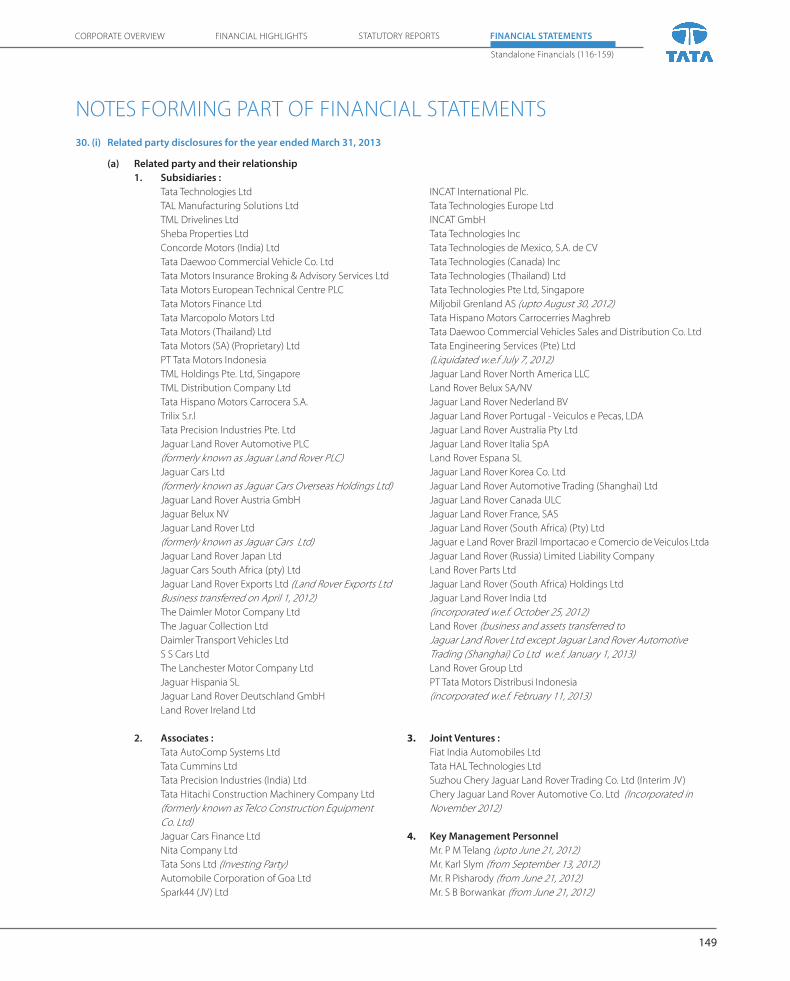
149
NOTES FORMING PART OF FINANCIAL STATEMENTS
Standalone Financials (116-159)
CORPORATE OVERVIEW FINANCIAL HIGHLIGHTS FINANCIAL STATEMENTSSTATUTORY REPORTS
30. (i) Related party disclosures for the year ended March 31, 2013
(a) Related party and their relationship
1. Subsidiaries :
Tata Technologies Ltd INCAT International Plc.
TAL Manufacturing Solutions Ltd Tata Technologies Europe Ltd
TML Drivelines Ltd INCAT GmbH
Sheba Properties Ltd Tata Technologies Inc
Concorde Motors (India) Ltd Tata Technologies de Mexico, S.A. de CV
Tata Daewoo Commercial Vehicle Co. Ltd Tata Technologies (Canada) Inc
Tata Motors Insurance Broking & Advisory Services Ltd Tata Technologies (Thailand) Ltd
Tata Motors European Technical Centre PLC Tata Technologies Pte Ltd, Singapore
Tata Motors Finance Ltd Miljobil Grenland AS (upto August 30, 2012)
Tata Marcopolo Motors Ltd Tata Hispano Motors Carrocerries Maghreb
Tata Motors (Thailand) Ltd Tata Daewoo Commercial Vehicles Sales and Distribution Co. Ltd
Tata Motors (SA) (Proprietary) Ltd Tata Engineering Services (Pte) Ltd
PT Tata Motors Indonesia (Liquidated w.e.f July 7, 2012)
TML Holdings Pte. Ltd, Singapore Jaguar Land Rover North America LLC
TML Distribution Company Ltd Land Rover Belux SA/NV
Tata Hispano Motors Carrocera S.A. Jaguar Land Rover Nederland BV
Trilix S.r.l Jaguar Land Rover Portugal - Veiculos e Pecas, LDA
Tata Precision Industries Pte. Ltd Jaguar Land Rover Australia Pty Ltd
Jaguar Land Rover Automotive PLC Jaguar Land Rover Italia SpA
(formerly known as Jaguar Land Rover PLC) Land Rover Espana SL
Jaguar Cars Ltd Jaguar Land Rover Korea Co. Ltd
(formerly known as Jaguar Cars Overseas Holdings Ltd) Jaguar Land Rover Automotive Trading (Shanghai) Ltd
Jaguar Land Rover Austria GmbH Jaguar Land Rover Canada ULC
Jaguar Belux NV Jaguar Land Rover France, SAS
Jaguar Land Rover Ltd Jaguar Land Rover (South Africa) (Pty) Ltd
(formerly known as Jaguar Cars Ltd) Jaguar e Land Rover Brazil Importacao e Comercio de Veiculos Ltda
Jaguar Land Rover Japan Ltd Jaguar Land Rover (Russia) Limited Liability Company
Jaguar Cars South Africa (pty) Ltd Land Rover Parts Ltd
Jaguar Land Rover Exports Ltd (Land Rover Exports Ltd Jaguar Land Rover (South Africa) Holdings Ltd
Business transferred on April 1, 2012) Jaguar Land Rover India Ltd
The Daimler Motor Company Ltd (incorporated w.e.f. October 25, 2012)
The Jaguar Collection Ltd Land Rover (business and assets transferred to
Daimler Transport Vehicles Ltd Jaguar Land Rover Ltd except Jaguar Land Rover Automotive
S S Cars Ltd Trading (Shanghai) Co Ltd w.e.f. January 1, 2013)
The Lanchester Motor Company Ltd Land Rover Group Ltd
Jaguar Hispania SL PT Tata Motors Distribusi Indonesia
Jaguar Land Rover Deutschland GmbH (incorporated w.e.f. February 11, 2013)
Land Rover Ireland Ltd
2. Associates : 3. Joint Ventures :
Tata AutoComp Systems Ltd Fiat India Automobiles Ltd
Tata Cummins Ltd Tata HAL Technologies Ltd
Tata Precision Industries (India) Ltd Suzhou Chery Jaguar Land Rover Trading Co. Ltd (Interim JV)
Tata Hitachi Construction Machinery Company Ltd Chery Jaguar Land Rover Automotive Co. Ltd (Incorporated in
(formerly known as Telco Construction Equipment November 2012)
Co. Ltd)
Jaguar Cars Finance Ltd 4. Key Management Personnel
Nita Company Ltd Mr. P M Telang (upto June 21, 2012)
Tata Sons Ltd (Investing Party) Mr. Karl Slym (from September 13, 2012)
Automobile Corporation of Goa Ltd Mr. R Pisharody (from June 21, 2012)
Spark44 (JV) Ltd Mr. S B Borwankar (from June 21, 2012)

150
NOTES FORMING PART OF FINANCIAL STATEMENTS
68th ANNUAL REPORT 2012-13
(` in crores)
(b) Transactions with the related parties
2012-2013
Subsidiaries Joint
Venture
Associates Key
Management
Personnel
Total
Purchase of goods 1,203.03 2,926.35 2,925.42 - 7,054.80
1,151.05 3,728.41 4,107.23 - 8,986.69
Sale of goods (inclusive of sales tax) 4,338.79 622.21 125.73 - 5,086.73
3,424.27 477.99 464.71 - 4,366.97
Purchase of fixed assets 32.64 - - - 32.64
45.96 - - - 45.96
Sale of division (Note 43(ii), page 159) 110.00 - - - 110.00
- - - - -
Redemption / buy back of Investments 1,378.95 - 31.00 - 1,409.95
4,150.34 - - - 4,150.34
Services received 1,761.27 0.48 17.53 23.45 1,802.73
2,129.48 - 51.27 33.07 2,213.82
Services rendered 266.03 57.85 10.89 - 334.77
134.44 8.32 16.73 - 159.49
Finance given (including loans and equity) 862.88 - 0.01 - 862.89
1,592.39 42.50 - - 1,634.89
Loans repaid by the related parties 487.80 - 23.83 - 511.63
113.00 - - - 113.00
Loans taken 2,029.30 - 50.00 - 2,079.30
1,792.20 - 9.00 - 1,801.20
Loans repaid by the Company 1,771.05 - 25.50 - 1,796.55
1,733.35 - 11.00 - 1,744.35
Interest / Dividend paid / (received) (net) (1,562.99) (35.01) 209.10 - (1,388.90)
(111.28) (32.89) 230.02 - 85.85
(c) Balances with related parties (as at March 31, 2013)
Amount receivable 460.57 79.91 10.10 - 550.58
240.55 - 62.38 - 302.93
Amount payable 293.05 - 79.75 - 372.80
290.77 112.68 116.53 - 519.98
Amount receivable (in respect of loans and interest) 748.38 325.14 - - 1,073.52
577.00 303.75 23.83 0.09 904.67
Provision for amount receivable (in respect of loans and interest) 398.95 - - - 398.95
153.95 - - - 153.95
Amount payable (in respect of loans and interest) 321.10 - 29.50 - 350.60
62.85 - 5.00 - 67.85
Bills discounted (in respect of amount receivable) - - 5.12 - 5.12
- - 25.53 - 25.53
Bank Guarantee / Other assets given as security 2.54 - 3.00 - 5.54
36.50 - 3.00 - 39.50
Note : Current year figures are shown in bold and comparative figures for the previous year are shown below the current year.

151
NOTES FORMING PART OF FINANCIAL STATEMENTS
Standalone Financials (116-159)
CORPORATE OVERVIEW FINANCIAL HIGHLIGHTS FINANCIAL STATEMENTSSTATUTORY REPORTS
(` in crores)
2012-2013 2011-2012
(d) Disclosure in respect of material transactions with related parties
(i) Purchase of goods Fiat India Automobiles Ltd 2,926.35 3,728.41
Tata Cummins Ltd 2,298.91 3,267.67
Tata Marcopolo Motors Ltd 673.51 508.85
Jaguar Land Rover 492.30 537.62
Tata AutoComp Systems Ltd 425.80 561.80
(ii) Sale of goods TML Distribution Company Ltd 3,484.44 2,464.72
Fiat India Automobiles Ltd 622.21 477.99
Concorde Motors (India) Ltd 446.10 724.74
Nita Company Ltd 94.19 168.75
Tata Hitachi Construction Machinery Company Ltd 31.53 45.43
(iii) Redemption / buy back of Investments TML Holdings Pte Ltd 1,378.95 4,150.34
Tata AutoComp Systems Ltd 21.00 -
Tata Sons Ltd 10.00 -
(iv) Purchase of fixed assets Tata Technologies Ltd 12.55 34.44
TAL Manufacturing Solutions Ltd 12.82 6.24
Trilix S.r.l. 5.19 -
(v) Services received TML Drivelines Ltd 596.07 1,057.97
Tata Technologies Ltd 481.03 405.95
Tata Motors European Technical Centre Plc 281.87 200.58
Tata Motors Finance Ltd 230.91 136.31
Tata Sons Ltd 17.44 51.27
Fiat India Automobiles Ltd 0.48 -
(vi) Services rendered Jaguar Land Rover 75.42 43.47
TML Drivelines Ltd 63.56 42.24
TML Distribution Company Ltd 62.20 9.27
Fiat India Automobiles Ltd 57.85 8.32
Tata Hitachi Construction Machinery Company Ltd 9.44 9.62
Tata Sons Ltd 1.35 0.57
(vii) Finance given (including loans and equity)
Investment in equity Tata Motors Finance Ltd 150.00 300.00
Investment in equity Automobile Corporation of Goa Ltd 0.01 -
Loan given Tata Motors (Thailand) Ltd 105.75 -
Loan given Tata Hispano Motors Carrocera S.A. 88.61 89.63
Inter corporate deposit TML Distribution Company Ltd 480.00 73.00

152
NOTES FORMING PART OF FINANCIAL STATEMENTS
68th ANNUAL REPORT 2012-13
(` in crores)
2012-2013 2011-2012
(viii) Loans repaid by the related parties
Inter corporate deposit TML Distribution Company Ltd 480.00 73.00
Inter corporate deposit Automobile Corporation of Goa Ltd 23.83 -
(ix) Loans taken
Inter corporate deposit TML Distribution Company Ltd 591.05 690.00
Inter corporate deposit Tata Technologies Ltd 817.65 461.40
Inter corporate deposit TML Drivelines Ltd 529.60 617.05
Inter corporate deposit Automobile Corporation of Goa Ltd 50.00 9.00
(x) Loans repaid by the Company
Inter corporate deposit TML Distribution Company Ltd 591.05 690.00
Inter corporate deposit TML Drivelines Ltd 496.25 560.20
Inter corporate deposit Tata Technologies Ltd 635.75 459.40
Inter corporate deposit Automobile Corporation of Goa Ltd 25.50 11.00
(xi) Interest / dividend paid / (received)
Dividend paid Tata Sons Ltd 282.99 290.77
Dividend received TML Holdings Pte Ltd, Singapore (1,421.98) -
Dividend received Tata Cummins Ltd (36.00) (27.00)
Dividend received Tata Sons Ltd (11.20) (10.60)
Interest paid Fiat India Automobiles Ltd 151.93 85.48
Interest received Fiat India Automobiles Ltd (186.94) (118.37)

153
NOTES FORMING PART OF FINANCIAL STATEMENTS
Standalone Financials (116-159)
CORPORATE OVERVIEW FINANCIAL HIGHLIGHTS FINANCIAL STATEMENTSSTATUTORY REPORTS
ii) Disclosures required by Clause 32 of the Listing Agreement
Amount of loans / advances in nature of loans outstanding from subsidiaries and associates during 2012-2013
Name of the Company Outstanding as at March 31,
2013
Maximum amount outstanding during
the year
Investment in shares of the
Company
Direct Investment in shares of subsidiaries of
the Company
` in crores ` in crores No. of shares No. of shares
a) Subsidiaries
Sheba Properties Ltd - 0.80 - 8,11,992
[Shares in Tata Technology] - - - 8,11,992
Tata Technologies Ltd - - - -
- 3.00 - -
TAL Manufacturing Solutions Ltd - - - -
- 34.00 - -
Tata Motors European Technical Centre Plc., UK - 55.33 - -
[Shares in Miljobil Grenland AS] 55.33 55.78 - 9 ,498
Tata Marcopolo Motors Ltd - 5.00 - -
5.00 5.00 - -
Tata Motors (Thailand) Ltd 278.98 278.98 - -
154.69 157.70 - -
TML Distribution Company Ltd - 200.00 - -
- 35.00 - -
Tata Hispano Motors Carrocera S.A. 416.03 416.03 - 40,000
[Shares in Tata Hispano Motors Carrocerries Maghreb] 342 .91 352 .58 - 40 ,000
Tata Motors Insurance Broking and Advisory Services Ltd - 1.70 - -
1.70 1.70 - -
Tata Motors (SA) Proprietary Ltd 7.56 8.53 - -
8.53 8.53 - -
b) Associates
Tata AutoComp Systems Ltd - 23.83 - -
23.83 23.83 - -
c) Joint Ventures :
Fiat India Automobiles Ltd 265.00 265.00 - -
265.00 265.00 - -
Note : Current year figures are shown in bold and comparative figures for the previous year are shown below the current year.
31. The Company has a joint venture with Fiat Group Automobiles S.p.A., Italy, Fiat India Automobiles Limited (FIAL), for manufacturing passenger cars, engines and
transmissions at Ranjangaon in India. The Company has an investment of ` 1,242.04 crores as at March 31, 2013, representing 50% shareholding in FIAL .
The proportionate share of assets and liabilities as at March 31, 2013 and income and expenditure for the year 2012-2013 of FIAL as per their unaudited financial
statement are given below :
(` in crores)
As on March 31,
2013
As on March 31,
2012 2012-2013 2011-2012
RESERVES AND SURPLUS (578.81) (650.58) INCOME
Revenue from operations 1,869.09 1,716.47
NON-CURRENT LIABILITIES Less : Excise duty (253.80) (247.73)
Long-term borrowings 634.12 795.69 Other operating income 141.90 169.21
Other long-term liabilities 2.18 - Other income 86.10 92.92
Long-term provisions 5.35 6.24 1,843.29 1,730.87
CURRENT LIABILITIES
Short-term borrowings 108.01 99.90
Trade payables 668.54 633.87
Other current liabilities 260.46 304.41 EXPENDITURE
Short-term provisions 3.09 8.61 Manufacturing and other expenses 1,413.24 1,429.57
1,681.75 1,848.72 Product development cost 2.28 3.27
NON-CURRENT ASSETS Depreciation 166.59 160.76
Fixed assets 1,386.26 1,516.50 Finance cost 179.03 162.81
Other long-term loans and advances 82.27 42.60 Exchange Loss (net) on revaluation of foreign
Othe non-current assets 20.77 29.13 currency borrowings, deposits and loan given 10.77 17.85
Current assets 717.87 714.15 Tax expenses / (credit) (0.39) -
2,207.17 2,302.38 1,771.52 1,774.26
Claims not acknowledged as debts 10.49 6.26
Capital commitments 21.07 12.19

154
NOTES FORMING PART OF FINANCIAL STATEMENTS
68th ANNUAL REPORT 2012-13
32. Defined benefit plans / long term compensated absences - as per actuarial valuations as on March 31, 2013.
Gratuity, Superannuation and BKY Compensated Absences Post-retirement Medicare scheme
2013 2012 2011 2010 2009 2013 2012 2011 2010 2009 2013 2012 2011 2010 2009
i Components of employer expense
Current service cost 41.46 37.98 29.63 24.97 25.24 28.55 23.16 18.41 14.68 14.85 3.96 4.12 2.88 2.53 1.97
Interest cost 51.78 48.77 42.32 38.09 37.42 18.21 15.82 12.49 10.30 10.69 7.64 7.03 6.15 5.86 4.72
Expected return on plan assets (46.24) (43.69) (39.56) (35.46) (32.56) - - - - - - - - - -
Actuarial (Gains) / Losses (0.04) 9.50 53.84 46.23 (4.26) 2.58 17.81 34.05 22.92 (9.80) 0.71 (3.80) 4.21 (1.74) 10.00
Total expense recognised in the Statement
of Profit & Loss Account in Note 24, page 145
under item :
46.96 52.56 86.23 73.83 25.84 49.33 56.79 64.95 47.90 15.74 12.31 7.35 13.24 6.65 16.69
(b) & (c) (a) (c)
ii Actual contribution and benefit payments for
year ended March 31,
Actual benefit payments 72.52 48.92 55.21 54.15 57.20 31.79 25.62 25.93 18.24 22.49 2.94 2.82 3.10 3.17 3.43
Actual Contributions 54.12 46.91 78.11 75.80 22.18 31.79 25.62 25.93 18.24 22.49 2.94 2.82 3.10 3.17 3.43
iii Net liability recognised in Balance Sheet as
at March 31,
Present Value of Defined Benefit Obligation 682.38 652.56 606.73 534.60 485.95 245.72 230.14 198.97 159.95 130.29 96.42 88.66 84.13 73.99 70.51
Fair value of plan assets 624.60 587.21 547.03 483.02 432.39 N/A N/A N/A N/A N/A N/A N/A N/A N/A N/A
Net liability recognised in Balance Sheet (57.78) (65.35) (59.70) (51.58) (53.56) (245.72) (230.14) (198.97) (159.95) (130.29) (96.42) (88.66) (84.13) (73.99) (70.51)
Experience adjustment on plan liabilities (20.20) (1.05) (33.21) (3.35) (37.27) N/A N/A N/A N/A N/A 8.10 (3.87) 4.62 0.84 2.21
Experience adjustment on plan assets 18.52 (1.49) 1.55 (6.49) 10.41 N/A N/A N/A N/A N/A - - - - -
iv Change in Defined Benefit Obligations (DBO)
during the year ended March 31,
Present Value of DBO at the beginning of the year 652.56 606.73 534.60 485.95 474.36 230.14 198.97 159.95 130.29 137.04 88.66 84.13 73.99 70.51 57.25
Current service cost 41.46 37.98 29.63 24.97 25.24 28.55 23.16 18.41 14.68 14.85 3.96 4.12 2.88 2.53 1.97
Interest cost 51.78 48.77 42.32 38.09 37.42 18.21 15.82 12.49 10.30 10.69 7.64 7.03 6.15 5.86 4.72
Acquisitions/Transfer in/ Transfer out (9.38) - - - - (1.97) - - - - (1.61) - - - -
Actuarial losses 18.48 8.00 55.39 39.74 6.13 2.58 17.81 34.05 22.92 (9.80) 0.71 (3.80) 4.21 (1.74) 10.00
Benefits paid (72.52) (48.92) (55.21) (54.15) (57.20) (31.79) (25.62) (25.93) (18.24) (22.49) (2.94) (2.82) (3.10) (3.17) (3.43)
Present Value of DBO at the end of the year 682.38 652.56 606.73 534.60 485.95 245.72 230.14 198.97 159.95 130.29 96.42 88.66 84.13 73.99 70.51
v Change in fair value of assets during the year
ended March 31,
Plan assets at the beginning of the year 587.21 547.03 483.02 432.39 424.45 N/A N/A N/A N/A N/A N/A N/A N/A N/A N/A
Acquisitions/Transfer in/ Transfer out (8.97) - - - - - - - - - - - - - -
Actual return on plan assets 64.76 42.19 41.11 28.98 42.96 N/A N/A N/A N/A N/A N/A N/A N/A N/A N/A
Actual Company contributions 54.12 46.91 78.11 75.80 22.18 31.79 25.62 25.93 18.24 22.49 2.94 2.82 3.10 3.17 3.43
Benefits paid (72.52) (48.92) (55.21) (54.15) (57.20) (31.79) (25.62) (25.93) (18.24) (22.49) (2.94) (2.82) (3.10) (3.17) (3.43)
Plan assets at the end of the year 624.60 587.21 547.03 483.02 432.39 N/A N/A N/A N/A N/A N/A N/A N/A N/A N/A
vi Actuarial Assumptions
Discount Rate (%) 6.75-8.35 6.75-8.50 6.75-8.50 6.75-8.50 6.75-8.50 8.35 8.50 8.50 8.50 8.50 8.35 8.50 8.50 8.50 8.50
Expected Return on plan assets (%) 8.00 8.00 8.00 8.00 8.00 N/A N/A N/A N/A N/A N/A N/A N/A N/A N/A
Medical cost inflation (%) N/A N/A N/A N/A N/A N/A N/A N/A N/A N/A 5.00 4.00 4.00 4.00 4.00
vii The major categories of plan assets as
percentage of total plan assets
Debt securities 73% 77% 75% 74% 76% N/A N/A N/A N/A N/A N/A N/A N/A N/A N/A
Balance with approved Insurance companies 24% 19% - - - N/A N/A N/A N/A N/A N/A N/A N/A N/A N/A
Balances with banks 4% 4% 25% 26% 24% N/A N/A N/A N/A N/A N/A N/A N/A N/A N/A
viii Effect of one percentage point change in
assumed Medical inflation rate
One percentage point increase in Medical
inflation rate
One percentage point decrease in Medical
inflation rate
2013 2012 2011 2010 2009 2013 2012 2011 2010 2009
Revised DBO as at March 31, 103.81 95.34 91.65 81.48 77.68 87.07 81.62 77.57 67.49 64.29
Revised service cost for the year 3.95 4.01 3.37 2.95 2.30 2.79 3.04 2.48 2.17 1.69
Revised interest cost for the year 8.20 7.66 6.79 6.47 4.79 6.67 6.46 5.60 5.33 4.28
(a) Defined contribution plans -
The Company’s contribution to defined contribution plan aggregated ` 170.45 crores (2011-12 ` 165.25 crores) for the year ended March 31, 2013 has been recognised
in the statement of Profit and Loss Statement under note 24, page 145.
(b) The expected rate of return on plan assets is based on market expectation, at the beginning of the year, for returns over the entire life of the related obligation.
(c) The assumption of future salary increases, considered in actuarial valuation, takes into account of inflation, seniority, promotion and other relevant factors, such as supply
and demand in the employment market.
(d) The Company expects to contribute ` 55.36 crores to the funded pension plans in the year 2013-14.
(` in crores)

155
NOTES FORMING PART OF FINANCIAL STATEMENTS
Standalone Financials (116-159)
CORPORATE OVERVIEW FINANCIAL HIGHLIGHTS FINANCIAL STATEMENTSSTATUTORY REPORTS
(` in crores)
2012-2013 2011-201233. Purchase of products for sale :
(a) Spare parts and accessories for sale 1,735.82 1,558.96 (b) Bodies and trailers for mounting on chassis 1,045.84 1,637.87 (c) Vehicles 47,973 nos. (2011-12 : 53,583 nos.) 3,082.79 3,237.12
5,864.45 6,433.95
2012-2013 2011-201234. Expenditure incurred on research and development :
(a) Revenue expenditure - charged to profit and loss statement 500.15 243.30 (b) Revenue expenditure - capitalised 1,142.38 1,127.86 (c) Capital expenditure 116.78 177.53
1,759.31 1,548.69
2012-2013 2011-2012 35. (a) Auditors’ remuneration (excluding service tax) :
(i) Audit fees 4.25 4.00 (ii) Audit fees for financial statements as per IFRS
(including SOX certification) 3.25 3.50 (iii) In other capacities :
Company law matters (` 35,000 for 2012-13, ` 35,000 for 2011-12) - - Tax audit / Transfer pricing audit* 0.49 0.49 Taxation matters* 0.47 0.20
(iv) Other services 0.09 0.07 (v) Reimbursement of travelling and out-of-pocket expenses 0.27 0.34
(b) Cost Auditors’ remuneration (excluding service tax) :(i) Cost Audit fees 0.20 0.14 (ii) Reimbursement of travelling and out-of-pocket expenses 0.01 0.01
*Includes payment to an affiliate firm of satutory auditors 0.47 0.18
2012-2013 2011-201236. Details of provision :
(a) Product warrantyOpening Balance 452.76 398.25 Add: Provision for the year (net) 353.08 368.42 Less: Payments / debits (net of recoveries from suppliers) (372.22) (313.91)Closing balance 433.62 452.76
Current 309.38 387.26 Non-current 124.24 65.50
(b) Provision for deliquencyOpening balance 148.11 9.96 Add: Provision for the year (net) 297.03 157.92 Less: Payments / debits (net) 107.90 19.77 Closing balance 337.24 148.11
Current 242.81 - Non-current 94.43 148.11
(c) Premium on redemption of Foreign Currency Convertible Notes (FCCN) and Convertible
Alternative Reference Securities (CARS):Opening Balance 912.50 801.09 Foreign currency exchange (gain) /loss 82.97 100.99 Premium on redemption of FCCN / CARS (including withholding tax) (843.37) (0.97)Reversal of provision for premium due to conversion of FCCN/CARS (19.92) - Provision / (Reversal of provision) for withholding tax upon conversion / redemption / foreign
currency exchange of FCCN / CARS (97.97) 11.39
Closing balance 34.21 912.50 Current - 855.73 Non current 34.21 56.77

156
NOTES FORMING PART OF FINANCIAL STATEMENTS
68th ANNUAL REPORT 2012-13
37. Derivative transactions
The Company uses forward exchange contracts, principal only swaps, interest rate swaps, currency swaps and currency options to hedge its
exposure in foreign currency and interest rates. The information on derivative instruments is as follows :
(a) Derivative Instruments outstanding as at March 31, 2013
Currency Amount Buy / Sell Amount
(Foreign currency
in millions)
(` in crores)
(i) Forward exchange contracts (net)US $ / IN ` US $ 37.57 Buy 203.95
- Buy -US $ / IN ` US $ 25.00 Sell 135.69
- Sell -(ii) Options (net)
US $ / IN ` US $ 10.00 Buy 54.29 US $ 15.00 Buy 76.32
(b) Foreign exchange currency exposures not covered by derivative instruments as at March 31, 2013
Amount Amount (Foreign currency
in millions)
(` in crores)
(i) Amount receivable on account of sale of goods, investment in preference
shares, loan and interest charges
US $
US $
246.90
670.79
1,338.59
3,411.33€ 64.25 446.22 € 54.53 370.28 £ 8.63 70.99 £ 8.68 70.88
THB 2,765.75 511.66 THB 1 ,105.99 182 .38 ZAR 55.96 33.04 ZAR 34.45 22 .96
(ii) Amount payable on account of loan and interest charges and other foreign
currency expenditure
US $
US $
959.46
1,750.83
5,208.44
8,908.64€ 11.89 82.67 € 11.79 80.08 £ 15.67 * 128.64 £ 11.50 93.75 ¥ 230.10 13.33 ¥ 373.22 22 .98
Others 2.64 Others 1.56
* Note : Hedged partially by GBP USD forward of GBP 1.75 million

157
NOTES FORMING PART OF FINANCIAL STATEMENTS
Standalone Financials (116-159)
CORPORATE OVERVIEW FINANCIAL HIGHLIGHTS FINANCIAL STATEMENTSSTATUTORY REPORTS
(` in crores)
2012-2013 2011-2012
38. Information in regard to sale of products effected by the company
1. Light, medium and heavy commercial vehicles, jeep type vehicles,
passenger cars, utility vehicles etc. and bodies thereon [including export
and other incentives of ` 328.76 crores (2011-2012 ` 437.69 crores)] 43,810.63 54,154.01
2. Spare Parts for Vehicles 3,273.80 2,910.60
3. Others 1,580.85 1,585.81
48,665.28 58,650.42
2012-2013 2011-2012
39. Information in regard to raw materials and components consumed :
Engines 1,707.41 2,568.17
Tyres, tubes and flaps 2,187.98 3,022.60
Paints, oils and lubricants 273.93 334.10
Steel , steel tubes, steel melting scrap 871.25 1,452.72
Non-ferrous alloys / metals , ferro alloys 85.63 117.52
Other components 22,118.08 26,399.71
27,244.28 33,894.82
The consumption figures shown above are after adjusting excesses and shortages ascertained on physical count, unserviceable items, etc. The figures
of other components comprises finished / semi finished components / assemblies / sub assemblies and other components (balancing figure based
on the total consumption).

158
NOTES FORMING PART OF FINANCIAL STATEMENTS
68th ANNUAL REPORT 2012-13
(` in crores)
2012-2013 2011-2012
40. Information regarding exports and imports and other matters :
1. Earnings in foreign exchange :
(i) F.O.B. value of goods exported [including sales through export house, exports to Nepal,
Bhutan and local sales eligible for export incentives and exchange differences (net) -
gain of ` 33.20 crores (2011-12 loss of ` 26.91 crores)] 3,419.05 3,598.22
(ii) Rent income 7.30 6.75
(iii) Commission 1.33 0.70
(iv) Interest and dividend 1,430.58 46.23
(v) Sale of services 27.57 25.05
2. C.I.F. value of imports
(i) Raw material and components 1,057.03 1,364.69
(ii) Machinery spares and tools 60.66 57.31
(iii) Capital goods 275.34 362.48
(iv) Vehicles / spare parts / accessories for sale 456.98 525.51
(v) Other items 38.32 15.47
3. (a) Value of imported and indigenous raw materials and components consumed [note below] :
(i) Imported at Rupee cost 1,140.20 1,635.39
(ii) Indigenously obtained 26,104.08 32,259.43
(b) Percentage to total consumption :
(i) Imported % 4.19 4.82
(ii) Indigenously obtained % 95.81 95.18
In giving the above information, the Company has taken the view that components and spares as referred to in Clause 5(viii)(c) of Part II of Revised
Schedule VI covers only such items as consumed directly in production.
(` in crores)
2012-2013 2011-2012
41. Expenditure in foreign currency (subject to deduction of tax where applicable) :
(i) Technical know-how / services / consultancy fees 446.28 387.44
(ii) Interest 193.99 271.64
(iii) Consultancy / professional charges 26.69 35.66
(iv) Payments on other accounts [including exchange differences (net)] 163.79 228.14
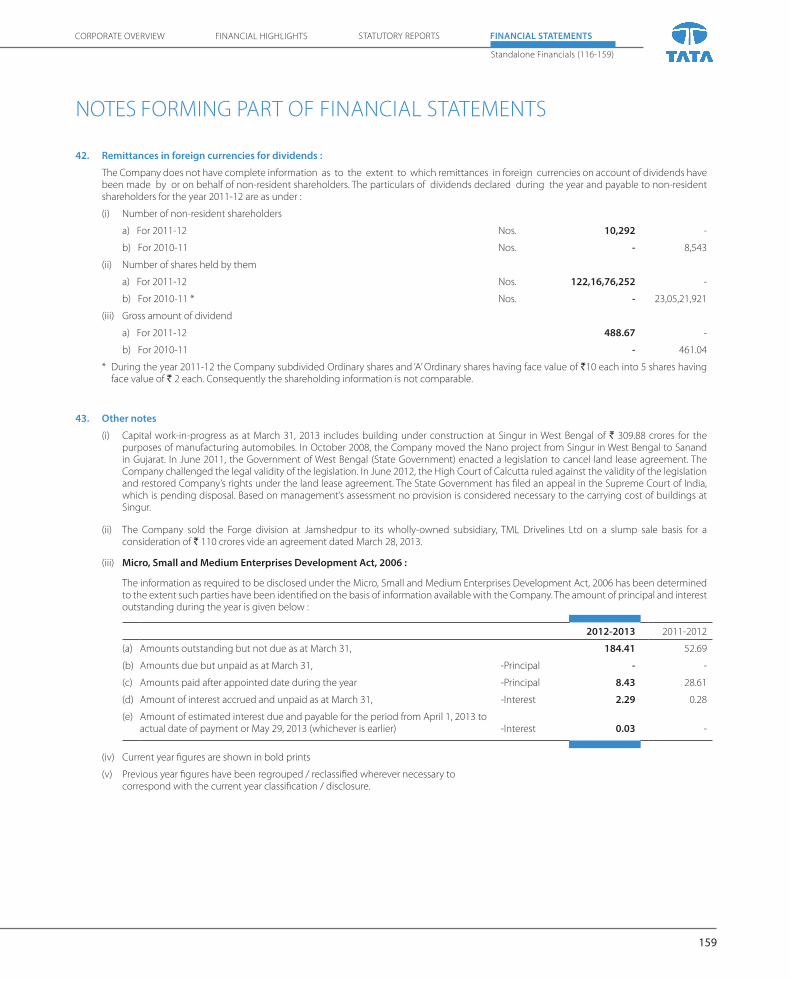
159
NOTES FORMING PART OF FINANCIAL STATEMENTS
Standalone Financials (116-159)
CORPORATE OVERVIEW FINANCIAL HIGHLIGHTS FINANCIAL STATEMENTSSTATUTORY REPORTS
42. Remittances in foreign currencies for dividends :
The Company does not have complete information as to the extent to which remittances in foreign currencies on account of dividends have
been made by or on behalf of non-resident shareholders. The particulars of dividends declared during the year and payable to non-resident
shareholders for the year 2011-12 are as under :
(i) Number of non-resident shareholders
a) For 2011-12 Nos. 10,292 -
b) For 2010-11 Nos. - 8,543
(ii) Number of shares held by them
a) For 2011-12 Nos. 122,16,76,252 -
b) For 2010-11 * Nos. - 23,05,21,921
(iii) Gross amount of dividend
a) For 2011-12 488.67 -
b) For 2010-11 - 461.04
* During the year 2011-12 the Company subdivided Ordinary shares and ‘A’ Ordinary shares having face value of `10 each into 5 shares having
face value of ` 2 each. Consequently the shareholding information is not comparable.
43. Other notes
(i) Capital work-in-progress as at March 31, 2013 includes building under construction at Singur in West Bengal of ` 309.88 crores for the
purposes of manufacturing automobiles. In October 2008, the Company moved the Nano project from Singur in West Bengal to Sanand
in Gujarat. In June 2011, the Government of West Bengal (State Government) enacted a legislation to cancel land lease agreement. The
Company challenged the legal validity of the legislation. In June 2012, the High Court of Calcutta ruled against the validity of the legislation
and restored Company’s rights under the land lease agreement. The State Government has filed an appeal in the Supreme Court of India,
which is pending disposal. Based on management’s assessment no provision is considered necessary to the carrying cost of buildings at
Singur.
(ii) The Company sold the Forge division at Jamshedpur to its wholly-owned subsidiary, TML Drivelines Ltd on a slump sale basis for a
consideration of ` 110 crores vide an agreement dated March 28, 2013.
(iii) Micro, Small and Medium Enterprises Development Act, 2006 :
The information as required to be disclosed under the Micro, Small and Medium Enterprises Development Act, 2006 has been determined
to the extent such parties have been identified on the basis of information available with the Company. The amount of principal and interest
outstanding during the year is given below :
2012-2013 2011-2012
(a) Amounts outstanding but not due as at March 31, 184.41 52.69
(b) Amounts due but unpaid as at March 31, -Principal - -
(c) Amounts paid after appointed date during the year -Principal 8.43 28.61
(d) Amount of interest accrued and unpaid as at March 31, -Interest 2.29 0.28
(e) Amount of estimated interest due and payable for the period from April 1, 2013 to
actual date of payment or May 29, 2013 (whichever is earlier) -Interest 0.03 -
(iv) Current year figures are shown in bold prints
(v) Previous year figures have been regrouped / reclassified wherever necessary to
correspond with the current year classification / disclosure.

68th ANNUAL REPORT 2012-13
160
INDEPENDENT AUDITORS’ REPORT TO THE BOARD OF DIRECTORS OFTATA MOTORS LIMITED
Report on the Consolidated Financial Statements
We have audited the accompanying consolidated financial statements of TATA MOTORS LIMITED ( the “Company”), its subsidiaries and jointly controlled entities (the Company, its subsidiaries and jointly controlled entities constitute “the Group”), which comprise the Consolidated Balance Sheet as at March 31, 2013, the Consolidated Profit and Loss Statement and the Consolidated Cash Flow Statement for the year then ended, and a summary of the significant accounting policies and other explanatory information.
Management’s Responsibility for the Consolidated Financial Statements
The Company’s Management is responsible for the preparation of these consolidated financial statements that give a true and fair view of the consolidated financial position, consolidated financial performance and consolidated cash flows of the Group in accordance with the accounting principles generally accepted in India. This responsibility includes the design, implementation and maintenance of internal control relevant to the preparation and presentation of the consolidated financial statements that give a true and fair view and are free from material misstatement, whether due to fraud or error.
Auditors’ Responsibility
Our responsibility is to express an opinion on these consolidated financial statements based on our audit. We conducted our audit in accordance with the Standards on Auditing issued by the Institute of Chartered Accountants of India. Those Standards require that we comply with ethical requirements and plan and perform the audit to obtain reasonable assurance about whether the consolidated financial statements are free from material misstatement.
An audit involves performing procedures to obtain audit evidence about the amounts and the disclosures in the consolidated financial statements. The procedures selected depend on the auditor’s judgement, including the assessment of the risks of material misstatement of the consolidated financial statements, whether due to fraud or error. In making those risk assessments, the auditor considers internal control relevant to the Company’s preparation and presentation of the consolidated financial statements that give a true and fair view in order to design audit procedures that are appropriate in the circumstances, but not for the purpose of expressing an opinion on the effectiveness of the Company’s internal control. An audit also includes evaluating the appropriateness of the accounting policies used and the reasonableness of the accounting estimates made by the Management, as well as evaluating the overall presentation of the consolidated financial statements.
We believe that the audit evidence we have obtained is sufficient and appropriate to provide a basis for our audit opinion.
As stated in the Other Matters paragraph below, our opinion, in so far as it relates to the amounts and disclosures included in respect of the subsidiaries and associates not audited by us, is based solely on the reports of such other auditors.
Opinion
In our opinion and to the best of our information and according to the explanations given to us, and based on the consideration of the reports of the other auditors on the financial statements of the subsidiaries and associates and based on the consideration of the unaudited financial statements/financial information of the subsidiaries, jointly controlled entities and associates; referred to below in the Other Matters paragraph, the aforesaid consolidated financial statements give a true and fair view in conformity with the accounting principles generally accepted in India:
(a) in the case of the Consolidated Balance Sheet, of the state of affairs of the Group as at March 31, 2013;
(b) in the case of the Consolidated Profit and Loss Statement, of the profit of the Group for the year ended on that date; and
(c) in the case of the Consolidated Cash Flow Statement, of the cash flows of the Group for the year ended on that date.
Emphasis of Matter
We draw attention to Note k (i) under significant accounting policies. As stated in the note, the changes in actuarial valuation (net) amounting to ` 2,354.13 crores (net of tax of ` 626.74 crores) for the year ended March 31, 2013 and ` 6,224.71 crores as at March 31, 2013, have been accounted in “Reserves and Surplus” in respect of a group of subsidiary companies.
Our opinion is not qualified in respect of this matter.
Other Matters
a) We did not audit the financial statements of 12 subsidiaries whose financial statements reflect total assets (net) of ` 31,479.25 crores as at March 31, 2013, total revenues of ` 1,41,287.85 crores and net cash out flows amounting to ` 1,456.78 crores for the year ended on that date, as considered in the consolidated financial statements. The consolidated financial statements also include the Group’s share of net profit of ` 143.63 crores for the year ended March 31, 2013, as considered in the consolidated financial statements, in respect of 3 associates, whose financial statements have not been audited by us. These financial statements have been audited by other auditors whose reports have been furnished to us by the Management and our opinion, in so far as it relates to the amounts and disclosures included in respect of these subsidiaries and associates is based solely on the reports of the other auditors.

Consolidated Financials (160-196)
CORPORATE OVERVIEW FINANCIAL HIGHLIGHTS FINANCIAL STATEMENTSSTATUTORY REPORTS
161
INDEPENDENT AUDITORS’ REPORT b) The consolidated financial statements include the unaudited financial statements/financial information of 6 subsidiaries and 1 jointly controlled
entity (Previous year ended March 31, 2012: 8 subsidiaries and 1 jointly controlled entity), whose financial statements/financial information reflect total assets (net) of ` 51.43 crores as at March 31, 2013 (As at March 31, 2012: ` 230.67 crores), total revenue of ` 2,357.32 crores (Previous year ended March 31, 2012 : ` 2,306.22 crores) and net cash outflows amounting to ` 261.40 crores (Previous year ended March 31, 2012: ` 46.74 crores) for the year ended on that date, as considered in the consolidated financial statements. The consolidated financial statements also include the Group’s share of net loss of ` 48.58 crores for the year ended March 31, 2013, as considered in the consolidated financial statements, in respect of 2 associates (Previous year ended March 31, 2012: ` 17.65 crores of 2 associates), based on their unaudited financial statements/financial information. Our opinion, in so far as it relates to the amounts included in respect of these subsidiaries, jointly controlled entities and associates, is based solely on such unaudited financial statements/financial information.
Our opinion is not qualified in respect of these matters.
For DELOITTE HASKINS & SELLS Chartered Accountants (Firm Registration No. 117366W)
N. VENKATRAM PartnerMUMBAI, May 29, 2013 (Membership No.71387)

162
68th ANNUAL REPORT 2012-13
consolidated balance sheetas at March 31, 2013
(` in crores)
Note PageAs at
March 31, 2013As at
March 31, 2012I EQUITY AND LIABILITIES
1. Shareholders’ Funds(a) Share capital 2 172 638.07 634.75 (b) Reserves and surplus 3 174 36,999.23 32,063.75
37,637.30 32,698.50 2. Minority Interest 370.48 307.13 3. Non-current Liabilities
(a) Long-term borrowings 4 176 32,110.07 27,962.48 (b) Deferred tax liabilities (net) 6 178 2,019.49 2,165.07 (c) Other long term liabilities 7 179 3,284.06 2,297.57 (d) Long-term provisions 9 180 8,319.15 6,232.39
45,732.77 38,657.51 4. Current Liabilities
(a) Short-term borrowings 5 176 11,612.21 10,741.59 (b) Trade payables 11 180 44,780.14 36,686.32 (c) Other current liabilities 8 179 22,140.96 19,069.78 (d) Short-term provisions 10 180 7,752.59 6,770.38
86,285.90 73,268.07 TOTAL 170,026.45 144,931.21
II ASSETS1. Non-Current Assets
(a) Fixed Assets(i) Tangible assets 12 181 32,385.76 27,118.58 (ii) Intangible assets 13 181 18,680.15 13,148.09 (iii) Capital work-in-progress 4,309.26 3,121.51 (iv) Intangible assets under development 14,108.44 12,824.32
69,483.61 56,212.50 (b) Goodwill (on consolidation) 14 182 4,102.37 4,093.74 (c) Non-current investments 15 182 1,515.40 1,391.54 (d) Deferred tax assets (net) 6 178 4,428.93 4,539.33 (e) Long-term loans and advances 17 183 15,465.46 13,657.95 (f ) Other non-current assets 19 184 1,023.95 574.68
96,019.72 80,469.74 2. Current Assets
(a) Current investments 16 183 7,542.32 7,526.17 (b) Inventories 21 184 20,969.01 18,216.02 (c) Trade receivables 22 184 10,942.66 8,236.84 (d) Cash and bank balances 23 184 21,112.67 18,238.13 (e) Short-term loans and advances 18 183 12,608.46 11,337.22 (f ) Other current assets 20 184 831.61 907.09
74,006.73 64,461.47 TOTAL 170,026.45 144,931.21
III NOTES FOrMINg PArT OF FINANCIAL STATEMENTS
in terms of our report attached For and on behalf of the board
For DELOITTE HASKINS & SELLS Chartered Accountants
N VENKATRAMPartner
Mumbai, May 29, 2013 Mumbai, May 29, 2013
N N WADIA
R A MASHELKAR
N MUNJEE
S BHARGAVA
V K JAIRATH
R SPETH
Directors
CYRUS P MISTRYChairman
RAVI KANTVice-Chairman
KARL SLYM Managing Director R PISHARODYExecutive DirectorS B BORWANKAR Executive DirectorC RAMAKRISHNANChief Financial OfficerH K SETHNA Company Secretary
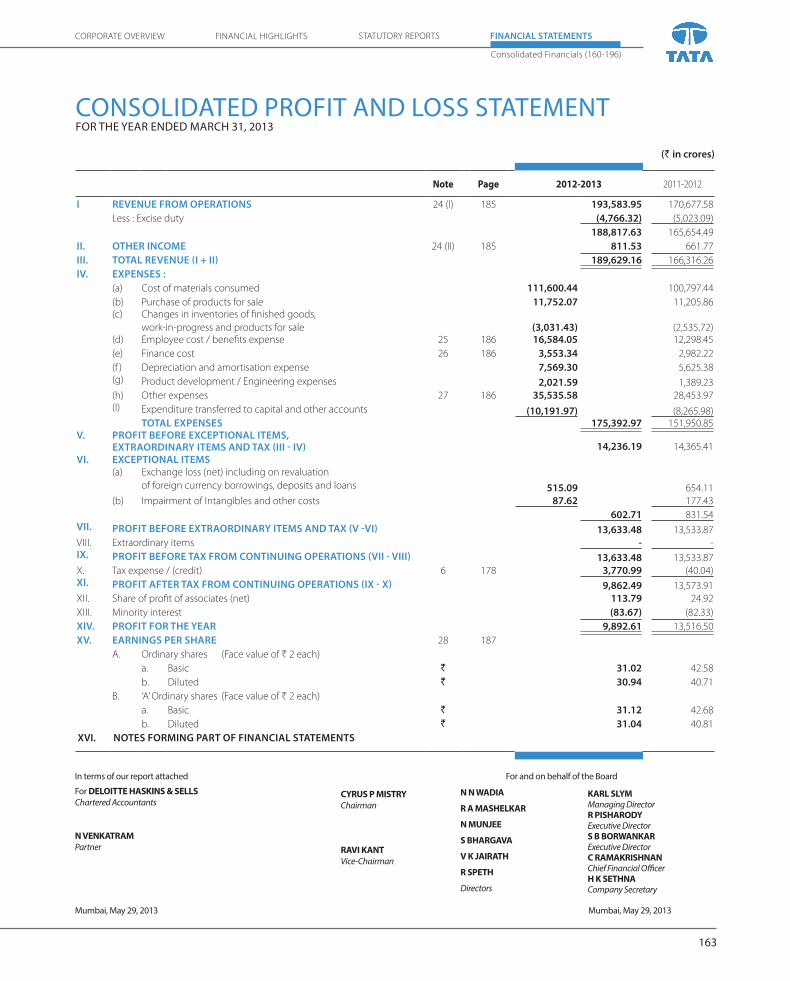
163
CORPORATE OVERVIEW FINANCIAL HIGHLIGHTS STATUTORY REPORTS
Consolidated Financials (160-196)
FINANCIAL STATEMENTS
consolidated proFit and loss stateMentFor the year ended March 31, 2013
(` in crores)
Note Page 2012-2013 2011-2012
I rEVENUE FrOM OPErATIONS 24 (I) 185 193,583.95 170,677.58 Less : Excise duty (4,766.32) (5,023.09)
188,817.63 165,654.49 II. OTHEr INCOME 24 (II) 185 811.53 661.77 III. TOTAL rEVENUE (I + II) 189,629.16 166,316.26 IV. EXPENSES :
(a) Cost of materials consumed 111,600.44 100,797.44 (b) Purchase of products for sale 11,752.07 11,205.86 (c) Changes in inventories of finished goods,
work-in-progress and products for sale
(3,031.43)
(2,535.72)(d) Employee cost / benefits expense 25 186 16,584.05 12,298.45 (e) Finance cost 26 186 3,553.34 2,982.22 (f ) Depreciation and amortisation expense 7,569.30 5,625.38 (g) Product development / Engineering expenses 2,021.59 1,389.23 (h) Other expenses 27 186 35,535.58 28,453.97 (I) Expenditure transferred to capital and other accounts (10,191.97) (8,265.98) TOTAL EXPENSES 175,392.97 151,950.85
V. PrOFIT BEFOrE EXCEPTIONAL ITEMS, EXTrAOrDINArY ITEMS AND TAX (III - IV) 14,236.19 14,365.41
VI. EXCEPTIONAL ITEMS(a) Exchange loss (net) including on revaluation
of foreign currency borrowings, deposits and loans 515.09 654.11 (b) Impairment of Intangibles and other costs 87.62 177.43
602.71 831.54 VII. PrOFIT BEFOrE EXTrAOrDINArY ITEMS AND TAX (V -VI) 13,633.48 13,533.87 VIII. Extraordinary items - -IX. PrOFIT BEFOrE TAX FrOM CONTINUINg OPErATIONS (VII - VIII) 13,633.48 13,533.87 X. Tax expense / (credit) 6 178 3,770.99 (40.04)XI. PrOFIT AFTEr TAX FrOM CONTINUINg OPErATIONS (IX - X) 9,862.49 13,573.91 XII. Share of profit of associates (net) 113.79 24.92 XIII. Minority interest (83.67) (82.33) XIV. PrOFIT FOr THE YEAr 9,892.61 13,516.50 XV. EArNINgS PEr SHArE 28 187
A. Ordinary shares (Face value of ` 2 each)a. Basic ` 31.02 42.58 b. Diluted ` 30.94 40.71
B. ‘A’ Ordinary shares (Face value of ` 2 each)a. Basic ` 31.12 42.68 b. Diluted ` 31.04 40.81
XVI. NOTES FOrMINg PArT OF FINANCIAL STATEMENTS
in terms of our report attached For and on behalf of the board
For DELOITTE HASKINS & SELLS Chartered Accountants
N VENKATRAMPartner
Mumbai, May 29, 2013 Mumbai, May 29, 2013
N N WADIA
R A MASHELKAR
N MUNJEE
S BHARGAVA
V K JAIRATH
R SPETH
Directors
CYRUS P MISTRYChairman
RAVI KANTVice-Chairman
KARL SLYM Managing Director R PISHARODYExecutive DirectorS B BORWANKAR Executive DirectorC RAMAKRISHNANChief Financial OfficerH K SETHNA Company Secretary

164
68th ANNUAL REPORT 2012-13
consolidated cash Flow stateMentFor the year ended March 31, 2013
(` in crores)
2012 -2013 2011 - 2012
A. Cash flows from operating activitiesProfit for the year 9,892.61 13,516.50 Adjustments for:Depreciation (including lease equalisation adjusted in income) 7,564.78 5,620.86 Loss on sale of assets (including assets scrapped / written off ) 23.47 76.72 Profit on sale of investments (net) (79.85) (48.45)Impairment of Intangibles and other costs 87.62 139.18 Provision for diminution in value of investments 0.41 - Provision for inter corporate deposits (net) 5.29 - Gain on settlement of deferred sales tax liability (138.29) (153.74)Share of profit in respect of investments in associate companies (net) (113.79) (24.92)Share of minority interest 83.67 82.33 Tax expense / (credit) 3,770.99 (40.04)Interest / dividend (net) 2,822.17 2,470.96 Non-cash dividend income on mutual funds - (14.56)Profit on issue of shares by a subsidiary - (47.36)Exchange difference 434.17 854.86
14,460.64 8,915.84 Operating profit before working capital changes 24,353.25 22,432.34 Adjustments for:Inventories (2,693.24) (2,718.98)Trade receivables (2,727.65) (1,006.86)Finance receivables (2,479.10) (5,652.07)Other current and non-current assets (999.03) (980.94)Trade payables 8,136.94 5,866.85 Other current and non-current liabilities (628.33) 2,321.06 Provisions 1,322.46 (109.14)
(67.95) (2,280.08)Cash generated from operations 24,285.30 20,152.26 Income taxes paid (net) (2,223.07) (1,767.94)Net cash from operating activities 22,062.23 18,384.32
B. Cash flows from investing activitiesPurchase of fixed assets (18,757.03) (13,875.55)Sale of fixed assets 36.69 92.70 Advance towards investments - (25.00)Investment in associate companies (0.01) (8.76)Investments in mutual fund sold / (made) (net) 160.70 (5,840.09)Investments in subsidiary company - (304.33)(Increase) / decrease in Investments in retained interests in securitisation transactions (107.69) 0.18 Investments - others (5.50) (17.33)Redemption of Investment in associates 21.00 - Sale / redemption of investments - others 12.86 83.75 Deposits of margin money / cash collateral (251.21) (5.85)Realisation of margin money / cash collateral 762.15 506.06 Fixed / restricted deposits with banks made (6,972.22) (2,560.76)Fixed / restricted deposits with banks realised 836.65 877.51 Interest received 712.17 467.25 Dividend received from associates 56.25 46.60 Dividend / income on investments received 37.78 23.73 (Increase) / decrease in short term Inter-corporate deposit 44.83 (2.96)Net cash used in investing activities (23,412.58) (20,542.85)

165
CORPORATE OVERVIEW FINANCIAL HIGHLIGHTS STATUTORY REPORTS
Consolidated Financials (160-196)
FINANCIAL STATEMENTS
consolidated cash Flow stateMentFor the year ended March 31, 2013
(` in crores)
2012 -2013 2011 - 2012
C. Cash flows from financing activitiesExpenses on Foreign Currency Convertible Notes (FCCN) conversion (0.23) - Brokerage and other expenses on Non-Convertible Debentures (NCD) (93.02) (76.69)Proceeds from issue of shares to minority shareholders (net of issue expenses) 0.56 138.54 Premium paid on redemption of FCCN / CARS (886.95) (0.97)Premium paid on redemption of NCD (96.55) - Proceeds from issue of shares held in abeyance 0.16 0.02 Proceeds from long-term borrowings (net of issue expenses) 13,091.77 19,030.04 Repayment of long-term borrowings (7,475.94) (4,664.13)Proceeds from short-term borrowings 14,693.77 7,911.22 Repayment of short-term borrowings (13,011.82) (10,345.65)Net change in other short-term borrowings (with maturity up to three months) 155.56 520.85 Repayment of fixed deposits (1,868.38) (1,069.25)Dividend paid (including dividend distribution tax) (1,485.40) (1,479.33)Dividend paid to minority shareholders (23.33) (23.78)Interest paid [including discounting charges paid ` 568.49 crores (2011-2012 ` 624.31 crores)] (4,655.99) (3,373.69)Net cash (used in) / from financing activities (1,655.79) 6,567.18 Net (decrease) / increase in cash and cash equivalents (3,006.14) 4,408.65 Cash and cash equivalents as at March 31 (Opening balance) 14,833.02 9,345.41 Effect of foreign exchange on cash and cash equivalents 521.94 1,078.96 Cash and cash equivalents as at March 31 (Closing balance) 12,348.82 14,833.02
Previous year figures have been restated, wherever necessary, to conform to this period's classification.
Non-cash transactions :FCCN / CARS converted to Ordinary shares 232.83 -
in terms of our report attached For and on behalf of the board
For DELOITTE HASKINS & SELLS Chartered Accountants
N VENKATRAMPartner
Mumbai, May 29, 2013 Mumbai, May 29, 2013
N N WADIA
R A MASHELKAR
N MUNJEE
S BHARGAVA
V K JAIRATH
R SPETH
Directors
CYRUS P MISTRYChairman
RAVI KANTVice-Chairman
KARL SLYM Managing Director R PISHARODYExecutive DirectorS B BORWANKAR Executive DirectorC RAMAKRISHNANChief Financial OfficerH K SETHNA Company Secretary

166
Notes FoRMING PARt oF CoNsolIdAted FINANCIAl stAteMeNts
68th ANNUAL REPORT 2012-13
1. Basis of Consolidation and Significant Accounting Policies (I) Basis of consolidation: the consolidated financial statements relate to tata Motors limited (the Company), its subsidiary companies, joint ventures and associates.
the Company and its subsidiaries constitute the Group. (a) Basis of preparation the financial statements are prepared under the historical cost convention on an accrual basis of accounting in accordance with the
generally accepted accounting principles, Accounting standards notified under section 211 (3C) of the Companies Act, 1956 and the relevant provisions thereof.
(b) Use of estimates the preparation of financial statements requires management to make judgments, estimates and assumptions, that affect the
application of accounting policies and the reported amounts of assets and liabilities and disclosures of contingent liabilities at the date of these financial statements and the reported amounts of revenues and expenses for the years presented. Actual results may differ from these estimates. estimates and underlying assumptions are reviewed on an ongoing basis. Revisions to accounting estimates are recognised in the period in which the estimate is revised and future periods affected.
(c) Principles of consolidation: the consolidated financial statements have been prepared on the following basis: i. the financial statements of the subsidiary companies / joint ventures / associates used in the consolidation are drawn upto the
same reporting date as of the Company i.e. year ended March 31, 2013. ii. the financial statements of the Company and its subsidiary companies have been combined on a line-by-line basis by adding
together like items of assets, liabilities, income and expenses. the intra-group balances and intra-group transactions and unrealised profits have been fully eliminated.
iii. the consolidated financial statements include the share of profit / loss of the associate companies which has been accounted as per the ‘equity method’, and accordingly, the share of profit / loss of each of the associate companies (the loss being restricted to the cost of investment) has been added to / deducted from the cost of investments.
An associate is an enterprise in which the investor has significant influence and which is neither a subsidiary nor a joint venture of the investor.
iv. the financial statements of the joint venture companies have been combined by using proportionate consolidation method and accordingly, venturer’s share of each of the assets, liabilities, income and expenses of jointly controlled entity is reported as separate line items in the Consolidated Financial statements.
v. the excess of cost to the Company of its investments in the subsidiary companies / joint ventures over its share of equity of the subsidiary companies / joint ventures, at the dates on which the investments in the subsidiary companies / joint ventures are made, is recognised as ‘Goodwill’ being an asset in the consolidated financial statements. Alternatively, where the share of equity in the subsidiary companies / joint ventures as on the date of investment is in excess of cost of investment of the Company, it is recognised as ‘Capital Reserve’ and shown under the head ‘Reserves and surplus’, in the consolidated financial statements.
vi. Minority interest in the net assets of consolidated subsidiaries consists of the amount of equity attributable to the minority shareholders at the dates on which investments are made by the Company in the subsidiary companies and further movements in their share in the equity, subsequent to the dates of investments as stated above.
(d) The following subsidiary companies are considered in the consolidated financial statements:
% of holding either directly orthrough subsidiaries
SrNo.
Name of the Subsidiary CompanyCountry of incorporation
As at March 31, 2013
As at March 31, 2012
Direct Subsidiaries1 tata daewoo Commercial Vehicle Co. ltd south Korea 100 100 2 tMl drivelines ltd India 100 100 3 tAl Manufacturing solutions ltd India 100 100 4 sheba Properties ltd India 100 100 5 Concorde Motors (India) ltd India 100 100 6 tata Motors Insurance Broking & Advisory services ltd India 100 100 7 tata Motors european technical Centre Plc UK 100 100 8 tata technologies ltd India 72.32 72.41 9 tata Motors Finance ltd India 100 100 10 tata Marcopolo Motors ltd India 51 51 11 tata Motors (thailand) ltd thailand 90.82 90.82 12 tMl Holdings Pte ltd, singapore singapore 100 100 13 tMl distribution Company ltd India 100 100 14 tata Motors (sA) (Proprietary) ltd south Africa 60 60 15 tata Hispano Motors Carrocera s.A spain 100 100 16 trilix s.r.l Italy 80 80 17 tata Precision Industries Pte ltd singapore 78.39 78.39 18 Pt tata Motors Indonesia Indonesia 100 100

167
Notes FoRMING PARt oF CoNsolIdAted FINANCIAl stAteMeNts
CoRPoRAte oVeRVIeW FINANCIAl HIGHlIGHts FINANCIAL STATEMENTSstAtUtoRY RePoRts
Consolidated Financials (160-196)
(e) The following Joint Venture companies are considered in the consolidated financial statements:
SrNo.
Name of the joint venture companyCountry of incorporation
% of holding either directly orthrough subsidiaries
As at March 31, 2013
As at March 31, 2012
1 Fiat India Automobiles limited India 50.00 50.00 2 tata HAl technologies ltd ** India 36.16 36.20 3 Chery Jaguar land Rover Automotive Co ltd (incorporated in November 2012) China 50 - 4 suzhou Chery Jaguar land Rover trading Co ltd China 50 - ** effective holding % of the Company as it is a Joint Venture of tata technologies ltd
SrNo.
Name of the subsidiary companyCountry of incorporation
% of holding either directly orthrough subsidiaries
As at March 31, 2013
As at March 31, 2012
Indirect subsidiaries *19 tata technologies (thailand) ltd thailand 72.32 72.41 20 tata technologies Pte. ltd, singapore singapore 72.32 72.41 21 INCAt International Plc UK 72.32 72.41 22 tata technologies europe ltd UK 72.32 72.41 23 INCAt GmbH. Germany 72.32 72.41 24 tata technologies Inc UsA 72.52 72.62 25 tata technologies de Mexico, s.A. de C.V. Mexico 72.52 72.62 26 tata technologies (Canada) Inc. Canada 72.52 72.62 27 Miljobil Greenland As (upto August 30, 2012) Norway - 71.69 28 Jaguar land Rover Automotive Plc (formerly known as JaguarlandRover Plc) UK 100 100 29 Jaguar land Rover ltd (formerly known as Jaguar Cars overseas Holdings ltd) UK 100 100 30 Jaguar land Rover Austria GmbH Austria 100 100 31 Jaguar Belux NV Belgium 100 100 32 Jaguar land Rover Japan ltd Japan 100 100 33 Jaguar Cars south Africa (pty) ltd south Africa 100 100 34 Jaguar land Rover exports ltd UK 100 100 35 the daimler Motor Company ltd UK 100 100 36 the Jaguar Collection ltd UK 100 100 37 daimler transport Vehicles ltd UK 100 100 38 s.s. Cars ltd UK 100 100 39 the lanchester Motor Company ltd UK 100 100 40 Jaguar Hispania sl spain 100 100 41 Jaguar land Rover deutschland GmbH Germany 100 100 42 land Rover UK 100 100 43 land Rover Group ltd Jersey 100 100 44 Jaguar land Rover North America llC UsA 100 100 45 land Rover Belux sA/NV Belgium 100 100 46 land Rover Ireland ltd Ireland 100 100 47 Jaguar land Rover Nederland BV (formerly known as land Rover Nederland BV) Netherlands 100 100 48 Jaguar land Rover Portugal - Veiculos e Pecas, ldA Portugal 100 100 49 Jaguar land Rover Australia Pty ltd Australia 100 100 50 land Rover exports ltd (upto April 1, 2012) UK - 100 51 Jaguar land Rover Italia spA Italy 100 100 52 land Rover espana sl spain 100 100 53 Jaguar land Rover Korea Co. ltd south Korea 100 100 54 Jaguar land Rover Automotive trading (shanghai) Co. ltd China 100 100 55 Jaguar land Rover Canada UlC Canada 100 100 56 Jaguar land Rover France, sAs France 100 100 57 Jaguar land Rover south Africa (pty) ltd south Africa 100 100 58 Jaguar land Rover Brazil llC Brazil 100 100 59 limited liability Company "Jaguar land Rover" (Russia) Russia 100 100 60 land Rover Parts ltd UK 100 100 61 Jaguar land Rover (south Africa) Holdings ltd. UK 100 100 62 Jaguar land Rover India ltd (incorporated w.e.f. october 25, 2012) India 100 - 63 tata Hispano Motors Carroceries Maghreb Morocco 100 100 64 tata daewoo Commercial Vehicle sales and distribution Co. ltd. south Korea 100 100 65 tata engineering services (Pte) limited (upto July 5, 2012) singapore - 78.39 66 Pt tata Motors distribusi Indonesia (incorporated w.e.f. February 11, 2013) Indonesia 99.59 - * effective holding % of the Company directly and through its subsidiaries.

168
Notes FoRMING PARt oF CoNsolIdAted FINANCIAl stAteMeNts
68th ANNUAL REPORT 2012-13
(II) Significant accounting policies : (a) Revenue recognition (i) Sale of products the Company recognises revenue on the sale of products,net of discounts when the products are delivered to the dealer / customer or when delivered
to the carrier for exports sales, which is when risks and rewards of ownership pass to the dealer / customer. sales include income from services and exchange fluctuations relating to export receivables. sales include export and other recurring and non-recurring incentives from the Government at the national and state levels. sale of products is presented gross of excise duty where applicable, and net of other indirect taxes. Revenues are recognised when collectibility of the resulting receivables is reasonably assured.
(ii) Revenue from sale of vehicles with guaranteed repurchase option /repurchase arrangement some of the subsidiary companies sell vehicles to daily rental car companies and other fleet customers subject to guaranteed repurchase options and to
Ford Motor Group management employees, with repurchase arrangements. At the time of sale, the proceeds are recorded as deferred revenue in other current liabilities and the cost of the vehicles are recorded as inventories. the difference between the proceeds and the guaranteed repurchase amount is recognised in sales over the term of the arrangement, using a straight-line method. the difference between the cost of the vehicle and the estimated auction value is netted off against revenue over the term of the lease.
(iii) Revenue from software consultancy on time and materials contracts is recognised based on certification of time sheet and billed to clients as per the terms of specific contracts. on fixed price contracts, revenue is recognised based on milestone achieved as specified in the contracts on the proportionate completion method on the basis of the work completed. Foreseeable losses on such contracts are recognized when probable. Revenue from rendering annual maintenance services is recognised proportionately over the period in which services are rendered. Revenue from third party software products and hardware sale is recognised upon delivery.
(iv) dividend from investments is recognized when the right to receive the payment is established and when no significant uncertainty as to measurability or collectability exits.
(v) Interest income is recognized on the time basis determined by the amount outstanding and the rate applicable and where no significant uncertainty as to measurability or collectability exists.
(b) Depreciation and Amortisation (i) depreciation is provided on straight line Method basis (slM) over the estimated useful lives of the assets. estimated useful lives of assets are as follows: Type of Asset Estimated useful life leasehold land amortised over the period of the lease Buildings 20 to 40 years Plant, machinery and equipment 9 to 30 years Computers and other It assets 3 to 6 years Vehicles 3 to 10 years Furniture, fixtures and office appliances 3 to 20 years technical know-how 2 to 10 years developed technologies 10 years Computer software 1 to 8 years special tools are amortised on a straight line basis over the lives of the model concerned, which is 7 to 10 years.
Capital assets, the ownership of which does not vest with the Company, other than leased assets, are depreciated over the estimated period of their utility or five years, whichever is less.
(ii) Product development costs are amortised over a period of 36 months to 120 months or on the basis of actual production to planned production volume over such period.
(iii) In respect of assets whose useful life has been revised, the unamortised depreciable amount has been charged over the revised remaining useful life. (iv) depreciation is not recorded on capital work-in-progress / intangible assets under development until construction and installation are complete and
asset is ready for its intended use.
(c) Fixed Assets (i) Fixed assets are stated at cost of acquisition or construction less accumulated depreciation / amortisation. (ii) the product development cost incurred on new vehicle platform, engines, transmission and new products are recognised as fixed assets, when feasibility
has been established, the Company has committed technical, financial and other resources to complete the development and it is probable that asset will generate probable future benefits.
(iii) Cost includes purchase price, taxes and duties, labour cost and directly attributable costs for self constructed assets and other direct costs incurred upto the date the asset is ready for its intended use. Borrowing cost incurred for qualifying assets is capitalised up to the date the asset is ready for intended use, based on borrowings incurred specifically for financing the asset or the weighted average rate of all other borrowings, if no specific borrowings have been incurred for the asset. the cost of acquisition is further adjusted for exchange differences relating to long term foreign currency borrowings attributable to the acquisition of depreciable asset w.e.f. April 1, 2007.
(iv) software not exceeding Rs. 25,000 and product development costs relating to minor product enhancements, facelifts and upgrades are charged off to the Profit and loss statement as and when incurred.
(d) Impairment At each Balance sheet date, the Company assesses whether there is any indication that the fixed assets have suffered an impairment loss. If any such indication
exists, the recoverable amount of the asset is estimated in order to determine the extent of the impairment, if any. Where it is not possible to estimate the recoverable amount of individual asset, the Company estimates the recoverable amount of the cash-generating unit to which the asset belongs. As per the assessment conducted by the Company at March 31, 2013, there were no indications that the fixed assets have suffered an impairment loss.
(e) Leases (i) Finance lease Assets acquired under finance leases are recognised at the lower of the fair value of the leased assets at inception and the present value of minimum
lease payments. lease payments are apportioned between the finance charge and the outstanding liability. the finance charge is allocated to periods during the lease term at a constant periodic rate of interest on the remaining balance of the liability. Assets given under finance leases are recognised as receivables at an amount equal to the net investment in the lease and the finance income is based on a constant rate of return on the outstanding net investment.
(ii) Operating lease leases other than finance lease ,are operating leases and the leased assets are not recognised on the Company’s balance sheet. Payments under operating
leases are recognised in the Profit and loss statement on a straight line basis over the lease term.

169
Notes FoRMING PARt oF CoNsolIdAted FINANCIAl stAteMeNts
CoRPoRAte oVeRVIeW FINANCIAl HIGHlIGHts FINANCIAL STATEMENTSstAtUtoRY RePoRts
Consolidated Financials (160-196)
(f) Transactions in foreign currencies and accounting of derivatives
(i) Exchange differences
transactions in foreign currencies are recorded at the exchange rates prevailing on the date of the transaction. Foreign currency monetary assets and liabilities are translated at year end exchange rates.
(1) exchange differences arising on settlement of transactions and translation of monetary items other than those covered by (2) below are recognised as income or expense in the year in which they arise. exchange differences considered as borrowing cost are capitalised to the extent these relate to the acquisition / construction of qualifying assets and the balance amount is recognised in the Profit & loss statement.
(2) exchange differences relating to long term foreign currency monetary assets / liabilities are accounted for with effect from April 1, 2007 in the following manner:
- differences relating to borrowings attributable to the acquisition of the depreciable capital asset are added to / deducted from the cost of such capital assets.
- other differences are accumulated in Foreign Currency Monetary Item translation difference Account, to be amortised over the period, beginning April 1, 2007 or date of inception of such item, as applicable, and ending on March 31, 2011 or the date of its maturity, whichever is earlier.
- Pursuant to notification issued by the Ministry of Corporate Affairs, on december 29, 2011, the exchange differences on long term foreign currency monetary items (other than those relating to acquisition of depreciable asset) are amortised over the period till the date of maturity or March 31, 2020, whichever is earlier.
(3) on consolidation, the assets, liabilities and goodwill or capital reserve arising on the acquisition, of the Group’s overseas operations are translated at exchange rates prevailing on the balance sheet date. Income and expenditure items are translated at the average exchange rates for the year/month. exchange differences arising in case of Integral Foreign operations are recognised in the Profit and loss statement and exchange differences arising in case of Non integral Foreign operations are recognised in the Group’s translation Reserve classified under Reserves and surplus.
(ii) Hedge accounting
the Company uses foreign currency forward contracts to hedge its risks associated with foreign currency fluctuations relating to highly probable forecast transactions. With effect from April 1, 2008, the Company designates such forward contracts in a cash flow hedging relationship by applying the hedge accounting principles set out in Accounting standard 30- Financial Instruments: Recognition and Measurement.
these forward contracts are stated at fair value at each reporting date. Changes in the fair value of these forward contracts that are designated and effective as hedges of future cash flows are recognised directly in Hedging Reserve Account under Reserves and surplus, net of applicable deferred income taxes and the ineffective portion is recognised immediately in the Profit and loss statement.
Amounts accumulated in Hedging Reserve Account are reclassified to profit and loss in the same periods during which the forecasted transaction affects Profit and loss statement.
Hedge accounting is discontinued when the hedging instrument expires or is sold, terminated, or exercised, or no longer qualifies for hedge accounting. For forecasted transactions, any cumulative gain or loss on the hedging instrument recognised in Hedging Reserve Account is retained there until the forecasted transaction occurs.
If the forecasted transaction is no longer expected to occur, the net cumulative gain or loss recognised in Hedging Reserve Account is immediately transferred to the Profit and loss statement for the year.
(iii) Premium or discount on forward contracts other than those covered in (ii) above is amortised over the life of such contracts and is recognised as income and expense. Foreign currency options and other derivatives are stated at fair value as at the year end with change in fair value recognised in the Profit and loss statement.
(g) Product warranty expenses
the estimated liability for product warranties is recorded when products are sold. these estimates are established using historical information on the nature, frequency and average cost of warranty claims and management estimates regarding possible future incidence based on corrective actions on product failures. the timing of outflows will vary as and when warranty claim will arise - being typically upto five years.
(h) Income on vehicle loan
Interest income from loan contracts in respect of vehicles and income from plant given on lease, are accounted for by using the Internal Rate of Return method. Consequently, a constant rate of return on the net outstanding amount is accrued over the period of contract. the Company and its subsidiary provides an allowance for finance receivables that are in arrears for more than 11 months, to the extent of an amount equivalent to the outstanding principal and amounts due but unpaid considering probable inherent loss including estimated realisation based on past performance trends. In respect of loan contracts that are in arrears for more than 6 months but not more than 11 months, allowance is provided to the extent of 10% of the outstanding and amount due but unpaid.
(i) Sale of finance receivables
the Company and its subsidiary sells finance receivables to special Purpose entities (“sPe”) in securitisation transactions. Recourse is in the form of the Company and its subsidiary’s investment in subordinated securities issued by these special purpose entities, cash collateral and bank guarantees. the loans are derecognised in the balance sheet when they are sold and consideration has been received by the Company and its subsidiary. sales and transfers that do not meet the criteria for surrender of control are accounted for as secured borrowings.

170
Notes FoRMING PARt oF CoNsolIdAted FINANCIAl stAteMeNts
68th ANNUAL REPORT 2012-13
Gains or losses from the sale of loans are recognised in the period the sale occurs based on the relative fair value of the portion sold and the portion allocated to retained interests, except for subsidiaries which are governed by prudential norms for income recognition issued by the Reserve Bank of India for Non Banking Financial Companies (NBFC), where gains or losses on sale are accounted for as per these norms.
In case of a subsidiary, the estimated liability for servicing expenses in respect of assigned receivables is made based on the ratio between the cost incurred for servicing current receivables and the collection made during the year.
(j) Inventories
Inventories are valued at the lower of cost and net realisable value. Cost of raw materials and consumables are ascertained on a moving weighted average / monthly moving weighted average basis, except for Jaguar and land Rover which is on FIFo basis. Cost, including variable and fixed overheads, are allocated to work-in-progress and finished goods determined on full absorption cost basis. Net realisable value is estimated selling price in the ordinary course of business less estimated cost of completion and selling expenses.
(k) Employee benefits
(i) Pension plans
one of the major subsidiary group, Jaguar land Rover, operates several defined benefit pension plans, which are contracted out of the second state pension scheme. the assets of the plan are held in separate trustee administered funds. the plans provide for monthly pension after retirement as per salary drawn and service period as set out in rules of each fund.
Contributions to the plans by the subsidiary group take into consideration the results of actuarial valuations. the plans with a surplus position at the year end have been limited to the maximum economic benefit available from unconditional rights to refund from the scheme or reduction in future contributions. Where the subsidiary group is considered to have a contractual obligation to fund the pension plan above the accounting value of the liabilities, an onerous obligation is recognised.
during the year ended and as at March 31, 2013, ` 2,354.13 crores (debit) (net of tax) and ` 6224.71 crores (debit) (net of tax) respectively have been accounted, in “Reserves and surplus” representing changes in actuarial valuation of pension plans of a subsidiary company in the UK, in accordance with IFRs principles and permitted by As 21 in the consolidated financial statements. this treatment is consistent with the accounting principles followed by subsidiary company in UK, under IFRs.
A separate defined contribution plan is available to employees of a major subsidiary group, Jaguar land Rover. Costs in respect of this plan are charged to the Profit and loss statement as incurred.
(ii) Gratuity
the Company and some of its subsidiaries in India have an obligation towards gratuity, a defined benefit retirement plan covering eligible employees. the plan provides for a lump sum payment to vested employees at retirement, death while in employment or on termination of employment of an amount equivalent to 15 to 30 days salary payable for each completed year of service. Vesting occurs upon completion of five years of service. the Company and the said subsidiaries make annual contributions to gratuity funds established as trusts. some subsidiaries have obtained insurance policies with the life Insurance Corporation of India. the Company and some of its subsidiaries account for the liability for gratuity benefits payable in future based on an independent actuarial valuation as at Balance sheet date.
(iii) Superannuation
the Company and some of its subsidiaries have two superannuation plans, a defined benefit plan and a defined contribution plan. An eligible employee on April 1, 1996 could elect to be a member of either plan.
employees who are members of the defined benefit superannuation plan are entitled to benefits depending on the years of service and salary drawn. the monthly pension benefits after retirement range from 0.75% to 2% of the annual basic salary for each year of service. the Company and the said subsidiaries account for superannuation benefits payable in future under the plan based on an independent actuarial valuation as at Balance sheet date.
With effect from April 1, 2003, this plan was amended and benefits earned by covered employees have been protected as at March 31, 2003. employees covered by this plan are prospectively entitled to benefits computed on a basis that ensures that the annual cost of providing the pension benefits would not exceed 15% of salary.
the Company and some of its subsidiaries maintain separate irrevocable trusts for employees covered and entitled to benefits. the Company and its subsidiaries contributes up to 15% of the eligible employees’ salary to the trust every year. such contributions are recognised as an expense when incurred. the Company and the said subsidiaries have no further obligation beyond this contribution.
(iv) Bhavishya Kalyan Yojana (BKY)
Bhavishya Kalyan Yojana is an unfunded defined benefit plan. the benefits of the plan include pension in certain case, payable upto the date of normal superannuation had the employee been in service, to an eligible employee at the time of death or permanent disablement, while in service, either as a result of an injury or as certified by the Company’s Medical Board. the monthly payment to dependents of the deceased / disabled employee under the plan equals 50% of the salary drawn at the time of death or accident or a specified amount, whichever is higher. the Company accounts for the liability for BKY benefits payable in future based on an independent actuarial valuation as at Balance sheet date.

171
Notes FoRMING PARt oF CoNsolIdAted FINANCIAl stAteMeNts
CoRPoRAte oVeRVIeW FINANCIAl HIGHlIGHts FINANCIAL STATEMENTSstAtUtoRY RePoRts
Consolidated Financials (160-196)
(v) Severance indemnity
tata daewoo Commercial Vehicle Co. ltd., and tata daewoo Commercial Vehicle sales and distribution Co. ltd., subsidiary companies incorporated in Korea has an obligation towards severance indemnity, a defined benefit retirement plan, covering eligible employees. the plan provides for a lump sum payment to all employees with more than one year of employment equivalent to 30 days’ salary payable for each completed year of service.
(vi) Post-retirement medicare scheme
Under this scheme, employees of the Company and some of its subsidiaries get medical benefits subject to certain limits of amount, periods after retirement and types of benefits, depending on their grade and location at the time of retirement. employees separated from the Company as part of early separation scheme, on medical grounds or due to permanent disablement are also covered under the scheme. the Company and the said subsidiaries account for the liability for post-retirement medical scheme based on an independent actuarial valuation as at Balance sheet date.
(vii) Provident fund and family pension
the eligible employees of the Company and some of its subsidiaries are entitled to receive benefits in respect of provident fund, a defined contribution plan, in which both employees and the company/subsidiaries make monthly/annual contributions at a specified percentage of the covered employees’ salary (currently 12% of employees’ salary). the contributions, as specified under the law, are made to the provident fund and pension fund set up as irrevocable trust by the Company and its subsidiaries or to respective Regional Provident Fund Commissioner and the Central Provident Fund under the state Pension scheme. the Company and some of its subsidiaries are generally liable for monthly/annual contributions and any shortfall in the fund assets based on the government specified minimum rates of return or pension and recognises such contributions and shortfall, if any, as an expense in the year incurred.
(viii) Compensated absences
the Company and some of its subsidiaries provides for the encashment of leave or leave with pay subject to certain rules. the employees are entitled to accumulate leave subject to certain limits, for future encashment. the liability is provided based on the number of days of unutilized leave at each balance sheet date on basis of an independent actuarial valuation as at Balance sheet date.
(l) Investments
i. long term investments are stated at cost less other than temporary diminution in value, if any.
ii. Investment in associate companies are accounted as per the ‘equity method’, and accordingly, the share of post acquisition reserves of each of the associate companies has been added to / deducted from the cost of investments.
iii. Current investments are stated at lower of cost and fair value. Fair value of investments in mutual funds are determined on portfolio basis.
(m) Income taxes
tax expenses comprises current and deferred taxes. Current taxes are determined based on respective taxable income of each taxable entity and tax rules applicable for respective tax jurisdictions. Current tax is net of credit for entitlement for Minimum Alternative tax.
deferred tax is recognised, on timing differences, being the difference between taxable income and accounting income that originate in one period and are capable of reversal in one or more subsequent periods.deferred tax assets in respect of unabsorbed depreciation and carry forward of losses are recognised if there is virtual certainty that there will be sufficient future taxable income available to realise such losses.such deferred tax assets and liabilities are computed separately for each taxable entity and for each taxable jurisdiction.
deferred tax assets and liabilities are measured based on the tax rates that are expected to apply in the period when asset is realised or the liability is settled, based on tax rates and tax laws that have been enacted or substantially enacted by the balance sheet date.
the tax expense is not comparable with the profit before tax, since it is consolidated on a line-by-line addition for each subsidiary company and no tax effect is recorded in respect of consolidation adjustments. this accounting treatment is as per accounting standard As-21.
(n) Redemption premium on Foreign Currency Convertible Notes (FCCN) / Non Convertible Debentures (NCD)
Premium payable on redemption of FCCN / NCd as per the terms of issue, is provided fully in the year of issue by adjusting against the securities Premium Account (sPA) (net of tax). Any change in the premium payable, consequent to conversion or exchange fluctuations is adjusted to the sPA.
(o) Borrowing costs
Fees towards structuring / arrangements and underwriting and other incidental costs incurred in connection with borrowings are amortised over the period of the loan.
(p) Liabilities and contingent liabilities
the Company records a liability for any claims where a potential loss is probable and capable of being estimated and discloses such matters in its financial statements, if material. For potential losses that are considered possible, but not probable, the Company provides disclosure in the financial statements but does not record a liability in its accounts unless the loss becomes probable.
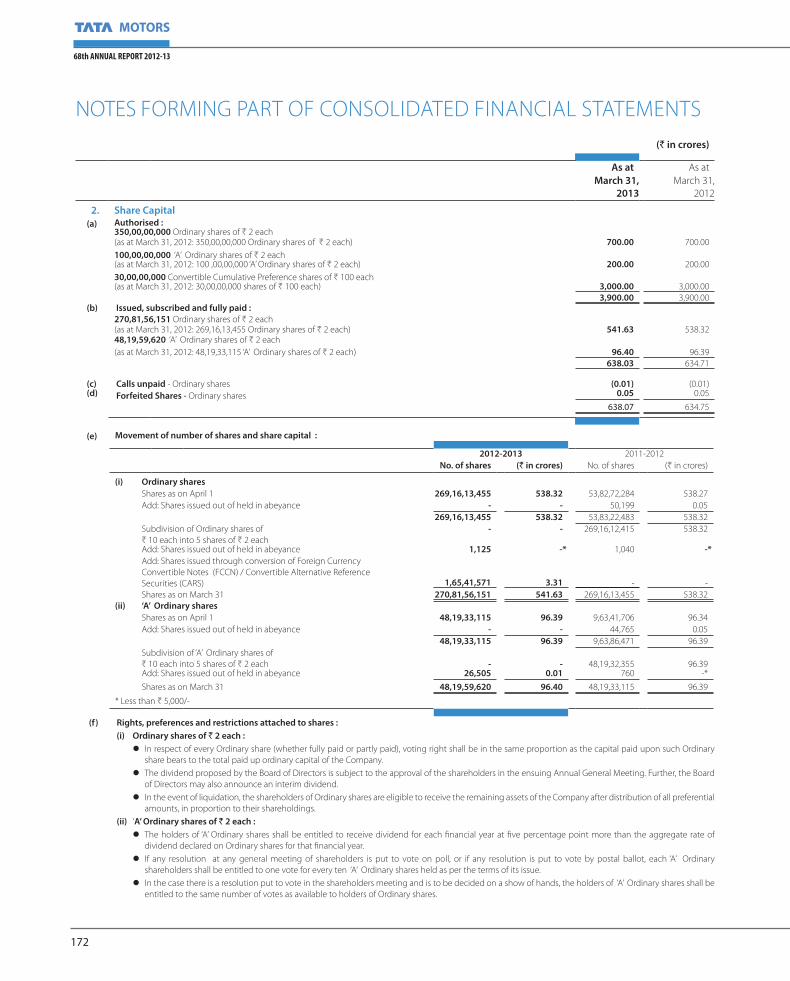
172
Notes FoRMING PARt oF CoNsolIdAted FINANCIAl stAteMeNts
68th ANNUAL REPORT 2012-13
(` in crores)
As at As at March 31,
2013March 31,
2012
2. Share Capital(a) Authorised :
350,00,00,000 ordinary shares of ` 2 each (as at March 31, 2012: 350,00,00,000 ordinary shares of ` 2 each) 700.00 700.00 100,00,00,000 ‘A’ ordinary shares of ` 2 each (as at March 31, 2012: 100 ,00,00,000 ‘A’ ordinary shares of ` 2 each) 200.00 200.00 30,00,00,000 Convertible Cumulative Preference shares of ` 100 each (as at March 31, 2012: 30,00,00,000 shares of ` 100 each) 3,000.00 3,000.00
3,900.00 3,900.00 (b) Issued, subscribed and fully paid :
270,81,56,151 ordinary shares of ` 2 each (as at March 31, 2012: 269,16,13,455 ordinary shares of ` 2 each) 541.63 538.32 48,19,59,620 ‘A’ ordinary shares of ` 2 each (as at March 31, 2012: 48,19,33,115 ‘A’ ordinary shares of ` 2 each) 96.40 96.39
638.03 634.71
(c) Calls unpaid - ordinary shares (0.01) (0.01)(d) Forfeited Shares - ordinary shares 0.05 0.05
638.07 634.75
(e) Movement of number of shares and share capital :
2012-2013 2011-2012No. of shares (` in crores) No. of shares (` in crores)
(i) Ordinary shares shares as on April 1 269,16,13,455 538.32 53,82,72,284 538.27 Add: shares issued out of held in abeyance - - 50,199 0.05
269,16,13,455 538.32 53,83,22,483 538.32 subdivision of ordinary shares of ` 10 each into 5 shares of ` 2 each
- - 269,16,12,415 538.32
Add: shares issued out of held in abeyance 1,125 -* 1,040 -* Add: shares issued through conversion of Foreign Currency Convertible Notes (FCCN) / Convertible Alternative Reference securities (CARs) 1,65,41,571 3.31 - - shares as on March 31 270,81,56,151 541.63 269,16,13,455 538.32 (ii) ‘A’ Ordinary shares shares as on April 1 48,19,33,115 96.39 9,63,41,706 96.34 Add: shares issued out of held in abeyance - - 44,765 0.05
48,19,33,115 96.39 9,63,86,471 96.39 subdivision of ‘A’ ordinary shares of ` 10 each into 5 shares of ` 2 each - - 48,19,32,355 96.39 Add: shares issued out of held in abeyance 26,505 0.01 760 -* shares as on March 31 48,19,59,620 96.40 48,19,33,115 96.39
* less than ` 5,000/-
(f) Rights, preferences and restrictions attached to shares : (i) Ordinary shares of ` 2 each : l In respect of every ordinary share (whether fully paid or partly paid), voting right shall be in the same proportion as the capital paid upon such ordinary
share bears to the total paid up ordinary capital of the Company. l the dividend proposed by the Board of directors is subject to the approval of the shareholders in the ensuing Annual General Meeting. Further, the Board
of directors may also announce an interim dividend. l In the event of liquidation, the shareholders of ordinary shares are eligible to receive the remaining assets of the Company after distribution of all preferential
amounts, in proportion to their shareholdings. (ii) ‘A’ Ordinary shares of ` 2 each : l the holders of ‘A’ ordinary shares shall be entitled to receive dividend for each financial year at five percentage point more than the aggregate rate of
dividend declared on ordinary shares for that financial year. l If any resolution at any general meeting of shareholders is put to vote on poll, or if any resolution is put to vote by postal ballot, each ‘A’ ordinary
shareholders shall be entitled to one vote for every ten ‘A’ ordinary shares held as per the terms of its issue. l In the case there is a resolution put to vote in the shareholders meeting and is to be decided on a show of hands, the holders of ‘A’ ordinary shares shall be
entitled to the same number of votes as available to holders of ordinary shares.

173
Notes FoRMING PARt oF CoNsolIdAted FINANCIAl stAteMeNts
CoRPoRAte oVeRVIeW FINANCIAl HIGHlIGHts FINANCIAL STATEMENTSstAtUtoRY RePoRts
Consolidated Financials (160-196)
(iii) American Depository Shares (ADSs) and Global Depositary Shares (GDSs) :
l Holders of Ads and Gds are not entitled to attend or vote at shareholders meetings. Holders of Ads may exercise voting rights with respect to the ordinary shares represented by Ads only in accordance with the provisions of the Company’s Ads deposit agreement and Indian law. the depository for the holders of the Global depository Receipts (GdRs) shall exercise voting rights in respect of the Gds by issue of an appropriate proxy or power of attorney in terms of the deposit agreement pertaining to the GdRs.
l shares issued upon conversion of Adss will rank pari passu with existing ordinary shares of ` 2 each in all respects, including entitlement of the dividend declared.
(g) Number of shares held by each shareholder holding more than 5 percent of the issued share capital
As at March 31, 2013 As at March 31, 2012
% of Issued share capital
No. of shares % of Issued share capital
No of shares
(i) Ordinary shares :
(a) tata sons limited 25.93% 70,23,33,345 25.96% 69,88,33,345
(b) tata steel limited 5.46% 14,78,10,695 5.49% 14,78,10,695
(c) life Insurance Corporation of India * - 6.75% 18,17,10,232
(d) Citibank N A as depository # 49,80,91,115 # 43,54,28,360
(ii) ‘A’ Ordinary shares :
(a) HdFC trustee Co limited - HdFC top 200 Fund 6.10% 2,93,87,761 6.67% 3,21,37,761
(b) HsBC Global Investment Funds a/c HsBC Global Investment Funds Mauritius ltd
5.97% 2,87,89,306 - -
(c) HdFC trustee Co limited - HdFC equity Fund 5.37% 2,58,78,932 6.07% 2,92,46,932
# held by Citibank, N.A. as depository for American depository shares (Adss) and Global depository shares (Gdss)
* less than 5%
(h) Information regarding issue of shares in the last five years
(i) the Company has not issued any shares without payment being received in cash.
(ii) there has been no issue of bonus shares.
(iii) the Company has not undertaken any buy-back of shares.
(i) Other Notes
(i) the Company has issued the Foreign Currency Convertible Notes (FCCNs) which are convertible into ordinary shares or Adss. the terms of issue along with the earliest dates of conversion are given on page 177, note (3).
(ii) the entitlements to 4,91,875 ordinary shares of ` 2 each (as at March 31, 2012 : 4,93,000 ordinary shares of ` 2 each) and 2,46,895 ‘A’ ordinary shares of ` 2 each (as at March 31, 2012: 2,73,400 ‘A’ ordinary shares of ` 2 each) are subject matter of various suits filed in the courts / forums by third parties for which final order is awaited and hence kept in abeyance.
(iii) subsequent to the year ended March 31, 2013, the Company has alloted :
1,17,89,695 ordinary shares upon conversion of 306, 4% Foreign Currency Convertible Notes (FCCN) due 2014.

174
Notes FoRMING PARt oF CoNsolIdAted FINANCIAl stAteMeNts
68th ANNUAL REPORT 2012-13
As at March 31, 2012
Additions Deductions As at March 31, 2013
3. Reserves and surplus
(a) securities Premium Account [Notes (i) and (ii)] 11,186.76 233.31 91.50 11,328.57 11,350.68 9.18 173.10 11,186.76
(b) Capital Redemption Reserve 2.28 - - 2.28 2.28 - - 2.28
(c) Capital Reserve (on consolidation) [Note (iii)] 405.36 34.85 - 440.21 367.30 38.06 - 405.36
(d) debenture Redemption Reserve 1,172.15 - 130.00 1,042.15 1,102.15 70.00 - 1,172.15
(e) Amalgamation Reserve 0.05 - - 0.05 0.05 - - 0.05
(f ) special Reserve 145.05 63.14 - 208.19 95.76 49.29 - 145.05
(g) Revaluation Reserve [Note (iv)] 92.90 - 53.30 39.60 144.63 - 51.73 92.90
(h) Hedging Reserve Account [Note (v)] (161.17) - 1,416.90 (1,578.07) 208.76 - 369.93 (161.17)
(i) Pension Reserve [Note (vi)] (3,870.58) 1,618.47 3,972.60 (6,224.71) (3,998.70) 1,619.10 1,490.98 (3,870.58)
(j) earned surplus Reserve [Note (vii), page 175] 14.51 - - 14.51 11.83 2.68 - 14.51
(k) Reserves for Research and Human Resource development [Note (viii), page 175] 169.29 - - 169.29 155.88 13.41 - 169.29
(l) Restricted Reserve 0.39 - - 0.39 0.39 - - 0.39
(m) translation Reserve [Note (ix), page 175] 177.46 104.81 - 282.27 (2,186.13) 2,363.59 - 177.46
(n) General Reserve [Note (x), page 175] 4,984.77 83.79 - 5,068.56 4,817.39 185.17 17.79 4,984.77
(o) Foreign Currency Monetary Item translation difference Account (Net) [Note (xi), page 175] (451.43) (1,245.17) (562.73) (1,133.87) - (1,086.52) (635.09) (451.43)
(p) Profit and loss Account / surplus [Note (xii), page 175] 18,195.96 10,022.61 878.76 27,339.81 6,461.49 13,516.50 1,782.03 18,195.96
32,063.75 10,915.81 5,980.33 36,999.23 18,533.76 16,780.46 3,250.47 32,063.75
Notes:- 2012 - 2013 2011 - 2012 Additions Deductions Additions deductions
(i) the opening and closing balances of securities Premium Account are net of calls in arrears of ` 0.03 crore(ii) Securities Premium Account :
(a) Premium on shares issued on conversion of Foreign Currency Convertible Notes (FCCN) / Convertible Alternative Reference securities (CARs) and held in abeyance out of rights issue of shares [previous year premium on shares issued which were held in abeyance out of rights issue of shares] 229.68 - 2.98 -
(b) share issue expenses and brokerage, stamp duty and other fees on Non-Convertible debentures [net of tax of ` 1.75 crores (2011-12 ` Nil)] - 91.50 - 76.69
(c) Premium on redemption of FCCN / CARs, exchange differences and withholding tax [net of tax ` 12.31 crores (2011-12 ` 15.99 crores)] 3.63 - - 96.41
(d) Profit on sale of plant items written off in earlier years - - 6.20 -
233.31 91.50 9.18 173.10(iii) the addition to Capital Reserve represents exchange gain on opening balances in respect of foreign
subsidiaries.(iv) Revaluation Reserve :
(a) depreciation on revalued portion of assets taken over on amalgamation of a company - 0.44 - 0.44(b) depreciation on revalued portion of assets of a subsidiary company - 52.86 - 51.29
- 53.30 - 51.73(v) the deduction to Hedging Reserve Account is net of tax ` 423.35 crores (2011-12 ` 45.88 crores).(vi) Pension Reserve :
(a) Actuarial losses (net) - 3,972.60 - 1,490.98 (b) Movement in restriction of pension assets 991.73 - 346.60 -(c) tax impact on acturial losses (net) and movement in restriction of pension assets 626.74 - 1,272.50 -
1,618.47 3,972.60 1,619.10 1,490.98
(` in crores)

175
Notes FoRMING PARt oF CoNsolIdAted FINANCIAl stAteMeNts
CoRPoRAte oVeRVIeW FINANCIAl HIGHlIGHts FINANCIAL STATEMENTSstAtUtoRY RePoRts
Consolidated Financials (160-196)
(vii) Under the Korean Commercial Code, tata daewoo Commercial Vehicle Company ltd. (tdCV), a subsidiary, is required to appropriate annually at least 10% of cash dividend declared each year to a legal reserve, earned surplus Reserve until such reserve equals 50% of capital stock of tdCV. this reserve may not be utilized for cash dividends but may only be used to offset against future deficit, if any, or may be transferred to capital stock of tdCV.
(viii) Reserve on Research and Human Resource Development :
Under the special tax treatment Control law, tdCV appropriated retained earnings for research and human resource development. the reserve, which was used for its own purpose, is regarded as ‘discretionary Appropriated Retained earnings’.
(ix) translation Reserves represents conversion of balances in functional currency of foreign subsidiaries (net of minority share) and associates. [Note (f )(i)(3), page 169]
(` in crores)
2012 - 2013 2011 - 2012 Additions Deductions Additions deductions
(x) General Reserve :
(a) Amount recovered (net) towards indemnity relating to business amalgamated in prior year 0.08 - 0.04 - (b) Amount written off / written back by a subsidiary against securities Premium Account [net of tax of
` Nil (2011-12: ` 1.50 crores)] 0.02 - 0.77 3.13
(c) Amount written off by an associate against securities Premium Account - - - 14.66
(d) Government grants / incentives received by an associate 24.21 - 26.33 -
(e) Amount transferred from Profit and loss Account / surplus 59.48 - 158.03 -
83.79 - 185.17 17.79
(xi) Foreign Currency Monetary Item Translation Difference Account :
(a) exchange loss during the year (net) (1,245.17) - (1,086.52) -
(b) Amortisation of exchange fluctuation for the year - (562.73) - (635.09)
(1,245.17) (562.73) (1,086.52) (635.09)
(xii) Profit and Loss Account / Surplus :
(a) Profit for the year 9,892.61 - 13,516.50 -
(b) tax on interim dividend by subsidiaries (including Group’s share of subsidiaries’ dividend tax) - 4.54 - 3.00
(c) Proposed dividend - 645.20 - 1,280.70
(d) tax on proposed dividend (including Group’s share of subsidiaries’ dividend tax) - 106.40 - 204.92
(e) debenture Redemption Reserve 130.00 - - 70.00
(f ) General Reserve - 59.48 - 158.03
(g) special Reserve - 63.14 - 49.29
(h) earned surplus Reserve - - - 2.68
(i) Reserve for Research and Human Resource development - - - 13.41
10,022.61 878.76 13,516.50 1,782.03

176
Notes FoRMING PARt oF CoNsolIdAted FINANCIAl stAteMeNts
68th ANNUAL REPORT 2012-13
(` in crores)
As atMarch 31, 2013
As atMarch 31, 2012
4. Long-term Borrowings(A) Secured :
(a) Privately placed Non-Convertible debentures [Notes 1(a) below, 2(a), 2(b) and 2(c), page 177] 4,108.21 4,646.65 (b) term loans :
(i) From banks [Notes 1(b) below, 2(d) and 2(e), page 177] 4,848.82 2,957.52 (ii) From others [Note 2(f ), page 177] 167.20 -
(c) Finance lease obligations [Notes 30(A) (a) (ii), page 188] 33.14 32.28 9,157.37 7,636.45
(B) Unsecured :(a) Foreign Currency Convertible Notes (FCCN) [Note 3, page 177] 402.25 597.36 (b) Privately placed Non-Convertible debentures [Note 1(a) below] 3,239.80 1,049.40 (c) subordinated perpetual debentures 250.00 150.00 (d) term loans :
(i) From banks [Note 1(b) below] 3,502.86 5,668.26 (ii) From others 213.62 216.59
(e) senior Notes [Note 36 (c)(i), page 196] 15,344.17 12,327.19 (f ) deposits :
(i) deposits accepted from public - 238.28 (ii) deposits accepted from shareholders - 78.95
22,952.70 20,326.03 TOTAL (A+B) 32,110.07 27,962.48
As atMarch 31, 2013
As atMarch 31, 2012
5. Short-term borrowings(A) Secured :
(a) loan from banks [Note 2(d), page 177] 7,744.41 7,937.59 (b) loan from others 79.26 200.00
7,823.67 8,137.59 (B) Unsecured :
(a) (i) loan from banks 996.38 1,266.67 (ii) loan from others 7.36 54.38
(b) Inter corporate deposits from associates 29.50 30.00 (c) Commercial paper 2,755.30 1,252.95
3,788.54 2,604.00 TOTAL (A+B) 11,612.21 10,741.59
Notes :(1) Terms of redemption / repayments :
(a) Privately placed Non-Convertible debentures will be redeemed from 2014-15 to 2025-26.(b) term loans from Banks are repayable from 2014-15 to 2018-19.

177
Notes FoRMING PARt oF CoNsolIdAted FINANCIAl stAteMeNts
CoRPoRAte oVeRVIeW FINANCIAl HIGHlIGHts FINANCIAL STATEMENTSstAtUtoRY RePoRts
Consolidated Financials (160-196)
Notes :
(2) Nature of Security (on loans including interest accrued thereon) :
(a) during the year 2009-10, the Company issued 2% secured non-convertible credit enhanced rupee debentures in four tranches, having tenor upto seven years, aggregating ` 4,200 crores on a private placement basis. these are secured by a second charge in favour of Vijaya Bank, debenture trustee and first ranking pari passu charge in favour of state Bank of India as security trustee on behalf of the guarantors, by way of english mortgage of the Company’s lands, freehold and leasehold, together with all buildings, constructions and immovable and movable properties situated at Chinchwad, Pimpri, Chikhali and Maval in Pune district and plant and machinery and other movable assets situated at Pantnagar in the state of Uttarakhand and at Jamshedpur in the state of Jharkhand. As at March 31, 2013 ` 3,050 crores is outstanding, of which ` 1,800 crores are classified as current liabilities being maturing before March 31, 2014.
(b) Rated, listed, secured, 9.95% Coupon, Non-Convertible debentures amounting to ` 200 crores and 10.25% Coupon, Non-Convertible debentures amounting to ` 500 crores are secured by a pari passu charge by way of an english mortgage of the Company’s freehold land together with immovable properties, plant and machinery and other movable assets (excluding stock and book debts) situated at sanand in the state of Gujarat.
(c) Privately placed non-convertible debentures amounting to ` 3,524.90 crores are fully secured by :
(i) First charge on residential flat of tata Motors Finance limited (tMFl), a subsidiary of the Company (ii) Pari - passu charge is created with the security trustee for loans from banks on: - All receivables of tMFl arising out of loan and trade advances, - All book debts of tMFl arising out of loan and trade advances, - Receivables from senior and Junior pass through certificates of tMFl. (iii) First charge on secured / unsecured loans given by tMFl as identified from time to time and accepted by the debenture trustee. (iv) Any other security as identified by tMFl and acceptable to the debenture trustee.
(d) loans from Banks are secured by hypothecation of existing current assets of the Company viz. stock of raw materials, stock in process, semi-finished goods, stores and spares not relating to plant and machinery (consumable stores and spares), bills receivable and book debts including receivable from hire purchase / leasing and all other moveable current assets except cash and bank balances, loans and advances of the Company both present and future.
(e) term loans from banks amounting to ` 4,075 crores are secured by a pari passu charge in favour of the security trustee on receivables and book debts arising out of loans and advances and such current assets as may be identified by tMFl from time to time and accepted by the security trustee.
(f ) term loan from others carries simple interest at the rate of 0.10 % p.a. and is secured by a subservient charge against the Company’s freehold land together with immovable properties, plant and machinery and other movable assets (excluding stock and book debts) situated at sanand in the state of Gujarat.
(3) Foreign Currency Convertible Notes (FCCN) and Convertible Alternative Reference Securities (CARS) :
the Company issued the FCCN and CARs which are convertible into ordinary shares or Adss. the particulars, terms of issue and the status of conversion as at March 31, 2013 are given below :
@ Increased due to cash dividend distribution antidilution adjustment as per terms of issue.
Issue 0% CARS (due 2012) 4% FCCN (due 2014)Issued on July 11, 2007 october 15, 2009Issue Amount (in INR at the time of the issue) Us $ 490 million
(` 1,992.71 crores)Us $ 375 million(` 1,794.19 crores)
Face Value Us $ 100,000 Us $ 100,000Conversion Price per share at fixed exchange rate
` 960.96 Us $ 1 = ` 40.59
` 623.88Us $ 1 = ` 46.28
Reset Conversion Price (due to rights issue, Gds issue and subdivision of shares)
` 181.43 Us $ 1 = ` 40.59
` 120.12Us $ 1 = ` 46.28
exercise Period october 11, 2011 to June 12, 2012
November 25, 2009 (for conversion into shares or Gdss) and october 15, 2010 (for conversion into Adss) to october 9, 2014
early redemption at the option of the Companysubject to certain conditions
i) after october 11, 2011 at our option (in whole but not in part)
i) any time on or after october 15, 2012 (in whole but not in part) at our option
or or
ii) any time (in whole but not in part) in the event of certain changes affecting taxation in India
ii) any time (in whole but not in part) in the event of certain changes affecting taxation in India
Redeemable on July 12, 2012 october 16, 2014Redemption percentage of the Principal Amount 131.820% 108.505%Amount converted Us $ 0.10 million Us $ 300.9 millionAggregate conversion into AdRs (in terms of equivalent shares) and shares. 22,370 11,36,37,871Aggregate Notes Redeemed 4,729 NilAggregate Notes Bought Back Nil NilNotes outstanding as at March 31, 2013 Nil 741Amount outstanding as at March 31, 2013 Nil Us $ 74.10 million
(` 402.25 crores)Aggregate amount of shares that could be issued on conversion of outstanding notes
Nil 2,85,49,588 @

178
Notes FoRMING PARt oF CoNsolIdAted FINANCIAl stAteMeNts
68th ANNUAL REPORT 2012-13
(` in crores)
As atMarch 31, 2013
As atMarch 31, 2012
6. (a) Deferred tax assets and liabilities (net) classified on a company wise basis :(i) deferred tax asset 4,428.93 4,539.33 (ii) deferred tax liability (2,019.49) (2,165.07)
Net deferred tax asset 2,409.44 2,374.26
(b) Major components of deferred tax arising on account of timing differences are:Liabilities:depreciation (1,512.57) (1,522.35)Intangibles / Product development cost andReserves for Research and Human Resource development (7,030.54) (5,711.42)others (80.01) (137.80)
(8,623.12) (7,371.57)Assets:Unabsorbed depreciation/ business loss 7,097.92 6,984.83 employee benefits / expenses allowable on payment basis 3,026.23 2,122.29 Provision for doubtful debts 340.77 326.85 Premium on redemption of CARs (net of exchange fluctuation on premium) - 126.74 others 567.64 185.12
11,032.56 9,745.83 Net deferred tax asset 2,409.44 2,374.26
(c) Tax expenses / (credit) : 2012 - 2013 2011 - 2012(i) Current tax
Current tax 2,778.63 2,524.74 less : MAt credit entitlement (61.89) (293.29)Current tax (net of credit for Minimum Alternate tax) 2,716.74 2,231.45
(ii) Deferred tax charge / (credit) 1,054.25 (2,271.49)Total (i + ii) 3,770.99 (40.04)
(d) Deferred tax charge / (credit) for the year 2012 - 2013 2011 - 2012opening net deferred tax assets / (liability) 2,374.26 (1,463.79)(debited) / Credited to securities Premium Account 14.06 15.99 (debited) / Credited to Hedging Reserve 423.35 45.88 (debited) / Credited to Pension Reserve 626.74 1,272.50 (debited) / Credited to General Reserve - 1.50 translation differences in respect of foreign subsidiaries 25.28 230.69
3,463.69 102.77 Closing net deferred tax assets 2,409.44 2,374.26 deferred tax charge / (credit) for the year [Note below] 1,054.25 (2,271.49)
Notes : during the year ended March 31, 2012, a UK subsidiary company has recognised a tax credit of GBP 225 million (` 1,793.66 crores) for past income tax losses, consequent to establishing certainty of utilization on the basis of future profit forecasts and the planned consolidation of certain subsidiaries in the UK.

179
Notes FoRMING PARt oF CoNsolIdAted FINANCIAl stAteMeNts
CoRPoRAte oVeRVIeW FINANCIAl HIGHlIGHts FINANCIAL STATEMENTSstAtUtoRY RePoRts
Consolidated Financials (160-196)
(` in crores)
As atMarch 31, 2013
As atMarch 31, 2012
7. Other long-term liabilities(a) liability towards premium on redemption of Non-Convertible debentures 919.23 1,577.28 (b) deferred payment liabilities 237.00 286.25 (c) Interest accrued but not due on borrowings 2.21 33.24 (d) derivative financial instruments 1,733.50 271.31 (e) others 392.12 129.49
3,284.06 2,297.57
As atMarch 31, 2013
As atMarch 31, 2012
8. Other current liabilities(a) liability towards vehicles sold under repurchase arrangements 1,501.38 1,253.44 (b) liability for capital expenditure 1,958.12 962.00 (c) deposits and retention money 183.23 187.19 (d) Interest accrued but not due on borrowings 738.73 762.56 (e) Current maturities of long term borrowings (Note below) 9,869.10 8,444.89 (f ) deferred payment liabilities 63.82 75.30 (g) Advance and progress payments from customers 2,084.58 2,368.83 (h) statutory dues (VAt, excise, service tax, octroi etc) 2,973.04 3,664.53 (i) employee benefit obligations 49.76 52.42 (j) liability towards premium on redemption of Non-Convertible debentures 658.05 96.55 (k) liability towards Investors education and Protection Fund
under section 205C of the Companies Act, 1956 (IePF) not due 100.01 190.05 (l) derivative financial instruments 1,704.97 906.13 (m) others 256.17 105.89
22,140.96 19,069.78 Note :Current maturities of long term borrowings consists of :(i) Privately placed Non-Convertible debentures 3,002.03 875.00 (ii) term loans from banks and others 6,535.52 3,404.97 (iii) Finance lease obligations 17.41 14.15 (iv) Convertible Alternative Reference securities (CARs) - 2,406.74 (v) deposits accepted from public and shareholders 314.14 1,744.03
9,869.10 8,444.89

180
Notes FoRMING PARt oF CoNsolIdAted FINANCIAl stAteMeNts
68th ANNUAL REPORT 2012-13
(` in crores)
As atMarch 31, 2013
As atMarch 31, 2012
9. Long-term provisions(a) employee benefit obligations 4,381.60 3,026.91 (b) Warranty and product liability [Note 34(i), page 195] 3,560.44 2,520.77 (c) Premium on redemption of Foreign Currency Convertible Notes (FCCN) [Note 34(ii), page 195] 34.21 56.77 (d) Residual risk [Note 34(iii), page 195] 106.27 113.40 (e) environmental cost [Note 34(iv), page 195] 179.32 164.86 (f ) Current income tax (net of payment) - 147.88 (g) others 57.31 201.80
8,319.15 6,232.39
As atMarch 31, 2013
As atMarch 31, 2012
10. Short term provisions(a) employee benefit obligations 2,032.51 424.46 (b) Warranty and product liability [Note 34(i), page 195] 3,110.02 2,731.40 (c) Current income tax (net of payment) 1,792.02 1,163.83 (d) Premium on redemption of Convertible Alternative Reference securities (CARs)
[Note 34(ii), page 195] - 855.73 (e) Proposed dividend 645.20 1,280.70 (f ) Provision for tax on dividends 109.49 206.30 (g) Residual risk [Note 34(iii), page 195] 13.40 17.58 (h) others 49.95 90.38
7,752.59 6,770.38
As atMarch 31, 2013
As atMarch 31, 2012
11. Trade payables(a) Acceptances 4,393.13 4,078.74 (b) other than acceptances 40,387.01 32,607.58
44,780.14 36,686.32

181
Notes FoRMING PARt oF CoNsolIdAted FINANCIAl stAteMeNts
CoRPoRAte oVeRVIeW FINANCIAl HIGHlIGHts FINANCIAL STATEMENTSstAtUtoRY RePoRts
Consolidated Financials (160-196)
12. Tangible assets (` in crores)
Particulars
Cost as at April 1,
2012
Additions/ adjustments
[Note (ii)]
Translation adjustments
Deductions/ adjustments
Cost as at March 31,
2013
Accumulated depreciation
as at April 1, 2012
Depreciation for the year
Translation adjustment- accumulateddepreciation
Deductions/ adjustments
Accumulated depreciation up to March
31, 2013 [Note (iii)]
Net book value as at March 31,
2013
[I] Owned assets :
(i) land 1,697.51 27.51 30.50 61.91 1,693.61 - - - - - 1,693.61 1,559.31 - 138.20 - 1,697.51 - - - - - 1,697.51
(ii) Buildings 8,967.68 510.44 124.72 1,418.84 8,184.00 4,604.81 208.63 93.34 1,391.91 3,514.87 4,669.13 7,750.37 533.65 697.81 14.15 8,967.68 3,946.04 169.17 489.96 0.36 4,604.81 4,362.87
(iii) Plant, machinery and 56,879.81 8,724.96 128.84 3,145.31 62,588.30 36,860.38 3,556.85 272.73 3,036.88 37,653.08 24,935.22 equipment [Note (i)] 47,156.11 5,509.75 4,431.15 217.20 56,879.81 30,631.95 2,942.65 3,455.68 169.90 36,860.38 20,019.43
(iv) Furniture, fixtures and 603.65 162.62 3.20 66.52 702.95 382.06 44.48 5.40 59.07 372.87 330.08 office appliances [Note (i)] 465.14 112.36 38.81 12.66 603.65 308.80 51.09 31.61 9.44 382.06 221.59
(v) Vehicles [Note (i)] 357.64 98.11 9.83 214.36 251.22 148.69 50.54 3.14 80.61 121.76 129.46 255.97 145.16 19.13 62.62 357.64 122.53 56.02 5.17 35.03 148.69 208.95
(vi) Computers & other 1,315.78 48.17 28.63 464.39 928.19 1,027.85 72.00 26.84 460.07 666.62 261.57 It assets [Note (i)] 1,178.38 85.03 76.83 24.46 1,315.78 892.11 91.40 66.14 21.80 1,027.85 287.93
[II] Assets given on lease :
(i) Plant & machinery 395.93 6.26 - - 402.19 380.15 4.52 - 4.52 380.15 22.04 398.96 - - 3.03 395.93 382.24 4.86 - 6.95 380.15 15.78
[III] Assets taken on lease :
(i) leasehold land 265.54 1.86 (0.69) 1.38 265.33 55.64 3.64 1.69 32.55 28.42 236.91 259.48 3.36 12.42 9.72 265.54 46.33 8.91 0.40 - 55.64 209.90
(ii) Buildings 46.27 11.62 0.21 3.04 55.06 10.11 2.92 0.20 3.99 9.24 45.82 41.42 5.34 0.37 0.86 46.27 6.35 0.99 2.34 (0.43) 10.11 36.16
(iii) Plant & machinery 39.15 - (0.16) 0.10 38.89 31.40 3.33 - 0.10 34.63 4.26 39.15 - - - 39.15 28.76 2.62 0.02 - 31.40 7.75
(iv) Computers & other 115.57 38.22 - - 153.79 64.86 31.27 - - 96.13 57.66 It assets 66.35 49.37 0.29 0.44 115.57 43.31 21.43 0.12 - 64.86 50.71
tOTAL TANGIBLE ASSETS 70,684.53 9,629.77 325.08 5,375.85 75,263.53 43,565.95 3,978.18 403.34 5,069.70 42,877.77 32,385.76 59,170.64 6,444.02 5,415.01 345.14 70,684.53 36,408.42 3,349.14 4,051.44 243.05 43,565.95 27,118.58
(i) Includes plant, machinery and equipment, furniture, fixtures and office equipments, vehicles and computers having gross block of ` 204.28 crores, ` 1.15 crores, ` 1.67 crores and ` 165.64 crores (as at March 31, 2012 ` 158.58 crores, ` 1.41 crores, ` 1.57 crores and ` 119.50 crores) and net block of ` 6.41 crores, ` 0.08 crore, ` 0.02 crore and ` 0.53 crore (as at March 31, 2012 ` 5.51 crores, ` 0.08 crore, ` 0.02 crore and ` 0.28 crore) respectively, held for disposal.
(ii) Additions / adjustments include capitalisation of exchange loss of ` 169.22 crores (2011-2012 capitalisation of exchange loss of ` 165.08 crores).(iii) Accumulated depreciation includes : (a) lease equalisation of ` 4.52 crores (2011-2012 ` 4.51 crores) adjusted in lease rental income. (b) depreciation of ` 53.30 crores (2011-2012 ` 51.73 crores) on revalued portion of gross block transferred to Revaluation Reserve.
* Additions / Adjustments include capitalisation of exchange loss of ` 19.50 crores (2011-2012 capitalisation of exchange loss of ` 25.47 crores).
13. Intangible assets
Particulars
Cost as at April 1,
2012
Additions/ adjustments*
Translation adjustments
Deductions/ adjustments
Cost as at March 31,
2013
Accumulated amortisation
as at April 1, 2012
Amortisa- tion for the year
Translation adjustment- accumulateddepreciation
Deductions/ adjustments
Accumulated amortisation up to March
31, 2013
Net book value as at March 31,
2013
(i) technical know-how 37.42 - - - 37.42 26.81 - - - 26.81 10.61 37.29 0.12 0.01 - 37.42 26.29 0.52 - - 26.81 10.61
(ii) Computer software 2,255.27 392.16 31.94 697.32 1,982.05 1,458.34 329.24 27.13 695.06 1,119.65 862.40 1,686.07 383.59 208.00 22.39 2,255.27 1,056.21 287.02 126.75 11.64 1,458.34 796.93
(iii) Product development cost 12,538.61 9,011.35 (324.33) 207.32 21,018.31 4,066.28 3,160.54 (93.13) 145.24 6,988.45 14,029.86 6,828.41 4,946.72 763.48 - 12,538.61 1,948.45 1,890.37 227.51 0.05 4,066.28 8,472.33
(iv) trade marks & brand 3,241.66 - 22.82 - 3,264.48 - - - - - 3,264.48 2,841.73 - 399.93 - 3,241.66 - - - - - 3,241.66
(v) developed technologies 1,021.65 5.89 (22.60) - 1,004.94 395.09 101.34 (4.29) - 492.14 512.80 898.79 - 122.86 - 1,021.65 259.30 98.33 37.46 - 395.09 626.56
TOTAL INTANGIBLE ASSETS 19,094.61 9,409.40 (292.17) 904.64 27,307.20 5,946.52 3,591.12 (70.29) 840.30 8,627.05 18,680.15 12,292.29 5,330.43 1,494.28 22.39 19,094.61 3,290.25 2,276.24 391.72 11.69 5,946.52 13,148.09

182
Notes FoRMING PARt oF CoNsolIdAted FINANCIAl stAteMeNts
68th ANNUAL REPORT 2012-13
(` in crores)
As atMarch 31, 2013
As atMarch 31, 2012
14. Goodwill (on consolidation)Opening balance 4,093.74 3,584.79 Add : Addition due to increase in stake in subsidiary companies - 204.13 less : Impairment (25.36) (139.18)Add : Impact of foreign currency translation 33.99 444.00 Closing balance 4,102.37 4,093.74
As atMarch 31, 2013
As atMarch 31, 2012
15. Non-current investments(A) Investments in equity accounted investees :
Carrying amount of investments in associates (Note 4 below) 744.73 668.55 744.73 668.55
(B) Others (at cost)(i) Quoted
(a) equity shares 299.11 297.98 (b) Bonds 2.93 2.69
(ii) Unquoted(a) equity shares 382.10 353.49 (b) Cumulative redeemable preference shares 2.00 2.00 (c) Cumulative redeemable non-participating preference shares 6.00 - (d) Non-convertible debentures 3.50 3.50 (e) Mutual fund 12.50 38.00 (f ) optionally convertible debentures 1.66 4.11 (g) Retained interest in securitisation transactions 65.03 0.38
774.83 702.15
(C) Provision for diminution in value of Investments (net) (4.16) (4.16)
(D) Advance against investments - 25.00 Total 1,515.40 1,391.54
Notes:(1) Book value of quoted investments (other than in associates) 302.04 300.67 (2) Book value of unquoted investments (other than in associates) 468.63 422.32 (3) Market value of quoted investments (other than in associates) 210.48 288.35 (4) the particulars of investments in associate companies as of March 31, 2013 are as follows:
Sr. No.
Name of the Associates Country of Incorporation
Ownership Interest (%)
Original Cost of Investment
Amount of Goodwill/
(Capital Reserve) in
Original Cost
Share of post acquisition
Reserves and Surplus
Carrying amount of
Investments
(i) tata Cummins ltd India 50.00 90.00 - 202.99 292.99 50.00 90.00 - 206.61 296.61
(ii) tata AutoComp systems ltd India 26.00 77.47 - 142.06 219.53 26.00 77.47 - 13.34 90.81
(iii) NItA Company ltd Bangladesh 40.00 1.27 (0.43) 11.67 12.94 40.00 1.27 (0.43) 6.34 7.61
(iv) Automobile Corporation of Goa ltd India 47.19 109.63 55.28 25.75 135.38 47.18 109.62 55.28 22.02 131.64
(v) Jaguar Cars Finance ltd UK 49.90 0.51 - - 0.51 49.90 0.51 - - 0.51
(vi) tata Hitachi Construction Machinery Company ltd (formerly known as Telco India 40.00 80.20 0.20 (0.22) 79.98 Construction Equipment Company Ltd) 40.00 80.20 0.20 57.77 137.97
(vii) spark 44 ltd UK 50.00 3.40 - - 3.40 50.00 3.40 - - 3.40
Total 362.48 55.05 382.25 744.73 362.47 55.05 306.08 668.55
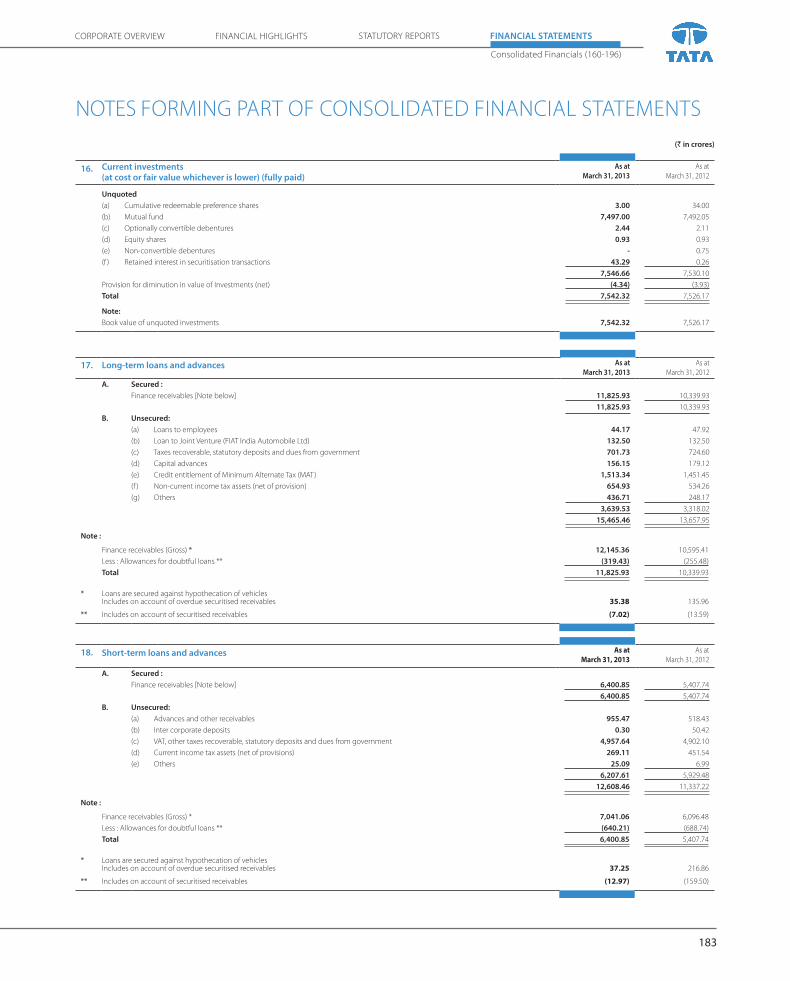
183
Notes FoRMING PARt oF CoNsolIdAted FINANCIAl stAteMeNts
CoRPoRAte oVeRVIeW FINANCIAl HIGHlIGHts FINANCIAL STATEMENTSstAtUtoRY RePoRts
Consolidated Financials (160-196)
(` in crores)
16. Current investments (at cost or fair value whichever is lower) (fully paid)
As atMarch 31, 2013
As atMarch 31, 2012
Unquoted(a) Cumulative redeemable preference shares 3.00 34.00 (b) Mutual fund 7,497.00 7,492.05 (c) optionally convertible debentures 2.44 2.11 (d) equity shares 0.93 0.93 (e) Non-convertible debentures - 0.75 (f ) Retained interest in securitisation transactions 43.29 0.26
7,546.66 7,530.10 Provision for diminution in value of Investments (net) (4.34) (3.93)Total 7,542.32 7,526.17
Note:Book value of unquoted investments 7,542.32 7,526.17
17. Long-term loans and advances As atMarch 31, 2013
As atMarch 31, 2012
A. Secured :Finance receivables [Note below] 11,825.93 10,339.93
11,825.93 10,339.93 B. Unsecured:
(a) loans to employees 44.17 47.92 (b) loan to Joint Venture (FIAt India Automobile ltd) 132.50 132.50 (c) taxes recoverable, statutory deposits and dues from government 701.73 724.60 (d) Capital advances 156.15 179.12 (e) Credit entitlement of Minimum Alternate tax (MAt) 1,513.34 1,451.45 (f ) Non-current income tax assets (net of provision) 654.93 534.26 (g) others 436.71 248.17
3,639.53 3,318.02 15,465.46 13,657.95
18. Short-term loans and advances As atMarch 31, 2013
As atMarch 31, 2012
A. Secured :Finance receivables [Note below] 6,400.85 5,407.74
6,400.85 5,407.74 B. Unsecured:
(a) Advances and other receivables 955.47 518.43 (b) Inter corporate deposits 0.30 50.42 (c) VAt, other taxes recoverable, statutory deposits and dues from government 4,957.64 4,902.10
(d) Current income tax assets (net of provisions) 269.11 451.54 (e) others 25.09 6.99
6,207.61 5,929.48 12,608.46 11,337.22
Note :
Finance receivables (Gross) * 7,041.06 6,096.48 less : Allowances for doubtful loans ** (640.21) (688.74)Total 6,400.85 5,407.74
* loans are secured against hypothecation of vehiclesIncludes on account of overdue securitised receivables
37.25
216.86
** Includes on account of securitised receivables (12.97) (159.50)
Note :
Finance receivables (Gross) * 12,145.36 10,595.41 less : Allowances for doubtful loans ** (319.43) (255.48)Total 11,825.93 10,339.93
* loans are secured against hypothecation of vehicles Includes on account of overdue securitised receivables 35.38 135.96
** Includes on account of securitised receivables (7.02) (13.59)

184
Notes FoRMING PARt oF CoNsolIdAted FINANCIAl stAteMeNts
68th ANNUAL REPORT 2012-13
19. Other non-current assets As atMarch 31, 2013
As atMarch 31, 2012
(a) Prepaid expenses 62.23 42.67 (b) Prepaid debt issue cost 277.30 303.29 (c) Interest accrued on loans and deposits 64.96 39.02 (d) derivative financial instruments 619.46 189.70
1,023.95 574.68
20. Other current assets As atMarch 31, 2013
As atMarch 31, 2012
(a) Prepaid expenses 463.53 286.69 (b) Prepaid debt issue cost 99.34 163.23 (c) Interest accrued on loans and deposits 11.93 62.13 (d) derivative financial instruments 256.81 395.04
831.61 907.09
21. Inventories As atMarch 31, 2013
As atMarch 31, 2012
(a) stores and spare parts (at or below cost) 192.97 178.39 (b) Consumable tools (at cost) 95.78 88.06 (c) Raw materials and components 1,855.47 2,011.65 (d) Work-in-progress 2,161.41 1,924.84 (e) Finished goods 16,197.27 13,378.42 (f ) Goods-in-transit - Raw materials and components (at cost) 466.11 634.66
20,969.01 18,216.02
22. Trade receivables (unsecured) As atMarch 31, 2013
As atMarch 31, 2012
(a) over six months 821.02 593.47 (b) others 10,443.32 7,969.58
11,264.34 8,563.05 less : Allowances for doubtful debts (321.68) (326.21)
10,942.66 8,236.84
23. Cash and bank balances As atMarch 31, 2013
As atMarch 31, 2012
(A) Cash and cash equivalents(a) Cash on hand 41.45 21.56 (b) Cheques on hand 121.94 79.84 (c) Current account with banks # 7,712.35 6,419.09 (d) Bank deposits with upto 3 months maturity 4,473.08 8,312.53
12,348.82 14,833.02
(B) Other bank balances (with more than 3 months but less than 12 months maturity)(a) Bank deposits 6,896.13 1,187.95 (b) other restricted deposits 900.24 1,070.91 (c) earmarked balances with banks 354.19 196.99 (d) Margin money / cash collateral with banks 140.29 40.50
8,290.85 2,496.35 (C) Other bank balances (with more than 12 months maturity)(a) Bank deposits - 32.60 (b) other restricted deposits 403.69 657.72 (c) Margin money / cash collateral with banks 69.31 218.44
473.00 908.76
Total (A + B + C) 21,112.67 18,238.13
# Includes remittances in transit 118.81 50.47
(` in crores)
Note: Items (c), (d) and (e) above are valued at lower of cost and net realisable value.

185
Notes FoRMING PARt oF CoNsolIdAted FINANCIAl stAteMeNts
CoRPoRAte oVeRVIeW FINANCIAl HIGHlIGHts FINANCIAL STATEMENTSstAtUtoRY RePoRts
Consolidated Financials (160-196)
(` in crores)
2012 - 2013 2011 - 201224. Total revenue
(I) Revenue from operations(a) sale of products 188,794.04 167,071.32 (b) sale of services 845.10 745.21 (c) Income from vehicle loan contracts (Note below) 2,780.02 2,061.08
192,419.16 169,877.61 (d) other operating revenues 1,164.79 799.97
193,583.95 170,677.58
(II) Other income(a) Interest income 693.90 487.64 (b) dividend income 37.27 37.92 (c) Profit on sale of investments (net) 79.85 48.45 (d) Profit on issue of shares by a subsidiary - 47.36 (e) other non-operating income 0.51 40.40
811.53 661.77 Note :
Includes :(a) Income from securitisation / sale of receivables of loan contracts (net) 27.83 45.90 (b) Interest income from loan contracts (net) 2,530.50 1,862.62

186
Notes FoRMING PARt oF CoNsolIdAted FINANCIAl stAteMeNts
68th ANNUAL REPORT 2012-13
(` in crores)
2012 - 2013 2011 - 2012
25. Employee cost / benefits expenses(a) salaries, wages and bonus 13,183.48 9,780.46 (b) Contribution to provident fund and other funds 1,659.99 1,303.97 (c) staff welfare expenses 1,740.58 1,214.02
16,584.05 12,298.45
2012 - 2013 2011 - 2012
26. Finance cost(a) Interest 4,125.47 3,182.42
less: transferred to capital account (1,270.85) (777.76) 2,854.62 2,404.66
(b) discounting charges 698.72 577.56 3,553.34 2,982.22
2012 - 2013 2011 - 2012
27. Other expenses(a) Processing charges 1,450.56 1,539.14 (b) Consumption of stores & spare parts 1,393.89 1,217.24 (c) Power & fuel 1,069.06 1,017.19 (d) Rent 161.28 128.84 (e) Repairs to buildings 120.25 101.51 (f ) Repairs to plant, machinery etc. 195.10 175.42 (g) Insurance 225.30 227.18 (h) Rates & taxes 202.61 259.15 (i) Freight, transportation, port charges etc. 4,798.01 3,734.55 (j) Publicity 6,607.14 5,398.40 (k) excise duty on closing stock 115.50 116.80 (l) Works operation and other expenses (Note below) 19,196.88 14,538.55
35,535.58 28,453.97 Note :Works operation and other expenses include:(i) Warranty and product liability expenses 4,188.74 3,427.45 (ii) Computer expenses 1,126.48 1,124.64 (iii) lease rentals in respect of plant, machinery and equipment 271.66 185.64 (iv) Provision and write off of sundry debtors, vehicle loans and advances (net) 525.33 554.45 (v) exchange loss / (gain) (net) 433.27 (405.85)

187
Notes FoRMING PARt oF CoNsolIdAted FINANCIAl stAteMeNts
CoRPoRAte oVeRVIeW FINANCIAl HIGHlIGHts FINANCIAL STATEMENTSstAtUtoRY RePoRts
Consolidated Financials (160-196)
2012 - 2013 2011 - 2012
28. Earnings Per Share
(a) Profit for the year ` in crores 9,892.61 13,516.50
(b) the weighted average number of ordinary shares for Basic ePs Nos. 270,60,14,707 269,15,42,867
(c) the weighted average number of ‘A’ ordinary shares for Basic ePs Nos. 48,19,58,717 48,19,00,898
(d) the nominal value per share (ordinary and 'A' ordinary) ` 2.00 2.00
(e) share of profit for ordinary shares for Basic ePs ` in crores 8,392.95 11,459.87
(f ) share of profit for 'A' ordinary shares for Basic ePs * ` in crores 1,499.66 2,056.63
(g) earnings Per ordinary share (Basic) ` 31.02 42.58
(h) earnings Per 'A' ordinary share (Basic) ` 31.12 42.68
(i) Profit for the year for Basic ePs ` in crores 9,892.61 13,516.50
(j) Add: Interest and other expenses on outstanding Foreign Currency Convertible Notes ` in crores 73.65 24.70
(k) Profit for the year for diluted ePs ` in crores 9,966.26 13,541.20
(l) the weighted average number of ordinary shares for Basic ePs Nos. 270,60,14,707 269,15,42,867 (m) Add: Adjustment for options relating to warrants, shares held in abeyance, Foreign Currency
Convertible Notes and Convertible Alternative Reference securitiesNos. 3,11,46,823 15,14,16,658
(n) the weighted average number of ordinary shares for diluted ePs Nos. 273,71,61,530 284,29,59,525
(o) the weighted average number of ‘A’ ordinary shares for Basic ePs Nos. 48,19,58,717 48,19,00,898
(p) Add: Adjustment for ‘A’ ordinary shares held in abeyance Nos. 2,47,798 3,05,518
(q) the weighted average number of ‘A’ ordinary shares for diluted ePs Nos. 48,22,06,515 48,22,06,416
(r) share of Profit for ordinary shares for diluted ePs ` in crores 8,469.38 11,573.37
(s) share of Profit for 'A' ordinary shares for diluted ePs * ` in crores 1,496.88 1,967.83
(t) earnings Per ordinary share (diluted) ` 30.94 40.71
(u) earnings Per 'A' ordinary share (diluted) ` 31.04 40.81
* 'A' ordinary share holders are entitled to receive dividend @ 5% points more than the aggregate rate of dividend determined by the Company on ordinary shares for the financial year.

188
Notes FoRMING PARt oF CoNsolIdAted FINANCIAl stAteMeNts
68th ANNUAL REPORT 2012-13
(` in crores)
As atMarch 31, 2013
As atMarch 31, 2012
29. Contingent liabilities, commitments (to the extent not provided for) :
description of claims and assertions where a potential loss is possible, but not probable is reported under notes (1), (2) and (3) below :
(1) Claims against the company not acknowledged as debt 1,698.03 1,020.03
(2) Provision not made for income tax matters in dispute 121.49 183.14 (3) the claims / liabilities in respect of excise duty, sales tax and other matters where the issues were decided in
favour of the Company for which department is in further appeal 74.91 73.50
(4) the Company has given guarantees for liability in respect of receivables assigned by way of securitisation 1,249.21 2,059.79 (5) other money for which the Company is contingently liable :
(i) In respect of bills discounted and export sales on deferred credit 493.66 248.55
(ii) Cash margin / collateral 203.31 251.17
(iii) In respect of subordinated receivables 2.95 20.77
(iv) others 59.26 90.28 (6) estimated amount of contracts remaining to be executed on capital account and not provided for 4,105.72 6,186.47 (7) Purchase commitments 13,351.71 13,321.97
As atMarch 31, 2013
As atMarch 31, 2012
30. Disclosure in respect of leases :
(A) Finance leases :
Assets taken on lease:
(a) (i) total of minimum lease payments 56.82 52.24
the total of minimum lease payments for a period :
Not later than one year 22.78 15.17
later than one year and not later than five years 33.86 36.71
later than five years 0.18 0.36
(ii) Present value of minimum lease payments 50.55 46.43
Present value of minimum lease payments for a period :
Not later than one year 17.41 14.15
later than one year and not later than five years 32.97 31.95
later than five years 0.17 0.33 (b) A general description of the significant leasing arrangements - the Company has entered into finance
lease arrangements for computers and data processing equipments from various vendors.
(B) Operating leases :
Assets taken on lease:
(a) total of minimum lease payments 380.99 392.40
the total of minimum lease payments for a period :
Not later than one year 101.96 96.85
later than one year and not later than five years 190.08 243.08
later than five years 88.95 52.47 (b) A general description of significant leasing arrangements - the Company has entered into operating
lease arrangements for property, computers and data processing equipments from various vendors.

189
Notes FoRMING PARt oF CoNsolIdAted FINANCIAl stAteMeNts
CoRPoRAte oVeRVIeW FINANCIAl HIGHlIGHts FINANCIAL STATEMENTSstAtUtoRY RePoRts
Consolidated Financials (160-196)
(` in crores)
(B) Transactions with the related parties Joint Venture Associates Key Management Personnel
2012-2013 Total
Purchase of goods 1,463.18 2,936.80 - 4,399.98 1 ,864.21 4 ,125.87 - 5 ,990.08
sale of goods (inclusive of sales tax) 311.60 126.80 - 438.40 239.55 478.27 - 717.82
services received 0.26 26.26 39.98 66.50 0 .30 60.76 76.83 137.89
services rendered 66.18 13.14 - 79.32 4 .33 20.56 - 24.89
Redemption / buy back of investments - 31.00 - 31.00 - - - -
Finance given (including loans and equity) 35.51 0.01 - 35.52 - - - -
Finance given, taken back (including loans and equity) - 23.83 - 23.83 - - - -
Finance taken (including loans and equity) - 50.00 - 50.00 - 94.00 - 94.00
Finance taken, paid back (including loans and equity) - 50.50 - 50.50 - 71.00 - 71.00
Interest / dividend paid/(received) (net) (18.78) 210.48 - 191.70
(16.45) 232.50 - 216.05
(C) Balances with the related partiesAmount Receivable 71.78 14.25 - 86.03
2 .27 73.73 - 76.00 Amount Payable - 85.36 - 85.36
56.34 108.69 - 165.03 Amount Receivable (in respect of loans, interest & dividend) 162.57 3.80 - 166.37
151.88 27.63 0 .09 179.60 Amount Payable (in respect of loans, interest & dividend) - 29.50 - 29.50
- 30.20 - 30.20 Bills discounted (in respect of amount receivable) - 5.12 - 5.12
- 25.53 - 25.53 Bank Guarantee / other assets given as security - 3.00 - 3.00
- 3 .00 - 3 .00
(D) Disclosure in respect of material transactions with related parties 2012 - 2013 2011 - 2012
(i) Purchase of Goods tata Cummins ltd 2,298.91 3,267.67 Fiat India Automobiles ltd 1,463.18 1,864.21 tata AutoComp systems ltd 425.80 561.80
(ii) sale of Goods Fiat India Automobiles ltd 311.11 238.99 Nita Company ltd 94.19 168.75 tata Hitachi Construction Machinery Co ltd 31.56 58.10
(iii) services received tata sons ltd 26.11 60.76 Fiat India Automobiles ltd 0.24 -
(iv) services rendered suzhou Chery Jaguar land Rover trading Co ltd 37.25 - Fiat India Automobiles ltd 28.93 4.15 tata Hitachi Construction Machinery Co ltd 10.34 12.20 tata sons ltd 1.35 0.57 tata Cummins ltd - 5.76
(v) Redemption / buy back of Investments tata AutoComp systems ltd 21.00 - tata sons ltd 10.00 -
(vi) Finance given including loan and equity suzhou Chery Jaguar land Rover trading Co ltd 35.13 - Automobile Corporation of Goa ltd 0.01 -
(vii) Finance given, taken back (including loans and equity) tata AutoComp systems ltd 23.83 - (viii) Finance taken including loan and equity Automobile Corporation of Goa ltd 50.00 59.00 (ix) Finance taken, paid back (including loans and equity) Automobile Corporation of Goa ltd 50.50 36.00 (x) Interest/dividend paid/(received)
dividend paid tata sons limited 282.99 290.77 dividend received tata Cummins ltd (36.00) (27.00) dividend received tata sons limited (11.20) (10.60) Interest paid Fiat India Automobiles ltd 75.96 42.74 Interest received Fiat India Automobiles ltd (93.47) (59.19)
31. Related party disclosures for the year ended March 31, 2013(A) Related parties and their relationship
Associates : Joint Ventures : Key Management Personnel :
tata AutoComp systems ltd Fiat India Automobiles ltd. Mr. Karl slym (w.e.f. september 13, 2012)tata Cummins ltd tata HAl technologies ltd Mr. R Pisharody (w.e.f. June 21, 2012)tata sons ltd (Investing Party) Chery Jaguar land Rover Automotive Co ltd Mr. s B Borwankar (w.e.f. June 21, 2012)Nita Company ltd (incorporated in November 2012) Mr. P M telang (upto June 21, 2012)tata Precision Industries (India) ltd suzhou Chery Jaguar land Rover trading Co ltdAutomobile Corporation of Goa ltd In Subsidiary Companies :Jaguar Cars Finance limited dr. Ralf spethtata Hitachi Construction Machinery Company ltd(formerly known as telco Construction equipment Company ltd)spark 44 limited
Note : Current year figures are shown in bold and comparative figures for the previous year are shown below the current year.

190
Notes FoRMING PARt oF CoNsolIdAted FINANCIAl stAteMeNts
68th ANNUAL REPORT 2012-13
32. Consolidated segment information for the year ended March 31, 2013 (` in crores)
Primary segment Automotive Others Inter-Segment Eliminations
Total Tata Vehicles /
spares and financing thereof *
Jaguar and Land Rover
Intra-Segment Eliminations
Total
(a) Revenueexternal sales and income from other operations 50,821.12 136,822.17 - 187,643.29 1,174.34 - 188,817.63
59,846.67 104,750.93 - 164,597.60 1,056.89 - 165,654.49 Inter segment / Intra segment sales and other income 98.87 - (93.31) 5.56 1,091.58 (1,097.14) -
74.57 - (67.89) 6.68 891.69 (898.37) - Total revenue 50,919.99 136,822.17 (93.31) 187,648.85 2,265.92 (1,097.14) 188,817.63
59,921.24 104,750.93 (67.89) 164,604.28 1,948.58 (898.37) 165,654.49
(b) Segment results before other income, finance cost, tax and exceptional items 1,736.89 14,975.61 - 16,712.50 375.68 (110.18) 16,978.00
4,152.00 12,359.45 - 16,511.45 294.88 (120.47) 16,685.86
(c) (i) other income 811.53 661.77
(ii) Finance cost (3,553.34) (2,982.22)
(iii) exceptional items :- exchange loss (net) on revaluation of foreign currency borrowings, deposits (515.09) and loans (654.11)
- Impairment of Intangibles and other costs (87.62) (177.43)
(d) Profit before tax 13,633.48 13,533.87
tax expense 3,770.99 (40.04)
(e) Profit after tax 9,862.49 13,573.91
(f) Segment assets 55,892.67 93,680.66 - 149,573.33 1,632.27 (692.66) 150,512.94 51,793.17 71,915.41 (40.09) 123,668.49 1,482.34 (568.02) 124,582.81
(g) Segment liabilities 14,744.40 52,422.39 - 67,166.79 660.58 (168.05) 67,659.32 13,730.61 40,649.75 (40.09) 54,340.27 501.59 (153.90) 54,687.96
(h) Other information(a) depreciation and amortisation expense 2,250.85 5,303.43 - 7,554.28 15.02 - 7,569.30
2,043.96 3,570.48 - 5,614.44 10.94 - 5,625.38 (b) Capital expenditure 3,317.49 18,161.52 (0.94) 21,478.07 40.78 (110.76) 21,408.09
3,700.02 11,322.93 - 15,022.95 5.16 (121.01) 14,907.10
(i) Segment assets exclude:(i) deferred tax assets 4,428.93
4,539.33 (ii) Current and non-current investments 9,057.72
8,917.71 (iii) Income tax assets (net of provision) including
MAt credit 2,437.38 2,437.25
(iv) other unallocated assets 3,589.48 4,454.11
19,513.51 20,348.40
* tata Vehicles includes tata daewoo and Fiat traded vehicles

191
Notes FoRMING PARt oF CoNsolIdAted FINANCIAl stAteMeNts
CoRPoRAte oVeRVIeW FINANCIAl HIGHlIGHts FINANCIAL STATEMENTSstAtUtoRY RePoRts
Consolidated Financials (160-196)
(` in crores)
(j) Segment liabilities exclude: (i) Minority interest 370.48
307.13 (ii) long-term borrowings 32,110.07
27,962.48 (iii) short-term borrowings 11,612.21
10,741.59 (iv) Current maturities of long term debt 9,869.10
8,444.89 (v) deferred tax liability 2,019.49
2,165.07 (vi) Proposed dividend and tax thereon 754.69
1,487.00 (vii) Provision for income tax 1,792.02
1,311.71 (viii) other unallocated liabilities 6,201.77
5,124.88 64,729.83
57,544.75
(B) Secondary segment United Rest of Rest of States UK Europe India China World Total
Revenue from external customers 18,941.79 22,366.90 22,263.90 44,783.22 44,695.08 35,766.74 1,88,817.63 15,813.26 18,092.61 18,909.47 54,123.98 29,726.40 28,988.77 1,65,654.49
Carrying amount of segment assets 3,698.94 73,671.26 2,887.54 52,753.50 6,656.36 10,845.34 1,50,512.94 4,942.36 50,151.01 5,736.44 48,528.88 5,000.15 10,223.97 1,24,582.81
Capital expenditure 3.97 17,918.84 27.51 3,166.75 110.53 180.49 21,408.09 9.39 11,154.88 34.04 3,433.72 118.71 156.36 14,907.10
Notes: (1) the Company has disclosed business segment as primary segment. Automotive segment consists of business of automobile products consisting of all types of commercial and passenger
vehicles including financing of the vehicles sold by the Company, wherever applicable. others primarily include engineering solutions and software operations. (2) segment revenues, expenses and results include transfer between business segments. such transfers are undertaken either at competitive market prices charged to unaffiliated customers
for similar goods or at contracted rates. these transfers are eliminated on consolidation.

192
Notes FoRMING PARt oF CoNsolIdAted FINANCIAl stAteMeNts
68th ANNUAL REPORT 2012-13
33. (a) Defined benefit plans / Long term compensated absences (` in crores)
As at / for the year ended on March 31,Gratuity, Superannuation and BKY / PSY Compensated Absences Post-retirement Medicare scheme2013 2012 2011 2010 2009 2013 2012 2011 2010 2009 2013 2012 2011 2010 2009
(i) Components of employer expenseCurrent service cost 52.29 46.66 35.79 31.60 31.60 34.43 27.95 22.29 18.66 18.31 4.06 4.22 3.67 3.27 2.79 Interest cost 59.81 55.26 47.96 44.96 43.98 20.59 17.83 14.07 12.16 12.53 8.34 8.14 7.23 7.05 5.80 expected return on plan assets (53.38) (49.74) (44.70) (42.18) (38.49) - - - - - - - - - - Past service cost - - 0.07 0.57 3.07 - - - - - - - - - - Actuarial losses / (gains) 4.42 21.81 59.49 50.90 (5.57) 6.07 23.23 40.45 29.16 (8.89) 2.00 (6.02) 3.80 (0.14) 10.57Total expense recognised in the Profit and Loss Statement in Note 25(b), page 186: 63.14 73.99 98.61 85.85 34.59 61.09 69.01 76.81 59.98 21.95 14.40 6.34 14.70 10.18 19.16
(b) & (c) (a) (c) (ii) Actual contribution and benefit
paymentsActual benefit payments 81.43 56.26 64.43 63.95 67.01 41.29 32.26 33.00 23.60 29.55 4.07 3.90 4.13 4.38 4.51Actual contributions 67.64 67.57 84.77 86.78 37.10 41.29 32.26 33.00 23.60 29.55 4.07 3.90 4.13 4.38 4.51
(iii) Net asset / (liability) recognised in Balance SheetPresent value of defined Benefit obligation 809.10 753.37 688.63 607.16 574.18 282.53 262.73 225.76 181.95 154.81 110.51 100.18 97.74 87.17 85.18Fair value of plan assets 734.24 674.01 616.11 548.41 515.83 - - - - - - - - - - Net asset / (liability) recognised in Balance Sheet (74.86) (79.36) (72.52) (58.75) (58.35) (282.53) (262.73) (225.76) (181.95) (154.81) (110.51) (100.18) (97.74) (87.17) (85.18)
experience adjustment on plan liabilities (23.56) (7.73) (37.41) (4.41) (42.32) N/A N/A N/A N/A N/A 8.76 (2.83) 5.32 0.39 4.87experience adjustment on plan assets 20.94 (3.16) 2.72 (5.11) 10.60 N/A N/A N/A N/A N/A - - - - -
(iv) Change in Defined Benefit Obligations (DBO)Present value of dBo at beginning of year 753.37 688.63 607.16 574.18 558.32 262.73 225.76 181.95 154.81 162.41 100.18 97.74 87.17 85.18 70.53 liability on acquisitions 0.04 0.43 - - - - 0.22 - - - - - - - -Current service cost 52.29 46.66 35.79 31.60 31.60 34.43 27.95 22.29 18.66 18.31 4.06 4.22 3.67 3.27 2.79 Interest cost 59.81 55.26 47.96 44.96 43.98 20.59 17.83 14.07 12.16 12.53 8.34 8.14 7.23 7.05 5.80 Plan amendments - - - 0.65 3.07 - - - - - - - - - - Actuarial (gains) / losses 25.02 18.65 62.15 46.15 4.22 6.07 23.23 40.45 29.16 (8.89) 2.00 (6.02) 3.80 (0.14) 10.57Benefits paid (81.43) (56.26) (64.43) (63.95) (67.01) (41.29) (32.26) (33.00) (23.60) (29.55) (4.07) (3.90) (4.13) (4.38) (4.51)sale of stake in subsidiary - - - (26.43) - - - - (9.24) - - - - (3.81) - Present value of DBO at the end of year 809.10 753.37 688.63 607.16 574.18 282.53 262.73 225.76 181.95 154.81 110.51 100.18 97.74 87.17 85.18
(v) Change in fair value of assetsPlan assets at beginning of year 674.01 616.11 548.41 515.83 497.46 - - - - - - - - - -liability on acquisitions 0.04 - - - - - - - - - - - - - -Actual return on plan assets 73.98 46.59 47.36 37.43 48.28 - - - - - - - - - -Actual Company contributions 67.64 67.57 84.77 86.78 37.10 41.29 32.26 33.00 23.60 29.55 4.07 3.90 4.13 4.38 4.51Benefits paid (81.43) (56.26) (64.43) (63.95) (67.01) (41.29) (32.26) (33.00) (23.60) (29.55) (4.07) (3.90) (4.13) (4.38) (4.51)sale of stake in subsidiary - - - (27.68) - - - - - - - - - - -Plan assets at the end of year 734.24 674.01 616.11 548.41 515.83 - - - - - - - - - -
(vi) Actuarial assumptionsdiscount rate (%) 6.75-8.35 6.75-8.50 6.75-8.50 6.75-8.50 6.75-8.50 8.35 8.50 8.50 8.50 8.50 8.35 8.50 8.50 8.50 8.50expected return on plan assets (%) 8.00 8.00 8.00 8.00 8.00 N/A N/A N/A N/A N/A N/A N/A N/A N/A N/AMedical cost inflation (%) N/A N/A N/A N/A N/A N/A N/A N/A N/A N/A 5.00 4.00 4.00 4.00 4.00
(vii) The major categories of plan assets as percentage to total plan assetsdebt securities 73% 77% 75% 76% 78% N/A N/A N/A N/A N/A N/A N/A N/A N/A N/A
Balance with approved Insurance companies 24% 19% - - - N/A N/A N/A N/A N/A N/A N/A N/A N/A N/A
Balances with banks 4% 4% 25% 24% 22% N/A N/A N/A N/A N/A N/A N/A N/A N/A N/A (viii) Effect of one percentage point change
in assumed medical inflation rate One percentage point increase in
medical inflation rate One percentage point decrease in
medical inflation rate2013 2012 2011 2010 2009 2013 2012 2011 2010 2009
Revised dBo 121.00 108.44 104.57 100.15 93.68 101.33 81.62 88.49 82.98 77.74 Revised service cost 4.86 4.88 4.30 3.78 3.21 3.41 3.04 3.16 2.80 2.50 Revised interest cost 9.30 8.85 7.97 7.78 5.96 7.54 6.81 6.59 6.42 5.30
(a) defined contribution plans- the Company’s contribution to defined contribution plan aggregated ` 235.60 crores (2011-12 ` 250.60 crores) for the year ended March 31, 2013 has been recognised in the Profit and loss
statement in note 25(b) on page 186. (b) the expected rate of return on plan assets is based on market expectation, at the beginning of the year, for returns over the entire life of the related obligation. (c) the assumption of future salary increases, considered in actuarial valuation, take account of inflation, seniority, promotion and other relevant factors, such as supply and demand in the employment
market. (d) the Company expects to contribute ` 92.40 crores to the funded pension plans in the year 2013-2014.

193
Notes FoRMING PARt oF CoNsolIdAted FINANCIAl stAteMeNts
CoRPoRAte oVeRVIeW FINANCIAl HIGHlIGHts FINANCIAL STATEMENTSstAtUtoRY RePoRts
Consolidated Financials (160-196)
As at / for the year ended on March 31, 2013 2012 2011 2010 2009
i Components of employer expenseCurrent service cost 37.24 21.18 20.32 17.54 14.75 Interest cost 9.30 10.26 10.28 8.85 7.64 Past service cost (6.17) - - - - Actuarial losses (62.40) (8.39) (23.38) 19.75 19.96 Total expense recognised in the Profit and Loss Statement in Note 25(b), page 186 : (22.03) 23.05 7.22 46.14 42.35
ii Actual Contribution and Benefit PaymentsActual benefit payments 87.97 14.64 8.96 16.26 10.16 Actual contributions 87.97 14.64 8.96 16.26 10.16
iii Net liability recognised in Balance SheetPresent value of defined Benefit obligation 164.44 252.58 220.62 217.23 174.83 Fair value of plan assets - - - - -
Net liability recognised in Balance Sheet (164.44) (252.58) (220.62) (217.23) (174.83)
experience adjustment on plan liabilities 79.62 19.01 5.56 (20.09) (15.42)experience adjustment on plan assets - - - - -
iv Change in Defined Benefit ObligationsPresent Value of dBo at the beginning of the year 252.58 220.62 217.23 174.83 156.50 Current service cost 37.24 21.18 20.32 17.54 14.75 Interest cost 9.30 10.26 10.28 8.85 7.64 Past service cost (6.17) - - - - Actuarial losses (62.40) (8.39) (23.38) 19.75 19.96 Benefits paid (87.97) (14.64) (8.96) (16.26) (10.16)exchange fluctuation 21.86 23.55 5.13 12.52 (13.86)Present Value of DBO at the end of the year 164.44 252.58 220.62 217.23 174.83
v Change in fair value of assetsPlan assets at the beginning of the year N/A N/A N/A N/A N/A Acquisition adjustment N/A N/A N/A N/A N/A Actual return on plan assets N/A N/A N/A N/A N/A Actual Company contributions 87.97 14.64 8.96 16.26 10.16 Benefits paid (87.97) (14.64) (8.96) (16.26) (10.16)Plan assets at the end of the year - - - - -
vi Actuarial assumptionsdiscount rate 3.07% 4.03% 4.53% 4.84% 5.00%expected return on plan assets N/A N/A N/A N/A N/A Medical cost inflation N/A N/A N/A N/A N/A
33. (b) Details of Severance Indemnity plan applicable to Tata Daewoo Commercial Vehicle Co. Ltd. and Tata Daewoo Commercial Vehicle Sales and Distribution Co. Ltd., Korea.
(` in crores)
the assumption of future salary increases, considered in actuarial valuation, take account of inflation, seniority, promotion and other relevant factors, such as supply and demand in the employment market.

194
Notes FoRMING PARt oF CoNsolIdAted FINANCIAl stAteMeNts
68th ANNUAL REPORT 2012-13
Post-retirement Pension scheme Post-retirement Medicare schemeAs at / for the year ended on March 31, 2013 2012 2011 2010 2009 2013 2012 2011 2010 2009
(i) Components of employer expenseCurrent service cost 1,009.27 780.53 752.63 480.03 483.89 0.52 0.46 0.64 0.53 0.47 Interest cost 2,177.34 1,829.87 1,529.40 1,555.04 1,263.37 0.60 0.53 0.71 0.61 0.47 expected return on plan assets (1,917.76) (1,833.99) (1,711.20) (1,314.87) (1,713.44) - - - - - Amortisation of past service cost 49.10 112.99 35.41 13.63 - - - - - - Curtailment - - - (5.45) - - - - - - settlement - - (1.20) - - (0.52) - - - - Asset restriction - - - - (14.62) - - - - - Actuarial losses - - - - 16.25 - - - - - Total expense recognised in the Profit and Loss Statement in Note 25(b), page 186 : 1,317.95 889.40 605.04 728.38 35.45 0.60 0.99 1.35 1.14 0.94
(ii) Actual contribution and benefit paymentsActual benefit payments 1,112.62 866.72 910.70 826.05 563.68 0.09 - - - - Actual contributions 1,442.36 1,760.55 1,545.97 398.06 552.64 3.10 - - - -
(iii) Amount recognised in Pension ReserveActuarial loss 3,972.49 1,490.14 1,391.86 642.93 2,585.69 0.86 0.84 (4.39) 1.67 - Movement in restriction of pension assets (235.08) (42.75) 888.67 (481.33) (959.22) - - - - - onerous obligation (1,056.73) (37.41) - - - - - - - - economic benefit from pre payment of normal contribution 300.08 (266.44) - - - - - - - - deferred tax (626.73) (1,272.50) - - - - - - - - exchange fluctuation - - - 102.13 (169.26) - - - - - Amount recognised in Pension Reserve 2,354.03 (128.96) 2,280.53 263.73 1,457.21 0.86 0.84 (4.39) 1.67 -
(iv) Net liability recognised in Balance SheetPresent value of defined Benefit obligation 49,426.92 40,065.65 30,723.35 26,340.24 22,119.55 9.60 10.76 7.69 10.76 8.65 Fair value of plan assets 44,046.30 38,372.91 29,816.11 25,908.86 22,591.74 - - - - - Restriction of pension asset (6.16) (229.00) (235.84) (17.64) (290.37) - - - - - Unrecognised actuarial gains and losses - - - - (3.42) - - - - - onerous obligation - (1,001.94) (902.99) (233.72) (436.01) - - - - - economic benefit from pre payment of normal contribution - 284.52 (15.28) 5.10 - - - - - - Net asset recognised in balance sheet 3.61 15.49 6.72 3.06 261.67 - - - - - Net (Liability) recognised in Balance Sheet (5,390.39) (2,654.65) (2,068.07) (680.70) (519.28) (9.60) (10.76) (7.69) (10.76) (8.65)experience adjustment on plan liabilities 56.75 610.62 696.80 4,404.25 241.26 - - - - -experience adjustment on plan assets (3,343.01) (1,392.44) 217.97 3,826.63 4,890.97 - - - - -
(v) Change in Defined Benefit Obligations (DBO)Present Value of dBo at beginning of year 40,065.65 30,723.35 26,340.24 22,119.55 - 10.32 7.69 10.76 8.65 - liability on acquisition - - - - 26,595.11 - - - - 7.59 Current service cost 1,009.27 780.53 752.63 480.03 483.89 0.52 0.46 0.64 0.53 0.47 Interest cost 2,177.34 1,829.87 1,529.40 1,555.04 1,263.37 0.60 0.53 0.71 0.61 0.47 Amendments 49.10 51.53 35.41 12.25 - - - - - - Actual member contributions 59.93 112.99 46.39 147.81 237.87 - - - - - Actuarial losses 7,314.38 2,797.44 1,608.01 4,902.21 (2,462.41) 0.86 0.84 (4.39) 1.67 (1.02)Benefits paid (1,112.62) (866.72) (910.70) (826.05) (563.69) (0.09) - - - - expenses paid (0.77) (1.22) (0.99) (0.15) (0.07) - - - - - Plan combinations - - - 2.72 57.41 - - - - - Plan curtailment - - - (5.45) - - - - - - Plan settlement - - (9.42) (0.68) - (3.53) - - - - exchange fluctuation (135.36) 4,637.88 1,332.38 (2,047.04) (3,491.93) 0.92 0.80 (0.03) (0.70) 1.14 Present Value of DBO at the end of year 49,426.92 40,065.65 30,723.35 26,340.24 22,119.55 9.60 10.32 7.69 10.76 8.65
(vi) Change in fair value of assetsPlan assets at beginning of year 38,372.91 29,816.11 25,908.88 22,591.74 - N/A N/A N/A N/A N/A Plan assets on acquisition - - - - 29,341.88 N/A N/A N/A N/A N/A Actual return on plan assets 5,259.65 3,141.29 1,927.28 5,574.15 (3,520.28) N/A N/A N/A N/A N/A Actual Company contributions 1,442.36 1,760.55 1,545.97 398.06 552.64 3.10 N/A N/A N/A N/A Actual member contributions 59.93 51.53 46.39 147.81 237.87 N/A N/A N/A N/A N/A Benefits paid (1,112.62) (866.72) (910.70) (826.04) (563.68) (0.09) N/A N/A N/A N/A expenses paid (0.77) (1.22) (0.99) (0.15) (0.07) N/A N/A N/A N/A N/A Plan combinations - - - - 54.50 N/A N/A N/A N/A N/A Plan settlement - - (8.22) (0.68) - (3.01) N/A N/A N/A N/A exchange fluctuation 24.84 4,471.37 1,307.50 (1,976.01) (3,511.12) N/A N/A N/A N/A N/A Plan assets at the end of year 44,046.30 38,372.91 29,816.11 25,908.88 22,591.74 N/A N/A N/A N/A N/A
(vii) Actuarial assumptionsdiscount rate (%) 3.69-4.40 4.38-5.10 5.19- 5.50 5.50- 5.60 6.70-7.16 4.10 4.88 5.74 6.22 7.77 Inflation (%) 2.00-3.40 2.00-3.30 2.00-3.40 2.00-3.50 2.52-3.30 N/A N/A N/A N/A N/A expected return on plan assets (%) 4.75-6.34 4.85-6.34 5.75-6.57 6.50 5.80-6.40 N/A N/A N/A N/A N/A Medical cost inflation (%) N/A N/A N/A N/A N/A 4.50 4.50 4.20 7.80 4.90-8.10
(viii) The major categories of plan assets as percentage to total plan assetsequity securities 17%-38% 19%-38.4% 20%-40% 39%-53% 27%-36% N/A N/A N/A N/A N/A debt securities 38%-68% 38.4%-67% 40%-63% 39%-56% 36%-62% N/A N/A N/A N/A N/A other 15%-24% 8%-23.2% 2.4%-20% 1%-23% 3%-29% N/A N/A N/A N/A N/A
(` in crores)
(a) defined Contribution Plans- Jaguar and land Rover group’s contribution to defined contribution plan aggregated ` 100.60 crores (` 82.45 crores for the year ended March 31, 2012) has been recognised in the Profit and loss statement in note 25(b) on page 186. (b) the expected rate of return on plan assets is based on market expectation, at the beginning of the year, for returns over the entire life of the related obligation. (c) the assumption of future salary increases, considered in actuarial valuation, take account of inflation, seniority, promotion and other relevant factors, such as supply and demand in the employment market. (d) the Company expects to contribute ` 1,751.20 crores to the funded pension plans in the year 2013-2014.
33. (c) Details of Defined benefit plans applicable to Jaguar and Land Rover group

195
Notes FoRMING PARt oF CoNsolIdAted FINANCIAl stAteMeNts
CoRPoRAte oVeRVIeW FINANCIAl HIGHlIGHts FINANCIAL STATEMENTSstAtUtoRY RePoRts
Consolidated Financials (160-196)
(` in crores)
2012 - 2013 2011 - 2012
34. (i) Movement of provision for warranty and product liabilityopening balance 5,252.17 4,126.19 Add: Provision for the year (net) (including additional provision for earlier years) 4,188.74 3,427.45 less: Payments / debits (net of recoveries from suppliers) (2,742.34) (2,857.76)Foreign currency translation (28.11) 556.29 Closing balance 6,670.46 5,252.17
Current portion 3,110.02 2,731.40 Non-current portion 3,560.44 2,520.77
6,670.46 5,252.17 The provision is expected to be utilized for settlement of warranty claims within a period of 5 years.
(ii) Movement of provision for redemption of FCCN / CARS opening balance 912.50 801.09 Foreign currency exchange loss 82.97 100.99 Premium on redemption of FCCN / CARs (including withholding tax) (843.37) (0.97)Reversal of provision for premium due to conversion of FCCN / CARs (19.92) - Provision / (reversal of provision) for withholding tax upon conversion / redemption / foreign currency exchange of FCCN / CARs (97.97) 11.39 Closing balance 34.21 912.50
Current portion - 855.73 Non-current portion 34.21 56.77
34.21 912.50
(iii) Movement of provision for residual riskopening balance 130.98 50.23 Add: Provision / (reversal of provision) for the year (6.02) 42.57 less: Payments / debits (7.74) - Foreign currency translation 2.45 38.18 Closing balance 119.67 130.98
Current portion 13.40 17.58 Non-current portion 106.27 113.40
119.67 130.98 In certain markets, some subsidiaries are responsible for the residual risk arising on vehicles sold by dealers on a leasing arrangement. the provision is based on the latest available market expectations of future residual value trends. the timing of the outflows will be at the end of the lease arrangements – being typically up to three years.
(iv) Movement of provision towards environmental costopening balance 164.86 130.90 Add: Provision for the year (net) 25.79 19.47 less: Payments (12.04) (4.96)Foreign currency translation 0.71 19.45 Closing balance 179.32 164.86
Current portion - - Non-current portion 179.32 164.86
179.32 164.86
this provision relates to various environmental remediation costs such as asbestos removal and land clean up. the timing of when these costs will be incurred is not known with certainty.

196
Notes FoRMING PARt oF CoNsolIdAted FINANCIAl stAteMeNts
68th ANNUAL REPORT 2012-13
(b) the share of profit / (loss) in respect of investments in associate companies include figures which are considered as per unaudited financial statements for the year ended March 31, 2013, as per details given below :
(c) during the year ended March 31, 2013 :
(i) Jaguar land Rover Automotive Plc., an indirect subsidiary of the Company, has issued Us$ 500 million (approximately ` 2,690.94 crores), 5.625% senior Notes due 2023.
(ii) Jaguar land Rover Automotive Plc. and its subsidiaries, have invested CNY 700 million (approximately ` 604.45 crores) in the joint venture company in China.
(d) Previous year figures have been regrouped / reclassified whereever necessary to correspond with the current year classification / disclosure
(e) Capital Work-in-progress as at March 31, 2013 includes building under construction at singur in West Bengal of ` 309.88 crores for the purposes of manufacturing automobiles. In october 2008, the Company moved the Nano project from singur in West Bengal to sanand in Gujarat. In June 2011, the newly elected Government of West Bengal (state Government) enacted a legislation to cancel land lease agreement. the Company challenged the legal validity of the legislation. In June 2012, the High Court of Calcutta ruled against the validity of the legislation and restored Company’s rights under the land lease agreement. the state Government has filed an appeal in the supreme Court of India, which is pending disposal. Based on management’s assessment no provision is considered necessary to the carrying cost of buildings at singur.
(f ) Current year figures are shown in bold prints.
(` in crores)
Net Worth As at March 31, 2013
Total Revenue for the year ended March 31, 2013
Net Increase / (Decrease) in Cash & Cash equivalent during 2012-2013
(i) Subsidiaries : tata Motors (sA) (Proprietary) ltd 9.79 103.17 (0.55) tata Hispano Motors Carrocera s.A (545.41) 138.09 19.41 tata Motors european technical Centre Plc 49.79 300.60 (115.73) Miljobil Greenland As - - (9.59) trilix s.r.l 10.75 58.24 (0.06) tata Precision Industries Pte ltd 1.08 0.03 (0.59)
(474.00) 600.13 (107.11)(ii) Joint venture : Fiat India Automobiles ltd 525.43 1,757.19 (154.29) Total (i + ii) 51.43 2,357.32 (261.40)For the year ended / as at March 31, 2012 230.67 2,306.22 (46.74)
35. The additional disclosure as required by AS 7 (Revised) on Construction Contracts: (a) Advance received is ` 14.01 crores (as at March 31, 2012 ` 27.75 crores) (b) Retention money is ` 13.28 crores (as at March 31, 2012 ` 19.33 crores) (c) Contract revenue recognised during the year is ` 54.36 crores (2011-12 ` 119.51 crores) (d) Aggregate amount of costs incurred and recognised profits (less recognised losses) ` 259.02 crores (as at March 31, 2012
` 381.25 crores)
36. Other Notes
(a) the following subsidiaries / joint venture have been considered on unaudited basis. details for the same as per individual entity’s financials are as under :
(` in crores)
Profit / (Loss) for the year ended
March 31, 2013
tata Hitachi Construction Machinery Company ltd (53.95)Nita Company ltd. 5.37
(48.58)For the year ended March 31, 2012 (17.65)

197
Subsidiary Companies Financial
Highlights (197-199)
CORPORATE OVERVIEW FINANCIAL HIGHLIGHTS FINANCIAL STATEMENTSSTATUTORY REPORTS
Sr.
No
Subs
idia
ry
Coun
try
of
In
corp
orat
ion
Repo
rtin
g cu
rren
cy #
Shar
e ca
pita
l (in
cl. a
dvan
ces
tow
ards
ca
pita
l whe
re
appl
icab
le)
Rese
rves
and
Su
rplu
s To
tal
Ass
ets
Tota
l Li
abili
ties
Turn
over
Pr
ofit /
(Los
s)
Befo
re T
ax T
ax E
xpen
se /
(Cre
dit)
Pr
ofit /
(Los
s)
afte
r tax
Profi
t/ (L
oss)
for t
he p
erio
d/
year
*
Prop
osed
di
vide
nd a
nd
tax
ther
eon
Inve
stm
ents
(e
xcep
t in
case
of
inve
stm
ent
in th
e
subs
idia
ries)
1TA
L M
anuf
actu
ring
Solu
tions
Ltd
Indi
a IN
R 6
5.00
1
9.68
3
38.9
0 2
54.2
2 2
13.0
0 (2
1.99
) 0
.04
(22.
03)
(22.
03)
- -
2TM
L D
rivel
ines
Ltd
Indi
a IN
R 7
7.00
6
73.4
6 9
38.0
4 1
87.5
8 4
00.7
9 1
18.7
6 3
9.88
7
8.88
7
8.88
3
1.53
1
14.4
2
3Co
ncor
de M
otor
s (In
dia)
Ltd
Indi
a IN
R 2
8.05
2
7.59
2
77.5
5 2
21.9
1 7
64.5
6 (1
5.81
) (0
.47)
(15.
34)
(15.
34)
- -
4Sh
eba
Prop
ertie
s Lt
dIn
dia
INR
75.
00
91.
36
169
.57
3.2
1 2
.26
7.3
7 0
.97
6.4
0 6
.40
- 1
16.4
2
5Ta
ta D
aew
oo C
omm
erci
al V
ehic
le C
o. L
tdSo
uth
Kore
a KR
W 5
7.35
1
,121
.80
2,9
18.0
3 1
,738
.88
4,0
23.3
2 (1
08.7
1) (1
8.91
) (8
9.80
) (8
9.80
) -
2.39
6Ta
ta Te
chno
logi
es L
tdIn
dia
INR
43.
20
665
.28
991
.50
283
.20
818
.03
262
.04
60.
82 2
01.2
2 2
01.2
2 80
.01
284
.96
7Ta
ta M
otor
s In
sura
nce
Brok
ing
& A
dvis
ory
Serv
ices
Ltd
Indi
a IN
R 2
.50
9.3
4 2
4.60
1
2.76
5
6.06
7
.05
0.8
2 6
.23
6.2
3 0
.58
2.8
0
8Ta
ta M
otor
s Eu
rope
an Te
chni
cal C
entr
e Pl
cU
K G
BP 2
20.5
9 (1
70.8
1) 1
87.3
0 1
37.5
2 3
00.6
0 (4
8.52
) 3
.27
(51.
79)
(51.
79)
2.3
0 -
9TM
L D
istr
ibut
ion
Com
pany
Ltd
Indi
a IN
R 2
25.0
0 7
0.27
6
41.1
3 3
45.8
6 3
,255
.68
16.
94
5.5
1 1
1.43
1
1.43
-
-
10Ta
ta M
otor
s (S
A) (
Prop
rieta
ry) L
tdSo
uth
Afr
ica
ZAR
13.
00
(3.2
1) 5
9.04
4
9.25
1
03.1
7 0
.84
- 0
.84
0.8
4 -
-
11Ta
ta M
otor
s Fi
nanc
e Lt
dIn
dia
INR
1,2
30.0
0 1
,458
.61
20,
645.
65
17,
957.
04
2,7
87.4
1 4
49.5
8 1
40.2
8 3
09.3
0 3
09.3
0 1
00.7
3 1
12.0
2
12Ta
ta M
arco
polo
Mot
ors
Ltd
Indi
a IN
R 1
70.0
0 (2
4.79
) 4
02.7
5 2
57.5
4 6
56.8
4 6
.27
- 6
.27
6.2
7 -
-
13Ta
ta M
otor
s (T
haila
nd) L
tdTh
aila
nd
THB
229
.29
(435
.82)
674
.13
880
.66
392
.97
(79.
70)
- (7
9.70
) (7
9.70
) -
-
14TM
L H
oldi
ngs
Pte
Ltd,
Sin
gapo
reSi
ngap
ore
GBP
13,
843.
04
(371
.73)
13,
471.
31
- -
(232
.43)
0.3
9 (2
32.8
2) (2
32.8
2) -
-
15Ta
ta H
ispa
no M
otor
s Ca
rroc
era
S.A
Spai
n EU
RO 3
.70
(481
.05)
329
.68
807
.04
121
.00
(88.
86)
- (8
8.86
) (8
8.86
) -
-
16Tr
ilix
S.r.l
Italy
EU
RO 0
.61
10.
14
37.
26
26.
51
58.
24
4.3
5 1
.23
3.1
2 3
.12
- -
17Ta
ta P
reci
sion
Indu
strie
s Pt
e Lt
dSi
ngap
ore
SGD
74.
21
(73.
13)
1.1
0 0
.02
0.0
4 (0
.05)
- (0
.05)
(0.0
5) -
-
18PT
Tat
a M
otor
s In
done
sia
Indo
nesi
aID
R 4
7.20
(3
2.16
) 2
1.60
6
.56
0.06
(3
1.19
) -
(31.
19)
(31.
19)
- -
19IN
CAT
Inte
rnat
iona
l Plc
UK
GBP
1.9
9 3
8.21
4
7.87
7
.67
- (0
.01)
- (0
.01)
(0.0
1) -
-
20Ta
ta Te
chno
logi
es In
cU
SAU
SD 2
42.5
7 (4
32.2
3) 1
94.6
5 3
84.3
1 5
87.1
6 2
6.65
1
2.44
1
4.21
1
4.21
-
-
21Ta
ta Te
chno
logi
es (C
anad
a) In
c.Ca
nada
USD
0
.01
4.1
8 1
9.27
1
5.08
5
.57
1.2
8 0
.32
0.9
6 0
.96
- -
22Ta
ta Te
chno
logi
es d
e M
exic
o, S
.A. d
e C.
V.M
exic
oU
SD 0
.84
3.0
4 1
0.65
6
.77
14.
12
(0.4
3) -
(0.4
3) (0
.43)
- -
23Ta
ta Te
chno
logi
es E
urop
e Lt
dU
KG
BP 0
.08
147
.41
361
.58
214
.09
781
.97
83.
18
16.
36
66.
82
66.
82
- -
24IN
CAT
Gm
bH.
Ger
man
yEU
RO 1
.14
13.
72
16.
41
1.5
5 0
.50
0.0
3 0
.92
(0.8
9) (0
.89)
- -
25Ta
ta Te
chno
logi
es (T
haila
nd) L
tdTh
aila
ndTH
B 6
.53
0.1
7 7
.92
1.2
2 1
0.40
1
.73
- 1
.73
1.7
3 -
-
26Ta
ta Te
chno
logi
es P
te. L
td, S
inga
pore
Sing
apor
eU
SD 2
93.1
1 3
25.2
5 6
39.7
7 2
1.41
3
6.63
1
3.81
0
.23
13.
58
13.
58
- -
27M
iljob
il G
reen
land
AS
(upt
o Au
gust
30,
201
2)N
orw
ayN
OK
--
--
-8.
19-
8.19
8.19
--
28Ja
guar
Lan
d Ro
ver A
utom
otiv
e Pl
c (fo
rmer
ly k
now
n as
Ja
guar
Land
Rove
r Plc
)U
KG
BP 1
2,31
9.70
1
,766
.76
30,
311.
59
16,
225.
13
- 3
25.0
1 9
9.74
2
25.2
7 2
25.2
7 -
-
29Ja
guar
Lan
d Ro
ver L
td (
form
erly
kno
wn
as Ja
guar
Car
s O
vers
eas H
oald
ings
Ltd
)U
KG
BP 1
2,31
4.78
1
2,82
8.71
9
3,99
2.11
6
8,84
8.62
6
2,03
0.57
7
73.8
4 4
7.29
7
26.5
5 7
26.5
5 -
6,4
33.6
5
30La
nd R
over
UK
GBP
41.
05
28,
649.
91
28,
690.
96
- 5
9,81
6.51
1
0,37
1.24
1
,834
.87
8,5
36.3
7 8
,536
.37
- 1
95.3
9
31Ja
guar
Lan
d Ro
ver E
xpor
ts L
imite
d U
KG
BP -
255
.60
23,0
83.2
0 2
2,82
7.60
83
,553
.80
92.
30
- 9
2.30
9
2.30
-
-
32Ja
guar
Lan
d Ro
ver N
orth
Am
eric
a, L
LC.
USA
USD
229
.09
(79.
86)
4,4
24.3
4 4
,275
.43
19,
366.
86
112
.58
86.
71
25.
87
25.
87
- -
33Ja
guar
Lan
d Ro
ver D
euts
chla
nd G
mbH
Ger
man
yEU
R 1
7.78
1
54.0
0 1
,644
.10
1,4
72.3
2 5
,406
.78
31.
05
14.
25
16.
80
16.
80
- -
34Ja
guar
Lan
d Ro
ver A
ustr
ia G
mbH
Aust
riaEU
R 1
.01
42.
99
245
.43
201
.43
1,0
28.1
6 5
.84
1.4
3 4
.41
4.4
1 -
-
35Ja
guar
Lan
d Ro
ver I
talia
SpA
Italy
EUR
180
.43
134
.71
902
.51
587
.37
3,7
51.8
9 2
0.05
1
4.50
5
.55
5.5
5 -
-
36Ja
guar
Lan
d Ro
ver P
ortu
gal-V
eicu
los
e Pe
cas,
LDA
.Po
rtug
alEU
R 9
.60
57.
51
131
.96
64.
85
175
.88
0.6
3 (0
.53)
1.1
6 1
.16
- -
SU
BS
IDIA
RY
CO
MP
AN
IES
: F
INA
NC
IAL
HIG
HL
IGH
TS
20
12
-13
(`
in
cro
res)

198
68th ANNUAL REPORT 2012-13
Sr.
No
Subs
idia
ry
Coun
try
of
In
corp
orat
ion
Repo
rtin
g cu
rren
cy #
Shar
e ca
pita
l (in
cl. a
dvan
ces
tow
ards
ca
pita
l whe
re
appl
icab
le)
Rese
rves
and
Su
rplu
s To
tal
Ass
ets
Tota
l Li
abili
ties
Turn
over
Pr
ofit /
(Los
s)
Befo
re T
ax T
ax E
xpen
se /
(Cre
dit)
Pr
ofit /
(Los
s)
afte
r tax
Profi
t/ (L
oss)
for t
he p
erio
d/
year
*
Prop
osed
di
vide
nd a
nd
tax
ther
eon
Inve
stm
ents
(e
xcep
t in
case
of
inve
stm
ent
in th
e
subs
idia
ries)
37Ja
guar
Lan
d Ro
ver F
ranc
e SA
SFr
ance
EUR
22.
49
55.
69
707
.12
628
.94
3,5
30.9
0 1
9.17
9
.12
10.
05
10.
05
- -
38Ja
guar
Lan
d Ro
ver A
ustr
alia
Pty
Ltd
Aust
ralia
AUD
3.7
2 1
55.7
8 1
,533
.96
1,3
74.4
6 3
,293
.62
82.
65
24.
69
57.
96
57.
96
- -
39Ja
guar
Lan
d Ro
ver A
utom
otiv
e Tr
adin
g (S
hang
hai)
Co. L
td
Chin
aCN
Y 5
8.83
3
,148
.03
10,
576.
67
7,3
69.8
1 4
3,79
3.06
4
,892
.47
1,7
73.8
6 3
,118
.61
3,1
18.6
1 -
-
40Ja
guar
Lan
d Ro
ver J
apan
Ltd
Ja
pan
JPY
27.
69
214
.48
578
.85
336
.68
1,0
92.3
0 2
2.02
5
.57
16.
45
16.
45
- -
41Ja
guar
Lan
d Ro
ver K
orea
Com
pany
Ltd
So
uth
Kore
aKR
W 0
.26
51.
28
448
.42
396
.87
1,0
72.5
3 1
8.88
3
.65
15.
23
15.
23
- -
42Ja
guar
Lan
d Ro
ver C
anad
a U
LC
Cana
daCA
D -
43.
12
832
.70
789
.58
1,8
70.6
6 1
3.10
2
.22
10.
88
10.
88
- -
43Ja
guar
Lan
d Ro
ver B
razi
l LLC
Br
azil
BRL
51.
58
95.
58
1,2
28.4
6 1
,081
.30
2,7
65.5
9 2
88.4
6 9
1.92
1
96.5
4 1
96.5
4 -
-
44Li
mite
d Li
abili
ty C
ompa
ny “J
agua
r Lan
d Ro
ver”
(Rus
sia)
Russ
iaRU
R 7
.06
867
.90
1,4
95.9
1 6
20.9
3 7
,835
.24
565
.11
119
.08
446
.03
446
.03
- -
45Ja
guar
Lan
d Ro
ver (
Sout
h A
fric
a) (P
ty) L
td
Sout
h A
fric
aZA
R -
66.
85
797
.36
730
.51
2,7
21.1
5 1
31.2
4 3
8.31
9
2.93
9
2.93
-
-
46Ja
guar
His
pani
a SL
Spai
nEU
R 6
.50
11.
77
78.
36
60.
09
210
.62
1.2
3 0
.42
0.8
1 0
.81
- -
47Ja
guar
Bel
ux N
.V.
Belg
ium
EUR
8.7
0 2
.38
99.
24
88.
16
251
.22
1.4
9 0
.51
0.9
8 0
.98
- -
48Ja
guar
Lan
d Ro
ver (
Sout
h A
fric
a) H
oldi
ngs
Ltd
UK
GBP
- 1
,605
.90
1,6
12.3
9 6
.49
- 2
4.99
7
.05
17.
94
17.
94
- -
49La
nd R
over
Gro
up L
td
Jers
eyG
BP -
- -
- -
- -
- -
- -
50La
nd R
over
Irel
and
Ltd
Irela
ndEU
R -
1.7
3 1
.73
- -
(2.0
1) 0
.19
(1.8
2) (1
.82)
- -
51La
nd R
over
Exp
orts
Ltd
(upt
o Ap
ril 1
, 201
2)U
KG
BP -
- -
- -
- -
- -
- -
52La
nd R
over
Esp
ana
SLSp
ain
EUR
300
.53
40.
77
676
.89
335
.59
1,5
76.6
1 1
0.32
3
.50
6.8
2 6
.82
- -
53Ja
guar
Lan
d Ro
ver N
eder
land
BV
Net
herla
nds
EUR
0.3
2 1
1.20
2
44.6
6 2
33.1
4 8
17.9
2 5
.07
0.7
7 4
.30
4.3
0 -
-
54La
nd R
over
Bel
ux S
A/N
VBe
lgiu
mEU
R 1
.42
6.3
1 3
59.1
0 3
51.3
7 1
,591
.28
8.7
6 3
.04
5.7
2 5
.72
- -
55Ja
guar
Lan
d Ro
ver I
ndia
Ltd
Indi
aIN
R 9
.25
(4.0
5) 5
.44
0.2
4 -
(4.0
5) -
(4.0
5) (4
.05)
- -
56La
nd R
over
Par
ts L
tdU
KG
BP -
- -
- -
- -
- -
- -
57Th
e La
nche
ster
Mot
or C
ompa
ny L
td
UK
GBP
- -
- -
- -
- -
- -
-
58Th
e D
aim
ler M
otor
Com
pany
Ltd
UK
GBP
12.
31
- 1
2.31
-
- -
- -
- -
-
59S
S Ca
rs L
td
UK
GBP
- -
- -
- -
- -
- -
-
60D
aim
ler T
rans
port
Veh
icle
s Lt
d U
KG
BP -
- -
- -
- -
- -
- -
61Th
e Ja
guar
Col
lect
ion
Ltd
UK
GBP
- -
- -
- -
- -
- -
-
62Ja
guar
Car
s (S
outh
Afr
ica)
(Pty
) Ltd
So
uth
Afr
ica
ZAR
- -
- -
- -
- -
- -
-
63Ta
ta H
ispa
no M
otor
s Ca
rroc
erie
s M
aghr
ebM
oroc
coEU
R 2
5.27
(6
8.53
) 9
6.93
1
40.1
9 4
0.65
(9
.55)
0.2
0 (9
.75)
(9.7
5) -
-
64Ta
ta D
aew
oo C
omm
erci
al V
ehic
le S
ales
and
Dis
trib
utio
n Co
. Ltd
.So
uth
Kore
aKR
W
4.0
0 2
.77
24.
88
18.
11
40.
33
(2.4
9) (0
.52)
(1.9
7) (1
.97)
- -
65PT
Tat
a M
otor
s D
istr
ibus
i Ind
ones
ia (i
ncor
pora
ted
w.e
.f Fe
brua
ry 1
1, 2
013)
Indo
nesi
aID
R1.
240.
161.
250.
17-
(0.1
6)-
(0.1
6)(0
.16)
--
De
tail
s o
f D
ire
ct
sub
sid
iari
es,
on
co
nso
lid
ate
d b
asi
s in
clu
din
g t
he
ir r
esp
ec
tiv
e s
ub
sid
iari
es
incl
ud
ed
ab
ov
e
1Ta
ta Te
chno
logi
es L
td (N
ote
A, p
age
84)
43.
02
909
.88
1,7
53.1
3 8
00.2
3 2
,014
.60
392
.43
91.
70
300
.73
300
.73
80.
01
284
.96
2Ta
ta M
otor
s Eur
opea
n Te
chni
cal C
entr
e Pl
c.(N
ote
B, p
age
84)
220
.59
(170
.81)
(187
.30)
137
.51
300
.60
45.
73
3.2
7 4
2.46
4
2.46
2
.30
-
3Ta
ta H
ispa
no M
otor
s Ca
rroc
era
S.A
. (N
ote
C, p
age
84)
3.7
0 (5
49.1
2) 2
86.0
2 8
31.4
4 1
38.0
9 (1
40.4
1) (3
9.80
) (1
00.6
1) (1
00.6
1) -
-
4Ta
ta D
aew
oo C
omm
erci
al V
ehic
le C
o. L
td. (
Not
e D
, pag
e 84
) 5
7.35
9
99.6
6 2
,802
.13
1,7
41.4
0 3
,933
.68
(92.
77)
(19.
43)
(73.
34)
(73.
34)
- 2
.39
5TM
L H
oldi
ngs
Pte
Ltd,
Sin
gapo
re (
Not
e E,
pag
e 84
)**
6PT
Tat
a M
otor
s In
done
sia
( Not
e F,
page
84)
47.
20
(32.
16)
21.
60
6.5
6 0
.06
(31.
35)
- (3
1.35
) (3
1.35
) -
-
**TM
L H
oldi
ngs
Pte
Ltd,
Sin
gapo
re h
olds
fully
Jagu
ar L
and
Rove
r Aut
omot
ive
Plc,
the
cons
olid
ated
acc
ount
s of
whi
ch is
giv
en b
elow
and
that
com
pris
es a
ll JL
R co
mpa
nies
as
stat
ed a
bove
.
Jagu
ar L
and
Rove
r Aut
omot
ive
Plc
(form
erly
kno
wn
as Ja
guar
Land
Rove
r Plc
) .12
,319
.70
17,7
72.6
41,
05,9
44.6
475
,852
.30
135,
712.
3414
,827
.92
3,67
1.73
11,1
56.1
911
,156
.19
-6,
433.
65
SU
BS
IDIA
RY
CO
MP
AN
IES
: F
INA
NC
IAL
HIG
HL
IGH
TS
20
12
-13
(`
in
cro
res)

199
Subsidiary Companies Financial
Highlights (197-199)
CORPORATE OVERVIEW FINANCIAL HIGHLIGHTS FINANCIAL STATEMENTSSTATUTORY REPORTS
Notes: Country of
incorporation
(A) Subsidiaries of Tata Technologies Ltd that have been consolidated
1 Tata Technologies (Thailand) Ltd Thailand
2 Tata Technologies Pte. Ltd, Singapore Singapore
3 INCAT International Plc UK
4 Tata Technologies Europe Ltd UK
5 INCAT GmbH. Germany
6 Tata Technologies Inc USA
7 Tata Technologies de Mexico, S.A. de C.V. Mexico
8 Tata Technologies (Canada) Inc. Canada
(B) Subsidiary of Tata Motors European Technical Centre Plc that has been consolidated
1 Miljobil Greenland AS (upto August 30, 2012) Norway
(C) Subsidiary of Tata Hispano Motors Carrocera S.A that has been consolidated
1 Tata Hispano Motors Carroceries Maghreb Morocco
(D) Subsidiary of Tata Daewoo Commercial Vehicle Co. Ltd that has been consolidated
1 Tata Daewoo Commercial Vehicle Sales and Distribution Co. Ltd. South Korea
(E) Subsidiaries of TML Holdings Pte Ltd, Singapore that have been consolidated
1 Jaguar Land Rover Automotive Plc (formerly known as JaguarLandRover Plc) UK
2 Jaguar Land Rover Ltd (formerly known as Jaguar Cars Overseas Holdings Ltd) UK
3 Jaguar Land Rover Austria GmbH Austria
4 Jaguar Belux NV Belgium
5 Jaguar Land Rover Japan Ltd Japan
6 Jaguar Cars South Africa (pty) Ltd South Africa
7 Jaguar Land Rover Exports Ltd UK
8 The Daimler Motor Company Ltd UK
9 The Jaguar Collection Ltd UK
10 Daimler Transport Vehicles Ltd UK
11 S.S. Cars Ltd UK
12 The Lanchester Motor Company Ltd UK
13 Jaguar Hispania SL Spain
14 Jaguar Land Rover Deutschland GmbH Germany
15 Land Rover UK
16 Land Rover Group Ltd Jersey
17 Jaguar Land Rover North America LLC USA
18 Land Rover Belux SA/NV Belgium
19 Land Rover Ireland Ltd Ireland
20 Jaguar Land Rover Nederland BV (formerly known as Land Rover Nederland BV) Netherlands
21 Jaguar Land Rover Portugal - Veiculos e Pecas, LDA Portugal
22 Jaguar Land Rover Australia Pty Ltd Australia
23 Land Rover Exports Ltd (upto April 1, 2012) UK
24 Jaguar Land Rover Italia SpA Italy
25 Land Rover Espana SL Spain
26 Jaguar Land Rover Korea Co. Ltd South Korea
27 Jaguar Land Rover Automotive Trading (Shanghai) Co. Ltd China
28 Jaguar Land Rover Canada ULC Canada
29 Jaguar Land Rover France, SAS France
30 Jaguar Land Rover (South Africa) (pty) Ltd South Africa
31 Jaguar Land Rover Brazil LLC Brazil
32 Limited Liability Company "Jaguar Land Rover" (Russia) Russia
33 Land Rover Parts Ltd UK
34 Jaguar Land Rover (South Africa) Holdings Ltd. UK
35 Jaguar Land Rover India Ltd (incorporated w.e.f. October 25, 2012) India
(F) Subsidiary of PT Tata Motors Indonesia that has been consolidated
1 PT Tata Motors Distribusi Indonesia (incorporated w.e.f. February 11, 2013) Indonesia
# The financial statements of subdsidiaries whose reporting currency are other than INR are converted into Indian Rupees on the basis of appropriate
exchange rates.
* Profit for the year is after share of minority interest and share of profit / (loss) in respect of investment in associate companies.

68th ANNUAL REPORT 2012-13
200
LISTED SECURITIES ISSUED BY SUBSIDIARY COMPANIES
Security Allotted on ISIN Issue Size Listed On
Tata Motors Finance Limited
FY 12-13
11.50% Unsecured Rated Perpetual
Debentures (due 2022)
May 30, 2012 INE909H08105 Rs. 269,000,000 Wholesale Debt
Market Segment
of NSE
11.50%Unsecured Rated Perpetual
Debentures (due 2022)
June 28,2012 INE909H08113 Rs.731,000,000 Wholesale Debt
Market Segment
of NSE
FY 10-11
11.35%Unsecured Rated Perpetual
Debentures (due 2022)
November 23, 2010 INE909H08055 Rs.1,500,000,000 Wholesale Debt
Market Segment
of NSE
Jaguar Land Rover Automotive PLC
FY 12-13
5.625% Senior Notes (due 2023) January 28, 2013 USG50027AE42 &
US47010BAA26
US$500,000,000 Luxembourg
Stock Exchange
FY 11-12
8.125% Senior Notes (due 2018) May 19, 2011 XS0627215535 &
XS0627215378
GB£500,000,000 Luxembourg
Stock Exchange
7.750% Senior Notes (due 2018) May 19, 2011 US47009XAA72 &
USG50027AA20
US$410,000,000 Luxembourg
Stock Exchange
8.125% Senior Notes (due 2021) May 19, 2011 US47009XAB55 &
USG50027AB03
US$410,000,000 Luxembourg
Stock Exchange
8.250% Senior Notes (due 2020) March 27, 2012 XS0765386627 &
XS0765386973
GB£500,000,000 Luxembourg
Stock Exchange
TML Holdings Pte. Ltd.
FY 12-13
4.25% Senior Notes (due 2018) May 16,2013 SG56E5992953 S$350,000,000 Singapore Stock
Exchange
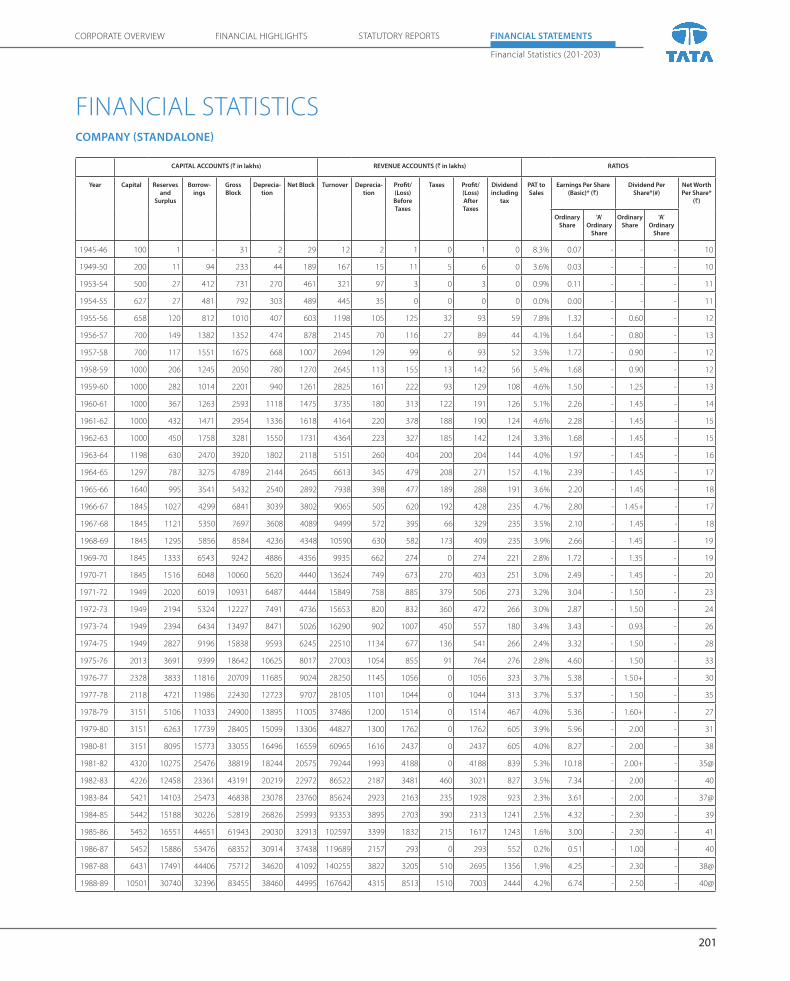
201
Financial Statistics (201-203)
CORPORATE OVERVIEW FINANCIAL HIGHLIGHTS FINANCIAL STATEMENTSSTATUTORY REPORTS
CAPITAL ACCOUNTS (` in lakhs) REVENUE ACCOUNTS (` in lakhs) RATIOS
Year Capital Reserves
and
Surplus
Borrow-
ings
Gross
Block
Deprecia-
tion
Net Block Turnover Deprecia-
tion
Profit/
(Loss)
Before
Taxes
Taxes Profit/
(Loss)
After
Taxes
Dividend
including
tax
PAT to
Sales
Earnings Per Share
(Basic)* (`)
Dividend Per
Share*(#)
Net Worth
Per Share*
(`)
Ordinary
Share
'A'
Ordinary
Share
Ordinary
Share
'A'
Ordinary
Share
1945-46 100 1 - 31 2 29 12 2 1 0 1 0 8.3% 0.07 - - - 10
1949-50 200 11 94 233 44 189 167 15 11 5 6 0 3.6% 0.03 - - - 10
1953-54 500 27 412 731 270 461 321 97 3 0 3 0 0.9% 0.11 - - - 11
1954-55 627 27 481 792 303 489 445 35 0 0 0 0 0.0% 0.00 - - - 11
1955-56 658 120 812 1010 407 603 1198 105 125 32 93 59 7.8% 1.32 - 0.60 - 12
1956-57 700 149 1382 1352 474 878 2145 70 116 27 89 44 4.1% 1.64 - 0.80 - 13
1957-58 700 117 1551 1675 668 1007 2694 129 99 6 93 52 3.5% 1.72 - 0.90 - 12
1958-59 1000 206 1245 2050 780 1270 2645 113 155 13 142 56 5.4% 1.68 - 0.90 - 12
1959-60 1000 282 1014 2201 940 1261 2825 161 222 93 129 108 4.6% 1.50 - 1.25 - 13
1960-61 1000 367 1263 2593 1118 1475 3735 180 313 122 191 126 5.1% 2.26 - 1.45 - 14
1961-62 1000 432 1471 2954 1336 1618 4164 220 378 188 190 124 4.6% 2.28 - 1.45 - 15
1962-63 1000 450 1758 3281 1550 1731 4364 223 327 185 142 124 3.3% 1.68 - 1.45 - 15
1963-64 1198 630 2470 3920 1802 2118 5151 260 404 200 204 144 4.0% 1.97 - 1.45 - 16
1964-65 1297 787 3275 4789 2144 2645 6613 345 479 208 271 157 4.1% 2.39 - 1.45 - 17
1965-66 1640 995 3541 5432 2540 2892 7938 398 477 189 288 191 3.6% 2.20 - 1.45 - 18
1966-67 1845 1027 4299 6841 3039 3802 9065 505 620 192 428 235 4.7% 2.80 - 1.45+ - 17
1967-68 1845 1121 5350 7697 3608 4089 9499 572 395 66 329 235 3.5% 2.10 - 1.45 - 18
1968-69 1845 1295 5856 8584 4236 4348 10590 630 582 173 409 235 3.9% 2.66 - 1.45 - 19
1969-70 1845 1333 6543 9242 4886 4356 9935 662 274 0 274 221 2.8% 1.72 - 1.35 - 19
1970-71 1845 1516 6048 10060 5620 4440 13624 749 673 270 403 251 3.0% 2.49 - 1.45 - 20
1971-72 1949 2020 6019 10931 6487 4444 15849 758 885 379 506 273 3.2% 3.04 - 1.50 - 23
1972-73 1949 2194 5324 12227 7491 4736 15653 820 832 360 472 266 3.0% 2.87 - 1.50 - 24
1973-74 1949 2394 6434 13497 8471 5026 16290 902 1007 450 557 180 3.4% 3.43 - 0.93 - 26
1974-75 1949 2827 9196 15838 9593 6245 22510 1134 677 136 541 266 2.4% 3.32 - 1.50 - 28
1975-76 2013 3691 9399 18642 10625 8017 27003 1054 855 91 764 276 2.8% 4.60 - 1.50 - 33
1976-77 2328 3833 11816 20709 11685 9024 28250 1145 1056 0 1056 323 3.7% 5.38 - 1.50+ - 30
1977-78 2118 4721 11986 22430 12723 9707 28105 1101 1044 0 1044 313 3.7% 5.37 - 1.50 - 35
1978-79 3151 5106 11033 24900 13895 11005 37486 1200 1514 0 1514 467 4.0% 5.36 - 1.60+ - 27
1979-80 3151 6263 17739 28405 15099 13306 44827 1300 1762 0 1762 605 3.9% 5.96 - 2.00 - 31
1980-81 3151 8095 15773 33055 16496 16559 60965 1616 2437 0 2437 605 4.0% 8.27 - 2.00 - 38
1981-82 4320 10275 25476 38819 18244 20575 79244 1993 4188 0 4188 839 5.3% 10.18 - 2.00+ - 35@
1982-83 4226 12458 23361 43191 20219 22972 86522 2187 3481 460 3021 827 3.5% 7.34 - 2.00 - 40
1983-84 5421 14103 25473 46838 23078 23760 85624 2923 2163 235 1928 923 2.3% 3.61 - 2.00 - 37@
1984-85 5442 15188 30226 52819 26826 25993 93353 3895 2703 390 2313 1241 2.5% 4.32 - 2.30 - 39
1985-86 5452 16551 44651 61943 29030 32913 102597 3399 1832 215 1617 1243 1.6% 3.00 - 2.30 - 41
1986-87 5452 15886 53476 68352 30914 37438 119689 2157 293 0 293 552 0.2% 0.51 - 1.00 - 40
1987-88 6431 17491 44406 75712 34620 41092 140255 3822 3205 510 2695 1356 1.9% 4.25 - 2.30 - 38@
1988-89 10501 30740 32396 83455 38460 44995 167642 4315 8513 1510 7003 2444 4.2% 6.74 - 2.50 - 40@
FINANCIAL STATISTICSCOMPANY (STANDALONE)

202
68th ANNUAL REPORT 2012-13
Notes :
@ On increased capital base due to conversion of Bonds / Convertible Debentures / Warrants / FCCN into shares.
$ On increased capital base due to issue of Bonus Shares. Net Worth excludes ordinary dividends.
* Equivalent to a face value of Rs.10/- per share.
# Includes Interim Dividend where applicable.
+ Including on Bonus Shares issued during the year.
! Includes a special dividend of Rs. 2.50 per share for the Diamond Jubilee Year.
++ On increased capital base due to Rights issue and conversion of FCCN into shares.
^ On increased capital base due to GDS issue and conversion of FCCN into shares.
^^ On increased capital base due to QIP issue and conversion of FCCN into shares.
** Consequent to sub-division of shares, figures for previous years are not comparable.
CAPITAL ACCOUNTS (` in lakhs) REVENUE ACCOUNTS (` in lakhs) RATIOS
Year Capital Reserves
and
Surplus
Borrow-
ings
Gross
Block
Deprecia-
tion
Net Block Turnover Deprecia-
tion
Profit/
(Loss)
Before
Taxes
Taxes Profit/
(Loss)
After
Taxes
Dividend
including
tax
PAT to
Sales
Earnings Per Share
(Basic)* (`)
Dividend Per
Share*(#)
Net Worth
Per Share*
(`)
Ordinary
Share
'A'
Ordinary
Share
Ordinary
Share
'A'
Ordinary
Share
1989-90 10444 37870 48883 91488 43070 48418 196910 4891 14829 4575 10254 3126 5.2% 9.87 - 3.00 - 47
1990-91 10387 47921 48323 100894 48219 52675 259599 5426 23455 9250 14205 4154 5.5% 13.69 - 4.00 - 56
1991-92 11765 61863 105168 123100 54609 68491 317965 6475 20884 7800 13084 4389 4.1% 12.45 - 4.00 - 67@
1992-93 12510 64207 144145 153612 61710 91902 309156 7456 3030 26 3004 3642 1.0% 2.47 - 3.00 - 63
1993-94 12867 70745 141320 177824 70285 107539 374786 9410 10195 20 10175 5020 2.7% 7.91 - 4.00 - 65
1994-95 13694 128338 115569 217084 81595 135489 568312 11967 45141 13246 31895 8068 5.6% 23.29 - 6.00 - 104
1995-96 24182 217400 128097 294239 96980 197259 790967 16444 76072 23070 53002 14300 6.7% 21.92 - 6.00 - 100
1996-97 25588 339169 253717 385116 117009 268107 1012843 20924 100046 23810 76236 22067 7.5% 30.40 - 8.00 - 143
1997-98 25588 349930 330874 487073 141899 345174 736279 25924 32880 3414 29466 15484 4.0% 11.51 - 5.50 - 147
1998-99 25590 350505 344523 569865 165334 404531 659395 28132 10716 970 9746 8520 1.5% 3.81 - 3.00 - 147
1999-00 25590 349822 300426 581233 182818 398415 896114 34261 7520 400 7120 7803 0.8% 2.78 - 2.50 - 147
2000-01 25590 299788 299888 591427 209067 382360 816422 34737 (50034) 0 (50034) 0 - (18.45) - - - 127
2001-02 31982 214524 230772 591006 243172 347834 891806 35468 (10921) (5548) (5373) 0 - (1.98) - - - 77@
2002-03 31983 227733 145831 608114 271307 336807 1085874 36213 51037 21026 30011 14430 2.8% 9.38 - 4.00 - 81
2003-04 35683 323677 125977 627149 302369 324780 1555242 38260 129234 48200 81034 31825 5.2% 24.68 - 8.00 - 102@
2004-05 36179 374960 249542 715079 345428 369651 2064866 45016 165190 41495 123695 51715 6.0% 34.38 - 12.50! - 114@
2005-06 38287 515420 293684 892274 440151 452123 2429052 52094 205338 52450 152888 56778 6.3% 40.57 - 13.00 - 145@
2006-07 38541 648434 400914 1128912 489454 639458 3206467 58629 257318 65972 191346 67639 6.0% 49.76 - 15.00 - 178@
2007-08 38554 745396 628052 1589579 544352 1045227 3357711 65231 257647 54755 202892 65968 6.0% 52.64 - 15.00 - 203@
2008-09 51405 1171610 1316556 2085206 625990 1459216 2949418 87454 101376 1250 100126 34570 3.4% 22.70 23.20 6.00 6.50 238++
2009-10 57060 1439487 1659454 2364896 721292 1643604 4021755 103387 282954 58946 224008 99194 5.6% 42.37 42.87 15.00 15.50 262^
2010-11 63771 1937559 1591543 2568235 846625 1721610 5160692 136077 219652 38470 181182 146703 3.5% 30.28 30.78 20.00 20.50 315^^
2011-12 63475 1899126 1588057 2902206 996587 1905619 5979502 160674 134103 9880 124223 146372 2.5% 3.90** 4.00** 4.00** 4.10** 61.84
2012-13 63807 1849677 1679895 3181998 1161144 2020854 5140793 181762 17493 (12688) 30181 72423 0.6% 0.93 1.03 0.93 1.03 59.98
FINANCIAL STATISTICSCOMPANY (STANDALONE)
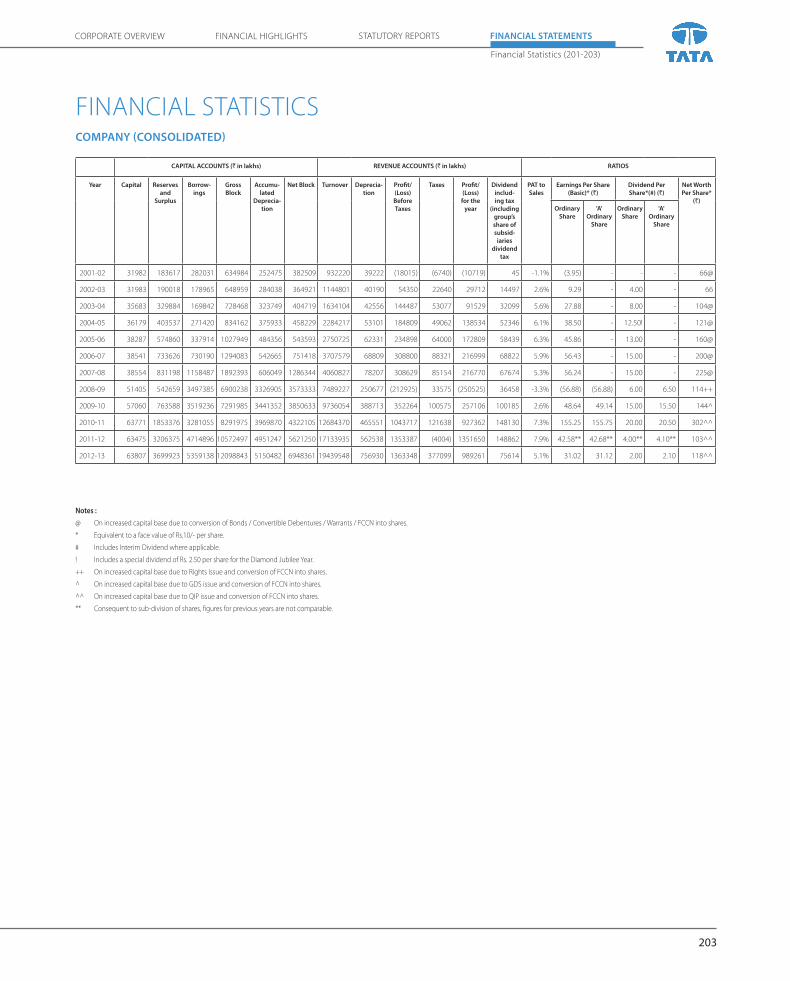
203
Financial Statistics (201-203)
CORPORATE OVERVIEW FINANCIAL HIGHLIGHTS FINANCIAL STATEMENTSSTATUTORY REPORTS
FINANCIAL STATISTICSCOMPANY (CONSOLIDATED)
Notes :
@ On increased capital base due to conversion of Bonds / Convertible Debentures / Warrants / FCCN into shares.
* Equivalent to a face value of Rs.10/- per share.
# Includes Interim Dividend where applicable.
! Includes a special dividend of Rs. 2.50 per share for the Diamond Jubilee Year.
++ On increased capital base due to Rights issue and conversion of FCCN into shares.
^ On increased capital base due to GDS issue and conversion of FCCN into shares.
^^ On increased capital base due to QIP issue and conversion of FCCN into shares.
** Consequent to sub-division of shares, figures for previous years are not comparable.
CAPITAL ACCOUNTS (` in lakhs) REVENUE ACCOUNTS (` in lakhs) RATIOS
Year Capital Reserves
and
Surplus
Borrow-
ings
Gross
Block
Accumu-
lated
Deprecia-
tion
Net Block Turnover Deprecia-
tion
Profit/
(Loss)
Before
Taxes
Taxes Profit/
(Loss)
for the
year
Dividend
includ-
ing tax
(including
group’s
share of
subsid-
iaries
dividend
tax
PAT to
Sales
Earnings Per Share
(Basic)* (`)
Dividend Per
Share*(#) (`)
Net Worth
Per Share*
(`)
Ordinary
Share
'A'
Ordinary
Share
Ordinary
Share
'A'
Ordinary
Share
2001-02 31982 183617 282031 634984 252475 382509 932220 39222 (18015) (6740) (10719) 45 -1.1% (3.95) - - - 66@
2002-03 31983 190018 178965 648959 284038 364921 1144801 40190 54350 22640 29712 14497 2.6% 9.29 - 4.00 - 66
2003-04 35683 329884 169842 728468 323749 404719 1634104 42556 144487 53077 91529 32099 5.6% 27.88 - 8.00 - 104@
2004-05 36179 403537 271420 834162 375933 458229 2284217 53101 184809 49062 138534 52346 6.1% 38.50 - 12.50! - 121@
2005-06 38287 574860 337914 1027949 484356 543593 2750725 62331 234898 64000 172809 58439 6.3% 45.86 - 13.00 - 160@
2006-07 38541 733626 730190 1294083 542665 751418 3707579 68809 308800 88321 216999 68822 5.9% 56.43 - 15.00 - 200@
2007-08 38554 831198 1158487 1892393 606049 1286344 4060827 78207 308629 85154 216770 67674 5.3% 56.24 - 15.00 - 225@
2008-09 51405 542659 3497385 6900238 3326905 3573333 7489227 250677 (212925) 33575 (250525) 36458 -3.3% (56.88) (56.88) 6.00 6.50 114++
2009-10 57060 763588 3519236 7291985 3441352 3850633 9736054 388713 352264 100575 257106 100185 2.6% 48.64 49.14 15.00 15.50 144^
2010-11 63771 1853376 3281055 8291975 3969870 4322105 12684370 465551 1043717 121638 927362 148130 7.3% 155.25 155.75 20.00 20.50 302^^
2011-12 63475 3206375 4714896 10572497 4951247 5621250 17133935 562538 1353387 (4004) 1351650 148862 7.9% 42.58** 42.68** 4.00** 4.10** 103^^
2012-13 63807 3699923 5359138 12098843 5150482 6948361 19439548 756930 1363348 377099 989261 75614 5.1% 31.02 31.12 2.00 2.10 118^^
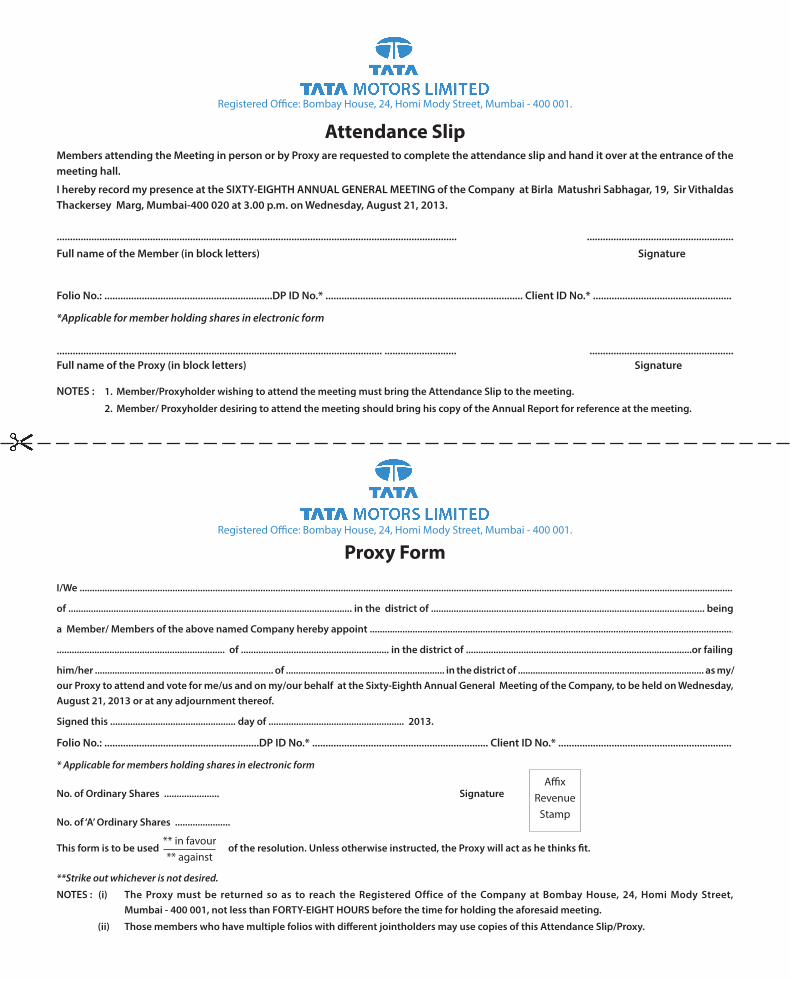
Registered Office: Bombay House, 24, Homi Mody Street, Mumbai - 400 001.
Attendance SlipMembers attending the Meeting in person or by Proxy are requested to complete the attendance slip and hand it over at the entrance of the
meeting hall.
I hereby record my presence at the SIXTY-EIGHTH ANNUAL GENERAL MEETING of the Company at Birla Matushri Sabhagar, 19, Sir Vithaldas
Thackersey Marg, Mumbai-400 020 at 3.00 p.m. on Wednesday, August 21, 2013.
...................................................................................................................................................... .......................................................
Full name of the Member (in block letters) Signature
Folio No.: ...............................................................DP ID No.* .......................................................................... Client ID No.* ....................................................
*Applicable for member holding shares in electronic form
.......................................................................................................................... ........................... ......................................................
Full name of the Proxy (in block letters) Signature
NOTES : 1. Member/Proxyholder wishing to attend the meeting must bring the Attendance Slip to the meeting.
2. Member/ Proxyholder desiring to attend the meeting should bring his copy of the Annual Report for reference at the meeting.
Registered Office: Bombay House, 24, Homi Mody Street, Mumbai - 400 001.
Proxy Form
I/We ....................................................................................................................................................................................................................................................................
of ................................................................................................................. in the district of ............................................................................................................. being
a Member/ Members of the above named Company hereby appoint .................................................................................................................................................
................................................................... of ........................................................... in the district of ..........................................................................................or failing
him/her ........................................................................ of ................................................................ in the district of ........................................................................... as my/
our Proxy to attend and vote for me/us and on my/our behalf at the Sixty-Eighth Annual General Meeting of the Company, to be held on Wednesday,
August 21, 2013 or at any adjournment thereof.
Signed this .................................................. day of ...................................................... 2013.
Folio No.: ..........................................................DP ID No.* .................................................................. Client ID No.* .................................................................
* Applicable for members holding shares in electronic form
No. of Ordinary Shares ...................... Signature
No. of ‘A’ Ordinary Shares ......................
This form is to be used of the resolution. Unless otherwise instructed, the Proxy will act as he thinks fit.
**Strike out whichever is not desired.
NOTES : (i) The Proxy must be returned so as to reach the Registered Office of the Company at Bombay House, 24, Homi Mody Street,
Mumbai - 400 001, not less than FORTY-EIGHT HOURS before the time for holding the aforesaid meeting.
(ii) Those members who have multiple folios with different jointholders may use copies of this Attendance Slip/Proxy.
** in favour** against
AffixRevenue
Stamp

10,000th Ace roll-out from
Dharwad plant
(January 30, 2013)
1st Vehicle roll-out from
Dharwad plant
(March 15, 2012)
Jaguar Land Rover
Halewood plant
Range Rover Evoque
manufacturing plant

Bombay House 24 Homi Mody Street Mumbai 400 001