tfaws 2010 center presentation · pdf fileabstract • the landsat 8 data continuity...
TRANSCRIPT

GSFC· 2015
ANALYTICAL METHODOLOGY USED TO ASSESS/REFINE
OBSERVATORY THERMAL VACUUM TEST CONDITIONS FOR
THE LANDSAT 8 DATA CONTINUITY MISSION
Louis Fantano
NASA Goddard Space Flight Center
Landsat 8 Thermal Team
Spacecraft Bus
Orbital Space Sciences Corporation (OSC)
Billy Greenrock (Lead Thermal Engineer)
Corey Roberts (Thermal Analyst)
Operational Land Imager (OLI)
Ball Aerospace & Technology Corporation (BATC)
Michael East (Lead OLI Thermal Engineer)
Thermal Infrared Sensor (TIRS)
Goddard Space Flight Center (GSFC)
Veronica Otero (TIRS Thermal Product Design Lead)
Landsat Project Office
Goddard Space Flight Center (GSFC)
Louis Fantano (Lead Project Thermal Engineer)
2 TFAWS 2015 – August 3-7, 2015 – Silver Spring, MD
Many thanks to a great team !
ABSTRACT
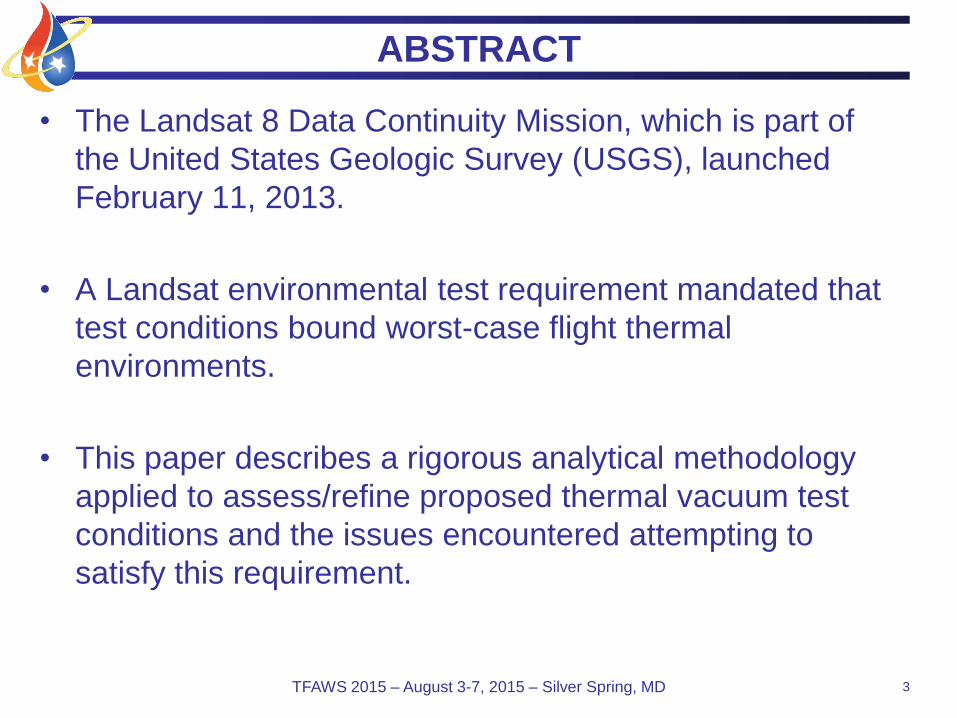
• The Landsat 8 Data Continuity Mission, which is part of
the United States Geologic Survey (USGS), launched
February 11, 2013.
• A Landsat environmental test requirement mandated that
test conditions bound worst-case flight thermal
environments.
• This paper describes a rigorous analytical methodology
applied to assess/refine proposed thermal vacuum test
conditions and the issues encountered attempting to
satisfy this requirement.
3 TFAWS 2015 – August 3-7, 2015 – Silver Spring, MD
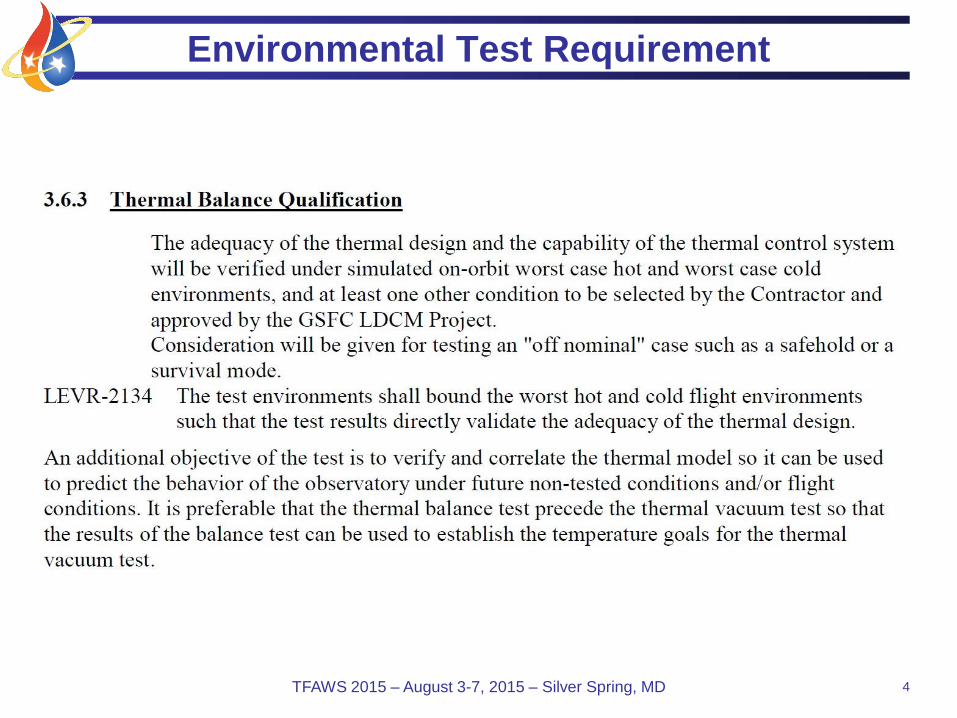
Environmental Test Requirement
4 TFAWS 2015 – August 3-7, 2015 – Silver Spring, MD
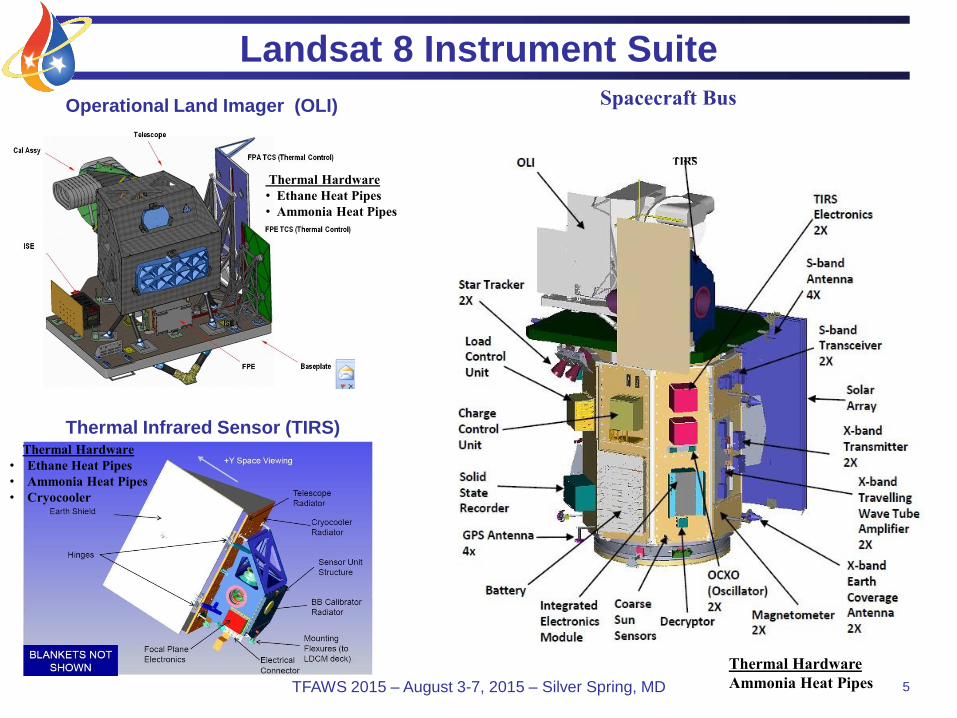
Landsat 8 Instrument Suite
Operational Land Imager (OLI)
Thermal Infrared Sensor (TIRS)
5 TFAWS 2015 – August 3-7, 2015 – Silver Spring, MD
Thermal Hardware
• Ethane Heat Pipes
• Ammonia Heat Pipes
Thermal Hardware
• Ethane Heat Pipes
• Ammonia Heat Pipes
• Cryocooler
Spacecraft Bus
TIRS
Thermal Hardware
Ammonia Heat Pipes

Thermal Vacuum Test Set-Up
6 TFAWS 2015 – August 3-7, 2015 – Silver Spring, MD
MXP
OITL
OITL
AT B
AT A
CPT AHot
Target
Cold Target
Hot Start,A
CPTA
AT A, swap to B
AT B
Cold Start,A
Hot Start,B
CPT B
CPT B, swap to A
Warm up
Return To AMB
AT A/B
Cold Start,B
BOV
CPT A/B
AMB
Pump Down
HB
AT A
MRT5.2 pt1
MXP
MRT5.2 pt2
MRT6
SE
SB/HT
OITL OITL
MNP MNP MNP
MXPMXP
CB
0.0 0.8 1.3 2.3 4.8 6.8 9.5 13.011.5 15.4 17.3 19.4 21.8 24.8 27.5 29.128.6
Running Time (Days)2.6
OITL
MNP LPT A
OLI
TIRS OFF
OFF Available for Operation
Cryogenic OperationDry Out/Ambient Ops Warm Up
OFF
OFF
MRT5.2 pt3
11.8 12.7 19.9
SE
SE
SE

Methodology Objectives
• Systematic process that inputs raw data directly from flight
and TVAC models that generates quantitative measure of
how the two environments compare.
• Create process that forces a detailed look at the model
output to flush out analytical errors prior to test initiation.
• Generate summary output that facilitates communication
to project management of environment comparison
analyses results.
7 TFAWS 2015 – August 3-7, 2015 – Silver Spring, MD

Methodology Overview
8 TFAWS 2015 – August 3-7, 2015 – Silver Spring, MD
Operational Land Imager
(OLI)
Thermal Infrared Sensor
(TIRS)
TMM
Observatory
Integrator
TMM
Nodal Group Correspondence 1. Identify Major Elements
(OLI,TIRS,BUS,PROP)
2. MLI vs Non-MLI Groups
SINDA QMAP FILES
Steady State Solutions
Cold, Hot, Safe Hold Flight Cases
Cold, Hot, Safe Hold Test Cases
A) Verify steady state solution
B) Calculate Group to Group
Energy Balances
C) Flight Versus TVAC Model
Group Comparison
D) Flight vs TVAC Power
Dissipation Comparison
E) Flight vs TVAC Environment
Comparison
For each case set pair (Flight /TVAC) :
a) Assume groups coupled to space sink in the flight case have environmental inputs.
b) Calculate QNet Flight (QAbsEnv-Qspace) for each of these groups
c) Calculate QSink TVAC for each of these groups
d) Compare QNet to QSink
e) Sum heat flow differences to generate Flight to TVAC Comparison metric (with/without MLI) for each case set.
Note: Models set up so that absorbed environmental loads, dissipated heat loads,
and applied heater power are input to unique nodes.
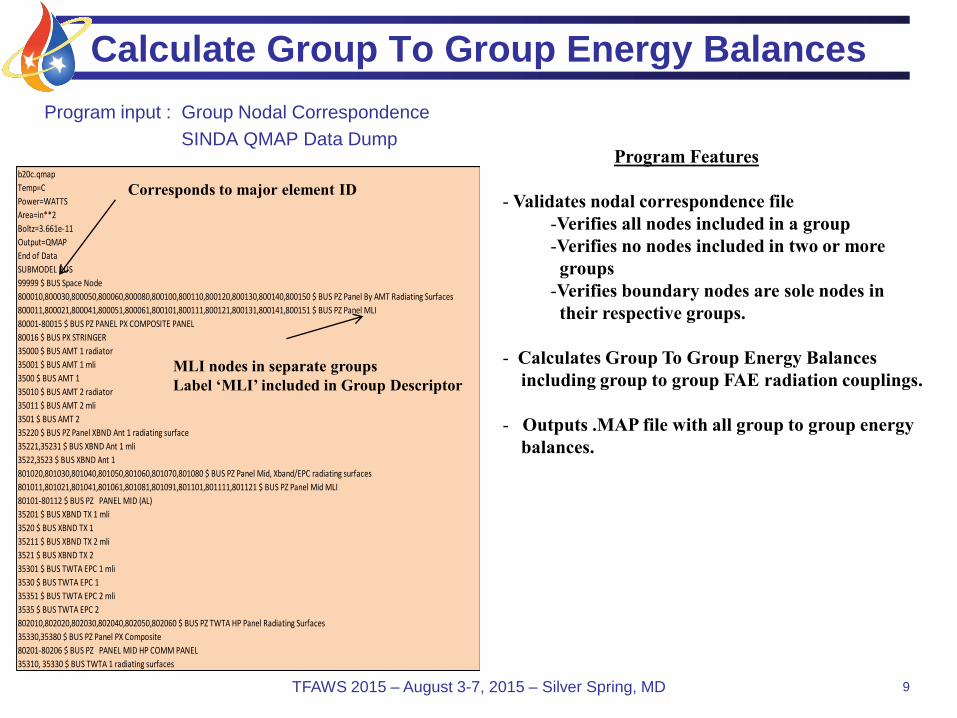
Calculate Group To Group Energy Balances
Program input : Group Nodal Correspondence
SINDA QMAP Data Dump
9 TFAWS 2015 – August 3-7, 2015 – Silver Spring, MD
Program Features
- Validates nodal correspondence file
-Verifies all nodes included in a group
-Verifies no nodes included in two or more
groups
-Verifies boundary nodes are sole nodes in
their respective groups.
- Calculates Group To Group Energy Balances
including group to group FAE radiation couplings.
- Outputs .MAP file with all group to group energy
balances.
b20c.qmap
Temp=C
Power=WATTS
Area=in**2
Boltz=3.661e-11
Output=QMAP
End of Data
SUBMODEL BUS
99999 $ BUS Space Node
800010,800030,800050,800060,800080,800100,800110,800120,800130,800140,800150 $ BUS PZ Panel By AMT Radiating Surfaces
800011,800021,800041,800051,800061,800101,800111,800121,800131,800141,800151 $ BUS PZ Panel MLI
80001-80015 $ BUS PZ PANEL PX COMPOSITE PANEL
80016 $ BUS PX STRINGER
35000 $ BUS AMT 1 radiator
35001 $ BUS AMT 1 mli
3500 $ BUS AMT 1
35010 $ BUS AMT 2 radiator
35011 $ BUS AMT 2 mli
3501 $ BUS AMT 2
35220 $ BUS PZ Panel XBND Ant 1 radiating surface
35221,35231 $ BUS XBND Ant 1 mli
3522,3523 $ BUS XBND Ant 1
801020,801030,801040,801050,801060,801070,801080 $ BUS PZ Panel Mid, Xband/EPC radiating surfaces
801011,801021,801041,801061,801081,801091,801101,801111,801121 $ BUS PZ Panel Mid MLI
80101-80112 $ BUS PZ PANEL MID (AL)
35201 $ BUS XBND TX 1 mli
3520 $ BUS XBND TX 1
35211 $ BUS XBND TX 2 mli
3521 $ BUS XBND TX 2
35301 $ BUS TWTA EPC 1 mli
3530 $ BUS TWTA EPC 1
35351 $ BUS TWTA EPC 2 mli
3535 $ BUS TWTA EPC 2
802010,802020,802030,802040,802050,802060 $ BUS PZ TWTA HP Panel Radiating Surfaces
35330,35380 $ BUS PZ Panel PX Composite
80201-80206 $ BUS PZ PANEL MID HP COMM PANEL
35310, 35330 $ BUS TWTA 1 radiating surfaces
Corresponds to major element ID
MLI nodes in separate groups
Label ‘MLI’ included in Group Descriptor

Output Example: Space Sink (Cold Ops Case)
10 TFAWS 2015 – August 3-7, 2015 – Silver Spring, MD
.
.
.
0.0012 -40.5 0.01091 $ TIRS Telescope Isolation System(TIS), Mid Ring, Telescope Shield I/F, [TELEALR1] 1761,1762
0.001 -87.1 0.02163 $ TIRS Telescope MISC PARTS, RETAINERS, SPRINGS, ETC. [LENSAS34] 1751-1757
0.0009 -23 0.00625 $ TIRS OSC Lid Man Hole Cover [ManHoleCoverMLI] 10808-10810,10836-10839,10850,20808-20822,20836-20839,20850
0.0008 7.3 0.00355 $ OLI Quaternary Mirror MLI 11481
0.0008 -24.9 0.00581 $ TIRS CRYOCOOLER MOUNT CCM (Keel) (Key Group) [KEELRED] 931-985
0.0007 -25.4 0.00493 $ TIRS MLI Tunnel [BellowsMLI] 10701-10711,20707,20711
0.0007 23.3 0.00238 $ OLI Cal Assy Stim Lamp-2 7792
0.0006 17.8 0.00225 $ OLI Secondary Mirror Silver 11201
0.0006 -17.2 0.00377 $ TIRS Foot, -Y MLI [HSG_FT3_MLI] 4367,14367
0.0005 -111.8 0.02020 $ TIRS APG BAR Telescope Link [TelescopeLink] 801-807,823-835,840-847
0.0004 9.2 0.00179 $ OLI Cal Assy Shutter Wheel Motor &Mech 7600
0.0004 54.9 0.00089 $ OLI Heater Plate 6 4806
0.0004 39.9 0.00104 $ OLI Heater Plate 5 4805
0.0003 -19.8 0.00203 $ TIRS Foot, +Z MLI [HSG_FT1_MLI] 4387,14387
0.0003 -86.7 0.00655 $ TIRS Telescope Lens 3 [LENS3] 1736
0.0003 -77.8 0.00485 $ TIRS 1 Layer Telescope Blanket [TELEMLI] 1783-1787
0.0003 -86.9 0.00599 $ TIRS Telescope Aft Barrel TCB Sensor Htr Zone 1 (Key Group)[TBODY3] 1721-1726
GROUP SUMMARY:
QMAP
0
Linear Conduction : 0
Radiation Exchange : 25050.94
----- ---------- -------------- -----
Heat Flow Balance : 25050.94
Heat Sources :
********************1 of 649 **************************************
99999 $ BUS Space Node Avg Temp = -273.0 (-273.0 to -273.0)
99999
CAP = 0.000 Group FOM = 0.000
Heat Sources:
0 $ BUS Space Node 999
Linear Con duction:
QFlow Temp
QMAP C
Radiation Exchange: RadSum To Group: 116030.566489 IN**2
QFlow Temp Fae Group Description
QMap C IN**2
4624.55 22.5 16535 $ BUS SA PANEL 4 (FARTHEST FROM BUS) 2004
4615.41 22.7 16465 $ BUS SA PANEL 3 (MIDDLE PANEL 2) 2003
4604.81 23.3 16284 $ BUS SA PANEL 2 (MIDDLE PANEL 1) 2002
3258.61 16.2 11711 $ BUS SA PANEL 1 (CLOSEST TO BUS) 2001,2015
641.3412 -14.9 3935.26078 $ BUS Instrument Deck MLI 10511-11251
445.2307 -27.6 3316.8388 $ TIRS TIRS_ES Earth SHIELD 300-359 300-359
355.5366 -14.7 2238.07 $ BUS BOTTOM CLOSEOUT BLANKET EXTERNAL MLI 13091,13211-13281
346.603 50 867.98 $ BUS SA PANEL 1 MLI 20011
249.0403 -25.5 1720.32 $ BUS LV ADAPTER MLI 13011-13081
235.0502 -37.2 2024.681 $ OLI Cal Assy MLI (ext) 5951-5962
203.232 -27 1551.2575 $ TIRS TIRS_ES MLI 403-438,450-454,470-474 403-438,450-454,470-474
203.098 -0.4 1002 $ BUS MLI - NY PANEL PX 860001
187.623 2.8 884.6 $ BUS RW 3,4 MLI 201
181.239 -1 902.56 $ BUS PZNY RWA MLI 301
177.5098 -5.8 956.937 $ BUS Battery Radiator 321001-321024
156.3357 -39 1818.411 $ OLI CO MLI Skirt (ext) 8940-8949
130.802 -9.8 742.99 $ BUS MLI - NZ PANEL PX 840001
125.6774 -16.4 778.715 $ BUS TOP CLOSEOUT MLI OUTER 16011,16021,16031,16041,16051,16061,16071,16081
101.342 -18.6 659.19 $ BUS RW 1,2 MLI 101
100.114 -0.1 492 $ BUS MLI - NYNZ PANEL NX 851001
99.5171 -12.2 586.08 $ BUS MLI - PZNY PANEL NX 871001
99.0873 -19.1 834.326 $ OLI PX Baseplate MLI 13701-13714
98.8766 0.7 480.48 $ BUS MLI - NYNZ PANEL PX 850001
92.3374 -26 591.6734 $ TIRS Closeout MLI [HSG_MLI] 4201-4222,14201-14222,24202,24210,104253-104254,104288,104291
87.8795 -1.7 442.54 $ BUS SSR NZPY PANEL NX Radiating Surface 831010
87.6418 -17.5 565.49688 $ TIRS Structure, -Y/+X Slanted Truss [HSG_MLI_MINUSY] 14121-14134,14181-14194
87.3406 -9.9 496.99 $ BUS MLI - PZNY PANEL PX 870001
85.6012 -29.4 662.75 $ BUS PZPY PANEL NX MLI 811001
84.8902 -14.4 517.12065 $ TIRS MLI on +Z [HSG_MLI_PLUSZ] 4241,14321-14332,24241
84.6184 -33.6 702.19 $ BUS SSR mli 31101
76.5692 -33.3 715.506 $ OLI Ext MLI Skirt 6191-6196
70.3451 -24.7 516.76 $ OLI FPA Truss MLI 9390-9393
65.509 -13 390.75 $ BUS PZNY RWA Radiator 300
63.7555 -7.3 348.91 $ BUS MLI - NZ PANEL NX 841001
62.7182 -6 339.2896 $ BUS PZPY Panel Radiating surfaces 810010,810030,810060,810070,810080,810090,810120,810130,810140,810150
59.4747 -44.4 664.6252 $ OLI MLI BP Edge MLI 13940-13950
59.4182 -14.4 361.94 $ BUS PZ Panel NX MLI 803011
56.9927 3.7 265.352 $ BUS SA LAUNCH SUPPORT, NZNY NX MLI 24101,24111,24121,24131
55.1849 -33.8 459.22 $ BUS IEM MLI 31001
54.9987 29.8 178.31 $ BUS SIRU Radiator 101
54.2051 -8.9 283.019 $ BUS IEM radiating surfaces 31000,31010,31020
Begin Processing Group 1 $ BUS Space Node 9/25/2012 12:38:09 AM
•Landsat Observatory Flight Model included 649 groups
• Energy balance similar to shown calculated for each group
•These data used as basis to compare flight versus test thermal
environments.
Listing ordered by heat flow
Group to group FAE radiation couplings
.
.
.
.

Flight Versus TVAC Model Group Comparison
• Verify groups included in each model are consistent with
test configuration.
• Rigorous check performed to identify which sub-models included in
each model.
11 TFAWS 2015 – August 3-7, 2015 – Silver Spring, MD
Sample Output
SUMMARY COMPARISON - Cycle Thru TVAC - Compare to Flight
17 Groups Not Coupled In TVAC File
1 Space Node
5 BUS SA PANEL 1 MLI
6 BUS SA PANEL 1 (CLOSEST TO BUS)
7 BUS SA PANEL 2 (MIDDLE PANEL 1)
8 BUS SA PANEL 3 (MIDDLE PANEL 2)
9 BUS SA PANEL 4 (FARTHEST FROM BUS)
10 BUS SA DAMPER 1 (CLOSEST TO BUS)
11 BUS SA DAMPER 2 (FARTHEST FROM BUS)
12 SADA Wire bundle
13 TIRS ES/SB EARTHSHIELD Upper ES to Wing Closeout
14 TIRS ES/SB EARTHSHIELD Upper Wing
15 TIRS ES/SB EARTHSHIELD Lower ES to Wing Closeout
16 TIRS ES/SB EARTHSHIELD Lower Wing
17 TIRS Strongback (Key Group)
27 Groups In TVAC File Not In Flight File
1 TVAC CHAMBER END - MAN DOOR
2 TVAC L-FRAME
3 TVAC MLI - L-FRAME
4 TVAC L-FRAME ADAPTOR PLATE
5 TVAC MLI L-FRAME ADAPTOR PLATE
6 TVAC STANCHIONS
.
. Output removed
.
22 TVAC TIRS TELE RAD COLD PLATE BACKSIDE MLI
23 TVAC PZ BUS IR PLATE
24 TVAC PZ TIRS IR PLATE
25 TVAC OLI PZ SNORKEL SHOWER CAP
26 TVAC OLI PY SNORKEL SHOWER CAP
27 TVAC TIRS NADIR SHOWER CAP
SUMMARY COMPARISON - Cycle Thru Flight QMAP - Compare To TVAC
4 Groups Not Coupled In Flight File
1 BUS OCXO 1 radiator
2 BUS OCXO 2 radiator
3 BUS DECRYPTOR radiator
4 OLI SPACE NODE
3 Groups In Flt File Not In TVAC File
1 BUS SEP RING
2 TIRS_ES Earth SHIELD 300-359
3 TIRS_ES MLI 403-474
Note:
Due to rules associated with how SINDA generates QMAP files, nodes
not included in the model could show up in the QMAP
but not be coupled to anything.

Flight vs TVAC Power Dissipation Comparison
• Critical to evaluate power dissipation assumptions
embedded in flight and TVAC models for consistency.
• In practice, with hardware as complex as an Observatory,
it is not a simple matter to match powers exactly though
that assumption is implicit in the test verification
methodology.
• Process To Evaluate Power Dissipation Assumption
– Simple program inputs a power dissipation specification file that
lists all groups with power dissipation.
– Program cycles through MAP files, identifies all groups with non-
zero power dissipation, and verifies that specification file has
correctly identified all groups.
– First iterate through TVAC files and then flight files.
12 TFAWS 2015 – August 3-7, 2015 – Silver Spring, MD
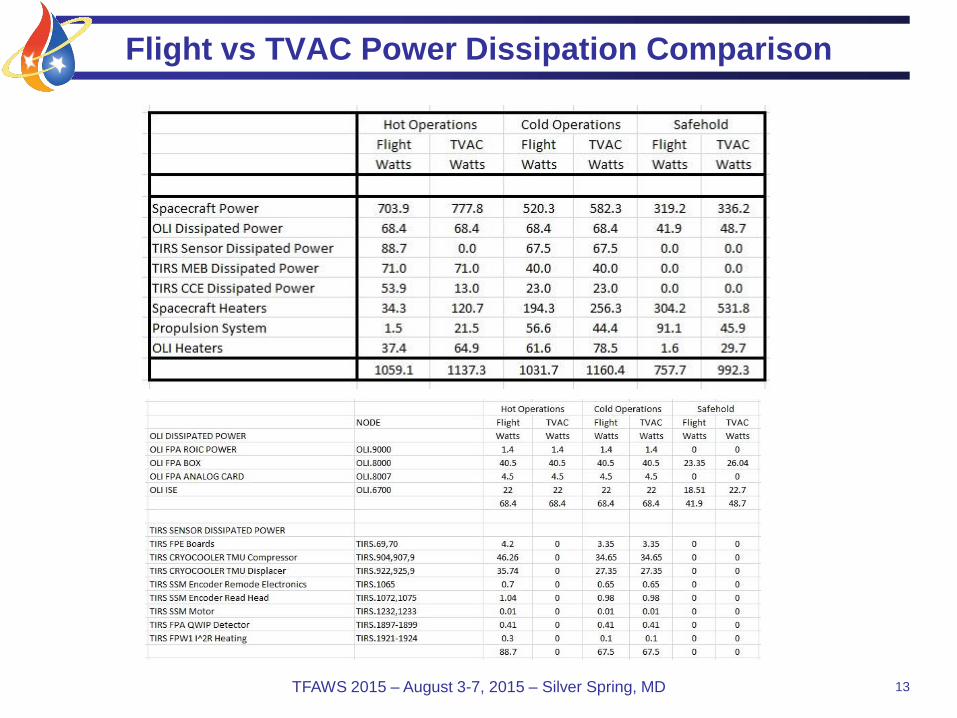
Flight vs TVAC Power Dissipation Comparison
13 TFAWS 2015 – August 3-7, 2015 – Silver Spring, MD

Flight vs Test Environmental Comparison
Flight Thermal Environment
For each group with view to space:
QNet = QAbs – QSpace
Where: QNet = Flight Environment
QAbs = Absorbed heat load from
solar/earth heat sources
QSpace = Heat radiated to space sink
TVAC Thermal Environment
For each group with view to chamber/cold sink:
QTVRad = Heat radiated to TVAC Hardware
( Chamber, Cold plates, etc.)
14 TFAWS 2015 – August 3-7, 2015 – Silver Spring, MD
Flight/TVAC Comparison
Delta = Heat difference for a particular
group between flight and TVAC
Delta=QTVRad – QNet
NetTot = Cumulated delta sum for each
major Observatory hardware
element.
(OLI, TIRS, BUS, PROP)
Note: Test article conductively isolated
from TVAC test support structure and
guarded with zero-Q heaters.
QAbs QSpace
QTVRad
Key Definitions & Nomenclature

Flight vs Test Environmental Comparison
15 TFAWS 2015 – August 3-7, 2015 – Silver Spring, MD
Cold
Ops
Output
For
BUS:
COMPONENT DESCRIPTION FAE Spc TAvg QAbsEnv QSpace QNet TSnk TVSnk Temp QTVRad EnvTestQ DELTA NetTot NetXMLI TEST
in**2 C Watts Watts Watts C ( C ) ( C ) ( W ) (W) ( W ) (W) (W) COND
BUS SA PANEL 4 (FARTHEST FROM BUS) 200416535 22.5 4628.91 4624.55 4.36 22.4 GROUP NOT COUPLED IN TVAC MODEL 0
BUS SA PANEL 3 (MIDDLE PANEL 2) 2003 16465 22.7 4625.63 4615.41 10.22 22.6 GROUP NOT COUPLED IN TVAC MODEL 0
BUS SA PANEL 2 (MIDDLE PANEL 1) 2002 16284 23.3 4633.64 4604.81 28.83 23.2 GROUP NOT COUPLED IN TVAC MODEL 0
BUS SA PANEL 1 (CLOSEST TO BUS) 2001,201511711 16.2 3310.52 3258.61 51.91 21.9 GROUP NOT COUPLED IN TVAC MODEL 0
BUS Instrument Deck MLI 10511-11251 3935.3 -14.9 645.96 641.34 4.61 -13 -26.5 -34 -39.47 0 -44.08 -44.08 0 COLDER
BUS BOTTOM CLOSEOUT BLANKET EXTERNAL MLI 13091,12238.1 -14.7 339.73 355.54 -15.81 -16.4 -61.9 -60.3 -19.33 0 -3.52 -47.6 0 COLDER
BUS SA PANEL 1 MLI 20011 868 50 410.21 346.6 63.61 49.5 GROUP NOT COUPLED IN TVAC MODEL 0
BUS LV ADAPTER MLI 13011-13081 1720.3 -25.5 233.7 249.04 -15.34 -22.7 -58.9 -59.2 -19.47 0 -4.13 -51.73 0 COLDER
BUS MLI - NY PANEL PX 860001 1002 -0.4 171.63 203.1 -31.47 -1.2 -69.9 -70.1 -10.21 0 21.26 -30.47 0 WARMER
BUS RW 3,4 MLI 201 884.6 2.8 176.85 187.62 -10.78 2 -65.8 -66.8 -10.74 0 0.04 -30.43 0 WARMER
BUS PZNY RWA MLI 301 902.6 -1 170.7 181.24 -10.54 -1.6 -62.4 -62.5 -10.2 0 0.34 -30.09 0 WARMER
BUS Battery Radiator 321001-321024 956.9 -5.8 32.02 177.51 -145.49 -97.9 -62.2 -2 -107.48 0 38.01 7.92 38.01 WARMER
BUS MLI - NZ PANEL PX 840001 743 -9.8 129.07 130.8 -1.74 -10.4 -63.5 -65.9 -10.14 0 -8.4 -0.48 38.01 COLDER
BUS TOP CLOSEOUT MLI OUTER 16011,16021,16031,160778.7 -16.4 111.86 125.68 -13.82 -17.5 -51.3 -52.2 -15.53 0 -1.71 -2.19 38.01 COLDER
BUS RW 1,2 MLI 101 659.2 -18.6 97.94 101.34 -3.4 -18.8 -64.5 -65.5 -8.91 0 -5.51 -7.7 38.01 COLDER
BUS MLI - NYNZ PANEL NX 851001 492 -0.1 97.63 100.11 -2.48 -0.2 -66.8 -67.1 -6.19 0 -3.71 -11.41 38.01 COLDER
BUS MLI - PZNY PANEL NX 871001 586.1 -12.2 90.69 99.52 -8.83 -12.3 -59.1 -59 -2.55 0 6.28 -5.13 38.01 WARMER
BUS MLI - NYNZ PANEL PX 850001 480.5 0.7 96.4 98.88 -2.47 -0.5 -65.7 -67.9 -5.84 0 -3.37 -8.5 38.01 COLDER
BUS SSR NZPY PANEL NX Radiating Surface 831010442.5 -1.7 5.45 87.88 -82.43 -102.1 -66.6 1.5 -57.56 0 24.87 16.37 62.88 WARMER.
.
BUS PZ Panel XBND Ant 2 radiating surface 3524034.8 -7.9 6.29 6.3 -0.01 -8.4 -43.6 -24.6 -1.22 0 -1.21 -61.75 54.14 COLDER
BUS OCXO Mounting Plate radiating surface 3133028.9 3.3 2.73 6.17 -3.44 -40.8 -55.6 1.4 -3.7 0 -0.26 -62.01 53.88 COLDER
BUS PZ Panel XBND Ant 1 radiating surface 3522033 -7.5 6.1 6.01 0.08 -6.7 -39.3 -25.7 -0.92 0 -1 -63.01 52.88 COLDER
BUS SADA ELECTRONICS CONTROL UNIT (ECU) MLI 333522.9 15.4 5.87 5.82 0.05 14.8 -67.7 -67.7 -0.31 0 -0.36 -63.37 52.88 COLDER
BUS GPS RX 2 Radiator 33010 20.1 -3.2 0.72 3.91 -3.19 -53.5 -62.1 -3.1 -2.57 0 0.62 -62.75 53.5 WARMER
BUS GPS RX 1 Radiator 33000 19.1 -0.5 0.66 3.87 -3.2 -49.2 -61.7 -3.5 -2.4 0 0.8 -61.95 54.3 WARMER
BUS PY Panel Battery Radiator 32110 34.3 -40.2 4.15 3.7 0.45 -39.1 -62 -62.8 -0.21 0 -0.66 -62.61 53.64 COLDER
BUS DECRYPTOR mli 35601 29.3 -32.8 3.25 3.58 -0.33 -32.8 -52.5 -52.4 -0.35 0 -0.02 -62.63 53.64 COLDER
BUS STAR CAMERA 1 BAFFLE 3120 23.6 -20.4 2.4 3.53 -1.12 -24.6 -44.6 -36.6 -1.32 0 -0.2 -62.83 53.44 COLDER
BUS PZ Panel PX Composite 35330,35380 20.2 -11.3 2.22 3.48 -1.26 -29.4 -30.5 -2.2 -1.74 0 -0.48 -63.31 52.96 COLDER
BUS NYNZ PANEL Radiating surface 851080 17.7 -6.5 0.75 3.28 -2.54 -40.3 -54.7 -9.4 -2.03 0 0.51 -62.8 53.47 WARMER
BUS GPS RX 1 mli 33001 15.7 0.1 3.09 3.2 -0.11 0 -65.9 -65.9 -0.19 0 -0.08 -62.88 53.47 COLDER
BUS Battery Radiator MLI 32101 65.1 -82 2.55 3.18 -0.63 -81.6 -71.9 -72.3 -0.44 0 0.19 -62.69 53.47 WARMER
BUS GPS RX 2 mli 33011 15 -0.6 3.03 3.02 0.01 -0.5 -65.1 -65.4 -0.2 0 -0.21 -62.9 53.47 COLDER
BUS STAR CAMERA 2 BAFFLE 3220 23.5 -30.8 1.96 2.97 -1.01 -35.7 -49.1 -41.2 -1.14 0 -0.13 -63.03 53.34 COLDER
BUS TAM 1 mli 33201 16.5 -15.1 2.62 2.67 -0.06 -15.1 -41 -41.1 -0.15 0 -0.09 -63.12 53.34 COLDER
BUS TAM 2 mli 33211 15.7 -13.2 2.62 2.63 0 -13.2 -41.3 -41.3 -0.14 0 -0.14 -63.26 53.34 COLDER
Summation
Columns
Equivalent Heat Sink calculated for reference.
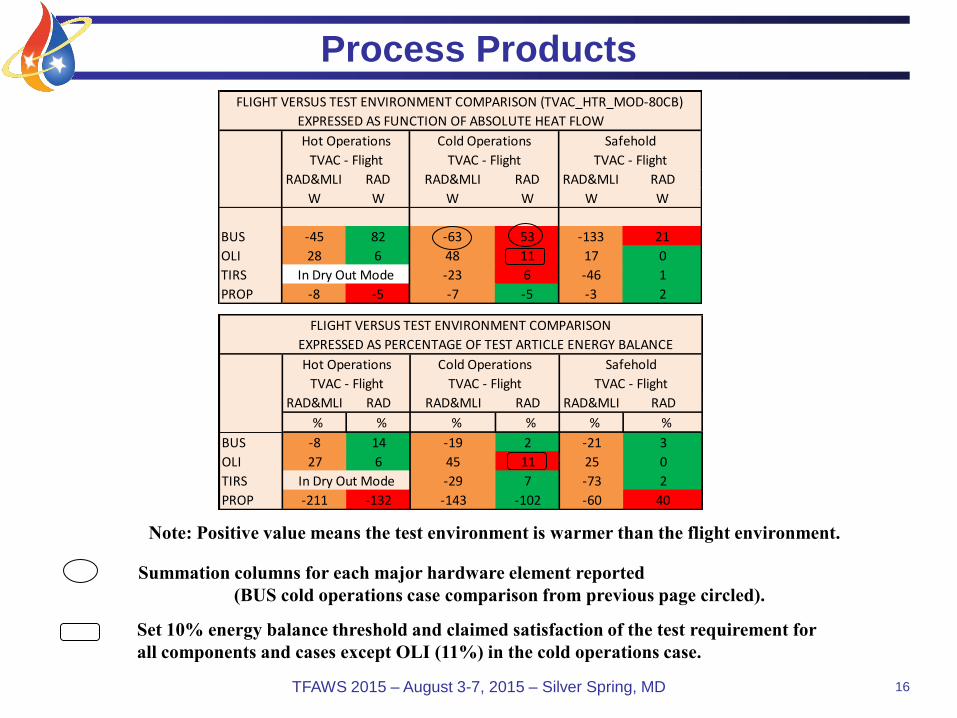
Process Products
16 TFAWS 2015 – August 3-7, 2015 – Silver Spring, MD
EXPRESSED AS FUNCTION OF ABSOLUTE HEAT FLOW
RAD&MLI RAD RAD&MLI RAD RAD&MLI RAD
W W W W W W
BUS -45 82 -63 53 -133 21
OLI 28 6 48 11 17 0
TIRS -23 6 -46 1
PROP -8 -5 -7 -5 -3 2
In Dry Out Mode
FLIGHT VERSUS TEST ENVIRONMENT COMPARISON (TVAC_HTR_MOD-80CB)
SafeholdHot Operations Cold Operations
TVAC - Flight TVAC - Flight TVAC - Flight
Note: Positive value means the test environment is warmer than the flight environment.
EXPRESSED AS PERCENTAGE OF TEST ARTICLE ENERGY BALANCE
RAD&MLI RAD RAD&MLI RAD RAD&MLI RAD
% % % % % %
BUS -8 14 -19 2 -21 3
OLI 27 6 45 11 25 0
TIRS -29 7 -73 2
PROP -211 -132 -143 -102 -60 40
TVAC - Flight TVAC - Flight TVAC - Flight
FLIGHT VERSUS TEST ENVIRONMENT COMPARISON
Hot Operations Cold Operations Safehold
In Dry Out Mode
Summation columns for each major hardware element reported
(BUS cold operations case comparison from previous page circled).
Set 10% energy balance threshold and claimed satisfaction of the test requirement for
all components and cases except OLI (11%) in the cold operations case.
Issues Encountered
• “Bounding” thermal environment easier said than done …
– Complicated hardware and many components with different
temperature requirements.
• For Landsat-8, instrument survival temperature
requirements limited how cold the chamber cold wall
could be (ended up at -100 C for cold cases).
– Understandable since cold case includes orbital environmental
flux inputs whereas the chamber has none.
• Heaters typically not installed at locations where the minimum cold
case maintains temperatures above requirements.
• In the chamber, these locations driven by the local (typically cold wall)
thermal environment which can be colder.
• Projects that include a bounding design case TVAC test requirement
should consider designing for a colder test environment (flight and/or
test heaters).
17 TFAWS 2015 – August 3-7, 2015 – Silver Spring, MD
At The End Of The Day
• What is important …
– Recognize shared goals to exercise models and perform a
successful Observatory thermal vacuum test campaign.
– Develop trust and maintain good communication between teams.
– Minimize time required for Contractor to provide data.
– Very helpful to quantitatively compare test and flight thermal
environments so that the most sensible test conditions are
applied.
– Landsat-8 thermal vacuum test campaign ended up being very
successful with few (if any) modeling issues identified.
18 TFAWS 2015 – August 3-7, 2015 – Silver Spring, MD