textile mills limited...al baraka bank (pakistan) limited bank alfalah limited (islamic) bankislami...
TRANSCRIPT
T e x t i l e M i l l s L i m i t e d
Quarterly ReportCondensed Interim Financial Information
For The 3rd Quarter Ended March 31, 2018

Company Information
BOARD OF DIRECTORS Mohomed Bashir - ChairmanZain Bashir - Vice Chairman/ Executive DirectorMohammed Zaki Bashir - Chief Executive OfficerZiad Bashir - Non Executive DirectorS.M. Nadim Shafiqullah - Non Executive DirectorDr. Amjad Waheed - Independent DirectorEhsan A. Malik - Independent Director
CHIEF FINANCIAL OFFICER Abdul Aleem
COMPANY SECRETARY Salim Ghaffar
AUDIT COMMITTEE Dr. Amjad Waheed - Chairman & MemberMohomed Bashir - MemberS.M. Nadim Shafiqullah - MemberSalim Ghaffar - Secretary
HUMAN RESOURCE AND Ehsan A. Malik - Chairman & MemberREMUNERATION Mohomed Bashir - MemberCOMMITTEE Zain Bashir - Member
Salim Ghaffar - Secretary
BANKERS Allied Bank LimitedBank Al Habib LimitedAskari Bank LimitedAl Baraka Bank (Pakistan) LimitedBank Alfalah Limited (Islamic)Bankislami Pakistan LimitedThe Bank Of PunjabDubai Islamic Bank Pakistan LimitedFaysal Bank LimitedHabib Bank Limited
Quarterly Report March 2018 (1)
Habib Bank LimitedHabib Metropolitan Bank LimitedMCB Bank LimitedMCB Islamic Bank LimitedMeezan Bank LimitedNational Bank Of PakistanSamba Bank LimitedSilkbank LimitedSoneri Bank LimitedStandard Chartered Bank (Pakistan) LimitedUnited Bank LimitedThe Bank of Khyber
AUDITORS Kreston Hyder Bhimji & Co.Chartered Accountants
INTERNAL AUDITORS Grant Thornton Anjum RahmanChartered Accountants
LEGAL ADVISORS A.K. Brohi & CoAdvocates
REGISTERED OFFICE Plot No.82,Main National Highway,Landhi, Karachi-75120
SHARE REGISTRAR FAMCO Associates (Private) Limited8-F, Next To Hotel Faran, Nursery, Block 6,P.E.C.H.S., Shahrah-E-Faisal, Karachi.Phone No. (+92-021) 34380101-5Fax No. (+92-021) 34380106
MILLS Landhi Industrial Area,Karachi-75120
E-MAIL [email protected]
URL www.gulahmed.com
DIRECTORS’REVIEW REPORT TO THE SHAREHOLDERS
The Directors of your Company are pleased to present their review of the affairs of the Company for the nine months ended March 31, 2018.
ECONOMIC OVERVIEW
The pace of growth of our country’s economy remained strong during thefinancial year 2018 and the economy appears to be on a pathto achieve growth of between5.5 to 6.0 percent. This growth is backed bycumulative increase in exports of approximately 12 percent as compared to same period of last year.The turnaround in export has been caused primarily by a healthy growth in textile exports (mainly knitwear, bed wear and readymade garments), as well as by export of foodrelated commodities i.e. rice and sugar. This upturn in exports is likely to continue on the back drop of synchronized recovery in the global economy and world trade.Further, the other inflows such as foreign direct investment and non-resident Pakistani’s remittances have also shown an improvement.
Despite a noticeable turnaround in the country’s exports since early 2017, the pressure on the balance of payments has continued to mount. Import growth has been fairly firm cumulatively from July 2017 to February 2018, rising by 17 percent over same period of last year. Resultantly, the current account deficit rose by 50 percent for the period from July 2017 to February 2018 over same period in FY17, to US$ 10.8 billion. Higher import of energy, iron & steel, transport equipment and food has been the primary driver for the larger import bill.
INDUSTRIAL OVERVIEW
The performance of textile sector is heavily dependent on the local cotton crop. The country has produced around 11.57 million bales up to March 31, 2018 versus the annual revised target of 12.6 million bales. Hence, despite being the world’s fourth largest cotton producer, Pakistan is currently relying on imported cotton to meet the estimated annual demand o f 15 to 16 million bales. Nonetheless, the country’s textile exports has risenduring the year as stated earlier due to the rupee value adjustment, textile package and the GSP plus scheme of the EU. However, exports of cotton cloth remained flat due to weak demand from China.
The textile sectorwhich absorbs 40% of the total industrial workforce andcontributes 62% towards exports still has immense untapped potential. As mentioned above, the textile package and adjustmentof PKR versus US$ parity has provided some respite.However, challenges such as disallowance of adjustment of input tax on packing material, increase in minimum wages, higher production costs as compared to global competitorsand long outstanding receivables from the Government continue to halt revival to its full potential. Notably, the industrial gas tariff in Pakistan is 100% higher and electricity tariff is almost 50% higher as compared to other regional competitors which hampers competitiveness of spinning, weaving and processing industries on a global scale. Owing to this Pakistan is not even in the list of the top 10 textile exporters.
Quarterly Report March 2018 (2)

FINANCIAL PERFORMANCE
During the period under review, the management continued tofocus on profitable avenues, maximizing efficiency in production activities and cost rationalization through various means. These have boosted overall sales and profit as compared to the corresponding period of previous year,drivenby the increase insales which reaped benefits ofBMR investment made in the past few years.The Company made net sales of Rs.32,477 million during the period as against Rs.28,730million in the corresponding period of previous year thusshowing a healthyincrease of around 13%. Further,owing to the effects of cost rationalization measures and BMR activities, the gross profit of the Company improved by 27% over the corresponding period last year, increasing from 18.3% to 20.6%. Accordingly, profit before tax improved by 194 % exhibiting an increase fromRs.494 million to Rs. 1,433 million, while profit after tax increased from Rs. 295 million to Rs. 1,255 million.
Key financialnumbers are presented below:
Description Units Nine months ended
March 31, 2018
Nine monthsended
March 31, 2017Net export sales Rs. in millions 22,123 19,357Net local sales Rs. in millions 10,354 9,373Net total sales Rs. in millions 32,477 28,730Gross profit Rs. in millions 6,680 5,260Profit before tax Rs. in millions 1,433 493Profit after tax Rs. in millions 1,255 294Earningsper share (EPS) Rupees 3.52 0.99Break-up-value per share Rupees 33.06 30.01Debt to equity ratio Times 0.65 0.74Current ratio Times 1.12 1.01
FUTURE OUTLOOK
We see financial year 2018 to be a positive year for the textile sector especially for export orientated companies due to the textile package announced by the government and the anticipated incentives to export-driven sectors.Accordingly, we are optimistic about the future outlook of theCompanyasmanagement will continue to drive agenda ofattractingcustomers through innovation and stronger brand equity, both locally and internationally.Measures are also being taken to rationalize costs which would eventuallyimprove results and ensure sustainability.
Quarterly Report March 2018 (3)
CONSOLIDATED FINANCIAL STATEMENTS
Consolidated financial statements for the nine months ended March 31, 2018 of the Company and its subsidiaries Gul Ahmed International Limited (FZC) - UAE, GTM (Europe) Limited – UK, GTM USA Corp. - USA and Sky Home Corp. – USA are annexed.
ACKNOWELDGEMENT
We acknowledge and appreciate the efforts and valuable support of allstakeholders.
For and on behalf of the Board
April 28, 2018Karachi
_______________ _____________________Mohomed BashirChairman
Mohammed Zaki BashirChief Executive Officer
Quarterly Report March 2018 (4)

2018 31 9
6.05.5 2018
12
2017 17 2018 2017
50 2018 2017 2017 10.8
12.6
11.57 2018 31
Quarterly Report March 2018 (5)
1615 GSP
62 40 US$ PKR
100
50
BMR 28,730 32,477
13 27 BMR
494 194 20.6 18.3 295 1,433
1,255
Quarterly Report March 2018 (6)

2017 31
2018 31
19,357 22,123 9,373 10,354
28,730 32,477 5,260 6,680
493 1,433 294 1,255
0.99 3.52 EPS 30.01 33.06
0.74 0.65 1.01 1.12
2018
Quarterly Report March 2018 (7)
2018 31
GTM GTM FZC USA USA
2018 28
Quarterly Report March 2018 (8)

Condensed Interim Un-consolidated Balance SheetAs at March 31, 2018
Un-Audited AuditedMarch June
Note 2018 2017
EQUITY AND LIABILITIES
SHARE CAPITAL AND RESERVES Authorised share capital 750,000,000 ordinary shares of Rs.10 each (June-2017: 400,000,000 ordinary shares of Rs.10 each) 7,500,000 4,000,000
Issued, subscribed and paid-up capital 3,564,955 3,564,955 356,495,525 ordinary shares of Rs. 10 each
Reserves 8,247,462 7,348,962 11,812,417 10,913,917
NON-CURRENT LIABILITIES Long term financing - Secured 5 6,427,371 7,146,403 Deferred liabilities
Deferred taxation - net 298,358 298,358 Staff retirement benefits 23,271 23,864
321,629 322,222
CURRENT LIABILITIES Trade and other payables 8,171,876 5,583,378 Accrued mark-up/profit 113,093 138,898
Rupees in '000
Quarterly Report March 2018 (9)
Accrued mark-up/profit 113,093 138,898 Short term borrowings 14,402,727 11,935,343 Current maturity of long term financing 5 1,263,344 678,511
23,951,040 18,336,130
CONTINGENCIES AND COMMITMENTS 7
42,512,457 36,718,672
ASSETS
NON-CURRENT ASSETSProperty, plant and equipment 8 15,338,207 15,969,256 Intangible assets 9 26,575 33,747 Long term investment 58,450 58,450 Long term loans and advances 38,851 40,092 Long term deposits 194,227 192,629
15,656,310 16,294,174
CURRENT ASSETSStores, spare parts and loose tools 1,000,573 988,216 Stock-in-trade 16,410,040 12,469,962 Trade debts 4,613,587 3,345,046 Loans and advances 1,097,328 688,979 Short term prepayments 312,724 196,653 Other receivables 1,629,885 1,143,099 Tax refunds due from Government 514,729 648,960 Taxation - net 779,513 673,701 Cash and bank balances 497,768 269,882
26,856,147 20,424,498
42,512,457 36,718,672
MOHOMED BASHIR MOHAMMED ZAKI BASHIR ABDUL ALEEMChief Executive Officer Chief Finance Officer
The annexed notes form an integral part of this condensed interim un-consolidated financial information.
Chairman

Condensed Interim Un-consolidated Profit And Loss AccountFor the nine months ended 31 March, 2018
Note July to March
July to March
January to March
January to March
2018 2017 2018 2017
Sales 32,458,741 28,729,331 11,533,298 10,204,227
Cost of sales
Opening stock of finished goods 9,733,822 11,285,914 11,854,532 11,871,883
Cost of goods manufactured 27,894,212 24,072,083 8,953,751 8,265,906
Closing stock of finished goods (11,829,876) (11,900,897) (11,829,876) (11,900,897)
25,798,158 23,457,100 8,978,407 8,236,892
Gross profit 6,660,583 5,272,231 2,554,891 1,967,335
Distribution cost 3,114,362 2,812,380 1,217,976 1,151,814
Administrative expenses 1,553,336 1,467,123 443,111 355,455
Other operating expenses 122,709 36,596 66,391 21,564
4,790,407 4,316,099 1,727,478 1,528,833
1,870,176 956,132 827,413 438,502
Un-AuditedNine months ended Quarter Ended
----------------------------Rupees in '000----------------------------
Quarterly Report March 2018 (10)
Other income 251,800 172,739 96,728 72,217
Operating profit 2,121,976 1,128,871 924,141 510,719
Finance cost 689,197 635,089 231,856 210,444
Profit before taxation 1,432,779 493,782 692,285 300,275
Taxation
- Current 11 177,783 192,193 55,036 64,329
- Deferred - 6,708 - 24,047
177,783 198,901 55,036 88,376 Profit after taxation 1,254,996 294,881 637,249 211,899
Re-stated Re-stated
Earning per share - basic and diluted (Rs.) 3.52 0.91 1.79 0.65
MOHOMED BASHIR MOHAMMED ZAKI BASHIR ABDUL ALEEMChief Executive Officer Chief Finance Officer
0
Chairman
The annexed notes form an integral part of this condensed interim un-consolidated financial information.
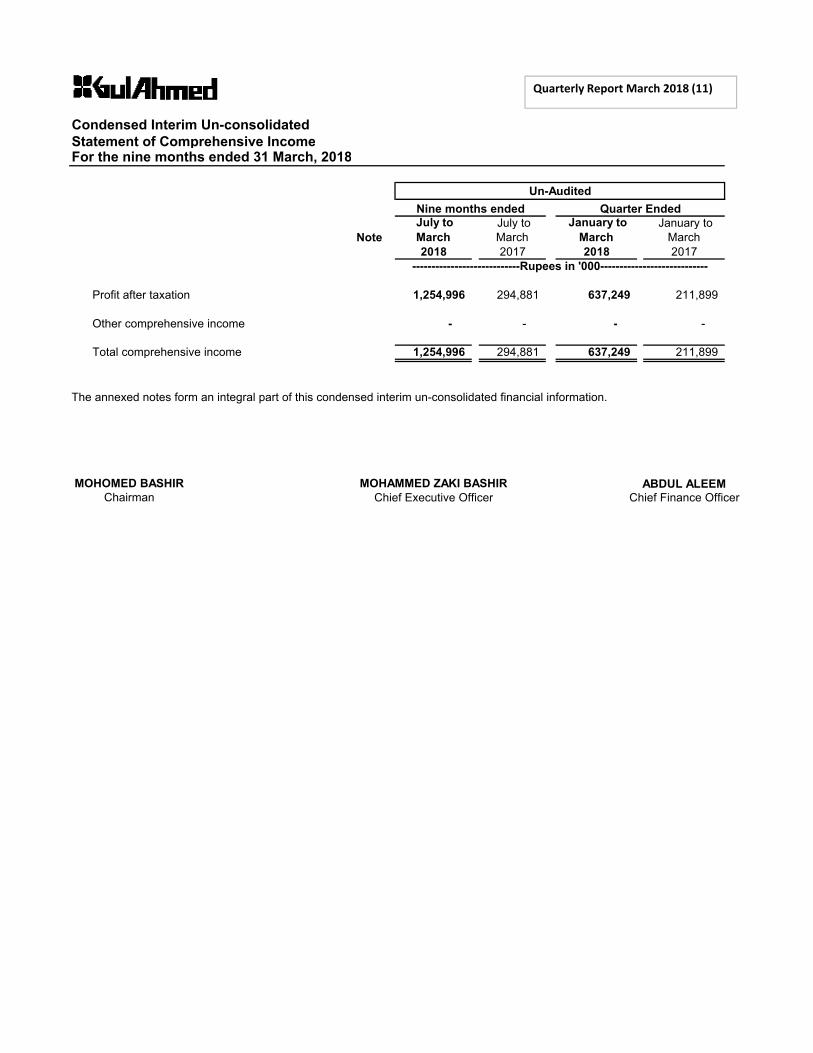
Condensed Interim Un-consolidated Statement of Comprehensive IncomeFor the nine months ended 31 March, 2018
Note July to March
July to March
January to March
January to March
2018 2017 2018 2017
Profit after taxation 1,254,996 294,881 637,249 211,899
Other comprehensive income - - - -
Total comprehensive income 1,254,996 294,881 637,249 211,899
MOHOMED BASHIR MOHAMMED ZAKI BASHIR ABDUL ALEEMChairman Chief Executive Officer Chief Finance Officer
The annexed notes form an integral part of this condensed interim un-consolidated financial information.
Un-AuditedNine months ended Quarter Ended
----------------------------Rupees in '000----------------------------
Quarterly Report March 2018 (11)
Chairman Chief Executive Officer Chief Finance Officer

Condensed Interim Un-ConsolidatedCash Flow StatementFor the nine months ended 31 March, 2018
Note March March 2018 2017
CASH FLOWS FROM OPERATING ACTIVITIES
Profit before taxation 1,432,779 493,782
Adjustments for:Depreciation 1,365,390 1,139,479 Amortisation 7,412 4,219 Provision for gratuity 34,722 20,701 Finance cost 689,197 635,089 Provision for slow moving/obsolete stores,
spares and loose tools 17,052 10,984 Impairment allowance against doubtful trade debts 31,604 28,740
Loss on disposal of property, plant and equipment 15,778 1,866 Unclaimed liabilities written back - 937
Gain on disposal of property, plant and equipment (66,189) (13,793) 2,094,966 1,828,222
Cash flows from operating activities before adjustments of working capital 3,527,745 2,322,004
Un-AuditedNine months ended
-----------Rupees in '000-----------
Quarterly Report March 2018 (12)
working capital 3,527,745 2,322,004
Changes in working capital: (Increase)/Decrease in current assets
Stores, spare parts and loose tools (29,409) (134,122) Stock-in-trade (3,940,078) (1,147,746)Trade debts (1,300,145) 175,741 Loans and advances (408,349) (227,721) Short term prepayments (116,071) (27,131) Other receivables (486,786) (348,516) Tax refunds due from Government 134,231 343,083
(6,146,607) (1,366,412) Increase in current liabilities
Trade and other payables 2,585,086 678,147 (3,561,521) (688,265)
Cash generated (used in) / from operations (33,776) 1,633,739
Adjustments for:Gratuity paid (35,315) (48,848) Finance cost paid (715,002) (647,207) Income tax paid (283,595) (567,074) Net decrease in Long term loans and Advances 1,241 (19,818) Net (decrease) in Long term deposits (1,598) (40,461)
(1,034,269) (1,323,408)Net Cash (used in) / generated from Operating activities (1,068,045) 310,331
CASH FLOWS FROM INVESTING ACTIVITIES
Addition to property, plant and equipment (895,172) (4,519,077)Addition to intangible assets (240) (7,748) Proceeds from sale of property, plant and equipment 211,242 25,065 Net cash used in investing activities (684,170) (4,501,760)
Balance carried forward (1,752,215) (4,191,429)

Condensed Interim Un-ConsolidatedCash Flow StatementFor the nine months ended 31 March, 2018
Note March March 2018 2017
Balance brought forward (1,752,215) (4,191,429)
CASH FLOWS FROM FINANCING ACTIVITIES
Proceeds from long term financing 425,754 2,983,753 Repayments of long term financing (559,953) (631,234) Dividend paid (353,084) (96,947)
Net cash (used in) / generated from financing activities (487,283) 2,255,572
Net decrease in cash and cash equivalents (2,239,498) (1,935,857)
Cash and cash equivalents - at the beginning of the period (11,665,461) (12,558,716)
Cash and cash equivalents - at the end of the period 10 (13,904,959) (14,494,573)
Un-Audited
-----------Rupees in '000-----------
Quarterly Report March 2018 (13)
MOHOMED BASHIR MOHAMMED ZAKI BASHIR ABDUL ALEEMChairman Chief Executive Officer Chief Finance Officer
The annexed notes form an integral part of this condensed interim un-consolidated financial information.
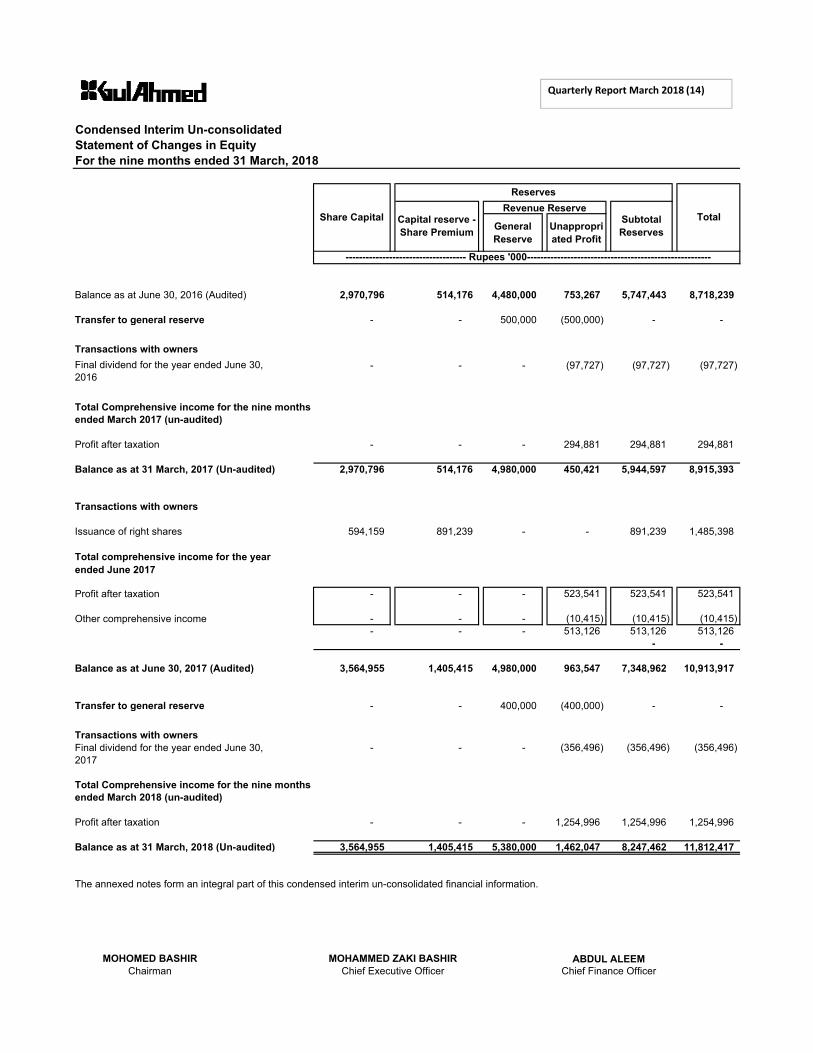
Condensed Interim Un-consolidated Statement of Changes in EquityFor the nine months ended 31 March, 2018
General Reserve
Unappropriated Profit
Balance as at June 30, 2016 (Audited) 2,970,796 514,176 4,480,000 753,267 5,747,443 8,718,239
Transfer to general reserve - - 500,000 (500,000) - -
Transactions with owners- - - (97,727) (97,727) (97,727)
Total Comprehensive income for the nine monthsended March 2017 (un-audited)
Profit after taxation - - - 294,881 294,881 294,881
Balance as at 31 March, 2017 (Un-audited) 2,970,796 514,176 4,980,000 450,421 5,944,597 8,915,393
Reserves
------------------------------------ Rupees '000-------------------------------------------------------
TotalCapital reserve - Share Premium
Revenue ReserveSubtotal Reserves
Share Capital
Final dividend for the year ended June 30, 2016
Quarterly Report March 2018 (14)
Transactions with owners
Issuance of right shares 594,159 891,239 - - 891,239 1,485,398
- - - 523,541 523,541 523,541
- - - (10,415) (10,415) (10,415) - - - 513,126 513,126 513,126
- -
Balance as at June 30, 2017 (Audited) 3,564,955 1,405,415 4,980,000 963,547 7,348,962 10,913,917
Transfer to general reserve - - 400,000 (400,000) - -
Transactions with owners- - - (356,496) (356,496) (356,496)
Total Comprehensive income for the nine monthsended March 2018 (un-audited)
Profit after taxation - - - 1,254,996 1,254,996 1,254,996
Balance as at 31 March, 2018 (Un-audited) 3,564,955 1,405,415 5,380,000 1,462,047 8,247,462 11,812,417
MOHOMED BASHIR MOHAMMED ZAKI BASHIR ABDUL ALEEMChairman Chief Executive Officer Chief Finance Officer
Final dividend for the year ended June 30, 2017
The annexed notes form an integral part of this condensed interim un-consolidated financial information.
Total comprehensive income for the year ended June 2017
Profit after taxation
Other comprehensive income
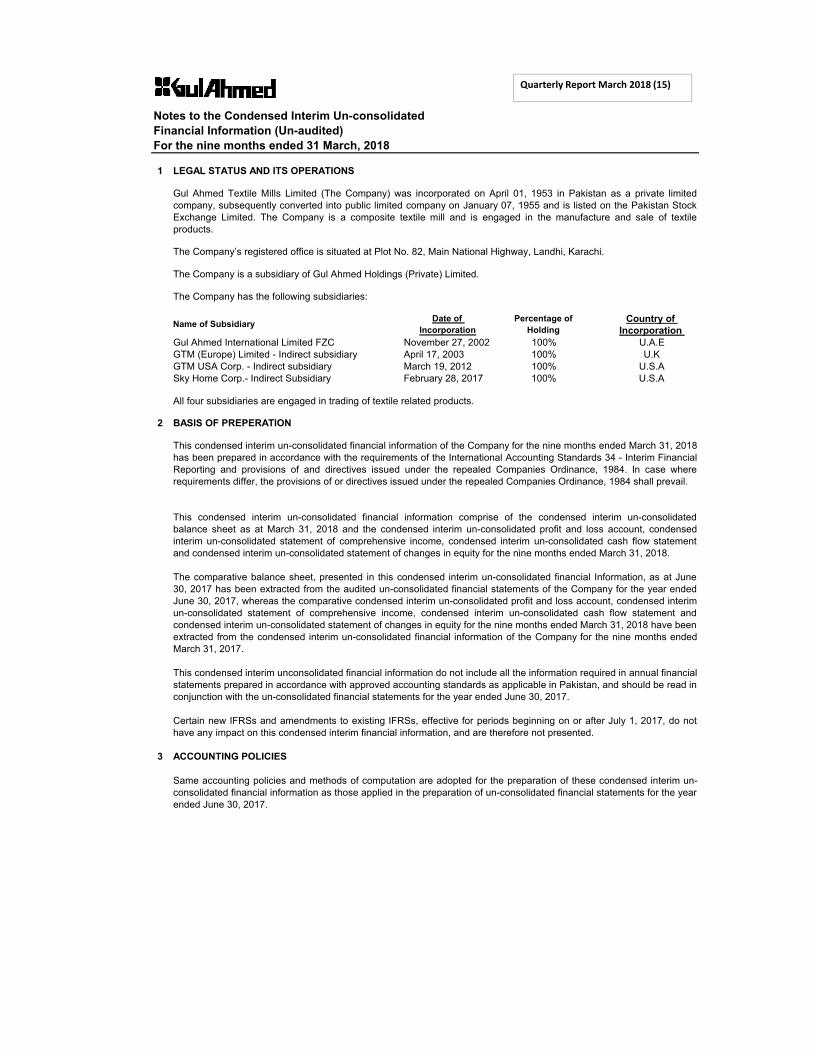
Notes to the Condensed Interim Un-consolidated Financial Information (Un-audited)For the nine months ended 31 March, 2018
1 LEGAL STATUS AND ITS OPERATIONS
The Company is a subsidiary of Gul Ahmed Holdings (Private) Limited.
Country of Incorporation
Gul Ahmed International Limited FZC November 27, 2002 100% U.A.EGTM (Europe) Limited - Indirect subsidiary April 17, 2003 100% U.KGTM USA Corp. - Indirect subsidiary March 19, 2012 100% U.S.ASky Home Corp.- Indirect Subsidiary February 28, 2017 100% U.S.A
2 BASIS OF PREPERATION
Gul Ahmed Textile Mills Limited (The Company) was incorporated on April 01, 1953 in Pakistan as a private limitedcompany, subsequently converted into public limited company on January 07, 1955 and is listed on the Pakistan StockExchange Limited. The Company is a composite textile mill and is engaged in the manufacture and sale of textileproducts.
The Company’s registered office is situated at Plot No. 82, Main National Highway, Landhi, Karachi.
The Company has the following subsidiaries:
Name of Subsidiary Date of Percentage of HoldingIncorporation
All four subsidiaries are engaged in trading of textile related products.
This condensed interim un-consolidated financial information of the Company for the nine months ended March 31, 2018has been prepared in accordance with the requirements of the International Accounting Standards 34 - Interim FinancialReporting and provisions of and directives issued under the repealed Companies Ordinance, 1984. In case whererequirements differ, the provisions of or directives issued under the repealed Companies Ordinance, 1984 shall prevail.
Quarterly Report March 2018 (15)
3 ACCOUNTING POLICIES
Same accounting policies and methods of computation are adopted for the preparation of these condensed interim un-consolidated financial information as those applied in the preparation of un-consolidated financial statements for the yearended June 30, 2017.
This condensed interim un-consolidated financial information comprise of the condensed interim un-consolidatedbalance sheet as at March 31, 2018 and the condensed interim un-consolidated profit and loss account, condensedinterim un-consolidated statement of comprehensive income, condensed interim un-consolidated cash flow statementand condensed interim un-consolidated statement of changes in equity for the nine months ended March 31, 2018.
The comparative balance sheet, presented in this condensed interim un-consolidated financial Information, as at June30, 2017 has been extracted from the audited un-consolidated financial statements of the Company for the year endedJune 30, 2017, whereas the comparative condensed interim un-consolidated profit and loss account, condensed interimun-consolidated statement of comprehensive income, condensed interim un-consolidated cash flow statement andcondensed interim un-consolidated statement of changes in equity for the nine months ended March 31, 2018 have beenextracted from the condensed interim un-consolidated financial information of the Company for the nine months endedMarch 31, 2017.
This condensed interim unconsolidated financial information do not include all the information required in annual financialstatements prepared in accordance with approved accounting standards as applicable in Pakistan, and should be read inconjunction with the un-consolidated financial statements for the year ended June 30, 2017.
Certain new IFRSs and amendments to existing IFRSs, effective for periods beginning on or after July 1, 2017, do nothave any impact on this condensed interim financial information, and are therefore not presented.
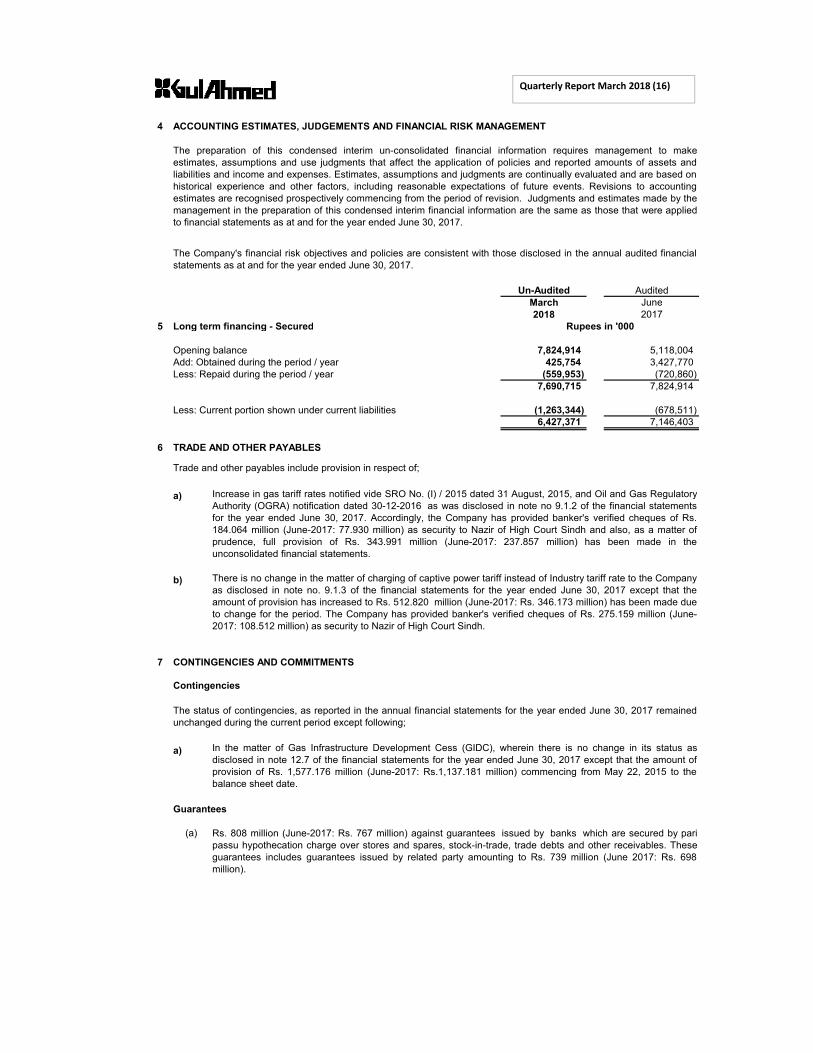
4 ACCOUNTING ESTIMATES, JUDGEMENTS AND FINANCIAL RISK MANAGEMENT
Un-Audited AuditedMarch June2018 2017
5 Long term financing - Secured
Opening balance 7,824,914 5,118,004 Add: Obtained during the period / year 425,754 3,427,770 Less: Repaid during the period / year (559,953) (720,860)
7,690,715 7,824,914
Less: Current portion shown under current liabilities (1,263,344) (678,511) 6,427,371 7,146,403
6 TRADE AND OTHER PAYABLES
Trade and other payables include provision in respect of;
a)
The Company's financial risk objectives and policies are consistent with those disclosed in the annual audited financialstatements as at and for the year ended June 30, 2017.
The preparation of this condensed interim un-consolidated financial information requires management to makeestimates, assumptions and use judgments that affect the application of policies and reported amounts of assets andliabilities and income and expenses. Estimates, assumptions and judgments are continually evaluated and are based onhistorical experience and other factors, including reasonable expectations of future events. Revisions to accountingestimates are recognised prospectively commencing from the period of revision. Judgments and estimates made by themanagement in the preparation of this condensed interim financial information are the same as those that were appliedto financial statements as at and for the year ended June 30, 2017.
Rupees in '000
Increase in gas tariff rates notified vide SRO No. (I) / 2015 dated 31 August, 2015, and Oil and Gas Regulatory
Quarterly Report March 2018 (16)
a)
b)
7 CONTINGENCIES AND COMMITMENTS
Contingencies
a)
Guarantees
(a)
Increase in gas tariff rates notified vide SRO No. (I) / 2015 dated 31 August, 2015, and Oil and Gas RegulatoryAuthority (OGRA) notification dated 30-12-2016 as was disclosed in note no 9.1.2 of the financial statementsfor the year ended June 30, 2017. Accordingly, the Company has provided banker's verified cheques of Rs.184.064 million (June-2017: 77.930 million) as security to Nazir of High Court Sindh and also, as a matter ofprudence, full provision of Rs. 343.991 million (June-2017: 237.857 million) has been made in theunconsolidated financial statements.
There is no change in the matter of charging of captive power tariff instead of Industry tariff rate to the Companyas disclosed in note no. 9.1.3 of the financial statements for the year ended June 30, 2017 except that theamount of provision has increased to Rs. 512.820 million (June-2017: Rs. 346.173 million) has been made dueto change for the period. The Company has provided banker's verified cheques of Rs. 275.159 million (June-2017: 108.512 million) as security to Nazir of High Court Sindh.
The status of contingencies, as reported in the annual financial statements for the year ended June 30, 2017 remainedunchanged during the current period except following;
In the matter of Gas Infrastructure Development Cess (GIDC), wherein there is no change in its status asdisclosed in note 12.7 of the financial statements for the year ended June 30, 2017 except that the amount ofprovision of Rs. 1,577.176 million (June-2017: Rs.1,137.181 million) commencing from May 22, 2015 to thebalance sheet date.
Rs. 808 million (June-2017: Rs. 767 million) against guarantees issued by banks which are secured by paripassu hypothecation charge over stores and spares, stock-in-trade, trade debts and other receivables. Theseguarantees includes guarantees issued by related party amounting to Rs. 739 million (June 2017: Rs. 698million).
(b)
(c)
(d)
Commitments
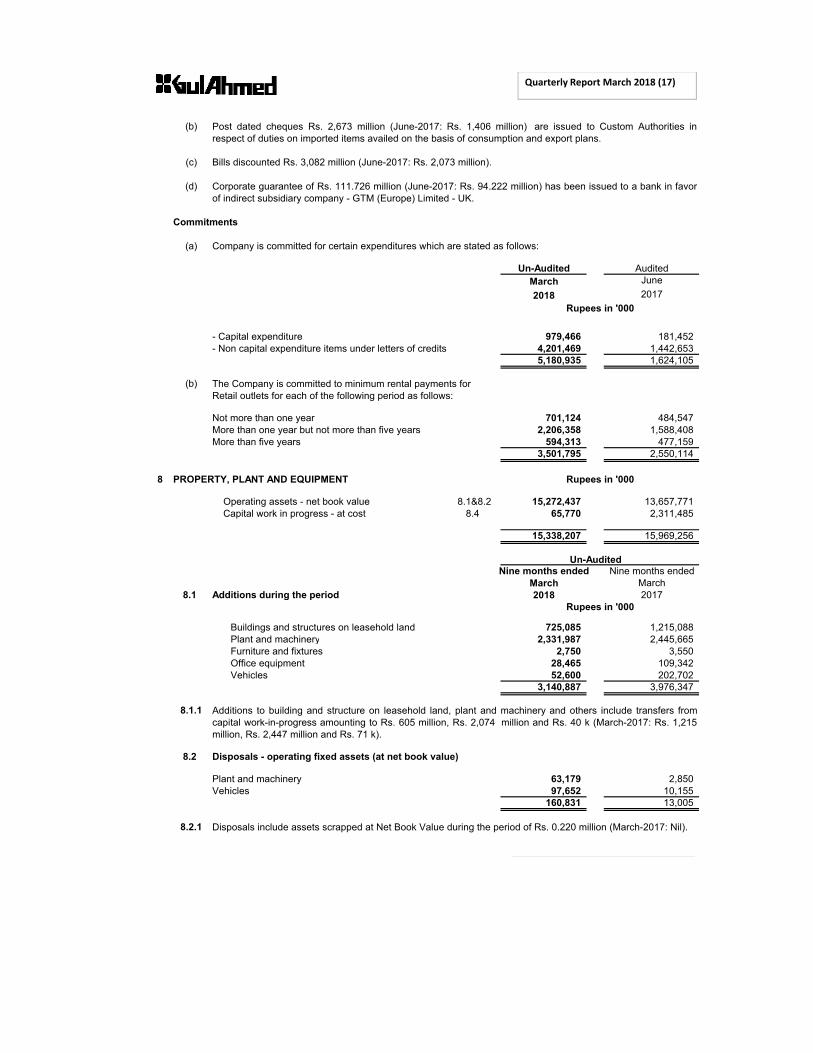
(a) Company is committed for certain expenditures which are stated as follows:
Un-Audited AuditedMarch June2018 2017
- Capital expenditure 979,466 181,452 - Non capital expenditure items under letters of credits 4,201,469 1,442,653
5,180,935 1,624,105
(b)
Not more than one year 701,124 484,547 More than one year but not more than five years 2,206,358 1,588,408 More than five years 594,313 477,159
3,501,795 2,550,114
8 PROPERTY, PLANT AND EQUIPMENT
Post dated cheques Rs. 2,673 million (June-2017: Rs. 1,406 million) are issued to Custom Authorities inrespect of duties on imported items availed on the basis of consumption and export plans.
Bills discounted Rs. 3,082 million (June-2017: Rs. 2,073 million).
Corporate guarantee of Rs. 111.726 million (June-2017: Rs. 94.222 million) has been issued to a bank in favorof indirect subsidiary company - GTM (Europe) Limited - UK.
Rupees in '000
The Company is committed to minimum rental payments for Retail outlets for each of the following period as follows:
Rupees in '000
Quarterly Report March 2018 (17)
Operating assets - net book value 8.1&8.2 15,272,437 13,657,771 Capital work in progress - at cost 8.4 65,770 2,311,485
15,338,207 15,969,256
Un-AuditedNine months ended Nine months ended
March March8.1 Additions during the period 2018 2017
Buildings and structures on leasehold land 725,085 1,215,088 Plant and machinery 2,331,987 2,445,665 Furniture and fixtures 2,750 3,550 Office equipment 28,465 109,342 Vehicles 52,600 202,702
3,140,887 3,976,347
8.1.1
8.2 Disposals - operating fixed assets (at net book value)
Plant and machinery 63,179 2,850 Vehicles 97,652 10,155
160,831 13,005
8.2.1 Disposals include assets scrapped at Net Book Value during the period of Rs. 0.220 million (March-2017: Nil).
Rupees in '000
Additions to building and structure on leasehold land, plant and machinery and others include transfers fromcapital work-in-progress amounting to Rs. 605 million, Rs. 2,074 million and Rs. 40 k (March-2017: Rs. 1,215million, Rs. 2,447 million and Rs. 71 k).

Un-AuditedNine months ended Nine months ended
March March2018 2017
8.3 Depreciation charge during the period 1,365,390 1,139,479
8.4 Additions - capital work in progress (at cost)
Machinery 402,108 3,266,662 Building 238,565 937,892 Others - 32
640,673 4,204,586
Note Un-Audited Audited9 INTANGIBLE ASSETS March June
2018 2017
Intangible - net book value 9.1&9.2 26,575 33,747
Un-AuditedNine months ended Nine months ended
March March2018 2017
9.1 Additions - intangibles (at cost)Computer Software 240 7,748
9.2 Amortization charge during the period 7,412 4,219
10 CASH AND CASH EQUIVALENTS March June
Rupees in '000
Rupees in '000
Rupees in '000
Quarterly Report March 2018 (18)
10 CASH AND CASH EQUIVALENTS March June2018 2017
Cash and cash equivalents comprises of:
Cash and bank balances 497,768 363,109Short term borrowings (14,402,727) (14,857,682)
(13,904,959) (14,494,573)
11 TAXATIONProvision for current taxation has been made on the basis of normal tax liability, final taxation, tax credit andseparate block income under the Income Tax Ordinance, 2001.
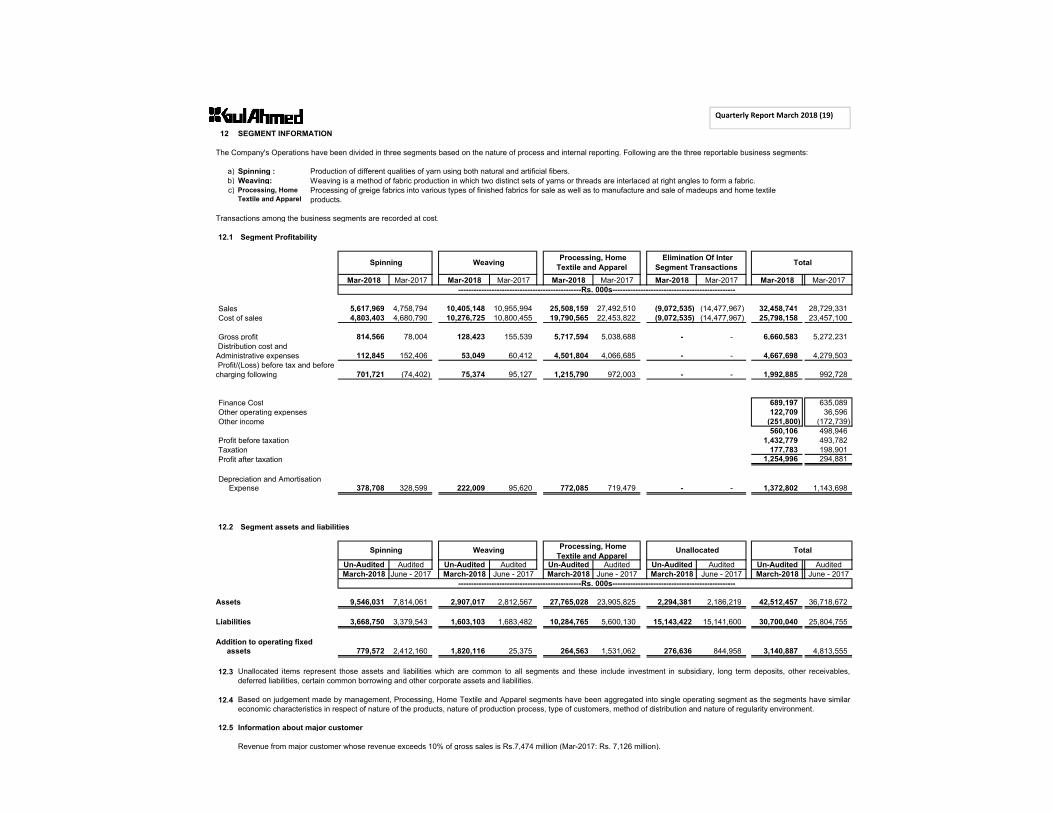
12 SEGMENT INFORMATION
a) Spinning : Production of different qualities of yarn using both natural and artificial fibers.b) Weaving:c)
Transactions among the business segments are recorded at cost.
12.1 Segment Profitability
Mar-2018 Mar-2017 Mar-2018 Mar-2017 Mar-2018 Mar-2017 Mar-2018 Mar-2017 Mar-2018 Mar-2017
Sales 5,617,969 4,758,794 10,405,148 10,955,994 25,508,159 27,492,510 (9,072,535) (14,477,967) 32,458,741 28,729,331Cost of sales 4,803,403 4,680,790 10,276,725 10,800,455 19,790,565 22,453,822 (9,072,535) (14,477,967) 25,798,158 23,457,100
Gross profit 814,566 78,004 128,423 155,539 5,717,594 5,038,688 - - 6,660,583 5,272,231
112,845 152,406 53,049 60,412 4,501,804 4,066,685 - - 4,667,698 4,279,503
701,721 (74,402) 75,374 95,127 1,215,790 972,003 - - 1,992,885 992,728
The Company's Operations have been divided in three segments based on the nature of process and internal reporting. Following are the three reportable business segments:
Weaving is a method of fabric production in which two distinct sets of yarns or threads are interlaced at right angles to form a fabric.Processing, Home Textile and Apparel
Processing of greige fabrics into various types of finished fabrics for sale as well as to manufacture and sale of madeups and home textile products.
Spinning Weaving Processing, Home Textile and Apparel
Elimination Of Inter Segment Transactions Total
------------------------------------------------Rs. 000s------------------------------------------------
Distribution cost and Administrative expenses Profit/(Loss) before tax and before charging following
Quarterly Report March 2018 (19)
Finance Cost 689,197 635,089 Other operating expenses 122,709 36,596 Other income (251,800) (172,739)
560,106 498,946 Profit before taxation 1,432,779 493,782 Taxation 177,783 198,901 Profit after taxation 1,254,996 294,881
Depreciation and Amortisation Expense 378,708 328,599 222,009 95,620 772,085 719,479 - - 1,372,802 1,143,698
12.2 Segment assets and liabilities
Un-Audited Audited Un-Audited Audited Un-Audited Audited Un-Audited Audited Un-Audited AuditedMarch-2018 June - 2017 March-2018 June - 2017 March-2018 June - 2017 March-2018 June - 2017 March-2018 June - 2017
Assets 9,546,031 7,814,061 2,907,017 2,812,567 27,765,028 23,905,825 2,294,381 2,186,219 42,512,457 36,718,672
Liabilities 3,668,750 3,379,543 1,603,103 1,683,482 10,284,765 5,600,130 15,143,422 15,141,600 30,700,040 25,804,755
Addition to operating fixed assets 779,572 2,412,160 1,820,116 25,375 264,563 1,531,062 276,636 844,958 3,140,887 4,813,555
12.3
12.4
12.5 Information about major customer
Revenue from major customer whose revenue exceeds 10% of gross sales is Rs.7,474 million (Mar-2017: Rs. 7,126 million).
Spinning Weaving Processing, Home Textile and Apparel
Unallocated
------------------------------------------------Rs. 000s------------------------------------------------
Unallocated items represent those assets and liabilities which are common to all segments and these include investment in subsidiary, long term deposits, other receivables,deferred liabilities, certain common borrowing and other corporate assets and liabilities.
Based on judgement made by management, Processing, Home Textile and Apparel segments have been aggregated into single operating segment as the segments have similareconomic characteristics in respect of nature of the products, nature of production process, type of customers, method of distribution and nature of regularity environment.
Total
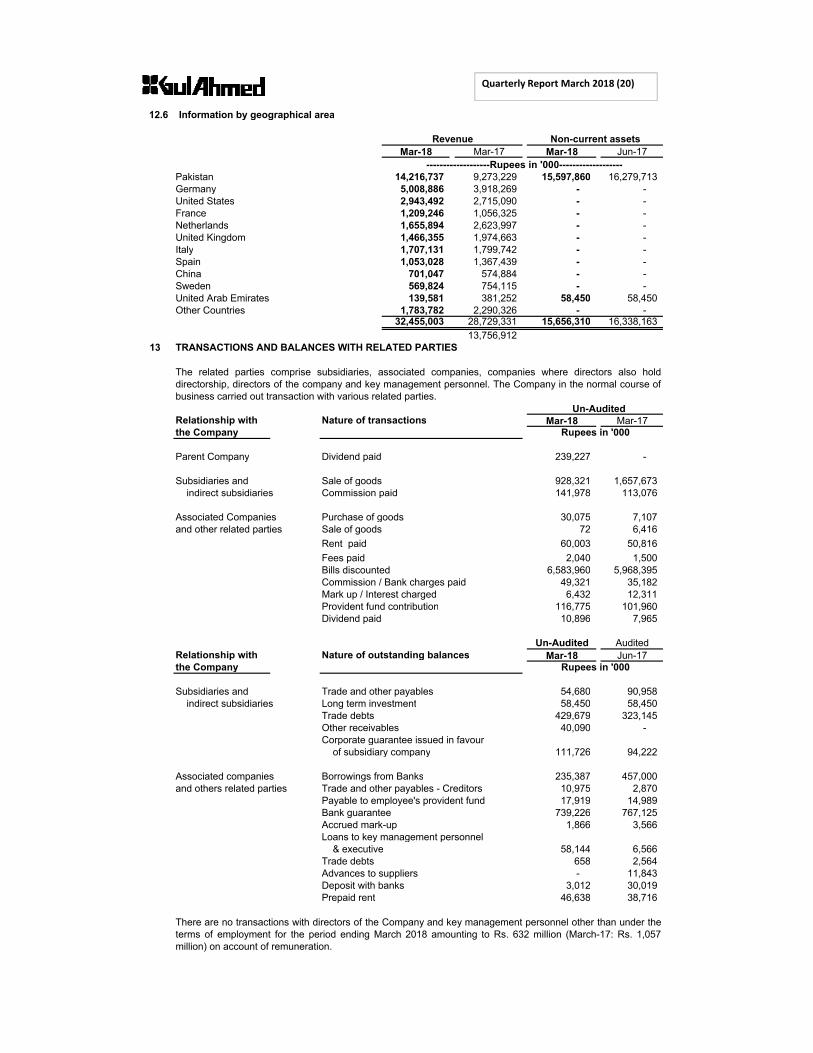
12.6 Information by geographical area
Mar-18 Mar-17 Mar-18 Jun-17
Pakistan 14,216,737 9,273,229 15,597,860 16,279,713Germany 5,008,886 3,918,269 - - United States 2,943,492 2,715,090 - - France 1,209,246 1,056,325 - - Netherlands 1,655,894 2,623,997 - - United Kingdom 1,466,355 1,974,663 - - Italy 1,707,131 1,799,742 - - Spain 1,053,028 1,367,439 - - China 701,047 574,884 - - Sweden 569,824 754,115 - - United Arab Emirates 139,581 381,252 58,450 58,450 Other Countries 1,783,782 2,290,326 - -
32,455,003 28,729,331 15,656,310 16,338,16313,756,912
13 TRANSACTIONS AND BALANCES WITH RELATED PARTIES
Un-AuditedRelationship with Nature of transactions Mar-18 Mar-17the Company
Parent Company Dividend paid 239,227 -
Subsidiaries and Sale of goods 928,321 1,657,673 indirect subsidiaries Commission paid 141,978 113,076
Rupees in '000
Revenue Non-current assets
-------------------Rupees in '000-------------------
The related parties comprise subsidiaries, associated companies, companies where directors also holddirectorship, directors of the company and key management personnel. The Company in the normal course ofbusiness carried out transaction with various related parties.
Quarterly Report March 2018 (20)
indirect subsidiaries Commission paid 141,978 113,076
Associated Companies Purchase of goods 30,075 7,107 and other related parties Sale of goods 72 6,416
Rent paid 60,003 50,816 Fees paid 2,040 1,500 Bills discounted 6,583,960 5,968,395 Commission / Bank charges paid 49,321 35,182 Mark up / Interest charged 6,432 12,311 Provident fund contribution 116,775 101,960 Dividend paid 10,896 7,965
Un-Audited AuditedRelationship with Nature of outstanding balances Mar-18 Jun-17the Company
Subsidiaries and Trade and other payables 54,680 90,958 indirect subsidiaries Long term investment 58,450 58,450
Trade debts 429,679 323,145 Other receivables 40,090 - Corporate guarantee issued in favour
of subsidiary company 111,726 94,222
Associated companies Borrowings from Banks 235,387 457,000 and others related parties Trade and other payables - Creditors 10,975 2,870
Payable to employee's provident fund 17,919 14,989 Bank guarantee 739,226 767,125 Accrued mark-up 1,866 3,566 Loans to key management personnel
& executive 58,144 6,566 Trade debts 658 2,564Advances to suppliers - 11,843 Deposit with banks 3,012 30,019 Prepaid rent 46,638 38,716
Rupees in '000
There are no transactions with directors of the Company and key management personnel other than under theterms of employment for the period ending March 2018 amounting to Rs. 632 million (March-17: Rs. 1,057million) on account of remuneration.
14 FAIR VALUES
- Level 1
- Level 2
- Level 3
15 DATE OF AUTHORISATION
16 GENERAL
Financial assets and liabilities of the Company are either short term in nature or are repriced periodicallytherefore; their carrying amounts approximate their fair values.
These financial statements were authorised for issue on April 28, 2018 by the Board of Directors of theCompany.
Fair value is the price that would be received to sell an asset or paid to transfer a liability in an orderlytransaction in the principal (or most advantageous) market at the measurement date under current marketconditions (i.e. an exit price) regardless of whether that price is directly observable or estimated using anothervaluation technique.
The Company while assessing fair values uses valuation techniques that are appropriate in the circumstances
using relevant observable data as far as possible and minimizing the use of unobservable inputs. Fair values
are categorized into following three levels based on the input used in the valuation techniques;
Quoted prices in active markets for identical assets or liabilities that can be assessed atmeasurement.
Inputs other than quoted prices included within level 1 that are observable for the asset or liability,either directly (that is, as prices) or indirectly (that is, derived from prices).
Inputs are unobservable inputs for the asset or liability Inputs for the asset or liability that are notbased on observable market data (that is, unobservable inputs).
Quarterly Report March 2018 (21)
16 GENERAL
16.1
16.2 Figures have been rounded off to the nearest thousand rupees.
16.3
16.4
MOHOMED BASHIR MOHAMMED ZAKI BASHIR ABDUL ALEEMChairman Chief Executive Officer Chief Finance Officer
Allocations for the workers' profit participation fund, workers' welfare fund and taxation are provisional and finalliability including liability for deferred taxation will be determined on the basis of annual results.
During the interim period, comparative figure of Rs. 43.98 million has been reclassified from Intangibles CapitalWork in Progress to short term prepayments due to clarification of terms of transaction during the period.
During the interim period, comparative figures in profit and loss account have been reclassified in order toensure fair and accurate presentation of unconsolidated interim financial information. For the nine months andquarter ended 31 March, 2017, Rs. 261 million has been reclassified from administrative expenses todistribution cost and Rs. 12.3 million has been reclassified from cost of good manufactured to administrativeexpenses.
T e x t i l e M i l l s L i m i t e d
Consolidated AccountsConsolidated Condensed Interim Financial Information
For The 3rd Quarter Ended March 31, 2018

Condensed Interim Consolidated Balance SheetAs at March 31, 2018
Un-Audited AuditedMarch June
Note 2018 2017
EQUITY AND LIABILITIES
SHARE CAPITAL AND RESERVES Authorised share capital 750,000,000 ordinary shares of Rs.10 each (June-2017: 400,000,000 ordinary shares of Rs.10 each) 7,500,000 4,000,000
Issued, subscribed and paid-up capital 3,564,955 3,564,955 356,495,525 ordinary shares of Rs. 10 each
Reserves 8,629,553 7,630,703 12,194,508 11,195,658
NON-CURRENT LIABILITIES Long term financing - Secured 6,427,371 7,146,403 Deferred liabilities
Deferred taxation 316,419 316,420 Staff retirement benefits 30,940 31,033
347,359 347,453
CURRENT LIABILITIES Trade and other payables 8,258,541 5,773,604 Accrued mark-up/profit 113,093 138,898 Short term borrowings 14,402,727 11,935,343
------------Rupees in '000------------
Quarterly Report March 2018 (22)
Short term borrowings 14,402,727 11,935,343 Current maturity of long term financing 1,263,344 678,511 Income tax payable 3,172 3,043
24,040,877 18,529,399
CONTINGENCIES AND COMMITMENTS 7
43,010,115 37,218,913
ASSETS
NON-CURRENT ASSETSProperty, plant and equipment 8 15,358,219 15,992,062 Intangible assets 9 33,710 41,887 Long term loans and advances 38,851 40,092Long term deposits 194,227 195,249 Deferred taxation - 98
15,625,007 16,269,388
CURRENT ASSETSStores, spare parts and loose tools 1,000,573 988,216 Stock-in-trade 16,643,239 12,661,087 Trade debts 4,809,231 3,640,608 Loans and advances 1,140,593 693,880 Short term prepayments 336,591 212,799 Other receivables 1,606,643 1,143,099 Tax refunds due from Government 514,729 648,960 Taxation - net 779,513 673,701 Cash and bank balances 553,996 287,175
27,385,108 20,949,525
43,010,115 37,218,913
MOHOMED BASHIR MOHAMMED ZAKI BASHIRChairman Chief Executive Officer
- -
The annexed notes form an integral part of these condensed interim consolidated financial information.
ABDUL ALEEMChief Finance Officer
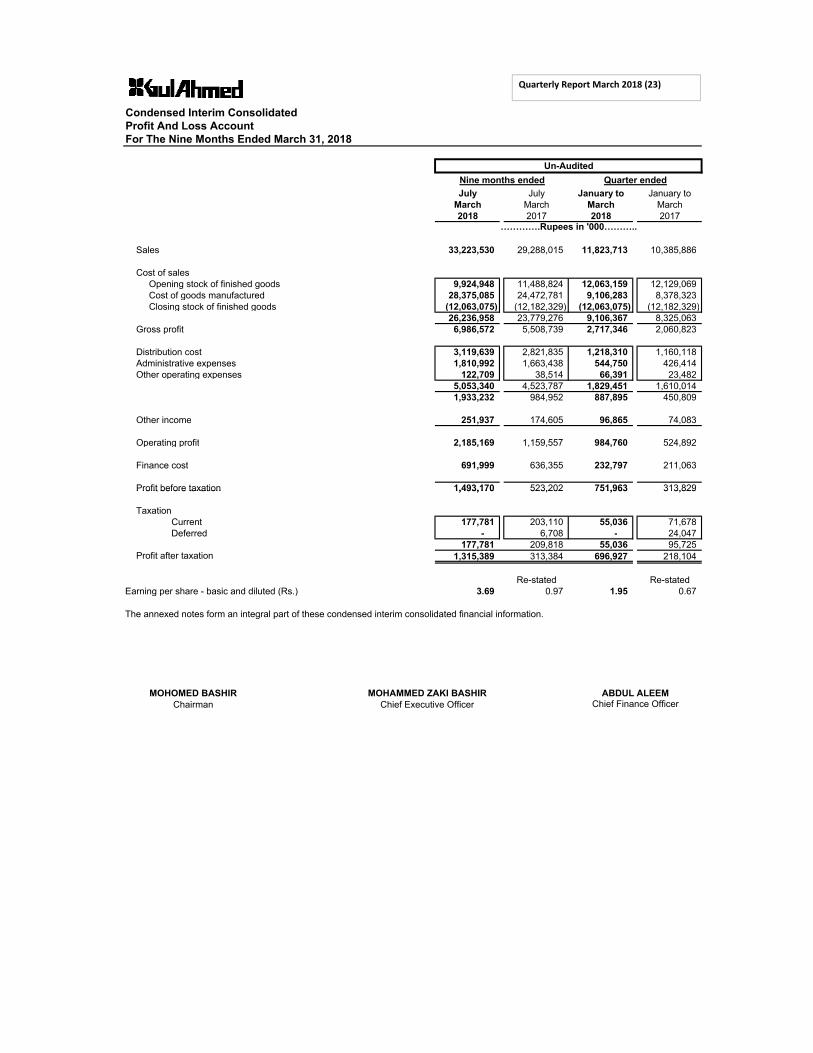
Condensed Interim Consolidated Profit And Loss AccountFor The Nine Months Ended March 31, 2018
July July January to January toMarch March March March2018 2017 2018 2017
Sales 33,223,530 29,288,015 11,823,713 10,385,886
Cost of sales Opening stock of finished goods 9,924,948 11,488,824 12,063,159 12,129,069 Cost of goods manufactured 28,375,085 24,472,781 9,106,283 8,378,323 Closing stock of finished goods (12,063,075) (12,182,329) (12,063,075) (12,182,329)
26,236,958 23,779,276 9,106,367 8,325,063 Gross profit 6,986,572 5,508,739 2,717,346 2,060,823
Distribution cost 3,119,639 2,821,835 1,218,310 1,160,118 Administrative expenses 1,810,992 1,663,438 544,750 426,414 Other operating expenses 122,709 38,514 66,391 23,482
5,053,340 4,523,787 1,829,451 1,610,0141,933,232 984,952 887,895 450,809
Other income 251,937 174,605 96,865 74,083
Operating profit 2,185,169 1,159,557 984,760 524,892
Finance cost 691,999 636,355 232,797 211,063
Profit before taxation 1,493,170 523,202 751,963 313,829
Un-AuditedNine months ended Quarter ended
………….Rupees in '000………..
Quarterly Report March 2018 (23)
Profit before taxation 1,493,170 523,202 751,963 313,829
TaxationCurrent 177,781 203,110 55,036 71,678 Deferred - 6,708 - 24,047
177,781 209,818 55,036 95,725Profit after taxation 1,315,389 313,384 696,927 218,104
Re-stated Re-statedEarning per share - basic and diluted (Rs.) 3.69 0.97 1.95 0.67
MOHOMED BASHIR MOHAMMED ZAKI BASHIRChairman Chief Executive Officer Chief Finance Officer
The annexed notes form an integral part of these condensed interim consolidated financial information.
ABDUL ALEEM

Condensed Interim Consolidated Statement of Comprehensive IncomeFor The Nine Months Ended March 31, 2018
July July January to January toMarch March March March2018 2017 2018 2017
Profit after taxation 1,315,389 313,384 696,927 218,104
Other comprehensive income for the period
Items that will be reclassified to profit and loss accountsubsequently
Exchange difference on translation of foreign subsidiaries 39,956 3,270 19,745 3,672
Total comprehensive income 1,355,345 316,655 716,672 221,777
MOHOMED BASHIR MOHAMMED ZAKI BASHIRChairman Chief Executive Officer Chief Finance Officer
Un-AuditedNine months ended Quarter ended
……..………….Rupees in '000……………….
The annexed notes form an integral part of these condensed interim consolidated financial information.
ABDUL ALEEM
Quarterly Report March 2018 (24)
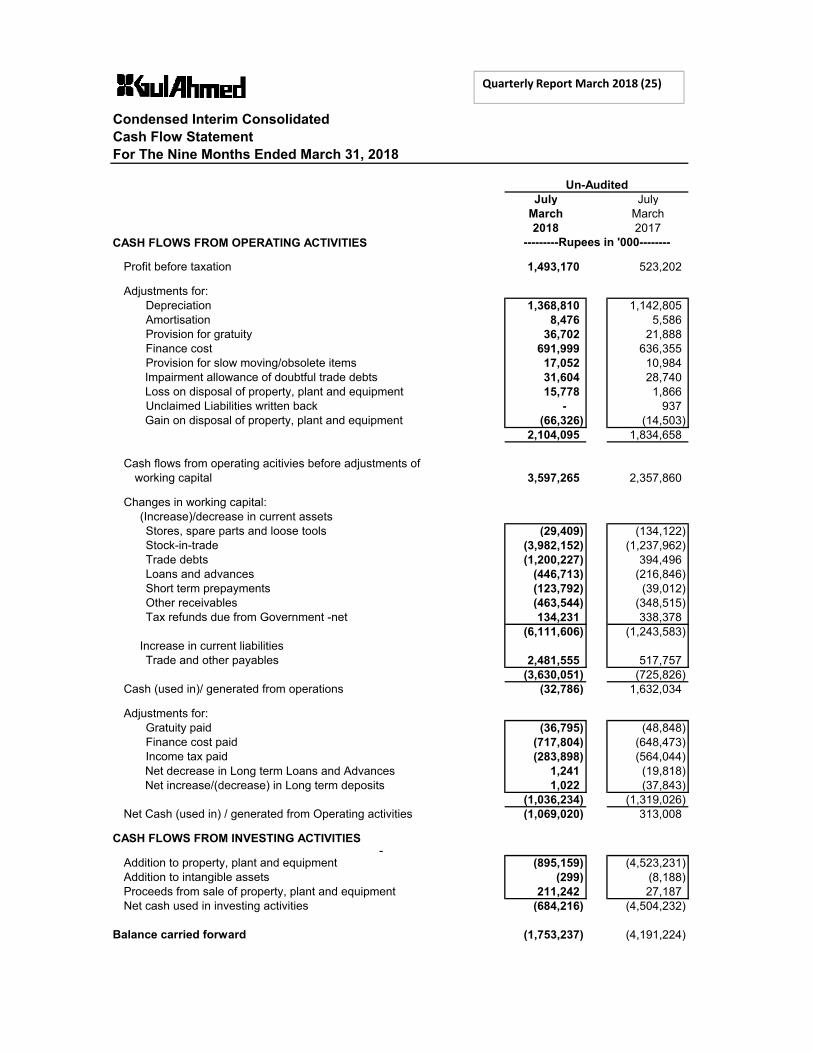
Condensed Interim Consolidated Cash Flow StatementFor The Nine Months Ended March 31, 2018
Un-AuditedJuly July
March March2018 2017
CASH FLOWS FROM OPERATING ACTIVITIES
Profit before taxation 1,493,170 523,202
Adjustments for:Depreciation 1,368,810 1,142,805 Amortisation 8,476 5,586 Provision for gratuity 36,702 21,888 Finance cost 691,999 636,355 Provision for slow moving/obsolete items 17,052 10,984
Impairment allowance of doubtful trade debts 31,604 28,740 Loss on disposal of property, plant and equipment 15,778 1,866
Unclaimed Liabilities written back - 937 Gain on disposal of property, plant and equipment (66,326) (14,503)
2,104,095 1,834,658
Cash flows from operating acitivies before adjustments of working capital 3,597,265 2,357,860
---------Rupees in '000--------
Quarterly Report March 2018 (25)
Changes in working capital: (Increase)/decrease in current assets
Stores, spare parts and loose tools (29,409) (134,122)Stock-in-trade (3,982,152) (1,237,962)Trade debts (1,200,227) 394,496Loans and advances (446,713) (216,846)Short term prepayments (123,792) (39,012)Other receivables (463,544) (348,515)Tax refunds due from Government -net 134,231 338,378
(6,111,606) (1,243,583) Increase in current liabilities
Trade and other payables 2,481,555 517,757(3,630,051) (725,826)
Cash (used in)/ generated from operations (32,786) 1,632,034
Adjustments for:Gratuity paid (36,795) (48,848)Finance cost paid (717,804) (648,473)Income tax paid (283,898) (564,044)
Net decrease in Long term Loans and Advances 1,241 (19,818) Net increase/(decrease) in Long term deposits 1,022 (37,843)
(1,036,234) (1,319,026)Net Cash (used in) / generated from Operating activities (1,069,020) 313,008
CASH FLOWS FROM INVESTING ACTIVITIES-
Addition to property, plant and equipment (895,159) (4,523,231)Addition to intangible assets (299) (8,188) Proceeds from sale of property, plant and equipment 211,242 27,187Net cash used in investing activities (684,216) (4,504,232)
Balance carried forward (1,753,237) (4,191,224)

Condensed Interim Consolidated Cash Flow StatementFor The Nine Months Ended March 31, 2018
Note Un-AuditedJuly July
March March2018 2017
Balance brought forward (1,753,237) (4,191,224)
CASH FLOWS FROM FINANCING ACTIVITIES
Proceeds from long term financing 425,754 2,983,753 Repayments of long term financing (559,953) (631,234) Dividend paid (353,084) (95,082)
Net cash (used in)/generated from financing activities (487,283) 2,257,437 Exchange difference on translation of foreign activities 39,956 3,270
Net decrease in cash and cash equivalents (2,200,563) (1,930,517)
---------Rupees in '000--------
Quarterly Report March 2018 (26)
Cash and cash equivalents - at the beginning of the period (11,648,168) (12,526,827)
Cash and cash equivalents - at the end of the period 10 (13,848,731) (14,457,344)
MOHOMED BASHIR MOHAMMED ZAKI BASHIRChief Executive Officer
The annexed notes form an integral part of these condensed interim consolidated financial information.
ABDUL ALEEMChairman Chief Finance Officer
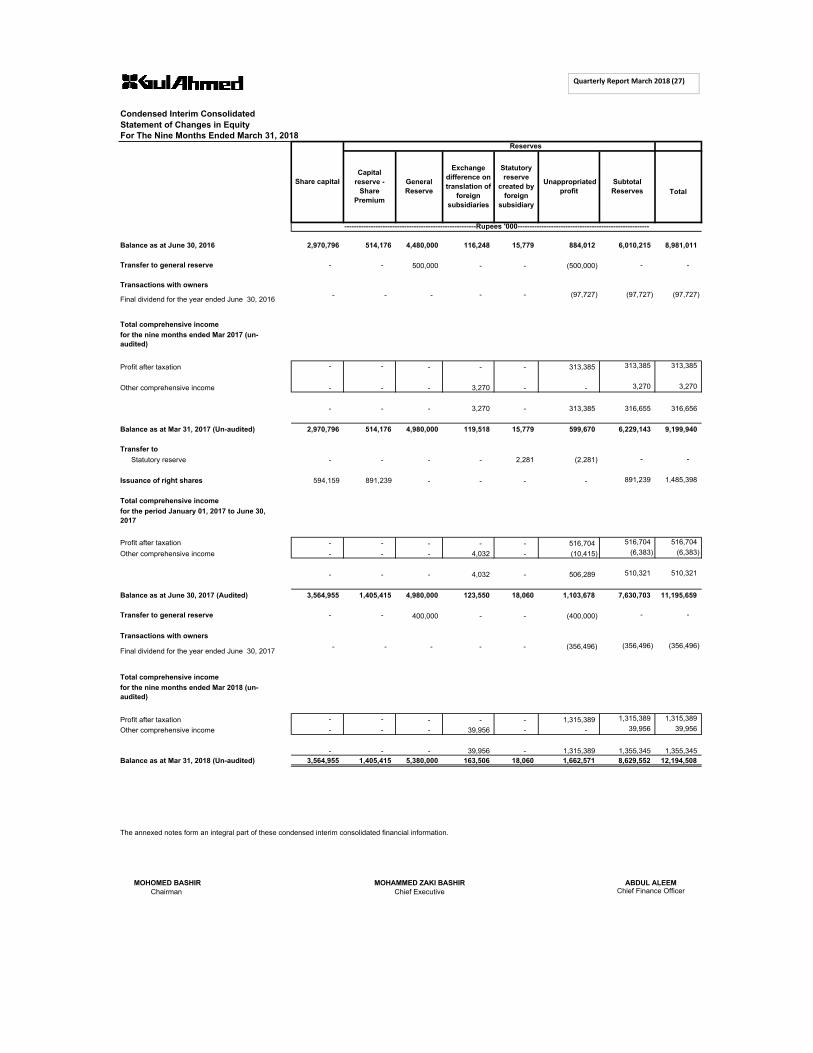
Condensed Interim Consolidated Statement of Changes in EquityFor The Nine Months Ended March 31, 2018
Total
Balance as at June 30, 2016 2,970,796 514,176 4,480,000 116,248 15,779 884,012 6,010,215 8,981,011
Transfer to general reserve - - 500,000 - - (500,000) - -
Transactions with owners - - - - - (97,727) (97,727) (97,727)
Profit after taxation - - - - - 313,385 313,385 313,385
Other comprehensive income - - - 3,270 - - 3,270 3,270
- - - 3,270 - 313,385 316,655 316,656
Balance as at Mar 31, 2017 (Un-audited) 2,970,796 514,176 4,980,000 119,518 15,779 599,670 6,229,143 9,199,940
Transfer to Statutory reserve - - - - 2,281 (2,281) - -
Issuance of right shares 594,159 891,239 - - - - 891,239 1,485,398
Share capital
Reserves
Capital reserve -
Share Premium
General Reserve
Exchange difference on translation of
foreign subsidiaries
Statutory reserve
created by foreign
subsidiary
Unappropriated profit
Subtotal Reserves
-------------------------------------------------------Rupees '000-------------------------------------------------------
Final dividend for the year ended June 30, 2016
Total comprehensive incomefor the nine months ended Mar 2017 (un-audited)
Quarterly Report March 2018 (27)
Profit after taxation - - - - - 516,704 516,704 516,704 Other comprehensive income - - - 4,032 - (10,415) (6,383) (6,383)
- - - 4,032 - 506,289 510,321 510,321
Balance as at June 30, 2017 (Audited) 3,564,955 1,405,415 4,980,000 123,550 18,060 1,103,678 7,630,703 11,195,659
Transfer to general reserve - - 400,000 - - (400,000) - -
Transactions with owners - - - - - (356,496) (356,496) (356,496)
Profit after taxation - - - - - 1,315,389 1,315,389 1,315,389 Other comprehensive income - - - 39,956 - - 39,956 39,956
- - - 39,956 - 1,315,389 1,355,345 1,355,345 Balance as at Mar 31, 2018 (Un-audited) 3,564,955 1,405,415 5,380,000 163,506 18,060 1,662,571 8,629,552 12,194,508
MOHOMED BASHIR MOHAMMED ZAKI BASHIRChairman Chief Executive
Total comprehensive income
The annexed notes form an integral part of these condensed interim consolidated financial information.
ABDUL ALEEMChief Finance Officer
for the period January 01, 2017 to June 30, 2017
Final dividend for the year ended June 30, 2017
Total comprehensive incomefor the nine months ended Mar 2018 (un-audited)
Notes to the Condensed Interim Consolidated Financial Information (Un-audited)For The Nine Months Ended March 31, 2018
1 LEGAL STATUS AND ITS OPERATIONS
1.1 Gul Ahmed Group ( "the Group") comprises the following:
- Gul Ahmed Textile Mills Limited- Gul Ahmed International Limited (FZC) - UAE- GTM (Europe) Limited - UK- GTM USA Corp. - USA- Sky Home Corp.- USA
All four subsidiaries are engaged in trading of textile related products.
1.2 Basis of consolidation
Gul Ahmed Textile Mills Limited (The Holding Company) was incorporated on 1st April 1953 in Pakistan as a private limitedcompany, converted into public limited company on 7th January 1955 and was listed on Karachi and Lahore StockExchanges in 1970 and 1971 respectively. The Holding Company is a composite textile mill and is engaged in themanufacture and sale of textile products.
The Holding Company's registered office is situated at Plot No. 82, Main National Highway, Landhi, Karachi.
Gul Ahmed International Limited (FZC) -UAE is a wholly owned subsidiary of Gul Ahmed Textile Mills Limited, GTM(Europe) Limited is a wholly owned subsidiary of Gul Ahmed International Limited (FZC) - UAE and GTM USA Corp. andSky Home Corp. are wholly owned subsidiaries of GTM (Europe) Limited.
The Company is a subsidiary of Gul Ahmed Holdings (Private) Limited that owns 66.78% shares of the Company.
Quarterly Report March 2018 (28)
2 BASIS OF PREPARATION
The financial information include the financial information of the Group.
Subsidiary companies are consolidated from the date on which more than 50% voting rights are transferred to the HoldingCompany or power to govern the financial and operating policies over the subsidiary and is excluded from consolidation fromthe date of disposal or cessation of control.
The financial statements of the subsidiaries are prepared for the same reporting period as the Holding Company, usingconsistent accounting policies.
The assets and liabilities of the subsidiary company have been consolidated on a line-by-line basis and the carrying value ofinvestment held by the Company is eliminated against the subsidiary's share capital. All intra-group balances andtransactions are eliminated.
The condensed interim consolidated financial information comprise the consolidated balance sheet of Gul Ahmed TextileMills Limited, its wholly owned subsidiary company Gul Ahmed International Limited (FZC), GTM (Europe) Limited which isthe wholly owned subsidiary of Gul Ahmed International Limited (FZC), GTM USA Corporation and Sky Home Corporationwhich is the wholly owned subsidiary of GTM (Europe) Limited as at March 31, 2018 and the related consolidated profit andloss account, consolidated cash flow statement and consolidated statement of changes in equity together with the notesforming part thereof for the period then ended. The financial statements of the subsidiary companies have been consolidatedon a line by line basis.
These condensed interim consolidated financial information of the Group for the nine months ended Maarch 31, 2018 havebeen prepared in accordance with the requirements of the International Accounting Standards 34 - Interim FinancialReporting and provisions of and directives issued under the repealed Companies Ordinance, 1984. In case whererequirements differ, the provisions of or directives issued under the repealed Companies Ordinance, 1984 shall prevail.

3 ACCOUNTING POLICIES
4 ACCOUNTING ESTIMATES, JUDGEMENTS AND FINANCIAL RISK MANAGEMENT
The comparatives balance sheet, presented in these condensed interim consolidated financial information, as at June 30,2017 has been extracted from the audited financial statements of the Group for the year ended June 30, 2017 whereas thecomparative condensed interim consolidated profit and loss account, condensed interim consolidated statement ofcomprehensive income, condensed interim consolidated cash flow statement and condensed interim consolidated statementof changes in equity for the nine months ended March 31, 2018 have been extracted from the condensed interimconsolidated financial information of the Group for the nine months ended March 31, 2017.
Companies Act, 2017 (the Act) has been promulgated during the year which introduces new disclosure and presentationrequirement. However the securities and Exchange Commission of Pakistan (SECP) vide its circular no. 23/2017 dated 4thOctober, 2017 has notified that Companies whose financial year ends on or before March 31, 2018 shall prepare theirfinancial statements in accordance with the provisions of the repealed Companies Ordinance 1984, Thereafter the Instituteof Chartered Accountants of Pakistan (ICAP) sought clarification from SECP and through its circular 17 of 2017 dated 6thOctober, 2017clarified that condensed interim financial information for the period ending or or before 31 March, 2018 willalso be prepared in accordance with the repealed Companies Ordinance 1984. Accordingly, these financial statements havebeen prepared in accordance with the provisions of the repealed Companies Ordinance, 1984.
These condensed interim consolidated financial information do not include all the information required in annual financialstatements prepared in accordance with approved accounting standards as applicable in Pakistan, and should be read inconjunction with the consolidated financial statements for the year ended June 30, 2017.
Certain new IFRSs and amendments to existing IFRSs, effective for periods beginning on or after July 1, 2017, do not haveany impact on this condensed interim financial information, and are therefore not presented.
Accounting policies and method of computations adopted for the preparation of these condensed interim consolidatedfinancial information are the same as those applied in the preparation of the consolidated financial statements for the yearended June 30, 2017.
Quarterly Report March 2018 (29)
4 ACCOUNTING ESTIMATES, JUDGEMENTS AND FINANCIAL RISK MANAGEMENT
Un-Audited AuditedMarch June2018 2017
5 Long term financing - Secured
Opening balance 7,824,914 5,118,004 Add: Obtained during the period / year 425,754 3,427,770 Less: Repaid during the period / year (559,953) (720,860)
7,690,715 7,824,914
Less: Current portion shown under current liabilities (1,263,344) (678,511) 6,427,371 7,146,403
6 TRADE AND OTHER PAYABLES
Trade and other payables include provision in respect of;
a)
b)
Increase in gas tariff rates notified vide SRO No. (I) / 2015 dated 31 August, 2015, and Oil and Gas Regulatory
Authority (OGRA) notification dated 30-12-2016 as was disclosed in note no 9.1.2 of the financial statements for the
year ended June 30, 2017. Accordingly, the Group has provided banker's verified cheques of Rs. 184.064 million
(June-2017: 77.930 million) as security to Nazir of High Court Sindh and also, as a matter of prudence, full provision
of Rs. 343.991 million (June-2017: 237.857 million) has been made in the consolidated financial statements.
There is no change in the matter of charging of captive power tariff instead of Industry tariff rate to the Group asdisclosed in note no. 9.1.3 of the financial statements for the year ended June 30, 2017 except that the amount ofprovision has increased to Rs. 512.820 million (June-2017: Rs. 346.173 million) has been made due to change forthe period. The Group has provided banker's verified cheques of Rs. 275.159 million (June-2017: 108.512 million) as security to Nazir of High Court Sindh.
The preparation of this condensed interim consolidated financial information requires management to make estimates,assumptions and use judgments that affect the application of policies and reported amounts of assets and liabilities andincome and expenses. Estimates, assumptions and judgments are continually evaluated and are based on historicalexperience and other factors, including reasonable expectations of future events. Revisions to accounting estimates arerecognised prospectively commencing from the period of revision. Judgments and estimates made by the management inthe preparation of this condensed interim financial information are the same as those that were applied to financialstatements as at and for the year ended June 30, 2017.
The Group's financial risk management objectives and policies are consistent with those disclosed in the annual auditedfinancial statements as at and for the year ended June 30, 2017.
-----------Rupees in '000----------

7 CONTINGENCIES AND COMMITMENTS
Contingencies
a)
Gurarantees
(a)
(b)
(c) Bills discounted Rs. 3,082 million (June-2017: Rs. 2,073 million).
(d)
Commitments
(a) Group is committed for certain expenditures which are stated as follows:
Un-Audited AuditedMarch June2018 2017
- Capital expenditure 979,466 181,452
The status of contingencies, as reported in the annual financial statements for the year ended June 30, 2017, remained unchanged during the currentperiod except following:
In the matter of Gas Infrastructure Development Cess (GIDC), wherein there is no change in its status as disclosed in note 12.7 of the financialstatements for the year ended June 30, 2017 except that the amount of provision of Rs. 1,577.176 million (June-2017: Rs.1,137.181 million)commencing from May 22, 2015 to the balance sheet date.
Rs. 808 million (June-2017: Rs. 767 million) against guarantees issued by banks which are secured by pari passu hypothecation charge overstores and spares, stock-in-trade, trade debts and other receivables. These guarantees includes guarantees issued by related partyamounting to Rs. 739 million (June 2017: Rs. 698 million).
Post dated cheques Rs. 2,673 million (June-2017: Rs. 1,406 million) are issued to Custom Authorities in respect of duties on imported itemsavailed on the basis of consumption and export plans.
Corporate guarantee of Rs. 111.726 million (June-2017: Rs. 94.222 million) has been issued to a bank by the Holding Company in favor of anindirect subsidiary Company - GTM (Europe) Limited - UK. .
-----------Rupees in '000----------
Quarterly Report March 2018 (30)
- Capital expenditure 979,466 181,452 - Non capital expenditure items under letters of credits 4,201,469 1,442,653
5,180,935 1,624,105
Un-Audited AuditedMarch June2017 2017
(b)
Not more than one year 701,124 484,547 More than one year but not more than five years 2,206,358 1,593,683 More than five years 594,313 477,159
3,501,795 2,555,389
8 PROPERTY, PLANT AND EQUIPMENT
Operating assets - net book value 8.1 & 8.2 15,292,449 13,680,577 Capital work in progress - at cost 8.4 65,770 2,311,485
15,358,219 15,992,062
Un-Auditedfor the nine months ended for the nine months ended
March March2018 2017
8.1 Additions during the period
Buildings and structures on leasehold land 725,085 1,215,088 Plant and machinery 2,331,989 2,445,665 Furniture and fixtures 2,700 6,423 Office equipment 28,500 110,507 Vehicles 52,600 202,818
3,140,874 3,980,501
-----------Rupees in '000----------
-----------Rupees in '000----------The Group is committed to minimum rental payments for Retail outlets for each of the following period as follows:
8.1.1 Additions to building and structure on leasehold land, plant and machinery and others include transfers from capital work-in-progressamounting to Rs. 605 million, Rs. 2,074 million and Rs. 40 k (March-2017: Rs. 1,215 million, Rs. 2,447 million and Rs. 71 k).

Un-Auditedfor the nine months ended for the nine months ended
March March2018 2017
8.2 Disposals - operating fixed assets (at net book value)
Plant and machinery 63,179 2,850 Furnitue & Fixture - 2,174 Vehicles 97,652 10,155
160,831 15,179
8.2.1
Un-AuditedMarch March2018 2017
8.3 Depreciation charge during the period 1,368,810 1,142,805
8.4 Additions - capital work in progress (at cost)
Machinery 402,108 3,266,662 Building 238,565 937,892 Others - 32
640,673 4,204,586
Note Un-Audited AuditedMarch June2018 2017
9 INTANGIBLE ASSETS
-----------Rupees in '000----------
Disposals include assets scrapped at Net Book Value during the period of Rs. 0.220 million (March-2017: Nil)..
-----------Rupees in '000----------
-----------Rupees in '000----------
Quarterly Report March 2018 (31)
Intangible - net book value 9.1 & 9.2 33,710 41,887
Un-Auditedfor the nine months ended for the nine months ended
March March2018 2017
9.1 Additions - intangibles (at cost)Computer Software 299 8,188
9.2 Amortisation charge during the period 8,476 5,586
Un-AuditedMarch March2018 2017
10 CASH AND CASH EQUIVALENTS
Cash and cash equivalents comprises of:
Cash and bank balances 553,996 400,338Short term borrowings (14,402,727) (14,857,682)
(13,848,731) (14,457,344)
11 TAXATIONProvision for current taxation has been made on the basis of normal tax liability, final taxation, tax credit and separate block ofincome under the Income Tax Ordinance, 2001.
-----------Rupees in '000----------
-----------Rupees in '000----------
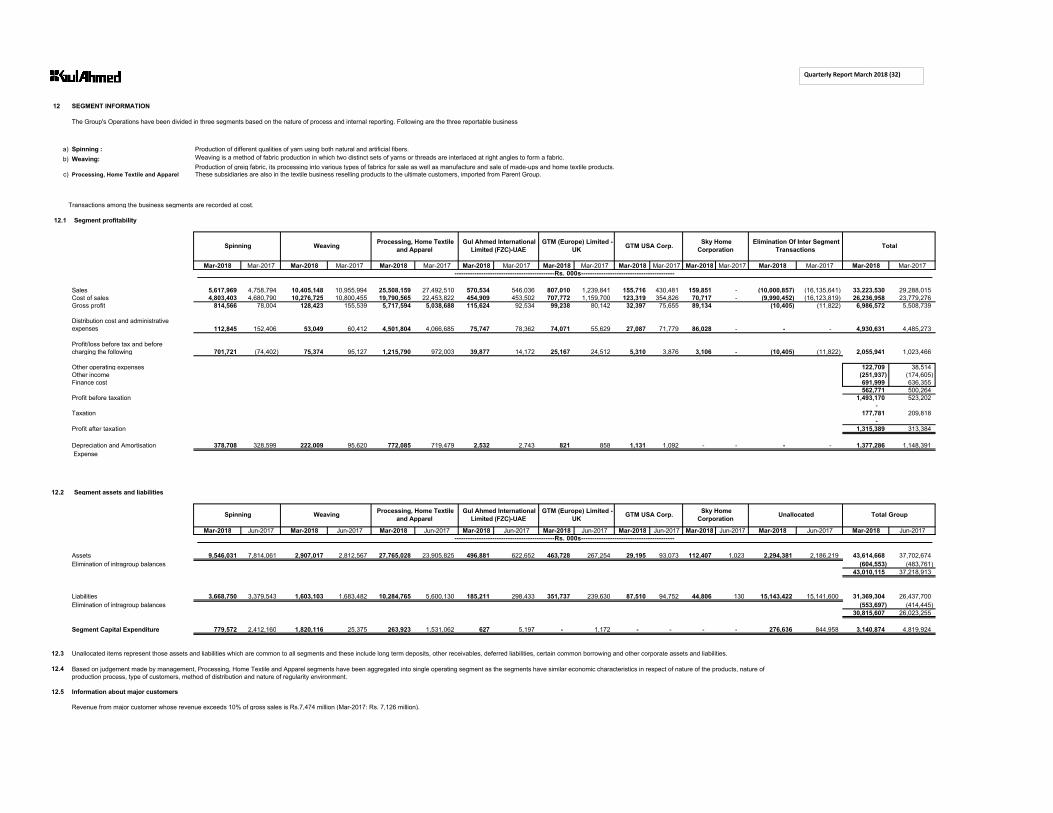
12 SEGMENT INFORMATION
a) Spinning : Production of different qualities of yarn using both natural and artificial fibers.b) Weaving:
Production of greig fabric, its processing into various types of fabrics for sale as well as manufacture and sale of made-ups and home textile products.These subsidiaries are also in the textile business reselling products to the ultimate customers, imported from Parent Group.
Transactions among the business segments are recorded at cost.
12.1 Segment profitability
Mar-2018 Mar-2017 Mar-2018 Mar-2017 Mar-2018 Mar-2017 Mar-2018 Mar-2017 Mar-2018 Mar-2017 Mar-2018 Mar-2017 Mar-2018 Mar-2017 Mar-2018 Mar-2017 Mar-2018 Mar-2017
Sales 5,617,969 4,758,794 10,405,148 10,955,994 25,508,159 27,492,510 570,534 546,036 807,010 1,239,841 155,716 430,481 159,851 - (10,000,857) (16,135,641) 33,223,530 29,288,015 Cost of sales 4,803,403 4,680,790 10,276,725 10,800,455 19,790,565 22,453,822 454,909 453,502 707,772 1,159,700 123,319 354,826 70,717 - (9,990,452) (16,123,819) 26,236,958 23,779,276 Gross profit 814,566 78,004 128,423 155,539 5,717,594 5,038,688 115,624 92,534 99,238 80,142 32,397 75,655 89,134 (10,405) (11,822) 6,986,572 5,508,739
Distribution cost and administrative expenses 112,845 152,406 53,049 60,412 4,501,804 4,066,685 75,747 78,362 74,071 55,629 27,087 71,779 86,028 - - - 4,930,631 4,485,273
Profit/loss before tax and beforecharging the following 701,721 (74,402) 75,374 95,127 1,215,790 972,003 39,877 14,172 25,167 24,512 5,310 3,876 3,106 - (10,405) (11,822) 2,055,941 1,023,466
Other operating expenses 122,709 38,514 Other income (251,937) (174,605) Finance cost 691,999 636,355
562,771 500,264 Profit before taxation 1,493,170 523,202
- Taxation 177,781 209,818
- Profit after taxation 1,315,389 313,384
Depreciation and Amortisation 378,708 328,599 222,009 95,620 772,085 719,479 2,532 2,743 821 858 1,131 1,092 - - - - 1,377,286 1,148,391 Expense
12.2 Segment assets and liabilities
Mar-2018 Jun-2017 Mar-2018 Jun-2017 Mar-2018 Jun-2017 Mar-2018 Jun-2017 Mar-2018 Jun-2017 Mar-2018 Jun-2017 Mar-2018 Jun-2017 Mar-2018 Jun-2017 Mar-2018 Jun-2017
Assets 9,546,031 7,814,061 2,907,017 2,812,567 27,765,028 23,905,825 496,881 622,652 463,728 267,254 29,195 93,073 112,407 1,023 2,294,381 2,186,219 43,614,668 37,702,674 Elimination of intragroup balances (604,553) (483,761)
43,010,115 37,218,913
Liabilities 3,668,750 3,379,543 1,603,103 1,683,482 10,284,765 5,600,130 185,211 298,433 351,737 239,630 87,510 94,752 44,806 130 15,143,422 15,141,600 31,369,304 26,437,700 Elimination of intragroup balances (553,697) (414,445)
30,815,607 26,023,255
Segment Capital Expenditure 779,572 2,412,160 1,820,116 25,375 263,923 1,531,062 627 5,197 - 1,172 - - - - 276,636 844,958 3,140,874 4,819,924
12.3 Unallocated items represent those assets and liabilities which are common to all segments and these include long term deposits, other receivables, deferred liabilities, certain common borrowing and other corporate assets and liabilities.
12.4
12.5 Information about major customers
Revenue from major customer whose revenue exceeds 10% of gross sales is Rs.7,474 million (Mar-2017: Rs. 7,126 million).
Based on judgement made by management, Processing, Home Textile and Apparel segments have been aggregated into single operating segment as the segments have similar economic characteristics in respect of nature of the products, nature of production process, type of customers, method of distribution and nature of regularity environment.
GTM (Europe) Limited - UK GTM USA Corp. Sky Home
Corporation Unallocated Total Group
---------------------------------------------Rs. 000s------------------------------------------
GTM USA Corp. Sky Home Corporation
Elimination Of Inter Segment Transactions Total
---------------------------------------------Rs. 000s------------------------------------------
Spinning Weaving Processing, Home Textile and Apparel
Gul Ahmed International Limited (FZC)-UAE
The Group's Operations have been divided in three segments based on the nature of process and internal reporting. Following are the three reportable business
Weaving is a method of fabric production in which two distinct sets of yarns or threads are interlaced at right angles to form a fabric.
c) Processing, Home Textile and Apparel
Weaving Processing, Home Textile and Apparel
Gul Ahmed International Limited (FZC)-UAE
GTM (Europe) Limited - UK Spinning
Quarterly Report March 2018 (32)
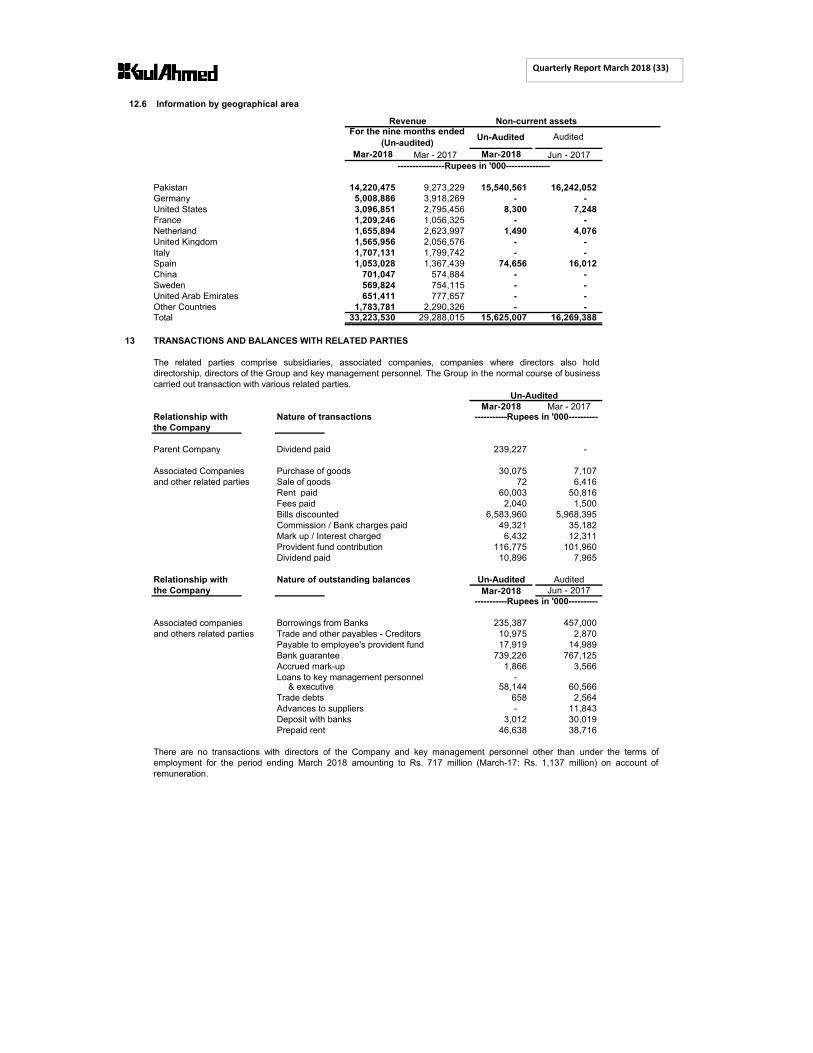
12.6 Information by geographical area
Mar-2018 Mar - 2017 Mar-2018 Jun - 2017
Pakistan 14,220,475 9,273,229 15,540,561 16,242,052 Germany 5,008,886 3,918,269 - - United States 3,096,851 2,795,456 8,300 7,248 France 1,209,246 1,056,325 - - Netherland 1,655,894 2,623,997 1,490 4,076 United Kingdom 1,565,956 2,056,576 - - Italy 1,707,131 1,799,742 - - Spain 1,053,028 1,367,439 74,656 16,012 China 701,047 574,884 - - Sweden 569,824 754,115 - - United Arab Emirates 651,411 777,657 - - Other Countries 1,783,781 2,290,326 - - Total 33,223,530 29,288,015 15,625,007 16,269,388
13 TRANSACTIONS AND BALANCES WITH RELATED PARTIES
Un-AuditedMar-2018 Mar - 2017
Relationship with Nature of transactionsthe Company
Parent Company Dividend paid 239,227 -
Associated Companies Purchase of goods 30,075 7,107 and other related parties Sale of goods 72 6,416
Rent paid 60,003 50,816 Fees paid 2,040 1,500 Bills discounted 6,583,960 5,968,395 Commission / Bank charges paid 49,321 35,182 Mark up / Interest charged 6,432 12,311 Provident fund contribution 116,775 101,960 Dividend paid 10,896 7,965
Relationship with Nature of outstanding balances Un-Audited Auditedthe Company Mar-2018 Jun - 2017
Associated companies Borrowings from Banks 235,387 457,000 and others related parties Trade and other payables - Creditors 10,975 2,870
Payable to employee's provident fund 17,919 14,989 Bank guarantee 739,226 767,125 Accrued mark-up 1,866 3,566 Loans to key management personnel -
& executive 58,144 60,566 Trade debts 658 2,564Advances to suppliers - 11,843 Deposit with banks 3,012 30,019Prepaid rent 46,638 38,716
----------------Rupees in '000---------------
Revenue Non-current assetsFor the nine months ended
(Un-audited) Un-Audited Audited
The related parties comprise subsidiaries, associated companies, companies where directors also holddirectorship, directors of the Group and key management personnel. The Group in the normal course of businesscarried out transaction with various related parties.
-----------Rupees in '000----------
-----------Rupees in '000----------
There are no transactions with directors of the Company and key management personnel other than under the terms ofemployment for the period ending March 2018 amounting to Rs. 717 million (March-17: Rs. 1,137 million) on account ofremuneration.
Quarterly Report March 2018 (33)

14 FAIR VALUES
- Level 1
- Level 2
- Level 3
15 DATE OF AUTHORISATION
16 GENERAL
16.1
16.2 Figures have been rounded off to the nearest thousand rupees.
16.3
16.4
MOHAMMED ZAKI BASHIRChief Executive Officer
The Group while assessing fair values uses valuation techniques that are appropriate in the circumstances using relevantobservable data as far as possible and minimizing the use of unobservable inputs. Fair values are categorized into followingthree levels based on the input used in the valuation techniques;
Fair value is the price that would be received to sell an asset or paid to transfer a liability in an orderly transaction in the principal(or most advantageous) market at the measurement date under current market conditions (i.e. an exit price) regardless ofwhether that price is directly observable or estimated using another valuation technique.
Quoted prices in active markets for identical assets or liabilities that can be assessed at measurement.
Inputs other than quoted prices included within level 1 that are observable for the asset or liability, eitherdirectly (that is, as prices) or indirectly (that is, derived from prices).
Chairman Chief Finance Officer
Financial assets and liabilities of the Group are either short term in nature or are repriced periodically therefore; their carryingamounts approximate their fair values.
This condensed interim consolidated financial information was authorised for issue on April 28, 2018 by the Board of Directors of the Group.
Allocations for the workers' profit participation fund, workers' welfare fund and taxation are provisional and final liability including liability for deferred taxation will be determined on the basis of annual results.
During the interim period, comparative figure of Rs. 43.98 million has been reclassified from Intangibles Capital Work in Progress to short term prepayments due to clarification of terms of transaction during the period.
During the interim period, comparative figures in profit and loss account have been reclassified in order to ensure fair andaccurate presentation of consolidated interim financial information. For the nine months and quarter ended 31 March, 2017, Rs.261 million has been reclassified from administrative expenses to distribution cost and Rs. 12.3 million has been reclassifiedfrom cost of good manufactured to administrative expenses.
MOHOMED BASHIR ABDUL ALEEM
Inputs are unobservable inputs for the asset or liability that are not based on observable market data (thatis, unobservable inputs).
Quarterly Report March 2018 (34)