testing the efficiency of markets in the 2002 world cup...
TRANSCRIPT
Testing the Efficiency of Markets in the 2002 World Cup*
Ricard Gil University of California-Santa Cruz
and
Steven D. Levitt
University of Chicago and the American Bar Foundation
June 2006
* We would like to thank Lars Hansen and John List for extensive discussions that have greatly improved the paper. Ethan Lieber, Michael Roh, and Kenneth Ward provided stellar research assistance. We are grateful to John Delaney of Intrade.com for providing the data used in this paper. Financial support for this research was provided by the National Science Foundation and the Sherman Shapiro Research Fund. Contact information: Ricard Gil, Department of Economics, University of California-Santa Cruz, 1156 High Street, Santa Cruz, CA 95064, [email protected]; Steven Levitt, Department of Economics, University of Chicago, 1126 E. 59th Street, Chicago, IL 60637, [email protected].
1
Abstract
Trading data from the gambling market for the 2002 World Cup provide a unique window through which to test theories of market efficiency. The contracts we study trade in real time as the game is played. The evidence concerning market efficiency is mixed. Although markets respond strongly to goals being scored, there is some evidence that prices continue to trend higher for 10-15 minutes after a goal. We also observe systematically negative returns for bets on the pre-game favorite, consistent with the biases seen in wagering on other sports. We document the endogenous emergence of market makers. These market makers are involved in a large share of trades. Increasing from two active market makers to five or more market makers does not appear to dramatically improve the functioning of the market. On average, the market makers earn slightly negative returns, implying that other traders are able to identify situations in which market makers are setting inefficient prices.
2

Data limitations pose an important obstacle to testing theories of finance in real-
world financial markets. Researchers typically cannot directly observe the arrival of new
information to the market. The identities, characteristics, and information sets of
particular traders are likewise usually unknown to the econometrician. In the face of
these intrinsic data weaknesses, testing some of the most basic predictions, e.g., that
efficient markets quickly and completely incorporate new information into prices,
become difficult to test.1
One approach to testing whether new information is incorporated quickly and
fully into markets is to analyze special cases in which new information becomes available
to market participants at an identifiable point in time, e.g. announcements about the
money supply (Pearce and Roley 1985, Chen et al. 1986), earnings (Beaver 1968),
layoffs (Worrell et al. 1991), etc. One limitation of such tests is that some actors may
have access to the information (or some portion of it) in these announcements ahead of
time, either through research or insider information. Jarrell and Poulsen (1989), for
instance, document large price run-ups for tender offer targets in advance of the offers
being made.
A second approach researchers have used to circumvent the complexities of real-
world financial markets has been to create artificial markets in controlled laboratory
settings. Chamberlain (1948) and Smith (1962), represent early applications of this
approach, finding that artificial markets did not reach the equilibrium prices predicted by
theory, or did so only under restrictive conditions. More recently, Plott and Sunder
(1988) and List (2004) find evidence more consistent with theory. One drawback of
1 There is, of course, an enormous literature testing various predictions of the efficient market hypothesis. An early survey of this work is Fama (1970). For two divergent reviews, see Malkiel (2003) and Shiller (2003).
1
these experimental studies is the artificiality of the setting, as argued in Levitt and List
(2006). Subjects newly exposed to an experimental market may only learn slowly how to
optimally trade, particularly if these subjects have limited experience trading in other
financial markets or the rules of thumb used in naturally occurring markets are not
rewarded in the lab. In addition, the amount of money at risk in experiments is small.
Consequently, the cost associated with sub-optimal trading behavior is likewise small.
In this paper, we follow a third approach that combines some of the most
desirable features of the research strategies described above. Namely, we analyze trading
in a non-traditional, but real-world, market for outcomes of 2002 World Cup soccer
matches.2 The data were provided by the internet trading site www.intrade.com. Unlike
typical betting markets in which all bets must be placed prior to the start of an event and a
bookmaker takes one side of the bet, the market we analyze is a true financial market
with real-time trading during the course of a match and contracts with traders on both
sides of each transaction.
This market provides many of the benefits of an experimental setting. First, the
primary innovation in information in this market is the scoring of a goal. Goals are
relatively rare (2.32 per game on average, or about .one goal for every 40 minutes of
play) and have a large impact on the asset’s final value. Because these games are
televised, all traders have virtually simultaneous access to new information in the form of
goals, and it is also observable to the econometrician. Second, we know the identities of
all traders in our data and can match IDs across trades and assets. Like standard financial
markets, these traders have self-selected and presumably are knowledgeable soccer fans
2 Camerer’s (1998) analysis of the impact of temporary interventions in horse racing betting market, while very different from our own study in the details, also has the feature of merging elements of experimental studies with a real-world market.
2

with experience betting on game outcomes. Third, we have not just completed
transactions, but also the full set of bid and ask offers, even if these offers are cancelled
or expire prior to execution. Fourth, the asset we examine has a pre-determined terminal
date (i.e. the end of the game), unlike equities and currencies. This eliminates the need to
take into account expectations about future events such as the flow of future dividends
when pricing the security. Finally, the amount of money at stake, while not large in any
absolute sense (a total of $1.5 million worth of contracts were traded), is far greater than
in experimental settings.
Using these data, we are able to test a wide array of predictions about how
markets function. In favor of efficient markets, we find that the prices in soccer betting
markets move sharply when a goal is scored, but that prices 10-15 minutes after the goal
is scored are statistically significantly higher than immediately after the goal, providing
some evidence of market inefficiency. The markets do appear to be efficient in the sense
that there are few pure arbitrage opportunities available by trading combinations of
securities related to a particular match. On the other hand, at least in our small sample,
there are systematic biases in valuations with traders overestimating the likelihood that
the pre-game favorite will win the match. While we are guarded in our interpretation of
this result given the limited number of games in the sample, it is consistent with past
evidence of a bias towards favorites in sports betting markets (e.g., Golec and Tamarkin
1991, Gray and Gray 1997, Levitt 2004).
We also document the endogenous emergence of traders acting as market makers
(i.e. simultaneously offering to buy and sell a given contract at some bid-ask spread).
Between two and eight market makers operate in the various games in our sample.
3

Market makers represent at least one side of 65 percent of all trades made while the
games are taking place. We find little difference in the functioning of the market (e.g. the
size of the bid-ask spread) as the number of market makers increases. Market makers
overall make losses, despite the fact that their offers to buy are typically 5 percentage
points below their offers to sell at any point in time. This implies that the traders taking
the other side of trades with market makers have some success in identifying those
instances where market makers are mispricing.
The remainder of the paper is structured as follows. Section II describes the data
and presents summary statistics. Section III tests various predictions of the efficient
market hypothesis and theories of trading volume. Section IV analyzes market maker
behavior. Section V concludes.
Section II: Data description
The data we use are from www.intrade.com, an internet website offering trading
in thousands of sports, financial, and political contracts annually.3 Intrade.com is not a
bookmaker and does not take positions in the securities. Rather, they create securities
based on publicly observable outcomes (e.g. which team will win a game, how many
inches of snow will fall in New York in December, who will win the U.S. presidential
election). Traders with accounts at the web site then post bid and ask offers, with
intrade.com serving as the clearinghouse for matching buyers to sellers. In return for
3 Leigh et al. (2003) use data from intrade.com’s sister site, tradesports.com, to analyze the response of financial markets to the threat of war in Iraq. Hartzmark and Solomon (2006) analyze tradesports.com data to test efficiency in football betting markets. Wolfers and Zitzewitz (2004) summarizes the existing literature on prediction markets.
4
their services, intrade.com charged a transaction cost of eight cents per trader for each
$10 contract traded.4
The particular contracts we focus on are futures contracts on the outcomes of
soccer matches played as part of the 2002 World Cup. For each match, there are three
contracts offered: one that pays off if a particular team wins, another that pays off if the
other team wins, and a third that pays off if it is a draw.5 The outcomes of the contracts
are mutually exclusive and exhaustive, so exactly one contract pays off on any game.
All trades are made online using a pre-established trading account. For each
contract, market participants are able to observe in real-time a market order book that
lists the full set of prices and quantities of current bids and asks for each security. The
trader also observes his own positions and account balances.
For each contract offered our data set includes the full order book second by
second, along with the precise time, price, volume traded, and identities of each trader.
Trading occurs somewhat infrequently in these markets – on average there are 63 trades
over the life of a contract, 64 percent of which occur during the roughly two hours over
which the game is being played (there are two 45 minute halves, a 15 minute
intermission, a few minutes of referee determined extra time). Consequently, in much of
our analysis, we aggregate trading data from continuous time up to a unit of analysis of
one minute intervals. When more than one transaction occurs in a given minute on a
particular security, we take quantity-weighted averages of the prices to construct our
4 At the time of our sample, each party to a transaction pays four cents per contract to open a position and four cents per contract to close a position. Positions that expire worthless are also charged a four cent closure fee. The fee structure has since changed at intrade.com, and the commissions charged are now lower. Note that these transaction costs are much smaller than the typical “vig” at traditional sportsbooks, where bettors must lay 11 units to win 10 on gambles that are 50-50 bets. 5 Because the contracts are for regulation time only (including injury time), in later rounds where the game cannot end in a draw,we still observe a contract that pays off for a draw.
5

price. If no trade occurs in a particular minute, then that minute is excluded from any
analysis involving prices.
We match the price data with published information on the time at which each
goal is scored over the course of the game. Our trading data are recorded in Greenwich
Mean Time, whereas the timing of goals is based on the minutes of play that have elapsed
in the game. This introduces some possible noise into the matching between prices and
the timing of goals. To minimize errors, we had two research assistants independently
undertake the task of performing the matching. In almost every game, the research
assistants produced identical mappings. In the cases where there was disagreement, the
discrepancies were only 1-2 minutes, and the authors used their best judgment to arbitrate
the appropriate choice.
Table 1 presents basic information on each of the 50 games that comprise the
sample.6 We show the teams playing, date, final score, and whether the outcome of the
game was an upset based on the pre-game prices. We also report the dollar value of
contracts traded, the number of trades, the number of market makers active, the number
of different individuals making at least one trade on the game, and the fraction of the
dollar volume which is traded while the game is in the running (as opposed to in advance
of the game). The games took place over the course of roughly a month in June 2002.
The total dollar value of trades ranged from a low of $2,030 to over $70,000. The typical
game has between one hundred and two hundred trades. There are at least two market
makers in each game, with as many as eight sometimes operating. The median number
of individuals trading in a particular game is 75.
6 There were 64 games played in the World Cup, but 14 of the games had very few trades and were omitted from the data set, leaving 50 games.
6

Section III: Testing the efficient market hypothesis
The efficient market hypothesis makes a number of predictions for these data: (1)
newly arriving information should be quickly and completely incorporated into market
prices, (2) no pure arbitrage opportunities across securities should exist, and (3) expected
profits should be equalized across characteristics of positions that are readily observable
to market participants, such as whether a team is a favorite or an underdog. We explore
these three predictions in turn.
The efficiency with which new information is incorporated into market prices
The hallmark of efficient markets is the ability to quickly and completely
incorporate new information into asset prices. Once a soccer match is underway, the
primary innovation in information is the scoring of a goal.7 To test the response of these
markets to a goal being scored, we analyze the pattern of prices in the 30 minute window
bracketing each score (15 minutes before and 15 minutes after the goal) by estimating
regressions of the form:
(1) 15
, , ,, , , , , , , , ,15
Pr Pr m c w prem c w t g m c w t g m c w tg
ice ice Goalβ ε+=−
− = +∑
where m identifies the match, c refers to the particular contract on the match (i.e. pre-
game favorite to win, pre-game underdog to win), w corresponds to the particular
window of 30 minutes bracketing a score, and t represents the minute of the match.8 In
order to anchor the prices for each contract and window around a common value, we
7 Of course, the passage of time without a goal scoring also reveals information. Since the expected number of goals scored per minute is only 0.026, the scoring of a goal is a much greater shock to the outcome of a game than failing to score a goal at any particular time. 8 We label the minute the goal is scored as minute number one; we do not have a minute zero in our analysis, instead jumping directly from minute negative one to minute one.
7

normalize all prices by subtracting the mean price at which the contract traded five to
fifteen minutes prior to the goal being scored.9 The thirty β coefficients represent the
minute-by-minute price deviations in the 15 minute time period leading up to and
following a goal being scored. Goal is an indicator variable corresponding to a particular
minute which is equal to one when a goal is scored in the team’s favor, negative one
when the opposing team scores, and zero otherwise. We estimate equation (1) using
weighted least squares, with the weights determined by the volume of contracts traded in
that minute of the match. Parts of the game that are not within 15 minutes of a goal are
excluded from the regression. If multiple goals are scored within a 30 minute period, the
same observation will be included more than once since it falls into multiple goal
windows. We cluster by game and contract type to take into account the resulting
correlation across observations. If a goal is scored in the last 15 minutes of the game, the
sample window will be truncated by the end of the game. Depending on the regression,
we will sometimes limit the sample to a subset of goals, e.g. goals scored by teams with a
one-goal lead immediately before the goal occurs.
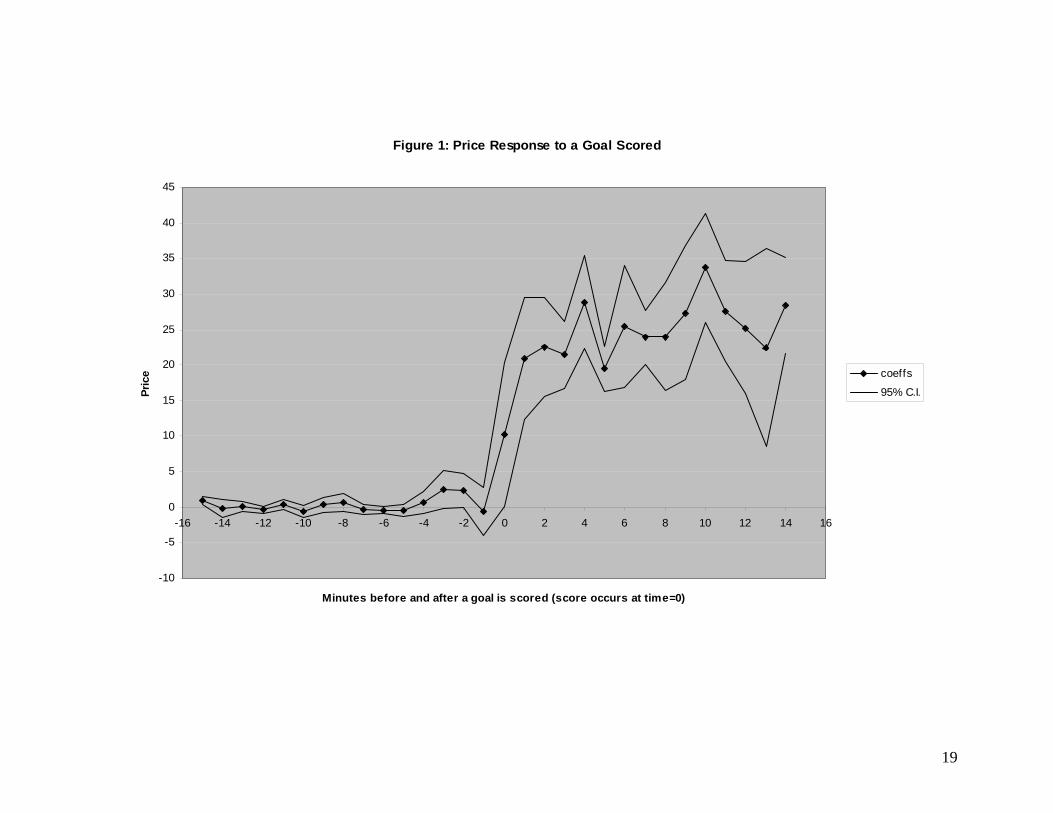
The results of estimating equation (1) for the full sample of goals are shown in
Figure 1. We show the β estimates along with 95 percent confidence intervals. Prices
are flat on average in advance of a goal and rise sharply just after the goal is scored.10
The magnitude of the price change accompanying a goal is approximately 20-30 on a
scale that runs from 0 to 100, meaning that scoring a goal on average changes the bettors’
estimates of the likelihood that this team will ultimately win by 20-30 percentage points
9 This is similar to including match-window fixed effects, except that it only conditions on the pre-goal prices. To the extent that the price impact of a goal varies by game situation, normalizing in this way provides an easier means of interpreting the impact of a goal. 10 Note that minute zero on the graph is the minute the goal is scored, so some trades occur before the score and others occur after.
8
and lowers the likelihood the opposing team will win by that amount.11 The estimates
are very precise before the goal is scored (as evidenced by the relatively narrow 95
percent confidence interval) and somewhat less precise after a goal is scored because of
the heterogeneous impact on price of goals in different situations.
There is some visual evidence that the initial price changes are not as large as
those 10-15 minutes after the goal is scored, implying that the new information is not
fully and immediately incorporated. Indeed, we can reject the null hypothesis that the
prices in the first few minutes after a goal is scored are equal to the later prices.12 A
strategy of buying contracts in the period 1-3 minutes after a goal is scored, and then
liquidating these positions 13-15 minutes after that same goal, would have yielded a
positive return on investment of roughly 4 percent before transaction costs and 2.4
percent after transaction costs.
The frequency with which arbitrage opportunities arise across related securities
In efficient markets, one does not expect arbitrage opportunities to be large or
persistent. In games in which a draw is possible, there are two combinations of trades
that can potentially yield arbitrage profits: (1) going long all three contracts (the pre-
game favorite to win, the pre-game underdog to win, and the draw), or (2) shorting all
11 In the specification in Figure 1, we have constrained the coefficient on price to have the same magnitude (but the opposite sign) when a team scores a goal versus is scored upon. Because of the possibility of a draw, these two values need not be identical. In later figures, we report results separately for goals in favor and goals against. 12 Although not shown graphically, we have also analyzed the price response to a goal being scored for a range of subsets of the data. The impact on the price of a team to win the game is similar when the team scores a goal to achieve a one goal lead or a two goal lead (on average the price change is 30 percentage points). When the team scores to tie the game, the price impact is smaller (slightly below 20 percentage points). The impact of a goal is not particularly sensitive to the price of the contract before the goal is scored. For almost all of these sub-groups we can reject the null hypothesis that the price changes are immediately and completely incorporated after a goal is scored.
9

three contracts. In the first case, one gets paid off on exactly one contract with certainty.
In the second instance, the arbitrager is guaranteed to have to pay off exactly one of the
three contracts. If the total of the ask prices on the three contracts (plus transaction costs)
is less than 100 at any point in time, an arbitrage opportunity is available. And similarly,
if the three bid prices (minus transaction costs) are more than 100, then the second
arbitrage opportunity is present.
Table 2 reports the frequency, persistence, and magnitude with which such
arbitrage opportunities arise. Column 1 shows that there were a total of 73 instances we
identify in which an arbitrage opportunity was present. The arbitrage chances lasted, on
average, for less than 15 seconds., as demonstrated in Column 2. Thus, during the
playing of these 50 games, there was a total of less than 20 minutes out of roughly 100
hours of play in which an arbitrage opportunity was available, or about one-third of one
percent of the time. Given that trading in these markets is relatively sparse (not a single
trade occurs in about two-thirds of the game minutes we observe), it is interesting that
these arbitrage opportunities so quickly correct themselves. The rapidity of the market
adjustment is even more remarkable in light of the fact that the total profit that an
arbitrageur would have made by exploiting all of these opportunities totals to less than
$800.
Equal returns across readily observable security characteristics
In an efficient market, one would not expect readily observable characteristics of
securities to be systematically associated with excess returns.13 Table 3 summarizes the
13 In financial markets, if observable characteristics are correlated with risk factors, then expected returns may vary, but no systematic correlation between observable factors and risk-adjusted returns should exist.
10
dollar value invested, realized profits (after transaction costs), and return on investment
for the various types of contracts. In each case, we report results for both investors who
are long the contract and those that are short the contract. The first row includes all
contract types. The total dollar value of investment at risk across all trades (both long
and short) was $1.447 million. Well more than half of the money at risk was for those
who were short the position ($875,307) ; because there are three contracts on each game
and only one contract will pay out at the end of the game, short sellers typically have to
put up more money than those going long. Investments that were long the securities lost
a total of almost $55,000. Short sellers made over $30,000. The difference between
these totals ($23,147) reflects the transaction cost associated with Intrade’s commission
of 1.6 percent per contract (0.4 percent of the face value of each $10 contract for each
trader both in opening and closing a position). The profits associated with taking the
short position are difficult to explain. There are no institutional obstacles associated with
short selling in this context – any trader can readily take a short position. Being short
does generally require a greater investment (because only one of three contracts pays off),
but it is hard to believe this can account for the striking pattern in the data.
The next three rows divide the sample into the three different contract types: the
pre-game favorite to win, the underdog to win, and a draw to occur. Long positions on
the favorite to win yield negative returns of almost $50,000, with corresponding profits of
almost $38,000 for those short the pre-game favorite to win. (The gap between these two
is again the commission charged on transactions).
The availability of positive returns shorting favorites runs contrary to efficient
market predictions. One possible explanation for the findings is that they are an
11

aberration resulting from a small sample of games. If an unusually large number of
upsets and an unexpectedly small number of draws occurred in the 2002 World Cup, such
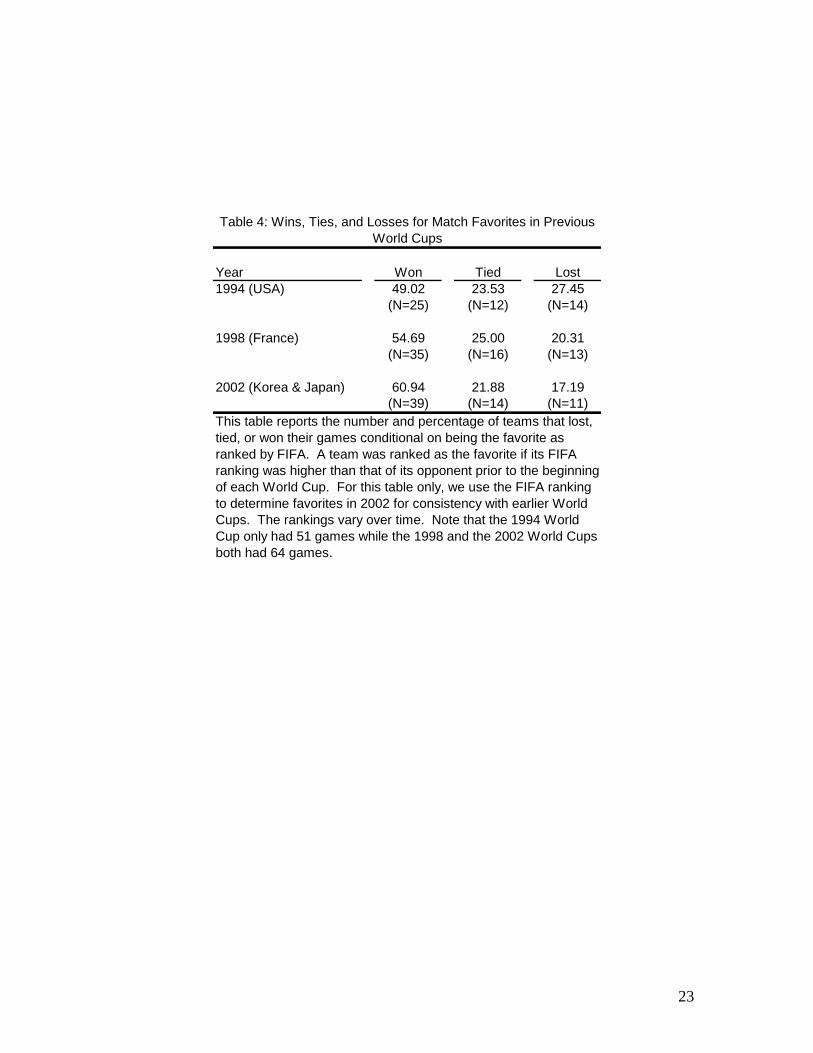
a result would arise in sample. Table 4, which displays game outcomes for the three most
recent World Cups, however, calls into question this explanation for the findings.
Favored teams won a greater share of games in the 2002 World Cup (our sample) than in
either the 1994 or 1998 tournaments.14,15
For the other two contract types, returns are much closer to being equalized
across short and long. Being short the underdog yields a small profit, as does being long
the draw.
Section IV: The Role of Market Makers
The markets we are analyzing are relatively thinly traded, making liquidity an
issue. One interesting feature of these markets is the endogenous emergence of market
makers who provide liquidity by offering to either buy or sell a substantial volume (at
least $500 worth) of a given contract at a particular point in time. These market makers
are not affiliated with Intrade and do not get special treatment vis-à-vis other traders.
They are simply individual traders who elect to provide market liquidity in pursuit of
profits. Market makers are on at least one side of the trade in 65 percent of the total
contracts traded and they represent approximately 50 percent of the money invested.
14 In the earlier tournaments, we do not have prices from the betting markets, so we define the favorite to be the team with the higher FIFA ranking prior to the beginning of World Cup play to be the favorite. In the 2002 World Cup, this algorithm would correctly pick the team that bettors call the favorite in 6 of the 50 games in our sample. For consistency, we use FIFA rankings to define favorites and underdogs in 2002 in Table 4, although this is not our definition elsewhere in the paper. 15 The results concerning bettor bias towards favorites, although far from definitive given our small sample of games, is consistent with past evidence of such biases in wagering on other sports (Levitt 2004).
12
Table 5 provides information about the distribution of numbers of market
makers, trading activity, and bid-ask spreads by contract. For every contract we observe,
there are at least two traders who take a market maker role. On over 20 percent of the
contracts there are five or more market makers in action (eight is the maximum). The
second row of the table reports the average volume traded on each contract, by number of
market makers. Trade volumes are an increasing function of the number of market
makers. This correlation may reflect the fact that additional market makers increase
liquidity in the markets. Alternatively, it may simply be that the same factors that
generate trading interest also encourage more market makers to enter. Analysis of the
median and mean bid-ask spreads on the contracts suggest that the latter explanation is
likely more important. The median bid-ask spread varies between three and four and it is
not clearly declining with the addition of more market makers.16 The mean bid-ask
spread is highest when there are four market makers, and lowest when there are five or
more market makers. In sum, it appears that the contracts with two market makers
provide about as smoothly as those with more market makers.
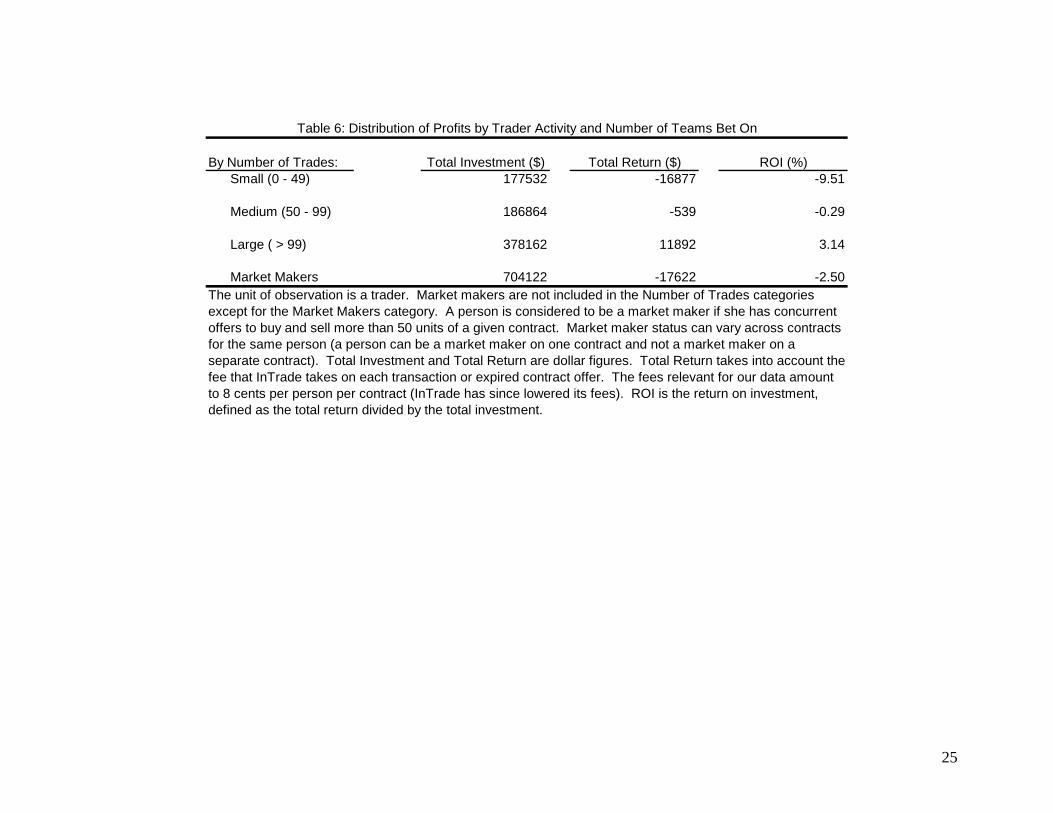
Table 6 shows returns to traders by the total number of trades they make, with
market makers broken out separately. More active traders do better than those who make
fewer trades, although this may be due in part to selection: if a trader has done poorly
thus far betting on the World Cup, he may be less likely to continue trading. The
interesting exception to the pattern of frequent traders doing better is for market makers.
Although market makers are extremely active traders, their net profits are negative, even
before transaction costs.
16 Although not shown in the table, when contracts are broken down separately into 5, 6, 7, or 8 market makers, the median bid-ask spread is 3 for each of those cases.
13
If the bid-ask spread set by market makers is centered on the true probabilities and
the spread offered by the market makers is 4 percent, then the expected market maker
profit would be 2 percent per trade, minus a 0.8 percent transaction fee, for a net profit
rate of 1.2 percent per trade. The total dollar value of trades by market makers of about
$700,000 would imply an expected profit of $8,400. In practice, however, market makers
lose $17,622 in the sample, for a return on investment of -2.5 percent. This suggests that
the bids and asks posted by the market makers are not centered around the true
probabilities, and that on average the bettors on the other side of the trade have better
estimates of the true probabilities than the market makers.17 Market makers do
particularly badly just before and after a goal is scored – about 30% of their total losses
arise in the minute before and minute after a goal. This suggests that in some cases other
gamblers are able to take advantage of the arrival of new information before the market
makers are able to cancel their posted bid-ask spreads.
Section V: Conclusion
Trading in securities tied to the outcome of World Cup matches provide a unique
window onto the working of real-world markets. These contracts have many of the
virtues of laboratory experiments on markets: the security traded is simple, it is easy to
identify information innovations and all market participants observe these information
shocks simultaneously. The World Cup contracts also have important advantages over
the lab. The amount of money at stake is much greater than most laboratory settings, the
markets are naturally occurring and not subject to the distortions that come with the
17 Further evidence that the market makers’ posted prices are not centered around the true probabilities comes from the fact that about 6.6% of trades take place between two market makers, when one’s bid price is above the other’s ask price.
14
excess scrutiny of the lab, and the participants self-select into these markets in a way that
is presumably analogous to other actual markets (Levitt and List 2006). Our analysis of
these markets suggests that the patterns observed provide only mixed support for the
efficient market hypothesis. Although prices jump immediately after goals are scored,
prices are higher still 10-15 minutes after the goal. Moreover, we observe systematically
negative returns for bets on favorites, which are not predicted in an efficient market. This
finding does not appear to be an artifact of the relatively small sample of matches that we
observe, and mirrors similar patterns in other sports wagering markets. In favor of
market efficiency, arbitrage opportunities across inter-related markets are few and far
between. Finally, we observe the endogenous emergence of market makers providing
liquidity in these markets. Surprisingly, these market makers generate negative profits,
yet remain prevalent in the data.
In addition to the puzzles highlighted above, these markets also raise another
important question worthy of economic consideration. The structure of this trading
market is fundamentally different than the standard sports wagering contract in which a
bookie takes one side of a bet with a bettor on the other. To compensate for the resulting
risk, the bookie’s commission, known as the vigorish, is typically 5 percent of the value
of the bet. The commission on trades at Intrade, in contrast, are less than 2 percent of the
value of the bet. Further, the Intrade contracts have the added virtue of being traded at
any point in time, even during the event, whereas the standard bet cannot be reversed
once it is placed with a bookie. In spite of these advantages, a total of less than $1.5
million in trades were made at Intrade in the 2002 World Cup, a trivially small fraction of
overall betting on the event. A partial answer to that question no doubt lies in the fact
15
that the Intrade website was relatively new at that time. Nonetheless, more recent data
from other sporting events suggests that while this form of wagering is gaining increased
acceptance among bettors, the share of all bets done in this format is far less than that
which economists would predict given the clear advantages that these markets provide
relative to traditional forms of bookmaking.
16

References
Beaver, William, 1968, “The Information Content of Annual Earnings Announcements,”
Journal of Accounting Research 6:67-92.
Camerer, Colin, 1998, “Can Asset Markets be Manipulated? A Field Experiment with
Racetrack Betting,” Journal of Political Economy 106(3):457-482.
Chamberlain, Edward, 1948, “An Experimental Imperfect Market,” Journal of Political
Economy 56(2): 95-108.
Chen, N., Richard Roll, and Stephen Ross, 1986, “Economic Forces and the Stock
Market,” Journal of Business 59:383-403.
Fama, Eugene, “Efficient Capital Markets: A Review of Theory and Empirical Work,”
Journal of Finance 25(2): 383-417.
Golec, J. and M. Tamarkin, 1991, “The Degree of Price Inefficiency in the Football
Betting Markets,” Journal of Financial Economics30: 311-325.
Gray, P. and S. Gray, 1997, “Testing Market Efficiency: Evidence from the NFL Sports
Betting Market,” Journal of Finance 52: 1725-1737.
Hartzmark, Sam, and David Solomon, 2006, “Are Gamblers Loss Averse? Efficiency
and the Disposition Effect in N.F.L. Prediction Markets,” unpublished
manuscript, University of Chicago.
Jarrell, Gregg, and Annette, Poulsen, 1989, “Stock Trading before the Announcement of
Tender Offers: Insider Trading or Market Anticipation?” Journal of Law,
Economics, and Organization 5(2):225-248.
Leigh, Andrew, Justin Wolfers, and Eric Zitzewitz, 2003, “What do Financial Markets
Think of War in Iraq?” NBER Working Paper No.9587.
17
18
Levitt, Steven, 2004, “How do markets function? An empirical analysis of gambling on
the National Football League,” Economic Journal 114, 495: 2043-2066.
Levitt, Steven, and John List, 2006, “What Do Laboratory Experiments Tell Us About
the Real World?” Working Paper, University of Chicago.
List, John, 2004, “Testing Neoclassical Competitive Theory in Multilateral Decentralized
Markets,” Journal of Political Economy 112(5):1131-1156.
Malkiel, Burton, 2003, “The Efficient Market Hypothesis and Its Critics,” Journal of
Economic Perspectives 17(1): 59-82.
Pearce, Douglas, and V. Vance Roley, 1985, “Stock Prices and Economic News,”
Journal of Business 58(1): 49-67.
Plott, Charles, and Shyam Sunder, 1988, “Rational Expectations and the Aggregation of
Diverse Information in Laboratory Security Markets,” Econometrica 56(5):1085-
1118.
Shiller, Robert, 2003, “From Efficient Markets Theory to Behavioral Finance,” Journal
of Economic Perspectives 17(1):83-104.
Smith, Vernon, 1962, “An Experimental Study of Competitive Market Behavior,”
Journal of Political Economy 70(2): 111-137.
Wolfers Justin, and Eric Zitzewitz, 2004, “Prediction Markets,” Journal of Economic
Perspectives 18(2):107-126.
Worrell, D., W. Davidson III, and V. Sharma, 1991, “Layoff Announcements and
Stockholder Wealth,” Academy of Management Journal 34:662-678.
19
Figure 1: Price Response to a Goal Scored
-10
-5
0
5
10
15
20
25
30
35
40
45
-16 -14 -12 -10 -8 -6 -4 -2 0 2 4 6 8 10 12 14 16
Minutes before and after a goal is scored (score occurs at time=0)
Pric
e coeffs
95% C.I.

Game Date Score UpsetVolume
Traded ($) TradesMarket Makers Traders
% Volume Traded During Game
Portugal-USA 6/5/2002 2-3 1 47010 424 7 140 0.69Russia-Tunisia 6/5/2002 2-0 0 18810 122 4 64 0.55Germany-Ireland 6/5/2002 1-1 0 14590 53 2 25 0.62Cameroon-Saudi Arabia 6/6/2002 1-0 0 30000 186 4 64 0.75Denmark-Senegal 6/6/2002 1-1 0 14690 60 2 43 0.09France-Uruguay 6/6/2002 0-0 0 19410 170 3 83 0.55Sweden-Nigeria 6/7/2002 2-1 0 37530 112 2 38 0.48Spain-Paraguay 6/7/2002 3-1 0 29800 182 2 76 0.72Argentina-England 6/7/2002 0-1 1 12240 81 2 42 0.62Slovenia-South Africa 6/8/2002 0-1 1 20340 121 3 48 0.61Italy-Croatia 6/8/2002 1-2 1 27940 208 4 88 0.57Brazil-China 6/8/2002 4-0 0 40810 246 6 103 0.36Mexico-Ecuador 6/9/2002 2-1 0 42430 344 7 140 0.50Russia-Japan 6/9/2002 0-1 1 24420 186 4 73 0.64Turkey-Costa Rica 6/9/2002 1-1 0 40850 305 3 124 0.65Portugal-Poland 6/10/2002 4-0 0 24700 144 2 63 0.61South Korea-USA 6/10/2002 1-1 0 40900 248 3 89 0.82Belgium-Tunisia 6/10/2002 1-1 0 71520 445 8 136 0.54France-Denmark 6/11/2002 0-2 1 34540 283 6 111 0.68Ireland-Saudi Arabia 6/11/2002 3-0 0 28010 151 7 85 0.35Germany-Cameroon 6/11/2002 2-0 0 29630 149 4 72 0.11Senegal-Uruguay 6/11/2002 3-3 0 8590 31 4 20 0.42Paraguay-Slovenia 6/12/2002 3-1 0 12790 53 2 38 0.13Argentina-Sweden 6/12/2002 1-1 0 5640 49 3 40 0.10England-Nigeria 6/12/2002 0-0 0 32560 204 4 84 0.59Spain-South Africa 6/12/2002 3-2 0 59900 358 7 115 0.46Croatia-Ecuador 6/13/2002 0-1 1 21820 107 4 70 0.17Italy-Mexico 6/13/2002 1-1 0 43850 370 4 123 0.67Turkey-China 6/13/2002 3-0 0 9030 64 4 39 0.37Brazil-Costa Rica 6/13/2002 5-2 0 13720 89 4 49 0.62USA-Poland 6/14/2002 1-3 1 6240 63 3 54 0.09Portugal-South Korea 6/14/2002 0-1 1 64230 473 8 135 0.62Russia-Belgium 6/14/2002 2-3 1 2030 21 2 17 0.01Japan-Tunisia 6/14/2002 2-0 0 23350 130 4 74 0.35England-Denmark 6/15/2002 3-0 0 31460 169 8 87 0.17Germany-Paraguay 6/15/2002 1-0 0 10410 104 4 57 0.82Spain-Ireland 6/16/2002 1-1 (3-2) 0 29930 190 6 92 0.29Sweden-Senegal 6/16/2002 1-2 (GG) 1 30090 175 4 58 0.61Brazil-Belgium 6/17/2002 2-0 0 29650 304 5 134 0.40Mexico-USA 6/17/2002 0-2 1 33120 161 4 79 0.61Japan-Turkey 6/18/2002 0-1 1 23760 175 5 80 0.45Italy-South Korea 6/18/2002 1-2 (GG) 1 39230 370 8 139 0.39Brazil-England 6/21/2002 2-1 0 52820 295 8 99 0.31Germany-USA 6/21/2002 1-0 0 50190 328 8 141 0.27Senegal-Turkey 6/22/2002 0-1 (GG) 1 16460 110 2 46 0.62Spain-South Korea 6/22/2002 0-0 (3-5) 1 17420 104 2 44 0.68Germany-South Korea 6/25/2002 1-0 0 49820 277 5 112 0.41Brazil-Turkey 6/26/2002 1-0 0 45300 221 9 115 0.24South Korea-Turkey 6/29/2002 2-3 1 22890 150 7 70 0.31Brazil-Germany 6/30/2002 2-0 0 10210 71 2 42 0.63
Table 1: Summary Statistics of Games Played in the 2002 World Cup
There were a total of 64 games in the 2002 World Cup. Only 50 games are included in our sample because 14 of the games had no activity in the market. First Round games can end in a tie. Playoff games go into an overtime period if they are tied at the end of regulation play. Score reflects the number of goals each team scored. GG denotes that the game went into overtime and was won with a golden goal in an extra period. If there were no goals in the overtime period, the teams went to a shootout with penalty kicks. The results of the penalty kicks are shown in parentheses. Upset shows when the pregame underdog (as determined by the prices of the contracts immediately before the game began) beat the pregame favorite.
20

21
Unique arbitrage opportunities
Average length of time opportunity exists (in
seconds)
Total value of arbitrage
opportunities ($)Position:
Long on all three 17 12.53 $100.38
Short on all three 56 14.55 $675.98
Table 2: Summary of Arbitrage Opportunities
Arbitrage opportunities take into account transaction costs associated with buying or selling a contract. The unit of observation is game x second. The unique number of arbitrage opportunities counts each aribtrage opportunity only once (an opportunity that lasts 10 seconds will only be counted once). The average length of time the arbitrage opportunity exists is conditional on this second having an arbitrage opportunity. The total value of the arbitrage opportunities displays the total amount of money that could have been made by fully exploiting the arbitrage opportunities.

22
Contract:
Total Long Short Total Long Short Long Short
All 1446680 571373 875307 -23147 -54797 31650 -9.59 3.62Favorite to win 627920 339803 288117 -10047 -47897 37850 -14.10 13.14Underdog to win 485540 127839 357701 -7769 -9004 1235 -7.04 0.35Draw to win 333220 103731 229490 -5332 2104 -7435 2.03 -3.24For each event (game), there were three contracts we included in the sample: a contract that pays if Team A wins, a contract that pays if Team B wins, and a contract that pays if Teams A & B draw. Total Investment and Total Return are dollar figures and are broken down by whether the trader offers to sell (Short) or offers to buy (Long). Total Return takes into account the fee that InTrade takes on each transaction or expired contract offer. The fees relevant for our data amount to 8 cents per person per contract which amount to 16 cents per trade (InTrade has since lowered its fees). ROI is the return on investment, defined as the total return divided by the total investment. A team is described as the Favorite if the contract for it to win was trading at a higher price than either of the other two contracts on that game the minute before the game started.
Table 3: Realized Profit by Contract Type and Position
ROI (%)Total Investment ($) Total Return ($)
Year Won Tied Lost1994 (USA) 49.02 23.53 27.45
(N=25) (N=12) (N=14)
1998 (France) 54.69 25.00 20.31(N=35) (N=16) (N=13)
2002 (Korea & Japan) 60.94 21.88 17.19(N=39) (N=14) (N=11)
This table reports the number and percentage of teams that lost, tied, or won their games conditional on being the favorite as ranked by FIFA. A team was ranked as the favorite if its FIFA ranking was higher than that of its opponent prior to the beginning of each World Cup. For this table only, we use the FIFA ranking to determine favorites in 2002 for consistency with earlier World Cups. The rankings vary over time. Note that the 1994 World Cup only had 51 games while the 1998 and the 2002 World Cups both had 64 games.
Table 4: Wins, Ties, and Losses for Match Favorites in Previous World Cups
23

24
2 3 4 5+
Number of Contracts 46 37 32 35
Average $ Trade Volume 5643 9180 11149 14019
Median Bid-Ask Spread 4 3 4 3
Mean Bid-Ask Spread 5.71 5.11 6.15 4.34
Table 5: Value of Trades and Bid-Ask Spread Information by Number of Market-Makers
Number of Market Makers active in the Contract
Data are by minute and contract. The Bid-Ask spread is the difference between the highest bid (buy) offer and the lowest ask (sell) offer at each minute of the game (the actual measurements are taken at exactly 1 minute into the game, exactly 2 minutes into the game, etc.). There were no contracts with fewer than 2 market makers or more than 8 market makers. The threshold for being considered a market maker is simultaneously offering to buy and sell at least 50 units of a single contract.
By Number of Trades: Total Investment ($) Total Return ($) ROI (%)
Small (0 - 49) 177532 -16877 -9.51
Medium (50 - 99) 186864 -539 -0.29
Large ( > 99) 378162 11892 3.14
Market Makers 704122 -17622 -2.50
Table 6: Distribution of Profits by Trader Activity and Number of Teams Bet On
The unit of observation is a trader. Market makers are not included in the Number of Trades categories except for the Market Makers category. A person is considered to be a market maker if she has concurrent offers to buy and sell more than 50 units of a given contract. Market maker status can vary across contracts for the same person (a person can be a market maker on one contract and not a market maker on a separate contract). Total Investment and Total Return are dollar figures. Total Return takes into account the fee that InTrade takes on each transaction or expired contract offer. The fees relevant for our data amount to 8 cents per person per contract (InTrade has since lowered its fees). ROI is the return on investment, defined as the total return divided by the total investment.
25