testing of analog video component signals … of analog video component signals application note ......
TRANSCRIPT
Testing of Analog Video Component Signals Application Note
Products:
ı R&S®VTC
ı R&S®VTE
ı R&S®VTS
ı R&S®BTC
Despite the now standard digital distribution of video signals, analog video signals are still an integral part
of AV terminals in the home.
This application note covers the fundamentals of analog component signals and shows how the signal
quality can be measured with the measuring equipment from Rohde & Schwarz.
Note:
Please find the most up-to-date document on our homepage
http:\\www.rohde-schwarz.com/appnote/7MH107.
App
licat
ion
Not
e
Har
ald
Ibl
5.
2015
– 7
MH
107_
0E
Table of Contents
7MH107_0E Rohde & Schwarz Testing of Analog Video Component Signals
2
Table of Contents
1 Introduction ......................................................................................... 4
2 Basics .................................................................................................. 5
2.1 GBR and YPbPr Color Systems ................................................................................. 5
2.2 Level .............................................................................................................................. 6
2.3 Synchronization ........................................................................................................... 7
3 Test Signals ......................................................................................... 8
4 Relevant Standards ............................................................................ 9
5 Test Scenarios .................................................................................. 10
5.1 Set-Top Box with RF Signal Feed ............................................................................10
5.2 Set-Top Box with USB Signal Feed..........................................................................11
5.3 DVD Player with Signal Feed via DVD or BD ..........................................................11
5.4 Laptop with VGA Interface ........................................................................................12
6 Operation of the R&S®VTC/VTE/VTS/BTC Video Analyzers ......... 13
6.1 Preparatory Steps ......................................................................................................13
6.2 Configuring the Analyzer ..........................................................................................15
6.3 Configuring the Test Parameters .............................................................................17
6.4 Performing the Measurement ...................................................................................21
7 Automated Measurements ............................................................... 23
7.1 Amplitude and Delay .................................................................................................23
7.1.1 Luminance Bar Amplitude ............................................................................................24
7.1.2 Sync Pulse Amplitude ..................................................................................................25
7.1.3 Color Bar Amplitude .....................................................................................................28
7.1.4 Inter Channel Amplitude ..............................................................................................30
7.1.5 Inter Channel Delay .....................................................................................................32
7.2 Linear Distortions ......................................................................................................33
7.2.1 2T Pulse Measurements ..............................................................................................33
7.2.2 Short Time Distortion ...................................................................................................36
7.3 Nonlinear Distortions ................................................................................................38
7.3.1 Nonlinearity, Nonlinearity Step 1 to Step 5 ..................................................................38
7.4 Frequency Response ................................................................................................41
7.4.1 SIN X/X Amplitude, SIN X/X Delay ..............................................................................41
Table of Contents
7MH107_0E Rohde & Schwarz Testing of Analog Video Component Signals
3
7.4.2 Multiburst .....................................................................................................................43
7.4.3 Sweep Amplitude .........................................................................................................45
7.5 Noise Measurements .................................................................................................46
7.5.1 Signal to Noise Unweighted, Signal to Noise Luminance Weighted ...........................46
7.6 Timing .........................................................................................................................50
7.6.1 Field Period ..................................................................................................................51
7.6.2 Field Frequency ...........................................................................................................51
7.6.3 Line Period ...................................................................................................................51
7.6.4 Line Frequency ............................................................................................................51
7.6.5 Lum Bar Duration .........................................................................................................51
7.7 Jitter ............................................................................................................................53
7.7.1 Line Jitter Pos Peak, Line Jitter Neg Peak, Line Jitter pp............................................53
7.7.2 Line Jitter Std. Deviation ..............................................................................................53
8 Ordering Information ........................................................................ 54
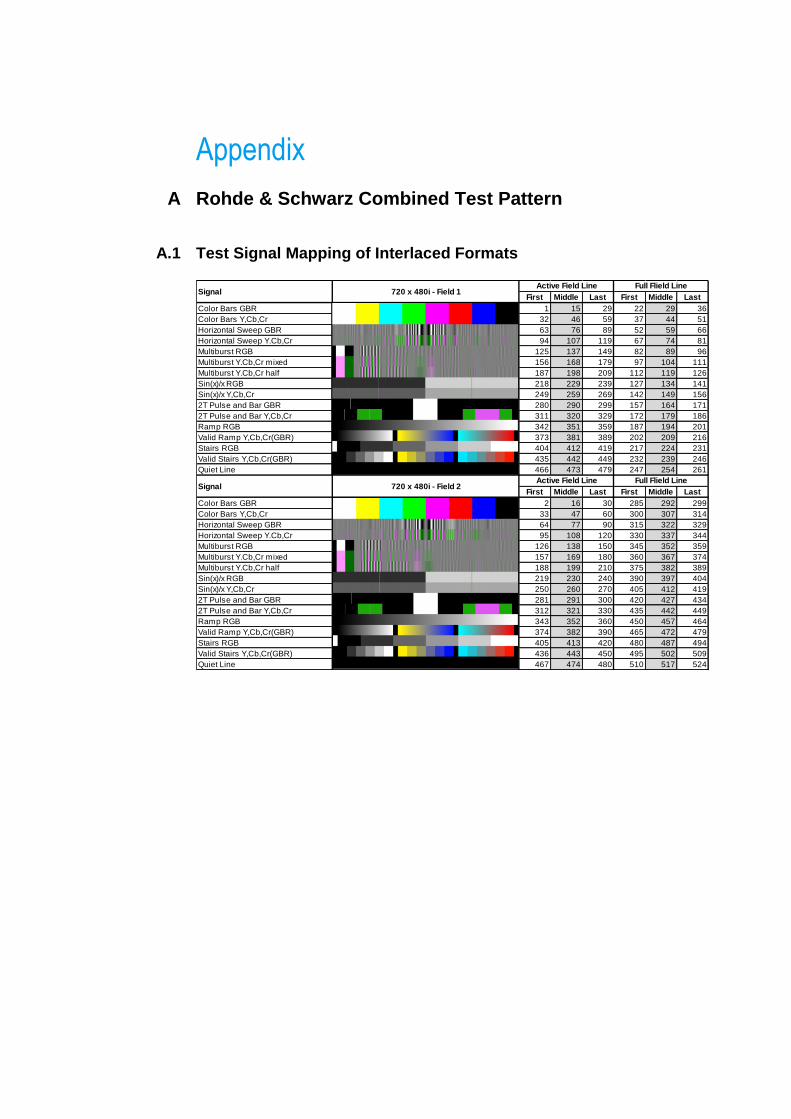
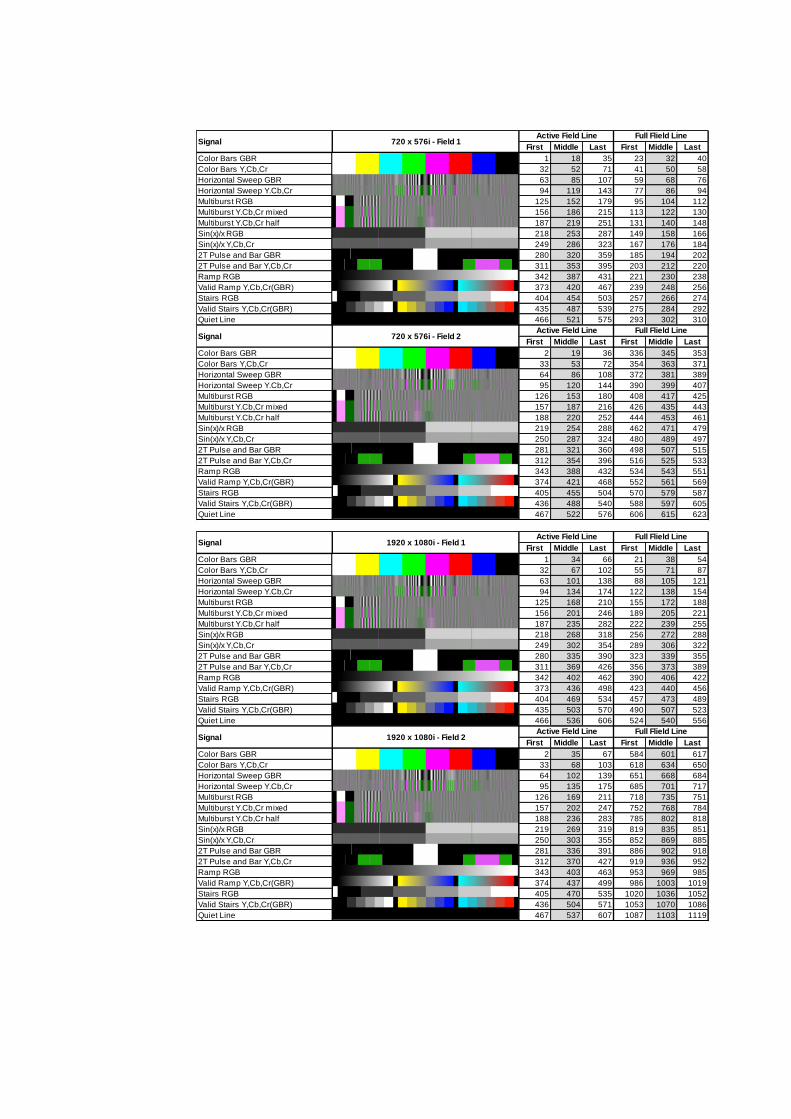
A Rohde & Schwarz Combined Test Pattern ..............................................................55
A.1 Test Signal Mapping of Interlaced Formats .................................................................55
A.2 Test Signal Mapping of Progressive Formats ..............................................................57
A.3 Timing and Frequencies ..............................................................................................58
A.4 Color Bars Signal Level ...............................................................................................58
B Mapping of Measurements and Test Signals ..........................................................59
C Sample Measurement Log ........................................................................................60
Introduction
GBR and YPbPr Color Systems
7MH107_0E Rohde & Schwarz Testing of Analog Video Component Signals
4
1 Introduction
Before digital video interfaces such as HDMI and MHL were introduced into homes,
analog component signals were the only way to exchange video signals with high
quality and in a wide range of resolutions. For this reason, analog interfaces are well
established in home consumer devices and are often still included in new video
equipment to maintain compatibility. As a result, the need for suitable T&M equipment
remains undiminished.
This application note provides an overview of the video component technology and
describes in detail the tests and measurements needed for this technology. It includes
a discussion of suitable test signals and the signal supply as well as descriptions of a
wide variety of automated measurements.
Finally, step-by-step instructions are provided for recording and ensuring the quality of
component signals using Rohde & Schwarz video test equipment.
Basics
GBR and YPbPr Color Systems
7MH107_0E Rohde & Schwarz Testing of Analog Video Component Signals
5
2 Basics
2.1 GBR and YPbPr Color Systems
Video component signals are defined in two primary color systems – GBR and YPbPr.
GBR signals represent the natural colors of a picture in the form of its basic green,
blue and red components. This color system is at the beginning and end of the
transmission chain for color images. Every camera supplies GBR signals for all pixels
of the image. And every display uses these signals to regenerate the original colors. In
homes, GBR signals are primarily encountered in PCs (VGA). In the case of set-top
boxes, analog GBR signals are usually only encountered at the SCART output.
YPbPr signals split the color into a brightness information Y and two color difference
signals, Pb and Pr. Pb is calculated from the difference between blue and luminance,
and Pr from the difference between red and luminance. The use of color difference
signals can be traced back to the introduction of color television. They make it possible
to transmit a signal that is compatible with black-and-white televisions. In addition,
color difference signals have an advantage over GBR because they can be used to
reduce the resolution of the color information as compared with the luminance
information. In the case of analog component signals, this is done by cutting the
transmission bandwidth for the color difference signals in half. Because the human eye
is less sensitive to color information, this saves valuable transmission bandwidth
without impairing the picture quality. YPbPr interfaces are found in every home
consumer device that supports video components.
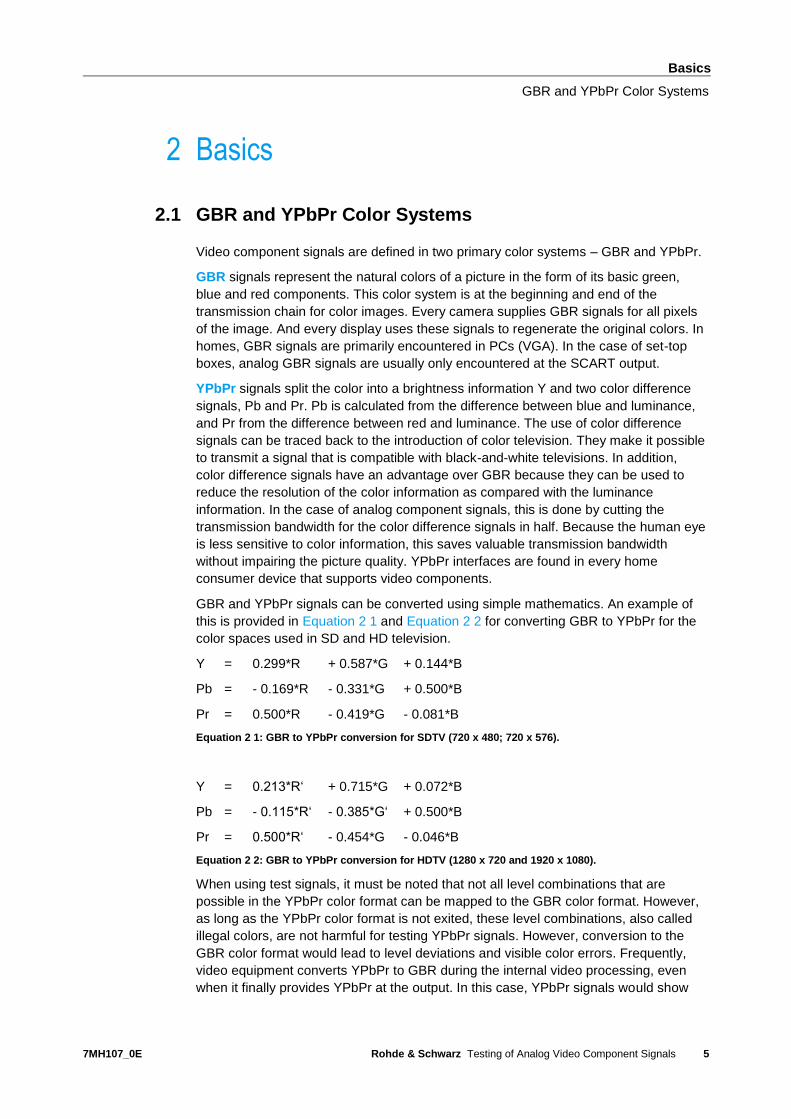
GBR and YPbPr signals can be converted using simple mathematics. An example of
this is provided in Equation 2 1 and Equation 2 2 for converting GBR to YPbPr for the
color spaces used in SD and HD television.
Y = 0.299*R + 0.587*G + 0.144*B
Pb = - 0.169*R - 0.331*G + 0.500*B
Pr = 0.500*R - 0.419*G - 0.081*B
Equation 2 1: GBR to YPbPr conversion for SDTV (720 x 480; 720 x 576).
Y = 0.213*R‘ + 0.715*G + 0.072*B
Pb = - 0.115*R‘ - 0.385*G‘ + 0.500*B
Pr = 0.500*R‘ - 0.454*G - 0.046*B
Equation 2 2: GBR to YPbPr conversion for HDTV (1280 x 720 and 1920 x 1080).
When using test signals, it must be noted that not all level combinations that are
possible in the YPbPr color format can be mapped to the GBR color format. However,
as long as the YPbPr color format is not exited, these level combinations, also called
illegal colors, are not harmful for testing YPbPr signals. However, conversion to the
GBR color format would lead to level deviations and visible color errors. Frequently,
video equipment converts YPbPr to GBR during the internal video processing, even
when it finally provides YPbPr at the output. In this case, YPbPr signals would show
Basics
Level
7MH107_0E Rohde & Schwarz Testing of Analog Video Component Signals
6
level deviation at the output. This must be taken into consideration when generating
proprietary test signals. The test signals provided by Rohde & Schwarz for
measurements of component signals [3] are designed in such a way that these effects
cannot occur.
A few notes regarding notations:
The notations Y‘PbPr as well as G‘B‘R’ are frequently seen. The prime indicates that
the signals underwent a gamma correction to compensate the nonlinearity of camera
systems. The notations YCbCr and Y’CbCr describe color differential signals in the
digital domain. Where there is no distinction for the primary color system, GBR and
G’B’R’ are used for analog and digital domain.
2.2 Level
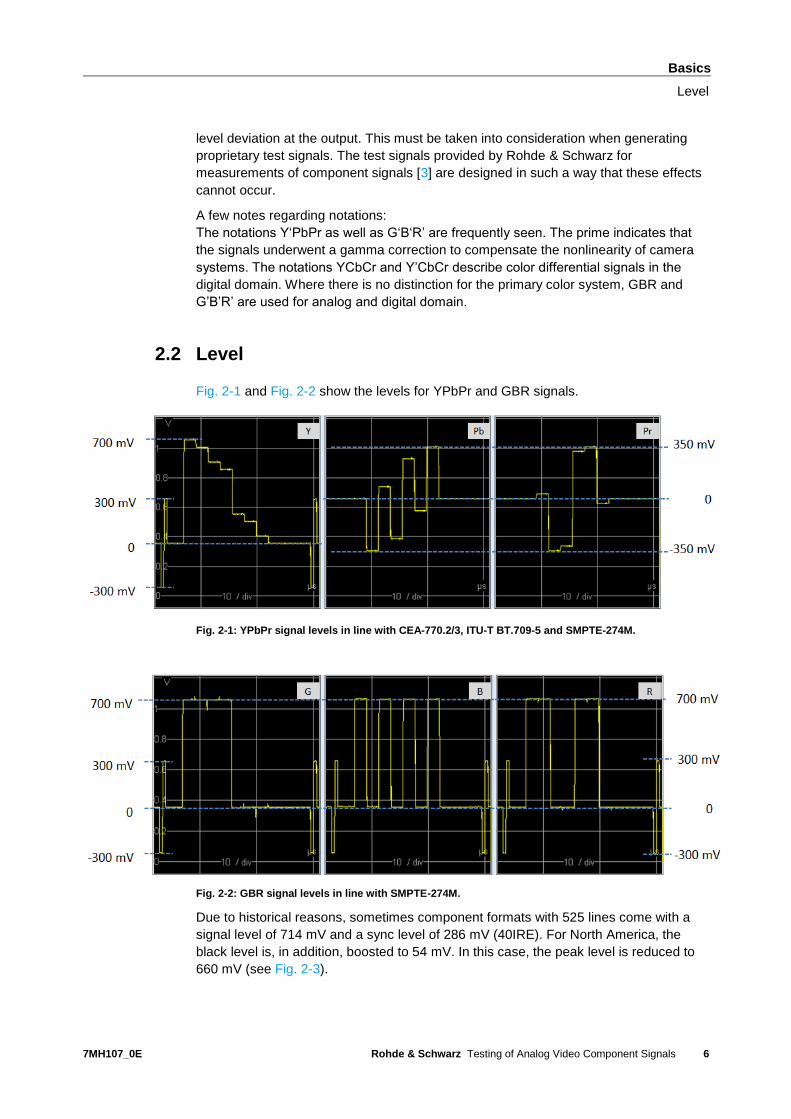
Fig. 2-1 and Fig. 2-2 show the levels for YPbPr and GBR signals.
Fig. 2-1: YPbPr signal levels in line with CEA-770.2/3, ITU-T BT.709-5 and SMPTE-274M.
Fig. 2-2: GBR signal levels in line with SMPTE-274M.
Due to historical reasons, sometimes component formats with 525 lines come with a
signal level of 714 mV and a sync level of 286 mV (40IRE). For North America, the
black level is, in addition, boosted to 54 mV. In this case, the peak level is reduced to
660 mV (see Fig. 2-3).
Basics
Synchronization
7MH107_0E Rohde & Schwarz Testing of Analog Video Component Signals
7
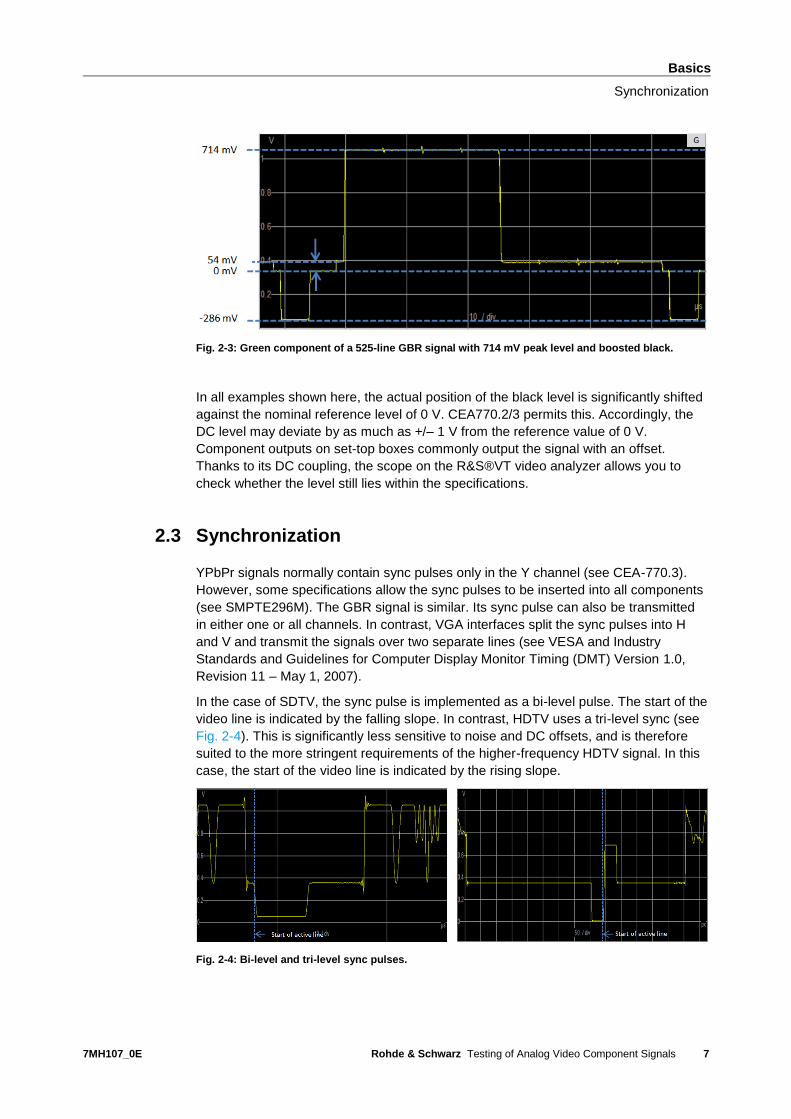
Fig. 2-3: Green component of a 525-line GBR signal with 714 mV peak level and boosted black.
In all examples shown here, the actual position of the black level is significantly shifted
against the nominal reference level of 0 V. CEA770.2/3 permits this. Accordingly, the
DC level may deviate by as much as +/– 1 V from the reference value of 0 V.
Component outputs on set-top boxes commonly output the signal with an offset.
Thanks to its DC coupling, the scope on the R&S®VT video analyzer allows you to
check whether the level still lies within the specifications.
2.3 Synchronization
YPbPr signals normally contain sync pulses only in the Y channel (see CEA-770.3).
However, some specifications allow the sync pulses to be inserted into all components
(see SMPTE296M). The GBR signal is similar. Its sync pulse can also be transmitted
in either one or all channels. In contrast, VGA interfaces split the sync pulses into H
and V and transmit the signals over two separate lines (see VESA and Industry
Standards and Guidelines for Computer Display Monitor Timing (DMT) Version 1.0,
Revision 11 – May 1, 2007).
In the case of SDTV, the sync pulse is implemented as a bi-level pulse. The start of the
video line is indicated by the falling slope. In contrast, HDTV uses a tri-level sync (see
Fig. 2-4). This is significantly less sensitive to noise and DC offsets, and is therefore
suited to the more stringent requirements of the higher-frequency HDTV signal. In this
case, the start of the video line is indicated by the rising slope.
Fig. 2-4: Bi-level and tri-level sync pulses.
Test Signals
Synchronization
7MH107_0E Rohde & Schwarz Testing of Analog Video Component Signals
8
3 Test Signals
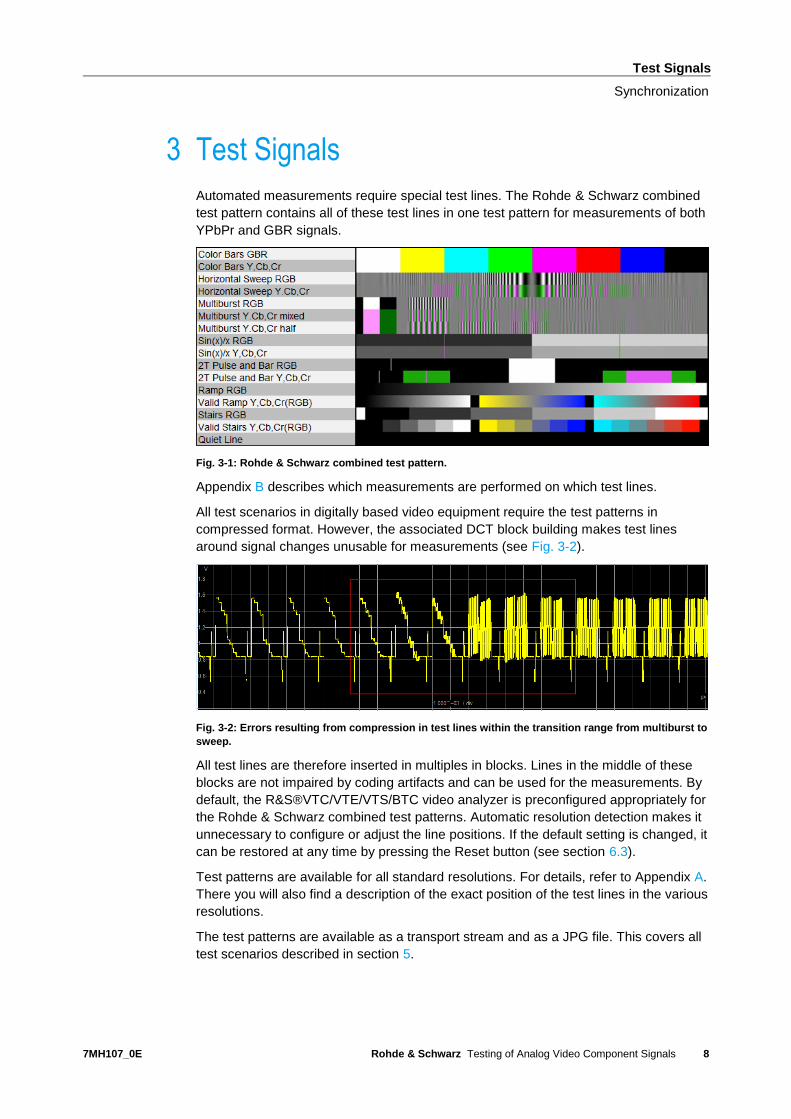
Automated measurements require special test lines. The Rohde & Schwarz combined
test pattern contains all of these test lines in one test pattern for measurements of both
YPbPr and GBR signals.
Fig. 3-1: Rohde & Schwarz combined test pattern.
Appendix B describes which measurements are performed on which test lines.
All test scenarios in digitally based video equipment require the test patterns in
compressed format. However, the associated DCT block building makes test lines
around signal changes unusable for measurements (see Fig. 3-2).
Fig. 3-2: Errors resulting from compression in test lines within the transition range from multiburst to
sweep.
All test lines are therefore inserted in multiples in blocks. Lines in the middle of these
blocks are not impaired by coding artifacts and can be used for the measurements. By
default, the R&S®VTC/VTE/VTS/BTC video analyzer is preconfigured appropriately for
the Rohde & Schwarz combined test patterns. Automatic resolution detection makes it
unnecessary to configure or adjust the line positions. If the default setting is changed, it
can be restored at any time by pressing the Reset button (see section 6.3).
Test patterns are available for all standard resolutions. For details, refer to Appendix A.
There you will also find a description of the exact position of the test lines in the various
resolutions.
The test patterns are available as a transport stream and as a JPG file. This covers all
test scenarios described in section 5.
Relevant Standards
Synchronization
7MH107_0E Rohde & Schwarz Testing of Analog Video Component Signals
9
4 Relevant Standards
ITU-R BT.470-6 Conventional Television Systems
ITU-R BT.601-5 Studio Encoding Parameters of Digital Television for Standard
4:3 and Widescreen 16:9 Aspect Ratios
ITU-R BT.709-5 Parameter Values for the HDTV Standards for Production and
International Programme Exchange
(Note: Part 1 of this document describes the old European
HDTV system and is no longer in use)
ITU-R BT.1700 Characteristics of Composite Video Signals for Conventional
Analogue Television Systems
ITU-R BT.1439-1 Measurement Methods Applicable in the Analogue Television
Studio and the Overall Analogue Television System
SMPTE ST 125-2013 SDTV Component Video Signal Coding 4:4:4 and 4:2:2 for 13.5
MHz and 18 MHz Systems
SMPTE 170M-2014 Composite Analog Video Signal NTSC for Studio Applications
SMPTE 253M-1998 Three-Channel RGB Analog Video Interface
SMPTE 274M-2008 1920 x 1080 Image Sample Structure, Digital Representation
and Digital Timing Reference Sequences for Multiple Picture
Rates
SMPTE 296M-1997 1280 x 720 Scanning, Analog and Digital Representation and
Analog Interface
CEA-770.2-D Standard Definition TV Analog Component Video Interface
CEA-770.3-E High Definition TV Analog Component Video Interface
CEA-861-D A DTV Profile for Uncompressed High Speed Digital Interfaces
Vsisv1r2 Video Signal Standard (VSIS)
DMTv1r11 VESA and Industry Standards and Guidelines for Computer
Display Monitor Timing (DMT) Version 1.0, Revision 11 – May 1,
2007
Test Scenarios
Set-Top Box with RF Signal Feed
7MH107_0E Rohde & Schwarz Testing of Analog Video Component Signals
10
5 Test Scenarios
The connections for performing measurements with an R&S®VTC/VTE/VTS/BTC
video analyzer are easily made. To prevent false results, however, a few basic
principles must be followed.
The 75 ohm BNC cables that feed the component signal to the analyzer must be equal
in length to prevent measurement errors during measurements of delay.
RCA connectors are typically used for the component outputs on the UEs. However,
the stability of these connections is often a critical factor. Therefore, only high-quality
RCA connectors should be used. Cables that include a direct RCA to BNC adaptation
are preferred. Alternatively, an RCA to BNC adapter can be used on the DUT. RCA
cables with an RCA to BNC adapter on the analyzer side should be avoided. The
quality of these cables is typically not suited for precision measurements.
During the tests, it must be consistently ensured that the test pattern resolution
matches the resolution of the video interface on the DUT. Although DUTs can convert
formats, the conversion typically ignores the Nyquist criteria. This results in aliasing
effects, in particular for frequency response measurements.
The test signal feed is dependent on the DUT. The sections below describe a few
typical scenarios.
5.1 Set-Top Box with RF Signal Feed
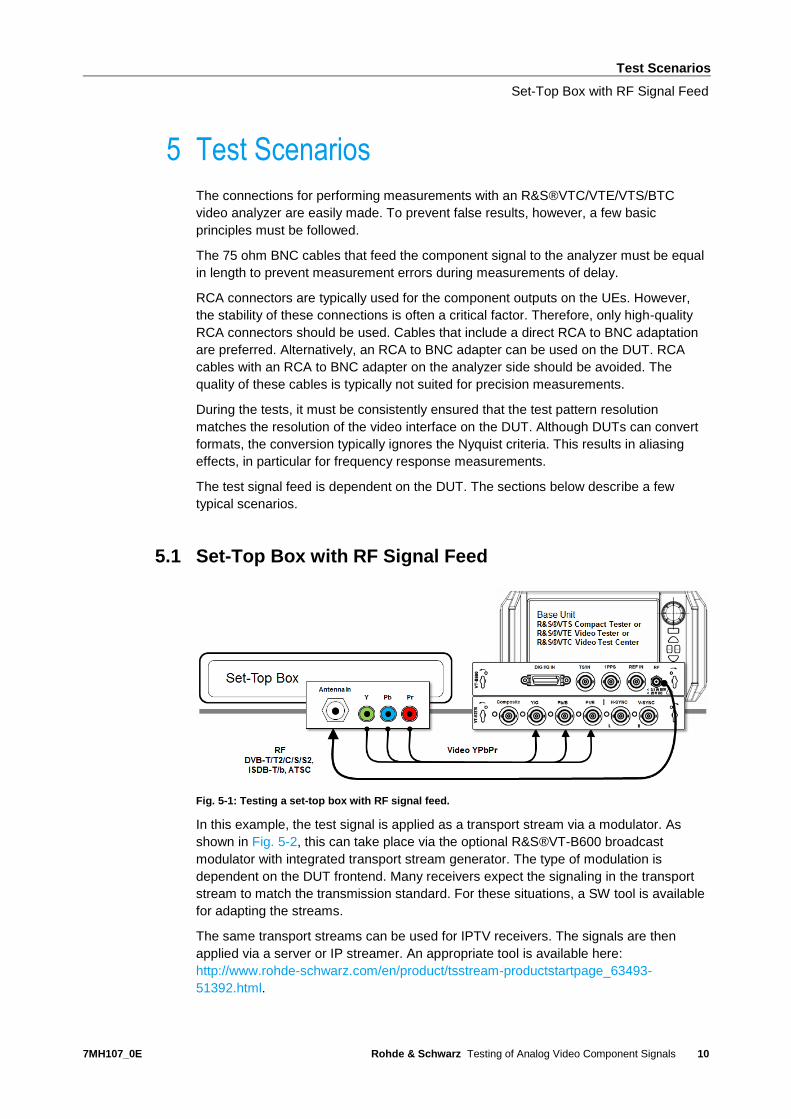
Fig. 5-1: Testing a set-top box with RF signal feed.
In this example, the test signal is applied as a transport stream via a modulator. As
shown in Fig. 5-2, this can take place via the optional R&S®VT-B600 broadcast
modulator with integrated transport stream generator. The type of modulation is
dependent on the DUT frontend. Many receivers expect the signaling in the transport
stream to match the transmission standard. For these situations, a SW tool is available
for adapting the streams.
The same transport streams can be used for IPTV receivers. The signals are then
applied via a server or IP streamer. An appropriate tool is available here:
http://www.rohde-schwarz.com/en/product/tsstream-productstartpage_63493-
51392.html.
Test Scenarios
Set-Top Box with USB Signal Feed
7MH107_0E Rohde & Schwarz Testing of Analog Video Component Signals
11
5.2 Set-Top Box with USB Signal Feed
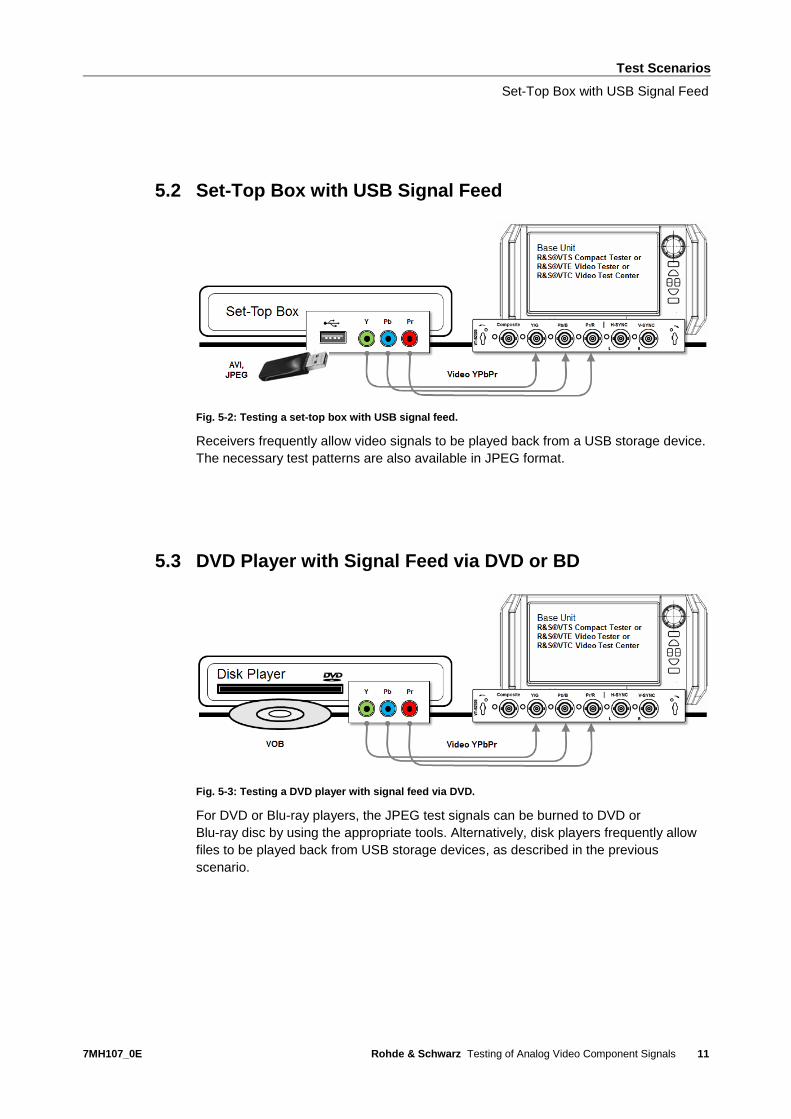
Fig. 5-2: Testing a set-top box with USB signal feed.
Receivers frequently allow video signals to be played back from a USB storage device.
The necessary test patterns are also available in JPEG format.
5.3 DVD Player with Signal Feed via DVD or BD
Fig. 5-3: Testing a DVD player with signal feed via DVD.
For DVD or Blu-ray players, the JPEG test signals can be burned to DVD or
Blu-ray disc by using the appropriate tools. Alternatively, disk players frequently allow
files to be played back from USB storage devices, as described in the previous
scenario.
Test Scenarios
Laptop with VGA Interface
7MH107_0E Rohde & Schwarz Testing of Analog Video Component Signals
12
5.4 Laptop with VGA Interface
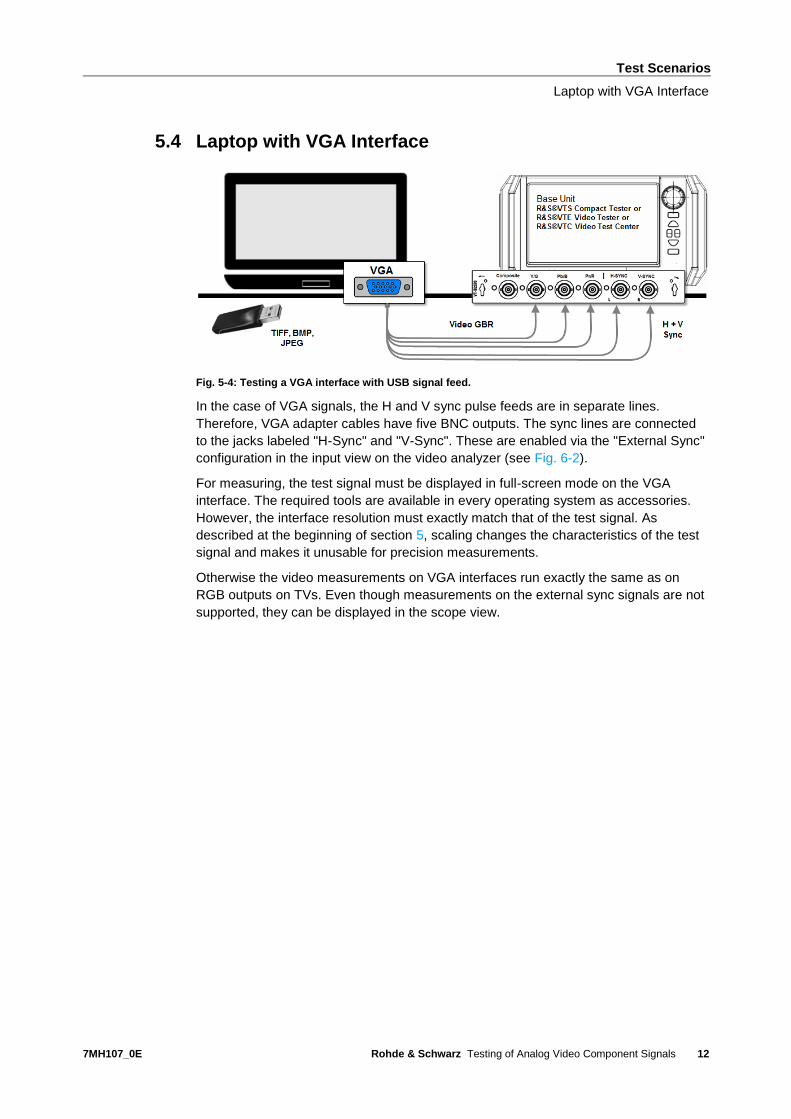
Fig. 5-4: Testing a VGA interface with USB signal feed.
In the case of VGA signals, the H and V sync pulse feeds are in separate lines.
Therefore, VGA adapter cables have five BNC outputs. The sync lines are connected
to the jacks labeled "H-Sync" and "V-Sync". These are enabled via the "External Sync"
configuration in the input view on the video analyzer (see Fig. 6-2).
For measuring, the test signal must be displayed in full-screen mode on the VGA
interface. The required tools are available in every operating system as accessories.
However, the interface resolution must exactly match that of the test signal. As
described at the beginning of section 5, scaling changes the characteristics of the test
signal and makes it unusable for precision measurements.
Otherwise the video measurements on VGA interfaces run exactly the same as on
RGB outputs on TVs. Even though measurements on the external sync signals are not
supported, they can be displayed in the scope view.
Operation of the R&S®VTC/VTE/VTS/BTC Video Analyzers
Preparatory Steps
7MH107_0E Rohde & Schwarz Testing of Analog Video Component Signals
13
6 Operation of the R&S®VTC/VTE/VTS/BTC
Video Analyzers
6.1 Preparatory Steps
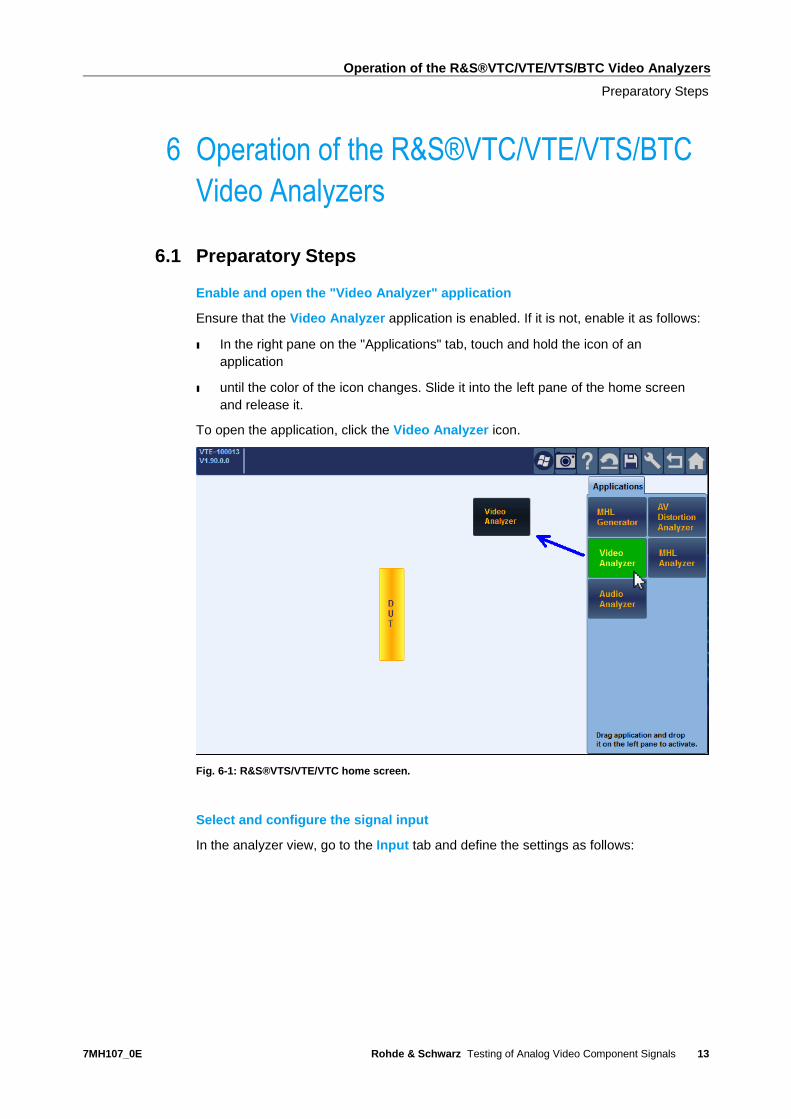
Enable and open the "Video Analyzer" application
Ensure that the Video Analyzer application is enabled. If it is not, enable it as follows:
ı In the right pane on the "Applications" tab, touch and hold the icon of an
application
ı until the color of the icon changes. Slide it into the left pane of the home screen
and release it.
To open the application, click the Video Analyzer icon.
Fig. 6-1: R&S®VTS/VTE/VTC home screen.
Select and configure the signal input
In the analyzer view, go to the Input tab and define the settings as follows:
Operation of the R&S®VTC/VTE/VTS/BTC Video Analyzers
Preparatory Steps
7MH107_0E Rohde & Schwarz Testing of Analog Video Component Signals
14
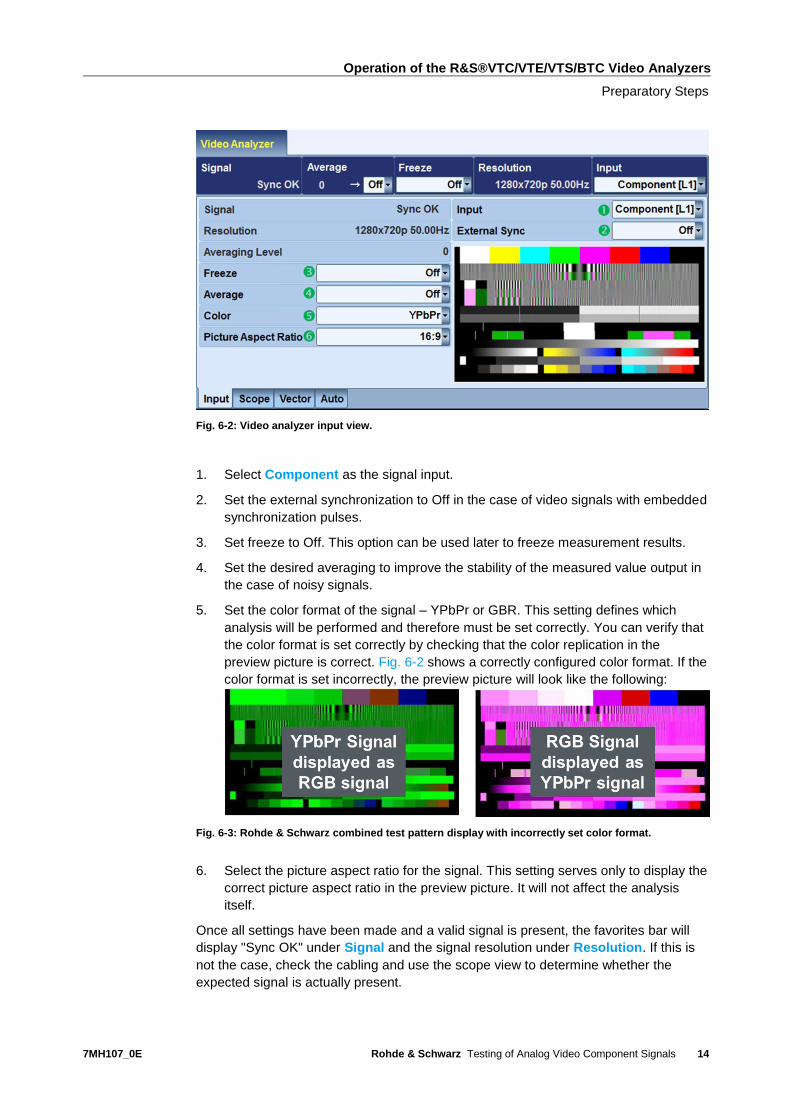
Fig. 6-2: Video analyzer input view.
1. Select Component as the signal input.
2. Set the external synchronization to Off in the case of video signals with embedded
synchronization pulses.
3. Set freeze to Off. This option can be used later to freeze measurement results.
4. Set the desired averaging to improve the stability of the measured value output in
the case of noisy signals.
5. Set the color format of the signal – YPbPr or GBR. This setting defines which
analysis will be performed and therefore must be set correctly. You can verify that
the color format is set correctly by checking that the color replication in the
preview picture is correct. Fig. 6-2 shows a correctly configured color format. If the
color format is set incorrectly, the preview picture will look like the following:
Fig. 6-3: Rohde & Schwarz combined test pattern display with incorrectly set color format.
6. Select the picture aspect ratio for the signal. This setting serves only to display the
correct picture aspect ratio in the preview picture. It will not affect the analysis
itself.
Once all settings have been made and a valid signal is present, the favorites bar will
display "Sync OK" under Signal and the signal resolution under Resolution. If this is
not the case, check the cabling and use the scope view to determine whether the
expected signal is actually present.
Operation of the R&S®VTC/VTE/VTS/BTC Video Analyzers
Configuring the Analyzer
7MH107_0E Rohde & Schwarz Testing of Analog Video Component Signals
15
Fig. 6-4: Display of the YPbPr standard color bar in the scope view.
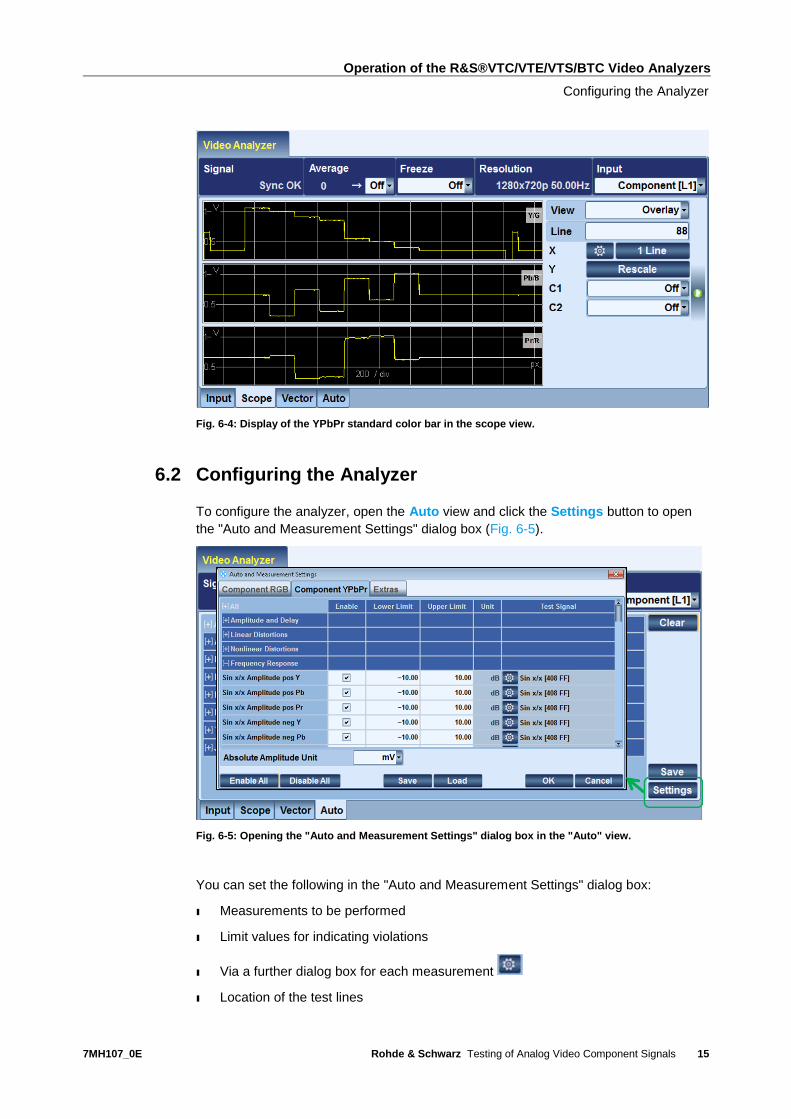
6.2 Configuring the Analyzer
To configure the analyzer, open the Auto view and click the Settings button to open
the "Auto and Measurement Settings" dialog box (Fig. 6-5).
Fig. 6-5: Opening the "Auto and Measurement Settings" dialog box in the "Auto" view.
You can set the following in the "Auto and Measurement Settings" dialog box:
ı Measurements to be performed
ı Limit values for indicating violations
ı Via a further dialog box for each measurement
ı Location of the test lines
Operation of the R&S®VTC/VTE/VTS/BTC Video Analyzers
Configuring the Analyzer
7MH107_0E Rohde & Schwarz Testing of Analog Video Component Signals
16
ı Type of test signal
ı Test locations within a test line
ı Options to save and load configurations
ı Option to define a separator character when saving test logs
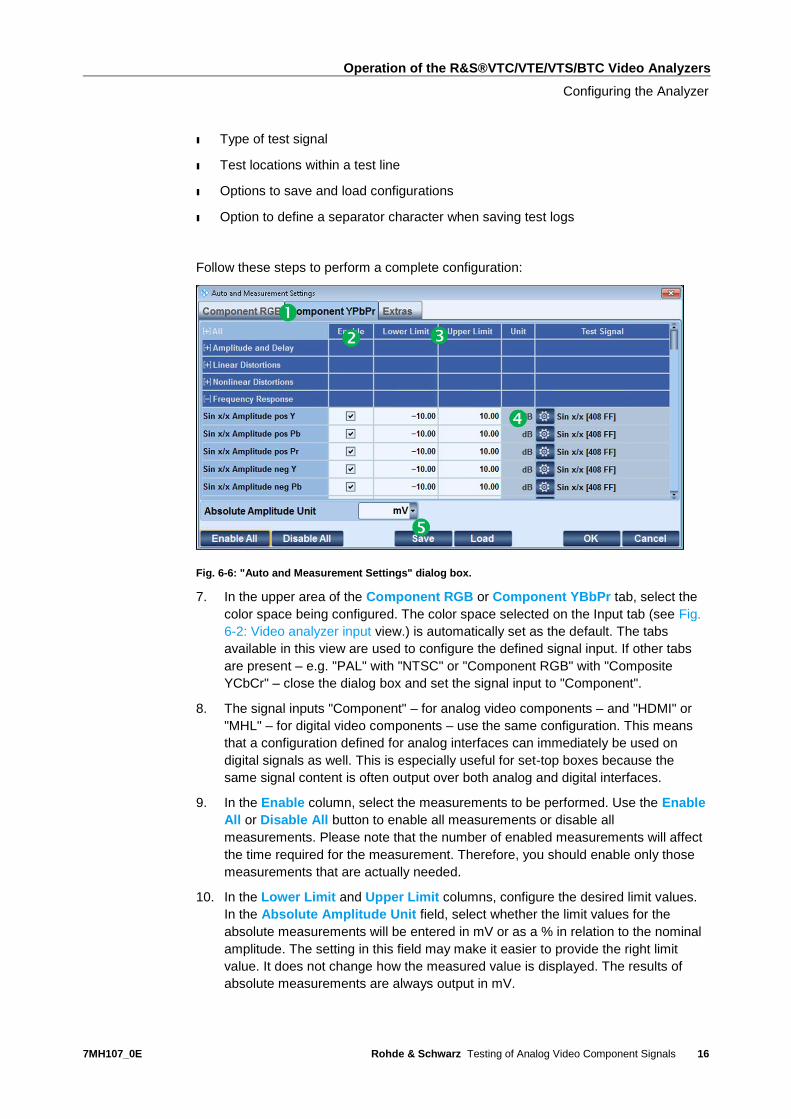
Follow these steps to perform a complete configuration:
Fig. 6-6: "Auto and Measurement Settings" dialog box.
7. In the upper area of the Component RGB or Component YBbPr tab, select the
color space being configured. The color space selected on the Input tab (see Fig.
6-2: Video analyzer input view.) is automatically set as the default. The tabs
available in this view are used to configure the defined signal input. If other tabs
are present – e.g. "PAL" with "NTSC" or "Component RGB" with "Composite
YCbCr" – close the dialog box and set the signal input to "Component".
8. The signal inputs "Component" – for analog video components – and "HDMI" or
"MHL" – for digital video components – use the same configuration. This means
that a configuration defined for analog interfaces can immediately be used on
digital signals as well. This is especially useful for set-top boxes because the
same signal content is often output over both analog and digital interfaces.
9. In the Enable column, select the measurements to be performed. Use the Enable
All or Disable All button to enable all measurements or disable all
measurements. Please note that the number of enabled measurements will affect
the time required for the measurement. Therefore, you should enable only those
measurements that are actually needed.
10. In the Lower Limit and Upper Limit columns, configure the desired limit values.
In the Absolute Amplitude Unit field, select whether the limit values for the
absolute measurements will be entered in mV or as a % in relation to the nominal
amplitude. The setting in this field may make it easier to provide the right limit
value. It does not change how the measured value is displayed. The results of
absolute measurements are always output in mV.
Operation of the R&S®VTC/VTE/VTS/BTC Video Analyzers
Configuring the Test Parameters
7MH107_0E Rohde & Schwarz Testing of Analog Video Component Signals
17
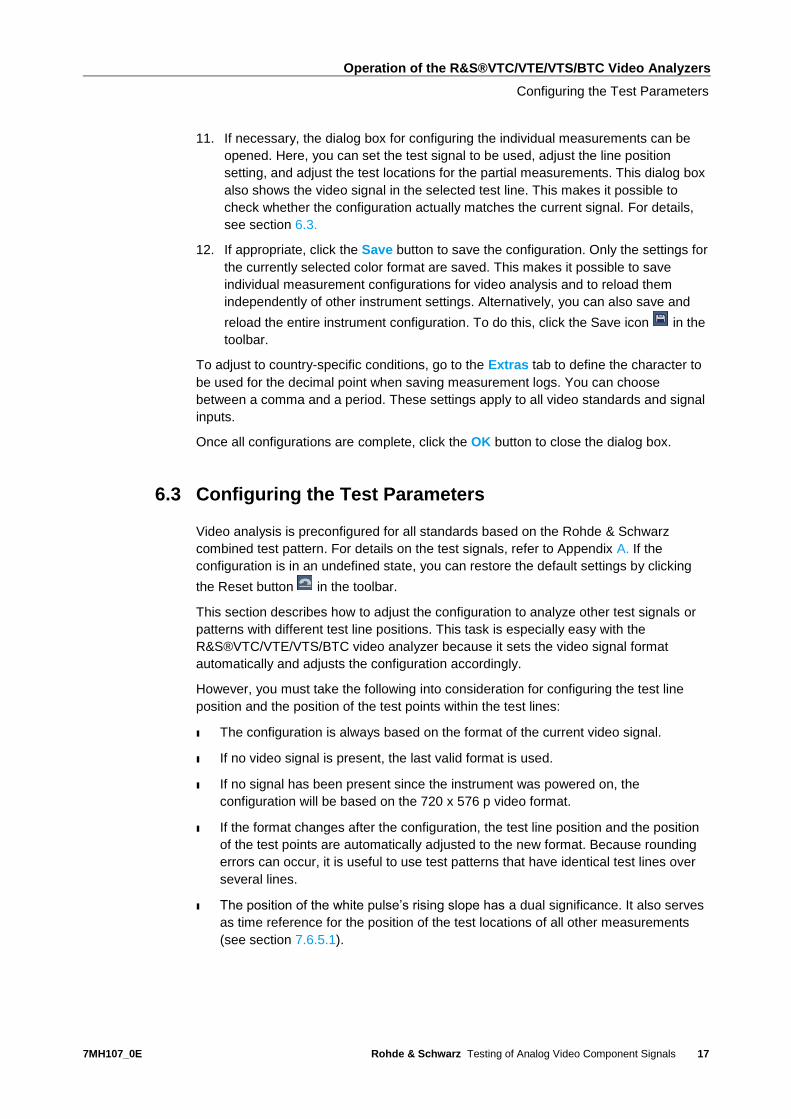
11. If necessary, the dialog box for configuring the individual measurements can be
opened. Here, you can set the test signal to be used, adjust the line position
setting, and adjust the test locations for the partial measurements. This dialog box
also shows the video signal in the selected test line. This makes it possible to
check whether the configuration actually matches the current signal. For details,
see section 6.3.
12. If appropriate, click the Save button to save the configuration. Only the settings for
the currently selected color format are saved. This makes it possible to save
individual measurement configurations for video analysis and to reload them
independently of other instrument settings. Alternatively, you can also save and
reload the entire instrument configuration. To do this, click the Save icon in the
toolbar.
To adjust to country-specific conditions, go to the Extras tab to define the character to
be used for the decimal point when saving measurement logs. You can choose
between a comma and a period. These settings apply to all video standards and signal
inputs.
Once all configurations are complete, click the OK button to close the dialog box.
6.3 Configuring the Test Parameters
Video analysis is preconfigured for all standards based on the Rohde & Schwarz
combined test pattern. For details on the test signals, refer to Appendix A. If the
configuration is in an undefined state, you can restore the default settings by clicking
the Reset button in the toolbar.
This section describes how to adjust the configuration to analyze other test signals or
patterns with different test line positions. This task is especially easy with the
R&S®VTC/VTE/VTS/BTC video analyzer because it sets the video signal format
automatically and adjusts the configuration accordingly.
However, you must take the following into consideration for configuring the test line
position and the position of the test points within the test lines:
ı The configuration is always based on the format of the current video signal.
ı If no video signal is present, the last valid format is used.
ı If no signal has been present since the instrument was powered on, the
configuration will be based on the 720 x 576 p video format.
ı If the format changes after the configuration, the test line position and the position
of the test points are automatically adjusted to the new format. Because rounding
errors can occur, it is useful to use test patterns that have identical test lines over
several lines.
ı The position of the white pulse’s rising slope has a dual significance. It also serves
as time reference for the position of the test locations of all other measurements
(see section 7.6.5.1).
Operation of the R&S®VTC/VTE/VTS/BTC Video Analyzers
Configuring the Test Parameters
7MH107_0E Rohde & Schwarz Testing of Analog Video Component Signals
18
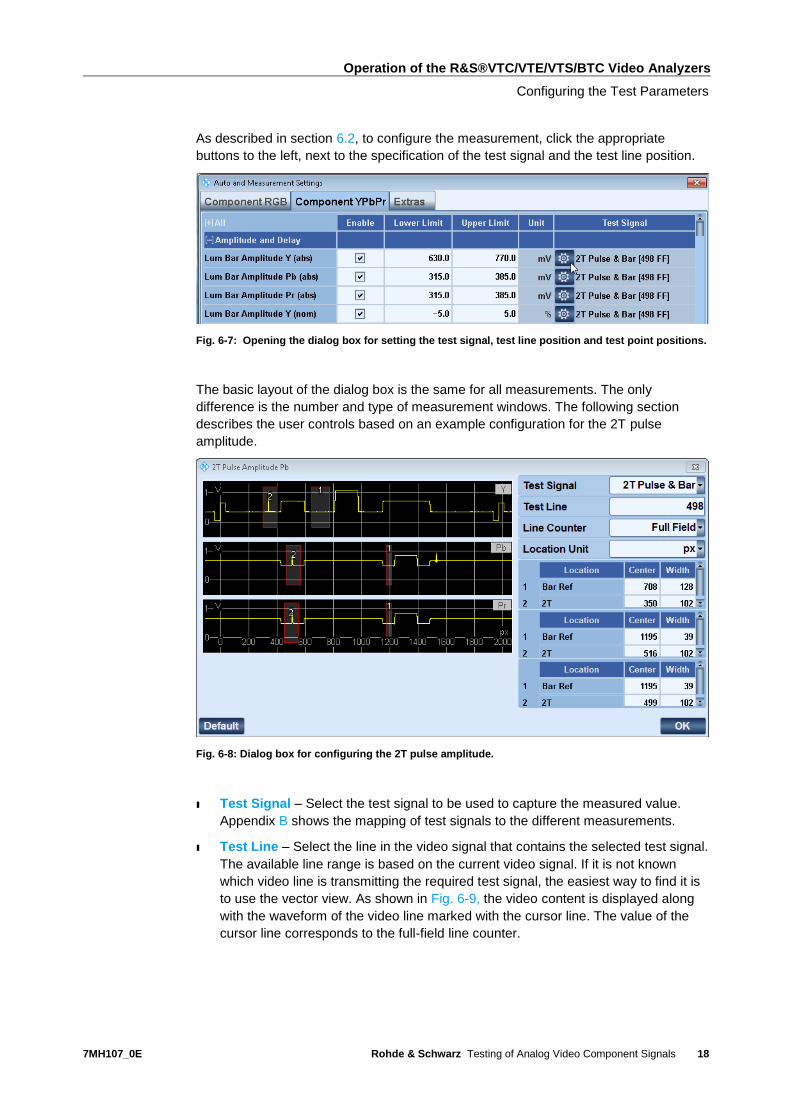
As described in section 6.2, to configure the measurement, click the appropriate
buttons to the left, next to the specification of the test signal and the test line position.
Fig. 6-7: Opening the dialog box for setting the test signal, test line position and test point positions.
The basic layout of the dialog box is the same for all measurements. The only
difference is the number and type of measurement windows. The following section
describes the user controls based on an example configuration for the 2T pulse
amplitude.
Fig. 6-8: Dialog box for configuring the 2T pulse amplitude.
ı Test Signal – Select the test signal to be used to capture the measured value.
Appendix B shows the mapping of test signals to the different measurements.
ı Test Line – Select the line in the video signal that contains the selected test signal.
The available line range is based on the current video signal. If it is not known
which video line is transmitting the required test signal, the easiest way to find it is
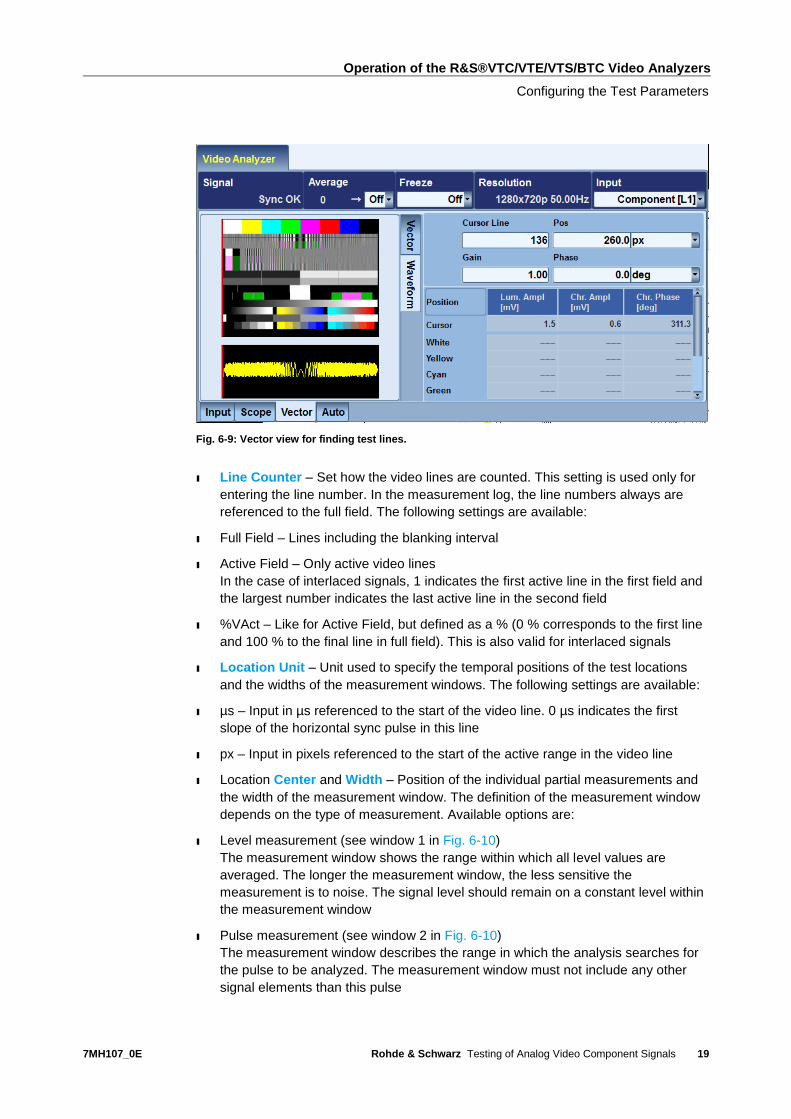
to use the vector view. As shown in Fig. 6-9, the video content is displayed along
with the waveform of the video line marked with the cursor line. The value of the
cursor line corresponds to the full-field line counter.
Operation of the R&S®VTC/VTE/VTS/BTC Video Analyzers
Configuring the Test Parameters
7MH107_0E Rohde & Schwarz Testing of Analog Video Component Signals
19
Fig. 6-9: Vector view for finding test lines.
ı Line Counter – Set how the video lines are counted. This setting is used only for
entering the line number. In the measurement log, the line numbers always are
referenced to the full field. The following settings are available:
ı Full Field – Lines including the blanking interval
ı Active Field – Only active video lines
In the case of interlaced signals, 1 indicates the first active line in the first field and
the largest number indicates the last active line in the second field
ı %VAct – Like for Active Field, but defined as a % (0 % corresponds to the first line
and 100 % to the final line in full field). This is also valid for interlaced signals
ı Location Unit – Unit used to specify the temporal positions of the test locations
and the widths of the measurement windows. The following settings are available:
ı µs – Input in µs referenced to the start of the video line. 0 µs indicates the first
slope of the horizontal sync pulse in this line
ı px – Input in pixels referenced to the start of the active range in the video line
ı Location Center and Width – Position of the individual partial measurements and
the width of the measurement window. The definition of the measurement window
depends on the type of measurement. Available options are:
ı Level measurement (see window 1 in Fig. 6-10)
The measurement window shows the range within which all level values are
averaged. The longer the measurement window, the less sensitive the
measurement is to noise. The signal level should remain on a constant level within
the measurement window
ı Pulse measurement (see window 2 in Fig. 6-10)
The measurement window describes the range in which the analysis searches for
the pulse to be analyzed. The measurement window must not include any other
signal elements than this pulse
Operation of the R&S®VTC/VTE/VTS/BTC Video Analyzers
Configuring the Test Parameters
7MH107_0E Rohde & Schwarz Testing of Analog Video Component Signals
20
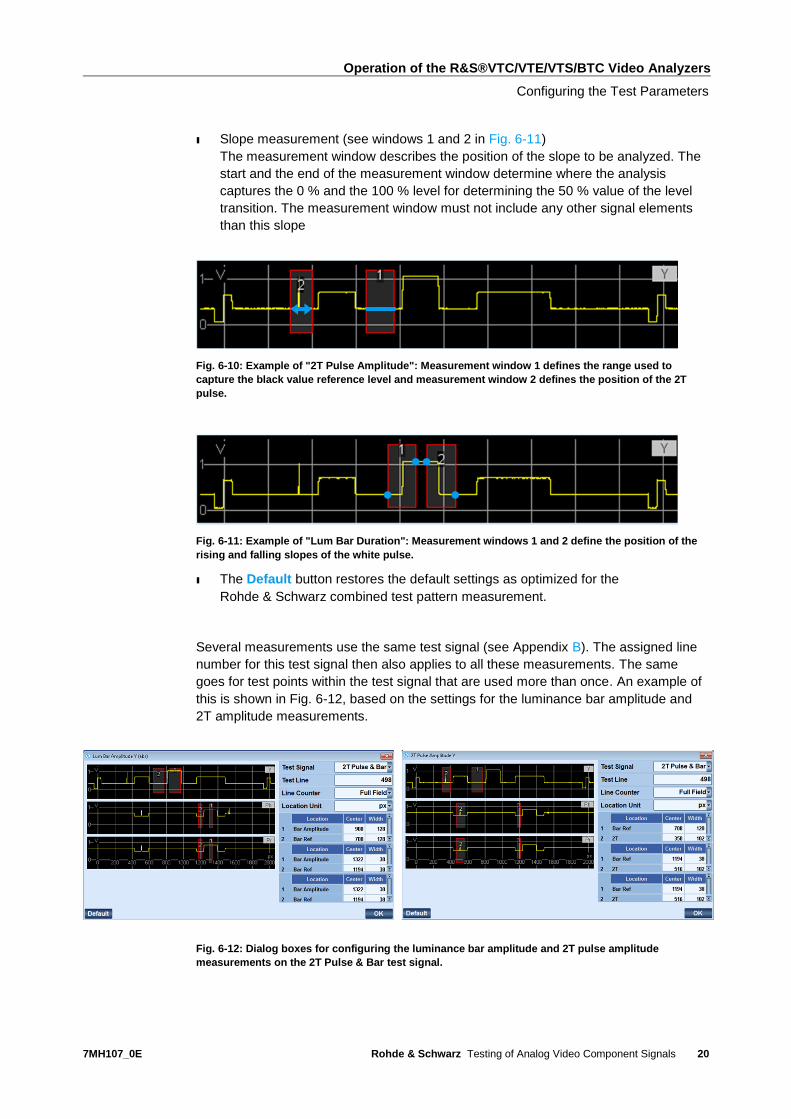
ı Slope measurement (see windows 1 and 2 in Fig. 6-11)
The measurement window describes the position of the slope to be analyzed. The
start and the end of the measurement window determine where the analysis
captures the 0 % and the 100 % level for determining the 50 % value of the level
transition. The measurement window must not include any other signal elements
than this slope
Fig. 6-10: Example of "2T Pulse Amplitude": Measurement window 1 defines the range used to
capture the black value reference level and measurement window 2 defines the position of the 2T
pulse.
Fig. 6-11: Example of "Lum Bar Duration": Measurement windows 1 and 2 define the position of the
rising and falling slopes of the white pulse.
ı The Default button restores the default settings as optimized for the
Rohde & Schwarz combined test pattern measurement.
Several measurements use the same test signal (see Appendix B). The assigned line
number for this test signal then also applies to all these measurements. The same
goes for test points within the test signal that are used more than once. An example of
this is shown in Fig. 6-12, based on the settings for the luminance bar amplitude and
2T amplitude measurements.
Fig. 6-12: Dialog boxes for configuring the luminance bar amplitude and 2T pulse amplitude
measurements on the 2T Pulse & Bar test signal.
Operation of the R&S®VTC/VTE/VTS/BTC Video Analyzers
Performing the Measurement
7MH107_0E Rohde & Schwarz Testing of Analog Video Component Signals
21
The settings shown in Fig. 6-12 are used to measure the "luminance bar amplitude"
and the "2T amplitude" on the 2T Pulse & Bar test signal. Both measurements use the
same settings for Test Line and Bar Ref. This means that a change in the settings for
one measurement will automatically be used for the other measurement. On the other
hand, the test position settings for Bar Amplitude and 2T are assigned to the specific
individual measurements and are used only there.
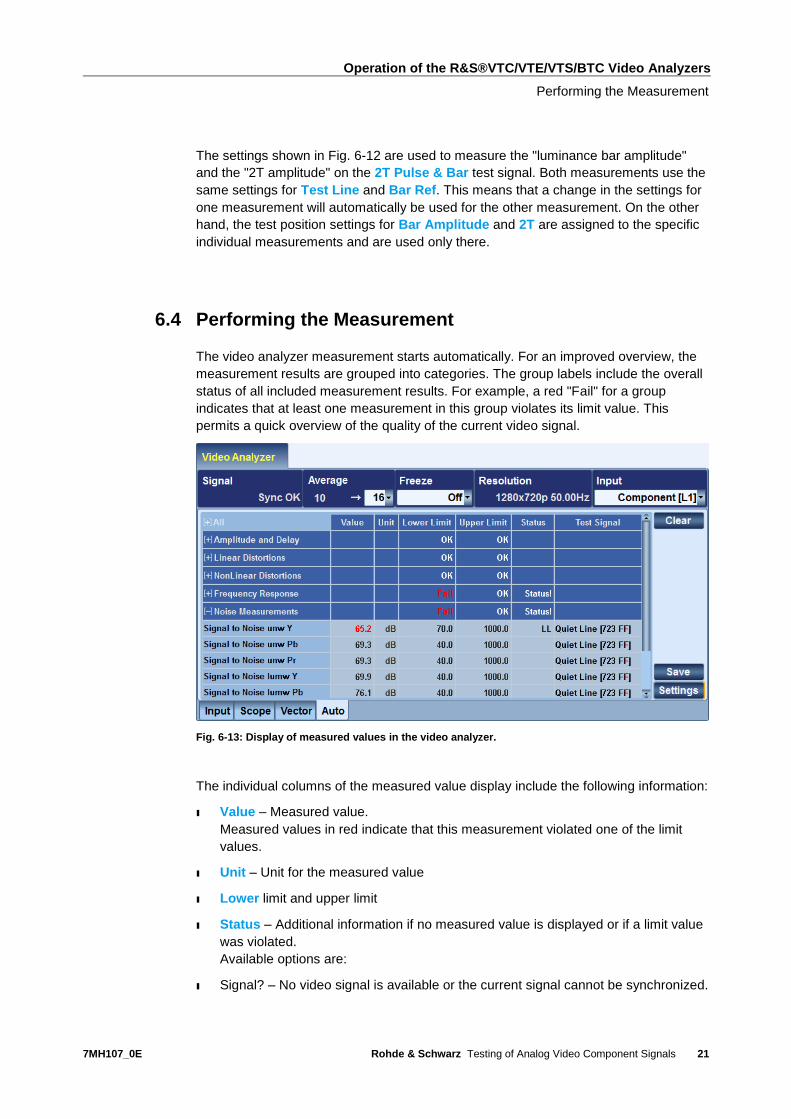
6.4 Performing the Measurement
The video analyzer measurement starts automatically. For an improved overview, the
measurement results are grouped into categories. The group labels include the overall
status of all included measurement results. For example, a red "Fail" for a group
indicates that at least one measurement in this group violates its limit value. This
permits a quick overview of the quality of the current video signal.
Fig. 6-13: Display of measured values in the video analyzer.
The individual columns of the measured value display include the following information:
ı Value – Measured value.
Measured values in red indicate that this measurement violated one of the limit
values.
ı Unit – Unit for the measured value
ı Lower limit and upper limit
ı Status – Additional information if no measured value is displayed or if a limit value
was violated.
Available options are:
ı Signal? – No video signal is available or the current signal cannot be synchronized.
Operation of the R&S®VTC/VTE/VTS/BTC Video Analyzers
Performing the Measurement
7MH107_0E Rohde & Schwarz Testing of Analog Video Component Signals
22
ı Wait – Measurement not yet complete
ı Test Signal? – The test signal in the test line does not match the measurement.
ı LL – The lower limit value was violated
ı UL – The upper limit value was violated
ı Test Signal – Test signal and line to be measured.
The line number is always specified in reference to the full field video signal.
To control the measurement, the following user controls are available:
Average is used to define the number of averaged measured values. This permits
stable and reproducible measurement results even for noisy signals. The Clear button
is used to clear all previous measurements. The Save button is used to open a dialog
box for saving the measured results in csv (comma-separated values) format.
The Settings button opens a dialog box to configure the video analysis (see section
6.2).
An example of a typical measurement log is provided in Appendix C .
Automated Measurements
Amplitude and Delay
7MH107_0E Rohde & Schwarz Testing of Analog Video Component Signals
23
7 Automated Measurements
Automated measurements for video component signals can be categorized as follows:
ı Amplitude and delay
ı Linear distortions
ı Nonlinear distortions
ı Frequency response
ı Noise
ı Timing
ı Jitter
This section describes the individual measurements. It includes a definition of the
measurements, the effects of any deviations and a description of the required test
signals.
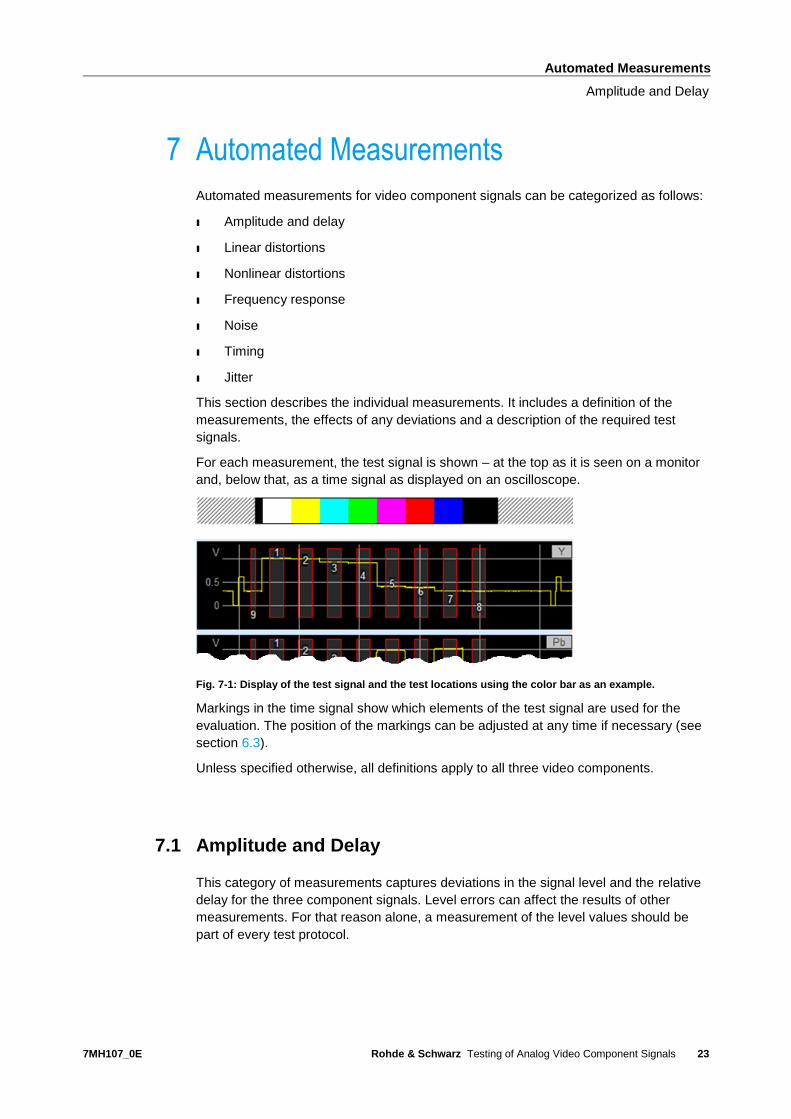
For each measurement, the test signal is shown – at the top as it is seen on a monitor
and, below that, as a time signal as displayed on an oscilloscope.
Fig. 7-1: Display of the test signal and the test locations using the color bar as an example.
Markings in the time signal show which elements of the test signal are used for the
evaluation. The position of the markings can be adjusted at any time if necessary (see
section 6.3).
Unless specified otherwise, all definitions apply to all three video components.
7.1 Amplitude and Delay
This category of measurements captures deviations in the signal level and the relative
delay for the three component signals. Level errors can affect the results of other
measurements. For that reason alone, a measurement of the level values should be
part of every test protocol.
Automated Measurements
Amplitude and Delay
7MH107_0E Rohde & Schwarz Testing of Analog Video Component Signals
24
7.1.1 Luminance Bar Amplitude
7.1.1.1 Definition
The Luminance Bar Amplitude specifies the largest signal amplitude in the visible
picture. If it is too small, the picture will be too dark and the dynamic range will not be
fully utilized. If it is too large, the danger of overdrive exists.
The measured value is calculated from the delta between the level in the white range
and the level in the black range. The result is expressed as a % referenced to a
nominal value of 700 mV or as an absolute value in mV.
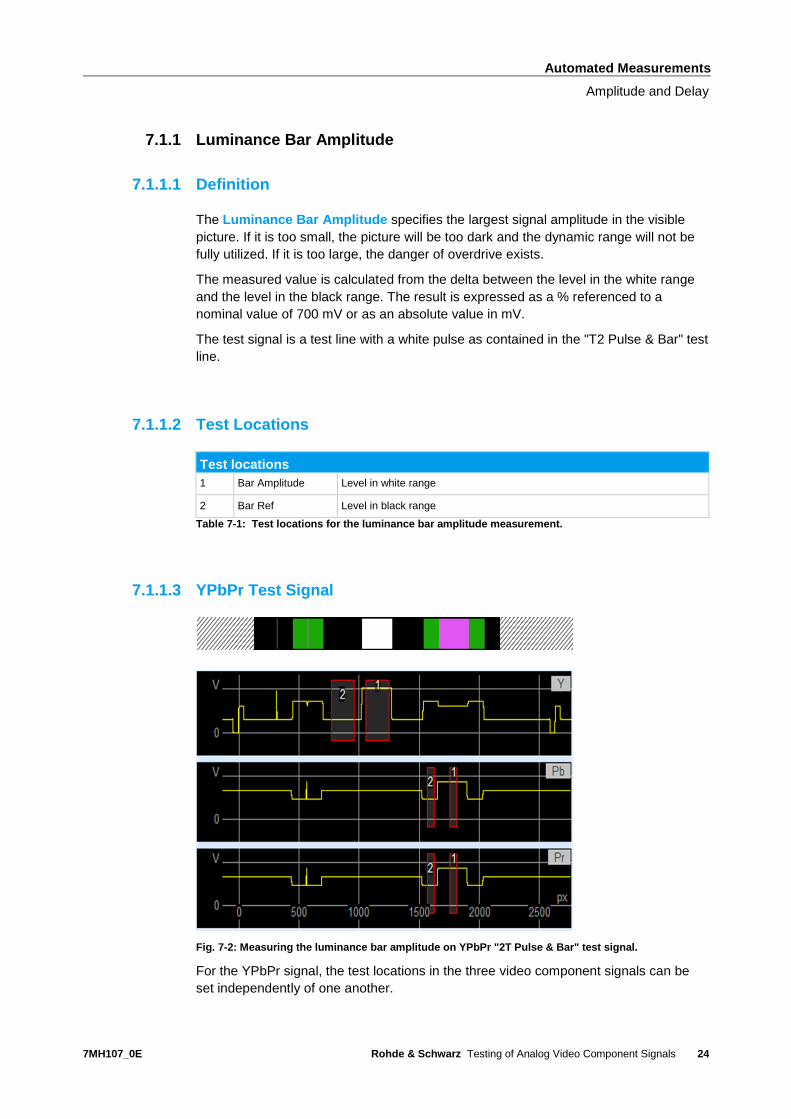
The test signal is a test line with a white pulse as contained in the "T2 Pulse & Bar" test
line.
7.1.1.2 Test Locations
Test locations
1 Bar Amplitude Level in white range
2 Bar Ref Level in black range
Table 7-1: Test locations for the luminance bar amplitude measurement.
7.1.1.3 YPbPr Test Signal
Fig. 7-2: Measuring the luminance bar amplitude on YPbPr "2T Pulse & Bar" test signal.
For the YPbPr signal, the test locations in the three video component signals can be
set independently of one another.
Automated Measurements
Amplitude and Delay
7MH107_0E Rohde & Schwarz Testing of Analog Video Component Signals
25
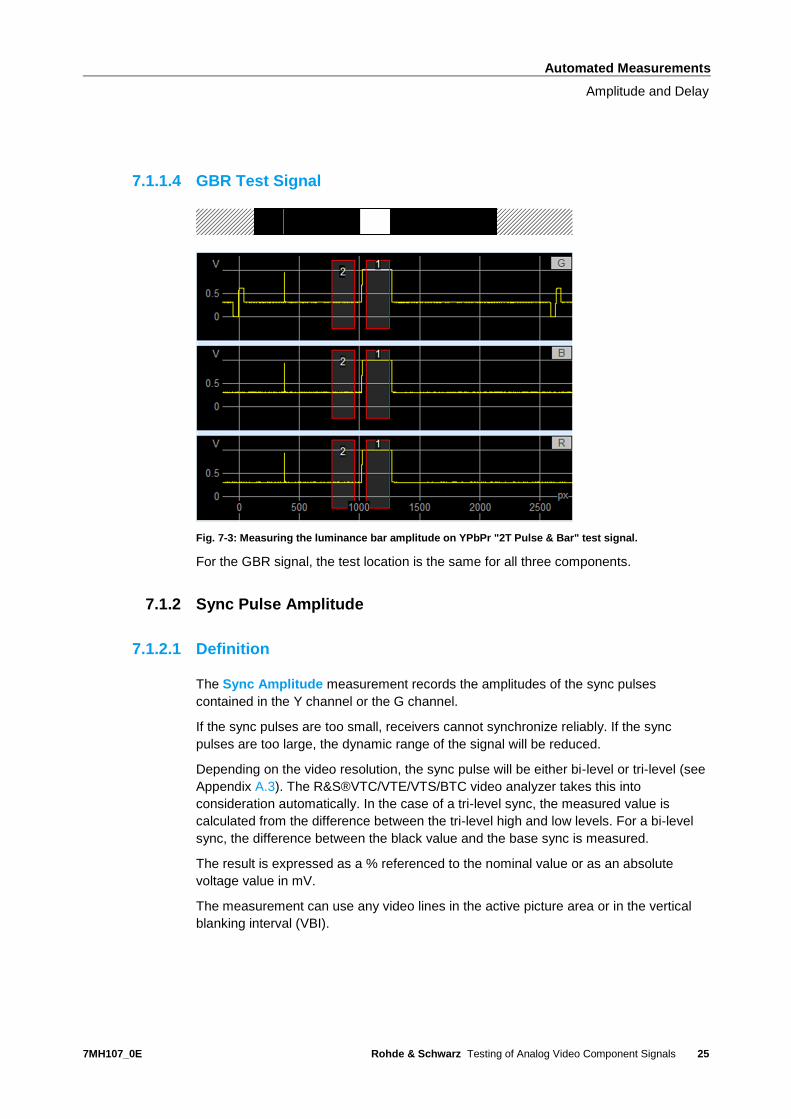
7.1.1.4 GBR Test Signal
Fig. 7-3: Measuring the luminance bar amplitude on YPbPr "2T Pulse & Bar" test signal.
For the GBR signal, the test location is the same for all three components.
7.1.2 Sync Pulse Amplitude
7.1.2.1 Definition
The Sync Amplitude measurement records the amplitudes of the sync pulses
contained in the Y channel or the G channel.
If the sync pulses are too small, receivers cannot synchronize reliably. If the sync
pulses are too large, the dynamic range of the signal will be reduced.
Depending on the video resolution, the sync pulse will be either bi-level or tri-level (see
Appendix A.3). The R&S®VTC/VTE/VTS/BTC video analyzer takes this into
consideration automatically. In the case of a tri-level sync, the measured value is
calculated from the difference between the tri-level high and low levels. For a bi-level
sync, the difference between the black value and the base sync is measured.
The result is expressed as a % referenced to the nominal value or as an absolute
voltage value in mV.
The measurement can use any video lines in the active picture area or in the vertical
blanking interval (VBI).
Automated Measurements
Amplitude and Delay
7MH107_0E Rohde & Schwarz Testing of Analog Video Component Signals
26
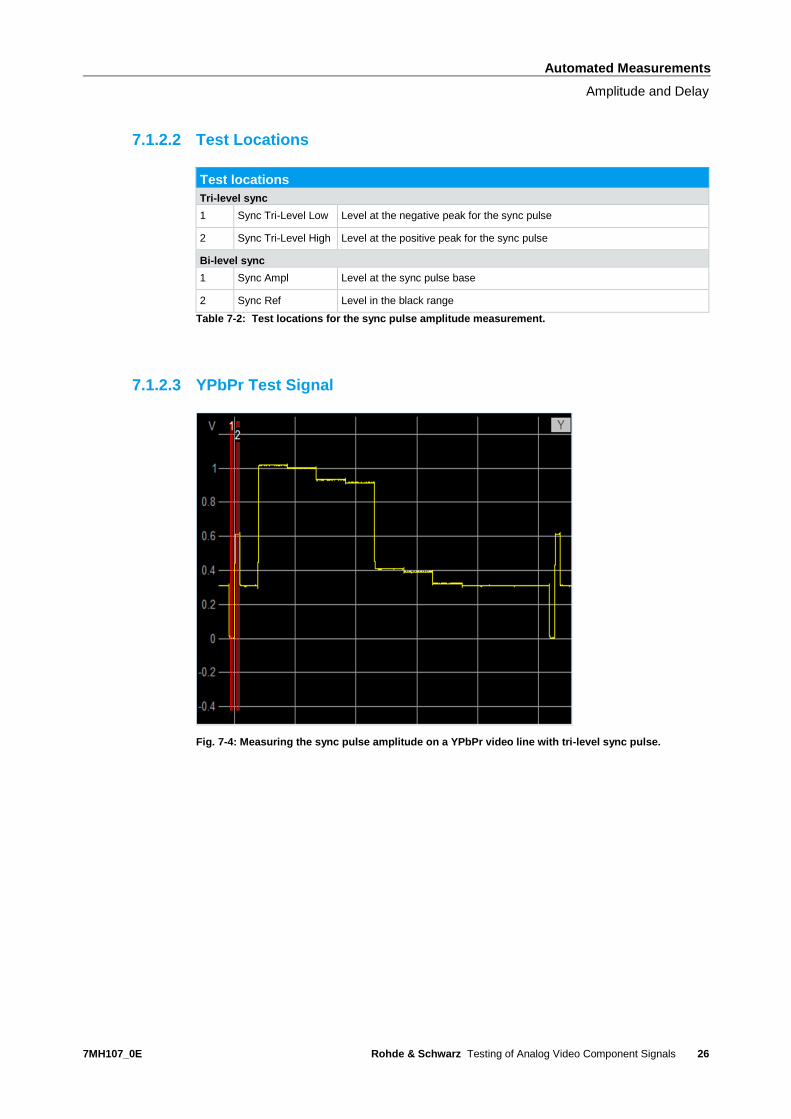
7.1.2.2 Test Locations
Test locations
Tri-level sync
1 Sync Tri-Level Low Level at the negative peak for the sync pulse
2 Sync Tri-Level High Level at the positive peak for the sync pulse
Bi-level sync
1 Sync Ampl Level at the sync pulse base
2 Sync Ref Level in the black range
Table 7-2: Test locations for the sync pulse amplitude measurement.
7.1.2.3 YPbPr Test Signal
Fig. 7-4: Measuring the sync pulse amplitude on a YPbPr video line with tri-level sync pulse.
Automated Measurements
Amplitude and Delay
7MH107_0E Rohde & Schwarz Testing of Analog Video Component Signals
27
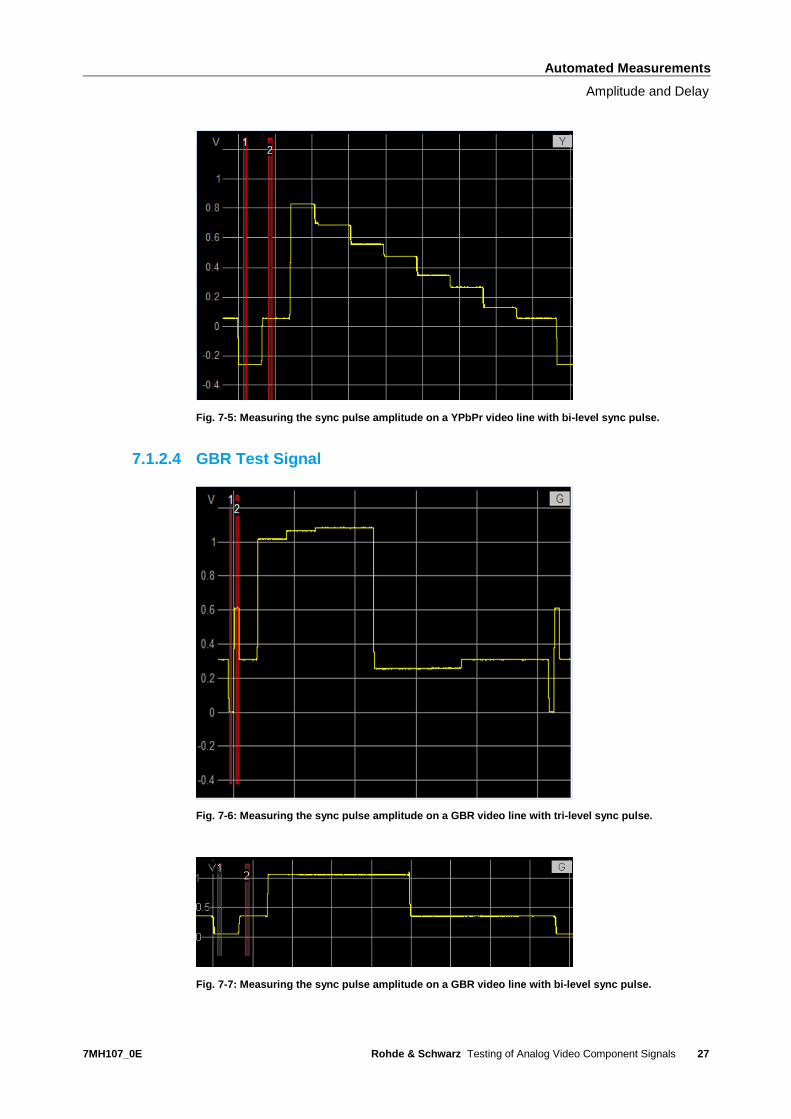
Fig. 7-5: Measuring the sync pulse amplitude on a YPbPr video line with bi-level sync pulse.
7.1.2.4 GBR Test Signal
Fig. 7-6: Measuring the sync pulse amplitude on a GBR video line with tri-level sync pulse.
Fig. 7-7: Measuring the sync pulse amplitude on a GBR video line with bi-level sync pulse.
Automated Measurements
Amplitude and Delay
7MH107_0E Rohde & Schwarz Testing of Analog Video Component Signals
28
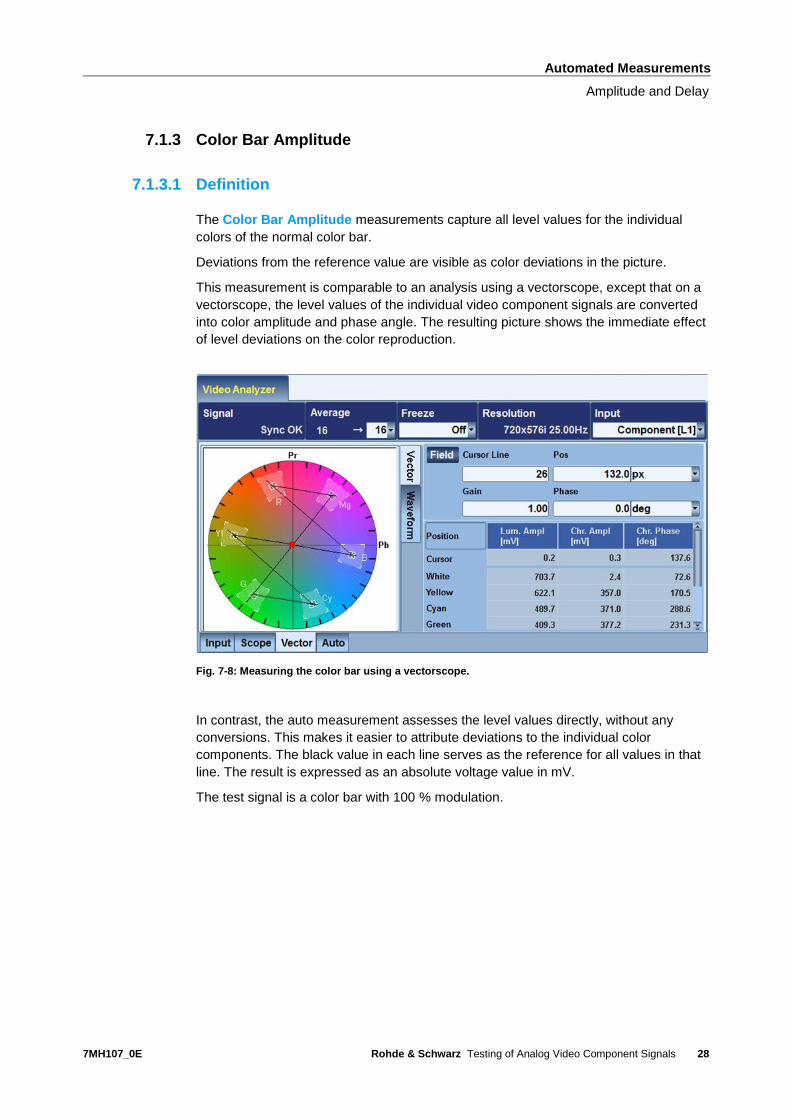
7.1.3 Color Bar Amplitude
7.1.3.1 Definition
The Color Bar Amplitude measurements capture all level values for the individual
colors of the normal color bar.
Deviations from the reference value are visible as color deviations in the picture.
This measurement is comparable to an analysis using a vectorscope, except that on a
vectorscope, the level values of the individual video component signals are converted
into color amplitude and phase angle. The resulting picture shows the immediate effect
of level deviations on the color reproduction.
Fig. 7-8: Measuring the color bar using a vectorscope.
In contrast, the auto measurement assesses the level values directly, without any
conversions. This makes it easier to attribute deviations to the individual color
components. The black value in each line serves as the reference for all values in that
line. The result is expressed as an absolute voltage value in mV.
The test signal is a color bar with 100 % modulation.
Automated Measurements
Amplitude and Delay
7MH107_0E Rohde & Schwarz Testing of Analog Video Component Signals
29
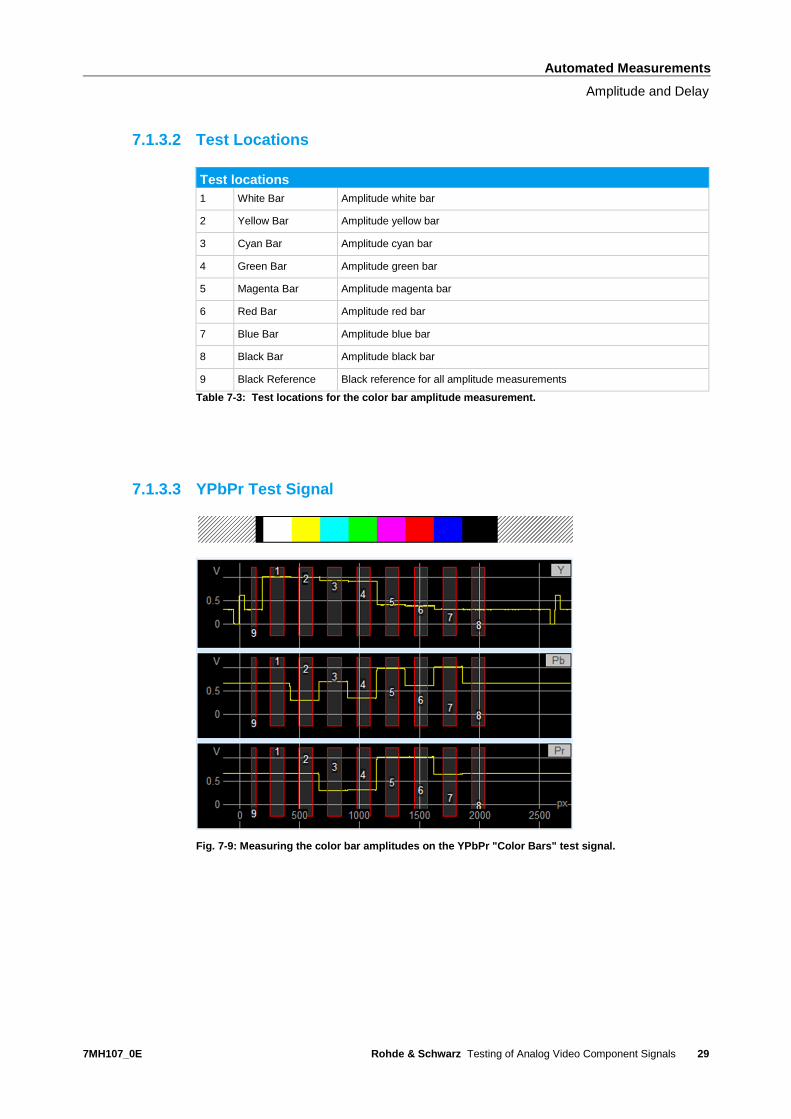
7.1.3.2 Test Locations
Test locations
1 White Bar Amplitude white bar
2 Yellow Bar Amplitude yellow bar
3 Cyan Bar Amplitude cyan bar
4 Green Bar Amplitude green bar
5 Magenta Bar Amplitude magenta bar
6 Red Bar Amplitude red bar
7 Blue Bar Amplitude blue bar
8 Black Bar Amplitude black bar
9 Black Reference Black reference for all amplitude measurements
Table 7-3: Test locations for the color bar amplitude measurement.
7.1.3.3 YPbPr Test Signal
Fig. 7-9: Measuring the color bar amplitudes on the YPbPr "Color Bars" test signal.
Automated Measurements
Amplitude and Delay
7MH107_0E Rohde & Schwarz Testing of Analog Video Component Signals
30
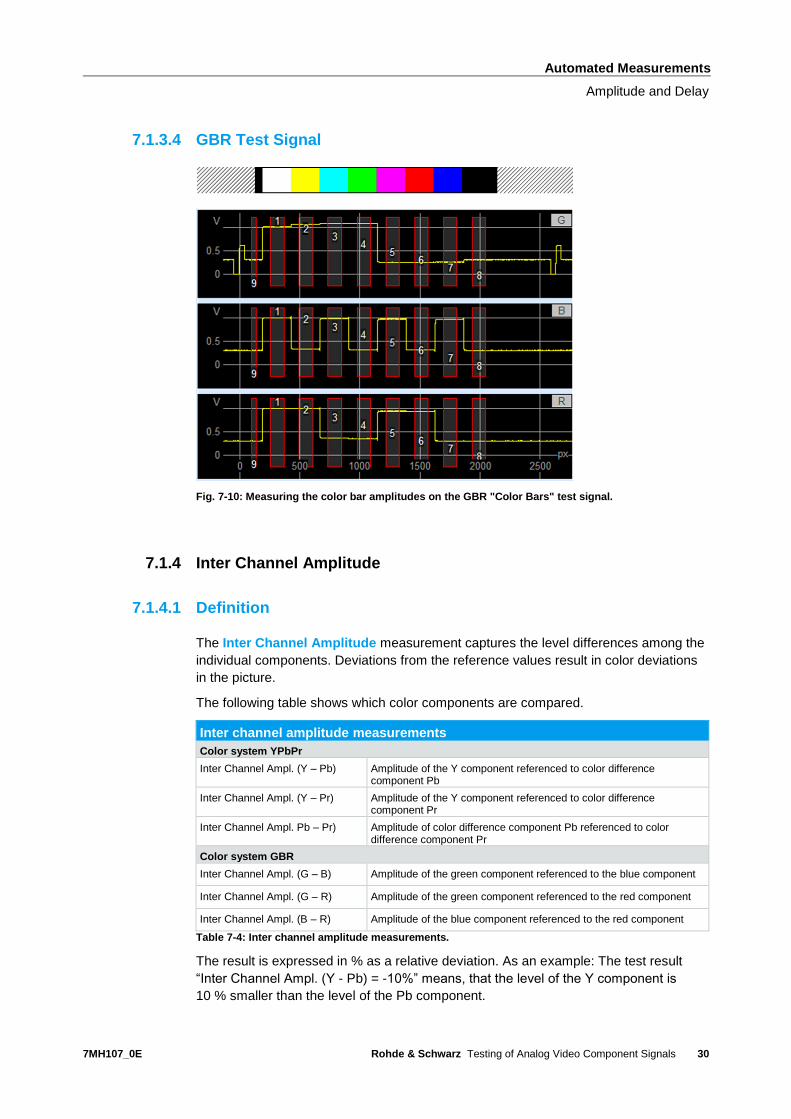
7.1.3.4 GBR Test Signal
Fig. 7-10: Measuring the color bar amplitudes on the GBR "Color Bars" test signal.
7.1.4 Inter Channel Amplitude
7.1.4.1 Definition
The Inter Channel Amplitude measurement captures the level differences among the
individual components. Deviations from the reference values result in color deviations
in the picture.
The following table shows which color components are compared.
Inter channel amplitude measurements
Color system YPbPr
Inter Channel Ampl. (Y – Pb) Amplitude of the Y component referenced to color difference component Pb
Inter Channel Ampl. (Y – Pr) Amplitude of the Y component referenced to color difference component Pr
Inter Channel Ampl. Pb – Pr) Amplitude of color difference component Pb referenced to color difference component Pr
Color system GBR
Inter Channel Ampl. (G – B) Amplitude of the green component referenced to the blue component
Inter Channel Ampl. (G – R) Amplitude of the green component referenced to the red component
Inter Channel Ampl. (B – R) Amplitude of the blue component referenced to the red component
Table 7-4: Inter channel amplitude measurements.
The result is expressed in % as a relative deviation. As an example: The test result
“Inter Channel Ampl. (Y - Pb) = -10%” means, that the level of the Y component is
10 % smaller than the level of the Pb component.
Automated Measurements
Amplitude and Delay
7MH107_0E Rohde & Schwarz Testing of Analog Video Component Signals
31
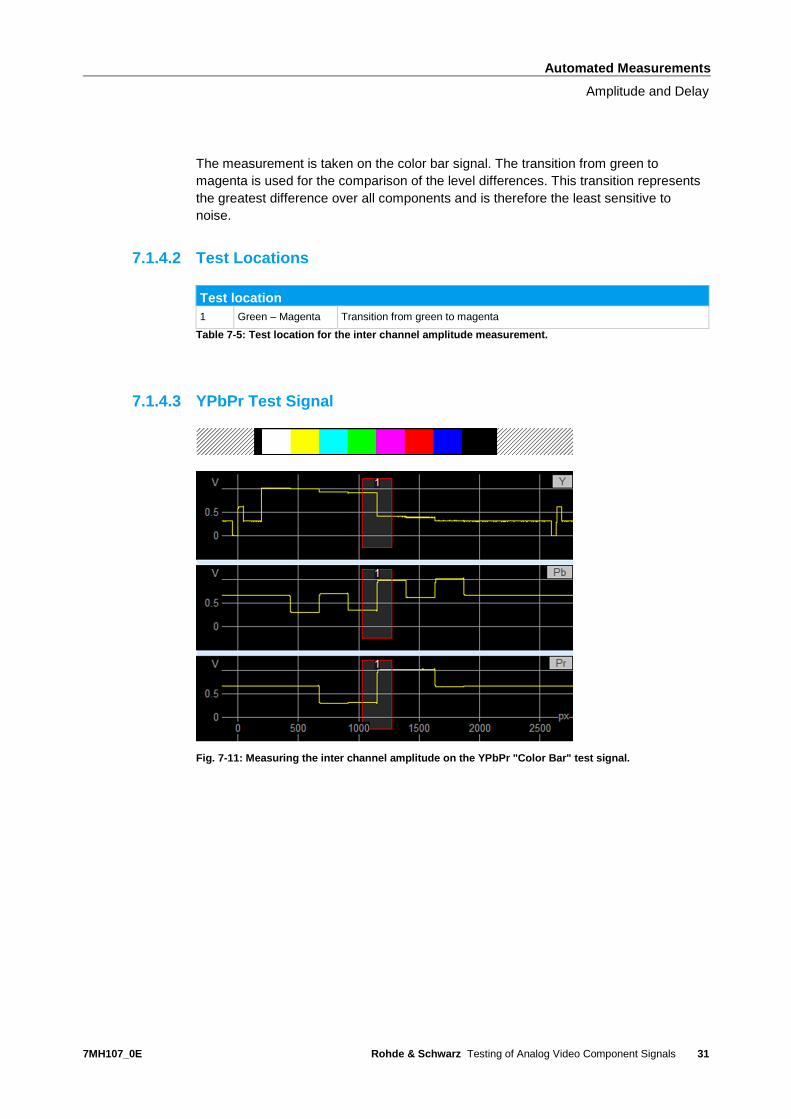
The measurement is taken on the color bar signal. The transition from green to
magenta is used for the comparison of the level differences. This transition represents
the greatest difference over all components and is therefore the least sensitive to
noise.
7.1.4.2 Test Locations
Test location
1 Green – Magenta Transition from green to magenta
Table 7-5: Test location for the inter channel amplitude measurement.
7.1.4.3 YPbPr Test Signal
Fig. 7-11: Measuring the inter channel amplitude on the YPbPr "Color Bar" test signal.
Automated Measurements
Amplitude and Delay
7MH107_0E Rohde & Schwarz Testing of Analog Video Component Signals
32
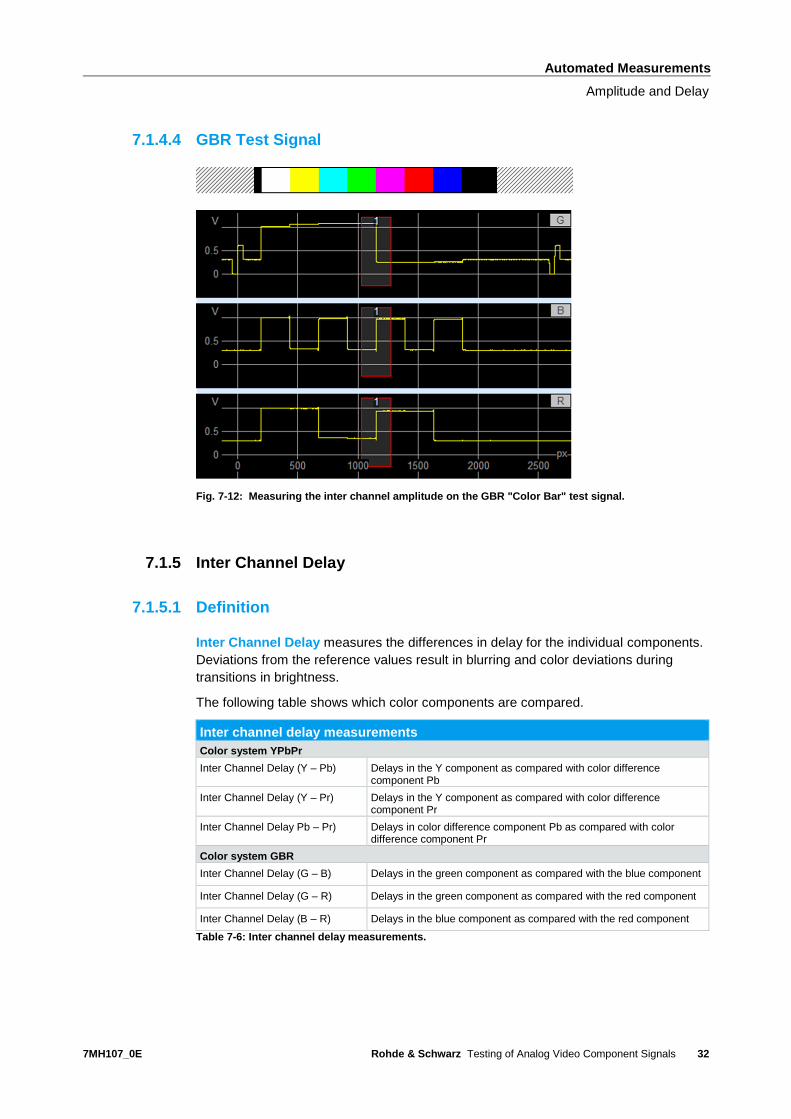
7.1.4.4 GBR Test Signal
Fig. 7-12: Measuring the inter channel amplitude on the GBR "Color Bar" test signal.
7.1.5 Inter Channel Delay
7.1.5.1 Definition
Inter Channel Delay measures the differences in delay for the individual components.
Deviations from the reference values result in blurring and color deviations during
transitions in brightness.
The following table shows which color components are compared.
Inter channel delay measurements
Color system YPbPr
Inter Channel Delay (Y – Pb) Delays in the Y component as compared with color difference component Pb
Inter Channel Delay (Y – Pr) Delays in the Y component as compared with color difference component Pr
Inter Channel Delay Pb – Pr) Delays in color difference component Pb as compared with color difference component Pr
Color system GBR
Inter Channel Delay (G – B) Delays in the green component as compared with the blue component
Inter Channel Delay (G – R) Delays in the green component as compared with the red component
Inter Channel Delay (B – R) Delays in the blue component as compared with the red component
Table 7-6: Inter channel delay measurements.
Automated Measurements
Linear Distortions
7MH107_0E Rohde & Schwarz Testing of Analog Video Component Signals
33
The delay to each reference component is specified in ns. As an example: The test
result “Inter Channel Delay (Y - Pb) = -100 ns” shows that the Y component is 100 ns
ahead of the Pb component.
The measurement is taken on the color bar signal at the level transitions from green to
magenta. They represent the greatest difference over all components and are
therefore the least sensitive to noise.
7.1.5.2 Test Locations
Test location
1 Green – Magenta Transition from green to magenta
Table 7-7: Test location for the inter channel delay measurement.
7.1.5.3 YPbPr Test Signal
The test signal and settings are identical to that for the inter channel amplitude
measurement.
See: Fig. 7-11.
7.1.5.4 GBR Test Signal
The test signal and settings are identical to that for the inter channel amplitude
measurement.
See: Fig. 7-12
7.2 Linear Distortions
Linear distortions result from deviations in the amplitude and/or phase frequency
response.
In contrast to the direct measurement of the frequency response using a multiburst or
SINX/X, the following measurements indicate how linear distortions affect the individual
signal elements, and thus their visibility.
7.2.1 2T Pulse Measurements
7.2.1.1 Definition
The 2T pulse is formed so that it optimally utilizes the transition range of the video
signal. As a result, linear distortions directly affect the signal waveform.
All 2T measurements are taken on a 2T pulse as defined in the "T2 Pulse & Bar" test
line.
Automated Measurements
Linear Distortions
7MH107_0E Rohde & Schwarz Testing of Analog Video Component Signals
34
The 2T Pulse Amplitude measurement captures the percentage of deviation of the 2T
amplitude peak as compared with the level of the white pulse. Negative deviations
indicate a reduced visibility of fine picture details.
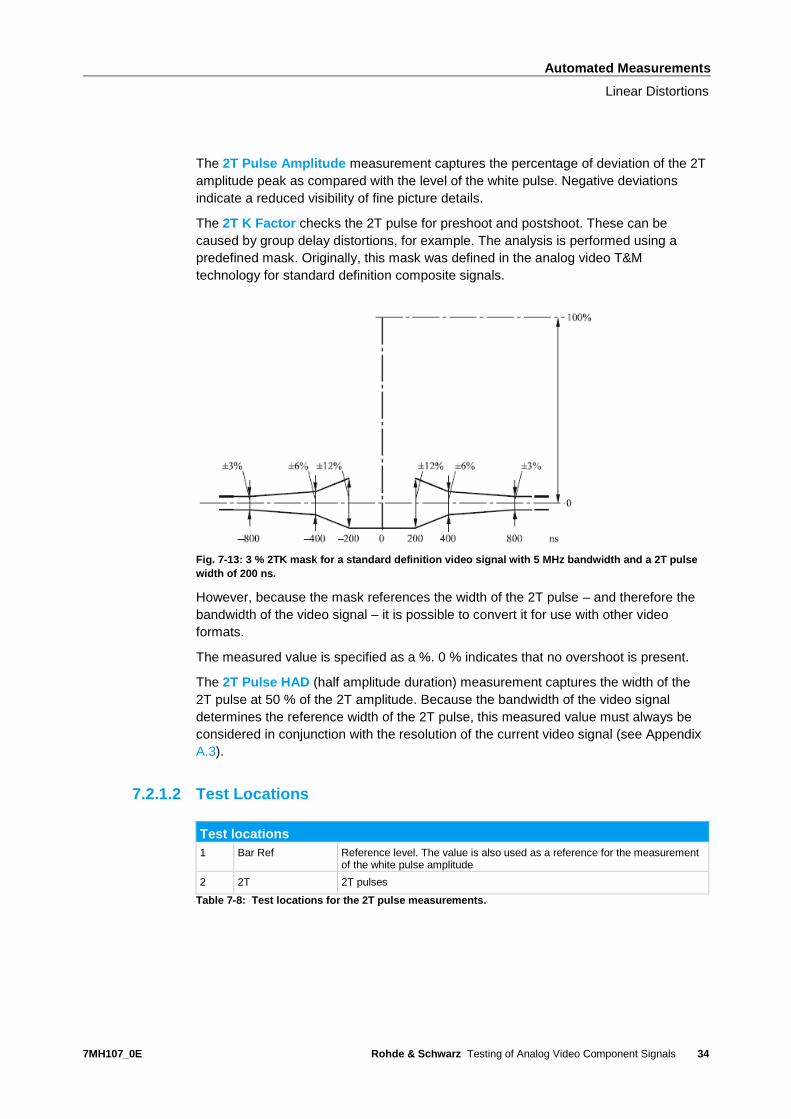
The 2T K Factor checks the 2T pulse for preshoot and postshoot. These can be
caused by group delay distortions, for example. The analysis is performed using a
predefined mask. Originally, this mask was defined in the analog video T&M
technology for standard definition composite signals.
Fig. 7-13: 3 % 2TK mask for a standard definition video signal with 5 MHz bandwidth and a 2T pulse
width of 200 ns.
However, because the mask references the width of the 2T pulse – and therefore the
bandwidth of the video signal – it is possible to convert it for use with other video
formats.
The measured value is specified as a %. 0 % indicates that no overshoot is present.
The 2T Pulse HAD (half amplitude duration) measurement captures the width of the
2T pulse at 50 % of the 2T amplitude. Because the bandwidth of the video signal
determines the reference width of the 2T pulse, this measured value must always be
considered in conjunction with the resolution of the current video signal (see Appendix
A.3).
7.2.1.2 Test Locations
Test locations
1 Bar Ref Reference level. The value is also used as a reference for the measurement of the white pulse amplitude
2 2T 2T pulses
Table 7-8: Test locations for the 2T pulse measurements.
Automated Measurements
Linear Distortions
7MH107_0E Rohde & Schwarz Testing of Analog Video Component Signals
35
7.2.1.3 YPbPr Test Signal
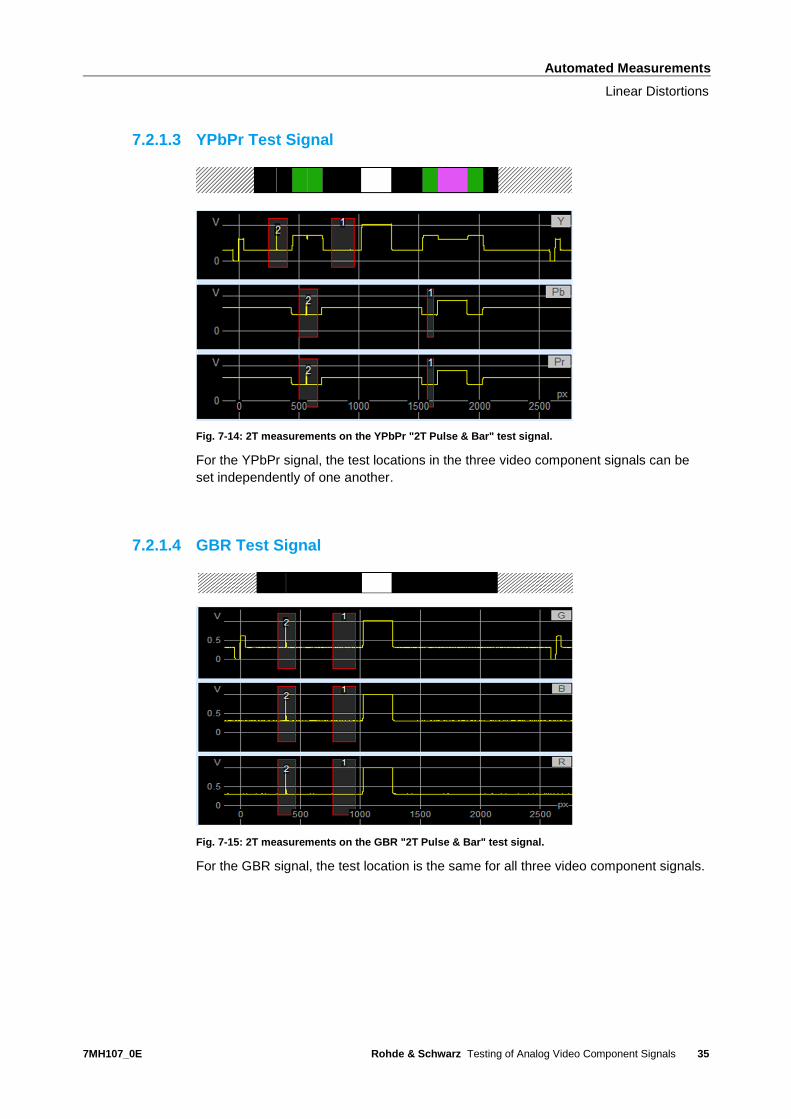
Fig. 7-14: 2T measurements on the YPbPr "2T Pulse & Bar" test signal.
For the YPbPr signal, the test locations in the three video component signals can be
set independently of one another.
7.2.1.4 GBR Test Signal
Fig. 7-15: 2T measurements on the GBR "2T Pulse & Bar" test signal.
For the GBR signal, the test location is the same for all three video component signals.
Automated Measurements
Linear Distortions
7MH107_0E Rohde & Schwarz Testing of Analog Video Component Signals
36
7.2.2 Short Time Distortion
7.2.2.1 Definition
The short time distortion measurement analyzes black-white and white-black
transitions. Like for the 2T pulse, the transitions are adapted exactly to the
transmission bandwidth of the video signal, and any linear distortions cause deviations
in the prescribed signal path. Depending on the type of interference, the picture might
be overdrawn or blurred at the level transitions. Color deviations can also occur.
The measurement is taken at the rising and falling slopes of the white pulse as
described in the "T2 Pulse & Bar" test line.
The ST Distortion Rise Time and ST Distortion Fall Time measurements assess the
rise and fall times for a white pulse. The nominal value is determined from the signal
bandwidth (see Appendix A.3). If the rise times are too short, this indicates an increase
in the level frequency response, and rise times that are too long indicate a reduction in
the level frequency response. The time is measured in ns.
The ST Dist Rise Preshoot and ST Dist Fall Preshoot measurements capture the
preshoots at the start of the level transitions.
The ST Dist Rise Overshoot and ST Dist Fall Overshoot measurements capture the
overshoots at the end of the level transitions.
The measured values are expressed as a % referenced to the value of the white pulse.
7.2.2.2 Test Locations
Test locations
1 Rising Slope Location of the transition from black to white
2 Falling Slope Location of the transition from white to black
Table 7-9: Locations for the short time distortion measurements.
Automated Measurements
Linear Distortions
7MH107_0E Rohde & Schwarz Testing of Analog Video Component Signals
37
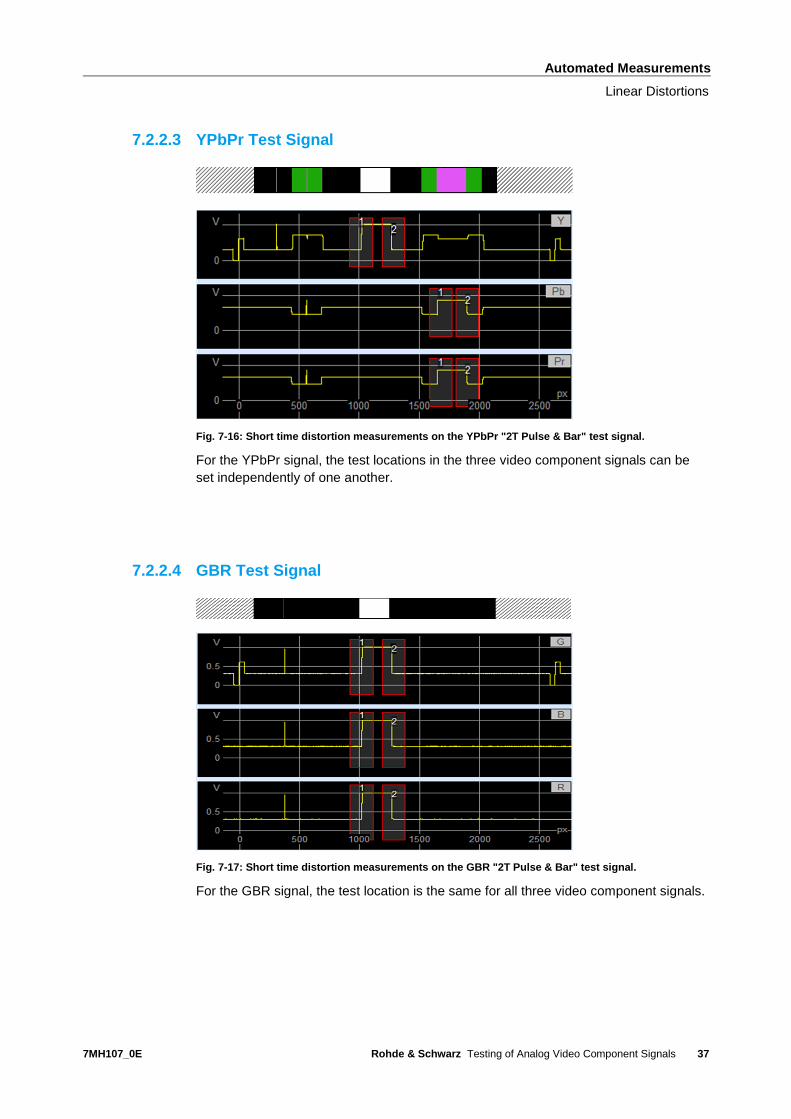
7.2.2.3 YPbPr Test Signal
Fig. 7-16: Short time distortion measurements on the YPbPr "2T Pulse & Bar" test signal.
For the YPbPr signal, the test locations in the three video component signals can be
set independently of one another.
7.2.2.4 GBR Test Signal
Fig. 7-17: Short time distortion measurements on the GBR "2T Pulse & Bar" test signal.
For the GBR signal, the test location is the same for all three video component signals.
Automated Measurements
Nonlinear Distortions
7MH107_0E Rohde & Schwarz Testing of Analog Video Component Signals
38
7.3 Nonlinear Distortions
Curves in the transmission characteristics cause nonlinear distortions and can lead to
color deviations.
7.3.1 Nonlinearity, Nonlinearity Step 1 to Step 5
7.3.1.1 Definition
This measurement assesses the linearity based on a continuous level increase. The
level measurements are taken at regular intervals. For an exactly linear transmission
characteristic, the level differences are the same at all adjacent test points. If nonlinear
distortions are present, the amplitude values will differ from one another.
The measurement is taken on a step signal or a ramp. It must be ensured that the
measurement times are set at regular intervals. If they are not, undistorted signals can
cause deviations from the reference value.
The Nonlinearity measured value is defined as the difference between the largest and
the smallest level difference in relation to the largest level difference. This measured
value therefore describes the order of magnitude of the nonlinear distortion.
The values of the individual level differences – Nonlinearity Step 1 to
Nonlinearity Step 5 – show the progression of the nonlinearity. The measured values
are defined as the value of the individual level differences 1 to 5 in relation to the
largest level difference.
The measured values are expressed as a %. By definition, the measured value is
always positive.
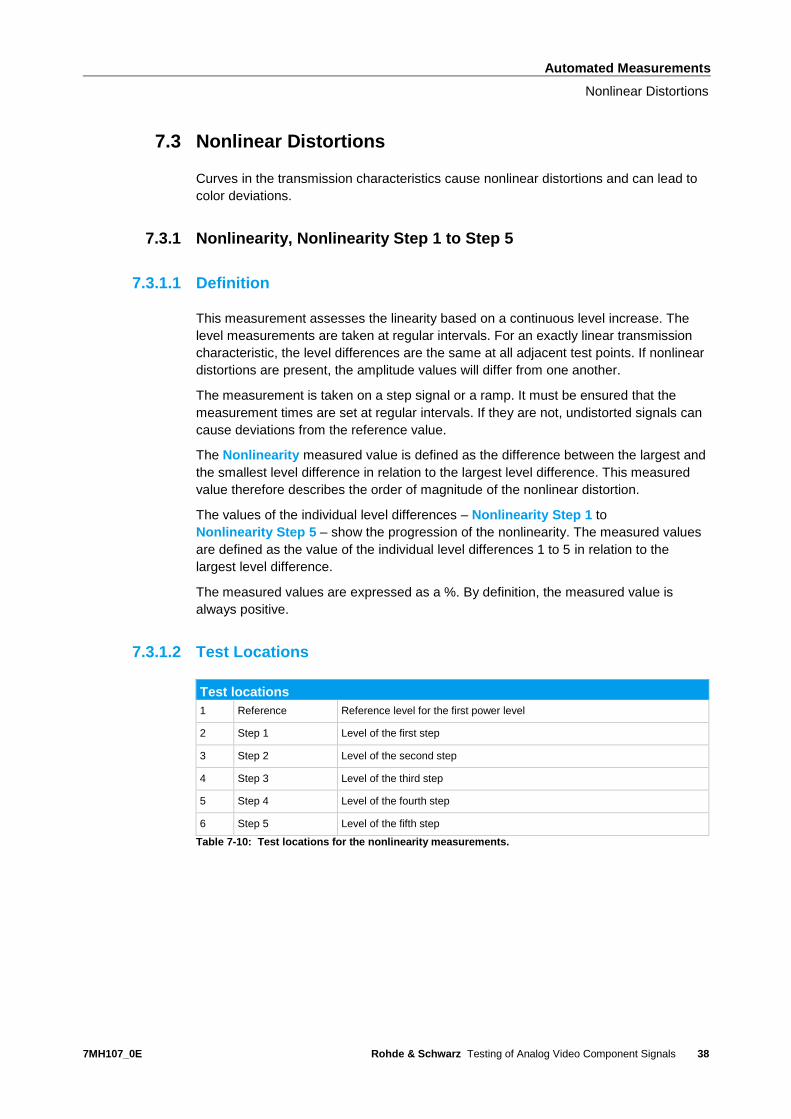
7.3.1.2 Test Locations
Test locations
1 Reference Reference level for the first power level
2 Step 1 Level of the first step
3 Step 2 Level of the second step
4 Step 3 Level of the third step
5 Step 4 Level of the fourth step
6 Step 5 Level of the fifth step
Table 7-10: Test locations for the nonlinearity measurements.
Automated Measurements
Nonlinear Distortions
7MH107_0E Rohde & Schwarz Testing of Analog Video Component Signals
39
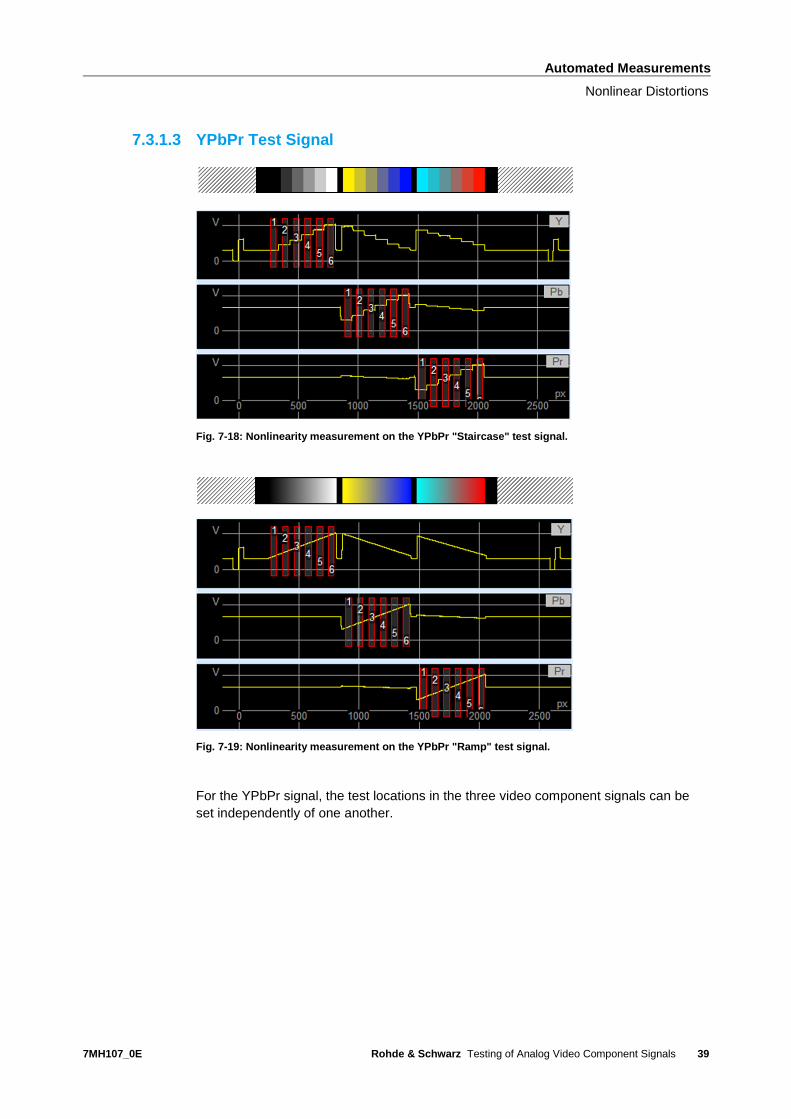
7.3.1.3 YPbPr Test Signal
Fig. 7-18: Nonlinearity measurement on the YPbPr "Staircase" test signal.
Fig. 7-19: Nonlinearity measurement on the YPbPr "Ramp" test signal.
For the YPbPr signal, the test locations in the three video component signals can be
set independently of one another.
Automated Measurements
Nonlinear Distortions
7MH107_0E Rohde & Schwarz Testing of Analog Video Component Signals
40
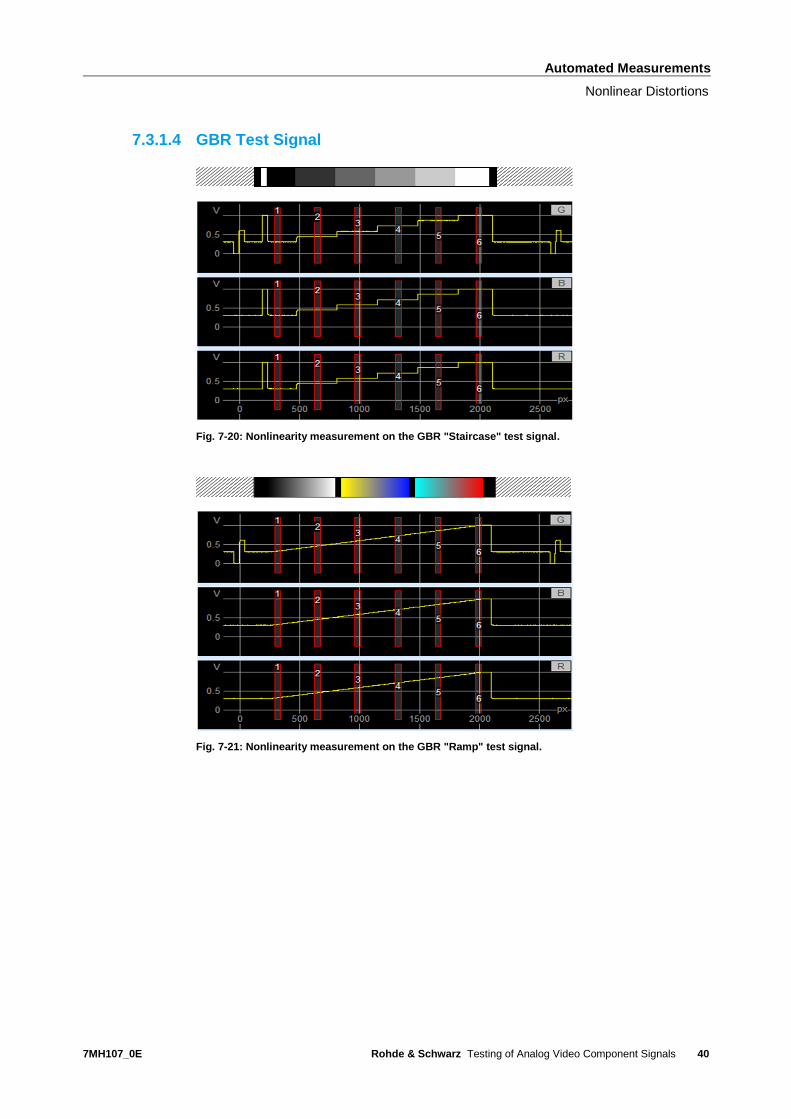
7.3.1.4 GBR Test Signal
Fig. 7-20: Nonlinearity measurement on the GBR "Staircase" test signal.
Fig. 7-21: Nonlinearity measurement on the GBR "Ramp" test signal.
Automated Measurements
Frequency Response
7MH107_0E Rohde & Schwarz Testing of Analog Video Component Signals
41
7.4 Frequency Response
Errors in the frequency domain are also linear distortions. However, in contrast to the
linear distortion measurements, these measurements show the frequency response
directly.
7.4.1 SIN X/X Amplitude, SIN X/X Delay
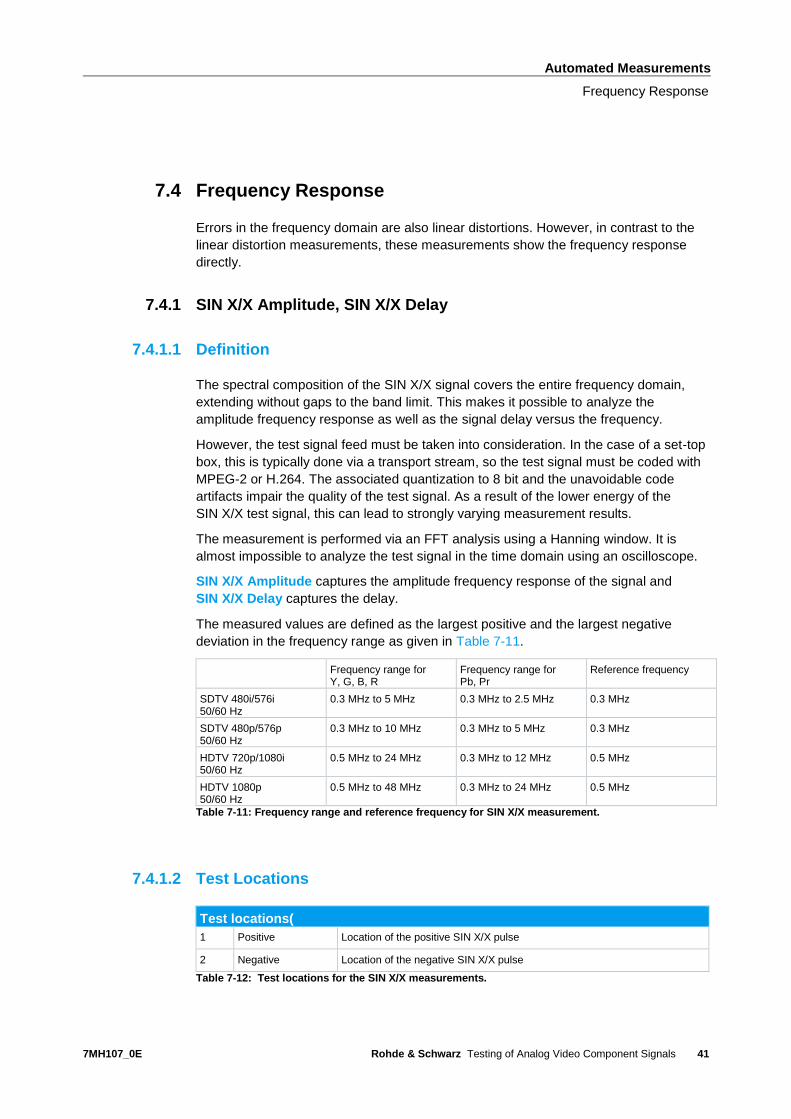
7.4.1.1 Definition
The spectral composition of the SIN X/X signal covers the entire frequency domain,
extending without gaps to the band limit. This makes it possible to analyze the
amplitude frequency response as well as the signal delay versus the frequency.
However, the test signal feed must be taken into consideration. In the case of a set-top
box, this is typically done via a transport stream, so the test signal must be coded with
MPEG-2 or H.264. The associated quantization to 8 bit and the unavoidable code
artifacts impair the quality of the test signal. As a result of the lower energy of the
SIN X/X test signal, this can lead to strongly varying measurement results.
The measurement is performed via an FFT analysis using a Hanning window. It is
almost impossible to analyze the test signal in the time domain using an oscilloscope.
SIN X/X Amplitude captures the amplitude frequency response of the signal and
SIN X/X Delay captures the delay.
The measured values are defined as the largest positive and the largest negative
deviation in the frequency range as given in Table 7-11.
Frequency range for Y, G, B, R
Frequency range for Pb, Pr
Reference frequency
SDTV 480i/576i 50/60 Hz
0.3 MHz to 5 MHz 0.3 MHz to 2.5 MHz 0.3 MHz
SDTV 480p/576p 50/60 Hz
0.3 MHz to 10 MHz 0.3 MHz to 5 MHz 0.3 MHz
HDTV 720p/1080i 50/60 Hz
0.5 MHz to 24 MHz 0.3 MHz to 12 MHz 0.5 MHz
HDTV 1080p 50/60 Hz
0.5 MHz to 48 MHz 0.3 MHz to 24 MHz 0.5 MHz
Table 7-11: Frequency range and reference frequency for SIN X/X measurement.
7.4.1.2 Test Locations
Test locations(
1 Positive Location of the positive SIN X/X pulse
2 Negative Location of the negative SIN X/X pulse
Table 7-12: Test locations for the SIN X/X measurements.
Automated Measurements
Frequency Response
7MH107_0E Rohde & Schwarz Testing of Analog Video Component Signals
42
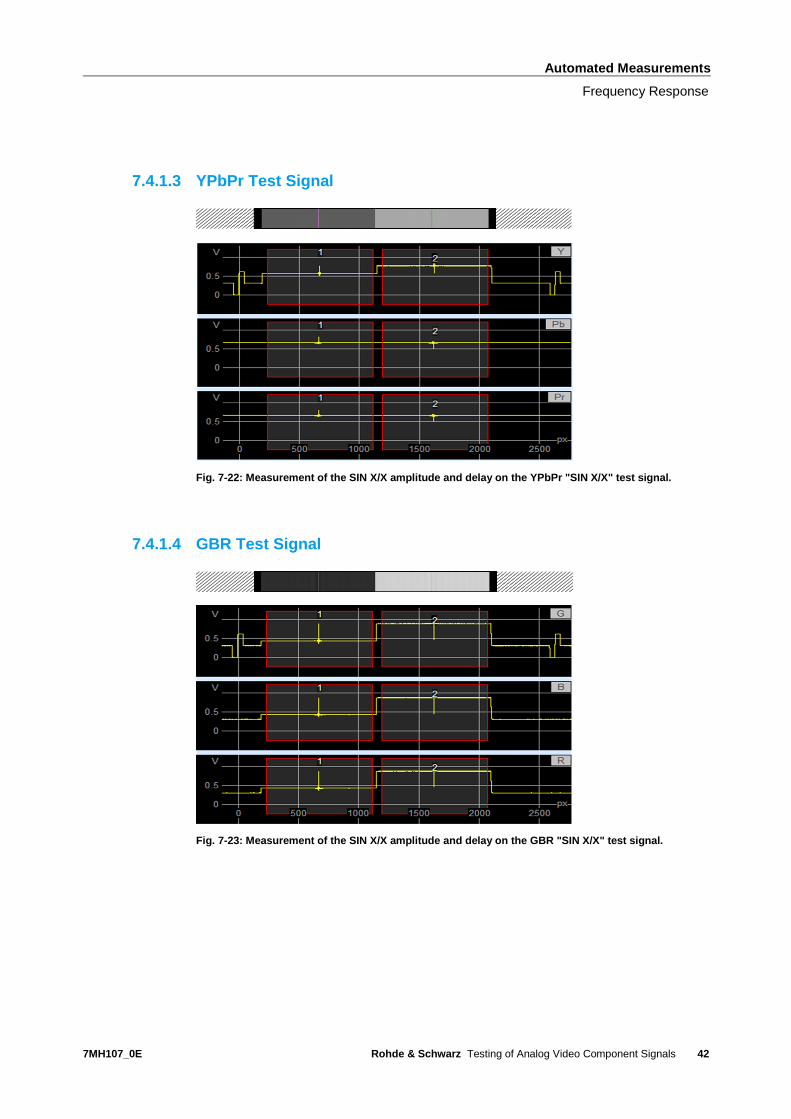
7.4.1.3 YPbPr Test Signal
Fig. 7-22: Measurement of the SIN X/X amplitude and delay on the YPbPr "SIN X/X" test signal.
7.4.1.4 GBR Test Signal
Fig. 7-23: Measurement of the SIN X/X amplitude and delay on the GBR "SIN X/X" test signal.
Automated Measurements
Frequency Response
7MH107_0E Rohde & Schwarz Testing of Analog Video Component Signals
43
7.4.2 Multiburst
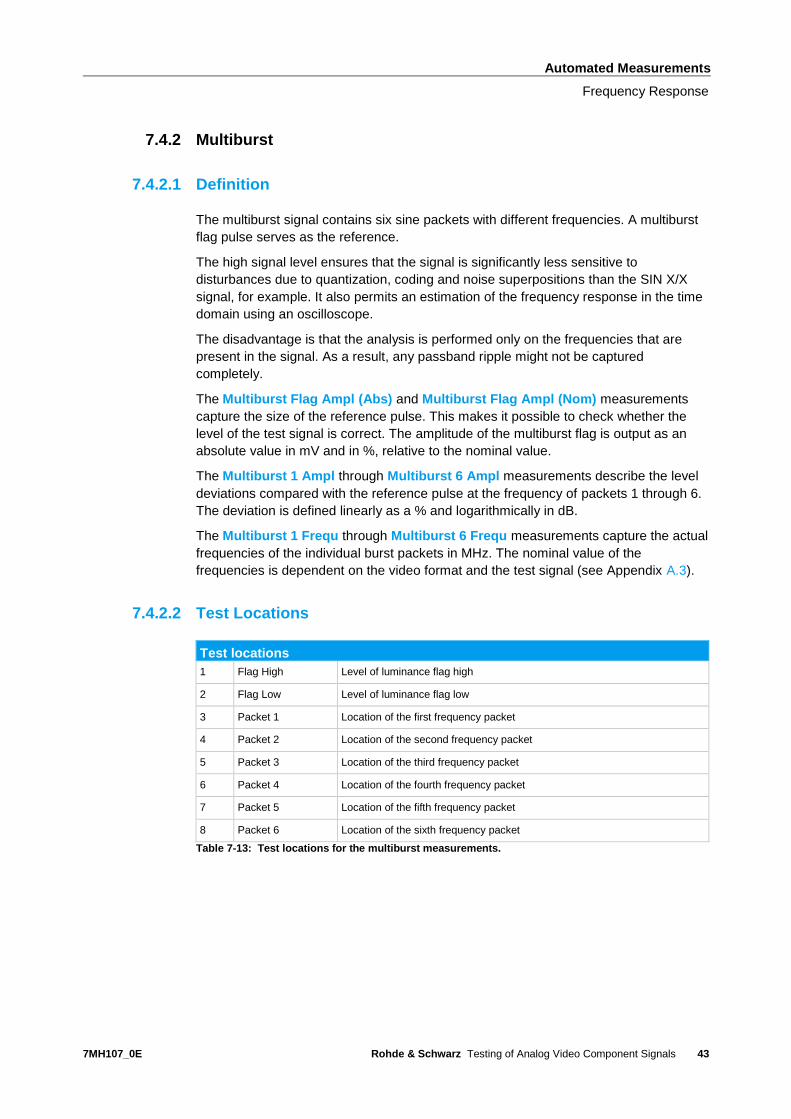
7.4.2.1 Definition
The multiburst signal contains six sine packets with different frequencies. A multiburst
flag pulse serves as the reference.
The high signal level ensures that the signal is significantly less sensitive to
disturbances due to quantization, coding and noise superpositions than the SIN X/X
signal, for example. It also permits an estimation of the frequency response in the time
domain using an oscilloscope.
The disadvantage is that the analysis is performed only on the frequencies that are
present in the signal. As a result, any passband ripple might not be captured
completely.
The Multiburst Flag Ampl (Abs) and Multiburst Flag Ampl (Nom) measurements
capture the size of the reference pulse. This makes it possible to check whether the
level of the test signal is correct. The amplitude of the multiburst flag is output as an
absolute value in mV and in %, relative to the nominal value.
The Multiburst 1 Ampl through Multiburst 6 Ampl measurements describe the level
deviations compared with the reference pulse at the frequency of packets 1 through 6.
The deviation is defined linearly as a % and logarithmically in dB.
The Multiburst 1 Frequ through Multiburst 6 Frequ measurements capture the actual
frequencies of the individual burst packets in MHz. The nominal value of the
frequencies is dependent on the video format and the test signal (see Appendix A.3).
7.4.2.2 Test Locations
Test locations
1 Flag High Level of luminance flag high
2 Flag Low Level of luminance flag low
3 Packet 1 Location of the first frequency packet
4 Packet 2 Location of the second frequency packet
5 Packet 3 Location of the third frequency packet
6 Packet 4 Location of the fourth frequency packet
7 Packet 5 Location of the fifth frequency packet
8 Packet 6 Location of the sixth frequency packet
Table 7-13: Test locations for the multiburst measurements.
Automated Measurements
Frequency Response
7MH107_0E Rohde & Schwarz Testing of Analog Video Component Signals
44
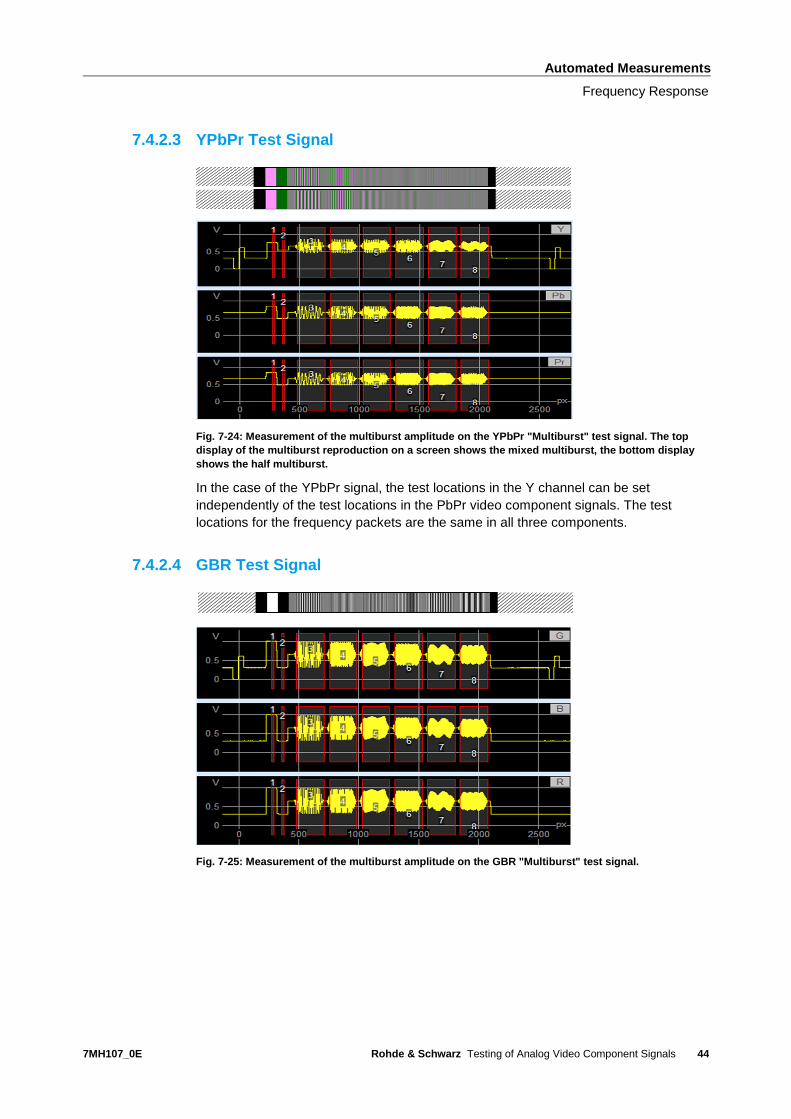
7.4.2.3 YPbPr Test Signal
Fig. 7-24: Measurement of the multiburst amplitude on the YPbPr "Multiburst" test signal. The top
display of the multiburst reproduction on a screen shows the mixed multiburst, the bottom display
shows the half multiburst.
In the case of the YPbPr signal, the test locations in the Y channel can be set
independently of the test locations in the PbPr video component signals. The test
locations for the frequency packets are the same in all three components.
7.4.2.4 GBR Test Signal
Fig. 7-25: Measurement of the multiburst amplitude on the GBR "Multiburst" test signal.
Automated Measurements
Frequency Response
7MH107_0E Rohde & Schwarz Testing of Analog Video Component Signals
45
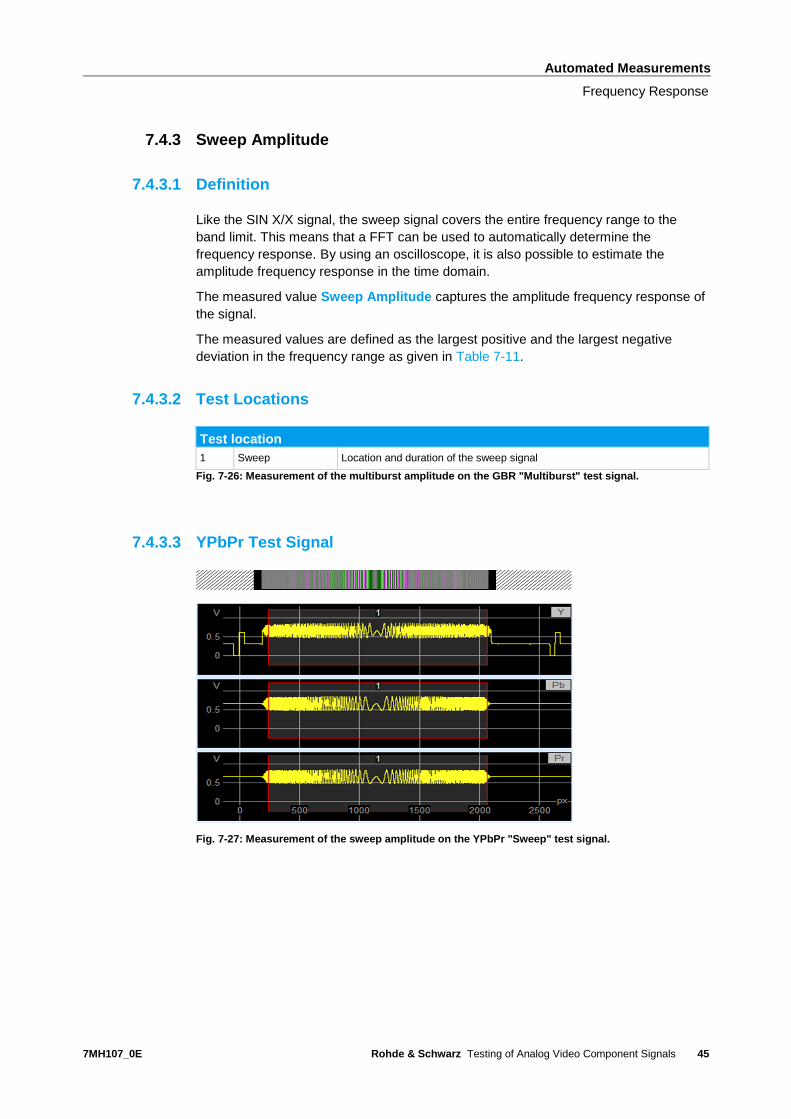
7.4.3 Sweep Amplitude
7.4.3.1 Definition
Like the SIN X/X signal, the sweep signal covers the entire frequency range to the
band limit. This means that a FFT can be used to automatically determine the
frequency response. By using an oscilloscope, it is also possible to estimate the
amplitude frequency response in the time domain.
The measured value Sweep Amplitude captures the amplitude frequency response of
the signal.
The measured values are defined as the largest positive and the largest negative
deviation in the frequency range as given in Table 7-11.
7.4.3.2 Test Locations
Test location
1 Sweep Location and duration of the sweep signal
Fig. 7-26: Measurement of the multiburst amplitude on the GBR "Multiburst" test signal.
7.4.3.3 YPbPr Test Signal
Fig. 7-27: Measurement of the sweep amplitude on the YPbPr "Sweep" test signal.
Automated Measurements
Noise Measurements
7MH107_0E Rohde & Schwarz Testing of Analog Video Component Signals
46
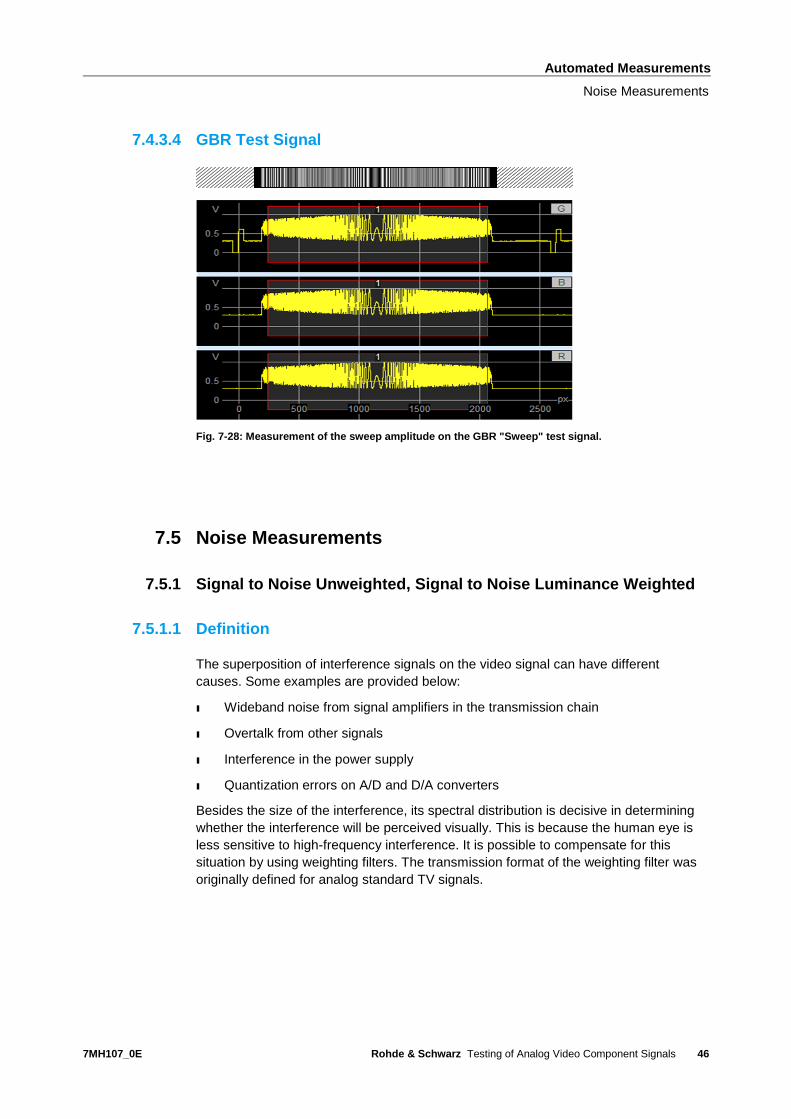
7.4.3.4 GBR Test Signal
Fig. 7-28: Measurement of the sweep amplitude on the GBR "Sweep" test signal.
7.5 Noise Measurements
7.5.1 Signal to Noise Unweighted, Signal to Noise Luminance Weighted
7.5.1.1 Definition
The superposition of interference signals on the video signal can have different
causes. Some examples are provided below:
ı Wideband noise from signal amplifiers in the transmission chain
ı Overtalk from other signals
ı Interference in the power supply
ı Quantization errors on A/D and D/A converters
Besides the size of the interference, its spectral distribution is decisive in determining
whether the interference will be perceived visually. This is because the human eye is
less sensitive to high-frequency interference. It is possible to compensate for this
situation by using weighting filters. The transmission format of the weighting filter was
originally defined for analog standard TV signals.

Automated Measurements
Noise Measurements
7MH107_0E Rohde & Schwarz Testing of Analog Video Component Signals
47
Fig. 7-29: Frequency response of a weighting filter for analog video signals with a bandwidth of
5 MHz.
There is no corresponding definition for HDTV signals. Therefore, the characteristic of
the weighting filter shown above is calculated up to the bandwidth for the signal of
interest.
The Signal to Noise Unw measurement defines the ratio of unweighted noise voltage
to the nominal signal level of 700 mV.
The Signal to Noise Lumw measurement defines the ratio of weighted noise voltage
to the nominal signal level of 700 mV.
The spectral distribution of the noise voltage can be ascertained from the difference
between the two measured values. If the noise signals are evenly distributed over the
bandwidth (white noise), the signal-to-noise ratio of the unweighted measurement is
7.4 dB worse than the weighted measurement. If the difference is greater, then this
interference has a larger component in the upper frequency domain. The same applies
in reverse to smaller differences.
Otherwise, the noise voltage is captured up to the band limit of the signal. However,
the analyzer includes filter settings for limiting the measurement bandwidth to 4.2 MHz,
5 MHz and 20 MHz. These filters serve only to ensure that the test instrument remains
compatible with old T&M equipment, which often cannot cover the entire frequency
bandwidth of a modern HDTV signal.
The bandwidth is selected via a menu in the "Signal to Noise" settings dialog box.
Automated Measurements
Noise Measurements
7MH107_0E Rohde & Schwarz Testing of Analog Video Component Signals
48
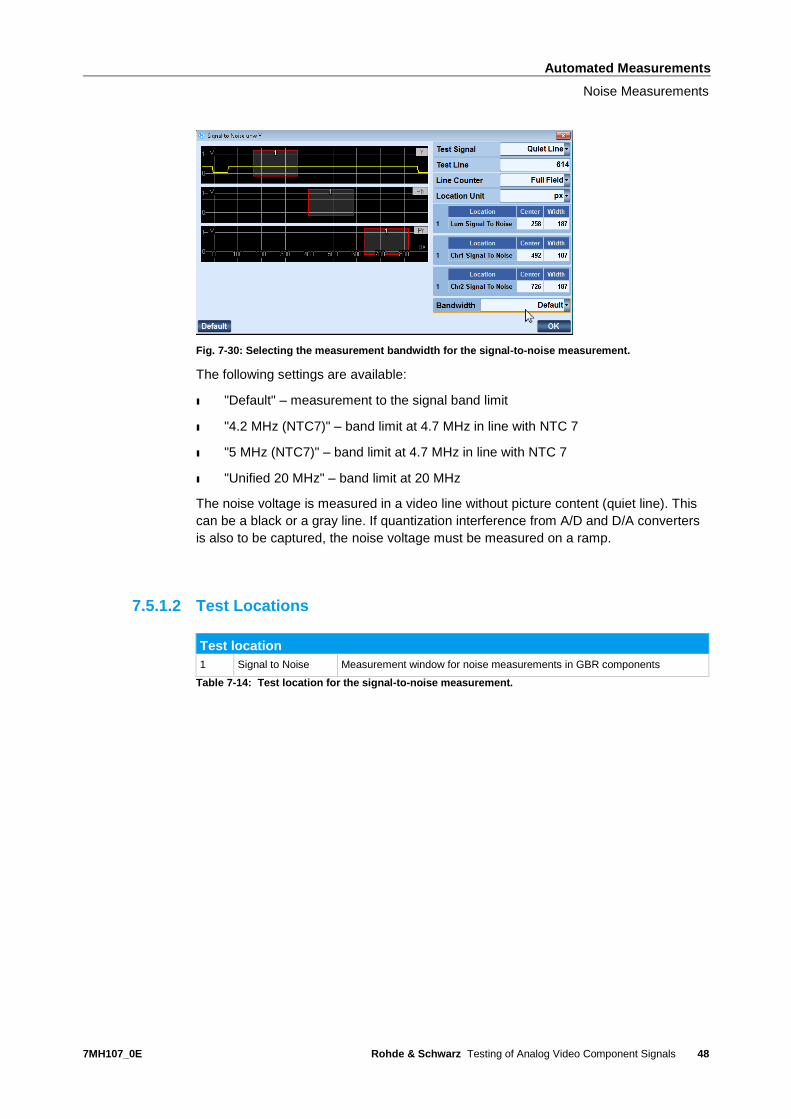
Fig. 7-30: Selecting the measurement bandwidth for the signal-to-noise measurement.
The following settings are available:
ı "Default" – measurement to the signal band limit
ı "4.2 MHz (NTC7)" – band limit at 4.7 MHz in line with NTC 7
ı "5 MHz (NTC7)" – band limit at 4.7 MHz in line with NTC 7
ı "Unified 20 MHz" – band limit at 20 MHz
The noise voltage is measured in a video line without picture content (quiet line). This
can be a black or a gray line. If quantization interference from A/D and D/A converters
is also to be captured, the noise voltage must be measured on a ramp.
7.5.1.2 Test Locations
Test location
1 Signal to Noise Measurement window for noise measurements in GBR components
Table 7-14: Test location for the signal-to-noise measurement.
Automated Measurements
Noise Measurements
7MH107_0E Rohde & Schwarz Testing of Analog Video Component Signals
49
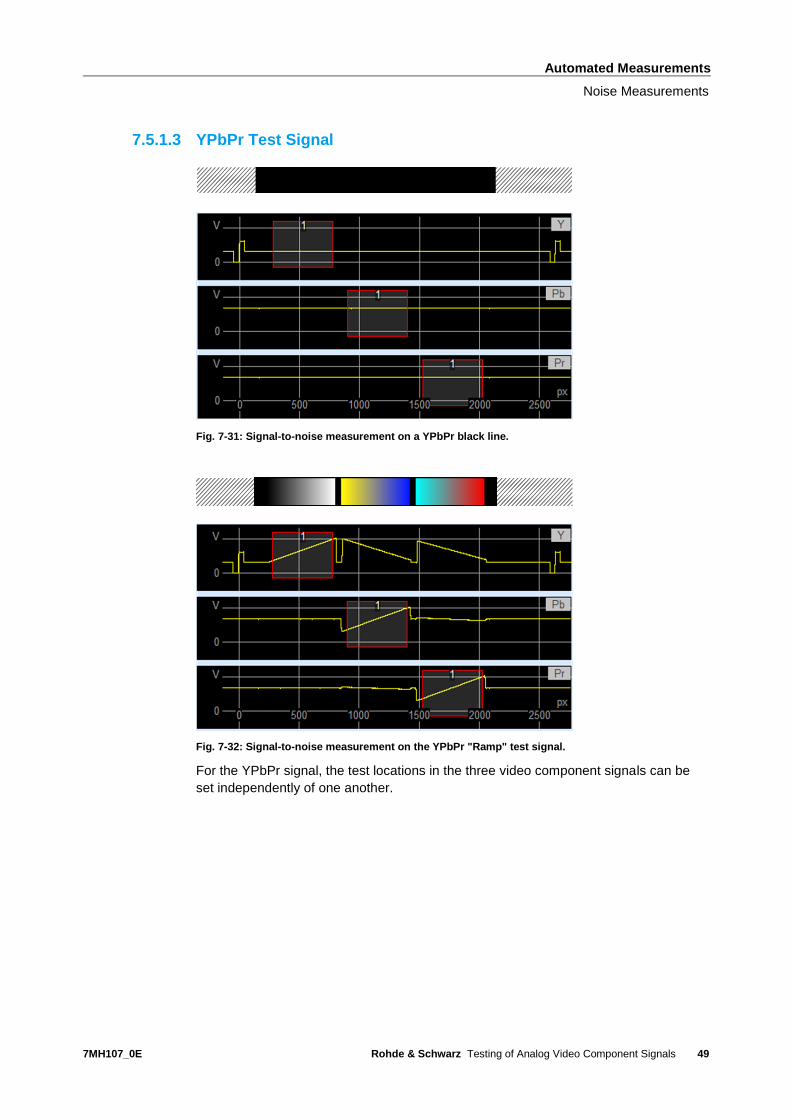
7.5.1.3 YPbPr Test Signal
Fig. 7-31: Signal-to-noise measurement on a YPbPr black line.
Fig. 7-32: Signal-to-noise measurement on the YPbPr "Ramp" test signal.
For the YPbPr signal, the test locations in the three video component signals can be
set independently of one another.

Automated Measurements
Timing
7MH107_0E Rohde & Schwarz Testing of Analog Video Component Signals
50
7.5.1.4 GBR Test Signal
Fig. 7-33: Signal-to-noise measurement on a GBR black line.
Fig. 7-34: Signal-to-noise measurement on the GBR "Ramp" test signal.
7.6 Timing
Time measurements check the temporal integrity of the video signal. This makes it
possible to identify errors during the clock generation in the DUT.
Automated Measurements
Timing
7MH107_0E Rohde & Schwarz Testing of Analog Video Component Signals
51
7.6.1 Field Period
The Field Period measurement captures the period of the full field video. The
measurement is taken on the sync pulses in the blanking intervals. It is therefore not
necessary to make a specific test signal available for selection. The measured value is
specified in µs.
7.6.2 Field Frequency
The Field Frequency measurement captures the repetition rate of the full field video.
The measurement is taken on the sync pulses in the blanking interval. It is therefore
not necessary to make a specific test signal available for selection. The measured
value is specified in Hz.
7.6.3 Line Period
The Line Period measurement captures the duration of the video lines. The
measurement is taken on the sync pulses in the blanking interval. It is therefore not
necessary to make a specific test signal available for selection. The measured value is
specified in µs.
7.6.4 Line Frequency
The Line Frequency measurement captures the repetition rate of the video lines. The
measurement is taken on the sync pulses in the video content. It is therefore not
necessary to make a specific test signal available for selection. The measured value is
specified in Hz.
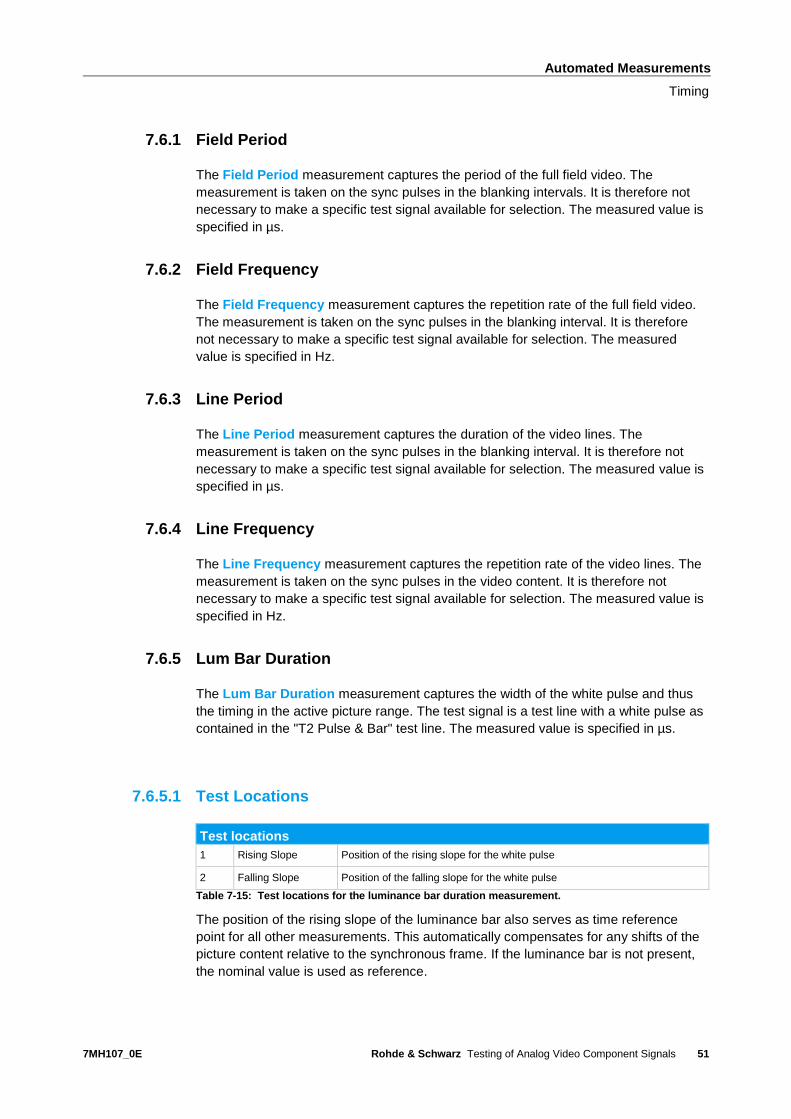
7.6.5 Lum Bar Duration
The Lum Bar Duration measurement captures the width of the white pulse and thus
the timing in the active picture range. The test signal is a test line with a white pulse as
contained in the "T2 Pulse & Bar" test line. The measured value is specified in µs.
7.6.5.1 Test Locations
Test locations
1 Rising Slope Position of the rising slope for the white pulse
2 Falling Slope Position of the falling slope for the white pulse
Table 7-15: Test locations for the luminance bar duration measurement.
The position of the rising slope of the luminance bar also serves as time reference
point for all other measurements. This automatically compensates for any shifts of the
picture content relative to the synchronous frame. If the luminance bar is not present,
the nominal value is used as reference.
Automated Measurements
Timing
7MH107_0E Rohde & Schwarz Testing of Analog Video Component Signals
52
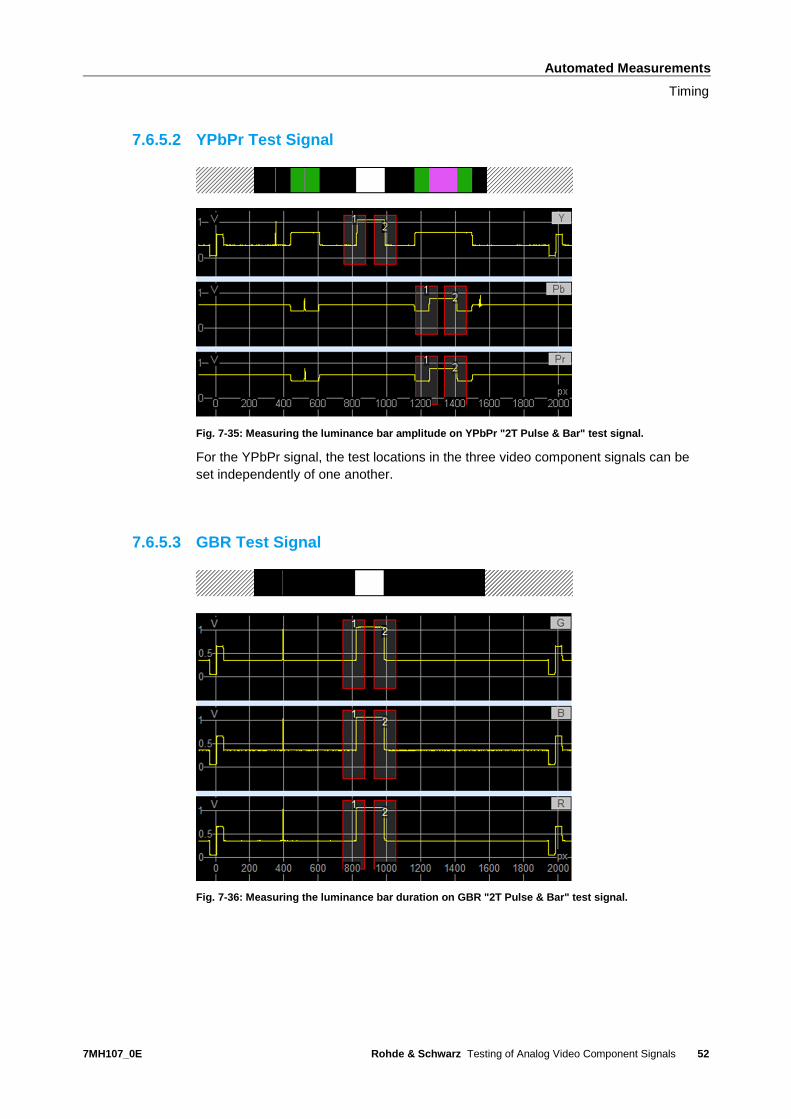
7.6.5.2 YPbPr Test Signal
Fig. 7-35: Measuring the luminance bar amplitude on YPbPr "2T Pulse & Bar" test signal.
For the YPbPr signal, the test locations in the three video component signals can be
set independently of one another.
7.6.5.3 GBR Test Signal
Fig. 7-36: Measuring the luminance bar duration on GBR "2T Pulse & Bar" test signal.
Automated Measurements
Jitter
7MH107_0E Rohde & Schwarz Testing of Analog Video Component Signals
53
7.7 Jitter
Jitter measurements assess the temporal stability of the video signal. With digital
processing of the video signal in UEs, signal jitter is typically no longer visible in the
picture. However, the jitter measurement still makes sense because it can be used to
identify problems during clock regeneration in the DUT.
The measurement is taken on the sync pulses in the active video content. It is
therefore not necessary to make a specific test signal available for selection.
7.7.1 Line Jitter Pos Peak, Line Jitter Neg Peak, Line Jitter pp
The Line Jitter Pos Peak and Line Jitter Neg Peak measurements capture the
longest or the shortest video line in full field. The difference to the average length of all
video lines in full field is output. The Line Jitter pp measurement specifies the sum of
the Line Jitter Pos Peak and Line Jitter Neg Peak measurements. The measured
value is specified in ns.
7.7.2 Line Jitter Std. Deviation
Line Jitter Std. Dev specifies the standard deviation of the line duration of all lines of a
full field. No unit is assigned to the measured value.
Ordering Information
Jitter
7MH107_0E Rohde & Schwarz Testing of Analog Video Component Signals
54
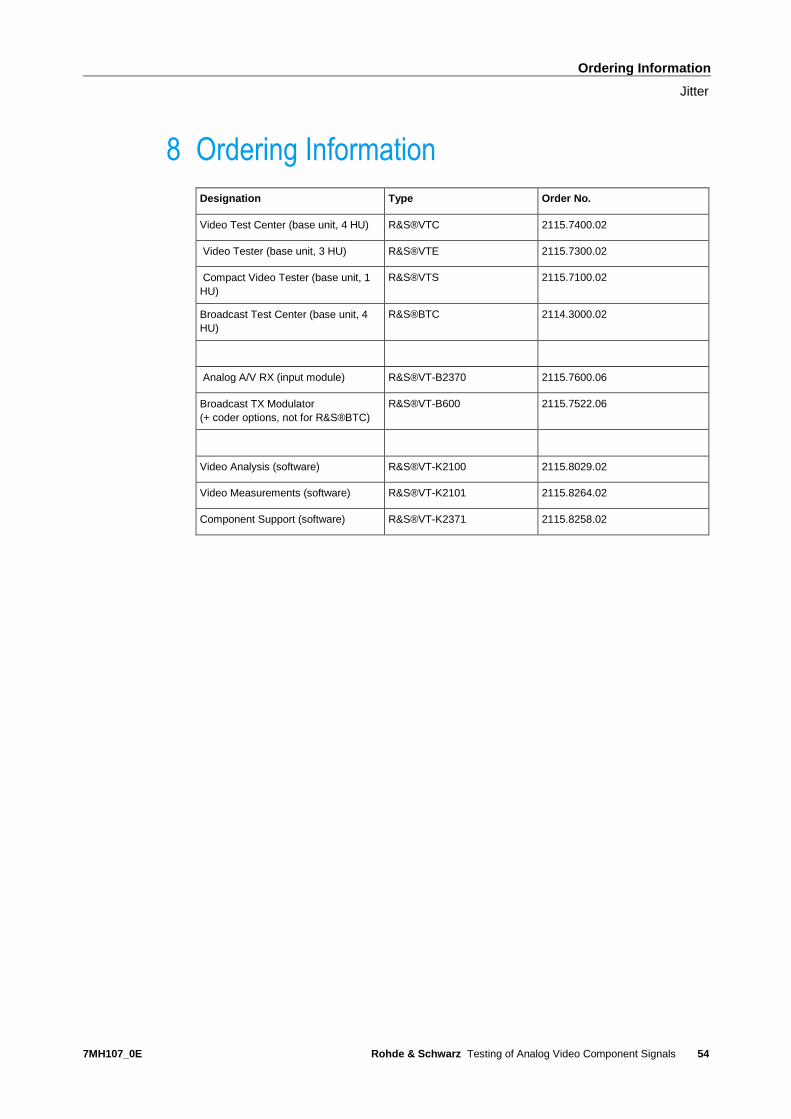
8 Ordering Information
Designation Type Order No.
Video Test Center (base unit, 4 HU) R&S®VTC 2115.7400.02
Video Tester (base unit, 3 HU) R&S®VTE 2115.7300.02
Compact Video Tester (base unit, 1
HU)
R&S®VTS 2115.7100.02
Broadcast Test Center (base unit, 4
HU)
R&S®BTC 2114.3000.02
Analog A/V RX (input module) R&S®VT-B2370 2115.7600.06
Broadcast TX Modulator
(+ coder options, not for R&S®BTC)
R&S®VT-B600 2115.7522.06
Video Analysis (software) R&S®VT-K2100 2115.8029.02
Video Measurements (software) R&S®VT-K2101 2115.8264.02
Component Support (software) R&S®VT-K2371 2115.8258.02
Appendix
A Rohde & Schwarz Combined Test Pattern
A.1 Test Signal Mapping of Interlaced Formats
First Middle Last First Middle Last
Color Bars GBR 1 15 29 22 29 36
Color Bars Y,Cb,Cr 32 46 59 37 44 51
Horizontal Sweep GBR 63 76 89 52 59 66
Horizontal Sweep Y.Cb,Cr 94 107 119 67 74 81
Multiburst RGB 125 137 149 82 89 96
Multiburst Y.Cb,Cr mixed 156 168 179 97 104 111
Multiburst Y.Cb,Cr half 187 198 209 112 119 126
Sin(x)/x RGB 218 229 239 127 134 141
Sin(x)/x Y,Cb,Cr 249 259 269 142 149 156
2T Pulse and Bar GBR 280 290 299 157 164 171
2T Pulse and Bar Y,Cb,Cr 311 320 329 172 179 186
Ramp RGB 342 351 359 187 194 201
Valid Ramp Y,Cb,Cr(GBR) 373 381 389 202 209 216
Stairs RGB 404 412 419 217 224 231
Valid Stairs Y,Cb,Cr(GBR) 435 442 449 232 239 246
Quiet Line 466 473 479 247 254 261
First Middle Last First Middle Last
Color Bars GBR 2 16 30 285 292 299
Color Bars Y,Cb,Cr 33 47 60 300 307 314
Horizontal Sweep GBR 64 77 90 315 322 329
Horizontal Sweep Y.Cb,Cr 95 108 120 330 337 344
Multiburst RGB 126 138 150 345 352 359
Multiburst Y.Cb,Cr mixed 157 169 180 360 367 374
Multiburst Y.Cb,Cr half 188 199 210 375 382 389
Sin(x)/x RGB 219 230 240 390 397 404
Sin(x)/x Y,Cb,Cr 250 260 270 405 412 419
2T Pulse and Bar GBR 281 291 300 420 427 434
2T Pulse and Bar Y,Cb,Cr 312 321 330 435 442 449
Ramp RGB 343 352 360 450 457 464
Valid Ramp Y,Cb,Cr(GBR) 374 382 390 465 472 479
Stairs RGB 405 413 420 480 487 494
Valid Stairs Y,Cb,Cr(GBR) 436 443 450 495 502 509
Quiet Line 467 474 480 510 517 524
Signal 720 x 480i - Field 1Active Field Line Full Flield Line
Signal 720 x 480i - Field 2Active Field Line Full Flield Line
First Middle Last First Middle Last
Color Bars GBR 1 18 35 23 32 40
Color Bars Y,Cb,Cr 32 52 71 41 50 58
Horizontal Sweep GBR 63 85 107 59 68 76
Horizontal Sweep Y.Cb,Cr 94 119 143 77 86 94
Multiburst RGB 125 152 179 95 104 112
Multiburst Y.Cb,Cr mixed 156 186 215 113 122 130
Multiburst Y.Cb,Cr half 187 219 251 131 140 148
Sin(x)/x RGB 218 253 287 149 158 166
Sin(x)/x Y,Cb,Cr 249 286 323 167 176 184
2T Pulse and Bar GBR 280 320 359 185 194 202
2T Pulse and Bar Y,Cb,Cr 311 353 395 203 212 220
Ramp RGB 342 387 431 221 230 238
Valid Ramp Y,Cb,Cr(GBR) 373 420 467 239 248 256
Stairs RGB 404 454 503 257 266 274
Valid Stairs Y,Cb,Cr(GBR) 435 487 539 275 284 292
Quiet Line 466 521 575 293 302 310
First Middle Last First Middle Last
Color Bars GBR 2 19 36 336 345 353
Color Bars Y,Cb,Cr 33 53 72 354 363 371
Horizontal Sweep GBR 64 86 108 372 381 389
Horizontal Sweep Y.Cb,Cr 95 120 144 390 399 407
Multiburst RGB 126 153 180 408 417 425
Multiburst Y.Cb,Cr mixed 157 187 216 426 435 443
Multiburst Y.Cb,Cr half 188 220 252 444 453 461
Sin(x)/x RGB 219 254 288 462 471 479
Sin(x)/x Y,Cb,Cr 250 287 324 480 489 497
2T Pulse and Bar GBR 281 321 360 498 507 515
2T Pulse and Bar Y,Cb,Cr 312 354 396 516 525 533
Ramp RGB 343 388 432 534 543 551
Valid Ramp Y,Cb,Cr(GBR) 374 421 468 552 561 569
Stairs RGB 405 455 504 570 579 587
Valid Stairs Y,Cb,Cr(GBR) 436 488 540 588 597 605
Quiet Line 467 522 576 606 615 623
Signal 720 x 576i - Field 1Active Field Line Full Flield Line
Signal 720 x 576i - Field 2Active Field Line Full Flield Line
First Middle Last First Middle Last
Color Bars GBR 1 34 66 21 38 54
Color Bars Y,Cb,Cr 32 67 102 55 71 87
Horizontal Sweep GBR 63 101 138 88 105 121
Horizontal Sweep Y.Cb,Cr 94 134 174 122 138 154
Multiburst RGB 125 168 210 155 172 188
Multiburst Y.Cb,Cr mixed 156 201 246 189 205 221
Multiburst Y.Cb,Cr half 187 235 282 222 239 255
Sin(x)/x RGB 218 268 318 256 272 288
Sin(x)/x Y,Cb,Cr 249 302 354 289 306 322
2T Pulse and Bar GBR 280 335 390 323 339 355
2T Pulse and Bar Y,Cb,Cr 311 369 426 356 373 389
Ramp RGB 342 402 462 390 406 422
Valid Ramp Y,Cb,Cr(GBR) 373 436 498 423 440 456
Stairs RGB 404 469 534 457 473 489
Valid Stairs Y,Cb,Cr(GBR) 435 503 570 490 507 523
Quiet Line 466 536 606 524 540 556
First Middle Last First Middle Last
Color Bars GBR 2 35 67 584 601 617
Color Bars Y,Cb,Cr 33 68 103 618 634 650
Horizontal Sweep GBR 64 102 139 651 668 684
Horizontal Sweep Y.Cb,Cr 95 135 175 685 701 717
Multiburst RGB 126 169 211 718 735 751
Multiburst Y.Cb,Cr mixed 157 202 247 752 768 784
Multiburst Y.Cb,Cr half 188 236 283 785 802 818
Sin(x)/x RGB 219 269 319 819 835 851
Sin(x)/x Y,Cb,Cr 250 303 355 852 869 885
2T Pulse and Bar GBR 281 336 391 886 902 918
2T Pulse and Bar Y,Cb,Cr 312 370 427 919 936 952
Ramp RGB 343 403 463 953 969 985
Valid Ramp Y,Cb,Cr(GBR) 374 437 499 986 1003 1019
Stairs RGB 405 470 535 1020 1036 1052
Valid Stairs Y,Cb,Cr(GBR) 436 504 571 1053 1070 1086
Quiet Line 467 537 607 1087 1103 1119
Signal 1920 x 1080i - Field 1Active Field Line Full Flield Line
Signal 1920 x 1080i - Field 2Active Field Line Full Flield Line
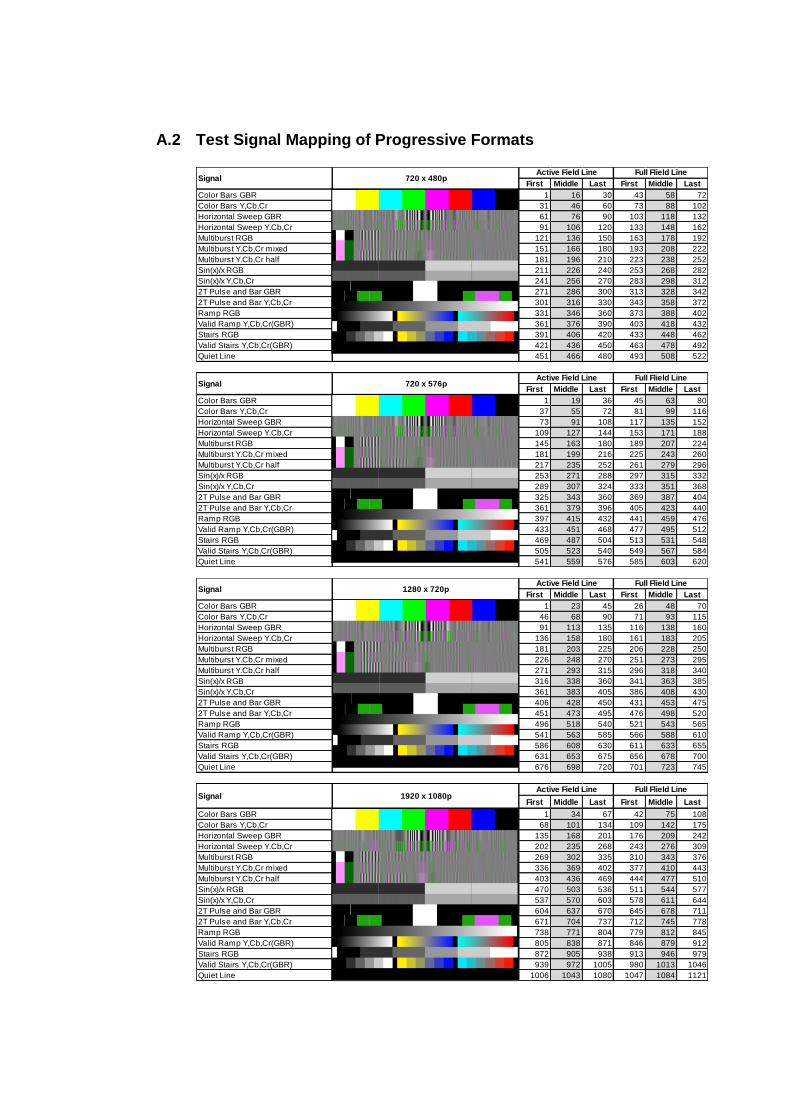
A.2 Test Signal Mapping of Progressive Formats
First Middle Last First Middle Last
Color Bars GBR 1 16 30 43 58 72
Color Bars Y,Cb,Cr 31 46 60 73 88 102
Horizontal Sweep GBR 61 76 90 103 118 132
Horizontal Sweep Y.Cb,Cr 91 106 120 133 148 162
Multiburst RGB 121 136 150 163 178 192
Multiburst Y.Cb,Cr mixed 151 166 180 193 208 222
Multiburst Y.Cb,Cr half 181 196 210 223 238 252
Sin(x)/x RGB 211 226 240 253 268 282
Sin(x)/x Y,Cb,Cr 241 256 270 283 298 312
2T Pulse and Bar GBR 271 286 300 313 328 342
2T Pulse and Bar Y,Cb,Cr 301 316 330 343 358 372
Ramp RGB 331 346 360 373 388 402
Valid Ramp Y,Cb,Cr(GBR) 361 376 390 403 418 432
Stairs RGB 391 406 420 433 448 462
Valid Stairs Y,Cb,Cr(GBR) 421 436 450 463 478 492
Quiet Line 451 466 480 493 508 522
Signal 720 x 480pActive Field Line Full Flield Line
First Middle Last First Middle Last
Color Bars GBR 1 19 36 45 63 80
Color Bars Y,Cb,Cr 37 55 72 81 99 116
Horizontal Sweep GBR 73 91 108 117 135 152
Horizontal Sweep Y.Cb,Cr 109 127 144 153 171 188
Multiburst RGB 145 163 180 189 207 224
Multiburst Y.Cb,Cr mixed 181 199 216 225 243 260
Multiburst Y.Cb,Cr half 217 235 252 261 279 296
Sin(x)/x RGB 253 271 288 297 315 332
Sin(x)/x Y,Cb,Cr 289 307 324 333 351 368
2T Pulse and Bar GBR 325 343 360 369 387 404
2T Pulse and Bar Y,Cb,Cr 361 379 396 405 423 440
Ramp RGB 397 415 432 441 459 476
Valid Ramp Y,Cb,Cr(GBR) 433 451 468 477 495 512
Stairs RGB 469 487 504 513 531 548
Valid Stairs Y,Cb,Cr(GBR) 505 523 540 549 567 584
Quiet Line 541 559 576 585 603 620
Signal 720 x 576pActive Field Line Full Flield Line
First Middle Last First Middle Last
Color Bars GBR 1 23 45 26 48 70
Color Bars Y,Cb,Cr 46 68 90 71 93 115
Horizontal Sweep GBR 91 113 135 116 138 160
Horizontal Sweep Y.Cb,Cr 136 158 180 161 183 205
Multiburst RGB 181 203 225 206 228 250
Multiburst Y.Cb,Cr mixed 226 248 270 251 273 295
Multiburst Y.Cb,Cr half 271 293 315 296 318 340
Sin(x)/x RGB 316 338 360 341 363 385
Sin(x)/x Y,Cb,Cr 361 383 405 386 408 430
2T Pulse and Bar GBR 406 428 450 431 453 475
2T Pulse and Bar Y,Cb,Cr 451 473 495 476 498 520
Ramp RGB 496 518 540 521 543 565
Valid Ramp Y,Cb,Cr(GBR) 541 563 585 566 588 610
Stairs RGB 586 608 630 611 633 655
Valid Stairs Y,Cb,Cr(GBR) 631 653 675 656 678 700
Quiet Line 676 698 720 701 723 745
Signal 1280 x 720pActive Field Line Full Flield Line
First Middle Last First Middle Last
Color Bars GBR 1 34 67 42 75 108
Color Bars Y,Cb,Cr 68 101 134 109 142 175
Horizontal Sweep GBR 135 168 201 176 209 242
Horizontal Sweep Y.Cb,Cr 202 235 268 243 276 309
Multiburst RGB 269 302 335 310 343 376
Multiburst Y.Cb,Cr mixed 336 369 402 377 410 443
Multiburst Y.Cb,Cr half 403 436 469 444 477 510
Sin(x)/x RGB 470 503 536 511 544 577
Sin(x)/x Y,Cb,Cr 537 570 603 578 611 644
2T Pulse and Bar GBR 604 637 670 645 678 711
2T Pulse and Bar Y,Cb,Cr 671 704 737 712 745 778
Ramp RGB 738 771 804 779 812 845
Valid Ramp Y,Cb,Cr(GBR) 805 838 871 846 879 912
Stairs RGB 872 905 938 913 946 979
Valid Stairs Y,Cb,Cr(GBR) 939 972 1005 980 1013 1046
Quiet Line 1006 1043 1080 1047 1084 1121
Full Flield LineSignal 1920 x 1080p
Active Field Line
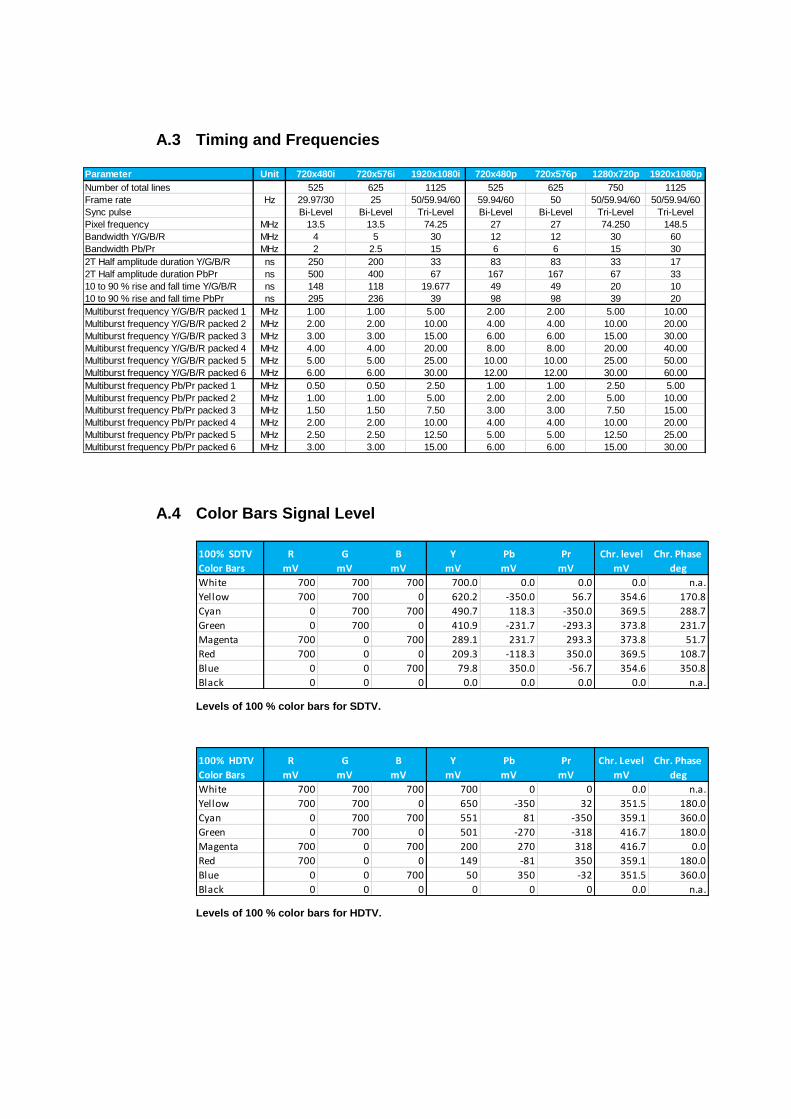
A.3 Timing and Frequencies
A.4 Color Bars Signal Level
Levels of 100 % color bars for SDTV.
Levels of 100 % color bars for HDTV.
Parameter Unit 720x480i 720x576i 1920x1080i 720x480p 720x576p 1280x720p 1920x1080p
Number of total lines 525 625 1125 525 625 750 1125
Frame rate Hz 29.97/30 25 50/59.94/60 59.94/60 50 50/59.94/60 50/59.94/60
Sync pulse Bi-Level Bi-Level Tri-Level Bi-Level Bi-Level Tri-Level Tri-Level
Pixel frequency MHz 13.5 13.5 74.25 27 27 74.250 148.5
Bandwidth Y/G/B/R MHz 4 5 30 12 12 30 60
Bandwidth Pb/Pr MHz 2 2.5 15 6 6 15 30
2T Half amplitude duration Y/G/B/R ns 250 200 33 83 83 33 17
2T Half amplitude duration PbPr ns 500 400 67 167 167 67 33
10 to 90 % rise and fall time Y/G/B/R ns 148 118 19.677 49 49 20 10
10 to 90 % rise and fall time PbPr ns 295 236 39 98 98 39 20
Multiburst frequency Y/G/B/R packed 1 MHz 1.00 1.00 5.00 2.00 2.00 5.00 10.00
Multiburst frequency Y/G/B/R packed 2 MHz 2.00 2.00 10.00 4.00 4.00 10.00 20.00
Multiburst frequency Y/G/B/R packed 3 MHz 3.00 3.00 15.00 6.00 6.00 15.00 30.00
Multiburst frequency Y/G/B/R packed 4 MHz 4.00 4.00 20.00 8.00 8.00 20.00 40.00
Multiburst frequency Y/G/B/R packed 5 MHz 5.00 5.00 25.00 10.00 10.00 25.00 50.00
Multiburst frequency Y/G/B/R packed 6 MHz 6.00 6.00 30.00 12.00 12.00 30.00 60.00
Multiburst frequency Pb/Pr packed 1 MHz 0.50 0.50 2.50 1.00 1.00 2.50 5.00
Multiburst frequency Pb/Pr packed 2 MHz 1.00 1.00 5.00 2.00 2.00 5.00 10.00
Multiburst frequency Pb/Pr packed 3 MHz 1.50 1.50 7.50 3.00 3.00 7.50 15.00
Multiburst frequency Pb/Pr packed 4 MHz 2.00 2.00 10.00 4.00 4.00 10.00 20.00
Multiburst frequency Pb/Pr packed 5 MHz 2.50 2.50 12.50 5.00 5.00 12.50 25.00
Multiburst frequency Pb/Pr packed 6 MHz 3.00 3.00 15.00 6.00 6.00 15.00 30.00
100% SDTV
Color Bars
R
mV
G
mV
B
mV
Y
mV
Pb
mV
Pr
mV
Chr. level
mV
Chr. Phase
deg
White 700 700 700 700.0 0.0 0.0 0.0 n.a.
Yellow 700 700 0 620.2 -350.0 56.7 354.6 170.8
Cyan 0 700 700 490.7 118.3 -350.0 369.5 288.7
Green 0 700 0 410.9 -231.7 -293.3 373.8 231.7
Magenta 700 0 700 289.1 231.7 293.3 373.8 51.7
Red 700 0 0 209.3 -118.3 350.0 369.5 108.7
Blue 0 0 700 79.8 350.0 -56.7 354.6 350.8
Black 0 0 0 0.0 0.0 0.0 0.0 n.a.
100% HDTV
Color Bars
R
mV
G
mV
B
mV
Y
mV
Pb
mV
Pr
mV
Chr. Level
mV
Chr. Phase
deg
White 700 700 700 700 0 0 0.0 n.a.
Yellow 700 700 0 650 -350 32 351.5 180.0
Cyan 0 700 700 551 81 -350 359.1 360.0
Green 0 700 0 501 -270 -318 416.7 180.0
Magenta 700 0 700 200 270 318 416.7 0.0
Red 700 0 0 149 -81 350 359.1 180.0
Blue 0 0 700 50 350 -32 351.5 360.0
Black 0 0 0 0 0 0 0.0 n.a.
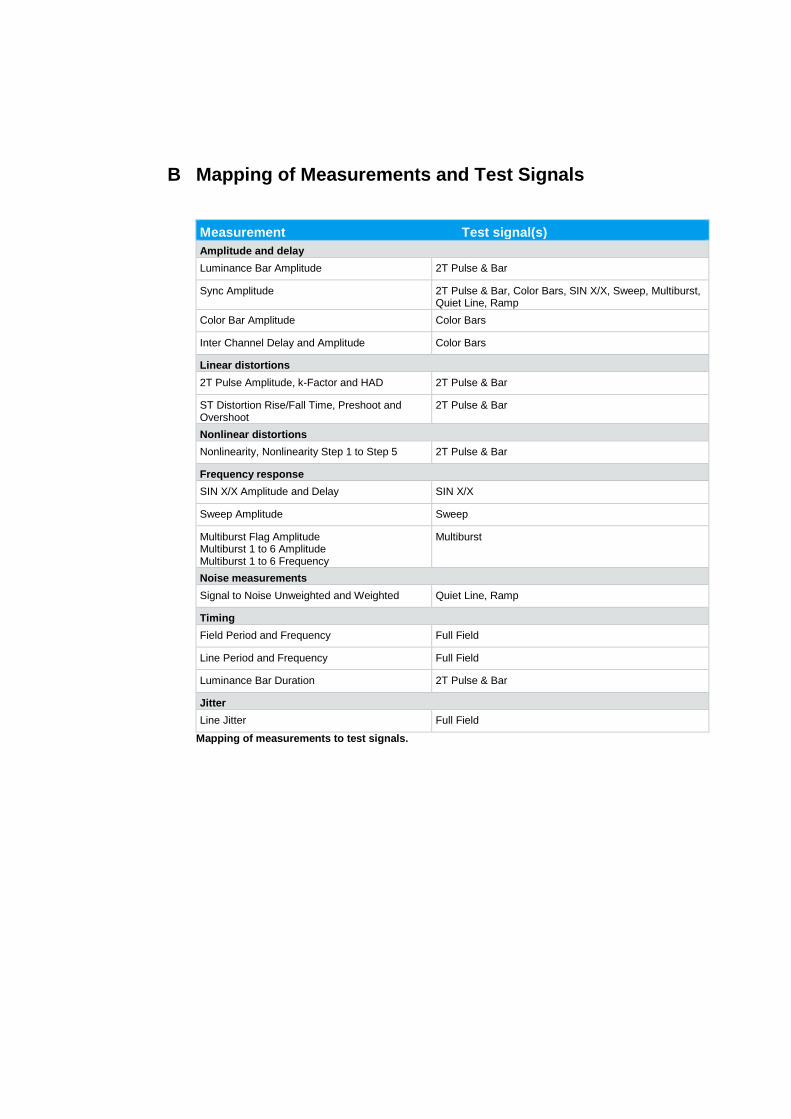
B Mapping of Measurements and Test Signals
Measurement Test signal(s)
Amplitude and delay
Luminance Bar Amplitude 2T Pulse & Bar
Sync Amplitude 2T Pulse & Bar, Color Bars, SIN X/X, Sweep, Multiburst, Quiet Line, Ramp
Color Bar Amplitude Color Bars
Inter Channel Delay and Amplitude Color Bars
Linear distortions
2T Pulse Amplitude, k-Factor and HAD 2T Pulse & Bar
ST Distortion Rise/Fall Time, Preshoot and Overshoot
2T Pulse & Bar
Nonlinear distortions
Nonlinearity, Nonlinearity Step 1 to Step 5 2T Pulse & Bar
Frequency response
SIN X/X Amplitude and Delay SIN X/X
Sweep Amplitude Sweep
Multiburst Flag Amplitude Multiburst 1 to 6 Amplitude Multiburst 1 to 6 Frequency
Multiburst
Noise measurements
Signal to Noise Unweighted and Weighted Quiet Line, Ramp
Timing
Field Period and Frequency Full Field
Line Period and Frequency Full Field
Luminance Bar Duration 2T Pulse & Bar
Jitter
Line Jitter Full Field
Mapping of measurements to test signals.
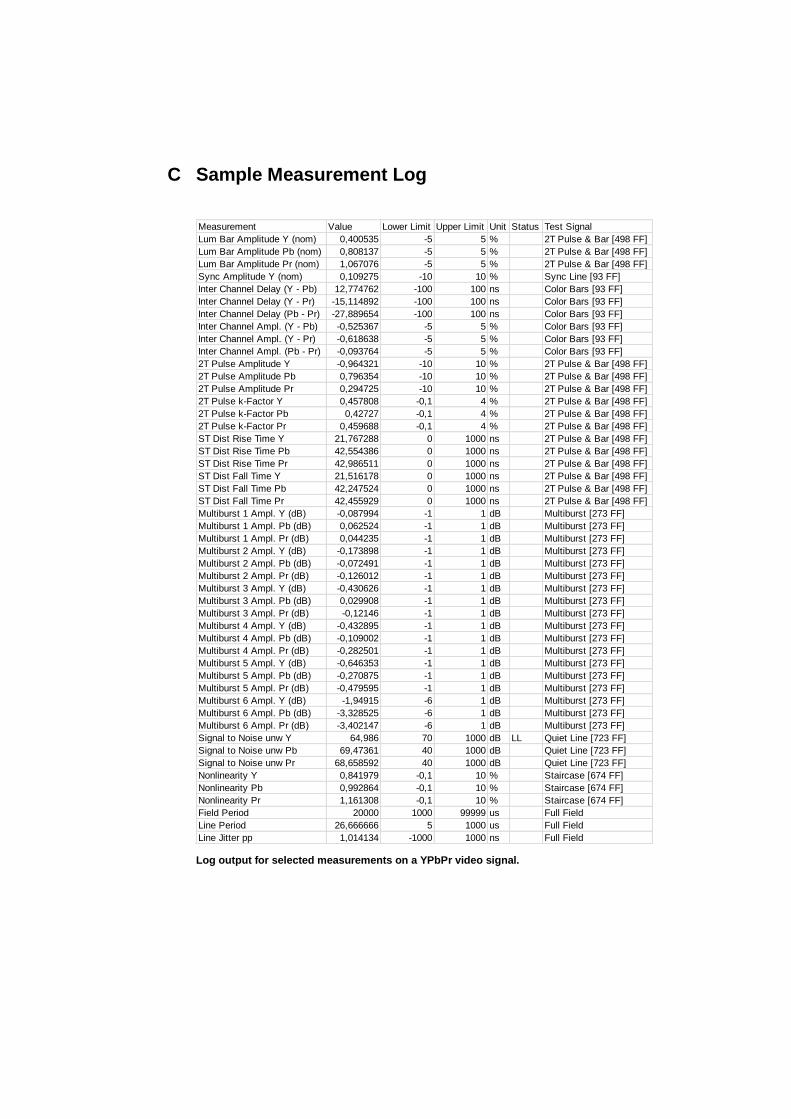
C Sample Measurement Log
Log output for selected measurements on a YPbPr video signal.
Measurement Value Lower Limit Upper Limit Unit Status Test Signal
Lum Bar Amplitude Y (nom) 0,400535 -5 5 % 2T Pulse & Bar [498 FF]
Lum Bar Amplitude Pb (nom) 0,808137 -5 5 % 2T Pulse & Bar [498 FF]
Lum Bar Amplitude Pr (nom) 1,067076 -5 5 % 2T Pulse & Bar [498 FF]
Sync Amplitude Y (nom) 0,109275 -10 10 % Sync Line [93 FF]
Inter Channel Delay (Y - Pb) 12,774762 -100 100 ns Color Bars [93 FF]
Inter Channel Delay (Y - Pr) -15,114892 -100 100 ns Color Bars [93 FF]
Inter Channel Delay (Pb - Pr) -27,889654 -100 100 ns Color Bars [93 FF]
Inter Channel Ampl. (Y - Pb) -0,525367 -5 5 % Color Bars [93 FF]
Inter Channel Ampl. (Y - Pr) -0,618638 -5 5 % Color Bars [93 FF]
Inter Channel Ampl. (Pb - Pr) -0,093764 -5 5 % Color Bars [93 FF]
2T Pulse Amplitude Y -0,964321 -10 10 % 2T Pulse & Bar [498 FF]
2T Pulse Amplitude Pb 0,796354 -10 10 % 2T Pulse & Bar [498 FF]
2T Pulse Amplitude Pr 0,294725 -10 10 % 2T Pulse & Bar [498 FF]
2T Pulse k-Factor Y 0,457808 -0,1 4 % 2T Pulse & Bar [498 FF]
2T Pulse k-Factor Pb 0,42727 -0,1 4 % 2T Pulse & Bar [498 FF]
2T Pulse k-Factor Pr 0,459688 -0,1 4 % 2T Pulse & Bar [498 FF]
ST Dist Rise Time Y 21,767288 0 1000 ns 2T Pulse & Bar [498 FF]
ST Dist Rise Time Pb 42,554386 0 1000 ns 2T Pulse & Bar [498 FF]
ST Dist Rise Time Pr 42,986511 0 1000 ns 2T Pulse & Bar [498 FF]
ST Dist Fall Time Y 21,516178 0 1000 ns 2T Pulse & Bar [498 FF]
ST Dist Fall Time Pb 42,247524 0 1000 ns 2T Pulse & Bar [498 FF]
ST Dist Fall Time Pr 42,455929 0 1000 ns 2T Pulse & Bar [498 FF]
Multiburst 1 Ampl. Y (dB) -0,087994 -1 1 dB Multiburst [273 FF]
Multiburst 1 Ampl. Pb (dB) 0,062524 -1 1 dB Multiburst [273 FF]
Multiburst 1 Ampl. Pr (dB) 0,044235 -1 1 dB Multiburst [273 FF]
Multiburst 2 Ampl. Y (dB) -0,173898 -1 1 dB Multiburst [273 FF]
Multiburst 2 Ampl. Pb (dB) -0,072491 -1 1 dB Multiburst [273 FF]
Multiburst 2 Ampl. Pr (dB) -0,126012 -1 1 dB Multiburst [273 FF]
Multiburst 3 Ampl. Y (dB) -0,430626 -1 1 dB Multiburst [273 FF]
Multiburst 3 Ampl. Pb (dB) 0,029908 -1 1 dB Multiburst [273 FF]
Multiburst 3 Ampl. Pr (dB) -0,12146 -1 1 dB Multiburst [273 FF]
Multiburst 4 Ampl. Y (dB) -0,432895 -1 1 dB Multiburst [273 FF]
Multiburst 4 Ampl. Pb (dB) -0,109002 -1 1 dB Multiburst [273 FF]
Multiburst 4 Ampl. Pr (dB) -0,282501 -1 1 dB Multiburst [273 FF]
Multiburst 5 Ampl. Y (dB) -0,646353 -1 1 dB Multiburst [273 FF]
Multiburst 5 Ampl. Pb (dB) -0,270875 -1 1 dB Multiburst [273 FF]
Multiburst 5 Ampl. Pr (dB) -0,479595 -1 1 dB Multiburst [273 FF]
Multiburst 6 Ampl. Y (dB) -1,94915 -6 1 dB Multiburst [273 FF]
Multiburst 6 Ampl. Pb (dB) -3,328525 -6 1 dB Multiburst [273 FF]
Multiburst 6 Ampl. Pr (dB) -3,402147 -6 1 dB Multiburst [273 FF]
Signal to Noise unw Y 64,986 70 1000 dB LL Quiet Line [723 FF]
Signal to Noise unw Pb 69,47361 40 1000 dB Quiet Line [723 FF]
Signal to Noise unw Pr 68,658592 40 1000 dB Quiet Line [723 FF]
Nonlinearity Y 0,841979 -0,1 10 % Staircase [674 FF]
Nonlinearity Pb 0,992864 -0,1 10 % Staircase [674 FF]
Nonlinearity Pr 1,161308 -0,1 10 % Staircase [674 FF]
Field Period 20000 1000 99999 us Full Field
Line Period 26,666666 5 1000 us Full Field
Line Jitter pp 1,014134 -1000 1000 ns Full Field
Rohde & Schwarz
The Rohde & Schwarz electronics group offers
innovative solutions in the following business fields:
test and measurement, broadcast and media, secure
communications, cybersecurity, radiomonitoring and
radiolocation. Founded more than 80 years ago, this
independent company has an extensive sales and
service network and is present in more than 70
countries.
The electronics group is among the world market
leaders in its established business fields. The
company is headquartered in Munich, Germany. It
also has regional headquarters in Singapore and
Columbia, Maryland, USA, to manage its operations
in these regions.
Regional contact
Europe, Africa, Middle East +49 89 4129 12345 [email protected] North America 1 888 TEST RSA (1 888 837 87 72) [email protected] Latin America +1 410 910 79 88 [email protected] Asia Pacific +65 65 13 04 88 [email protected]
China +86 800 810 82 28 |+86 400 650 58 96 [email protected]
Sustainable product design
ı Environmental compatibility and eco-footprint
ı Energy efficiency and low emissions
ı Longevity and optimized total cost of ownership
This application note and the supplied programs
may only be used subject to the conditions of use
set forth in the download area of the Rohde &
Schwarz website.
R&S® is a registered trademark of Rohde & Schwarz GmbH & Co.
KG; Trade names are trademarks of the owners.
Rohde & Schwarz GmbH & Co. KG
Mühldorfstraße 15 | 81671 Munich, Germany
Phone + 49 89 4129 - 0 | Fax + 49 89 4129 – 13777
www.rohde-schwarz.com
PA
D-T
-M: 3573.7
380.0
2/0
2.0
4/E
N/