testing a performance measurement framework for agri-food...
TRANSCRIPT
86 - Campinas,SP - August/2005
15th Congress - Developing Entrepreneurship Abilities to Feed the World in a Sustainable Way
testIng a performanCe measurement framework for agrI-fooD supplY ChaIns
Lusine Aramyan ¹Alfons Oude Lansink ²
Olaf van Kooten ³
abstraCtMeasurement of entire supply chain performance is an important issue, because it allows for
‘tracking and tracing’ of efficacy and efficiency failures and leads to more informed decision-making with regards to chain organization. The ultimate aim of implementing a performance measurement system is to improve the performance of the organization. If supply chains can get their performance measurement right, the data they generate will tell them where they are, how they are doing, and where they are going.
The choice of appropriate supply chain performance indicators is rather complicated due to presence of multiple inputs and multiple outputs in the system. This issue becomes even more problematic in the field of food and agribusiness due to specific characteristics of agri-food sup-ply chains. These difficulties require a shift in the focus of performance evaluation and bench-marking from characterising performance in terms of single measures to evaluating perfor-mance in a multidimensional systems perspective. Efforts as well as progress have been made in this area but supply chain performance measurement received little attention in the field of food and agribusiness. This paper presents a conceptual framework for selection performance measurement indicators for agri-food supply chain. Four main categories of performance mea-sures are identified as necessary components in agri-food supply chain performance measure-ment system. Each category contains set of performance indicators. Case study research has been designed in Dutch tomato supply chain to test the proposed conceptual framework.
key words: agri –food chain, indicator, performance, case study
IntroDuCtIonIn order to be able to asses the success of supply chains an adequate performance mea-
surement system needs to be developed. The basic purpose of any measurement system is to provide feedback, relative to the set of goals that increases organizations’ chances of achieving these goals efficiently and effectively. Recent studies have shown that performance indica-tors to measure supply chain performance that includes the characteristics of inclusiveness, universality, measurability and consistency are not available (Beamon, 1998). Evaluation of an organisation’s performance is complicated in the presence of multiple inputs and multiple outputs in the system. These aspects require a shift in the focus of performance evaluation and benchmarking from characterizing performance in terms of single measures to evaluating per-formance as a multidimensional systems perspective (Zhu, 2002). Lee and Billington (1992) found that supply chains do not have an adequate performance metrics and firms only aim at achieving their own performance standards. There is less agreement, however, on the matter of what such a system should look like. According to Bunte et al. (1998) performance indicators should relate to both effectiveness and efficiency of the supply chain and its actors. Van der Vorst (2000) makes a distinction for performance indicators on three main levels: supply chain
¹PhD researcher in Business Economics (e-mail: [email protected])² PhD professor of Business Economics at Wageningen University (e-mail: [email protected])³ Chair of the Horticultural Production Chains group at Wageningen University (e-mail: [email protected])
Campinas,SP-August/2005-87
IFMA 2005 - Brazil
level, organization level and process level. Beamon (1999) suggests a system of three dimen-sions: resources, output and flexibility.
Measuring the performance of chains and networks received little attention in the field of food and agribusiness. Agri-food supply chains have many specifications, which set them apart from other types of supply chains. Examples are: 1) Shelf life constraints for raw materials and perishability of product, 2) Long production throughput time 3) Seasonality in production 4) Physical product features like sensory properties such as taste, odour, appearance colour, size and image 5) Requires conditioned transportation and storage; 6) Product safety issues and many more.
Recent socio-economic developments have resulted in a change in performance require-ments for food supply chains as a whole and for all stages in the supply chain (Van der Vorst, 2000). This change is the result of the variation in buying behaviour of consumers. Besides the consumers’ preference variation, environment plays a vital role in agri-food supply chain per-formance assessment. The environmental variability affects the quantity and the quality of the farm products. The perishability of products put strains on logistics and quality management. Given these facts it is obvious that food quality and environmental issues have a great impact on agri-food supply chain performance. Thus, when developing a performance measurement system for agri-food supply chains, the indicators that reflect the quality aspects of product and processes are important (freshness, food safety, environmental issues, etc.) and together with other indicators, should be included into a performance measurement system.
Recently Aramyan et al. (2005) developed a conceptual framework of performance mea-surement system for agri-food supply chains, which captures the characteristics of agri-food supply chain as well as other financial and non-financial indicators. The goal of this study is to test the developed conceptual framework for measuring the performance of agri-food supply chains that can be adapted to different decision-makers and decisions to be made.
The paper is organized as follows. In the next section the details of the conceptual frame-work are briefly discussed followed by the case study description and methods used to carry out the research. Next, the results of the case study are analysed for each member of the supply chain separately. The paper ends with conclusions and discusses areas for future research.
DevelopIng a ConCeptual frameworkThis section develops a conceptual framework for measuring performance of agri-food sup-
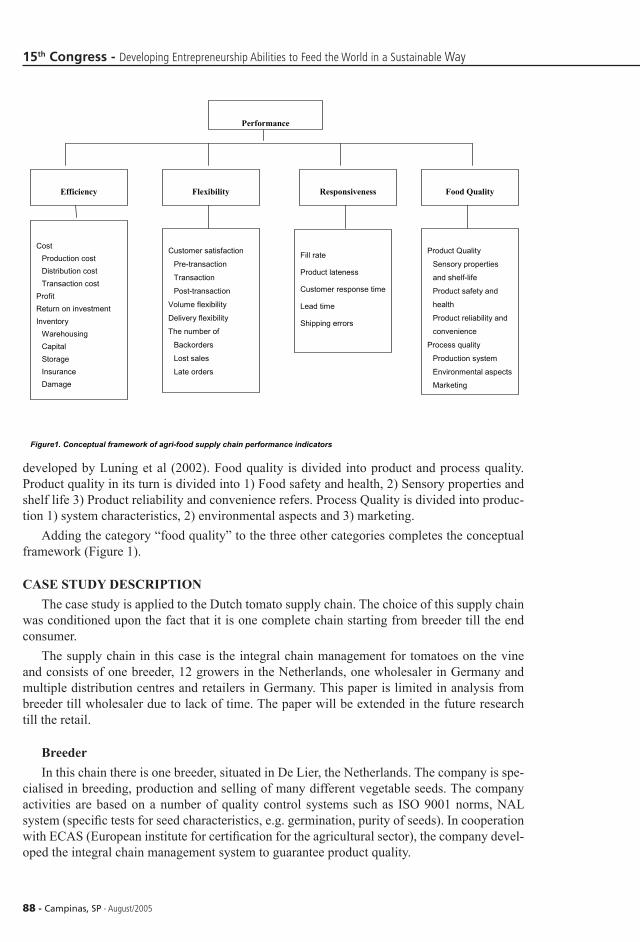
ply chains. Based on the literature review on existing performance indicators a conceptual framework for measuring performance of agri-food supply chains has been developed (Ara-myan et al., 2005). The framework takes into consideration specific characteristics of agri-food supply chains. The agri-food supply chain performance indicators are grouped in four main cat-egories: efficiency, flexibility, responsiveness and food quality. These main categories contain more detailed performance indicators (Figure 1). Efficiency aim to maximise value added by the process and minimise the cost absorbed in inventories. It includes several measures, but the most important ones are cost minimisation, profit maximisation and return on investment maxi-misation. Flexibility indicates the degree to which the supply chain can respond to a changing environment. It may include customer satisfaction, reduction in the number of backorders, lost sales, late order. Responsiveness aims at a high level of customer service and may include fill rate maximisation, product lateness minimisation, customer response time minimization, lead time minimization, error shipping, and customer complaints.
The specific characteristics of agri-food supply chains are captured in the measurement framework in category “food quality”. The latter is based on the framework of food quality
88 - Campinas,SP - August/2005
15th Congress - Developing Entrepreneurship Abilities to Feed the World in a Sustainable Way
developed by Luning et al (2002). Food quality is divided into product and process quality. Product quality in its turn is divided into 1) Food safety and health, 2) Sensory properties and shelf life 3) Product reliability and convenience refers. Process Quality is divided into produc-tion 1) system characteristics, 2) environmental aspects and 3) marketing.
Adding the category “food quality” to the three other categories completes the conceptual framework (Figure 1).
Case stuDY DesCrIptIonThe case study is applied to the Dutch tomato supply chain. The choice of this supply chain
was conditioned upon the fact that it is one complete chain starting from breeder till the end consumer.
The supply chain in this case is the integral chain management for tomatoes on the vine and consists of one breeder, 12 growers in the Netherlands, one wholesaler in Germany and multiple distribution centres and retailers in Germany. This paper is limited in analysis from breeder till wholesaler due to lack of time. The paper will be extended in the future research till the retail.
breeder In this chain there is one breeder, situated in De Lier, the Netherlands. The company is spe-
cialised in breeding, production and selling of many different vegetable seeds. The company activities are based on a number of quality control systems such as ISO 9001 norms, NAL system (specific tests for seed characteristics, e.g. germination, purity of seeds). In cooperation with ECAS (European institute for certification for the agricultural sector), the company devel-oped the integral chain management system to guarantee product quality.
Figure1. Conceptual framework of agri-food supply chain performance indicators
Performance
Efficiency Flexibility Responsiveness Food Quality
CostProduction costDistribution costTransaction cost
ProfitReturn on investmentInventory
WarehousingCapitalStorageInsuranceDamage
Customer satisfaction
Pre-transaction
Transaction
Post-transaction
Volume flexibility
Delivery flexibility
The number of
Backorders
Lost sales
Late orders
Fill rate
Product lateness
Customer response time
Lead time
Shipping errors
Product Quality
Sensory properties
and shelf-life
Product safety and
health
Product reliability and
convenience
Process quality
Production system
Environmental aspects
Marketing

Campinas,SP-August/2005-89
IFMA 2005 - Brazil
growersIn this chain there are 12 tomato growers who grow tomatoes situated in the South of the
Netherlands. Together they add up to an area of 24.35 hectares of tomatoes. In total 7 growers agreed to participate in interview. All interviewed growers cultivate 100% tomato except for one grower who cultivate 50% tomato. Quality standards used by the growers are integral chain man-agement, Integrierte Anbau (German control system of integrated cultivation) and Eurep GAP.
wholesalerThe wholesaler involved in this supply chain is a vegetable wholesaler in Weeze, Germany.
The company is working on certification according to the International Food Standard (IFS). The company delivers half of the production to supermarkets in Germany (3000 supermarkets in total).The share of tomatoes in total sales is 25%.
methoDThe source of information are interviews with 1) a chain manager in a breeding company 2)
owner-growers in seven tomato producing firms, 3) wholesaler in wholesale company. The type of interview is a focused interview (Yin, 1994), in which the interview consists of open-ended questions and a set of questions in the form of questionnaire. The first part of questionnaire includes general open-ended questions to become familiar with the firm. In the second part of the questionnaire respondents are given definitions of possible performance indicators that can be integrated into a performance measurement system. Respondents were given the opportuni-ties to suggest new indicators and/or to reject the proposed ones and to provide suggestions for better (practically possible) ways to measure the suggested indicators. Next, the respondents were asked to rank the listed indicators of performance according to the perceived importance for their firm. The used ranking method is interval ranking (Churchill, 1999). A Likert scale of 1 to 5 was used with 1 being not important at all for measuring performance and 5 being very important. In order to compare the final ranking average and standard deviation of the relative importance weights of indicators were calculated for each respondent. Relative importance weights correct for differences in levels between respondents and for unequal observations per respondent (Calker, 2004). The cause of such differences in levels between respondents is an outcome of different perception of respondents to a Likert scale, e.g. some respondents incline to give only scores 4 or 5 to all indicators, the others 2 or 3. The relative importance weight ,
for indicator i, respondent j, was calculated as follows:
where
= the value of indicator i for respondent j
= The average ranking of all indicators for respondent j
This procedure has been done only for growers, given that the number of breeder and wholesaler in chain equals to one.
( )( )j
ijij X
XW =
( )( )j
ijij X
XW = ( )
( )jij
ij XX
W =
( )( )j
ijij X
XW =
90 - Campinas,SP - August/2005
15th Congress - Developing Entrepreneurship Abilities to Feed the World in a Sustainable Way
results of Case stuDYResults of the case study are found in tables 1, 2 and 3. Analyses of results are presented
separately for each link of the supply chain.
breeDer
Category Efficiency Results shows that four indicators of efficiency out of five are important in measuring the
performance of the firm (see table 1). Suggested indicators for efficiency were costs (PRODC, TRANSC) profit (PROFIT), return on investments (ROI) and inventory (INVENT). All sug-gested indicators are measured in the company. Transaction costs are measured partly, e.g. costs for searching new clients are calculated and included in general costs. Respondent remains indifferent for transaction costs, arguing that these costs do not have much influence on perfor-mance. Unlike the growers, breeder emphasized the importance of inventory costs. They have high storage cost, including insurance, because seeds in storage are very expensive.
Category flexibility Suggested indicators for category flexibility were Customer satisfaction (CUSSAT), Vol-
ume flexibility (VF), Delivery flexibility (DF), the number of backorder (BACK), lost sales (LOSTS) and late orders (LATOR). From table 1 it is obvious that CUSTSAT is the most important indicator of performance. Initially CUSTSAT was divided into 3 phases: pre- trans-action, transaction satisfaction and post-transaction satisfaction. Interview reveals that only CUSTSAT in pre-transaction phase is calculated. Company has registered complaints system for customers. By that system the CUSTSAT is measured. In this phase breeder looks at, e.g. willingness to customize service, which is changes in orders due to customer requirements. Occasionally breeder performs a customer research to ask for satisfaction of growers, their opinion about breeder, their image, reliability and so on.
Although DF is important for measuring performance, the company does not measure it. The company has a list of prior customers, which is used in case if rush order takes place. VF is calculated, taking into account a plan of expected sales. At the end of the year actual sales are compared with planning. Breeder is indifferent about reduction in number of backorders. According to respondent lost sales do not happen, because the product is too valuable.
Category responsivenessSuggested indicators for the category responsiveness are fill rate (FILRATE), product
lateness (PRLATNES), customer response (CRT), lead time (LEADT), customer complaints (CUSCOMP) shipping errors (SHIPER). Table 1 shows that the most important indicator is product lateness, scoring a value 5 and the least important indicator is shipping errors scoring a value 3. From all suggested indicators, three are used in the company: lead time (with the help of planning), customer response time (by sending out questionnaire to customers) and customer complaints ( all complaints are registered).
product QualitySuggested indicators for food quality were: appearance (APPEAR), colour (COLOR), firm-
ness( FIRMNES), size and form( SIZEFORM), taste (TASTE), shelf life ( SHELFL), salubrity( SALUBR), safety(SAFETY), certified product(CERTIFPR), product reliability(PRODREL), convenience in information on packaging(CONVEN). These indicators fall into three subcat-
Campinas,SP-August/2005-91
IFMA 2005 - Brazil
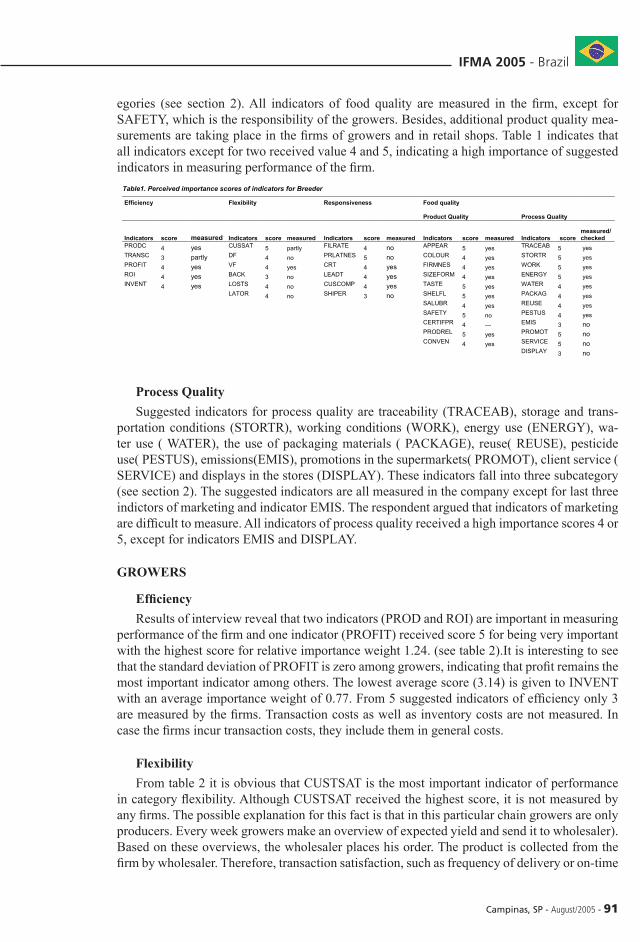
egories (see section 2). All indicators of food quality are measured in the firm, except for SAFETY, which is the responsibility of the growers. Besides, additional product quality mea-surements are taking place in the firms of growers and in retail shops. Table 1 indicates that all indicators except for two received value 4 and 5, indicating a high importance of suggested indicators in measuring performance of the firm.
process QualitySuggested indicators for process quality are traceability (TRACEAB), storage and trans-
portation conditions (STORTR), working conditions (WORK), energy use (ENERGY), wa-ter use ( WATER), the use of packaging materials ( PACKAGE), reuse( REUSE), pesticide use( PESTUS), emissions(EMIS), promotions in the supermarkets( PROMOT), client service ( SERVICE) and displays in the stores (DISPLAY). These indicators fall into three subcategory (see section 2). The suggested indicators are all measured in the company except for last three indictors of marketing and indicator EMIS. The respondent argued that indicators of marketing are difficult to measure. All indicators of process quality received a high importance scores 4 or 5, except for indicators EMIS and DISPLAY.
growers
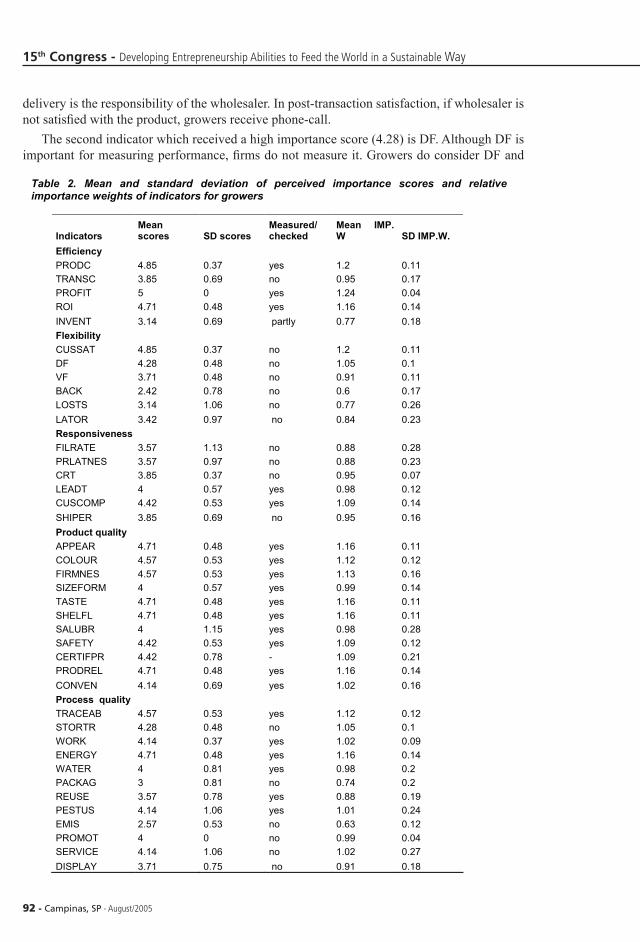
Efficiency Results of interview reveal that two indicators (PROD and ROI) are important in measuring
performance of the firm and one indicator (PROFIT) received score 5 for being very important with the highest score for relative importance weight 1.24. (see table 2).It is interesting to see that the standard deviation of PROFIT is zero among growers, indicating that profit remains the most important indicator among others. The lowest average score (3.14) is given to INVENT with an average importance weight of 0.77. From 5 suggested indicators of efficiency only 3 are measured by the firms. Transaction costs as well as inventory costs are not measured. In case the firms incur transaction costs, they include them in general costs.
flexibility From table 2 it is obvious that CUSTSAT is the most important indicator of performance
in category flexibility. Although CUSTSAT received the highest score, it is not measured by any firms. The possible explanation for this fact is that in this particular chain growers are only producers. Every week growers make an overview of expected yield and send it to wholesaler). Based on these overviews, the wholesaler places his order. The product is collected from the firm by wholesaler. Therefore, transaction satisfaction, such as frequency of delivery or on-time
Table1. Perceived importance scores of indicators for Breeder
Efficiency Flexibility Responsiveness Food quality
Product Quality Process Quality
Indicators score measured Indicators score measured Indicators score measured Indicators score measured Indicators scoremeasured/checked
PRODC 4 yes CUSSAT 5 partly FILRATE 4 no APPEAR 5 yes TRACEAB 5 yesTRANSC 3 partly DF 4 no PRLATNES 5 no COLOUR 4 yes STORTR 5 yesPROFIT 4 yes VF 4 yes CRT 4 yes FIRMNES 4 yes WORK 5 yesROI 4 yes BACK 3 no LEADT 4 yes SIZEFORM 4 yes ENERGY 5 yesINVENT 4 yes LOSTS 4 no CUSCOMP 4 yes TASTE 5 yes WATER 4 yes
LATOR 4 no SHIPER 3 no SHELFL 5 yes PACKAG 4 yesSALUBR 4 yes REUSE 4 yesSAFETY 5 no PESTUS 4 yesCERTIFPR 4 --- EMIS 3 noPRODREL 5 yes PROMOT 5 noCONVEN 4 yes SERVICE 5 no
DISPLAY 3 no
92 - Campinas,SP - August/2005
15th Congress - Developing Entrepreneurship Abilities to Feed the World in a Sustainable Way
delivery is the responsibility of the wholesaler. In post-transaction satisfaction, if wholesaler is not satisfied with the product, growers receive phone-call.
The second indicator which received a high importance score (4.28) is DF. Although DF is important for measuring performance, firms do not measure it. Growers do consider DF and
Table 2. Mean and standard deviation of perceived importance scores and relativeimportance weights of indicators for growers
IndicatorsMeanscores SD scores
Measured/checked
Mean IMP.W SD IMP.W.
EfficiencyPRODC 4.85 0.37 yes 1.2 0.11TRANSC 3.85 0.69 no 0.95 0.17PROFIT 5 0 yes 1.24 0.04ROI 4.71 0.48 yes 1.16 0.14INVENT 3.14 0.69 partly 0.77 0.18FlexibilityCUSSAT 4.85 0.37 no 1.2 0.11DF 4.28 0.48 no 1.05 0.1VF 3.71 0.48 no 0.91 0.11BACK 2.42 0.78 no 0.6 0.17LOSTS 3.14 1.06 no 0.77 0.26LATOR 3.42 0.97 no 0.84 0.23ResponsivenessFILRATE 3.57 1.13 no 0.88 0.28PRLATNES 3.57 0.97 no 0.88 0.23CRT 3.85 0.37 no 0.95 0.07LEADT 4 0.57 yes 0.98 0.12CUSCOMP 4.42 0.53 yes 1.09 0.14SHIPER 3.85 0.69 no 0.95 0.16Product qualityAPPEAR 4.71 0.48 yes 1.16 0.11COLOUR 4.57 0.53 yes 1.12 0.12FIRMNES 4.57 0.53 yes 1.13 0.16SIZEFORM 4 0.57 yes 0.99 0.14TASTE 4.71 0.48 yes 1.16 0.11SHELFL 4.71 0.48 yes 1.16 0.11SALUBR 4 1.15 yes 0.98 0.28SAFETY 4.42 0.53 yes 1.09 0.12CERTIFPR 4.42 0.78 - 1.09 0.21PRODREL 4.71 0.48 yes 1.16 0.14CONVEN 4.14 0.69 yes 1.02 0.16Process qualityTRACEAB 4.57 0.53 yes 1.12 0.12STORTR 4.28 0.48 no 1.05 0.1WORK 4.14 0.37 yes 1.02 0.09ENERGY 4.71 0.48 yes 1.16 0.14WATER 4 0.81 yes 0.98 0.2PACKAG 3 0.81 no 0.74 0.2REUSE 3.57 0.78 yes 0.88 0.19PESTUS 4.14 1.06 yes 1.01 0.24EMIS 2.57 0.53 no 0.63 0.12PROMOT 4 0 no 0.99 0.04SERVICE 4.14 1.06 no 1.02 0.27DISPLAY 3.71 0.75 no 0.91 0.18
Campinas,SP-August/2005-93
IFMA 2005 - Brazil
always put rush orders in the first place. However, there are no records of them. VF is not cal-culated. The major intention of growers is to produce as much as possible, even if the demand for the product is very low and they make losses. One of the explanations for this is that they are restricted by the size of glasshouse. Yet another explanation is that with agricultural produc-tion it is very difficult to predict the volume even having data from previous years, due to e.g. weather uncertainty.
Reduction in BACK, LOSTS and LATOR are not calculated. These indicators also received the lowest scores of importance ranging between 2.42 and 3.42. These answers are explained by the fact that the wholesaler takes care of products collection and transportation. Therefore, these indicators are more important for wholesalers, than for growers.
CategorY responsIvenessFrom table 2 we can see that the most important indicators are CUSCOMP (4.42) and
LEADT (4). From all suggested indicators, only two are used in the firms: lead time and cus-tomer complaints. In general growers think that this part is more applicable to wholesaler, because wholesaler collects products; thus growers are not responsible for logistic.
product QualityAll sensory properties mentioned are measured by breeder four times per year at growers’
firms and at supermarkets. Twice per year KCB (Dutch Quality Control Bureau) also provides quality checks of products. From Table 2 we can see that all product quality indicators received high perceived importance (ranging from 4.00 till 4.71) scores and high average relative impor-tance weight scores (ranging from 0.98 till 1.16). In order to increase the product quality respon-dents indicated the importance of feedback from wholesaler about the customer complaints.
process QualityFrom table 2 we can see that 8 indicators obtained a high importance score, 3 indicators
(PACKAG, REUSE and DISPLAY) received indifferent importance sore and one indicator (EMIS) is perceived to be unimportant. Energy use (ENERGY) is perceived to be the most im-portant indicator in this category due to high share of energy costs in total costs. At the current moment growers do not have restrictions on energy use (or CO2 emissions) from government, but it is expected on 2010. The glasshouse sector signed an agreement with the government aiming at reducing the use of energy. However it is not on firm level, but it is in sector level, which makes grower not very much concerned.
wholesaler
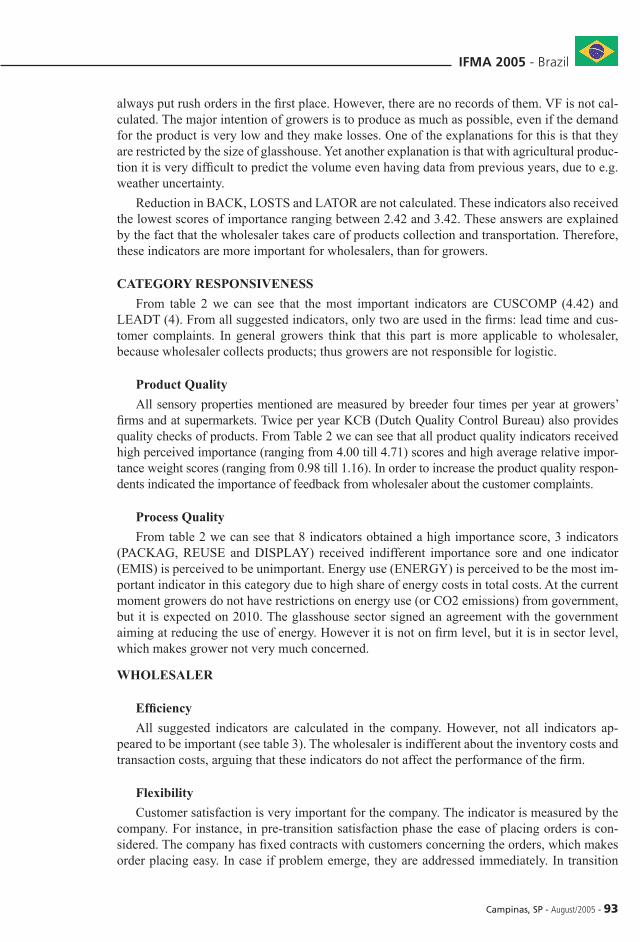
Efficiency All suggested indicators are calculated in the company. However, not all indicators ap-
peared to be important (see table 3). The wholesaler is indifferent about the inventory costs and transaction costs, arguing that these indicators do not affect the performance of the firm.
flexibility Customer satisfaction is very important for the company. The indicator is measured by the
company. For instance, in pre-transition satisfaction phase the ease of placing orders is con-sidered. The company has fixed contracts with customers concerning the orders, which makes order placing easy. In case if problem emerge, they are addressed immediately. In transition
94 - Campinas,SP - August/2005
15th Congress - Developing Entrepreneurship Abilities to Feed the World in a Sustainable Way
satisfaction phase the frequency of delivery is measured. In post-transaction satisfaction phase, wholesaler takes a responsibility of damage adjustment.
The attitude to the DF and VF is the same as in two previous links. They are not calculated, although they score a high value of importance. Rush orders are done in the first place. Re-duction in number of backorders, lost sales and late orders are registered for short-term. The respondent is in different about backorders and lost sales, because it rarely happens.
responsivenessFrom all suggested indicators of responsiveness, only CUSCOMP received a low score (in-
different). Surprisingly, the company does not pay much attention on customer complaints. Fill rate is calculated and it is very important. PRLATENES is not calculated, though it is consid-ered very important. The respondent explained the contradiction by the argument that product has to be in time, no mistakes are allowed and usually do not happen. The remaining indicators in category responsiveness are calculated by the firm and received high score of importance (see table 3).
product QualityFrom table 3 we can see that all indicators of product quality received very high scores
of importance, indicating that the company takes product quality very serious. All indicators are measured except (for SALUB) in the company by quality inspectors of the company. The indicators PRODREL and CONVEN are checked by KCB. SHELFL is measured, with grow-ers group every month. SAFETY is registered according to rules in quality checks by Food Compass.
process QualityCompared to the previous category the scores of the different indicators in this category
are more varied (see table 3). From 10 suggested indicators, 5 received high importance scores and 3 indicators (REUSE, SERVICE and DISPLAY) received indifferent importance scores and one indicator (WATER) is perceived to be unimportant. The perceived unimportance is explained by the fact water is hardly used in the company.
Although plastic boxes are reused and carton boxes are recycled, the company does not measure these indicators. The respondent explained that the value of reuse/recycle is very small and do not affect the total production. The company has no constraints from government con-cerning emissions which explains why the respondent is indifferent about this indicator. Indica-
Table3. Perceived importance scores of indicators for Wholesaler
Efficiency Flexibility Responsiveness Food quality
Product Quality Process Quality
Indicators score measured Indicators score measured Indicators score measured Indicators scoreMeasured/checked Indicators score
Measured/checked
DISTRC 4 yes CUSSAT 5 yes FILRATE 5 yes APPEAR 5 yes TRACEAB 5 yes
TRANSC 3 yes DF5 no PRLATNES 5 no
COLOUR5 yes
STORTR5 yes
PROFIT 5 yes VF4 no
CRT4 no
FIRMNES5 yes
WORK4 yes
ROI 4 yes BACK3 registered
LEADT4 yes SIZEFORM 5 yes
ENERGY4 yes
INVENT 3 yes LOSTS3 registered CUSCOMP 3 yes
TASTE5 yes
WATER2 yes
LATOR4 registered SHIPER 4 yes
SHELFL5 yes
PACKAG4 yes
SALUBR5 no
REUSE3 yes
SAFETY4 yes
EMIS3 no
CERTIFPR 5 -PROMOT
5 noPRODREL 5 yes
SERVICE3 no
CONVEN 4 yes DISPLAY 5 no
Campinas,SP-August/2005-95
IFMA 2005 - Brazil
tors for marketing (PROMOT, SERVICE and DISPLAY) are not measured by the company, because it is too difficult to measure, which is in line with the answer of the breeder.
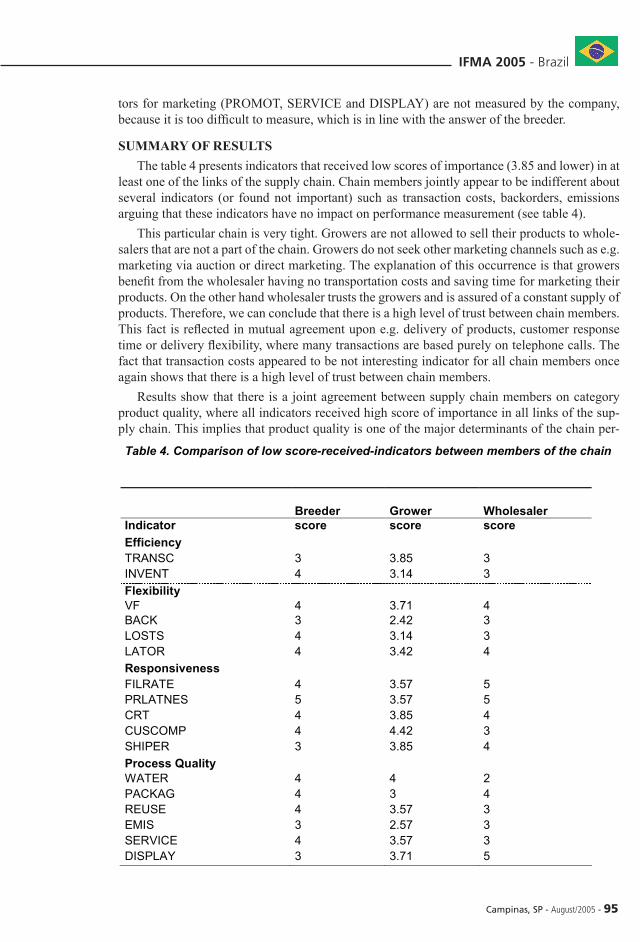
summarY of resultsThe table 4 presents indicators that received low scores of importance (3.85 and lower) in at
least one of the links of the supply chain. Chain members jointly appear to be indifferent about several indicators (or found not important) such as transaction costs, backorders, emissions arguing that these indicators have no impact on performance measurement (see table 4).
This particular chain is very tight. Growers are not allowed to sell their products to whole-salers that are not a part of the chain. Growers do not seek other marketing channels such as e.g. marketing via auction or direct marketing. The explanation of this occurrence is that growers benefit from the wholesaler having no transportation costs and saving time for marketing their products. On the other hand wholesaler trusts the growers and is assured of a constant supply of products. Therefore, we can conclude that there is a high level of trust between chain members. This fact is reflected in mutual agreement upon e.g. delivery of products, customer response time or delivery flexibility, where many transactions are based purely on telephone calls. The fact that transaction costs appeared to be not interesting indicator for all chain members once again shows that there is a high level of trust between chain members.
Results show that there is a joint agreement between supply chain members on category product quality, where all indicators received high score of importance in all links of the sup-ply chain. This implies that product quality is one of the major determinants of the chain per-
Table 4. Comparison of low score-received-indicators between members of the chain
Breeder Grower WholesalerIndicator score score scoreEfficiencyTRANSC 3 3.85 3INVENT 4 3.14 3FlexibilityVF 4 3.71 4BACK 3 2.42 3LOSTS 4 3.14 3LATOR 4 3.42 4ResponsivenessFILRATE 4 3.57 5PRLATNES 5 3.57 5CRT 4 3.85 4CUSCOMP 4 4.42 3SHIPER 3 3.85 4Process QualityWATER 4 4 2PACKAG 4 3 4REUSE 4 3.57 3EMIS 3 2.57 3SERVICE 4 3.57 3DISPLAY 3 3.71 5
96 - Campinas,SP - August/2005
15th Congress - Developing Entrepreneurship Abilities to Feed the World in a Sustainable Way
formance. There is a high level of agreement between chain members on category efficiency. The disagreement is reflected on only one indicator, which is inventory. Inventory costs are important for breeder given a large amount of expensive seeds kept in the storage for long time-period, which increases the costs of warehousing. A wholesaler sells its whole stock within one day. Agreement among chain members in category efficiency one more times shows that the costs remain one of the major concerns for measuring supply chain performance.
There is less agreement between chain members on importance of categories flexibility, responsiveness and process quality. Indicators in these categories such as e.g. fill rate, product lateness, customer complaints, water use, packaging, display in the stores, etc. (see table 4) received different importance perception in different links of the chain. Fill rate is not very interesting ifor growers, because wholesaler is responsible for transportation. The same goes for product lateness. Surprisingly customer complaints received low score at wholesaler, while breeder and growers find this indicator more important. During the interview growers explained that they would appreciate to have feedback information about customer complaints. Obviously growers lack information from the end of the chain. Water use and packaging received different scores in different links, because of differences in use of these indicators in different links.
ConClusIons anD DIsCussIonsThis paper tests a conceptual framework for selection performance measurement indicators
for agri-food supply chain. Summarizing all results it became obvious that four main catego-ries of performance measures suggested in the conceptual framework are confirmed as the necessary components in agri-food supply chain performance measurement system. Some of the suggested indicators within these categories such as e.g. transaction costs, backorders or emissions are proved to be not important for measuring the performance of the chain. Some of the suggested indicators e.g. production costs, profit, customer satisfaction and product quality indicators are very important for all members of supply chain. Chain members disagree about the importance of several indicators, e.g. fill rate, water use. Therefore, the framework can be adjusted to each member of the chain, based on the importance of the given indicators for each chain member. Namely, by using four main categories (efficiency, flexibility, responsiveness and food quality) integrated into one measurement system, chain members have the choice to include/exclude suggested indicators in the system based on their own perceptions about the importance of these indicators.
In order to have a complete view of how should measurement system look like for entire supply chain, for the future research the case study needs to be extended till the retail. Further-more, in order to test the applicability of this framework to real world an empirical research needs to be carried out. One of the suitable methods of analysis could be Multi Criteria Deci-sion Making approach.
referenCesAramyan, L., Ondersteijn, Ch., Van Kooten O., Oude Lansink, A.( 2005).Performance
Indicators in agri-food production chains. In Press. In C. Ondersteijn et al (Ed.), “Quantifying Supply Chains”, Kluwer Academic Publisher, Dordrecht, The Netherlands.
Beamon, B. M., 1998. Supply chain design and analysis: Models and methods. Interna-tional Journal of Production Economics 55, 281-294.
Beamon, B. M, 1999. Measuring supply chain performance. International Journal of Op-erations and Production Management 19(3), 275-292.
Campinas,SP-August/2005-97
IFMA 2005 - Brazil
Bunte, F., Mulder, M., Van Tongeren, F., and De Vlieger, K. (1998). Meting van de ‘per-formance’ van agrarische productiekolommen. LEI-onderzoeksverslag 163, Den Haag.
Churchill, G.A.(1999). Marketing research: Methodological foundations. Orlando: The Dryden Press, 1017pp.
Disco, A.(2004). Scoren op kwaliteit eist doorzettingsvermogen. Groeten & Fruit, week 48, pp18-19.
Luning, P.A., Marcelis, W.J., Jongen, W.M.F., 2002. Food Quality Management: a techno managerial approach Wageningen Academic Publishers, The Netherlands.
ECAS, 2003. Certificatieschema ‘IKZ®’. Integrale ketenzorg, versie 2, 23p.
Van Calker, K.J., Berensten, P.B., Giesen, G.W., and Huirne, R.B.( 2005). Identifying and ranking attributes that determine sustainability in Dutch dairy farming. Agriculture and Human Values 22, 53-63.
Van der Vorst, J.G.A.J., 2000. Effective Food Supply Chains. Generating, modelling and evaluation supply chain scenarios. PhD thesis Wageningen University, The Netherlands.
Yin, R.K. ( 1994). Case study research. Design and methods. Applied Social Research Methods Series, volume 5, second edition. Thousands Oaks, London.
Zhu, J., (2003). Quantitative models for performance evaluation and benchmarking. Klu-
wer Academic Publishers, Dordrecht.