temporal persistence of spatial patterns in throughfall · temporal persistence of spatial patterns...
TRANSCRIPT
Temporal persistence of spatial patterns in throughfall
R.F. Keima,*, A.E. Skaugsetb, M. Weilerc
aSchool of Renewable Natural Resources, Louisiana State University, LSU AgCenter, Baton Rouge, LA 70803, USAbDepartment of Forest Engineering, Oregon State University, Corvallis, OR 97331, USA
cDepartments of Forest Resources Management and Geography, University of British Columbia, Vancouver, BC V6T 1Z4, Canada
Received 4 November 2003; revised 10 January 2005; accepted 18 March 2005
Abstract
Spatial and temporal variability of throughfall beneath forests are potentially important controls on soil processes, watershed
hydrology, and biogeochemistry. We used a set of 94 rain gauges to measure variability of throughfall beneath three forest
stands in the Pacific Northwest, USA. The length scale over which throughfall amounts were correlated (spatial correlation
lengths) was between one-half- and one crown diameter in mid-age and old stands of conifers. In a deciduous stand, the spatial
correlation length was about one crown diameter when in leaf condition and throughfall was not correlated spatially in leaf-off
condition. Spatial patterns of storm-total throughfall were temporally stable in two ways: semivariograms, which provide a
measure of the continuity of a spatial phenomenon, were similar among storms, and throughfall amounts of an individual gauge
could be predicted relative to the plot average. Time stability plots of throughfall amounts, normalized with respect to mean and
variance, were useful for comparing temporal persistence of spatial throughfall variability among stands. Together,
semivariograms and time stability plots appear to be suitable descriptors of throughfall variability for modeling water flux at the
soil surface.
q 2005 Elsevier B.V. All rights reserved.
Keywords: Throughfall; Canopy interception; Spatial variability; Geostatistics
1. Introduction
An important effect of forest canopies on precipi-
tation is spatial redistribution that occurs by through-
fall and stemflow. Spatial variation in infiltration
influences spatial variation in a range of physical,
0022-1694/$ - see front matter q 2005 Elsevier B.V. All rights reserved.
doi:10.1016/j.jhydrol.2005.03.021
* Corresponding author. Tel.: C1 225 578 4169; fax: C1 225 578
4227.
E-mail addresses: [email protected] (R.F. Keim), arne.skaugset@
oregonstate.edu (A.E. Skaugset), [email protected] (M.
Weiler).
chemical, and biological processes, including soil
moisture (Eschner, 1967; Bouten et al., 1992; Si,
2002; Zhou, et al., 2002; Schume et al., 2003; Raat
et al., 2002), pedogenesis (Buol et al., 1989; Baba
and Okazak, 1999), nutrient cycling (Chang and
Matzner, 2000), root growth (Ford and Deans, 1978),
composition of the forest floor (Mottonen et al., 1999),
soil solution chemistry (Manderscheid and Matzner,
2000), groundwater chemistry (Bottcher et al., 1997),
and streamwater chemistry (Beier, 1998). The spatial
and temporal variability of throughfall therefore is
potentially an important control on watershed
Journal of Hydrology 314 (2005) 263–274
www.elsevier.com/locate/jhydrol
R.F. Keim et al. / Journal of Hydrology 314 (2005) 263–274264
hydrology and biogeochemistry (Zirlewagen and von
Wilpert, 2001).
Previous work has identified lateral flow on stems
and branches, differential accumulation on exposed
canopies, and differential evaporative loss of
intercepted precipitation from trees of varying leaf
area as processes affecting spatial redistribution of
precipitation by canopies (Herwitz and Slye, 1992;
Beier et al., 1993). Early work focused on the
deterministic effects of these processes at the scale
of individual trees (e.g., Horton, 1919; Wood, 1937;
Stout and McMahon, 1961). However, attempts to
predict spatially varying throughfall amounts from
immediate canopy cover in forests have mostly seen
limited success (Tobon Marin et al., 2000; Loescher
et al., 2002), or require calibration to both canopy
characteristics and measured throughfall (Whelan and
Anderson, 1996). An example of this problem is the
inconsistent relationship between throughfall and
position relative to tree stems and crowns. For
example, Voigt (1960), Ford and Deans (1978), and
Herwitz (1987) observed higher throughfall amounts
near stems than at crown edges, yet Aussenac (1970),
Swank (1972), Johnson (1990), and Beier et al.
(1993), all found throughfall consistently lower near
stems. Kittredge et al. (1941) found throughfall
highest near stems during large storms, but highest
near crown edges in small storms. The lack of
consistent relationships among stands, even when
species are identical, defeats the predictive power of
distance-to-stem predictors of throughfall patterns.
Investigations of spatial patterns of throughfall
using spatial statistics (e.g., Loustau et al., 1992;
Bellot and Escarre, 1998; Loescher et al., 2002;
Gomez et al., 2002) are less common than determi-
nistic regressions using vegetation characteristics, and
have yielded equivocal results. Some of these
investigators have reported data accumulated over
several storms, preventing detection of pattern
variation from storm to storm. Few researchers have
investigated whether spatial variability of throughfall
is repeated only statistically, or arise from spatial
variations in throughfall occurring at the same points
among storms.
Canopy structure and architecture have been
generally accepted as the most important control on
throughfall redistribution (e.g., Herwitz and Slye,
1992; Whelan and Anderson, 1996). Existing,
process-based models of this redistribution suitable
for providing boundary conditions for fine-scale
models of infiltration, groundwater recharge, soil
moisture patterns, or watershed hydrology require
many parameters that are difficult to measure (e.g.,
Whelan and Anderson, 1996; Davie and Durocher
1997 a, b). Hence, a conceptualization of temporal
and spatial variability of throughfall that does not rely
on vegetation mapping or intracanopy micrometeor-
ological measurements would allow incorporating
canopy redistribution of throughfall into soil models
more easily.
A full model of how spatial patterns of throughfall
vary may include both deterministic and stochastic
characterizations of spatial variability, but clearly
must include temporal variability of spatial patterns.
The specific objectives of this research were to
describe the spatial variation of throughfall under
three different forest stands and to determine how
spatial variations in throughfall persist among storms,
with the goal of developing a model of spatial
distribution of throughfall useful for modeling water
fluxes at the forest floor at fine spatial scales. In this
paper, we take the strategy of developing statistical
tools for quantifying patterns and time stability of
throughfall without regard to canopy measurements.
2. Methods
2.1. Study sites
We selected three forest stands in the Pacific
Northwest, USA, for this study. The study sites are
important forest types of the region and represent a
gradient of canopy complexity from a homogeneous,
tended stand to a complex, unmanaged stand with
large trees and gaps. We established a single plot in
each stand that was R10 times the area of the crowns
of dominant trees (about three crowns wide). Plots
were placed within transects randomly located
previously within each stand for related research.
One study site, a young conifer stand, is an even
age stand of conifers originating after a clearcut 60
years before the study. The dominant tree species is
Douglas-fir (Pseudotsuga menziesii), with a few grand
fir (Abies grandis), and bigleaf maple (Acer macro-
phyllum). The canopy is closed and spatially
R.F. Keim et al. / Journal of Hydrology 314 (2005) 263–274 265
homogenous. Maximum tree size in the plot was
0.4 m breast height stem diameter and 43 m tall, and
basal area in the plot was 111 m2 haK1. The crowns of
the dominant trees were approximately 5 m diameter,
so the plot in this stand was 15!15 m.
The second site is a stand of deciduous trees
about 60 years old that is located in a riparian area.
The dominant species are red alder (Alnus rubra),
bigleaf maple, Oregon ash (Fraxinus latifolia), and
vine maple (Acer circinatum). The canopy is less
homogenous than the young conifer stand, and is
intermediate in complexity of the stands in this
study. Maximum tree size in the plot was 1 m breast
height stem diameter and 30 m tall, and basal area
in the plot was 75 m2 haK1. The crowns of the
dominant trees were approximately 6 m diameter, so
the plot in this stand was 13.5!22.5 m. The plot
was not square because the riparian area was not
wide enough to accommodate a plot three crowns
square.
The final site is an old, uneven-age conifer stand,
where the oldest trees are about 600 years old. The
dominant species are Douglas-fir, western redcedar
(Thuja plicata), and western hemlock (Tsuga hetero-
phylla), with some bigleaf maple and vine maple. The
canopy is spatially complex, both horizontally and
vertically. Maximum tree size in the plot was 3 m
breast height stem diameter and 60 m tall, and basal
area in the plot was 198 m2 haK1. The crowns of the
dominant trees were approximately 10 m diameter, so
the plot in this stand was 30!30 m.
Previous work has illustrated the importance of
gaps in spatial variability of throughfall (Zirlewagen
and von Wilpert, 2001; Loescher et al., 2002), so we
excluded this source of variability and focused on
intra-crown processes by placing all three plots in
areas where density of trees was higher than the
stand average. Stand-density index, SDI (Reineke,
1933), of the plot in the young conifer stand was
2130 (SI units), compared to a stand-total SDI of
1130 and a theoretical maximum SDI for Douglas-fir
of 1470 (Reineke, 1933). The SDI of the plot in the
deciduous stand was 1460, compared to theoretical
maximum SDI for red alder of 1125 (Hibbs and
Carlton, 1989). The SDI of the plot in the old
conifer stand was 2700, compared to a stand-total
SDI of 1770.
2.2. Instrumentation and data
To measure throughfall, we placed 94 wedge-
shaped storage rain gauges with a 9.2 cm2 orifice
within each plot (Fig. 1). Each gauge was mounted on
a wooden stake, 25–50 cm above the forest floor, and
permitted a rainfall reading accurate to G1 mm. We
excluded low shrubs, grass, ferns, and herbs from the
study by removing them for at least 0.5 m around each
gauge. The gauge positions were coordinates selected
by random number generation, and we used a total-
station theodolite to place each gauge within 0.1 m of
its assigned coordinates. If a gauge fell inside a tree
stem, we moved it at a pre-generated random azimuth
and distance.
We measured storm-total throughfall at each gauge
for three to seven storms at each plot (Table 1) from
18 January 2002 to 8 July 2002. After measuring
several storms in one stand, we removed the gauges
and placed them in the next stand. The dominant form
of precipitation was rain in all storms except two,
which we excluded from the analyses. The measured
storms included both winter (leaf-off) and spring
(leaf-on) condition in the deciduous stand. We
assumed rainfall was spatially homogeneous over
these small plots.
2.3. Analyses
We used variograms as one measure of spatial
patterns in storm-total throughfall. Variogram anal-
ysis is a tool to measure the continuity of spatial
phenomena. It expresses continuity as the average
squared difference between quantities measured at
different locations. The semivariance g for measure-
ments taken distance h apart is then given as:
gðhÞ Z
PnðhÞðx KyÞ2
2nðhÞ; (1)
where x and y are measurements of storm-total
throughfall and n(h) is the number of measurement
pairs in the data set that are distance h apart (Olea,
1999). The distance h is known as the lag. In
applications where measurements are not evenly
spaced, such as this study, g is calculated for h
classified over some range of distance. Variograms
strictly have three dimensions (lag, semivariance, and
170 205 240 275 310 345 10 50 90 130 170
15 65 115 165 215 4 13 22 31 40
(a) Young Conifer (b) Old Conifer
(c) Deciduous; Leaf Off (d) Deciduous; Leaf On
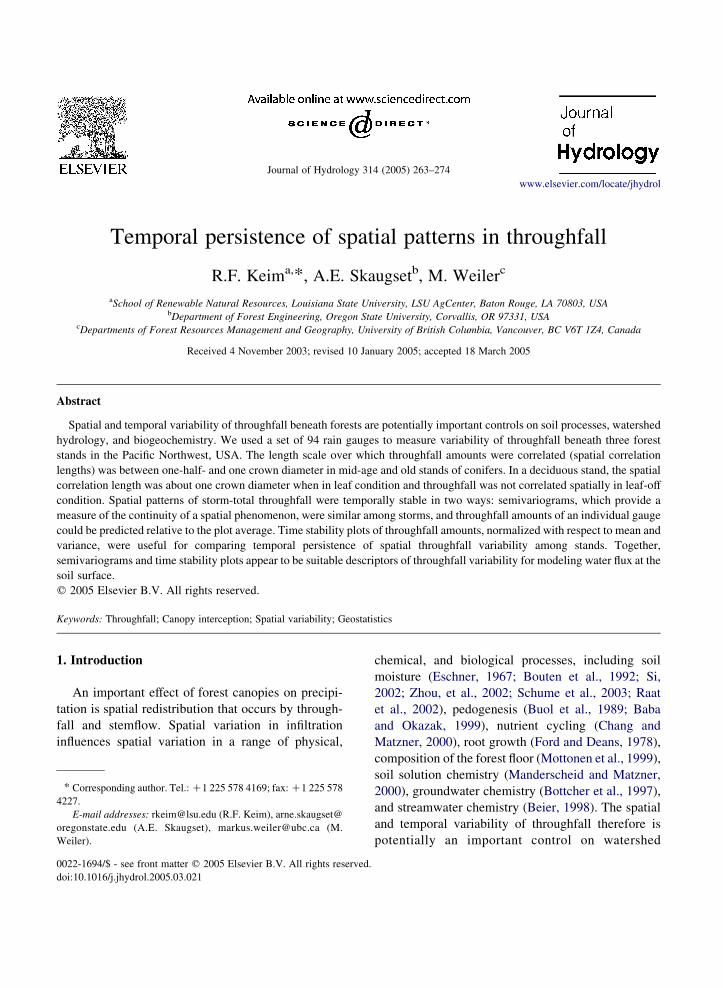
Fig. 1. Total throughfall (mm) recorded in three forest stands in the Pacific Northwest, USA. Map scale is indicated by 3-m tick marks on the
margin of each subplot. Solid black circles indicate trees, scaled to breast-height diameter. Open white squares indicate throughfall collectors,
scaled to storm-total throughfall. Color indicates throughfall between collectors for visualization purposes. Each interpolation is the result of
Kriging parameterized from variograms.
R.F. Keim et al. / Journal of Hydrology 314 (2005) 263–274266
direction), but, for ease of interpretation, are often
plotted in two dimensions by averaging over all
directions. Variograms plotted this way are referred to
as omnidirectional. Variograms can be characterized
by the sill, the maximum semivariance defined by the
overall variance of the data, and the range, the
distance at which the variogram reaches the sill.
The range describes the length scale over which
throughfall amounts are correlated, and is also known
as the spatial correlation length.
We used omnidirectional variograms with a
maximum distance of 75% of plot size, and
semivariance g(h) calculated for observations classi-
fied within annuli that were one fifteenth of the
maximum distance wide. To allow comparison of
variograms among storms, we standardized vario-
grams as: gsðhÞZgðhÞ=s2Lh, where s2
Lh is the lag
variance defined as the geometric mean of the
variances of observation pairs distance h apart. We
plotted the standardized variograms for each storm
together with the standardized variogram of the total
throughfall to assess the time stability of throughfall
patterns at each stand.
Variograms only describe the length scale over
which throughfall amounts are correlated, but do not
identify whether high or low throughfall areas persist
among storms. To quantify this, we modified a
measure that has formed the basis of previous time-
stability descriptions of soil moisture and throughfall.
Raat et al. (2002), following Vachaud et al. (1985),
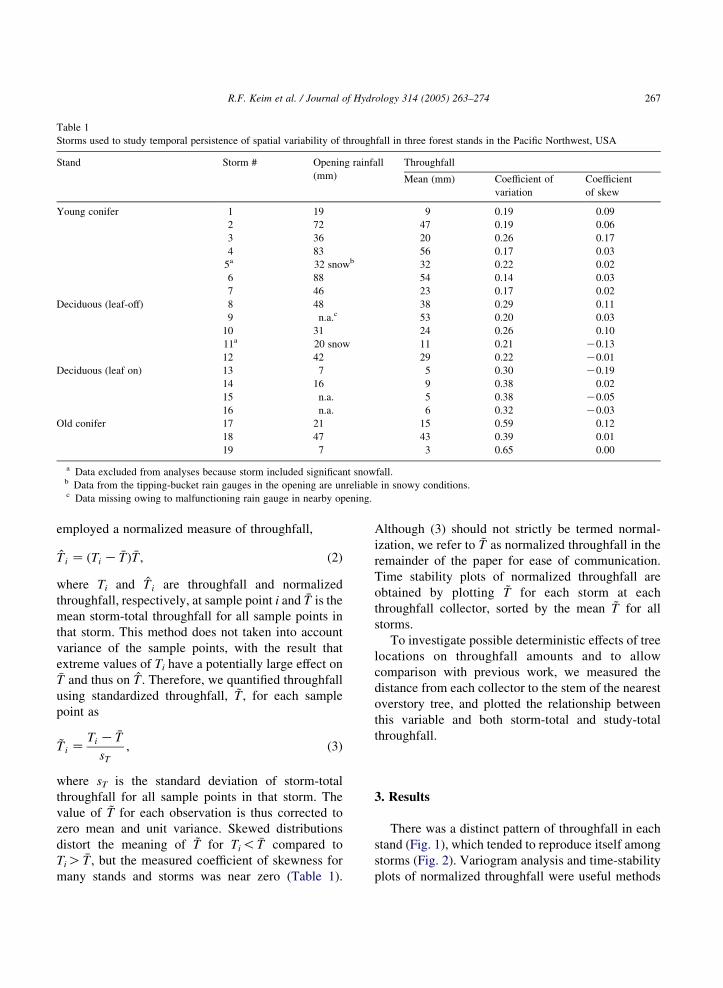
Table 1
Storms used to study temporal persistence of spatial variability of throughfall in three forest stands in the Pacific Northwest, USA
Stand Storm # Opening rainfall
(mm)
Throughfall
Mean (mm) Coefficient of
variation
Coefficient
of skew
Young conifer 1 19 9 0.19 0.09
2 72 47 0.19 0.06
3 36 20 0.26 0.17
4 83 56 0.17 0.03
5a 32 snowb 32 0.22 0.02
6 88 54 0.14 0.03
7 46 23 0.17 0.02
Deciduous (leaf-off) 8 48 38 0.29 0.11
9 n.a.c 53 0.20 0.03
10 31 24 0.26 0.10
11a 20 snow 11 0.21 K0.13
12 42 29 0.22 K0.01
Deciduous (leaf on) 13 7 5 0.30 K0.19
14 16 9 0.38 0.02
15 n.a. 5 0.38 K0.05
16 n.a. 6 0.32 K0.03
Old conifer 17 21 15 0.59 0.12
18 47 43 0.39 0.01
19 7 3 0.65 0.00
a Data excluded from analyses because storm included significant snowfall.b Data from the tipping-bucket rain gauges in the opening are unreliable in snowy conditions.c Data missing owing to malfunctioning rain gauge in nearby opening.
R.F. Keim et al. / Journal of Hydrology 314 (2005) 263–274 267
employed a normalized measure of throughfall,
T i Z ðTi K �TÞ �T ; (2)
where Ti and T i are throughfall and normalized
throughfall, respectively, at sample point i and �T is the
mean storm-total throughfall for all sample points in
that storm. This method does not taken into account
variance of the sample points, with the result that
extreme values of Ti have a potentially large effect on�T and thus on T . Therefore, we quantified throughfall
using standardized throughfall, ~T , for each sample
point as
~Ti ZTi K �T
sT
; (3)
where sT is the standard deviation of storm-total
throughfall for all sample points in that storm. The
value of ~T for each observation is thus corrected to
zero mean and unit variance. Skewed distributions
distort the meaning of ~T for Ti! �T compared to
TiO �T , but the measured coefficient of skewness for
many stands and storms was near zero (Table 1).
Although (3) should not strictly be termed normal-
ization, we refer to ~T as normalized throughfall in the
remainder of the paper for ease of communication.
Time stability plots of normalized throughfall are
obtained by plotting ~T for each storm at each
throughfall collector, sorted by the mean ~T for all
storms.
To investigate possible deterministic effects of tree
locations on throughfall amounts and to allow
comparison with previous work, we measured the
distance from each collector to the stem of the nearest
overstory tree, and plotted the relationship between
this variable and both storm-total and study-total
throughfall.
3. Results
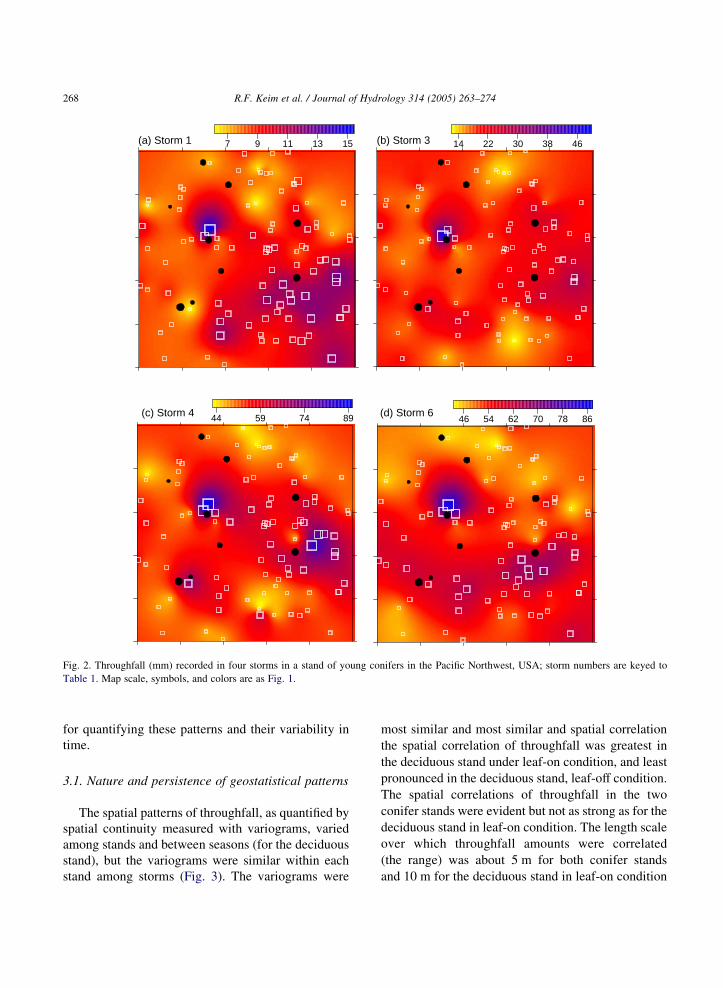
There was a distinct pattern of throughfall in each
stand (Fig. 1), which tended to reproduce itself among
storms (Fig. 2). Variogram analysis and time-stability
plots of normalized throughfall were useful methods
7 9 11 13 15 14 22 30 38 46
44 59 74 89 46 54 62 70 78 86
(a) Storm 1 (b) Storm 3
(c) Storm 4 (d) Storm 6
Fig. 2. Throughfall (mm) recorded in four storms in a stand of young conifers in the Pacific Northwest, USA; storm numbers are keyed to
Table 1. Map scale, symbols, and colors are as Fig. 1.
R.F. Keim et al. / Journal of Hydrology 314 (2005) 263–274268
for quantifying these patterns and their variability in
time.
3.1. Nature and persistence of geostatistical patterns
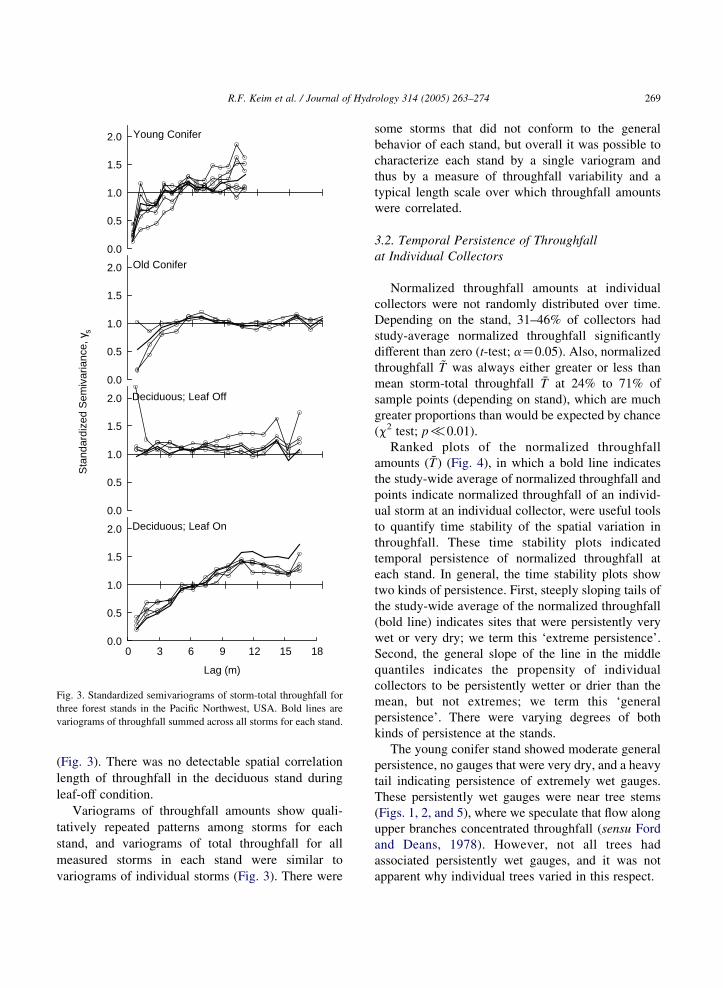
The spatial patterns of throughfall, as quantified by
spatial continuity measured with variograms, varied
among stands and between seasons (for the deciduous
stand), but the variograms were similar within each
stand among storms (Fig. 3). The variograms were
most similar and most similar and spatial correlation
the spatial correlation of throughfall was greatest in
the deciduous stand under leaf-on condition, and least
pronounced in the deciduous stand, leaf-off condition.
The spatial correlations of throughfall in the two
conifer stands were evident but not as strong as for the
deciduous stand in leaf-on condition. The length scale
over which throughfall amounts were correlated
(the range) was about 5 m for both conifer stands
and 10 m for the deciduous stand in leaf-on condition
Lag (m)
Sta
ndar
dize
d S
emiv
aria
nce,
γs
0 3 6 9 12 15 18
0.0
0.5
1.0
1.5
2.0 Old Conifer
0.0
0.5
1.0
1.5
2.0 Deciduous; Leaf Off
0.0
0.5
1.0
1.5
2.0 Young Conifer
0.0
0.5
1.0
1.5
2.0 Deciduous; Leaf On
Fig. 3. Standardized semivariograms of storm-total throughfall for
three forest stands in the Pacific Northwest, USA. Bold lines are
variograms of throughfall summed across all storms for each stand.
R.F. Keim et al. / Journal of Hydrology 314 (2005) 263–274 269
(Fig. 3). There was no detectable spatial correlation
length of throughfall in the deciduous stand during
leaf-off condition.
Variograms of throughfall amounts show quali-
tatively repeated patterns among storms for each
stand, and variograms of total throughfall for all
measured storms in each stand were similar to
variograms of individual storms (Fig. 3). There were
some storms that did not conform to the general
behavior of each stand, but overall it was possible to
characterize each stand by a single variogram and
thus by a measure of throughfall variability and a
typical length scale over which throughfall amounts
were correlated.
3.2. Temporal Persistence of Throughfall
at Individual Collectors
Normalized throughfall amounts at individual
collectors were not randomly distributed over time.
Depending on the stand, 31–46% of collectors had
study-average normalized throughfall significantly
different than zero (t-test; aZ0.05). Also, normalized
throughfall ~T was always either greater or less than
mean storm-total throughfall �T at 24% to 71% of
sample points (depending on stand), which are much
greater proportions than would be expected by chance
(c2 test; p/0.01).
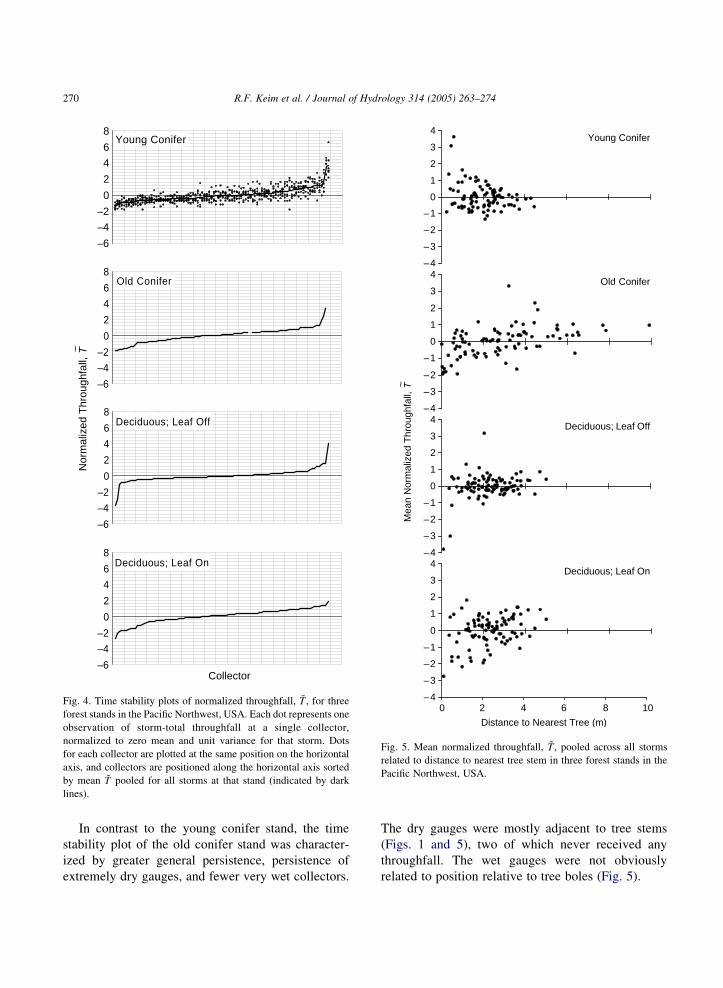
Ranked plots of the normalized throughfall
amounts ( ~T) (Fig. 4), in which a bold line indicates
the study-wide average of normalized throughfall and
points indicate normalized throughfall of an individ-
ual storm at an individual collector, were useful tools
to quantify time stability of the spatial variation in
throughfall. These time stability plots indicated
temporal persistence of normalized throughfall at
each stand. In general, the time stability plots show
two kinds of persistence. First, steeply sloping tails of
the study-wide average of the normalized throughfall
(bold line) indicates sites that were persistently very
wet or very dry; we term this ‘extreme persistence’.
Second, the general slope of the line in the middle
quantiles indicates the propensity of individual
collectors to be persistently wetter or drier than the
mean, but not extremes; we term this ‘general
persistence’. There were varying degrees of both
kinds of persistence at the stands.
The young conifer stand showed moderate general
persistence, no gauges that were very dry, and a heavy
tail indicating persistence of extremely wet gauges.
These persistently wet gauges were near tree stems
(Figs. 1, 2, and 5), where we speculate that flow along
upper branches concentrated throughfall (sensu Ford
and Deans, 1978). However, not all trees had
associated persistently wet gauges, and it was not
apparent why individual trees varied in this respect.
Distance to Nearest Tree (m)
Mea
n N
orm
aliz
ed T
hrou
ghfa
ll, T~
0 2 4 6 8 10–4
–3
–2
–1
0
1
2
3
4Deciduous; Leaf On
–4
–3
–2
–1
0
1
2
3
4Deciduous; Leaf Off
–4
–3
–2
–1
0
1
2
3
4Old Conifer
–4
–3
–2
–1
0
1
2
3
4Young Conifer
Fig. 5. Mean normalized throughfall, ~T , pooled across all storms
related to distance to nearest tree stem in three forest stands in the
Pacific Northwest, USA.
Nor
mal
ized
Thr
ough
fall,
T~
Collector
–6
–4
–2
0
2
4
6
8Young Conifer
–6
–4
–2
0
2
4
6
8Old Conifer
–6
–4
–2
0
2
4
6
8Deciduous; Leaf Off
–6
–4
–2
0
2
4
6
8Deciduous; Leaf On
Fig. 4. Time stability plots of normalized throughfall, ~T , for three
forest stands in the Pacific Northwest, USA. Each dot represents one
observation of storm-total throughfall at a single collector,
normalized to zero mean and unit variance for that storm. Dots
for each collector are plotted at the same position on the horizontal
axis, and collectors are positioned along the horizontal axis sorted
by mean ~T pooled for all storms at that stand (indicated by dark
lines).
R.F. Keim et al. / Journal of Hydrology 314 (2005) 263–274270
In contrast to the young conifer stand, the time
stability plot of the old conifer stand was character-
ized by greater general persistence, persistence of
extremely dry gauges, and fewer very wet collectors.
The dry gauges were mostly adjacent to tree stems
(Figs. 1 and 5), two of which never received any
throughfall. The wet gauges were not obviously
related to position relative to tree boles (Fig. 5).
R.F. Keim et al. / Journal of Hydrology 314 (2005) 263–274 271
There was less general persistence in the deciduous
stand during leaf-off condition than in either conifer
stand, but more in leaf-on condition (Fig. 4). The leaf-
off condition time stability plot was characterized by
extreme persistence of both wet and dry gauges, but
more gauges were extremely dry than extremely wet
in the leaf-on condition. There were two collectors
very near and underneath leaning trees, where
throughfall was persistently low during leaf-off
condition (Figs. 1 and 5). One of these collectors
remained dry during leaf-on condition, but the other
received variable throughfall, most likely as dripping
stemflow, during that time. There were seven
collectors under a midstory vine maple heavily
colonized by mosses where total throughfall was
119% of the stand average for all storms in the leaf-off
condition (upper right corner of Fig. 1c and d). As a
group, these collectors exhibited the largest temporal
variation in ~T of any in the entire study. We speculate
that flow along stems and branches on the tree and in
the moss concentrated throughfall under the tree, but
not always at exactly the same location. Drip points
seemed to move among storms within an area about
1 m across. This area of throughfall concentration
disappeared during leaf-on condition, and the collec-
tors under the mossy tree were consistently drier than
the mean.
Relationships between average normalized
throughfall and distance to nearest tree varied
among the stands (Fig. 5). Relationships were weak
at all stands, but the observations indicate a zone of
slightly higher throughfall within 0–2 m of trees in the
young conifer stand, slightly lower throughfall within
0–2 m of trees in the old conifer stand, and, except for
sites under leaning trees, no relationship between
throughfall amounts and tree locations in the
deciduous stand.
4. Discussion
Spatial patterns of throughfall in our three stands
were quantifiable and repeated from storm to storm,
but not predictable a priori from tree locations. The
temporal persistence of areas with lower and higher
throughfall from storm to storm implies consistent
deterministic controls on the persistence of spatial
throughfall variability, but the location of areas with
lower and higher throughfall could not be predicted
based on tree locations.
Previous applications of geostatistical methods to
describe throughfall in forests have yielded mixed
results. Loustau et al. (1992) found no evidence of
any spatial correlation at distances of approximately
2–35 m in storms in a pine forest in France. Bellot and
Escarre (1998) found no evidence of any spatial
structure in six storms in a Mediterranean dry forest.
Loescher et al. (2002) found a spatial correlation
length of 43 m integrated across storms in a wet
tropical forest in Costa Rica, but had limited data at
short distances and included canopy gaps in the
analysis. Gomez et al. (2002) reported a spatial
correlation length of approximately 1–3 m integrated
across storms under isolated olive trees in Spain, but
in an analysis that violated assumptions of spatial
isotropy. Our data indicated the length scale over
which throughfall amounts were correlated varied by
stand and season from no correlation to spatial
correlation lengths of approximately 3–10 m.
These published differences in the spatial corre-
lation of throughfall among stands can be expected,
because differences in canopy species, canopy
structure, density, spatial homogeneity, and meteor-
ological phenomena are known to alter patterns.
Differences in experimental design, such as size of
plots, number, size and spatial density of collectors,
time scale of integration (time between observations
of collected throughfall), make it difficult to directly
compare our results to previously published work.
Nevertheless, it seems reasonable to expect a
relationship between stand characteristic and the
length scale over which throughfall is correlated. In
this study, for example, the relatively unstructured
canopy of leafless deciduous trees produced an
uncorrelated throughfall pattern. In contrast, the
more-structured canopies of conifers or deciduous
trees in leaf produced length scales of about one
crown diameter over which throughfall amounts were
correlated.
This study purposely omitted data from gaps in the
forest canopy, which strongly influenced the results
and inferences. Zirlewagen and von Wilpert (2001)
demonstrated that spatial variability of throughfall at
the spatial scale of canopy gaps is an important
control on water quantity and chemistry at the
watershed scale. Inferences at the smaller scale of

R.F. Keim et al. / Journal of Hydrology 314 (2005) 263–274272
our study should be considered within a broader
context that accounts for variability at larger scales
that incorporate more types of heterogeneity.
Our preliminary finding of a relationship between
the size of tree crowns and the correlation length of
the throughfall pattern should be studied further in the
light of different driving forces (e.g., precipitation
amounts, intensity, or stand configuration) that this
study did not address. However, the relationship
between the spatial scales of canopies and throughfall
seems more promising for understanding the spatial
patterns of throughfall than predictions based on
distances to tree stems, and is simpler than previously
published efforts to estimate throughfall by determi-
nistic modeling based on spatially explicit canopy
data (e.g., Whelan and Anderson, 1996; Davie and
Durocher, 1997a).
The results of this research suggest that calibrated
statistical models of throughfall are viable as
characteristic descriptors of throughfall in a stand.
Variograms and stability plots of throughfall appear to
be stable measures of throughfall variability, and
require no canopy measurements to obtain. Coex-
istence of variogram shapes and normalized through-
fall amounts that were persistent in time at individual
samplers indicates that the spatial patterns were
deterministically reproduced among storms rather
than simply being repeated statistically (e.g., Fig. 2).
Although temporally repeated spatial distributions of
throughfall has been reported by others (e.g., Beier
et al., 1993; Whelan and Anderson, 1996; Raat et al.,
2002), this time stability has not previously been
explicitly linked with the geostatistical properties
found by other work (e.g., Loustau et al., 1992; Bellot
and Escarre, 1998; Loescher et al., 2002; Gomez et al.,
2002).
The combination of time-stability plots and
variograms allows spatial interpolation of throughfall
between measurements, reduction in the number of
required measurements in an individual stand after
calibration, and mathematical simulation of the
throughfall process. The results of this study indicate
that stand type and season affect these measures; data
from more stands and storms would improve the
versatility of this approach by identifying other
relevant variables.
Many papers have indicated less-variable through-
fall during larger storms (e.g., Tobon Marin et al.,
2000; Bouten et al., 1992). We found this in our data
as well, but lacked enough storms to fully evaluate
this relationship (Table 1). Notably, there was no
relationship between geostatistical structure and
storm-total throughfall in our data. We speculate
that spatial patterns may persist among storms but be
muted in larger events, but more data are needed to
quantify this effect.
Several researchers have used Spearman’s rank
correlation test to compare normalized throughfall
amounts or soil moisture at individual sites between
time periods (e.g., Vachaud et al., 1985; Raat et al.,
2002; Si, 2002). We found this technique to be less
powerful than the stability plot approach for detecting
temporal persistence in middle-quantile sample
points, because large variations in rank among time
periods may arise from only minor differences in
throughfall. The Spearman test is also unable to
address the possibility of persisting locations of
extremly wet or dry sites because it only tests for
‘general persistence’-that is, it tests whether the mean
line in the stability plot is statistically different than a
flat line.
Research has shown that spatial variation of
throughfall and the resulting infiltration variation
contribute to spatial variation in soil moisture patterns
in forest soils (e.g., Eschner, 1967; Bouten et al.,
1992; Si, 2002; Zhou, et al., 2002; Schume et al.,
2003; Raat et al., 2002). However, owing to spatial
variability of soil thickness and physical properties, it
is often not possible to relate patterns in throughfall
directly to patterns in water content (Raat et al., 2002).
Nonetheless, temporal and spatial persistence of
throughfall has important implications for soil
hydrology. Consistent and marked spatial differences
of water infiltrating into the forest soil will not only
produce consistently wetter and drier areas, but also
influence the rate of percolation through the unsatu-
rated zone. Thus, repeated patterns of infiltration may
be considered a kind of preferential flow at the scale
of several meters, perhaps akin to preferential flow in
macropores at smaller spatial scales. Consequences
may include lateral subsurface flow or rapid recharge
to groundwater as infiltration bypasses portions of the
soil profile (Weiler and Naef, 2003). Nutrients and
other solutes may thus also be transported faster than
in homogeneous matrix flow. Persistence of through-
fall variability may also be related to the decadal-scale
R.F. Keim et al. / Journal of Hydrology 314 (2005) 263–274 273
temporal stability of preferential flow paths as
observed in a structured forest soil by Hagedorn and
Bundt (2002).
This complex subsurface suite of hydrological
processes might be best modeled stochastically using
spatiotemporally variable boundary conditions,
compared to the common approach of modeling
infiltration as spatially homogeneous. The results of
this study would be directly applicable to such
modeling. After obtaining parameters necessary to
define variograms and time stability plots from field
data, inter-event variability in spatially explicit
throughfall can be simulated stochastically. For
example, a model grid of throughfall might be seeded
with mean normalized throughfall at each grid node
assigned from a probability distribution defined by the
stability plot, then arranged spatially using the
measured variogram as a constraint. Subsequent
events might be simulated by allowing normalized
throughfall at each grid node to vary according to the
observed distribution about the mean obtained from
time stability plots. This or some other scheme would
allow virtual experiements (sensu Weiler and
McDonnell, 2004) to help understand the role of
spatiotemporally variable throughfall in vadoze zone
hydrology.
5. Conclusions
Spatial patterns of throughfall at the three study
stands varied in quantifiable ways over time and
space. Semivariograms indicated that patterns of
normalized throughfall persisted among storms, and
persistent normalized throughfall at individual col-
lectors indicated the geostatistical patterns persisted
because of deterministic processes that consistently
redistributed precipitation to create patterns of
throughfall.
Patterns of throughfall can be described by
variograms and time stability plots of normalized
throughfall. These techniques in combination allow
quantification of the variability of throughfall in space
and time. These measures are flexible enough to
describe variability that is strong or weak, and
temporally persistent or random. Each of the forest
stands we investigated had characteristic semivario-
grams and persistence plots that can serve as the basis
of models of throughfall for application to, for
example, models of infiltration, soil processes, and
watershed hydrology. Further work may reveal
characteristic changes in these parameters with stand
disturbance and development.
Acknowledgements
This research was supported by grant 00-34158-
8978 from the U.S. Department of Agriculture,
Cooperative State Research Education and Extension
Service, Centers for Wood Utilization Research. We
thank Nalini Nadkarni and Bob Van Pelt for sharing
their Cedar Flats research plot, and two anonymous
reviewers for helpful comments.
References
Aussenac, G., 1970. Action du couvert forestier sur la distribution
au sol des precipitations. Annales des Sciences Forestieres 27,
383–399.
Baba, M., Okazaki, M., 1999. Spatial variability of soil solution
chemistry under Hinoki cypress (Chamaecyparis obtusa) in
Tama Hills. Soil Science and Plant Nutrition 45, 321–336.
Beier, C., 1998. Water and element fluxes calculated in a sandy
forest soil taking spatial variability into account. Forest Ecology
and Management 101, 269–280.
Beier, C., Hanson, K., Gunderson, P., 1993. Spatial variability of
throughfall fluxes in a spruce forest. Environmental Pollution
81, 257–267.
Bellot, J., Escarre, A., 1998. Stemflow and throughfall determi-
nation in a resprouted Mediterranean holm-oak forest. Annales
des Sciences Forestieres 55, 847–865.
Bottcher, J., Strebel, O., Lauer, S., 1997. Spatial variability of
groundwater solute concentrations at the water table under a
pine stand on sandy soil with deep ground water. Zeitschrift fur
Pflanzenernahrung und Bodenkunde 160, 67–72.
Bouten, W., Heimovaara, T., Tiktak, A., 1992. Spatial pattern of
throughfall and soil water dynamics in a Douglas fir stand.
Water Resources Research 28, 3227–3233.
Buol, S.W., Hole, F.D., McCracken, R.J., 1989. Soil Genesis and
Classification, third ed. Iowa State University Press, Ames.
446 p..
Chang, S.C., Matzner, E., 2000. The effect of beech stemflow
on spatial patterns of soil solution chemistry and seepage
fluxes in a mixed beech/oak stand. Hydrological Processes
14, 135–144.
Davie, T.J.A., Durocher, M.G., 1997a. A model to consider
the spatial variability of rainfall partitioning within deciduous
canopy. I. Model description. Hydrological Processes 11,
1509–1523.
R.F. Keim et al. / Journal of Hydrology 314 (2005) 263–274274
Davie, T.J.A., Durocher, M.G., 1997b. A model to consider the
spatial variability of rainfall partitioning within deciduous
canopy. I. Model parameterization and testing. Hydrological
Processes 11, 1525–1540.
Eschner, A.R., 1967. Interception and soil moisture distribution. In:
Sopper, W.E., Lull, H.W. (Eds.), Forest Hydrology. Pergamon,
Oxford, pp. 191–200.
Ford, E.D., Deans, J.D., 1978. The effects of canopy structure on a
stemflow, throughfall and interception loss in a young Sitka
spruce plantation. Journal of Applied Ecology 15, 905–917.
Gomez, J.A., Vanderlinden, K., Giraldez, J.V., Fereres, E., 2002.
Rainfall concentration under olive trees. Agricultural Water
Management 55, 53–70.
Hagedorn, F., Bundt, M., 2002. The age of preferential flow paths.
Geoderma 108, 119–132.
Herwitz, S.R., 1987. Raindrop impact and water flow on the
vegetative surfaces of trees and the effects on stemflow and
throughfall generation. Earth Surface Processes and Landforms
12, 425–432.
Herwitz, S.R., Slye, R.E., 1992. Spatial variability in the
interception of inclined rainfall by a tropical rainforest canopy.
Selbyana 13, 62–71.
Hibbs, D.E., Carlton, G.D., 1989. A comparison of diameter- and
volume-based stocking guides for red alder. Western Journal of
Applied Forestry 4, 113–115.
Horton, R.E., 1919. Rainfall interception. Monthly Weather Review
47, 603–623.
Johnson, R.C., 1990. The interception, throughfall, and stemflow in
a forest in highland Scotland and the comparison with other
forests in the UK. Journal of Hydrology 118, 281–287.
Kittredge, J., Loughead, H.J., Mazurak, A., 1941. Interception and
stemflow in a pine plantation. Journal of Forestry 39, 505–522.
Loescher, H.W., Powers, J.S., Oberbauer, S.F., 2002. Spatial
variation of throughfall volume in an old-growth tropical wet
forest, Costa Rica. Journal of Tropical Ecology 18, 397–407.
Loustau, D., Berbigier, P., Granier, A., El Hadj Moussa, F., 1992.
Interception loss, throughfall and stemflow in a maritime pine
stand I. Variability of throughfall and stemflow beneath the pine
canopy. Journal of Hydrology 138, 449–467.
Manderscheid, B., Matzner, E., 2000. Spatial and temporal variation
of soil solution chemistry and ion fluxes through the soil in a
mature Norway spruce (Picea abies (L.) Karst.) stand.
Biogeochemistry 30, 99–114.
Mottonen, M., Jarvinen, E., Hokkanen, T.J., Kuuluvainen, T.,
Ohtonen, R., 1999. Spatial distribution of soil ergosterol in the
organic layer of a mature Scots pine (Pinus sylvestris L.) forest.
Soil Biology and Biochemistry 3, 503–516.
Olea, R.A., 1999. Geostatistics for engineers and earth scientists,
Kluwer, Boston. Kluwer, Boston. 303 p..
Raat, K.J., Draaijers, G.P.J., Schaap, M.G., Tietema, A., Verstraten,
J.M., 2002. Spatial variability of throughfall water and
chemistry and forest floor water content in a Douglas fir forest
stand. Hydrology and Earth System Sciences 6, 363–374.
Reineke, L.H., 1933. Perfecting a stand-density index for even-aged
forests. Journal of Agricultural Research 46, 627–638.
Schume, H., Jost, G., Katzensteiner, K., 2003. Spatio-temporal
analysis of the soil water content in a mixed Norway spruce
(Picea abies (L.) Karst.)-European beech (Fagus sylvatica L.)
stand. Geoderma 112, 273–287.
Si, B.C., 2002. Spatial and statistical similarities of local soil water
fluxes. Soil Science Society of America Journal 66, 753–759.
Stout, B.B., McMahon, R.J., 1961. Throughfall variation under tree
crowns. Journal of Geophysical Research 66, 1839–1843.
Swank, W.T., 1972. Water balance, interception and transpiration
studies on a watershed in the Puget lowland region of western
Washington. Dissertation, University of Washington.
Tobon Marin, C., Bouten, W., Sevink, J., 2000. Gross rainfall and its
partitioning into throughfall, stemflow and evaporation of
intercepted water in four forest ecosystems in western
Amazonia. Journal of Hydrology 237, 40–57.
Vachaud, G., Passerat De Silans, A., Balabanis, P., Vauclin, M.,
1985. Temporal stability of spatially measured soil water
probability density functions. Soil Science Society of America
Journal 49, 822–828.
Voigt, G.K., 1960. Distribution of rainfall under forest stands.
Forest Science 6, 2–10.
Whelan, M.J., Anderson, J.M., 1996. Modelling spatial patterns of
throughfall and interception loss in a Norway spruce (Picea
abies) plantation at the plot scale. Journal of Hydrology 186,
335–354.
Weiler, M., McDonnell, J., 2004. Virtual experiments: a new
approach for improving process conceptualization in hillslope
hydrology. Journal of Hydrology 285, 3–18.
Weiler, M., Naef, F., 2003. An experimental tracer study of the role
of macropores in infiltration in grassland soils. Hydrological
Processes 17, 477–493.
Wood, O.M., 1937. The interception of precipitation in an oak-pine
forest. Ecology 18, 251–254.
Zhou, Q.Y., Shimada, J., Sato, A., 1937. Temporal variations of the
three-dimensional rainfall infiltration process in heterogeneous
soil. Water Resources Research 38. doi:10.1029/WR000349.
Zirlewagen, D., von Wilpert, K., 2001. Modeling water and ion
fluxes in a highly structured, mixed-species stand. Forest
Ecology and Management 143, 27–37.