temperature remote sensing using a tunable diode …
TRANSCRIPT
SCOTT A. GEARHART and MICHAEL E. THOMAS
TEMPERATURE REMOTE SENSING USING A TUNABLE DIODE LASER
A noninvasive technique for measuring temperature in hot gases is evaluated as an alternative to conventional mechanical-probing methods. The technique uses a diode-laser spectrometer to measure the line-center absorption-coefficient ratio of two absorption lines that originate from different vibrational energy levels of the same absorbing species. The results of this evaluation indicate that the technique is applicable for temperatures as low as 400 K and at pressures well below 1 atm.
INTRODUCTION Astrophysicists have long relied on measurements of
electromagnetic spectra to determine remotely many properties of celestial bodies, such as their temperature, pressure, and chemical composition. With recent advances in optics and quantum electronics, similar spectroscopic techniques are now being used for other applications that require a remote, noninvasive measurement. For example, Reid et al. I used a tunable-diode-Iaser spectroscopic technique to identify and monitor air pollutants remotely. A similar technique has been proposed by Cassidy and Reid 2 to measure the pressure of trace gases in the atmosphere. In addition, Raman spectroscopy and coherent anti-Stokes Raman spectroscopy (CARS) techniques have been investigated to measure temperature and molecular concentration for flow and combustion diagnostics. 3,4
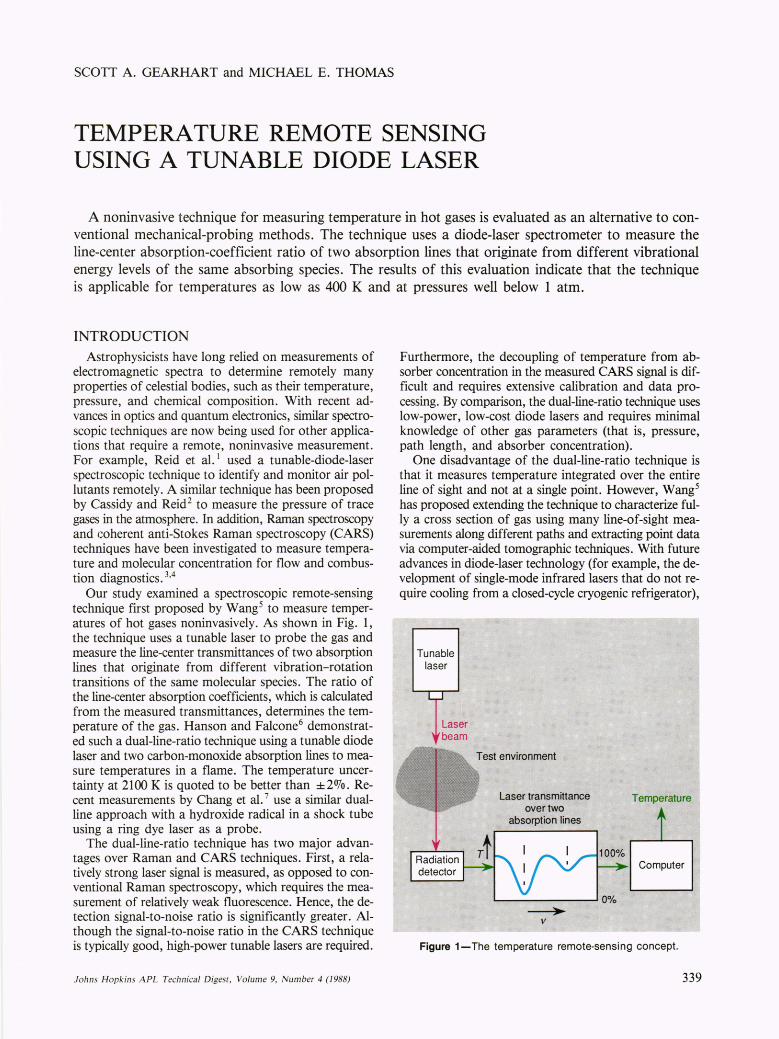
Our study examined a spectroscopic remote-sensing technique first proposed by Wang 5 to measure temperatures of hot gases noninvasively. As shown in Fig. 1, the technique uses a tunable laser to probe the gas and measure the line-center transmittances of two absorption lines that originate from different vibration-rotation transitions of the same molecular species. The ratio of the line-center absorption coefficients, which is calculated from the measured transmittances, determines the temperature of the gas. Hanson and Falcone6 demonstrated such a dual-line-ratio technique using a tunable diode laser and two carbon-monoxide absorption lines to measure temperatures in a flame. The temperature uncertainty at 2100 K is quoted to be better than ± 2070. Recent measurements by Chang et al. 7 use a similar dualline approach with a hydroxide radical in a shock tube using a ring dye laser as a probe.
The dual-line-ratio technique has two major advantages over Raman and CARS techniques. First, a relatively strong laser signal is measured, as opposed to conventional Raman spectroscopy, which requires the measurement of relatively weak fluorescence. Hence, the detection signal-to-noise ratio is significantly greater. Although the signal-to-noise ratio in the CARS technique is typically good, high-power tunable lasers are required.
Johns Hopkins A PL Technical Digest, Volume 9, Number 4 (1988)
Furthermore, the decoupling of temperature from absorber concentration in the measured CARS signal is difficult and requires extensive calibration and data processing. By comparison, the dual-line-ratio technique uses low-power, low-cost diode lasers and requires minimal knowledge of other gas parameters (that is, pressure, path length, and absorber concentration).
One disadvantage of the dual-line-ratio technique is that it measures temperature integrated over the entire line of sight and not at a single point. However, Wang5
has proposed extending the technique to characterize fully a cross section of gas using many line-of-sight measurements along different paths and extracting point data via computer-aided tomographic techniques. With future advances in diode-laser technology (for example, the development of single-mode infrared lasers that do not require cooling from a closed-cycle cryogenic refrigerator),
Tunable laser
L...J
Laser "beam
Laser transmittance over two
absorption lines
~----------~O%
Temperature
Computer
Figure 1-The temperature remote-sensing concept.
339
Gearhart, Thomas - Temperature Remote Sensing Using a Tunable Diode Laser
a diode-laser system may soon be compact enough to make temperature tomography possible for many applications. Another disadvantage of the dual-line-ratio technique is that it assumes thermal equilibrium of the vibrational-energy levels. Thus, highly dynamic environments may not be suitable for this approach unless the nonequilibrium behavior is understood.
The intent here is to assesss the feasibility of the dualline-ratio technique in a laboratory environment. Since previous studies have demonstrated the basic feasibility of high-temperature measurements (at about 2000 K), 6 the applicability to temperature measurements below 1000 K is emphasized. Various pressure regimes are also examined, as well as absorption-line selection criteria. The application of the technique in a realistic environment is a subject for additional study. One potential use for the technique is to monitor temperature in a supersonic aerodynamic test facility, such as the one at APL.
BACKGROUND When molecules are irradiated with a continuous spec
trum of photons, the transmitted spectrum contains dark lines that correspond to absorption at discrete frequencies. The frequency at which an absorption line appears is proportional to the energy required to excite the absorbing molecule from a lower to a higher energy configuration. The distribution of absorption lines is characteristic of the structure of the absorbing molecule.
Consider two absorption lines of the same molecular species that originate from transitions between two different vibration-rotation energy levels. The transmittance ratio of the two lines at their respective line centers VOl
and V02 is
exp[ -kl (VOl )1]
exp[ - k2 (V02 )/] (1)
where 7 is the transmittance, k is the absorption coefficient, and 1 is the path length. Taking the natural logarithms of the numerator and the denominator gives the absorption coefficient ratio,
SI (1)g( VOl ,al )
S2 (1)g(VOV a2 ) (2)
where S is the line strength, g(vo ,a) is the line shape function, and a is the line half-width at half-maximum.
The line strength determines the intensity of the absorption line for a particular band of frequencies per unit path length. The line strength depends on the difference between the number of molecules that are initially residing in each of the two lower energy states of the corresponding energy transition, as determined by the temperature and partial pressure of the absorbing species and the probability that the transition will occur.
The line shape function characterizes the frequency spread (that is, the width) of the absorption line. At pressures above 0.1 atm for temperatures around 296 K, the
340
line shape function is determined by the rate of molecular collisions; that is called collision broadening. At pressures below 0.01 atm at around the same temperatures, the line shape function is determined by the Doppler effect; that is called Doppler broadening. Note that the linebroadening mechanism is characteristic of the total gas pressure, not the partial pressure of the absorbing species .
Using the standard formula for line strength8 and assuming thermal equilibrium, Eq. 2 becomes
In 71 (VOl) = ~ eXP[(EII
_ E12
) T - To] In 72 ( VOl ) S 02 k8 To T
g(vol ,al ) X
g(vol ,(2 ) (3)
where EI is the lower energy level of the corresponding transition, k8 is the Boltzmann constant, and To is a reference temperature that is equal to 296 K. For the condition I (VOl - v02)1vOI I « 1 (that is, when the absorption lines are very close together in frequency), the ratio of the line shapes in Eq. 3 reduces to the ratio of the half-widths, a 2 I a l ' Using the expression a = a o
(PIPo) ..fTo/T (where a o is the half-width at normal temperature and pressure of To = 296 K and Po = 1 atm, respectively) and solving for the temperature gives
(4)
for pressures in the collision-broadened regime. Since the half-widths at pressures within the Doppler regime are approximately equal, it follows that
(5) k 8 To [ In (71 ) SOl ]
1 - Ell _ EI2 In In ( 72 ) SOl
From Eqs. 4 and 5, it is evident that only the linecenter transmittances of the two absorption lines need be measured to determine the temperature of the gas. The normal-temperature-and-pressure parameters So
and ao, as well as the parameter E I , are obtained from the absorption-line database compiled by the Air Force Geophysics Laboratory. 8
At total gas pressures between 0.01 and 0.1 atm, both collision broadening and Doppler broadening occur; this is called the Voigt regime. Since the ratio of the line shape functions in Eq. 3 will not reduce to a simple expression in this case, the determination of gas temperature is more complicated. To obtain a value of the linestrength ratio that can be used in Eq. 5, the measured transmittance profiles must each be integrated and then
Johns Hopkins APL Technical Digest, Volume 9, Number 4 (/988)
Gearhart, Thomas - Temperature Remote Sensing Using a Tunable Diode Laser
their ratio determined. In this article, to avoid such a complication, conditions where either collision broadening or Doppler broadening dominate are of primary interest.
ABSORPTION LINE SELECTION For the dual-line-ratio technique to be useful in a va
riety of applications, a number of candidate absorption line pairs must be available. Such a requirement is satisfied in the infrared spectrum, where there is a multitude of vibration-rotation absorption lines of various species. The regions from 3 to 5 Jlm and from 8 to 12 Jlm are of particular interest because the effects of water vapor absorption are small for practical path lengths. The general requirements for selecting absorption lines are as follows:
1. The absorbing species must be in thermal equilibrium and the absorption lines must correspond to different vibrational energy transitions.
2. The separation between the lines should be small enough to be scanned with a single frequency sweep of the laser.
3. The separation between the lines should be large enough to preclude significant overlap.
4. The transmittances of the absorption lines should vary between 10070 and 90% over the temperature range of interest.
These requirements are elaborated below. Because of the thermal equilibrium requirement, the
proper selection of the absorbing molecule is critical when measuring highly dynamic environments. Specifically, the absorbing molecules' vibrational relaxation time (that is, the time required for thermal equilibrium of vibrational energy levels) must be less than the time interval over which the temperature changes. The vibrational relaxation time for a given molecule Tv can be expressed as 9
T = v
'TrYJ Z -
v 4 P (6)
where Z v = the number of collisions necessary for equilibrium, YJ = viscosity, and p = pressure.
The maximum absorption-line spacing is limited by the continuous-tuning range of the laser. For a tunable infrared diode laser, the maximum absorption line separations must be about 1 cm - I .
The minimum spacing beyond which the absorption lines overlap significantly is largely dependent on the test environment. For example, at pressures in the collision regime and at temperatures below 1000 K, line-center transmittances of lines separated by less than about 0.5 cm -I may be subject to overlap error because the line widths are relatively large. At lower pressures and higher temperatures, the minimum line-spacing requirements are greatly relaxed. Line overlap errors are discussed in more detail later.
The transmittances of the absorption lines also depend on properties of the test environment -specifically, the
Johns Hopkins A PL Technical Digest, Volum e 9, Number 4 (1988)
path length, absorber concentration, temperature, and total pressure. If the test environment is such that one or both of the line-center transmittances is either close to 100% or close to 0%, then the changes in transmittance with temperature will be small and of the same order as the measurement errors. Hence, the temperature-measurement errors will be large. Although in most cases the properties of the test environment are fixed, the absorption line selection process does allow some control over transmittance values for a given environment. For example, two absorption lines whose line strengths at normal temperature and pressure are as close as possible will yield better measurement accuracy at low temperatures than two lines whose line strengths at normal temperature and pressure differ by a larger amount.
Carbon monoxide was selected for this study partly because of its abundance in most combustion processes, where the dual-line-ratio technique might be useful. In addition, carbon monoxide has some other attractive features. First, the separation between the fundamental vibration-rotation lines (that is, the 1-0 vibration lines) is
where Be is the rotational constant for CO (Be = 1.93 cm - I). In most test situations, the lines are far enough apart to preclude significant overlap errors. Moreover, the fundamental vibration band and the 2-1 vibration band overlap; hence, it is likely that there are a number of 1-0, 2-1 line pairs that meet the spacing requirements discussed previously.
However, carbon monoxide may be unacceptable for some highly dynamic environments because of its long Tv at some temperatures and pressures. To calculate Tv
for carbon monoxide using Eq. 6, v(1) was obtained from the CRC Handbook of Chemistry and Physics. 10
The data were fit to the following equation:
YJ(1)=a+bfl , (7)
where the coefficients for carbon monoxide are a = - 78.7 JlPoise and b = 14.9 JlPoise' K Y2 . Substituting Eq. 7 into Eq. 6 yields
Tv = (-6.1 + 1.16 fl ) x 10 - 11 Z v 1p , (8)
where p is in atmospheres. Table 1 is generated from Eq. 8 for a pressure of 1
atm. It is clear from Table 1 that high-pressure, hightemperature environments are desirable for fast equilibrium times. Scaling down the pressure in Eq. 8 also indicates that in the Doppler regime (that is, pressures no greater than 0.01 atm), a relatively long time is required to reach thermal equilibrium in the temperature range from 500 to 1000 K.
341
Gearhart, Thomas - Temperature Remote Sensing Using a Tunable Diode Laser
Table 1-Vibrational relaxation time for carbon monoxide.
T p Tv
(K) (atm) Z v (s)
500 1.0 2 X 10⁸ 4.0 X 10 - 2
1000 1.0 5 X 10⁶ 1.5 X 10- 3
2000 1.0 2 X 10⁵ 9.1 X 10 - 5
3000 1.0 2 X 10⁴ 1.1 X 10 - 5
4000 1.0 6 X 10³ 4.0 X 10 - 6
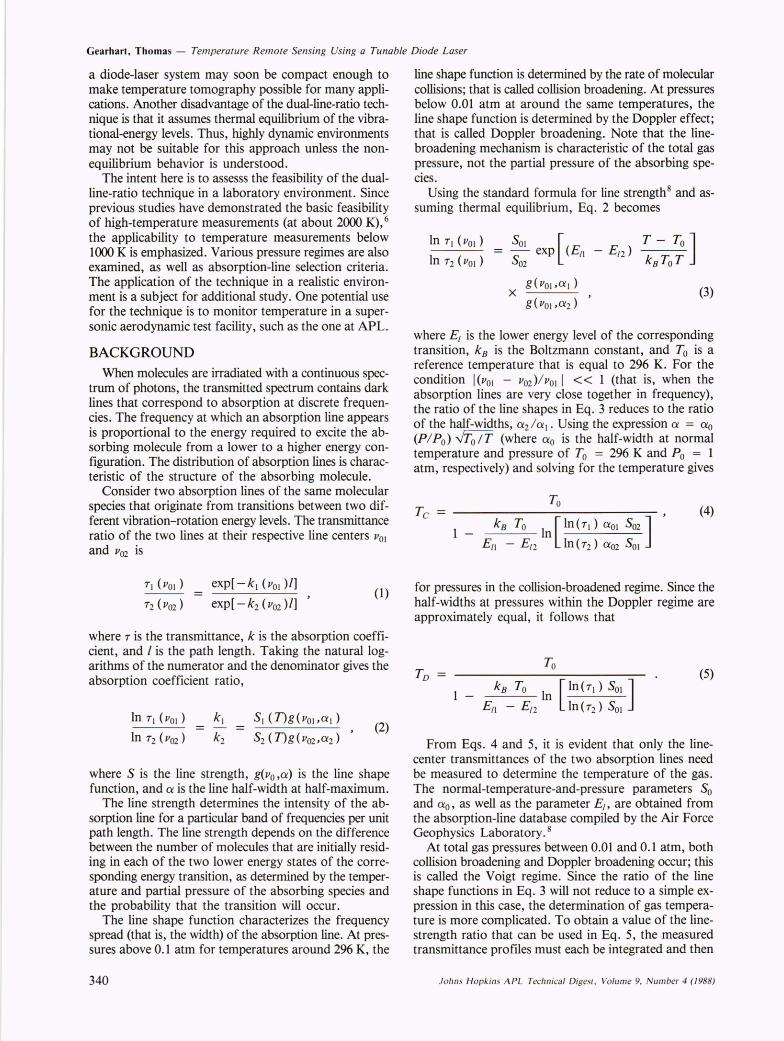
EXPERIMENT Figure 2 shows the experimental setup. The diverging
beam from the diode laser is collected and collimated by a barium fluoride lens with a focal length of 2S.0 mm. The collimated beam is chopped at 260 Hz and focused on the monochromator input slit with a barium fluoride lens with a focal length of 37.S mm. The McPherson Model 270 grating monochromator (3S0-mm focal length) serves as an optical bandpass filter to isolate a single laser mode. The monochromator input! output slit width is 300 /lm. That width is large enough to pass the single laser mode over the required tuning range, but small enough to ensure single-mode isolation.
The monochromator output is recollimated by a second barium fluoride lens (37.S-mm focal length) and strikes a calcium fluoride beam splitter. The transmitted beam enters the vacuum enclosure through a barium fluoride window, reflects from a first-surface mirror through the test cell, and exits the vacuum enclosure through a second barium fluoride window. The heated
Helium-neon alignment laser
Infrared diode laser
Plotter
,..--..100..-__ ---,,,
InpuVoutput coupling lenses
c>------J/
Single-mode Germanium laser beam etalon
Gas inlet
Vacuum enclosure
Lock-in amplifier
Lock-in amplifier
~
Signal in
Indium antimonide detector
Focusing lenses
t Signal in
Figure 2-Experimental setup and apparatus.
342
test cell contains various mixtures of carbon monoxide and nitrogen. The beam reflected by the beam splitter strikes a germanium Fabry-Perot etalon.
A laser beam transmitted through the etalon undergoes multiple reflections between the interior parallel surfaces that overlap and interfere. Constructive interference occurs each time the laser wavelength is an integral multiple of twice the etalon optical thickness. When this occurs the laser beam output from the etalon is at maximum intensity. By counting etalon transmittance maxima, the tuning rate of the laser can be monitored. The laser wavelength change that corresponds to a change from one etalon transmittance peak to the next is specified by the free spectral range of the etalon. The etalon used here has a free spectral range (in wavenumbers) of 0.066 cm - 1.
The test cell and etalon outputs are each focused by barium fluoride lenses (200-mm focal length) onto liquidnitrogen-cooled indium-antimony detectors. Two lock-in amplifiers demodulate the detector outputs. A synchronization signal from the chopper supplies the lock-in amplifier reference signals. A dual-channel x-y plotter records the demodulated detector voltages.
The diode-laser system, manufactured by the Laser Analytics Division of Spectra Physics, consists of the lasers and cold head, the cryogenic refrigerator, the vacion pump and control unit, the cryogenic temperature stabilizer, and the laser control module. The particular diode laser used belongs to the lead-salt family. The output power is about 1 m W in the region of 4.67 /lm. The laser operates simultaneously at 3 to S frequency modes. The line width of a single laser mode, as specified by the manufacturer, is about 1.00 X 10 - 4 cm -1 . It is the narrow line width, combined with the ability to be tuned, that makes the diode laser an excellent tool for highresolution spectroscopy.
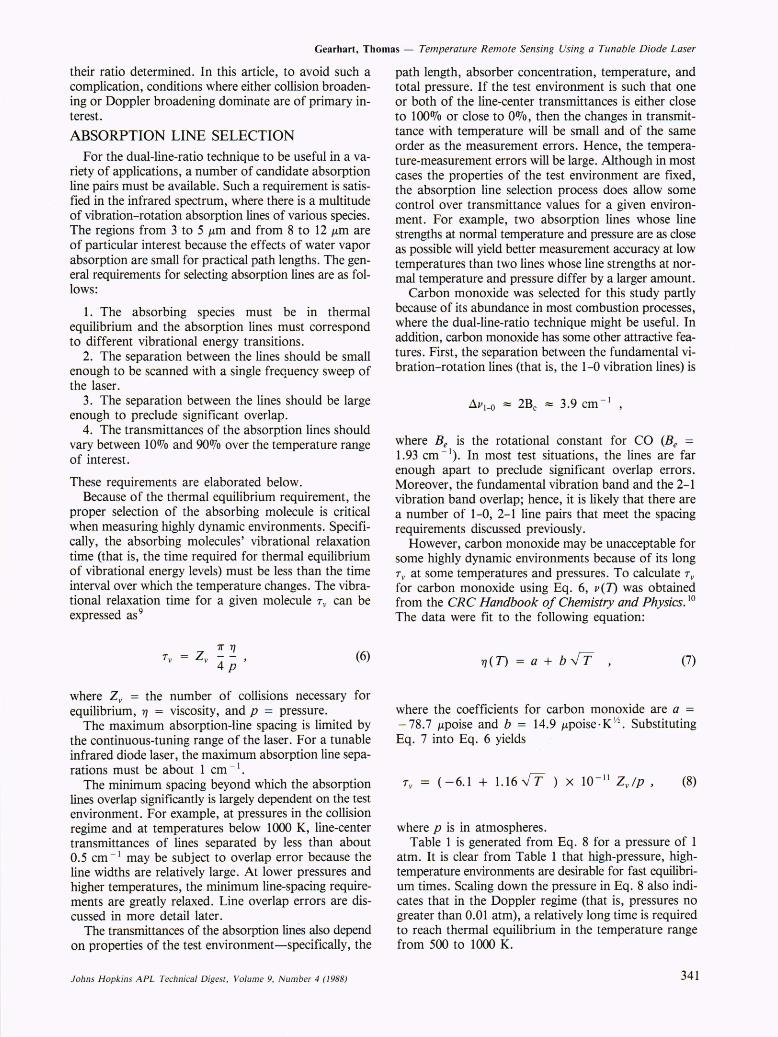
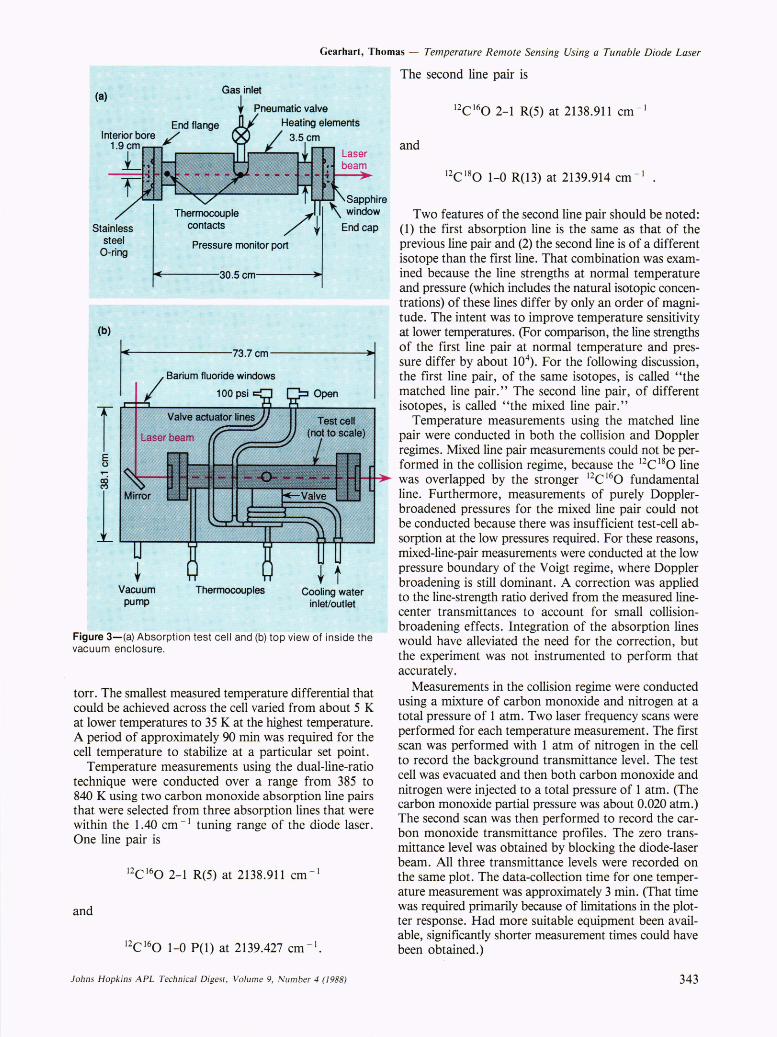
Figure 3a illustrates the test cell, which is constructed of 316 stainless steel. The cell is 30S mm long and has a center bore of 19.0 mm. Optical access is provided by two sapphire windows, one at each end of the cell. Gas enters the cell through the vertical stem via a pneumatically actuated valve that is normally closed. The valve is activated by two solenoid valves and a l00-psi nitrogen supply. Pressure gauges, which are connected to the lower stem in the right end-flange, monitor the cell pressure. The cell is instrumented with ceramic heating elements that are packed in zirconium oxide insulation and radiation shielding. Two type-K thermocouples in contact with the outside wall at the center and end of the cell monitor the temperature.
The test cell was designed to reach temperatures of 780 K. The 2S.4-mm-diameter, 6.3S-mm-thick sapphire windows were each specially brazed and sealed to the stainless-steel end-caps by Ceradyne, a California-based company. Stainless-steel O-rings were used to seal the end-caps to the cell end-flanges. To improve temperature uniformity and to reduce heat loss, the aluminum vacuum enclosure was constructed to encapsulate the test cell.
Figure 3b shows the dimensions of the enclosure. During operation, the enclosure is evacuated to about 0.2S0
Johns H opkins APL Technical DIgest, Volume 9, Number 4 (1988)
Gearhart, Thomas - Temperature Remote Sensing Using a Tunable Diode Laser
(a)
(b)
T E (,)
T""
1
Gas inlet
Pressure monitor port
...... ----30.5 r.m----~
Vacuum pump
Thermocouples Cooling water inleVoutiet
Figure 3-(a) Absorption test cell and (b) top view of inside the vacuum enclosure.
torr. The smallest measured temperature differential that could be achieved across the cell varied from about 5 K at lower temperatures to 35 K at the highest temperature. A period of approximately 90 min was required for the cell temperature to stabilize at a particular set point.
Temperature measurements using the dual-line-ratio technique were conducted over a range from 385 to 840 K using two carbon monoxide absorption line pairs that were selected from three absorption lines that were within the 1.40 cm - I tuning range of the diode laser. One line pair is
12C 160 2-1 R(5) at 2138.911 cm - I
and
Johns Hopkins A PL Technical Digest , Volum e 9, N um ber 4 (1988)
The second line pair is
12C160 2-1 R(5) at 2138.911 cm - I
and
12C180 1-0 R(13) at 2139.914 cm - I .
Two features of the second line pair should be noted: (1) the first absorption line is the same as that of the previous line pair and (2) the second line is of a different isotope than the first line. That combination was examined because the line strengths at normal temperature and pressure (which includes the natural isotopic concentrations) of these lines differ by only an order of magnitude. The intent was to improve temperature sensitivity at lower temperatures. (For comparison, the line strengths of the first line pair at normal temperature and pressure differ by about 104
). For the following discussion, the first line pair, of the same isotopes, is called "the matched line pair." The second line pair, of different isotopes, is called "the mixed line pair."
Temperature measurements using the matched line pair were conducted in both the collision and Doppler regimes. Mixed line pair measurements could not be performed in the collision regime, because the 12C
180 line
was overlapped by the stronger 12C 16
0 fundamental line. Furthermore, measurements of purely Dopplerbroadened pressures for the mixed line pair could not be conducted because there was insufficient test-cell absorption at the low pressures required. For these reasons, mixed-line-pair measurements were conducted at the low pressure boundary of the Voigt regime, where Doppler broadening is still dominant. A correction was applied to the line-strength ratio derived from the measured linecenter transmittances to account for small collisionbroadening effects. Integration of the absorption lines would have alleviated the need for the correction, but the experiment was not instrumented to perform that accurately.
Measurements in the collision regime were conducted using a mixture of carbon monoxide and nitrogen at a total pressure of 1 atm. Two laser frequency scans were performed for each temperature measurement. The first scan was performed with 1 atm of nitrogen in the cell to record the background transmittance level. The test cell was evacuated and then both carbon monoxide and nitrogen were injected to a total pressure of 1 atm. (The carbon monoxide partial pressure was about 0.020 atm.) The second scan was then performed to record the carbon monoxide transmittance profiles . The zero transmittance level was obtained by blocking the diode-laser beam. All three transmittance levels were recorded on the same plot. The data-collection time for one temperature measurement was approximately 3 min. (That time was required primarily because of limitations in the plotter response. Had more suitable equipment been available, significantly shorter measurement times could have been obtained.)
343
Gearhart, Thomas - Temperature Remote Sensing Using a Tunable Diode Laser
Measurements in the Doppler and the Doppler-dominated Voigt regimes were conducted on carbon monoxide alone, at pressures of 0.001 and 0.020 atm for the matched and mixed line pairs, respectively. Because of the narrow widths of the absorption lines, a separate background scan was not required. Rather, the background level at line-center was interpolated from points on the tails of the absorption lines. The zero transmittance level was again determined by blocking the laser beam.
The tuning rate of the laser for each of the measurements described above was 7.00 x 10 - 3 wavenumber/ so That rate was selected to be slow enough to provide adequate resolution of the transmittance profIles on the plotter, yet fast enough to ensure that test conditions would not change during the scan. The time constants of the lock -in amplifiers were set as long as possible (300 ms) to reject signal fluctuations outside the passband.
The measured line-center transmittance values were inserted into either Eq. 4 or Eq. 5 to calculate the temperature.
RESULTS
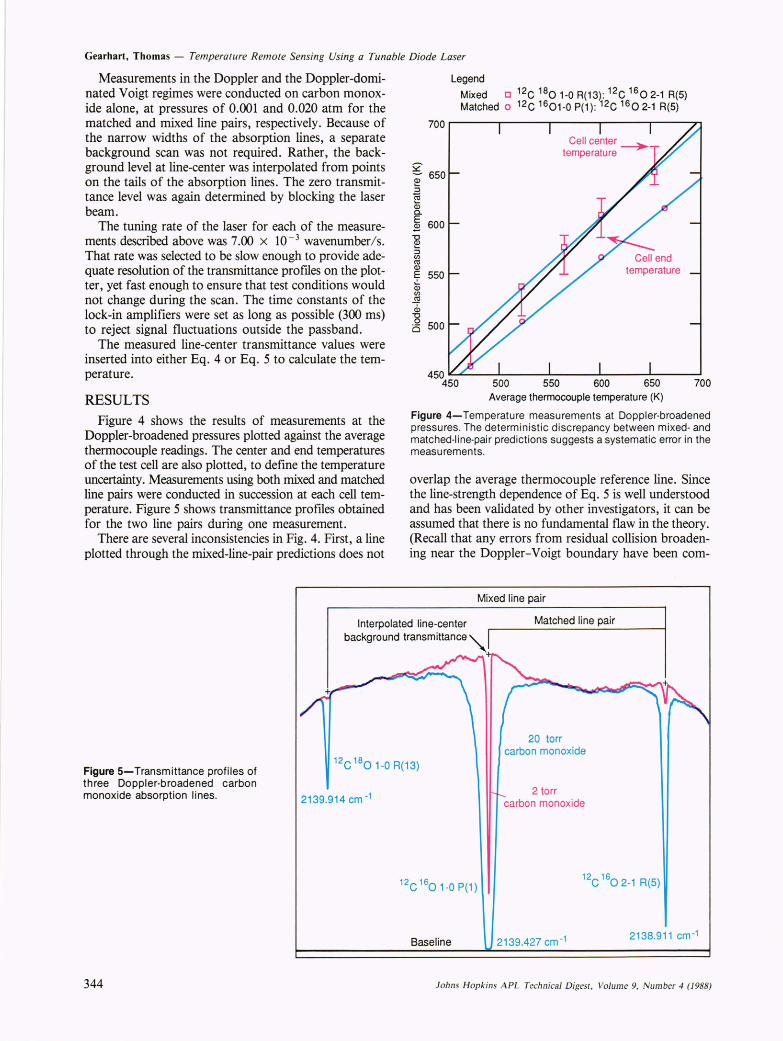
Figure 4 shows the results of measurements at the Doppler-broadened pressures plotted against the average thermocouple readings. The center and end temperatures of the test cell are also plotted, to define the temperature uncertainty. Measurements using both mixed and matched line pairs were conducted in succession at each cell temperature. Figure 5 shows transmittance profIles obtained for the two line pairs during one measurement.
There are several inconsistencies in Fig. 4. First, a line plotted through the mixed-line-pair predictions does not
Legend Mixed 0 12C 1801 _0 R(13) : 12C 1602-1 R(5) Matched 0 12C 1601 -0 P(1) : 12C 16 02-1 R(5)
700r-----~------r-----~------r-----~
g 650 ~ ::l Cii Q; a. E 2 600
~ ::l CIl ~ Q)
E 550 ci; CIl .!!l cD "8 (5 500
temperature
450~~--~------~----~------~----~
450 500 550 600 650 700 Average thermocouple temperature (K)
Figure 4-Temperature measurements at Doppler-broadened pressures. The deterministic discrepancy between mixed- and matched-line-pair predictions suggests a systematic error in the measurements.
overlap the average thermocouple reference line. Since the line-strength dependence of Eq. 5 is well understood and has been validated by other investigators, it can be assumed that there is no fundamental flaw in the theory. (Recall that any errors from residual collision broadening near the Doppler-Voigt boundary have been com-
Mixed line pair
Interpolated line-center
background transmittance '"
Matched line pair
Figure 5-Transmittance profiles of three Doppler-broadened carbon monoxide absorption lines.
344
12C 180 1-0 R(13)
2139.914 cm-1
12C 1601 _0 P(1)
Baseline
20 torr carbon monoxide
2 torr carbon monoxide
2139.427 cm -1 2138.911 cm -1
Johns Hopkins A PL Technical Digest, Volume 9, Number 4 (1988)
Gearhart, Thomas - Temperature Remote Sensing Using a Tunable Diode Laser
pensated.) One possible source of error is the line strengths at normal temperature and pressure used in Eq. 5 to determine the temperature. Although such an error may be present, calculations indicate that the result would be primarily a vertical shift in the plotted data rather than a change in slope. Based on our experience with the test cell, we feel that the dominant error lies not with the dual-line-ratio technique but with the ability to measure the average cell temperature with only two thermocouples. Note that the plotted data are within the cell-temperature uncertainty limits.
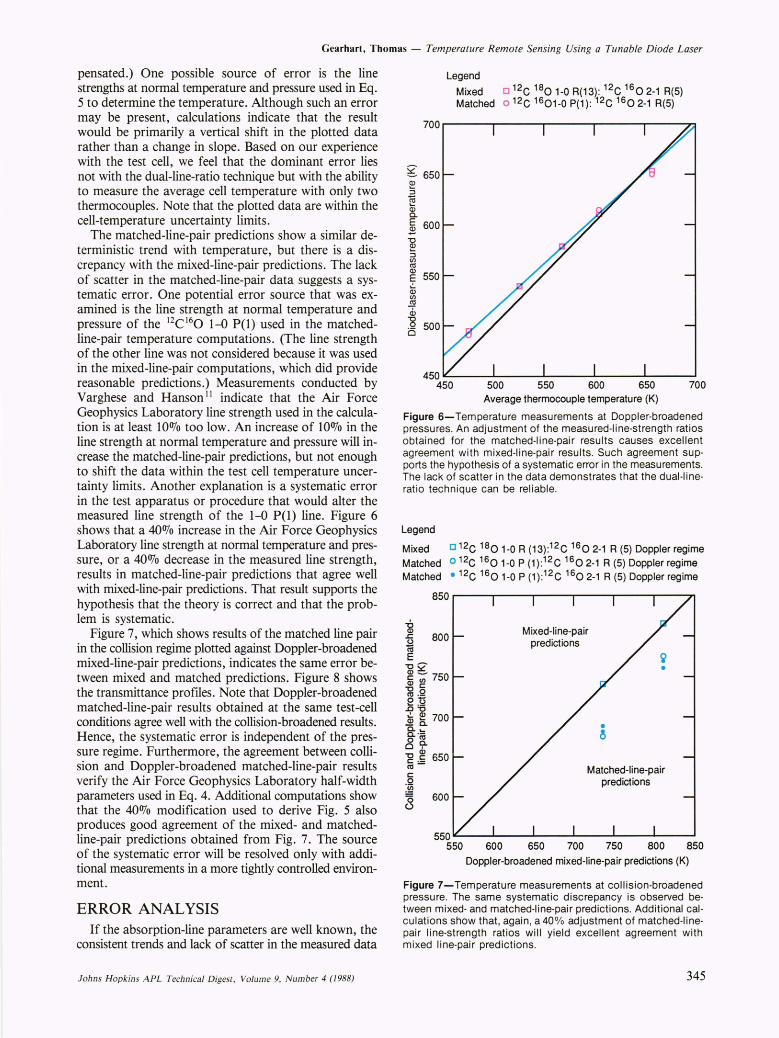
The matched-line-pair predictions show a similar deterministic trend with temperature, but there is a discrepancy with the mixed-line-pair predictions. The lack of scatter in the matched-line-pair data suggests a systematic error. One potential error source that was examined is the line strength at normal temperature and pressure of the 12C l60 1-0 P(I) used in the matchedline-pair temperature computations. (The line strength of the other line was not considered because it was used in the mixed-line-pair computations, which did provide reasonable predictions.) Measurements conducted by Varghese and Hanson I I indicate that the Air Force Geophysics Laboratory line strength used in the calculation is at least 10% too low. An increase of 10070 in the line strength at normal temperature and pressure will increase the matched-line-pair predictions, but not enough to shift the data within the test cell temperature uncertainty limits. Another explanation is a systematic error in the test apparatus or procedure that would alter the measured line strength of the 1-0 P(1) line. Figure 6 shows that a 40% increase in the Air Force Geophysics Laboratory line strength at normal temperature and pressure, or a 40% decrease in the measured line strength, results in matched-line-pair predictions that agree well with mixed-line-pair predictions. That result supports the hypothesis that the theory is correct and that the problem is systematic.
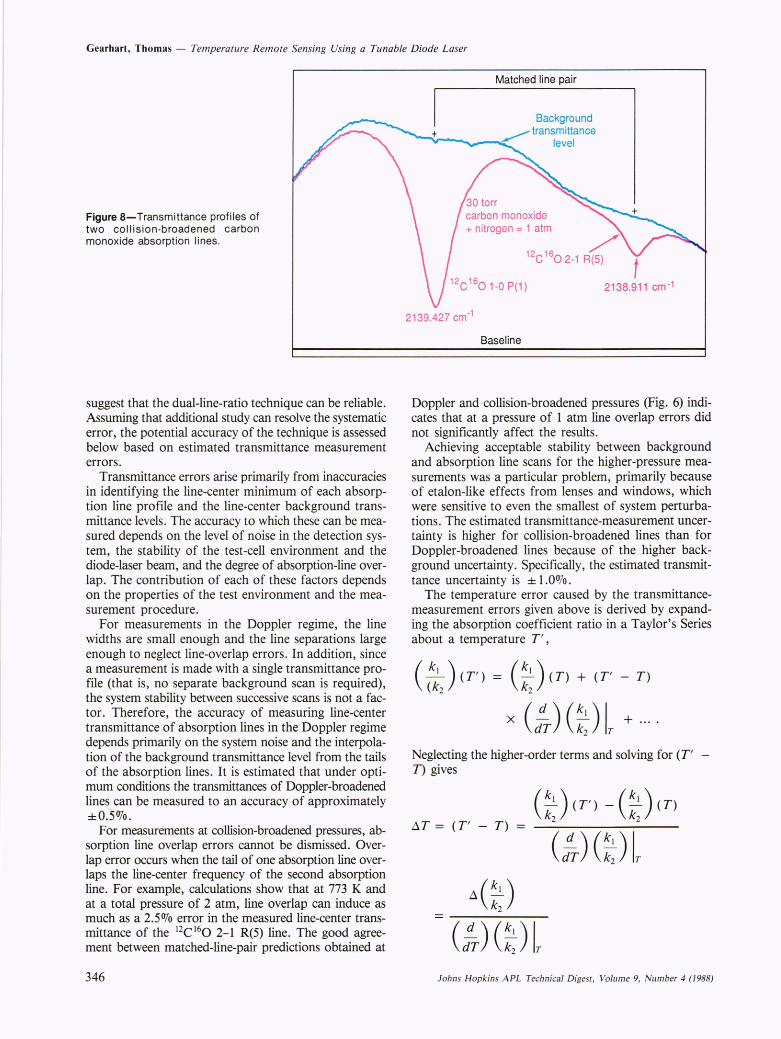
Figure 7, which shows results of the matched line pair in the collision regime plotted against Doppler-broadened mixed-line-pair predictions, indicates the same error between mixed and matched predictions. Figure 8 shows the transmittance profiles. Note that Doppler-broadened matched-line-pair results obtained at the same test-cell conditions agree well with the collision-broadened results. Hence, the systematic error is independent of the pressure regime. Furthermore, the agreement between collision and Doppler-broadened matched-line-pair results verify the Air Force Geophysics Laboratory half-width parameters used in Eq. 4. Additional computations show that the 40% modification used to derive Fig. 5 also produces good agreement of the mixed- and matchedline-pair predictions obtained from Fig. 7. The source of the systematic error will be resolved only with additional measurements in a more tightly controlled environment.
ERROR ANALYSIS If the absorption-line parameters are well known, the
consistent trends and lack of scatter in the measured data
f ohns Hopkins A PL Technical Digest, Volum e 9, N umber 4 (1988)
Legend Mixed [J 12C 1801 _0 R(13): 12C 1602_1 R(5) Matched 0 12C 1601-0 P(1): 12C 1602-1 R(5)
700~-----r------~-----r------r-----~
g 650 Q)
:s ca Q; a. § 600
-g ~ en C13
E 550 ~ en ~ d> "8 i:S 500
450~----~----~------~----~----~
450 500 550 600 650 700 Average thermocouple temperature (K)
Figure 6-Temperature measurements at Doppler-broadened pressures. An adjustment of the measured-line-strength ratios obtained for the matched-line-pair results causes excellent agreement with mixed-line-pair results . Such agreement supports the hypothesis of a systematic error in the measurements. The lack of scatter in the data demonstrates that the dual-lineratio technique can be reliable.
Legend
Mixed [J 12C 1801-0 R (13):12C 1602-1 R (5) Doppler regime Matched 0 12C 1601-0 P (1):12C 1602-1 R (5) Doppler regime Matched • 12C 1601-0 P (1) :12C 1602_1 R (5) Doppler regime
850
-g "fi 800 ca E "OQ' ~ --;;; 750 Q) c -g.Q 0'0 .0'0 .9} ~ 700 a. .... g.·a 09-"0 ~ 650 ~= c o ~ o 600 <..>
Mixed-line-pair predictions
• ~
~ •
Matched-line-pair predictions
550~--~----~----~--~----~--~
550 600 650 700 750 800 850 Doppler-broadened mixed-line-pair predictions (K)
Figure 7-Temperature measurements at collision-broadened pressure. The same systematic discrepancy is observed between mixed- and matched-line-pair predictions. Additional calculations show that , again , a 40 % adjustment of matched-linepair line-strength ratios will yield excellent agreement with mixed line-pair predictions.
345
Gearhart, Thomas - Temperature Remote Sensing Using a Tunable Diode Laser
Figure 8-Transmittance profiles of two collision-broadened carbon monoxide absorption lines.
suggest that the dual-line-ratio technique can be reliable. Assuming that additional study can resolve the systematic error, the potential accuracy of the technique is assessed below based on estimated transmittance measurement errors.
Transmittance errors arise primarily from inaccuracies in identifying the line-center minimum of each absorption line profile and the line-center background transmittance levels. The accuracy to which these can be measured depends on the level of noise in the detection system, the stability of the test-cell environment and the diode-laser beam, and the degree of absorption-line overlap. The contribution of each of these factors depends on the properties of the test environment and the measurement procedure.
For measurements in the Doppler regime, the line widths are small enough and the line separations large enough to neglect line-overlap errors. In addition, since a measurement is made with a single transmittance profile (that is , no separate background scan is required), the system stability between successive scans is not a factor. Therefore, the accuracy of measuring line-center transmittance of absorption lines in the Doppler regime depends primarily on the system noise and the interpolation of the background transmittance level from the tails of the absorption lines. It is estimated that under optimum conditions the transmittances of Doppler-broadened lines can be measured to an accuracy of approximately ±0.5<rJo.
For measurements at collision-broadened pressures, absorption line overlap errors cannot be dismissed. Overlap error occurs when the tail of one absorption line overlaps the line-center frequency of the second absorption line. For example, calculations show that at 773 K and at a total pressure of 2 atm, line overlap can induce as much as a 2.5% error in the measured line-center transmittance of the 12C
160 2-1 R(5) line. The good agreement between matched-line-pair predictions obtained at
346
Matched line pair
Background ~ transmittance
- ......... ----""'- level
carbon monoxide + nitrogen = 1 atm
2139.427 cm-1
Baseline
2138.911 cm -1
Doppler and collision-broadened pressures (Fig. 6) indicates that at a pressure of 1 atm line overlap errors did not significantly affect the results.
Achieving acceptable stability between background and absorption line scans for the higher-pressure measurements was a particular problem, primarily because of etalon-like effects from lenses and windows, which were sensitive to even the smallest of system perturbations. The estimated transmittance-measurement uncertainty is higher for collision-broadened lines than for Doppler-broadened lines because of the higher background uncertainty. Specifically, the estimated transmittance uncertainty is ± 1.0%.
The temperature error caused by the transmittancemeasurement errors given above is derived by expanding the absorption coefficient ratio in a Taylor's Series about a temperature T',
( ~) (T') = (~) (T) + (T' - T) (k2 k 2
x (:T)G;H + ....
Neglecting the higher-order terms and solving for (T' T) gives
l1T = (T' - T) =
LlG:)
(t,)(T') -(t,)(T)
(:T)(:;H
(:T)G;H f ohns Hopkins A PL Technical Digest, Volume 9, Number 4 (1988)
Gearhart, Thomas - Temperature Remote Sensing Using a Tunable Diode Laser
Differentiating either Eq. 4 or 5, depending on the pressure regime, gives (d/dT) / (k ) /k2 ) I T. Substituting the value above yields
jj.T =
1.439 jj.£ SO) a02 [ ( 1 2 exp 1.439 jj.£ -
T S02aO) To -DJ ' (9)
where jj.£ = (E/1 - E/2 ) / he.
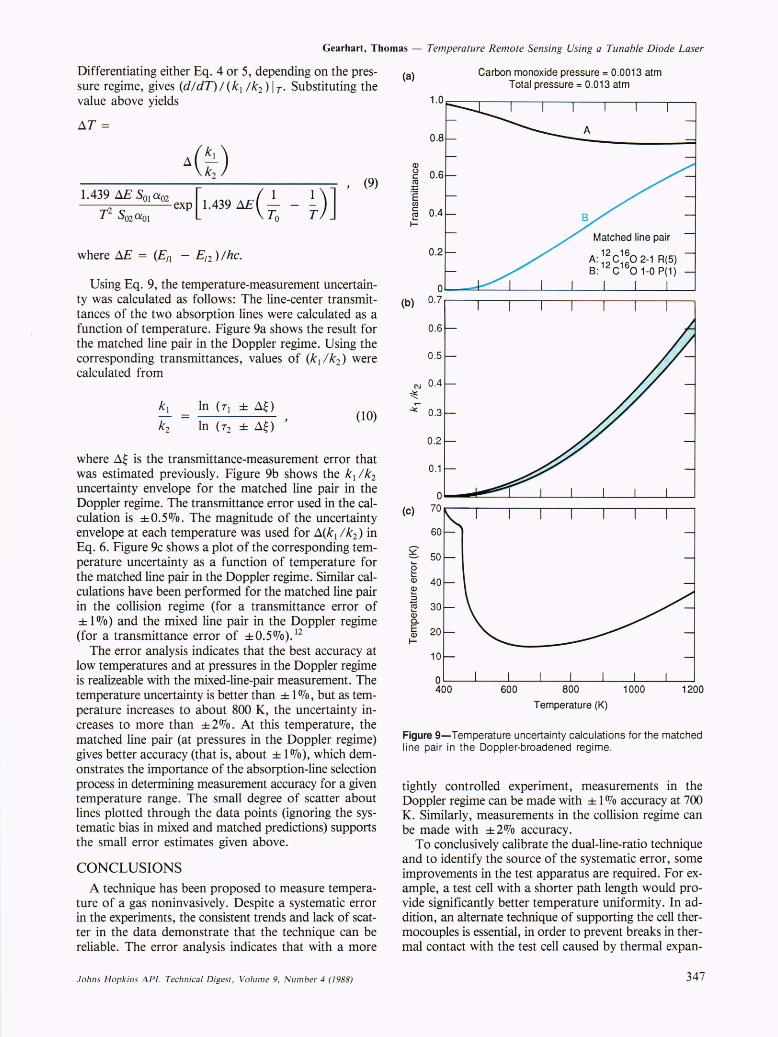
Using Eq. 9, the temperature-measurement uncertainty was calculated as follows: The line-center transmittances of the two absorption lines were calculated as a function of temperature. Figure 9a shows the result for the matched line pair in the Doppler regime. Using the corresponding transmittances, values of (k) I k2 ) were calculated from
In (7) ± jj.O
In (72 ± jj.O (10)
where jj.~ is the transmittance-measurement error that was estimated previously. Figure 9b shows the k) Ik2 uncertainty envelope for the matched line pair in the Doppler regime. The transmittance error used in the calculation is ±0.5Ofo. The magnitude of the uncertainty envelope at each temperature was used for jj.(k) I k2 ) in Eq. 6. Figure 9c shows a plot of the corresponding temperature uncertainty as a function of temperature for the matched line pair in the Doppler regime. Similar calculations have been performed for the matched line pair in the collision regime (for a transmittance error of ± 1 %) and the mixed line pair in the Doppler regime (for a transmittance error of ±0.5%).)2
The error analysis indicates that the best accuracy at low temperatures and at pressures in the Doppler regime is realizeable with the mixed-line-pair measurement. The temperature uncertainty is better than ± 1 %, but as temperature increases to about 800 K, the uncertainty increases to more than ±2%. At this temperature, the matched line pair (at pressures in the Doppler regime) gives better accuracy (that is, about ± 1 %), which demonstrates the importance of the absorption-line selection process in determining measurement accuracy for a given temperature range. The small degree of scatter about lines plotted through the data points (ignoring the systematic bias in mixed and matched predictions) supports the small error estimates given above.
CONCLUSIONS A technique has been proposed to measure tempera
ture of a gas noninvasively. Despite a systematic error in the experiments, the consistent trends and lack of scatter in the data demonstrate that the technique can be reliable. The error analysis indicates that with a more
Johns Hopkins A PL Tech nical Digesc, Volume 9, N umber 4 (1988)
(a)
Cl> 0 c: rei ::: 'E Ul c: ~ I-
(b)
N
~ ~
(c)
g e Q; Cl> :s q; Q; 0.. E Cl> I-
0.6
0.4
0.2
0 0.7
0.2
0.1
70
50
30
20
10
0 400
Carbon monoxide pressure = 0.0013 atm Total pressure = 0.013 atm
600 800 1000
Temperature (K)
1200
Figure 9-Temperature uncertainty calculations for the matched line pair in the Doppler-broadened regime.
tightly controlled experiment, measurements in the Doppler regime can be made with ± 1 % accuracy at 700 K. Similarly, measurements in the collision regime can be made with ± 2 % accuracy.
To conclusively calibrate the dual-line-ratio technique and to identify the source of the systematic error, some improvements in the test apparatus are required. For example, a test cell with a shorter path length would provide significantly better temperature uniformity. In addition, an alternate technique of supporting the cell thermocouples is essential, in order to prevent breaks in thermal contact with the test cell caused by thermal expan-
347
Gearhart, Thomas - Temperature Remote Sensing Using a Tunable Diode Laser
sion. Also, a pressure gauge that has a resolution of less than 1 torr would ensure a controlled cell environment for low-pressure measurements. Replacing lenses in the optical system with off-axis aspheric mirrors and replacing plane parallel windows with wedged windows would greatly reduce etalon effects, which degrade the transmittance spectra.
Since the precision of the absorption-line parameters at normal temperature and pressure are crucial to the dual-line-ratio technique, a calibration of the technique must include accurate measurement of those parameters. Because of its narrow single-mode line width, the tunable diode laser is an ideal tool for such measurements. Such measurements require a precisely controlled environment.'
The development of a system that uses the dual-lineratio technique in a particular application will require careful consideration of all environmental parameters, including knowledge of the temperature and pressure ranges, the gas chemical composition, and the flow tirnehistory. In addition, implementation issues such as laser power requirements, measurement interval, and optical access to the environment must be considered.
REFERENCES I J. Reid, J. Shewchum, B. K. Garside, and E. A. Ballik , "High Sensitivity Pollution Detection Employing Tunable Diode Lasers," Appl. Opt. 17, 300-306 (1978).
20. T. Cassidy and J . Reid, " Atmospheric Monitoring of Trace Gases Using Tunable Diode Lasers," Appl. Opt. 21 , 1185-1190 (1982).
3M. D. Levenson, "Coherent Raman Spectroscopy," Phys. Today 30, 44-49 (1977).
4R. E. Lee, R. Turner, and R. C. Benson, "Optical Measurements for Ramjet Engine Development," Johns Hopkins APL Tech. Dig. 4, 196-204 (1983).
5 J. Y. Wang, "Laser Absorption Methods for Simultaneous Determination of Temperature and Species Concentration Through a Cross Section of Radiating Flow," Appl. Opt. 15, 768-773 (1976).
6R. K. Hanson and P . K. Falcone, "Temperature Measurements Technique for High-Temperature Gases Using a Tunable Diode Laser," Appl. Opt. 17, 2477-2480 (1978).
348
7 A. Y. Chang, E. C. Rea, Jr., and R. K. Hanson, "Temperature Measurements in Shock Tubes Using a Laser-Based Absorption Technique," Appl. Opt. 26, 885-891 (1987) .
8L. S. Rothman , "AFGL Atmospheric Absorption Line Parameters Compilation: 1980 Version," Appl. Opt. 20, 791 (1981).
9 J . G. Parker, "Comparison of Experimental and Theoretical Vibrational Relaxation Times for Diatomic Gases," J. Chem. Phys. 41, 1600-1609 (1964).
lOR. C. Weast, M. J. Astle, and W. H. Beyer, eds. CRC Handbook ofChemistry and Physics, 68th Ed., CRC Press, p. F-44 (1987).
II P. L. Varghese and R. K. Hanson, "Tunable Infrared Diode Laser Measurements of Line Strengths and Collision Widths of 12C 160 at Room Temperature," J. Quant. Spectrosc. Radiat. Transfer. 24, 479-489 (1980).
12S. A. Gearhart and M. E. Thomas, Evaluation of a Temperature Remote Sensing Technique, JHU/ APL TG 1365 (1987).
ACKNOWLEDGMENT-The authors gratefully acknowledge the support and guidance of William J. Tropf and Christopher Davis.
THE AUTHORS
scon A. GEARHART graduated from the Pennsylvania State University in 1982 with a B.S. degree in engineering science. He received an M.S. degree in electrical engineering from the University of Maryland in 1987. Mr. Gearhart joined APL in 1983 and has worked primarily on the development and evaluation of optical and infrared sensors for guidance and surveillance applications. He has also participated in IR&D efforts in optical radar processing and laser remote sensing, as well as biomedical studies in laser angiography and laser Doppler velocimetry bf simulated blood flow .
MICHAEL E . THOMAS' s biography can be found on p. 338.
Johns Hopkin s APL Technical Digest, Volume 9, Number 4 (1988)