temkin group insight report net promoter score … · many large companies use net promoter® score...
TRANSCRIPT
TEMKINGROUPINSIGHTREPORT
NETPROMOTERSCOREBENCHMARKSTUDY,2017SIXTHANNUALSTUDYANALYZINGNPSFOR299COMPANIESACROSS20INDUSTRIES
ByBruceTemkinCustomerExperienceTransformist&ManagingPartnerOctober2017
[email protected]/916-2075TEMKINGROUP.COM
TEMKINGROUPINSIGHTREPORT www.temkingroup.com
Copyright©2017TemkinGroup.Allrightsreserved. Page2
ExecutiveSummaryManylargecompaniesuseNetPromoter®Score(NPS)toevaluatetheircustomers’loyalty.Tocomparescoresacrossorganizationsand industries,TemkinGroupmeasuredtheNPSofalmost300companiesacross 20 industries based on a survey of 10,000 U.S. consumers. Here are the highlights from thisbenchmark:< WithanNPSof66,USAA’sinsurancebusinessearnedthehighestscoreinthestudyforthefifthyearin
arow.< ComcastreceivedthelowestNPSforthethirdyearinarowwithascoreof-9.< The industryaverage forNPS ranged fromahighof43 forautodealersdown toa lowof9 forTV&
Internetserviceproviders.< Citibank,whoseNPSlagged35pointsbehindthebankingaverage,fellthefarthestbehinditspeers.< AllindustriessawtheiraverageNPSdeclineoverthepastyear,thoughutilitiesdroppedthemost.< 18- to 24-year-old consumers give companies the lowest NPS (with an average score of 17 across
industries), while consumers 65 and older give the highest NPS (with an average score of 38 acrossindustries).
< NPSishighlycorrelatedwithcustomerexperience.Onaverage,customerexperienceleadersenjoyanNPSover18pointshigherthancustomerexperiencelaggards.
USAAandJetBlueLeadtheNPSBenchmarkof299U.S.Companies
OurresearchshowsthatmanylargecompaniesuseNetPromoterScore(NPS)toevaluatecustomerexperience, so we benchmarked the NPS of 299 companies across 20 industries.1 In order tocompletethisanalysis,we:
§ Surveyed U.S. consumers. Using an online survey, we asked 10,000 U.S. consumers toprovide feedbackon the companies that theyhad interactedwithduring theprevious90days.2RespondentsansweredthestandardNPSquestion:Howlikelyareyoutorecommend<company> to friends and colleagues? Consumers selected a response from 0 (not at alllikely)to10(extremelylikely).
§ Categorized respondents as promoters, passives, and detractors. For each company,wedeterminedthepercentagesofitsrespondentswhowerepromoters(selected9or10),passives(selected7or8),ordetractors(selectedbetween0and6).
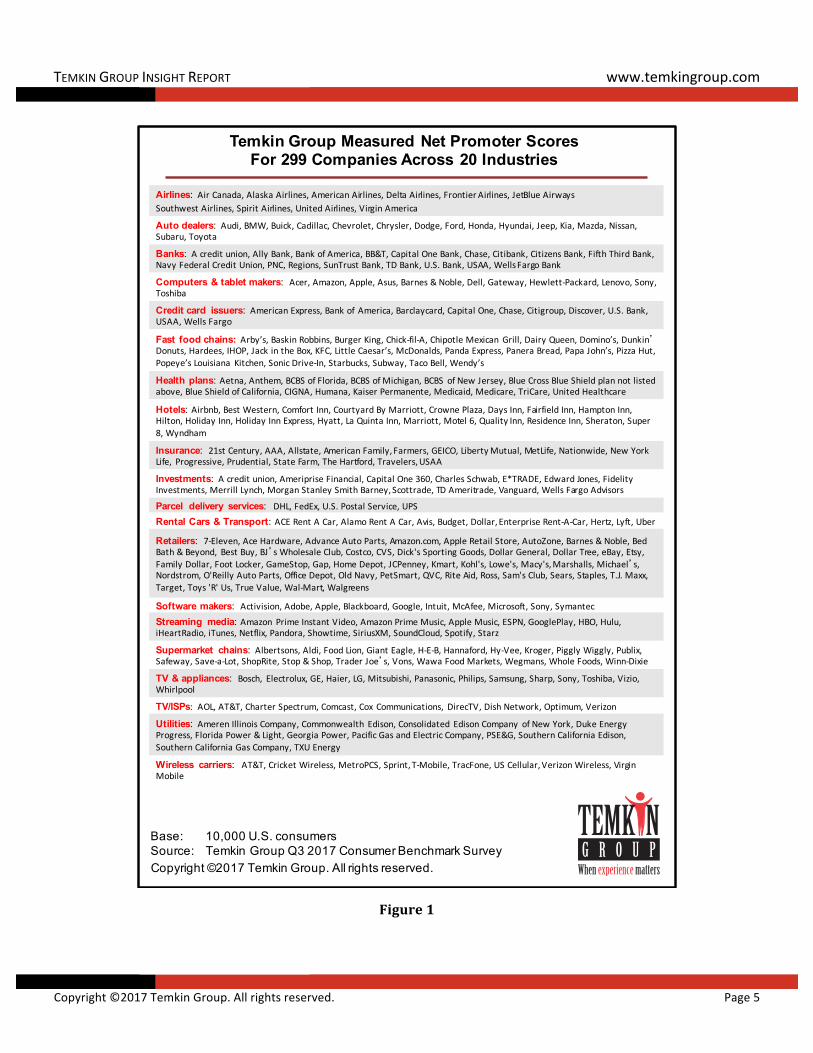
§ CalculatedNPS.WethenfoundtheNPSforeachcompanybysubtractingitspercentageofdetractors from its percentage of promoters. And although we included every surveyresponse in the industryaveragecalculation,weareonlypublishingresults fromthe299companieswithfeedbackfromatleast100consumers(seeFigure1).
1SeetheTemkinInsightGroupReport,“TheStateofCXMetrics,2016,”(December2016).2DatacomesfromtheTemkinGroupQ32017ConsumerBenchmarkSurvey,whichwasanonlinestudyof10,000U.S.consumersconductedduringAugust2017.SurveyrespondentswererepresentativeoftheU.S.Censusbasedonquotasforage,income,gender,ethnicity,andgeographicregion.
TEMKINGROUPINSIGHTREPORT www.temkingroup.com
Copyright©2017TemkinGroup.Allrightsreserved. Page3
USAAandJetBlueEarnTopSpotsinNPSRankings
AftercalculatingtheNPSforthe299companies,wefoundthat:
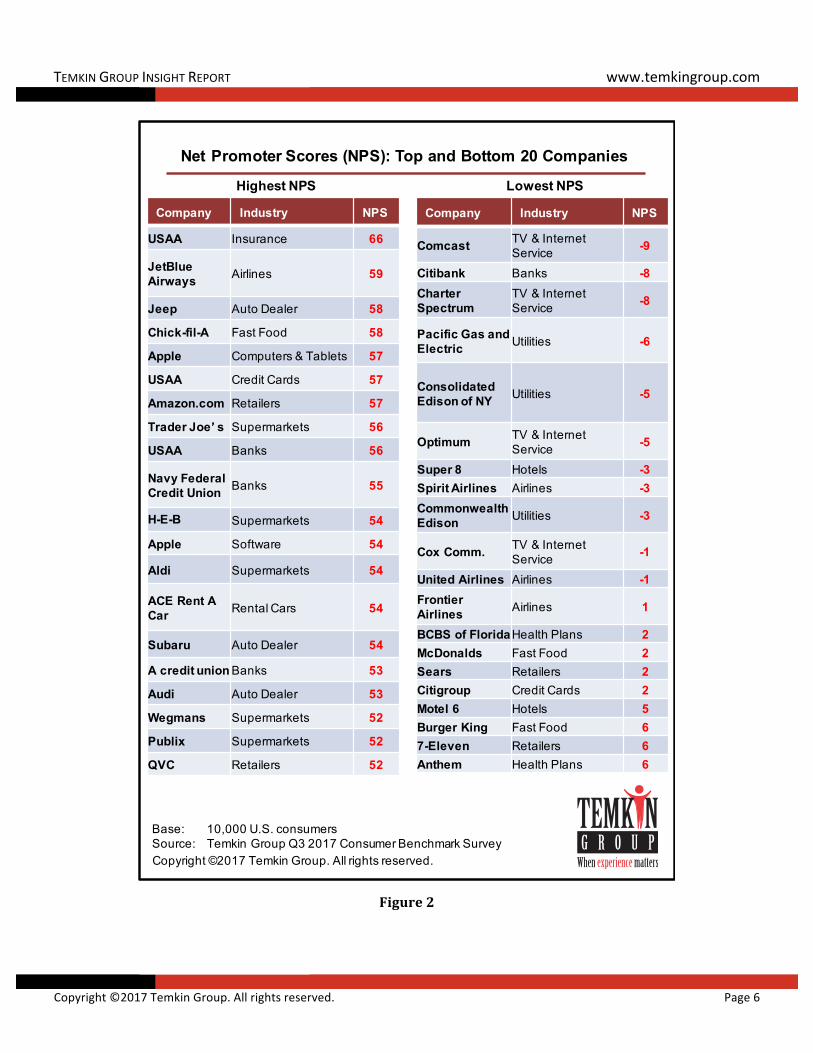
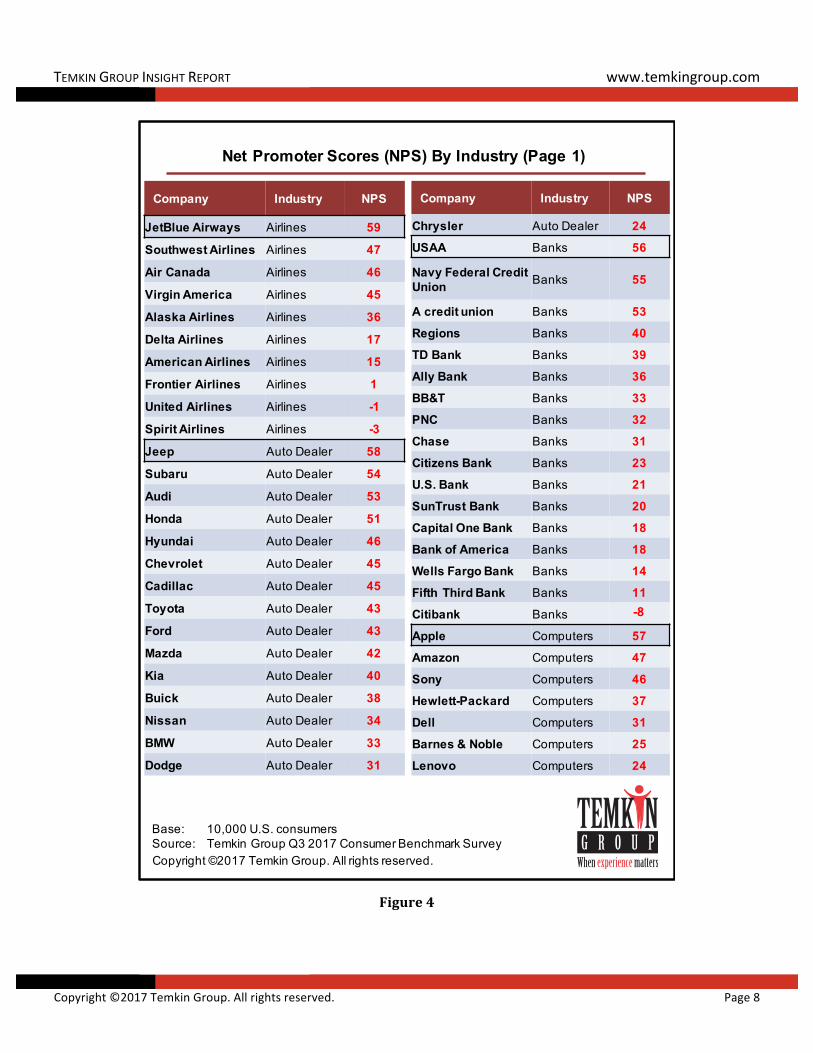
§ USAAtopstheNPSrankings.OneofUSAA’sbusinesseshasearnedthehighestNPSeveryyearwe’ve conducted this survey.Thisyear, for the fifthyear ina row,USAA’s insurancebusinesstookthetopspotwithanNPSof66.ThecompanieswiththenexthighestscoresareJetBlue(59),Jeep(58),andChick-fil-A(58)(seeFigure2).
§ Comcastremainsonthebottom.WithanNPSof-9,Comcastreceivedthelowestscoreinour benchmark for the third straight year. Citibank, Charter Spectrum, Pacific Gas andElectric,ConsolidatedEdisonofNY,andOptimumallalsoreceivedanNPSof-5orbelow.
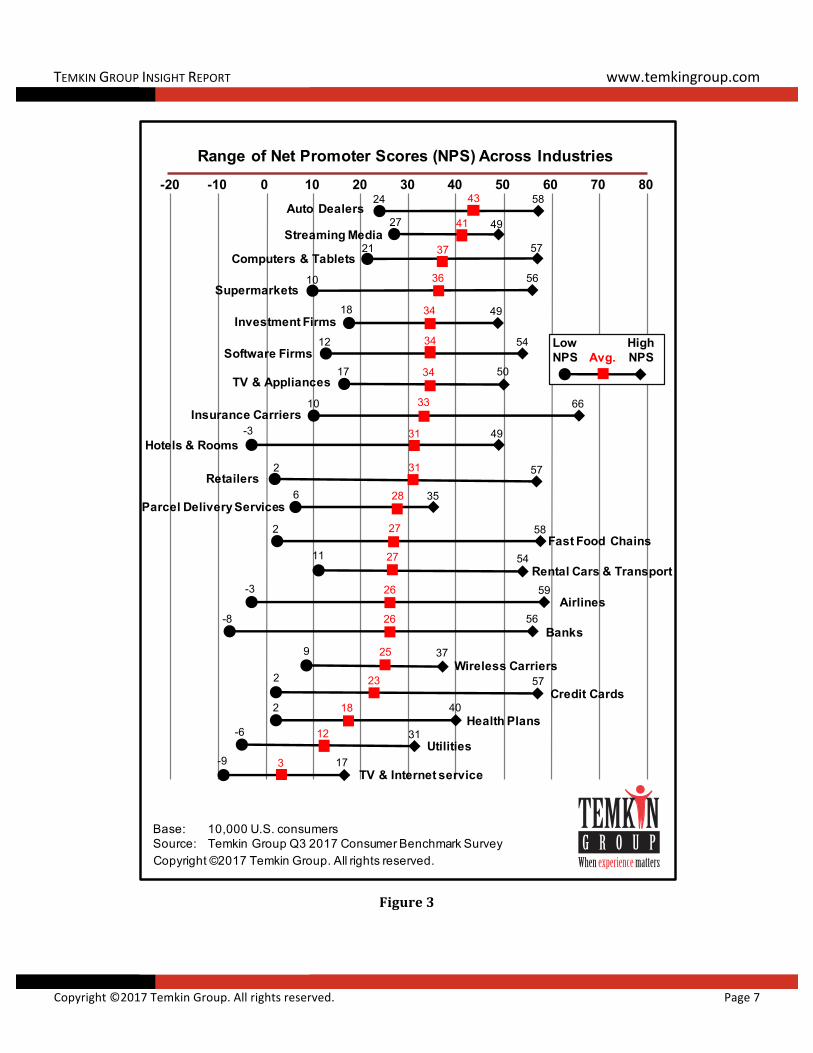
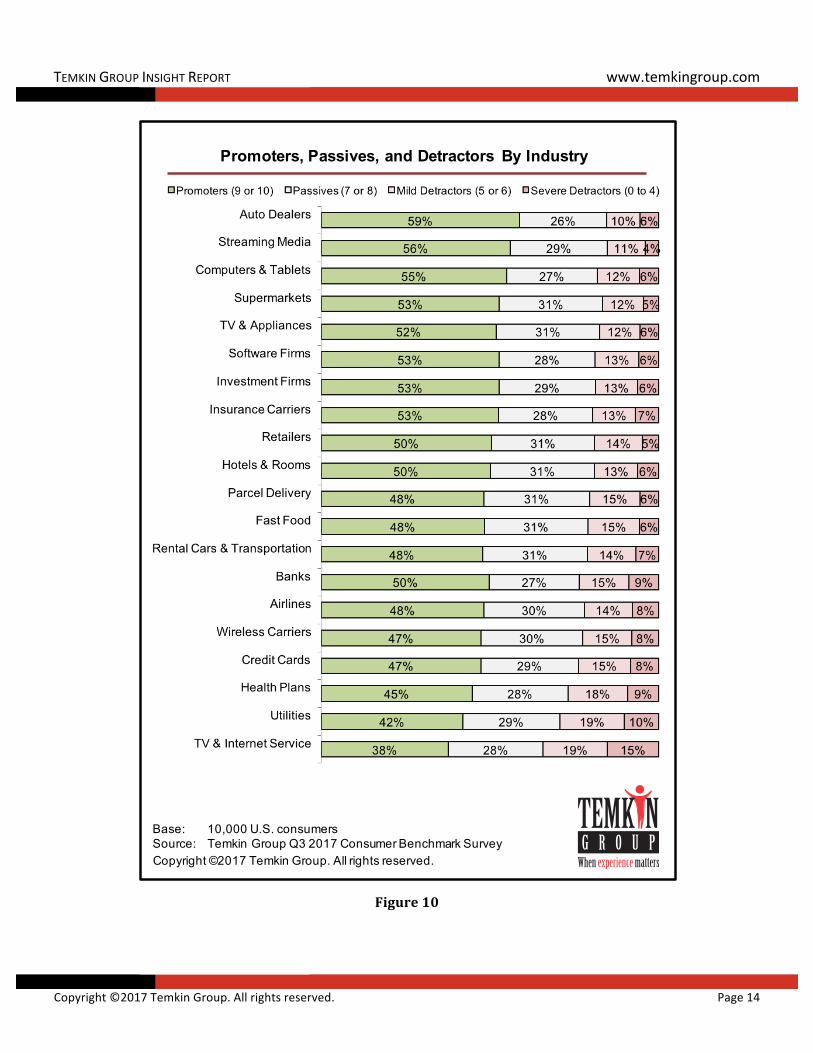
§ Autodealersearnthetopspot.Whenweanalyzedthescoresbyindustry,wefoundthatautodealersenjoythehighestaverageNPSwithascoreof43,puttingthemwellaheadofanyother industry(seeFigures3 to9).3Fifty-ninepercentofautodealers’customersarepromoters,whileonly16%aredetractors (seeFigure10).The streamingmedia industryearnedthesecondhighestaveragescorewithanNPSof41.Thelowestscoringindustry–by a wide margin – is TV & Internet service providers, who only received an industryaverageNPSofonly3.
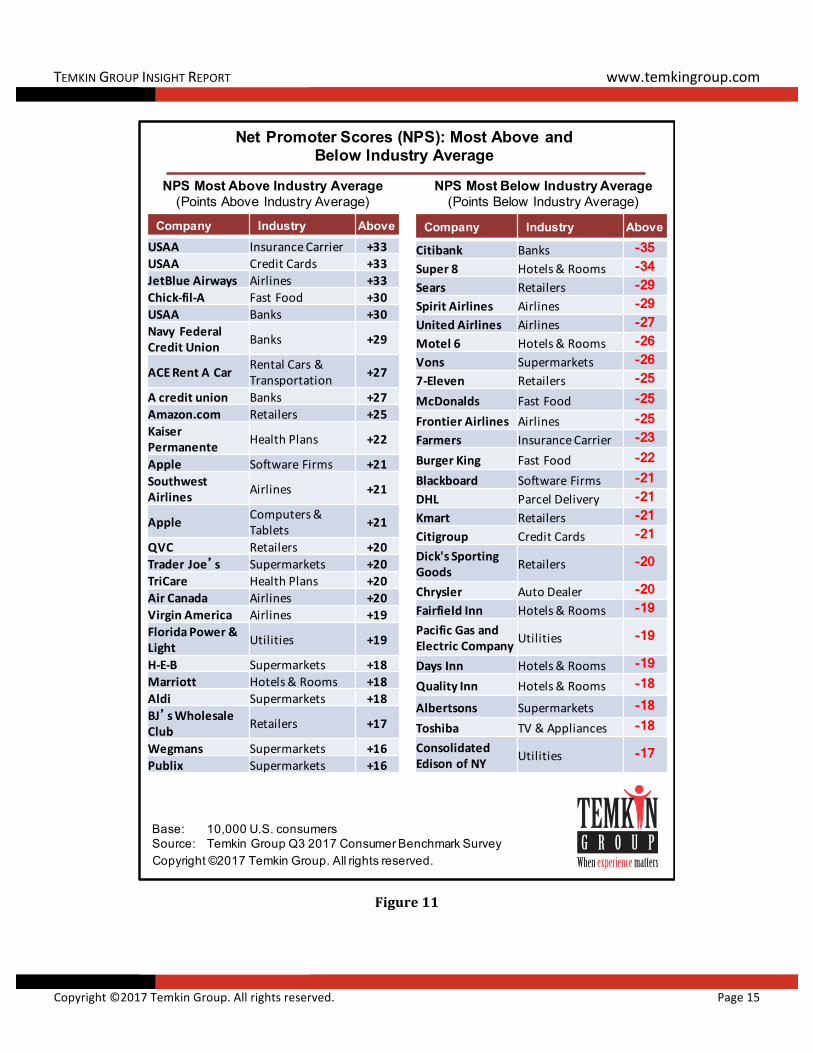
§ USAAandJetBlueoutshinetheircompetitors.Wecomparedeverycompany’sNPStoitsindustry’s average NPS (see Figure 11). USAA’s insurance business, USAA’s credit cardbusiness,andJetBlueallearnedscores33pointsabovetheirindustryaverage,thehighestofallthecompaniesweevaluated.Chick-fil-AandUSAA’sbankingbusinessesalsooutpacedthe competition by significant margins, each coming in 30 points above its industryaverages.
§ Citibank falls furthest behind. Citibank lags furthest behind its peers with an NPS 35points below the banking industry average. Super8 is not much better, falling 34 pointsbelowitspeers.
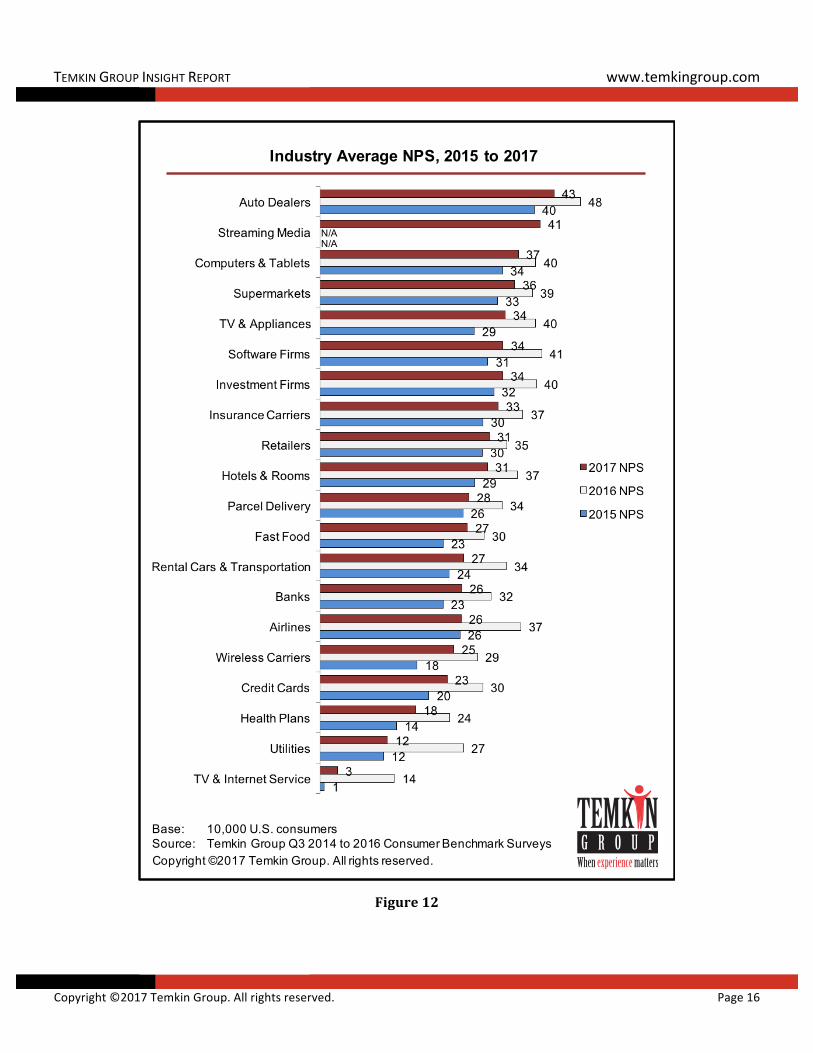
§ Utilities dropped the most. When we compared this year’s industry averages withindustryaveragesfromthelasttwoyears,wefoundthattheaverageforeveryindustryhasdroppedsincelastyear(seeFigure12).4Utilitiesdroppedthemost, falling14points.Andeventhoughtheirscoresfellthisyear,wirelesscarriersoverallhavegainedthemostsince2015,astheirscorehasgoneupbysevenpointsoverthattime.
NPSIncreasesWithAge
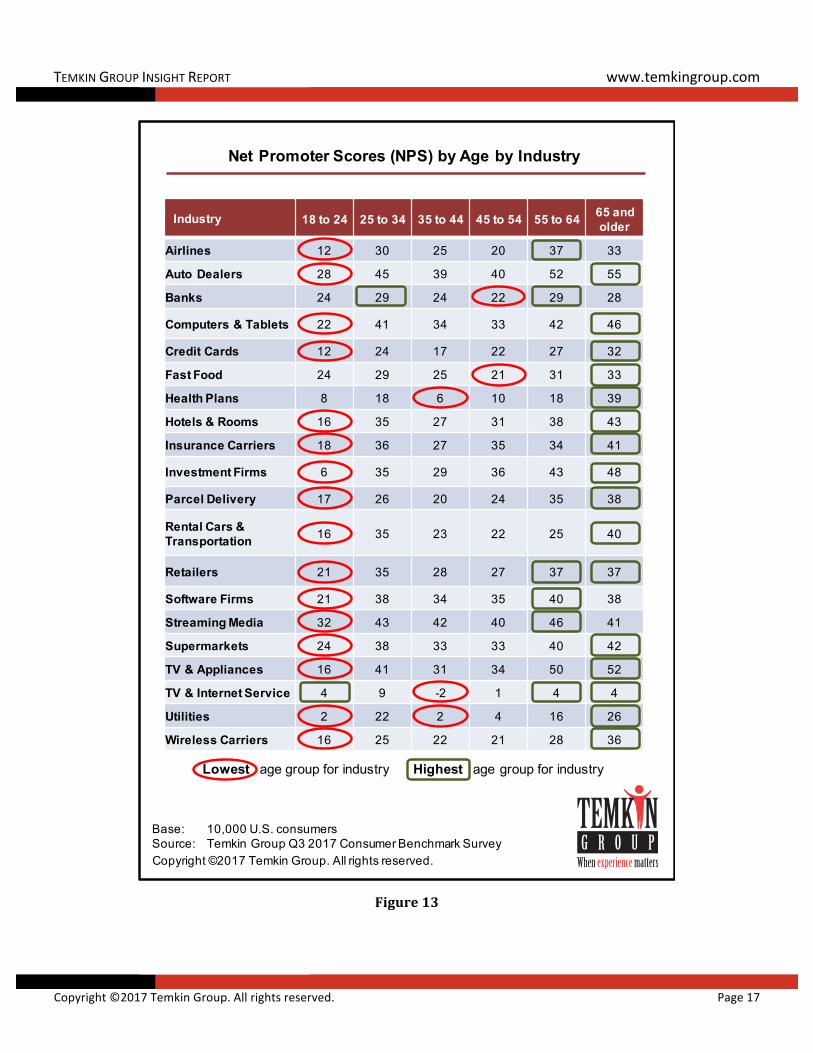
WeexaminedhowindustryNPSdiffersacrossagegroupsandfoundthat(seeFigure13):
§ Young consumers gave the lowest NPS. Customers between the ages of 18 and 25assignedcompaniesthelowestscoresofanyagegroup,givinganaveragescoreof17acrossthe 20 industries. In fact, this group gave the lowest average scores for 16 of the 20industriesweevaluated.
3Industryaveragesarecalculatedastheaveragescoreacrossallconsumerratingsintheindustry,notasaveragesoftheindividualcompanies.4SeetheTemkinGroupInsightReport,“NetPromoterScoreBenchmarkStudy,2016,”(October2016).
TEMKINGROUPINSIGHTREPORT www.temkingroup.com
Copyright©2017TemkinGroup.Allrightsreserved. Page4
§ OlderconsumersgavethehighestNPS.Consumers65andolderassignedcompaniesthehighest scores of any age group, giving an average score of 38 across the 20 industries.Overall, thisgroupgavethehighestscoresto16ofthe20industries.Consumersbetweentheagesof55and64assignedthesecondhighestaveragescores.
§ Investmentfirmshavethemostpronouncedgenerationgap.Onaverage,there’sa21-point gap between the age groupwho assigned the highest NPS and the age groupwhoassigned the lowest NPS. This is most noticeable in the investment industry, whereconsumers65andoldergavetheindustryanaveragescoreof48,whileconsumers24andyoungergaveitanaveragescoreof6–adifferenceof42percentage-points.
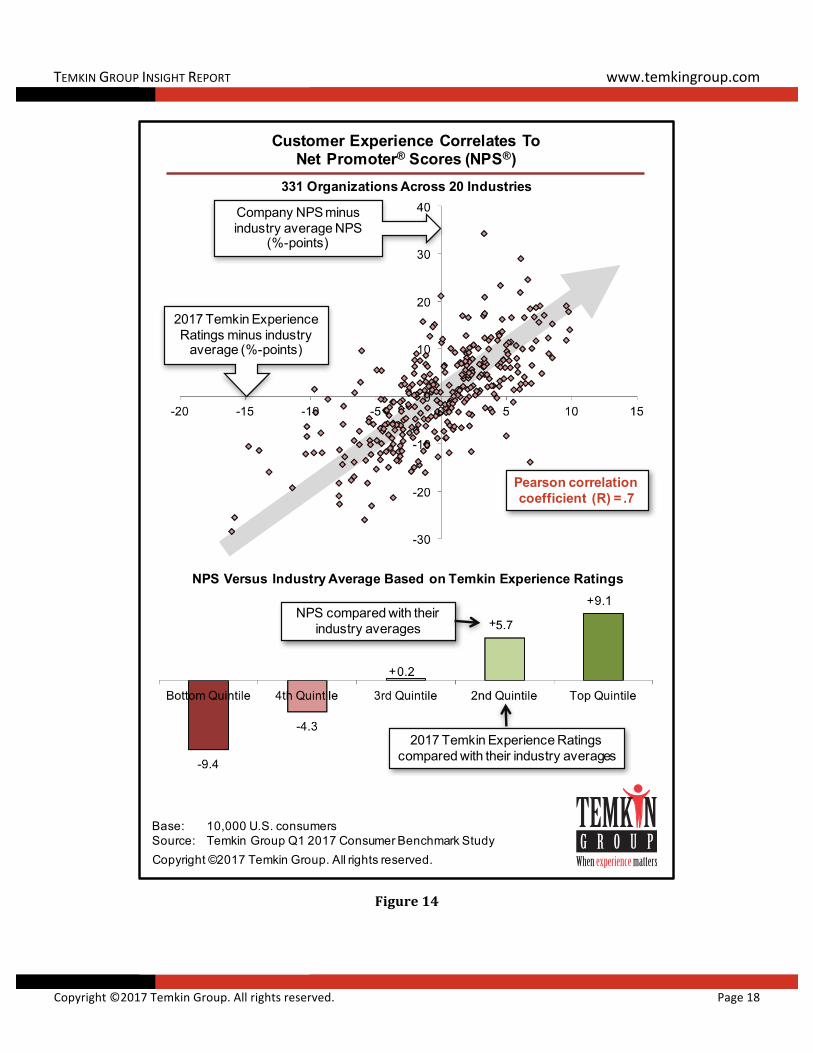
WantHigherNPS?ImproveCustomerExperience
HowcancompaniesincreasetheirNPS?Byimprovingtheexperiencetheydelivertocustomers.Toexamine the link between NPS and customer experience (CX), we compared companies’ NPS totheirscoresinour2017TemkinExperienceRatings.Wefound(seeFigure14):5
§ Averyhighcorrelation.ThePearsoncorrelationbetweenNPSandtheTemkinExperienceRatingsis0.7.
§ AhugegapbetweenCXleadersandlaggards.Partofthe2017TemkinExperienceRatingsreport looksathow theCX ratingsof the331companiesweevaluated compares to theirindustryaverage.WhenwecomparedtheresultsofthatstudywiththeresultsofthisNPSstudy, we found that the same companies that most dramatically outperformed theirindustry’saverageforcustomerexperiencealsooutperformedtheirindustry’saverageforNPS. These overachievers earned an average NPS 9.1 points higher than their peers.MeanwhilethosethatdelivertheworstcustomerexperiencealsoreceivedthelowestNPS,averagingscores9.4pointsbelowtheirindustry’saverage.
5TheTemkinExperienceRatingsmeasurecompanies’customerexperiencebyaskingconsumerstoratethreeareasoftheirexperience:success,effort,andemotion.SeetheTemkinGroupInsightReport,“2017TemkinExperienceRatings,”(March2017).
TEMKINGROUPINSIGHTREPORT www.temkingroup.com
Copyright©2017TemkinGroup.Allrightsreserved. Page5
Temkin Group Measured Net Promoter Scores For 299 Companies Across 20 Industries
Copyright ©2017 Temkin Group. All rights reserved.
Airlines: AirCanada,AlaskaAirlines,AmericanAirlines,DeltaAirlines,FrontierAirlines,JetBlueAirwaysSouthwestAirlines,SpiritAirlines,UnitedAirlines,VirginAmerica
Auto dealers: Audi,BMW,Buick,Cadillac,Chevrolet,Chrysler,Dodge,Ford,Honda,Hyundai,Jeep,Kia,Mazda,Nissan,
Subaru,Toyota
Banks: Acreditunion,AllyBank,BankofAmerica,BB&T,CapitalOneBank,Chase,Citibank,CitizensBank,FifthThirdBank,NavyFederalCreditUnion,PNC,Regions,SunTrustBank,TDBank,U.S.Bank,USAA,WellsFargoBank
Computers & tablet makers: Acer,Amazon,Apple,Asus,Barnes&Noble,Dell,Gateway,Hewlett-Packard,Lenovo,Sony,Toshiba
Credit card issuers: AmericanExpress,Bankof America,Barclaycard,CapitalOne,Chase,Citigroup,Discover,U.S.Bank,
USAA,WellsFargo
Fast food chains: Arby’s,BaskinRobbins,BurgerKing,Chick-fil-A,ChipotleMexican Grill,DairyQueen,Domino’s,Dunkin�Donuts,Hardees,IHOP,JackintheBox,KFC,LittleCaesar’s,McDonalds,PandaExpress,PaneraBread,PapaJohn’s,PizzaHut,
Popeye’sLouisiana Kitchen,SonicDrive-In,Starbucks,Subway,TacoBell,Wendy’s
Health plans: Aetna,Anthem,BCBSofFlorida,BCBSofMichigan,BCBS ofNewJersey,BlueCrossBlueShieldplannotlisted
above,BlueShieldofCalifornia,CIGNA,Humana,KaiserPermanente,Medicaid,Medicare,TriCare,UnitedHealthcare
Hotels: Airbnb,BestWestern,ComfortInn,CourtyardByMarriott,CrownePlaza,DaysInn,FairfieldInn,HamptonInn,
Hilton,HolidayInn,HolidayInnExpress,Hyatt,LaQuintaInn,Marriott,Motel6,QualityInn,ResidenceInn,Sheraton,Super
8,Wyndham
Insurance: 21stCentury,AAA,Allstate,AmericanFamily,Farmers,GEICO,LibertyMutual,MetLife,Nationwide,NewYork
Life, Progressive,Prudential,StateFarm,TheHartford,Travelers,USAA
Investments: Acreditunion,AmeripriseFinancial,CapitalOne360,CharlesSchwab,E*TRADE,EdwardJones,FidelityInvestments,MerrillLynch,MorganStanleySmithBarney,Scottrade,TDAmeritrade,Vanguard,WellsFargoAdvisors
Parcel delivery services: DHL,FedEx,U.S.PostalService,UPS
Rental Cars & Transport: ACERentACar,AlamoRentACar,Avis,Budget,Dollar,EnterpriseRent-A-Car,Hertz,Lyft,Uber
Retailers: 7-Eleven,AceHardware,AdvanceAutoParts,Amazon.com,AppleRetailStore,AutoZone,Barnes&Noble,BedBath&Beyond, BestBuy,BJ�sWholesaleClub,Costco,CVS,Dick'sSportingGoods,DollarGeneral,DollarTree,eBay,Etsy,
FamilyDollar,FootLocker,GameStop,Gap,HomeDepot,JCPenney,Kmart,Kohl's,Lowe's,Macy's,Marshalls,Michael�s,Nordstrom,O'ReillyAutoParts,OfficeDepot,OldNavy,PetSmart,QVC,RiteAid,Ross,Sam'sClub,Sears,Staples,T.J.Maxx,
Target,Toys'R'Us,TrueValue,Wal-Mart,Walgreens
Software makers: Activision,Adobe,Apple,Blackboard,Google,Intuit,McAfee,Microsoft,Sony,Symantec
Streaming media: Amazon PrimeInstantVideo,AmazonPrimeMusic,AppleMusic,ESPN,GooglePlay,HBO,Hulu,
iHeartRadio,iTunes,Netflix,Pandora,Showtime,SiriusXM,SoundCloud,Spotify,Starz
Supermarket chains: Albertsons,Aldi,FoodLion,GiantEagle,H-E-B,Hannaford,Hy-Vee,Kroger,PigglyWiggly,Publix,
Safeway,Save-a-Lot,ShopRite,Stop&Shop,TraderJoe�s,Vons,WawaFoodMarkets,Wegmans,WholeFoods,Winn-Dixie
TV & appliances: Bosch, Electrolux,GE,Haier,LG,Mitsubishi,Panasonic,Philips,Samsung,Sharp,Sony,Toshiba,Vizio,
Whirlpool
TV/ISPs: AOL,AT&T,CharterSpectrum,Comcast,Cox Communications, DirecTV,DishNetwork,Optimum,Verizon
Utilities: AmerenIllinoisCompany,Commonwealth Edison,Consolidated EdisonCompany ofNewYork,DukeEnergyProgress,FloridaPower&Light,GeorgiaPower,PacificGasandElectricCompany,PSE&G,SouthernCaliforniaEdison,
SouthernCaliforniaGasCompany,TXUEnergy
Wireless carriers: AT&T,CricketWireless,MetroPCS,Sprint,T-Mobile,TracFone,USCellular,VerizonWireless,Virgin
Mobile
Base: 10,000 U.S. consumersSource: Temkin Group Q3 2017 Consumer Benchmark Survey
Figure1
TEMKINGROUPINSIGHTREPORT www.temkingroup.com
Copyright©2017TemkinGroup.Allrightsreserved. Page6
Net Promoter Scores (NPS): Top and Bottom 20 Companies
Copyright ©2017 Temkin Group. All rights reserved.
Base: 10,000 U.S. consumersSource: Temkin Group Q3 2017 Consumer Benchmark Survey
Company Industry NPS
Comcast TV & Internet Service -9
Citibank Banks -8Charter Spectrum
TV & Internet Service -8
Pacific Gas and Electric Utilities -6
Consolidated Edison of NY Utilities -5
Optimum TV & Internet Service -5
Super 8 Hotels -3Spirit Airlines Airlines -3Commonwealth Edison Utilities -3
Cox Comm. TV & Internet Service -1
United Airlines Airlines -1Frontier Airlines Airlines 1
BCBS of Florida Health Plans 2McDonalds Fast Food 2Sears Retailers 2Citigroup Credit Cards 2Motel 6 Hotels 5Burger King Fast Food 67-Eleven Retailers 6Anthem Health Plans 6
Company Industry NPS
USAA Insurance 66
JetBlue Airways Airlines 59
Jeep Auto Dealer 58
Chick-fil-A Fast Food 58
Apple Computers & Tablets 57
USAA Credit Cards 57
Amazon.com Retailers 57
Trader Joe�s Supermarkets 56
USAA Banks 56
Navy Federal Credit Union Banks 55
H-E-B Supermarkets 54
Apple Software 54
Aldi Supermarkets 54
ACE Rent A Car Rental Cars 54
Subaru Auto Dealer 54
A credit union Banks 53
Audi Auto Dealer 53
Wegmans Supermarkets 52
Publix Supermarkets 52
QVC Retailers 52
Highest NPS Lowest NPS
Figure2
TEMKINGROUPINSIGHTREPORT www.temkingroup.com
Copyright©2017TemkinGroup.Allrightsreserved. Page7
Range of Net Promoter Scores (NPS) Across Industries80706050403020100-10-20
24 5843
27 4941
18 4934
2 57
11 5427
-3 5926
-8 5626
2 4018
-9 173
Auto Dealers
Software Firms
Investment Firms12 5434
10 6633
Hotels & Rooms
Computers & Tablets
Insurance Carriers
Airlines
Wireless Carriers
Rental Cars & Transport
2 5723
Health Plans
Credit Cards
TV & Internet service
LowNPS
HighNPSAvg.
Copyright ©2017 Temkin Group. All rights reserved.
Base: 10,000 U.S. consumersSource: Temkin Group Q3 2017 Consumer Benchmark Survey
5737
Supermarkets10 5636
17 50
Streaming Media
34
-3 4931
2 58
6 3528Parcel Delivery Services
Fast Food Chains
31
27
Retailers
Banks
-6 3112Utilities
9 3725
TV & Appliances
21
Figure3
TEMKINGROUPINSIGHTREPORT www.temkingroup.com
Copyright©2017TemkinGroup.Allrightsreserved. Page8
Net Promoter Scores (NPS) By Industry (Page 1)
Copyright ©2017 Temkin Group. All rights reserved.
Base: 10,000 U.S. consumersSource: Temkin Group Q3 2017 Consumer Benchmark Survey
Company Industry NPS
JetBlue Airways Airlines 59
Southwest Airlines Airlines 47
Air Canada Airlines 46
Virgin America Airlines 45
Alaska Airlines Airlines 36
Delta Airlines Airlines 17
American Airlines Airlines 15
Frontier Airlines Airlines 1
United Airlines Airlines -1
Spirit Airlines Airlines -3
Jeep Auto Dealer 58
Subaru Auto Dealer 54
Audi Auto Dealer 53
Honda Auto Dealer 51
Hyundai Auto Dealer 46
Chevrolet Auto Dealer 45
Cadillac Auto Dealer 45
Toyota Auto Dealer 43
Ford Auto Dealer 43
Mazda Auto Dealer 42
Kia Auto Dealer 40
Buick Auto Dealer 38
Nissan Auto Dealer 34
BMW Auto Dealer 33
Dodge Auto Dealer 31
Company Industry NPS
Chrysler Auto Dealer 24USAA Banks 56
Navy Federal Credit Union Banks 55
A credit union Banks 53Regions Banks 40TD Bank Banks 39Ally Bank Banks 36BB&T Banks 33PNC Banks 32Chase Banks 31Citizens Bank Banks 23U.S. Bank Banks 21SunTrust Bank Banks 20Capital One Bank Banks 18Bank of America Banks 18Wells Fargo Bank Banks 14Fifth Third Bank Banks 11Citibank Banks -8 Apple Computers 57Amazon Computers 47Sony Computers 46Hewlett-Packard Computers 37Dell Computers 31Barnes & Noble Computers 25Lenovo Computers 24
Figure4
TEMKINGROUPINSIGHTREPORT www.temkingroup.com
Copyright©2017TemkinGroup.Allrightsreserved. Page9
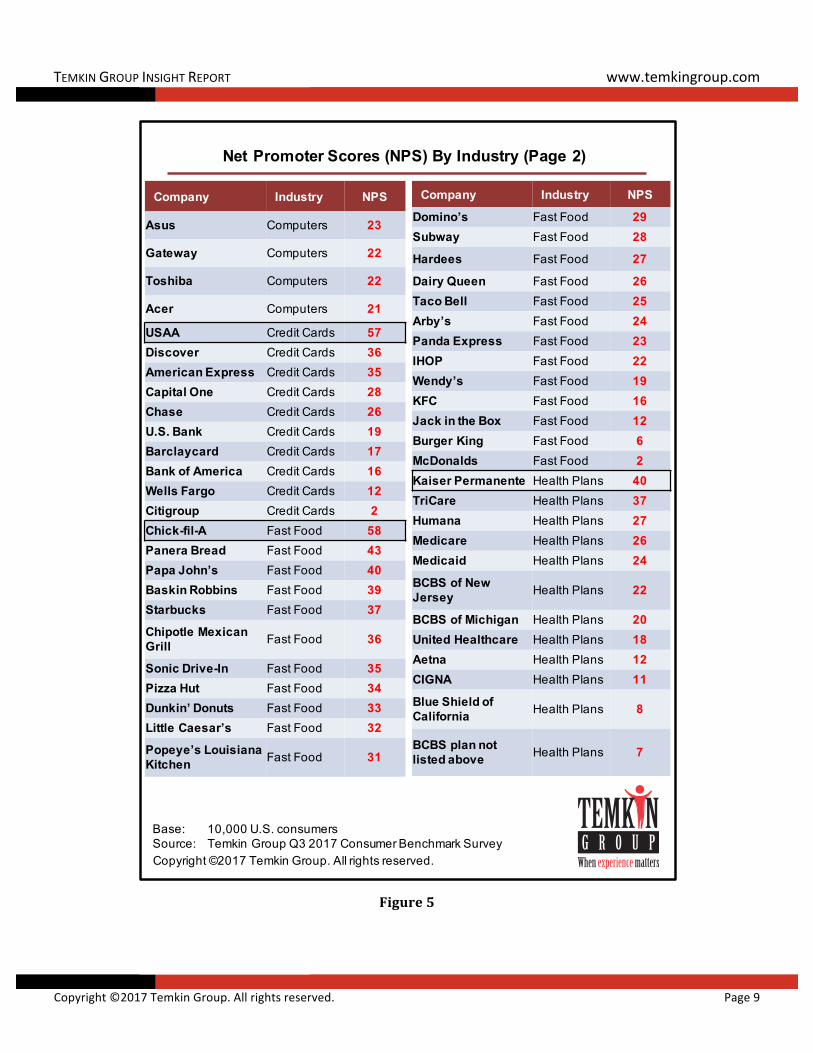
Net Promoter Scores (NPS) By Industry (Page 2)
Copyright ©2017 Temkin Group. All rights reserved.
Base: 10,000 U.S. consumersSource: Temkin Group Q3 2017 Consumer Benchmark Survey
Company Industry NPS
Asus Computers 23
Gateway Computers 22
Toshiba Computers 22
Acer Computers 21
USAA Credit Cards 57Discover Credit Cards 36American Express Credit Cards 35Capital One Credit Cards 28Chase Credit Cards 26U.S. Bank Credit Cards 19Barclaycard Credit Cards 17Bank of America Credit Cards 16Wells Fargo Credit Cards 12Citigroup Credit Cards 2Chick-fil-A Fast Food 58Panera Bread Fast Food 43Papa John’s Fast Food 40Baskin Robbins Fast Food 39Starbucks Fast Food 37
Chipotle Mexican Grill Fast Food 36
Sonic Drive-In Fast Food 35Pizza Hut Fast Food 34Dunkin’ Donuts Fast Food 33Little Caesar’s Fast Food 32
Popeye’s Louisiana Kitchen Fast Food 31
Company Industry NPS
Domino’s Fast Food 29Subway Fast Food 28
Hardees Fast Food 27
Dairy Queen Fast Food 26Taco Bell Fast Food 25Arby’s Fast Food 24Panda Express Fast Food 23IHOP Fast Food 22Wendy’s Fast Food 19KFC Fast Food 16Jack in the Box Fast Food 12Burger King Fast Food 6McDonalds Fast Food 2Kaiser Permanente Health Plans 40TriCare Health Plans 37Humana Health Plans 27Medicare Health Plans 26Medicaid Health Plans 24
BCBS of New Jersey Health Plans 22
BCBS of Michigan Health Plans 20United Healthcare Health Plans 18Aetna Health Plans 12CIGNA Health Plans 11
Blue Shield of California Health Plans 8
BCBS plan not listed above Health Plans 7
Figure5
TEMKINGROUPINSIGHTREPORT www.temkingroup.com
Copyright©2017TemkinGroup.Allrightsreserved. Page10
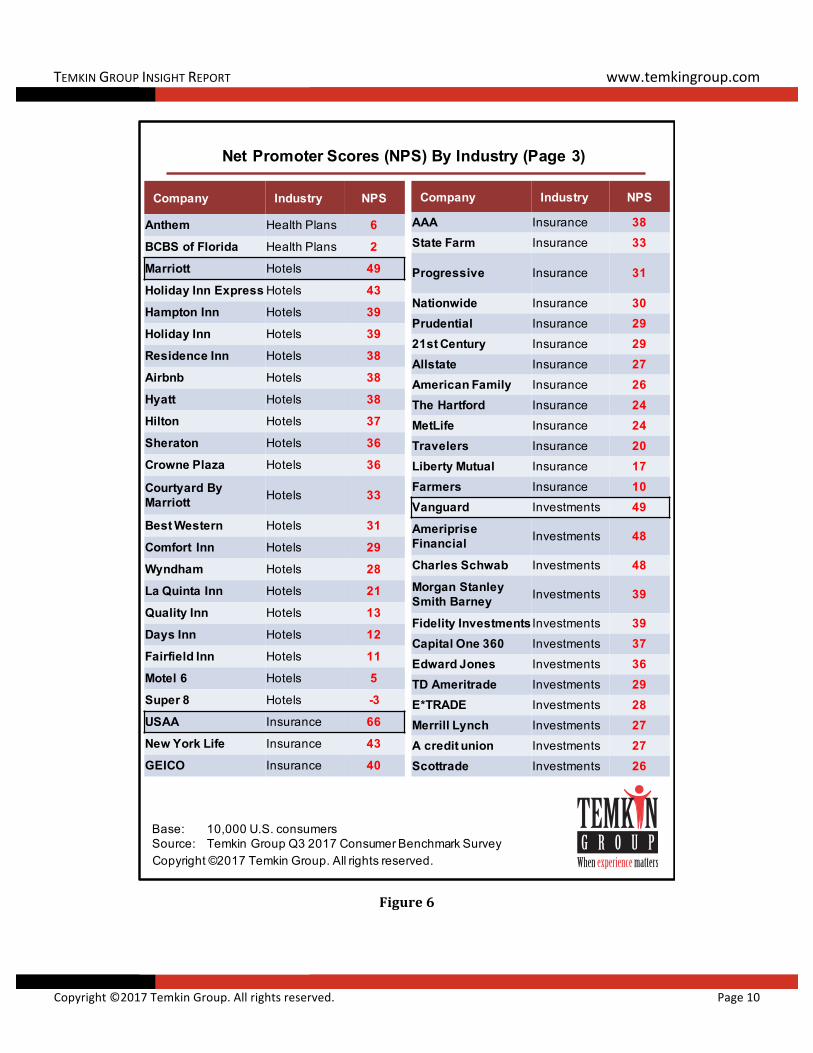
Net Promoter Scores (NPS) By Industry (Page 3)
Copyright ©2017 Temkin Group. All rights reserved.
Base: 10,000 U.S. consumersSource: Temkin Group Q3 2017 Consumer Benchmark Survey
Company Industry NPS
Anthem Health Plans 6BCBS of Florida Health Plans 2Marriott Hotels 49Holiday Inn Express Hotels 43Hampton Inn Hotels 39Holiday Inn Hotels 39Residence Inn Hotels 38Airbnb Hotels 38Hyatt Hotels 38Hilton Hotels 37Sheraton Hotels 36Crowne Plaza Hotels 36
Courtyard By Marriott Hotels 33
Best Western Hotels 31Comfort Inn Hotels 29Wyndham Hotels 28La Quinta Inn Hotels 21Quality Inn Hotels 13Days Inn Hotels 12Fairfield Inn Hotels 11Motel 6 Hotels 5Super 8 Hotels -3USAA Insurance 66New York Life Insurance 43GEICO Insurance 40
Company Industry NPS
AAA Insurance 38State Farm Insurance 33
Progressive Insurance 31
Nationwide Insurance 30Prudential Insurance 2921st Century Insurance 29Allstate Insurance 27American Family Insurance 26The Hartford Insurance 24MetLife Insurance 24Travelers Insurance 20Liberty Mutual Insurance 17Farmers Insurance 10Vanguard Investments 49Ameriprise Financial Investments 48
Charles Schwab Investments 48Morgan Stanley Smith Barney Investments 39
Fidelity Investments Investments 39Capital One 360 Investments 37Edward Jones Investments 36TD Ameritrade Investments 29E*TRADE Investments 28Merrill Lynch Investments 27A credit union Investments 27Scottrade Investments 26
Figure6
TEMKINGROUPINSIGHTREPORT www.temkingroup.com
Copyright©2017TemkinGroup.Allrightsreserved. Page11
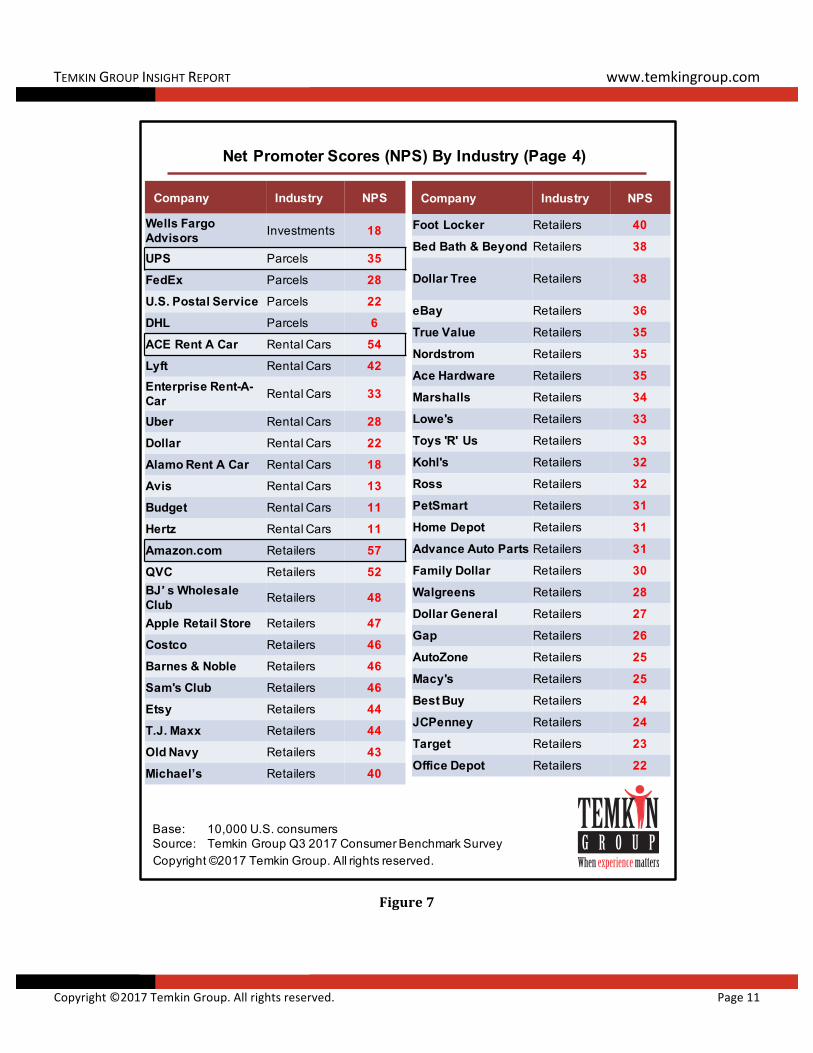
Net Promoter Scores (NPS) By Industry (Page 4)
Copyright ©2017 Temkin Group. All rights reserved.
Base: 10,000 U.S. consumersSource: Temkin Group Q3 2017 Consumer Benchmark Survey
Company Industry NPS
Wells Fargo Advisors Investments 18
UPS Parcels 35FedEx Parcels 28U.S. Postal Service Parcels 22DHL Parcels 6ACE Rent A Car Rental Cars 54Lyft Rental Cars 42Enterprise Rent-A-Car Rental Cars 33
Uber Rental Cars 28Dollar Rental Cars 22Alamo Rent A Car Rental Cars 18Avis Rental Cars 13Budget Rental Cars 11Hertz Rental Cars 11Amazon.com Retailers 57QVC Retailers 52BJ�s Wholesale Club Retailers 48
Apple Retail Store Retailers 47Costco Retailers 46Barnes & Noble Retailers 46Sam's Club Retailers 46Etsy Retailers 44T.J. Maxx Retailers 44Old Navy Retailers 43Michael’s Retailers 40
Company Industry NPS
Foot Locker Retailers 40Bed Bath & Beyond Retailers 38
Dollar Tree Retailers 38
eBay Retailers 36True Value Retailers 35Nordstrom Retailers 35Ace Hardware Retailers 35Marshalls Retailers 34Lowe's Retailers 33Toys 'R' Us Retailers 33Kohl's Retailers 32Ross Retailers 32PetSmart Retailers 31Home Depot Retailers 31Advance Auto Parts Retailers 31Family Dollar Retailers 30Walgreens Retailers 28Dollar General Retailers 27Gap Retailers 26AutoZone Retailers 25Macy's Retailers 25Best Buy Retailers 24JCPenney Retailers 24Target Retailers 23Office Depot Retailers 22
Figure7
TEMKINGROUPINSIGHTREPORT www.temkingroup.com
Copyright©2017TemkinGroup.Allrightsreserved. Page12
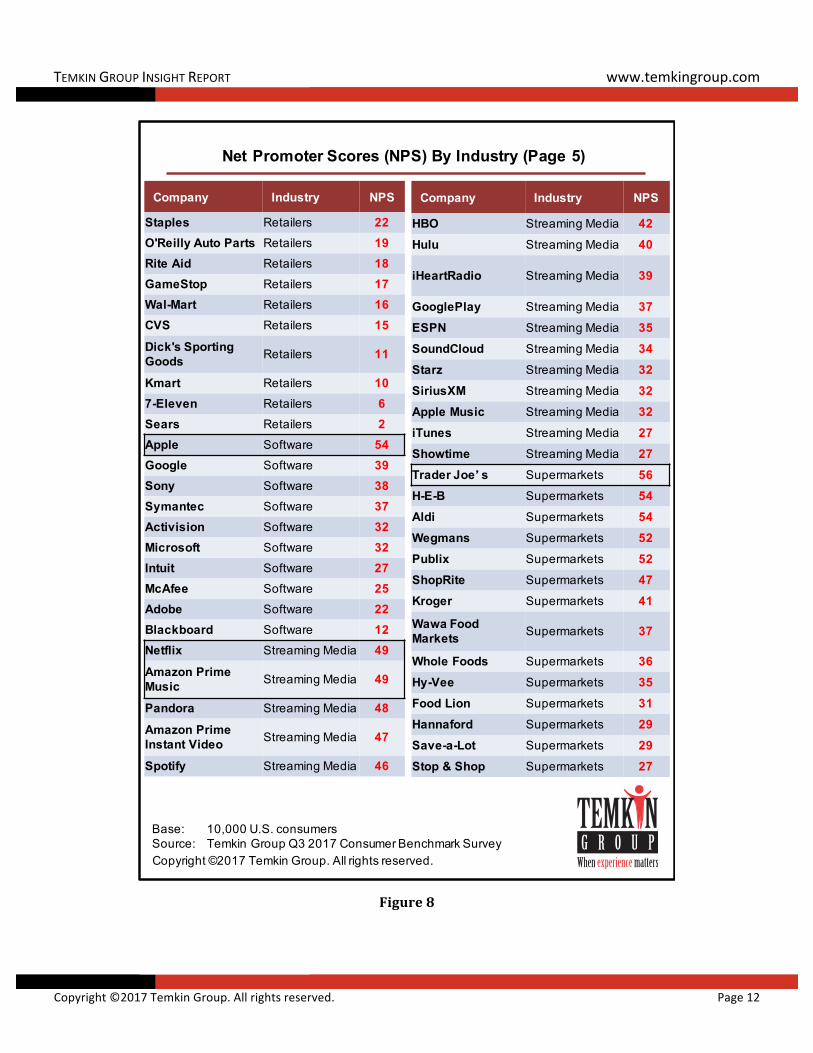
Net Promoter Scores (NPS) By Industry (Page 5)
Copyright ©2017 Temkin Group. All rights reserved.
Base: 10,000 U.S. consumersSource: Temkin Group Q3 2017 Consumer Benchmark Survey
Company Industry NPS
Staples Retailers 22
O'Reilly Auto Parts Retailers 19
Rite Aid Retailers 18
GameStop Retailers 17
Wal-Mart Retailers 16
CVS Retailers 15
Dick's Sporting Goods Retailers 11
Kmart Retailers 10
7-Eleven Retailers 6
Sears Retailers 2
Apple Software 54
Google Software 39
Sony Software 38
Symantec Software 37
Activision Software 32
Microsoft Software 32
Intuit Software 27
McAfee Software 25
Adobe Software 22
Blackboard Software 12
Netflix Streaming Media 49
Amazon Prime Music Streaming Media 49
Pandora Streaming Media 48
Amazon Prime Instant Video Streaming Media 47
Spotify Streaming Media 46
Company Industry NPS
HBO Streaming Media 42
Hulu Streaming Media 40
iHeartRadio Streaming Media 39
GooglePlay Streaming Media 37
ESPN Streaming Media 35
SoundCloud Streaming Media 34
Starz Streaming Media 32
SiriusXM Streaming Media 32
Apple Music Streaming Media 32
iTunes Streaming Media 27
Showtime Streaming Media 27
Trader Joe�s Supermarkets 56
H-E-B Supermarkets 54
Aldi Supermarkets 54
Wegmans Supermarkets 52
Publix Supermarkets 52
ShopRite Supermarkets 47
Kroger Supermarkets 41
Wawa Food Markets Supermarkets 37
Whole Foods Supermarkets 36
Hy-Vee Supermarkets 35
Food Lion Supermarkets 31
Hannaford Supermarkets 29
Save-a-Lot Supermarkets 29
Stop & Shop Supermarkets 27
Figure8
TEMKINGROUPINSIGHTREPORT www.temkingroup.com
Copyright©2017TemkinGroup.Allrightsreserved. Page13
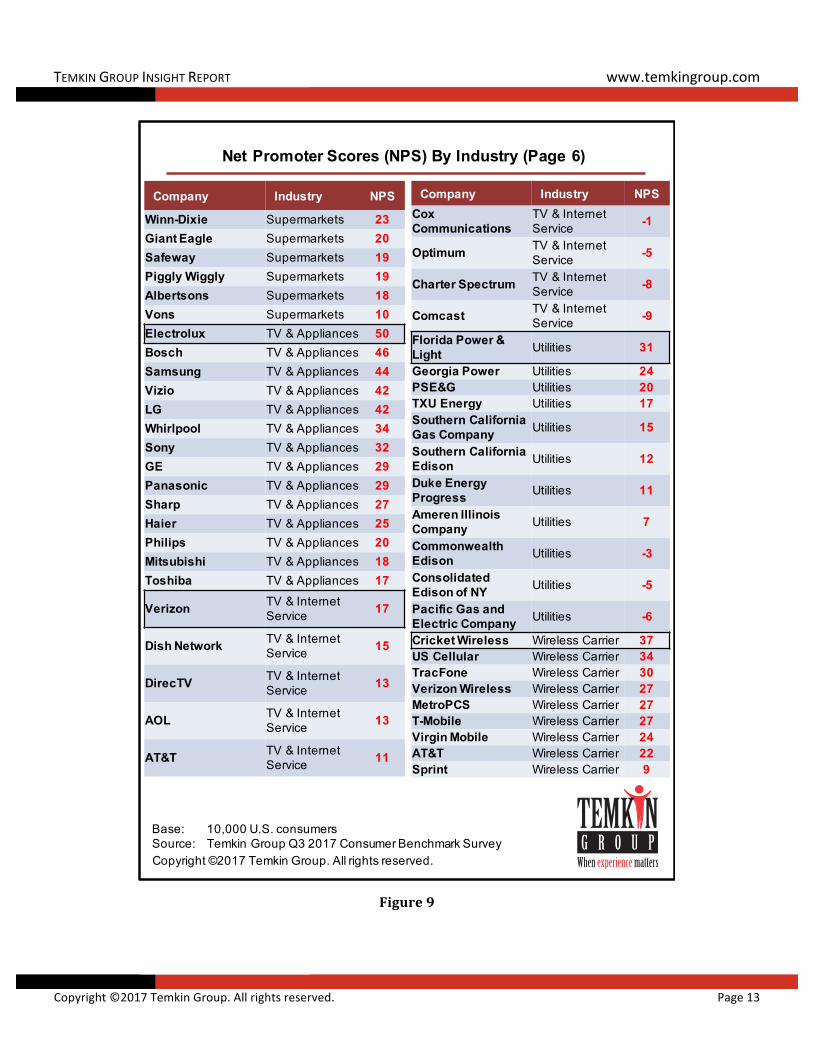
Net Promoter Scores (NPS) By Industry (Page 6)
Copyright ©2017 Temkin Group. All rights reserved.
Base: 10,000 U.S. consumersSource: Temkin Group Q3 2017 Consumer Benchmark Survey
Company Industry NPS
Winn-Dixie Supermarkets 23
Giant Eagle Supermarkets 20
Safeway Supermarkets 19
Piggly Wiggly Supermarkets 19
Albertsons Supermarkets 18
Vons Supermarkets 10
Electrolux TV & Appliances 50
Bosch TV & Appliances 46
Samsung TV & Appliances 44
Vizio TV & Appliances 42
LG TV & Appliances 42
Whirlpool TV & Appliances 34
Sony TV & Appliances 32
GE TV & Appliances 29
Panasonic TV & Appliances 29
Sharp TV & Appliances 27
Haier TV & Appliances 25
Philips TV & Appliances 20
Mitsubishi TV & Appliances 18
Toshiba TV & Appliances 17
Verizon TV & Internet Service 17
Dish Network TV & Internet Service 15
DirecTV TV & Internet Service 13
AOL TV & Internet Service 13
AT&T TV & Internet Service 11
Company Industry NPS
Cox Communications
TV & Internet Service -1
Optimum TV & Internet Service -5
Charter Spectrum TV & Internet Service -8
Comcast TV & Internet Service -9
Florida Power & Light Utilities 31
Georgia Power Utilities 24PSE&G Utilities 20TXU Energy Utilities 17Southern California Gas Company Utilities 15
Southern California Edison Utilities 12
Duke Energy Progress Utilities 11
Ameren Illinois Company Utilities 7
Commonwealth Edison Utilities -3 Consolidated Edison of NY Utilities -5 Pacific Gas and Electric Company Utilities -6 Cricket Wireless Wireless Carrier 37US Cellular Wireless Carrier 34TracFone Wireless Carrier 30Verizon Wireless Wireless Carrier 27MetroPCS Wireless Carrier 27T-Mobile Wireless Carrier 27Virgin Mobile Wireless Carrier 24AT&T Wireless Carrier 22Sprint Wireless Carrier 9
Figure9
TEMKINGROUPINSIGHTREPORT www.temkingroup.com
Copyright©2017TemkinGroup.Allrightsreserved. Page14
Promoters, Passives, and Detractors By Industry
Copyright ©2017 Temkin Group. All rights reserved.
Base: 10,000 U.S. consumersSource: Temkin Group Q3 2017 Consumer Benchmark Survey
Figure10
TEMKINGROUPINSIGHTREPORT www.temkingroup.com
Copyright©2017TemkinGroup.Allrightsreserved. Page15
Net Promoter Scores (NPS): Most Above and Below Industry Average
Copyright ©2017 Temkin Group. All rights reserved.
Base: 10,000 U.S. consumersSource: Temkin Group Q3 2017 Consumer Benchmark Survey
Company Industry AboveUSAA InsuranceCarrier +33USAA CreditCards +33JetBlueAirways Airlines +33Chick-fil-A FastFood +30USAA Banks +30Navy FederalCreditUnion Banks +29
ACERentACar RentalCars&Transportation +27
Acreditunion Banks +27Amazon.com Retailers +25KaiserPermanente HealthPlans +22
Apple SoftwareFirms +21SouthwestAirlines Airlines +21
Apple Computers&Tablets +21
QVC Retailers +20TraderJoe�s Supermarkets +20TriCare HealthPlans +20AirCanada Airlines +20VirginAmerica Airlines +19FloridaPower&Light Utilities +19
H-E-B Supermarkets +18Marriott Hotels&Rooms +18Aldi Supermarkets +18BJ�sWholesaleClub Retailers +17
Wegmans Supermarkets +16Publix Supermarkets +16
NPS Most Above Industry Average(Points Above Industry Average)
NPS Most Below Industry Average(Points Below Industry Average)
Company Industry Above
Citibank Banks -35 Super8 Hotels&Rooms -34 Sears Retailers -29 SpiritAirlines Airlines -29 UnitedAirlines Airlines -27 Motel6 Hotels&Rooms -26 Vons Supermarkets -26 7-Eleven Retailers -25 McDonalds FastFood -25 FrontierAirlines Airlines -25 Farmers InsuranceCarrier -23 BurgerKing FastFood -22 Blackboard SoftwareFirms -21 DHL ParcelDelivery -21 Kmart Retailers -21 Citigroup CreditCards -21 Dick'sSportingGoods Retailers -20
Chrysler AutoDealer -20 FairfieldInn Hotels&Rooms -19 PacificGasandElectricCompanyUtilities
-19
DaysInn Hotels&Rooms -19 QualityInn Hotels&Rooms -18 Albertsons Supermarkets -18 Toshiba TV&Appliances -18 ConsolidatedEdisonofNY Utilities -17
Figure11
TEMKINGROUPINSIGHTREPORT www.temkingroup.com
Copyright©2017TemkinGroup.Allrightsreserved. Page16
Industry Average NPS, 2015 to 2017
Copyright ©2017 Temkin Group. All rights reserved.
Base: 10,000 U.S. consumersSource: Temkin Group Q3 2014 to 2016 Consumer Benchmark Surveys
N/AN/A
Figure12
TEMKINGROUPINSIGHTREPORT www.temkingroup.com
Copyright©2017TemkinGroup.Allrightsreserved. Page17
Net Promoter Scores (NPS) by Age by Industry
Copyright ©2017 Temkin Group. All rights reserved.
Industry 18 to 24 25 to 34 35 to 44 45 to 54 55 to 64 65 and older
Airlines 12 30 25 20 37 33
Auto Dealers 28 45 39 40 52 55
Banks 24 29 24 22 29 28
Computers & Tablets 22 41 34 33 42 46
Credit Cards 12 24 17 22 27 32
Fast Food 24 29 25 21 31 33
Health Plans 8 18 6 10 18 39
Hotels & Rooms 16 35 27 31 38 43
Insurance Carriers 18 36 27 35 34 41
Investment Firms 6 35 29 36 43 48
Parcel Delivery 17 26 20 24 35 38
Rental Cars & Transportation 16 35 23 22 25 40
Retailers 21 35 28 27 37 37
Software Firms 21 38 34 35 40 38
Streaming Media 32 43 42 40 46 41
Supermarkets 24 38 33 33 40 42
TV & Appliances 16 41 31 34 50 52
TV & Internet Service 4 9 -2 1 4 4
Utilities 2 22 2 4 16 26
Wireless Carriers 16 25 22 21 28 36
Lowest age group for industry Highest age group for industry
Base: 10,000 U.S. consumers
Source: Temkin Group Q3 2017 Consumer Benchmark Survey
Figure13
TEMKINGROUPINSIGHTREPORT www.temkingroup.com
Copyright©2017TemkinGroup.Allrightsreserved. Page18
Customer Experience Correlates To Net Promoter® Scores (NPS®)
Copyright ©2017 Temkin Group. All rights reserved.
331 Organizations Across 20 Industries
Base: 10,000 U.S. consumersSource: Temkin Group Q1 2017 Consumer Benchmark Study
Company NPS minus industry average NPS
(%-points)
Pearson correlation coefficient (R) = .7
NPS compared with their industry averages
2017 Temkin Experience Ratings minus industry
average (%-points)
NPS Versus Industry Average Based on Temkin Experience Ratings
2017 Temkin Experience Ratings compared with their industry averages
+
+
+
Figure14
TEMKINGROUPINSIGHTREPORT www.temkingroup.com
Copyright©2017TemkinGroup.Allrightsreserved. Page19
AbouttheAuthor,BruceTemkin
BruceTemkin isCustomerExperienceTransformist&ManagingPartnerofTemkinGroup.He isalso theco-founderandEmeritusChairof theCustomerExperienceProfessionalsAssociation(cxpa.org).
Bruceiswidelyviewedasavisionaryinthefieldandaleadingexpert inhoworganizationsbuilddifferentiationthroughcustomerexperience.Hehasworkedwithhundredsoflargeorganizationson the strategy, operational processes, organizational structures, leadership, user-centric design,and culture required to sustain superior customer relationships. He regularly coaches seniorexecutivesthatareleadingcustomerexperiencetransformationefforts.
Bruce’s research focuses on identifying current and emerging best practices. He has publishedseminal reports likeTheROI of CustomerExperience,TheFuture of CustomerExperience, andTheFour Customer Experience Core Competencies. He uses this insight to advise companies on theircustomer experience journeys, identifying opportunities for sustainable breakthroughperformance.
Bruce is the author of the popular blog Customer Experience Matters® where he regularly postsinsightson topics suchas customerexperience,branding, leadership, andemployeeengagement.His eBook—Six Laws of Customer Experience—is available for free on the blog and has beendownloadedbytensofthousandsofpeoplearoundtheworld.6
Prior to forming Temkin Group, Bruce was Vice President & Principal Analyst with ForresterResearch.Duringhis12yearswithForrester,heledthecompany'sbusiness-to-business,financialservices, e-business, and customerexperiencepractices.BrucewasForrester’smost-readanalystfor13consecutivequartersandremainsoneofthemostrespectedanalystsintheindustry.
Bruce authored several of Forrester’smost popular research reports, includingExperience-BasedDifferentiation,TheCustomerExperience Journey,andVoiceOfTheCustomer:TheNextGeneration.HecreatedForrester’sCustomerExperienceIndex(CxI)andVoiceoftheCustomerAwardandalsoled the creation and expansion ofmany of Forrester’s experience evaluationmethodologies andtrainingworkshops.
Prior to Forrester, Bruce co-founded and led a couple of Internet start-ups. He also heldmanagementpositionswithGE,StratusComputers,andFidelityInvestments.
Brucehasbeenwidelyquoted inthepress, includingmediaoutletssuchasTheNewYorkTimes,WallStreetJournal,andBusinessWeek.
Bruce is a highly demanded public speaker who combines deep expertise with an engaging,entertainingstyle.Hehasdeliveredkeynotespeechesathundredsofindustryandcorporateeventsandisoftenrecognizedasoneofthetopspeakers.
Bruceholdsamaster’sdegreefromtheMITSloanSchoolofManagement,whereheconcentratedinbusiness strategy and operations. He also holds an undergraduate degree in mechanicalengineeringfromUnionCollege.
6CustomerExperienceMattersisaregisteredtrademarkofTemkinGroup.
! !
TEMKIN'GROUP'OVERVIEW'
!'
'
'
'
'
'
'
'
Temkin! Group! is! a! leading!customer! experience! (CX)!research,! consulting,! and!training! firm.! We! help!many!of!the!world’s!largest!brands! lead! their!transformational! journeys!towards! customerCcentricity! and! build! loyalty!by!engaging!the!hearts!and!minds! of! their! customers,!employees,!and!partners.!!!Our! team! combines! CX!thought! leadership! with! a!deep! understanding! of! the!dynamics! of! organizations!to! accelerate! results.!Rather! than! layering! on!cosmetic! changes,! we! help!companies!embed!practices!within! their! culture! and!operating!processes.!!
'
Temkin'Group'
48!White!Oak!Road!Waban,!MA!02468!617/916C2075!(tel)!617/663C6124!(fax)[email protected]'
!
!
TEMKIN'GROUP'WAS'FOUNDED'BASED'ON'FOUR'BELIEFS'
1. Customer'Experience'Drives'Loyalty:'Our!research!and!work!with!clients!has!shown!that!interactions!with!customers!influence!how!much!business!they!will!do!with!you!in!the!future!and!how!often!they!will!recommend!you.'
2. Improvement'Requires'Systemic'Change:!Companies!can!improve!customer!interactions!in!isolated!areas,!but!they!don’t!develop!competitive!advantage!until!customer!experience!is!embedded!in!their!operating!fabric.!
3. It’s'a'Journey,'Not'a'Project:!Building!the!capabilities!to!consistently!delight!customers!doesn’t!happen!overnight.!Companies!need!to!plan!for!a!multiCyear!organizational!change!program.!
4. We'Can'Help'You'Make'A'Difference:!Transformation!isn’t!easy,!but!becoming!more!customerCcentric!is!worth!the!effort.!We!are!committed!to!helping!our!clients!accelerate!their!results!and!avoid!many!of!the!obstacles!along!the!way.!!
HOW'WE'ARE'DIFFERENT'
Temkin!Group!is!focused!on!sustainable!success.!We!combine!researchCbased!thought!leadership! with! a! deep! understanding! of! human! behavior! and! organizational!dynamics!to!help!companies!build!four'customer'experience'core'competencies:!!!'
'
'
'
'
'
HOW'WE'CAN'HELP'
Temkin!Group!offers!a!number!of!different!services!including:!
! Research'&'Advisory'Subscriptions:'Access!all!of!our!research!on!trends,!best!practices,!and!benchmarks,!and!receive!advice!and!answers!to!your!questions.!
! InXperson'workshops:!We!can!deliver!customized!training!for!executives,!customer!experience!professionals,!advocates,!and!other!employees.!
! Speeches'and'webinars:'Temkin!Group!can!deliver!a!highly!engaging!and!entertaining!speech!about!leadingCedge!customer!experience!topics!for!just!about!any!event!or!offsite.!
! Advisory'services:!We!can!assess!your!efforts!and!identify!opportunities!for!you!to!accelerate!results!and!avoid!pitfalls!along!the!way,!and!coach!you!to!success.!
! CX'Institute:!Tap!into!the!CX!Institute’s!leadingCedge!online!training!to!engage,!inspire,!and!educate!100s!or!1,000s!of!leaders!across!your!organization.!
'
!WWW.TEMKINGROUP.COM!
! !
Copyright!@2017!Temkin!Group.!All!rights!reserved.!