telt educational technologies pilots:brief summary of … · telt educational technologies pilots:...
TRANSCRIPT

2010
Semester 1, 2010 results
S. Quinton, M. Pachman, A. Logunov,
9/14/2010
TELT educational technologies pilots: brief summary of findings

2
INTRODUCTION In 2009 UNSW undertook a large organizational effort related to the evaluation and
adoption of new educational technologies at the institutional level. The result of this effort
was a generic evaluation framework underpinning the technology selection and adoption
process. The TELT (Technology Enabled Learning and Teaching) Evaluation Framework has
three stages, and Stage 3 of this framework is directly referring to the educational
technology evaluation by staff and students.
This brief report describes the results of the Stage 3, sub-layer 1 TELT Evaluation
Framework activities. Stage 3 initiates an ongoing educational evaluation cycle, first to
ensure the targeted technology application (or solution/s) complies with the established
criteria (and subsequent inclusion or exclusion from the TELT platform) and second, to
evaluate the learning effectiveness of the approved educational technology to align with the
need to enhance and improve online learning and teaching practices at UNSW. Stage 3, step
1 is mainly designed to evaluate the educational usefulness and value (the usability) of a
technology application, tool, or solution. Stage 3, step 1 activities include primary
quantitative data collection, i.e. staff and student surveys. The survey discussed in this
document has been completed during Semester 1, 2010. The survey instrument, its creation
and refinement are discussed in the other document - Refinement of TELT survey
instrument.
The survey was developed following the guidelines of the TELT Evaluation Framework and
draws on developments presented in Evaluation of the TELT Platform - Essential Elements
and Methodologies and TELT Evaluation - A Multi-Definitional Approach to Educational
Technology Evaluation at UNSW; Stage 3 Evaluation Criteria documents.
This summary is aimed at providing a valuable snapshot of the University community
attitudes, opinions about technologies and an objective evaluation of the technologies, in
this case the Moodle and Wikispaces applications. More specifically, it seeks to estimate
students/staff prior technological experiences and some of the personality features and draft
students/staff profiles based on these data. Secondly, it will report the findings from the
technology evaluations adjusted for learners’ prior technological experiences. This approach
will allow for the development of unbiased (objective) estimates of technology ratings within
the current institutional context. Finally, the summary will provide baseline data against
which future comparisons can be made to monitor changes and improvements.
This summary presents the findings from Moodle and Wikispaces Evaluation surveys starting
from the discussion of the respondent sample and the different groups of learners
participating in this survey, proceeding with general descriptive findings broken down by
subscale (descriptives) and continuing with question-by-question response analysis. Note
that the Wikispaces analysis is presented in comparison with the general patterns of Moodle
responses since the Wikispaces sample is not sufficient to make independent conclusions.
The final part of the summary contains recommendations related to the use and
implementation of Moodle and Wikispaces at UNSW.
3
LIMITATIONS The present summary was not designed to be a cross-institutional comparison study in that
no other institutions were involved in the Evaluation activities. Nor were there available
usability data or agreed standardized evaluation responses from other institutions, although
some Australian institutions have undertaken the effort to evaluate their educational
technologies (LaTrobe and Monash universities, for example). Nonetheless, TELT Evaluation
Framework instruments have been anticipated to provide a rich collection of evaluation data
and are also designed to guide future evaluation activities in comparable institutions across
Australia.
STEP 1 MOODLE PILOT (S1 2010).
LOGISTICS
During the semester (Semester 1, 2010), the instructors employed a blended learning
approach to supplement classroom instruction with online resources and activities provided
on a Moodle course site. Students completed an online anonymous Evaluation survey during
the final four weeks of classes. The survey remained available two weeks after the end of
the semester.
PARTICIPANTS AND THE SCALE
Moodle, an open-source learning management system was piloted in 16 courses
representing 760 students and 10 staff members from 4 different faculties (COFA, FASS,
Science and Engineering). We have received 277 responses (36.4% of the total) which
considered a typical response rate for a mailed out survey while electronic surveys are
cautioned against as having a lower response rate (Gay & Airasian, 2003). Respondents
were required to express their degree of agreement or disagreement with each statement
by selecting one of the following seven Likert scale options: 1 – Strongly Disagree; 2 –
Disagree; 3 – Somewhat Disagree; 4 – Neither Agree or Disagree; 5 – Somewhat Agree; 6
– Agree; and 7 – Strongly Agree. Respondents were also invited to contribute non-
mandatory short qualitative feedback alongside any particular statement.
PARTICIPANT GROUPS
The survey was intended to be a generic evaluation tool reflecting learners’ and staff
opinions and perceptions of educational technologies. To this end, the traditional gender and
ethnicity-related questions were intentionally omitted from the survey questionnaire as our
main goal was not to specifically make detailed comparisons of different staff and student
populations and their technological proficiency or their resistance to implied institutional
authorities but rather to gather an empirical data in regards to the features of educational
technologies under evaluation. Thus, the breakout on learners groups described below
reflects only some of the learners personality traits and learners’ prior experiences with
educational technologies, the latter being considered one of the most important if not THE
most important factor in learners’ evaluation of technologies (Hong, 2002; Kim & Moore,
2005; Wu, Tennyson and Hsia, 2010)

4
Six questionnaire items were assessing the respondents’ attitudes toward technology (prior
knowledge factor). The Likert-scale responses were aggregated to create the overall picture
of the respondent sample. The obtained factor distribution is reflected in Figure 1.
With a theoretical overall minimum of 6 (if a respondent were to answer “strongly disagree”
to all 6 attitudes towards technology questions) and maximum of 42 (if a respondent were
to answer “strongly agree” to all attitudes towards technology questions), our respondents’
population was relatively normally distributed (M = 28.67; SD = 5.4). This normality of the
distribution confirms that our respondent population included sufficient variability of people
with different levels of prior technological knowledge and could be generalizable to any
student population (except for technical institutions students). As such the example of this
report could be used by other higher education institutions.
Figure 1: Participant’s population by their attitudes toward technology.
For further analysis we took into consideration how well informed our participants are about
the Moodle system, using those responses as a multiplier of the original distribution. Based
on this aggregate index the participants were then delineated into 3 categories of low prior
knowledge, average and high prior knowledge based on the distribution.
5
The rationale behind such division was that the opinion of a relatively knowledgeable person
with a strong background in this particular application (Moodle) could be considered an
expert opinion while the knowledge of a person with high prior knowledge with little
exposure to Moodle features could be considered into an expert or an average opinion
depending on how advanced the person originally was and how much does this person know
about Moodle. Thus, group 2 reflected people falling into +/- 1 SD around the mean
interval, while groups 1 and 3 reflected the extremes (< -1 SD and >1 SD).
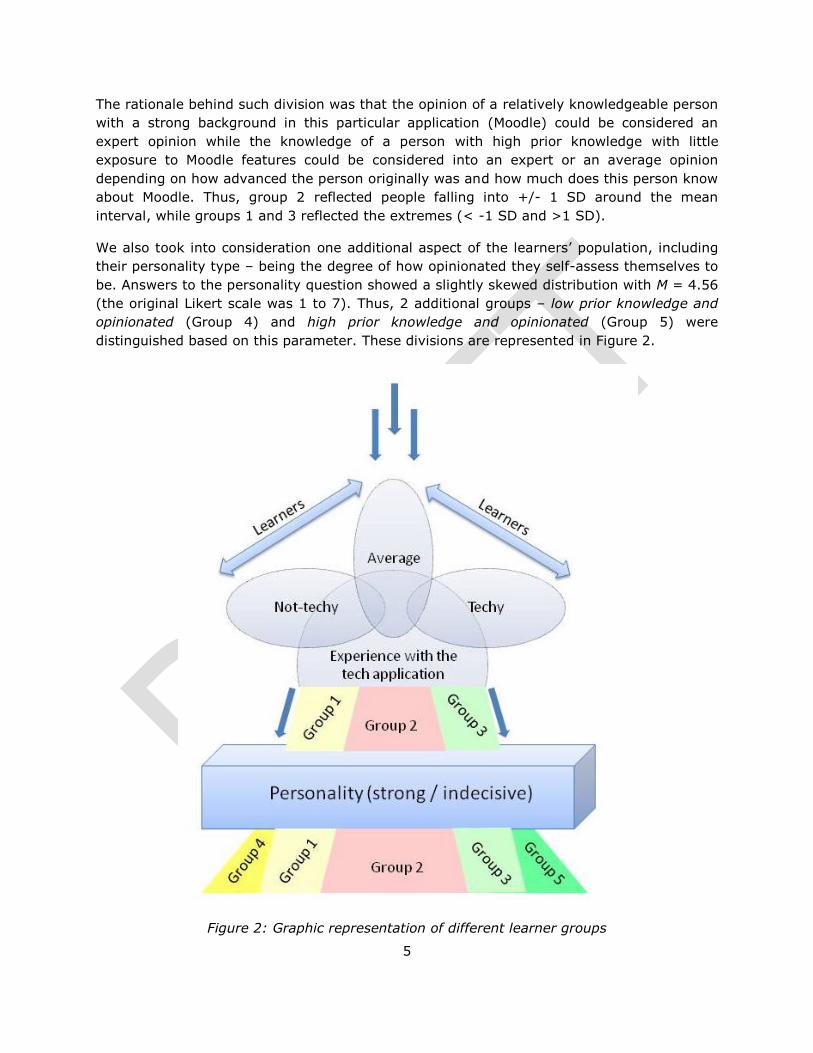
We also took into consideration one additional aspect of the learners’ population, including
their personality type – being the degree of how opinionated they self-assess themselves to
be. Answers to the personality question showed a slightly skewed distribution with M = 4.56
(the original Likert scale was 1 to 7). Thus, 2 additional groups – low prior knowledge and
opinionated (Group 4) and high prior knowledge and opinionated (Group 5) were
distinguished based on this parameter. These divisions are represented in Figure 2.
Figure 2: Graphic representation of different learner groups
6
In summary:
- Group 1:
non-opinionated respondents of a low prior knowledge
- Group 2:
average respondents with an average scoring on both technology usage and
personality traits
- Group 3:
non-opinionated respondents with a high self-assessed rating of technology usage
- Groups 4:
opinionated respondents who had a low self-assessed rating of technology usage
- Group 5:
opinionated respondents with a high self-assessed rating of technology usage
The breakdown on groups was designed to assess different needs of the different students’
populations in regard to the GUI (emotional appeal of technologies) and in regard to
technologies flexibility.
GENERAL FINDINGS (DESCRIPTIVES)
The survey instrument (see Refinement of TELT survey instrument for a description)
consisted of five subscales reflecting the following dimensions:
- Usability
- Feelings toward an application
- Resistance to implied authorities in relation to one’s teaching and learning
- Preconceived notions about eLearning
- Flexibility of application in relation to the teaching and learning
Means and standard deviations of the different learner groups are presented in Table 1.
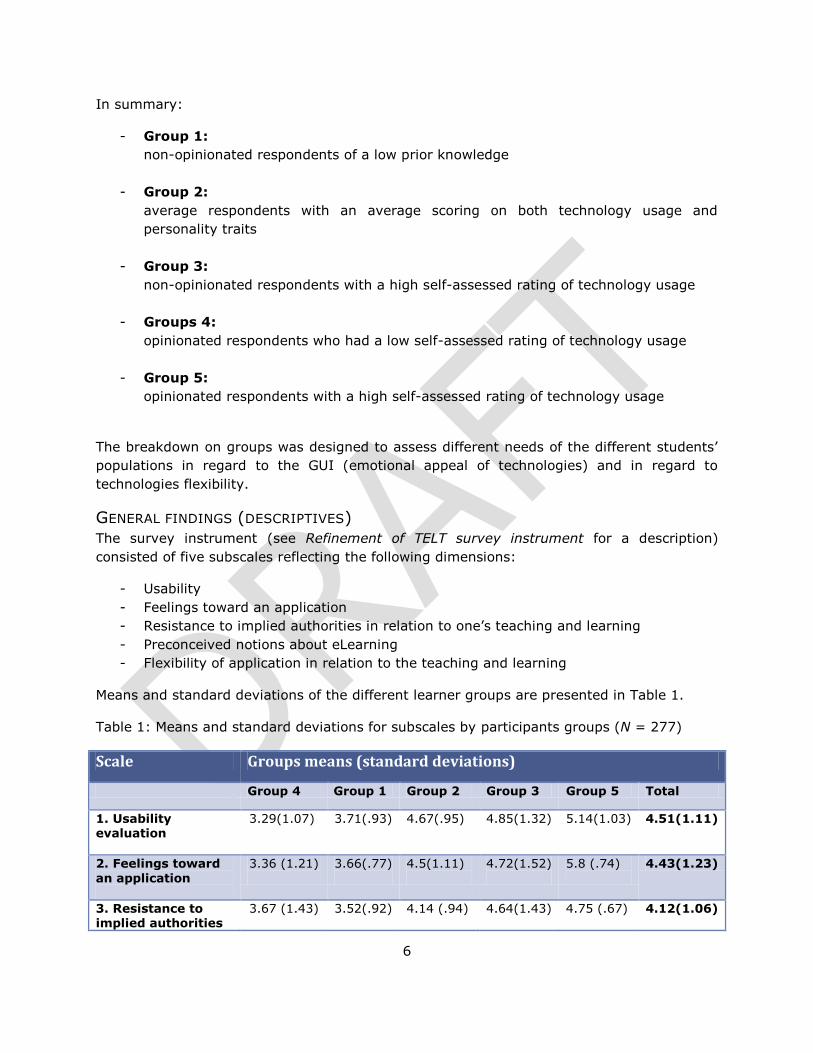
Table 1: Means and standard deviations for subscales by participants groups (N = 277)
Scale Groups means (standard deviations)
Group 4 Group 1 Group 2 Group 3 Group 5 Total
1. Usability evaluation
3.29(1.07)
3.71(.93)
4.67(.95)
4.85(1.32)
5.14(1.03)
4.51(1.11)
2. Feelings toward
an application
3.36 (1.21)
3.66(.77)
4.5(1.11)
4.72(1.52)
5.8 (.74)
4.43(1.23)
3. Resistance to implied authorities
3.67 (1.43)
3.52(.92)
4.14 (.94)
4.64(1.43)
4.75 (.67)
4.12(1.06)

7
in relation to one’s teaching and
learning*
4. Preconceived notions about
eLearning
3.64 (1.19)
3.69(1.1)
4.66(1.05)
5.02(1.04)
4.93 (1.2)
4.54(1.04)
5. Flexibility of application in relation to one’s
teaching and learning
4.31 (.77) 4.19(.82) 5.24 (.75) 6.06 (.49) 6.25 (.66) 5.2(.91)
* reverse scale
General results of our study demonstrate higher ratings for the flexibility of Moodle in
relation to one’s teaching and learning. The total rating on the flexibility subscale is even
higher than the usability subscale results or feelings toward an application subscale results.
At the same time it is also visible how much preconceived notions about eLearning influence
the learners’ opinions. The final findings demonstrate that the total rating for learners’
resistance to the institutional authorities is somewhat lower than any other factor. While our
learners value the flexibility of the technological application, they are uncertain about the
institutional reaction to their input and to their unique learning style. Coming out of a school
system with its strict curricular limits, university students are not sure how much
individuality they are allowed in this new adult world. The importance of including the
learners’ voices into the evaluation process has already been mentioned in research
literature (Alexander & Golja, 2007), but unfortunately this inclusion often confines students
to the role of an end recipient of the delivered educational services, where all decisions are
made without their input as in the case highlighted in Britain and Liber (2004).
GROUPS DIFFERENCES
There were significant differences between the learner groups for each of the subscales.
However, an unexpected finding at this stage of the evaluation was that learners’ error
experience influenced not only subjective subscales (such as the emotional aspects of
evaluation) but also many of the objective usability items. Therefore, no independent
analyses of the group differences were performed. But all the analyses included error-
experience as the second independent variable along with a group membership (see
discussion below).
SUMMARY OF GENERAL FINDINGS:
Contextual factors such as students’ perception of the flexibility of the system can serve as
a “deal breaker” in adoption decisions when one system (i.e. Moodle) could be perceived
highly flexible in comparison with the other technologies. The Moodle survey results also
indicate the importance of transparent technology evaluation policies and visible outcomes
in the institutional context, to inform students that their voices have been heard and their
opinion is taken into consideration when technology adoption decisions are made. At the
same time, as learners use more and more commercial products in their everyday lives,
8
average user expectations and requirements towards the “look and feel” of the educational
software will approach the market standards of for-profit applications.
STATISTICAL ANALYSIS
The data was analysed based on the division described above: 5 groups of learners (or 5
learners’ profiles) were weighted in their answers to the survey questions. The other
independent variable that was included in this analysis was learners’ experience with errors.
The notion of errors was understood broadly as a sum of technological and instructional
design factors, i.e. course design deficiencies, system malfunctions, and even interface
inconsistencies could have been perceived as errors. The study reflects the fact that the
learners were sensitive to their own personal experience with errors during the pilot.
Overall, the results of the study showed that the notion of errors requires further
investigation. The next cycle of evaluation pilot will be designed with a thorough
classification of the errors types and will include examples of errors to have a better picture
of the primary needs of the learners.
ANOVA with 2 independent variables (IVs) - group membership and an experience with
errors, and subscales as dependent variables (DVs) was used for a statistical analysis. Post-
hoc comparisons were conducted using Tukey’s HSD for honest significant difference for
groups, since this test allows for evaluating whether differences between any two pairs of
means are significant based on a calculated new critical value. It allows for sufficiently
controlling for Type I error when multiple pairs of means are compared.
STRONGLY ERRORS-DEPENDENT ITEMS
Two questionnaire items strongly depended on participants’ error experience – an item
related to the use of help and documentation during the use of application and the
perceived relation of the experiencing problems to the overall educational outcomes. These
items were analysed separately from the rest of the subscales’ items.
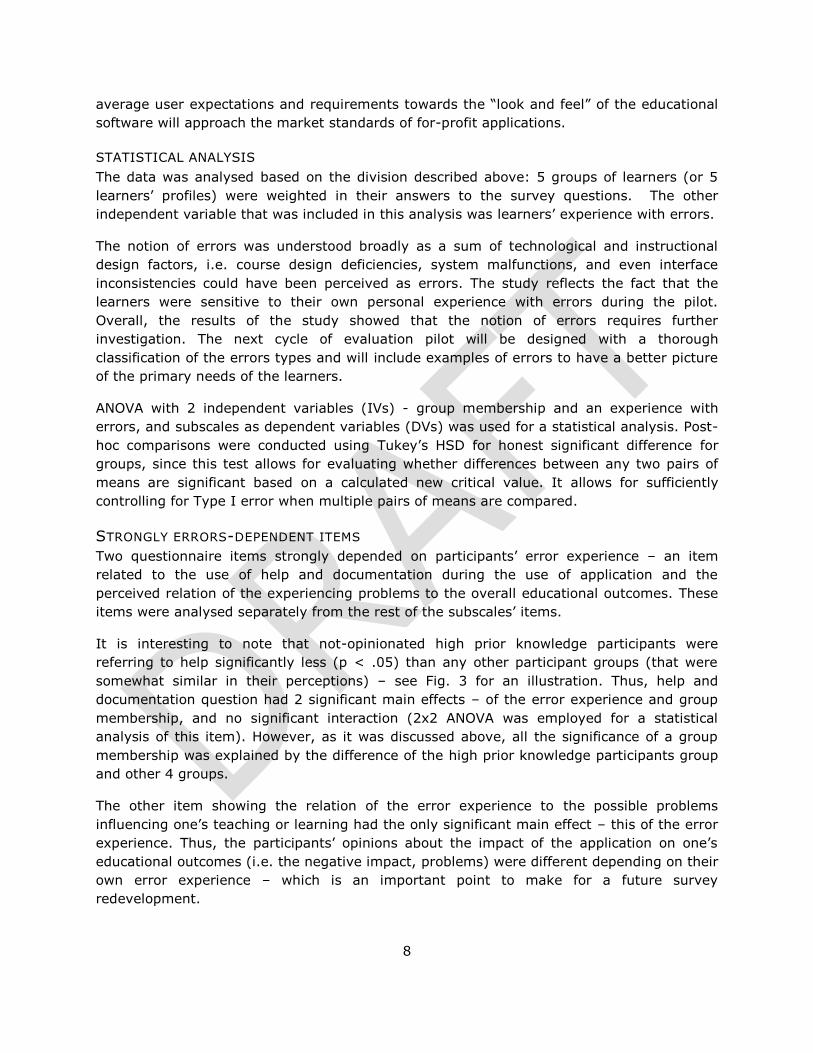
It is interesting to note that not-opinionated high prior knowledge participants were
referring to help significantly less (p < .05) than any other participant groups (that were
somewhat similar in their perceptions) – see Fig. 3 for an illustration. Thus, help and
documentation question had 2 significant main effects – of the error experience and group
membership, and no significant interaction (2x2 ANOVA was employed for a statistical
analysis of this item). However, as it was discussed above, all the significance of a group
membership was explained by the difference of the high prior knowledge participants group
and other 4 groups.
The other item showing the relation of the error experience to the possible problems
influencing one’s teaching or learning had the only significant main effect – this of the error
experience. Thus, the participants’ opinions about the impact of the application on one’s
educational outcomes (i.e. the negative impact, problems) were different depending on their
own error experience – which is an important point to make for a future survey
redevelopment.
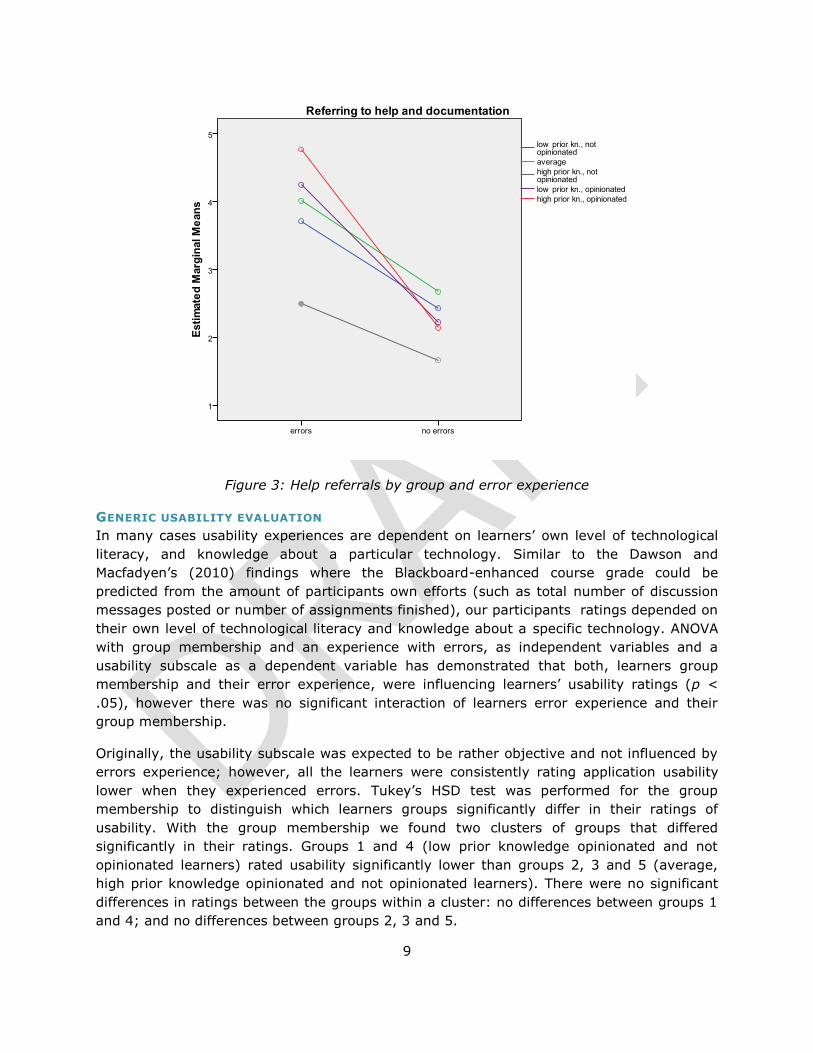
9
Figure 3: Help referrals by group and error experience
GENERIC USABILITY EVALUATION
In many cases usability experiences are dependent on learners’ own level of technological
literacy, and knowledge about a particular technology. Similar to the Dawson and
Macfadyen’s (2010) findings where the Blackboard-enhanced course grade could be
predicted from the amount of participants own efforts (such as total number of discussion
messages posted or number of assignments finished), our participants ratings depended on
their own level of technological literacy and knowledge about a specific technology. ANOVA
with group membership and an experience with errors, as independent variables and a
usability subscale as a dependent variable has demonstrated that both, learners group
membership and their error experience, were influencing learners’ usability ratings (p <
.05), however there was no significant interaction of learners error experience and their
group membership.
Originally, the usability subscale was expected to be rather objective and not influenced by
errors experience; however, all the learners were consistently rating application usability
lower when they experienced errors. Tukey’s HSD test was performed for the group
membership to distinguish which learners groups significantly differ in their ratings of
usability. With the group membership we found two clusters of groups that differed
significantly in their ratings. Groups 1 and 4 (low prior knowledge opinionated and not
opinionated learners) rated usability significantly lower than groups 2, 3 and 5 (average,
high prior knowledge opinionated and not opinionated learners). There were no significant
differences in ratings between the groups within a cluster: no differences between groups 1
and 4; and no differences between groups 2, 3 and 5.
10
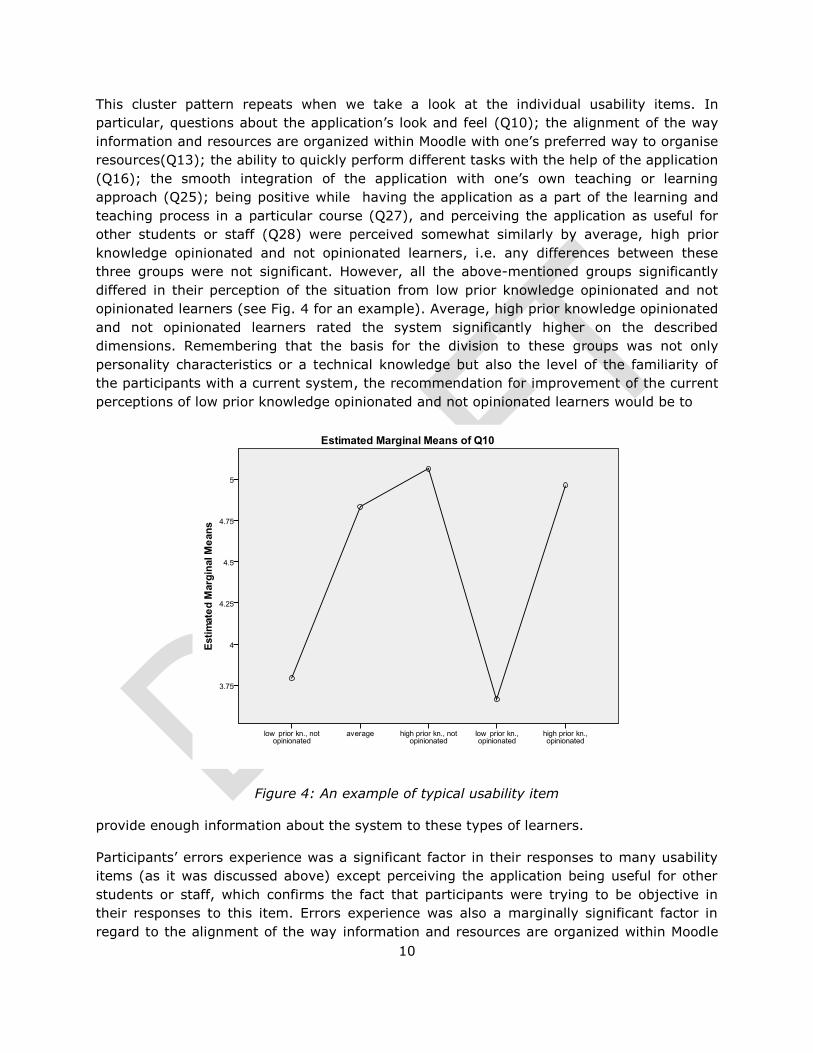
This cluster pattern repeats when we take a look at the individual usability items. In
particular, questions about the application’s look and feel (Q10); the alignment of the way
information and resources are organized within Moodle with one’s preferred way to organise
resources(Q13); the ability to quickly perform different tasks with the help of the application
(Q16); the smooth integration of the application with one’s own teaching or learning
approach (Q25); being positive while having the application as a part of the learning and
teaching process in a particular course (Q27), and perceiving the application as useful for
other students or staff (Q28) were perceived somewhat similarly by average, high prior
knowledge opinionated and not opinionated learners, i.e. any differences between these
three groups were not significant. However, all the above-mentioned groups significantly
differed in their perception of the situation from low prior knowledge opinionated and not
opinionated learners (see Fig. 4 for an example). Average, high prior knowledge opinionated
and not opinionated learners rated the system significantly higher on the described
dimensions. Remembering that the basis for the division to these groups was not only
personality characteristics or a technical knowledge but also the level of the familiarity of
the participants with a current system, the recommendation for improvement of the current
perceptions of low prior knowledge opinionated and not opinionated learners would be to
Figure 4: An example of typical usability item
provide enough information about the system to these types of learners.
Participants’ errors experience was a significant factor in their responses to many usability
items (as it was discussed above) except perceiving the application being useful for other
students or staff, which confirms the fact that participants were trying to be objective in
their responses to this item. Errors experience was also a marginally significant factor in
regard to the alignment of the way information and resources are organized within Moodle
11
with one’s preferred way to organise resources and the ability to quickly perform different
tasks with the help of the application. Thus, although participants were trying to be
objective, in many cases their own errors experience was an important factor on the way
they evaluate the usability of the application. In an ideal case scenario, usability evaluation
should be free of personal likes and dislikes and should reflect only effectiveness and
efficiency of the technological tool, so the notion of the errors should be further researched
in order to better understand the nature of subjective vs. objective factors in future studies.
Some items depended more obviously on the level of the learners’ technical knowledge. In
particular, an item referring to the consistency of the application to the learner’s previous
usability experience with other software and websites (Q11) had significantly different
responses only between high prior knowledge opinionated and average learners on one side
and opinionated low prior knowledge learners on the other side. High prior knowledge and
not-opinionated low prior knowledge learners were in the middle in their responses to this
item, and no significant differences were observed between them and the other groups
mentioned above. This result can also be explained by the way of this questionnaire item
was formulated (the point that is further discussed in Refinement of TELT survey instrument
document).
A similar pattern was observed for an item asking participants whether they consider the
application as having or not having certain problems (Q19). The two groups of high prior
knowledge and average participant significantly differed in their view of the problems
compared to the opinionated low prior knowledge group. High prior knowledge opinionated
and not-opinionated low prior knowledge learners were in the middle in their responses to
this item, and no significant differences were observed between them and the other groups
mentioned above. This questionnaire item was also very errors-dependent, i.e. the response
pattern changes drastically based on the fact participants have experienced an error,
especially for a low prior knowledge group (see Fig. 5). A particular recommendation for any
staff members having a low prior knowledge learners population would be to carefully
examine any course resources and activities they use in an online component of the course
in order to avoid simple errors such as problems with upload or similar.
It is interesting to note that the question about clarity and intuitiveness of searching,
finding and accessing information via Moodle (Q15) was perceived differently even by
technologically advanced group of learners (see Fig. 6 for an example). Opinionated high
prior knowledge participants and participants with an average level of technological
knowledge were considering the information search less intuitive than not-opinionated high
prior knowledge learners (p < .05 for a post-hoc comparison with opinionated high prior
knowledge learners; p < .05 for a post-hoc comparison with average learners). At the same
time, similarly to the previously discussed items, all these three groups were significantly
different in their opinion from low prior knowledge and opinionated low prior knowledge
learners. Another explanation of those findings might be related to the nature of the
learners’ groups themselves: not-opinionated high prior knowledge learners might perceive
certain things as being unclear and somewhat irrelevant but they have an extensive
experience with other applications and comparing to these other applications Moodle search
processes are relatively well defined.

12
Figure 5: differential influence of error experience on low prior knowledge learners
Figure 6: An example of differentially perceived usability item

13
SUMMARY OF USABILITY FINDINGS:
Error experience was a significant factor influencing the answers to all generic usability
questions, although this was not one of the expected outcomes. However, this outcome has
raised some additional concerns about the notion of errors in learning management systems
(LMS) and in higher education courses. It has provided a good example of how much the
evaluation of a technology and learners overall perception depend on the learners actual
experiences with the technology, emphasizing the need for a comprehensive staff and
student voice in technology evaluation.
Many of the usability items (Q10, Q13, Q16 etc.) were perceived somewhat similarly by
average, high prior knowledge and opinionated high prior knowledge participants, which
indicates that there are no particular problems with these aspects of the application except
for working on an overall level of students’ technical literacy.
The other finding is related to the intuitiveness of searching, finding and accessing
information via Moodle. This survey item received a highly positive rating only from the high
prior knowledge learners; opinionated high prior knowledge learners and average learners
were somewhat less enthusiastic. Thus, the development of effective processes and design
considerations behind searching, finding and accessing information via Moodle require
additional attention from course instructors and educational designers.
FEELINGS TOWARD AN APPLICATION (EMOTIONAL ASPECTS OF TECHNOLOGY EVALUATION)
We have employed the same statistical procedure for this subscale as for the usability
subscale. We have used ANOVA with group membership and experience with errors as
independent variables, and feelings toward an application subscale as the dependent
variable. Similar to the general usability items, participants’ errors experience was a
significant factor in their responses to all emotions-related items. However, this trend was
expected (in difference of the usability evaluation where more objectivity would be expected
from learners). The second independent variable, group membership, was also a significant
factor influencing participants overall ratings of their feelings about the application. There
was no significant interaction of the error experience and group membership. Post-hoc
Tukey’s HSD analysis of the group membership revealed three clusters of responses
significantly different from each other. Low prior knowledge learners had the lowest ratings
of feelings towards the application, significantly lower than average and opinionated high
prior knowledge learners (all p < 0.05). Average and opinionated high prior knowledge
learners were, in turn, rating their feelings significantly lower than not-opinionated high
prior knowledge learners (all p < 0.05). Within these clusters learners groups did not differ
significantly in their opinions.
The same cluster pattern appears for the individual items analysis. Atypical items with 3
significantly different clusters prevail (see Fig. 6 for an example). The emergence of these
atypical items can be explained by the situation when opinionated and average learners
understand the technological value of the application (see Generic Usability Evaluation
section) but their emotions about the application are somewhat unsettled in the way they
compare it to ultra-modern designs such as trendy tablet systems. Items 14 and 12 in
particular reflect this statistical pattern (an item asking how tedious it is to access
14
information and resources using Moodle, and an item referring to the application as
completely irrelevant and distracting for one’s teaching or learning processes, respectively).
These items showed that opinionated high prior knowledge learners and learners with an
average level of technological knowledge were considering the process more tedious and the
application more irrelevant than not opinionated high prior knowledge learners (p<.05 for a
post-hoc comparisons with opinionated high prior knowledge participants; p<.05 for a post-
hoc comparisons with average learners). There was also a significant difference between
opinionated high prior knowledge learners and learners with an average level of
technological knowledge mentioned above, and low prior knowledge and opinionated low
prior knowledge learners (all p < 0.05).
The other two items with three groupings and a significant difference only between the
“extremes” – the highest and the lowest opinions - were the questions about feeling
apprehensive in using the application (Q26) and the question about the level of the
application’s integration with one’s learning and teaching (Q21). In considering being
apprehensive and seeing applications’ features and content as being integrated with one’s
learning and teaching, not-opinionated high prior knowledge learners were significantly
different from high prior knowledge and opinionated low prior knowledge learners;
opinionated high prior knowledge participants and average learners were somewhere in
between in their perceptions of the situation.
It is interesting to note that the question about using help and documentation, discussed in
the error-dependent items section, loaded on the feelings toward an application factor.
Learners perceived help-seeking as a somewhat emotional procedure (response?). In some
sense the response pattern for this item (see Fig. 3) resembles the answer to the
hypothetical question of what makes a professional professional – dedication and hard
work... That is, spending their time to learn the system and correct the errors instead of
just following the manual possibly helped this participants’ group become experts.
SUMMARY OF EMOTIONAL ASPECTS FINDINGS:
As was expected, emotional aspects of the application evoked a stronger response from
opinionated learners (especially opinionated high prior knowledge learners), than their less
opinionated colleagues. Qualitative responses to this subscale show that the learners were
somewhat overloaded with information: “I ignore stuff I don't use”; “I only followed the
links the applications i needed to go to”; “Too many ways to display the info”; “Different
features suit different courses, but you should almost never use all of them”. As we can see,
learners’ feelings about the application are somewhat mixed. Coupled with a total mean of
4.43 (Table 1), the staff and student emotional reaction to Moodle is rather positive,
although certainly not at the top of the scale. It should be noted, however, that course
design issues (that will be explored on Stage 3, step 3 TELT Evaluation Framework in 2012)
seem to influence the feelings about the application in addition to the features of the
application itself.
WHO ARE OUR LEARNERS?
While the previous section reflected technical and emotional aspects in the use of the
application, the current section helps creating a complete picture of who our learners are,
15
There is no more division
on institution by itself and
technology by itself. They
are the one.
what experience with eLearning technologies they had in the past and how informed they
are about their own learning and teaching styles. It includes an analysis of two survey
subscales conducted in the same way as the previous subscale analysis (which included
testing the significance of error experience on participants’ ratings). Thus, we employ
ANOVA with group membership and experience with errors, as independent variables, and
the new subscales as the dependent variable(s). Otherwise, an experience with errors is
excluded as independent variable to increase the power of analysis.
RESISTANCE TO IMPLIED AUTHORITIES IN RELATION TO ONE’S TEACHING AND LEARNING
The Resistance to implied authorities in relation to one’s teaching and learning subscale
highlighted learners’ personal traits many of which were dependent on learners past
experiences and were not particularly related to their present experience with errors. Thus,
encountering errors did not play a significant role for items of this subscale (p = .17) except
for a question about an understanding of one’s unique teaching and learning styles by the
institution (Q30). Therefore, the items analysis (ANOVA) included only one independent
variable – group membership. Groups differed significantly in their total resistance to the
implied authorities (p < 0.001). Post-hoc Tukey’s HSD analysis of the group membership
revealed three distinct clusters of responses. Low prior knowledge opinionated and not
opinionated learners had significantly lower resistance than high prior knowledge
opinionated and not opinionated learners (all p < 0.05). Average learners were in the
middle in their responses and not significantly different from low prior knowledge
opinionated and high prior knowledge opinionated and not opinionated learners. The only
significant difference for average learners was with low prior knowledge not opinionated
learners (p < 0.05).
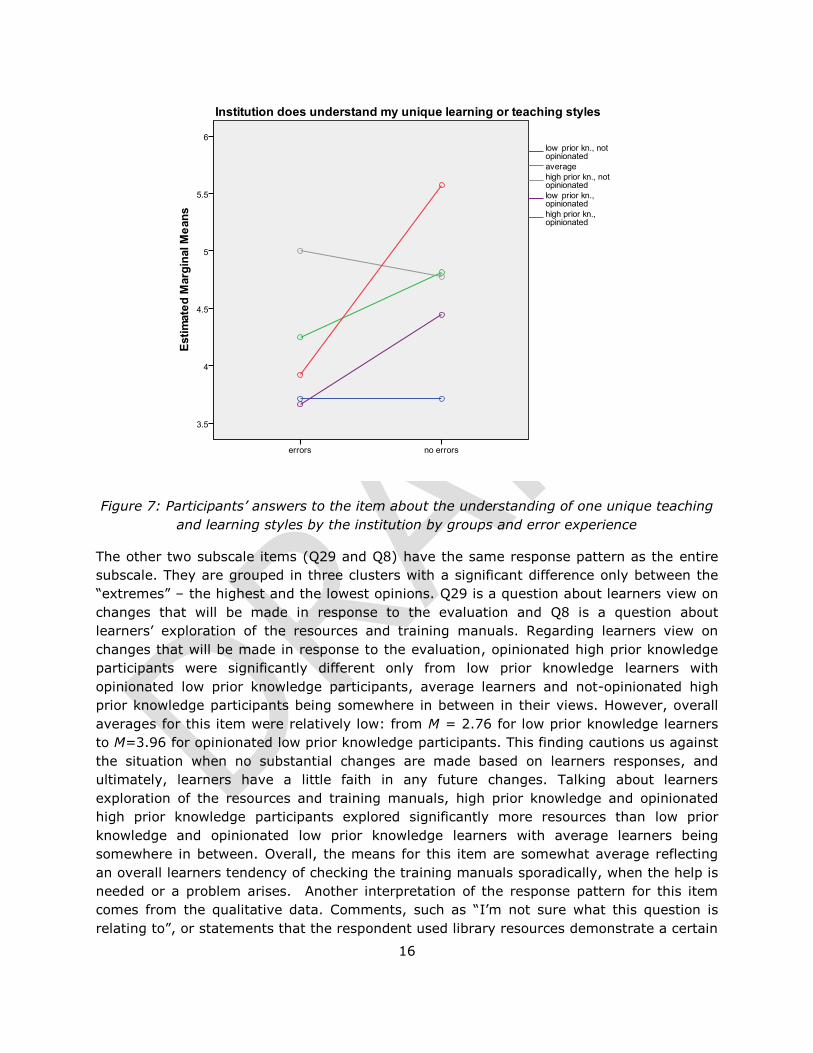
As it was mentioned above, an understanding of one’s unique teaching and learning styles
by the institution item (Q30) was unique in a sense that it was influenced by learners’ error
experience. But the main effect of the error experience (p < .05) was accounted for by
differential responses of one group - the opinionated high prior knowledge group (M = 3.92
for those experiencing errors and M=5.57 for those not experiencing errors). In turn, the
main effect of the group was manly accounted for by the opinionated high prior knowledge
group and opinionated not high prior knowledge group difference (p < .05), see Fig. 7 for
an example. The participants’ responses to the
above-mentioned question demonstrate that
although opinionated low prior knowledge group is
traditionally critical in their perceptions about how
much the institution understand their uniqueness,
opinionated high prior knowledge learners’ opinion
strongly depends on their error experience. In this
sense, being highly technology literate and seeking
technologically-enhanced courses leads to the
perception of the technology-enhanced courses as
an integral part of the institution. There is no more
division on the institution by itself and technology by itself: they are integrated – at least at
the minds of opinionated high prior knowledge learners. Technological error, then,
translates into institutional gaffe.
16
Figure 7: Participants’ answers to the item about the understanding of one unique teaching
and learning styles by the institution by groups and error experience
The other two subscale items (Q29 and Q8) have the same response pattern as the entire
subscale. They are grouped in three clusters with a significant difference only between the
“extremes” – the highest and the lowest opinions. Q29 is a question about learners view on
changes that will be made in response to the evaluation and Q8 is a question about
learners’ exploration of the resources and training manuals. Regarding learners view on
changes that will be made in response to the evaluation, opinionated high prior knowledge
participants were significantly different only from low prior knowledge learners with
opinionated low prior knowledge participants, average learners and not-opinionated high
prior knowledge participants being somewhere in between in their views. However, overall
averages for this item were relatively low: from M = 2.76 for low prior knowledge learners
to M=3.96 for opinionated low prior knowledge participants. This finding cautions us against
the situation when no substantial changes are made based on learners responses, and
ultimately, learners have a little faith in any future changes. Talking about learners
exploration of the resources and training manuals, high prior knowledge and opinionated
high prior knowledge participants explored significantly more resources than low prior
knowledge and opinionated low prior knowledge learners with average learners being
somewhere in between. Overall, the means for this item are somewhat average reflecting
an overall learners tendency of checking the training manuals sporadically, when the help is
needed or a problem arises. Another interpretation of the response pattern for this item
comes from the qualitative data. Comments, such as “I’m not sure what this question is
relating to”, or statements that the respondent used library resources demonstrate a certain
17
The biggest proportion of
the learners (about 84%)
turned to be rather
consumers of technology
than active participants in
aligning educational
technologies with their
own teaching and learning
needs.
degree of confusion regarding the type of resources
mentioned: course resources or training resources.
Questions about the integration of the application
with one’s unique learning or teaching approach,
and a search for alternative ways of integration
reveal the existence of a somewhat inert group of
low prior knowledge, opinionated low prior
knowledge and (unfortunately) average learners
that are significantly different from high prior
knowledge and opinionated high prior knowledge
participants in that they don’t look for challenges
with technology. The biggest proportion of the
learners (about 84%) turned out to be consumers of
technology rather than active participants in
aligning technology with their own teaching and
learning needs.
SUMMARY OF RESISTANCE TO IMPLIED AUTHORITIES FINDINGS:
The overall resistance to implied authorities in the Moodle sample is fairly low, with a large
proportion of learners being consumers of educational technologies rather than active
participants. The other emerging tendency is that the educational technologies are
perceived as an integral part of the university, thus the experience with these technologies
is seen as a part of the general university experience. Further recommendations for
educational administrators would include empowering the existing learners in regard to
including their voices in the evaluation process and informing upcoming students about the
possibilities of educational technologies.
PRECONCEIVED NOTIONS ABOUT ELEARNING
The Preconceived notions about eLearning subscale was tightly related to learners past
experiences and was not particularly related to their present experience with errors.
Experiencing errors did not (and should not, theoretically, over the short term) influence
participants existing opinions about eLearning (p = .91). Thus, the only observed influence
was that of the learners’ groups. ANOVA with group membership as an independent variable
revealed that the level of prior knowledge significantly influenced learners notions about
eLearning (p < 0.001). Post-hoc Tukey’s HSD analysis of the group membership revealed
two significantly different clusters of responses. Average, high prior knowledge opinionated
and not opinionated learners were considerably more optimistic about eLearning than low
prior knowledge opinionated and not opinionated learners (all p < 0.05). The same
groupings were present in individual items analysis. Both questions (Q6 - the value of
eLearning in construction of new knowledge and Q7 – in encouraging collaboration) fit under
the typical item profiles (see Fig. 4 for a graphic example) with average, high prior
knowledge and opinionated high prior knowledge participants being somewhat similar in
their opinions about eLearning. All of these learning groups have significantly higher
preconceived notions about eLearning than low prior knowledge and opinionated low prior
knowledge learners for both items. For example, opinions of average, high prior knowledge

18
and opinionated high prior knowledge learners mostly rise above average (average being 4
on the 1 to 7 scale), while low prior knowledge and opinionated low prior knowledge
participants fall somewhat below average. Thus, the prior technological knowledge shapes
learners existing opinions about eLearning.
As a recommendation, different courses, events and even advertisement instruments
promoting eLearning seem to be good ways to create a better understanding of eLearning
methods for staff and students.
SUMMARY OF PRECONCEIVED NOTIONS ABOUT ELEARNING FINDINGS:
One of the main goals of the new Evaluation Framework is to gain an understanding of who
are our learners and what is their current level of technological proficiency to be able to
come up with sound organizational recommendations in regard to those learners. If we
underestimate their current level or current experiences/expectations, it may have strong
budgetary consequences for a university as a whole and will not change the experience /
level of satisfaction for students. Improving students’ notions about eLearning is an
honourable and important long run goal, whilst efforts should be made to consider and
attend to the present needs of students with different notions about eLearning, in the short
run.
The findings for this subscale suggest that Preconceived notions about eLearning largely
depend on learners’ previous experiences with technology. This result calls for ongoing
promotion and integration of technology-related initiatives on campus and for future
students cohort.
FLEXIBILITY OF THE APPLICATION
The Flexibility of the application subscale was another subscale where we expected learners
to be objective rather than subjective. Therefore, we did not expect their error experience
to influence the outcomes. While the items in this subscale were intended to assess
respondents’ understanding of the system (Moodle) the underlying construct uncovered by
the statistical analysis could instead be called “opinions about integration and flexibility of
the technology applications”.
FLEXIBILITY OF APPLICATION IN RELATION TO THE TEACHING AND LEARNING
As expected, experience with errors only mattered for one of the subscale items (question
about the level of understanding of the integration patterns), while the other item (flexibility
of the application) does not show large difference in responses even between different
learners groups. Thus, our discussion is generally related to Q22 (understanding of
integration patterns). In this question, students’ group membership plays an important role:
high prior knowledge and opinionated high prior knowledge learners have significantly
higher responses than average learners (all p < 0.05), and average learners have a
significantly higher level of understanding of how the application, its features and its content
should integrate with student learning and teaching than low prior knowledge and
opinionated low prior knowledge learners (all p < 0.05). It is also interesting to note that
both high prior knowledge and opinionated high prior knowledge participants rate their
understanding relatively high (M= 6.6 and 6.26 on 7 points scale). As for flexibility of the
application (Q24), it was rated high by all learners groups with means ranging from 5.14 to
19
5.93 on 7-items scale. These high ratings regarding the flexibility of the application are
extremely important because they provide us with yet another source of information as for
how the pedagogical values can be integrated with the existing technology.
SUMMARY OF FLEXIBILITY OF APPLICATION IN RELATION TO THE TEACHING AND LEARNING
FINDINGS:
The flexibility of Moodle and its integration capabilities were rated relatively high by all
groups of learners with the total flexibility subscale mean equal to 5.2 (Table 1). Future
piloting of LMS educational technologies similar to Moodle is necessary to place this finding
into context. However, this preliminary result can give educational administrators a better
idea about the strengths and weaknesses of a piloted application, with its flexibility and
integration capabilities being particular areas of focus.
STAFF PERCEPTIONS
Only four staff members took part in Moodle survey. They were representing three different
groups: 1 low prior knowledge person; 2 average users and 1 high prior knowledge person.
Only one (high prior knowledge person) experienced errors. His / her overall usability
evaluation is higher than that of the low prior knowledge user but lower than those of two
average users. One of the average level of experience staff did not seem to like the
application in terms of access to information, identified some other problems (although he /
she did not experience any errors) and was not sure that his/her opinion will be taken into
consideration. Otherwise, there are no definite conclusions that can be possibly drawn about
faculty perceptions based on the small sample size of only four staff participants.
STAGE 3 WIKISPACES PILOT (S1 2010).
We received only 30 responses to the survey questions in Wikispaces pilot, which might be
due to the highly individualistic nature of the piloted environment (i.e. creating a good Wiki
is somewhat similar to the creation of the Web-site). Therefore, any results obtained for this
pilot should be interpreted within the context of a small sample size. The composition of the
sample itself should also be considered with caution: our sample had a high percentage of
staff members – 30% of the sample, while 70% were students. This is not the traditional
breakdown for a university environment. For example, UNSW has about 6000 staff
members and 46000 students, totalling in 52000 people on campus1 which is 11.5% staff
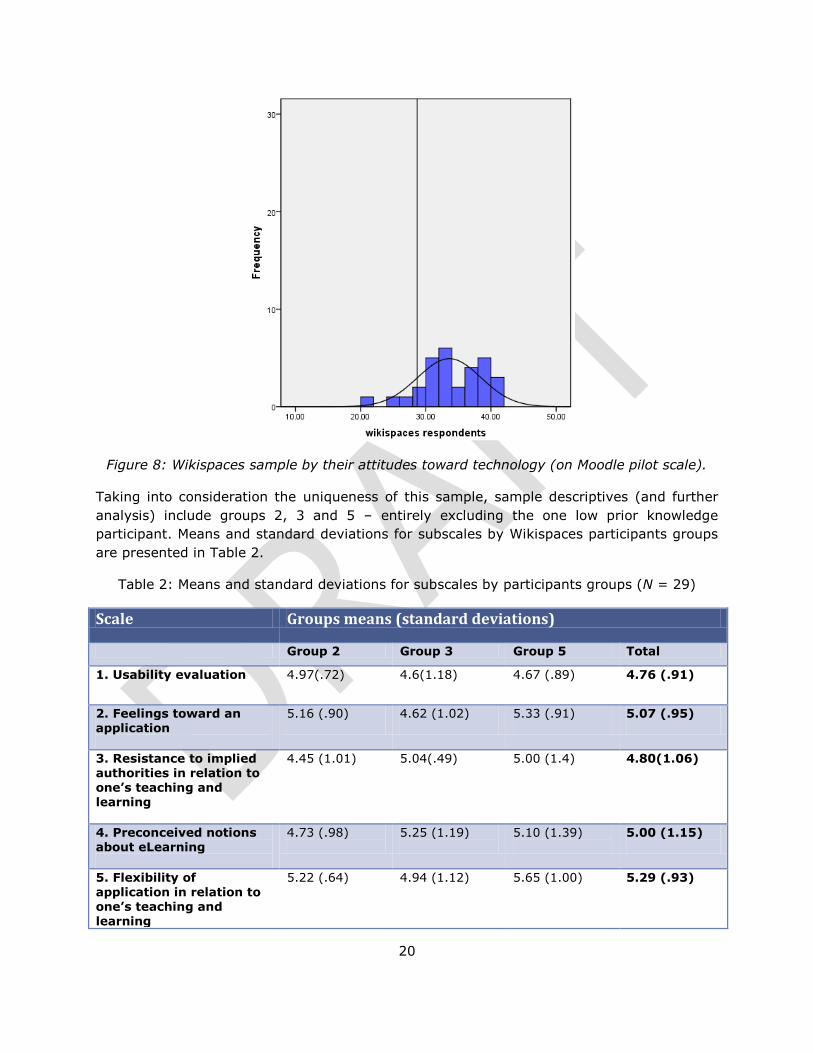
members and 88.5% students. The Wikispaces sample is also unique in terms of the high
level of participant technical proficiency: the vertical reference line on Fig. 8 reflects the
mean of Moodle pilot sample (i.e. typical university population). As we can see, the majority
- 87% of Wikispaces population is above this mean (right half of the figure). Moreover, the
division by groups similar to the one employed with Moodle sample gave us only 3% of low
prior knowledge and opinionated low prior knowledge participants (1 participant) in
Wikispaces sample. 60% (!) of the Wikispaces sample would be included in high prior
knowledge (27%) and opinionated high prior knowledge groups (33%).
1 http://en.wikipedia.org/wiki/University_of_New_South_Wales
20
Figure 8: Wikispaces sample by their attitudes toward technology (on Moodle pilot scale).
Taking into consideration the uniqueness of this sample, sample descriptives (and further
analysis) include groups 2, 3 and 5 – entirely excluding the one low prior knowledge
participant. Means and standard deviations for subscales by Wikispaces participants groups
are presented in Table 2.
Table 2: Means and standard deviations for subscales by participants groups (N = 29)
Scale Groups means (standard deviations)
Group 2 Group 3 Group 5 Total
1. Usability evaluation 4.97(.72)
4.6(1.18)
4.67 (.89)
4.76 (.91)
2. Feelings toward an application
5.16 (.90)
4.62 (1.02)
5.33 (.91)
5.07 (.95)
3. Resistance to implied authorities in relation to one’s teaching and learning
4.45 (1.01)
5.04(.49)
5.00 (1.4) 4.80(1.06)
4. Preconceived notions about eLearning
4.73 (.98)
5.25 (1.19)
5.10 (1.39)
5.00 (1.15)
5. Flexibility of
application in relation to one’s teaching and learning
5.22 (.64)
4.94 (1.12) 5.65 (1.00) 5.29 (.93)

21
In terms of usability, the patterns observed with more technologically literate (Wikispaces)
sample are different than those of the Moodle usability evaluation. Average learners actually
seemed to give higher scoring to the Wikispaces features than technologically advanced
learners. This paradox - mostly high prior knowledge people using Wikispaces, but average
learners thinking Wikispaces are more usable - can be explained by the already mentioned
fact that the idea of Wikispaces (almost akin to one’s own Website) appeals to the
somewhat more individualistic learners and technology proficient learners. At the same time
technology proficient individuals might see the ratio of the time spent on Wikispaces content
development to the final result as not very favourable since they are capable of doing the
Web content development on their own and possibly using the other tools. Average
learners, on the other hand, do not have multiple means of Web content development and
value the opportunity that Wikispaces presents for them.
A similar pattern is observed regarding the feelings toward an application. Whilst the not-
opinionated high prior knowledge group is somewhat more reserved in their feelings, the
average and opinionated high prior knowledge learners are excited to use Wikispaces.
As expected from the high staff proportion in this sample, the third and fourth subscales –
resistance to implied authorities in relation to one’s teaching and learning and preconceived
notions about eLearning - respectively have higher means than the traditional student
sample (Moodle pilot). Staff members value academic freedom and are resistant to outside
influences in relation to their teaching.
The fifth subscale, flexibility of the application in relation to one’s teaching and learning,
shows a somewhat challenging result. While the flexibility of Moodle in relation to one’s
teaching and learning was rated relatively high by all participant groups, it would be
expected that the absence of low prior knowledge groups would make these ratings even
higher for Wikispaces, which, however, is not the case. In our analysis of the flexibility
subscale results we should rather observe the usability ratings discussed above and
speculate that truly technologically proficient learners could have been feeling constrained
by the Wikispaces features. That could be why their flexibility ratings (the mean of 4.94 for
group 3, for example) are much lower than both average learners ratings in Wikispaces
sample and similar technological proficiency group (group 3) ratings of Moodle flexibility
(the group mean of 6.06). Overall, each group mean for this subscale in Wikispaces sample
is lower than similar groups means of Moodle flexibility.
SUMMARY OF GENERAL FINDINGS:
The Wikispaces pilot had a small sample of 30 participants; thus, any findings and
conclusions related to Wikispaces should be interpreted with caution. A larger sample of
users is necessary to draw any recommendations for the future, although this may also be
difficult due to the individualistic nature of the tested environment. However, we want to
highlight several interesting patterns that emerged from the current analysis. First of all,
there is a paradox where average learners rate Wikispaces usability somewhat higher than
high prior knowledge learners. This suggests targeting average learners and staff when
promoting Wikispaces as a technology. If these populations are able to deal with the steep
introductory learning curve of Wikispaces they then tend to find Wikispaces more usable
22
than high prior knowledge learners. Both average and opinionated high prior knowledge
learners tend to feel good regarding the use of Wikispaces based on the emotional
components. The other interesting finding is that with all the usable and emotionally
appealing features Wikispaces are perceived as somewhat less flexible as a technology
application than Moodle.
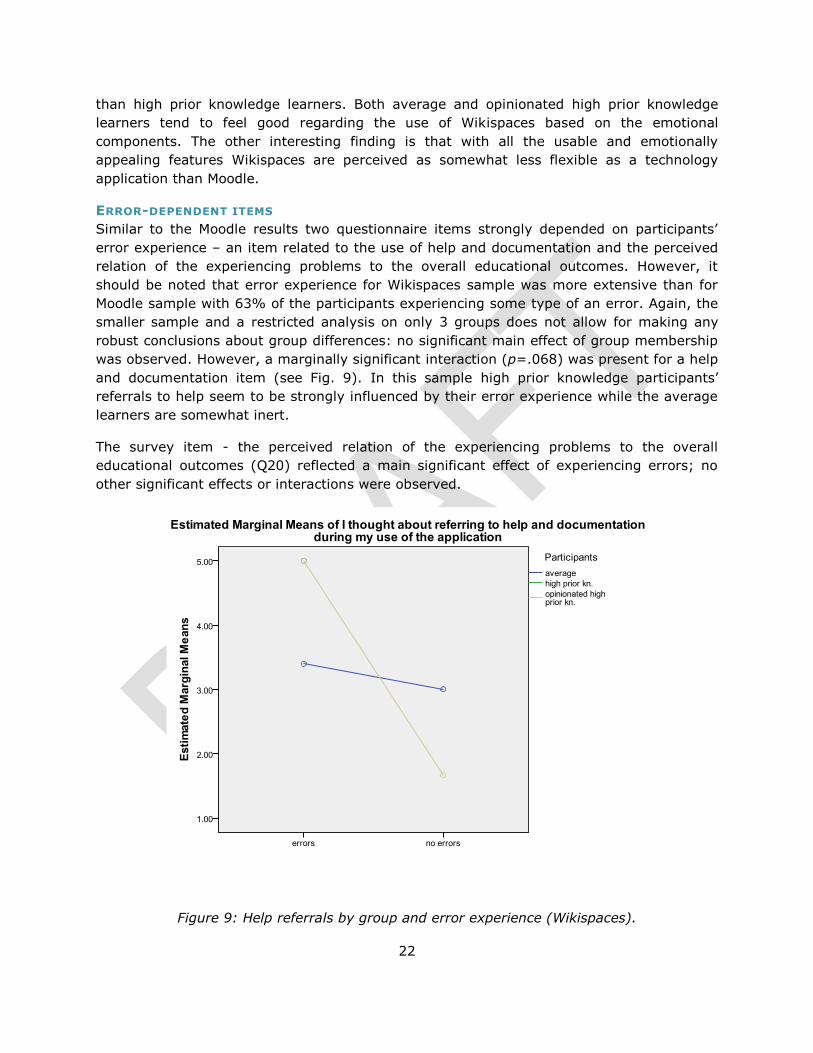
ERROR-DEPENDENT ITEMS
Similar to the Moodle results two questionnaire items strongly depended on participants’
error experience – an item related to the use of help and documentation and the perceived
relation of the experiencing problems to the overall educational outcomes. However, it
should be noted that error experience for Wikispaces sample was more extensive than for
Moodle sample with 63% of the participants experiencing some type of an error. Again, the
smaller sample and a restricted analysis on only 3 groups does not allow for making any
robust conclusions about group differences: no significant main effect of group membership
was observed. However, a marginally significant interaction (p=.068) was present for a help
and documentation item (see Fig. 9). In this sample high prior knowledge participants’
referrals to help seem to be strongly influenced by their error experience while the average
learners are somewhat inert.
The survey item - the perceived relation of the experiencing problems to the overall
educational outcomes (Q20) reflected a main significant effect of experiencing errors; no
other significant effects or interactions were observed.
Figure 9: Help referrals by group and error experience (Wikispaces).
23
QUESTIONNAIRE ITEMS ANALYSIS
The data was analysed based on the division described above: the responses of 3 groups of
respondents were analysed in relation to the subscale questions. However, due to the small
sample size the only significant difference that emerged was related to the flexibility
subscale. The main effect of errors experience (p < .05) and the interaction between the
group membership and the error experience (p < .05) were significant factors influencing
the answers to the flexibility scale. No main effect of group membership was observed.
Thus, while average learners experiencing or not experiencing errors were somewhat similar
in their perception of flexibility, opinionated high prior knowledge learners rated the
flexibility higher when they had an error experience and lower than average learners when
they did not have this experience. Further analysis revealed that the item that provoked
such differential response on flexibility scale was the question about flexibility itself; the
question about the integration issues did not reflect significant differences between the
groups.
24
RECOMMENDATIONS The ongoing piloting of new and diverse educational technologies prior to their institutional
adoption by the university for learning and teaching is an important step for the creation of
a modern and competitive university environment. This statement contains two points
elaborated below. Both these points were informed by the findings from Stage 3, sub-layer
1 TELT Evaluation Framework process:
1. The most technologically advanced students perceive the university and the
technologies the university uses as one and the same. In their mind, there is no
distinction between the physical educational institution and the technological
pathways of interaction and online presence that the institution has developed.
Thus, adverse technology adoption decisions could translate into a tarnished,
negative perception of the entire university brand, campus environment and
educational offerings. By applying the TELT Evaluation Framework we have the early
advantage of gaining this insight as the majority of students are still transforming
and developing their technological expectations and institutional perceptions, but this
stage is coming with the ongoing release of innovative technologies and the
increasing proportion of “digital natives” attending the university.
2. The unique differences between the technologies, their suitability for different types
of faculties and courses, and the needs of the staff and students themselves should
be taken into consideration when adopting these technologies. While the Moodle
sample is representative of the student population, the Wikispaces sample,
intentionally or not, reflects a different, more technology-oriented, population with a
higher percentage of staff members using this technology. Whether this pattern will
repeat on step 2 of the pilot remains to be seen.
The introduction of the Stage 3, sub-layer 1 pilot survey allowed for two sets of educational
recommendations to be made: a) recommendations for the ongoing further development of
the survey instrument itself (further discussed in Refinement of TELT survey instrument); b)
findings and recommendations regarding piloted educational technologies. It also allowed
for illuminating several major insights about the UNSW students population. Those points
are covered below:
1) Learners with higher technology expertise tended to rate educational technologies
higher and were better able to utilize the existing features of the application
2) Overall resistance to implied authorities in the Moodle sample is fairly low with a
large proportion of learners being consumers of educational technologies rather than
active participants. More attention should be paid to promoting and facilitating
students’ unique learning styles within the institutional context.
3) Using a lot of well designed commercial technology applications in their everyday
lives learners expect educational technology applications to similarly have a modern
design, a rich error-free feature set and a quick and intuitive workflow for completion
of different routine tasks.
4) Error experience plays an influential role not only for learners’ feelings about an
application but also for their assessment of overall usability. Thus, being error-free is
25
one of the major prerequisites for the success of an application in terms of its
perceived potential for adding educational value in terms of its usability and
usefulness.
General findings and recommendations regarding piloted educational technologies:
1) Transparent technology evaluation policies should be in place to encourage student
participation and to demonstrate visible outcomes from this evaluation in the
institutional context.
2) The emphasis should be made on the flexibility of a technology application for
different types of learners with the further need of ongoing customization and
refinement of the application since the “look and feel” of the educational software will
have to be consistent to the market trends and standards of other popular and well
designed commercial applications.
3) Search functions, such as finding and accessing information, in Learning
Management Systems like Moodle, require further attention and development from
the side of course instructors and educational designers.
4) When assessing learners’ feelings about the educational technology application, not
only should the features of the technology be considered but attention must be paid
to the overall integrated course design. Indeed, this is further developed upon and
explored in Stage 3, sub-layer 3 of the TELT Evaluation Framework. In brief, the
amount and style of information presented to the learners via online course
component should be carefully weighted against the on-campus component of the
course.
5) Empowering, encouraging and listening to the staff and students voices and
experiences in the evaluation process and informing upcoming students about the
range and possibilities of educational technologies could serve as two of the long-
term strategies underpinning effective ongoing L&T development.
6) Further promotion of innovative technology-related initiatives on campus and for the
future student cohort plays a critical role in further technological development and
evaluation activities.
7) Targeting average technology-proficient learners and staff when promoting
Wikispaces as a technology emerges as another strategy for L&T and TELT. If these
learners are able to deal with a steep introductory learning curve of Wikispaces they
tend to find Wikispaces more usable and quite emotionally appealing.
These findings will be taken into consideration for further Stage 3 evaluation activities
taking place during Semester 2, 2010.

26
REFERENCES
Alexander, S. & Golja, T. (2007). Using Students’ Experiences to Derive Quality in an
eLearning System: An Institution’s Perspective. Educational Technology & Society, 10 (2),
17-33.
Britain, S. & Liber, O. (2004). A framework for the pedagogical evaluation of elearning
environments. Report to JISC. Retrieved on October 31, 2009 from
http://www.cetis.ac.uk/members/pedagogy/files/4thMeet_framework/VLEfullReport
Dawson, S., & Macfadyen, L. P. (2010). Mining lms data to develop an “early warning
system” for educators: A proof of concept. Computers & Education, 54(2), 588-599.
Gay, L. R., & Airasian, P. (2003). Educational research: Competencies for analysis and
applications (7th Ed.). Upper Saddle River, New Jersey: Pearson Education, Inc.
Hong, K.-S. (2002). Relationships between students’ and instructional variables with
satisfaction and learning from a Web-based course. Internet and Higher Education 5, 267–
281.
Kim, K-S., & Moore, J. (2005). Web–based learning: Factors affecting students’ satisfaction
and learning experience. First Monday, 10 (11), retrieved from
http://firstmonday.org/htbin/cgiwrap/bin/ojs/index.php/fm/article/view/1294/1214
Wu, J-H., Tennyson, R., & Hsia, T-L (2010). A study of student satisfaction in a blended e-
learning system environment. Computers & Education, 55, 155–164.