telemetry using the ieee 802.11g standard, for monitoring ... · telemetry using the ieee 802.11g...
TRANSCRIPT

1
Telemetry Using the IEEE 802.11g Standard, for monitoring target ships
Germano Gonçalves Capela, Nuno Pessanha Santos, João Marques Vieira, César Bastos Monsanto Escola Naval
Departamento de Armas e Electrónica
Summary
This work consisted in the design, assembly and testing of a low cost system capable of performing telemetry over long distances, using wireless technology.
When sinking old decommissioned ships as targets for live fire exercises (a routinely used practice in the Navy), there is the nee d to measure many physical parameters during the impacts. These measurements must be made from a safe distance (between 3 and 8 nautical miles).
Due to the situation’s nature, a system capable of sampling and transmitting data over long distances (telemetry) was considered the best solution. This system must be reliable, tough and cheap. It must connect the sensors available aboard the target ship, and then connect these to a monitoring ship located a few miles away.
A system based on simple, cheap and available technology was assembled and tested. The tests focused on the following parameters: channel capacity, latency, maximum distance between the analysis point and the sampling point.
We implemented a LAN (Local Area Network) using wired connections aboard the target ship , and used a Wi-Fi connection to link this LAN with monitoring ship. We used the 802.11g IEEE standard that specifies the requirements for devices that enable the Transmission/reception (TX/RX) with speeds around 54 Mbps in the 2.4 GHz frequency range.
The range of the routers used for the long distance connection was incremented through the use of two amplifiers, two high-gain omnidirectional antennas and low attenuation cables.
To measure physical parameters, pressure, acceleration and temperature sensors were used. To make the data collection, a data logger with Ethernet interface was used. For visual observation a camera with Ethernet interface was used. A laptop with suitable software was used aboard the monitoring ship to collect the data. In the target ship, the router was connected to the camera and Ethernet enabled
data loggers that were connected to the various sensors.
Appropriate software was used to measure the capacity of the channel. It was possible to test the transmission rate during a file transmission, and during the reception of data from the datalogger and camera. The relationship between distance and transmission rate was also tested by moving the antennas.
1. Introduction
The genesis of this work is the interest of the Portuguese Navy in measuring physical parameters over long distances, as the result of an impact of a missile in a naval platform. The analysis of those parameters may provide information about the effects of the impact on the platform and on personnel.
First of all, the data collection should be made, and then this data should be transmitted in a reliable manner over a long distance (not less than 3 Nautical Miles for safety reasons).
The main requirements for the system were low cost and the use of off-the-shelf technology, being aware that this factor would influence the first. The specificity of the measurements was determinant in the project phase: the impact of a missile has hi-speed effects, which need high sampling rates. At the same time, this would produce an undesirably high amount of data that may make the transmission (there are limitations in the available bandwidth), recording and processing more difficult.
A data logger was used with high sampling rate, which is connected to the analog sensors. The visual record of events was done using a camera (see Figure 1). Two Wi-Fi routers, each associated with a Radio-frequency (RF) amplifier were used, together with high-gain omnidirectional antennas.
Various experiences have been made with the Wi-Fi technology, namely on remote vehicle control (Hamilton and Hamilton 2007) and long

2
range packet transmission (Flickenger, Okay et al. 2008), showing that even with some constraints (Anastasi, Borgia et al. 2004; Anastasi, Conti et al. 2004), it is viable its use in this case.
Accelerometer
Pressure sensors
Pressure Sensors
Camera
Data Logger
Router Router
Wireless Bridge Link
Computer
Target Ship Monitoring Ship
Figure 1 - General layout of the system
In this paper we shall start by addressing the problem of avoiding the Fresnel Zone (Seybold 2005) so as to use open space transmissions. Next we will discuss the choice of each equipment selected for the project. As a way to ensure that the builder’s specifications were consistent, all the equipments were tested. The routers, amplifiers and antennas were tested with a well calibrated device (Spectrum Analyzer from GOAME1). In order to replicate reality, the whole system was tested in the estuary of the Rio Tejo (near Lisbon), achieving a maximum distance of approximately 4 nautical miles between end points. The results of these tests and their interpretation are presented. 2. Specific problems
a. The Fresnel Zone
One of the issues to consider when implementing a telecommunication’s system is the Fresnel Zone. In the Fresnel Zone, interferences resulting from multi-path phenomena (Seybold 2005) can distort a signal considerably.
The Fresnel Zone is a tridimensional geometric place between the two points of communication. According to (Seybold 2005) , if there’s no obstruction in this zone, there won’t be any kind of interference. In our case, the only element that can be found within the Fresnel Zone is the sea. Given the distance between the points of communication and frequency used, it is possible to get the radius of each cross section of the ellipsoid that defines the Fresnel Zone as follows (Seybold 2005) : 1 Grupo Oficinal de Apoio ao Material Electrónico, a technical division from Arsenal do Alfeite
Were d1 and d2 are the distances from each antenna to the point where you want to calculate the Fresnel radius and ? is the wavelength of the transmitted signal m. Literature describes that, for most applications, if 60% of the Fresnel Zone is unobstructed, there isn’t significant energy loss. As was said before, at sea, it is necessary to ensure that the antennas are at a particular height, which is more than 60% of the radius found in the formula above.
Figure 1 –The Fresnel Zone (the orange ellipse)
Considering the case of last year’s target practice exercise, the monitoring ship, a Vasco da Gama class frigate where supposedly one of the antennas would be installed, had a maximum mast height of about 26m and the target ship had a mast height of 10m.
To establish communication between the two vessels at 5 nautical miles (for example), with a radio frequency of 2.45 GHz, the Fresnel Zone will have a maximum radius of 16.8 m. To ensure that 60% of the Fresnel Zone is above water, both antennas should be placed at a height of at least 10.08 m. Since one end of the link will be 26m in height, the section of greatest radius of the Fresnel zone is always higher than 10m.
b. Type of Antenna
Because of security reasons it is impossible f o r a ship to remain completely static. Thus, the choice must be omnidirectional antennas. The transmission range will be reduced by this fact
d2 d1
r
3
because, as a rule, these antennas have less gain than directional antennas. After searching a bit, we found omnidirectional antennas with high gain (10 dBi) and with a vertical beam opening of 13º, which is important due to the ships rocking movements.
c. Free-space Link
After choosing the antennas, we checked how much power would be necessary to make the transmission possible at a range of 5 nm.
For a transmission power Pt=2W (3dB), antennas’ gain Gt=Gr=10dBi, frequency f=2.4GHz and distance R=5 nm, using Friis formula (Seybold 2005) shown bellow (expressed in dB), it was possible to calculate the power in the receiving antenna, Pr:
Pr= Pt + Gt + Gr – Lfs
where Lfs is the free-space losses:
Lfs = 92, 44 + 20*log (f) + 20*log(R).
A power of -66,4 dBm was expected in the router’s antenna. The chosen amplifier has a gain of 20 dB in the reception. It was considered that connectors and cables losses would be around 20 dB (3 dB for plugs and 2 dB for cables). Thus, the router‘s input signal must be around the value calculated with Friis’ formula.
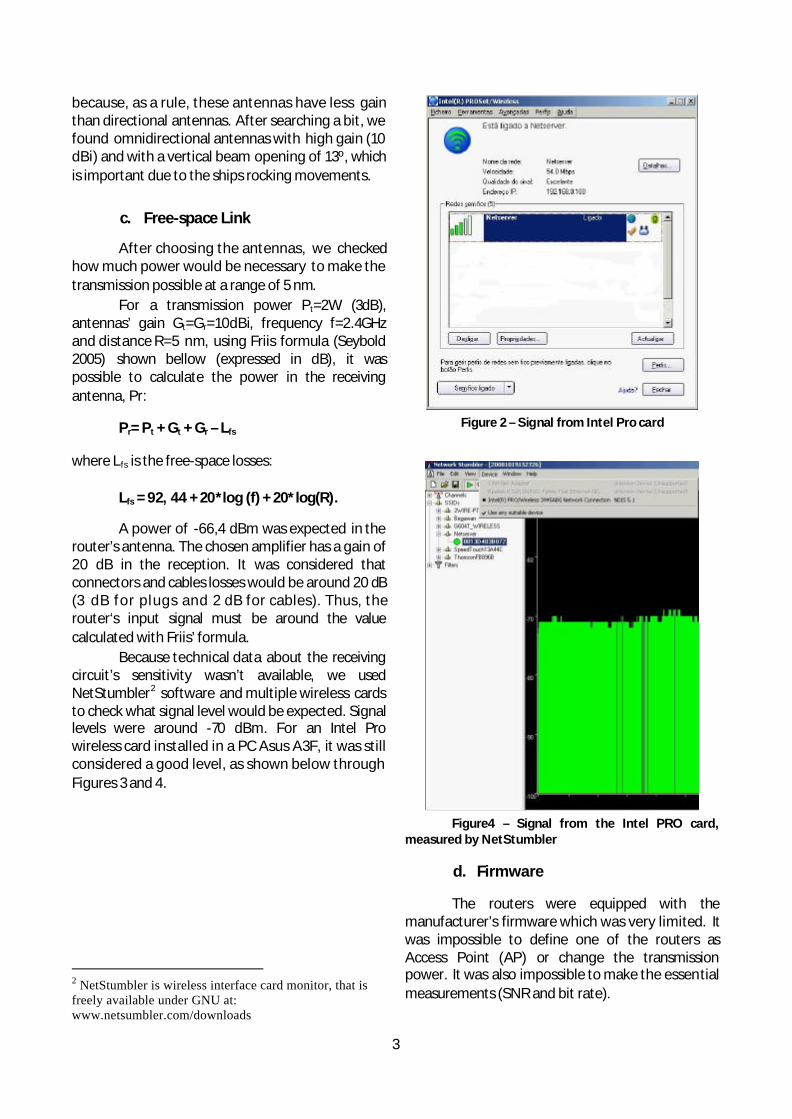
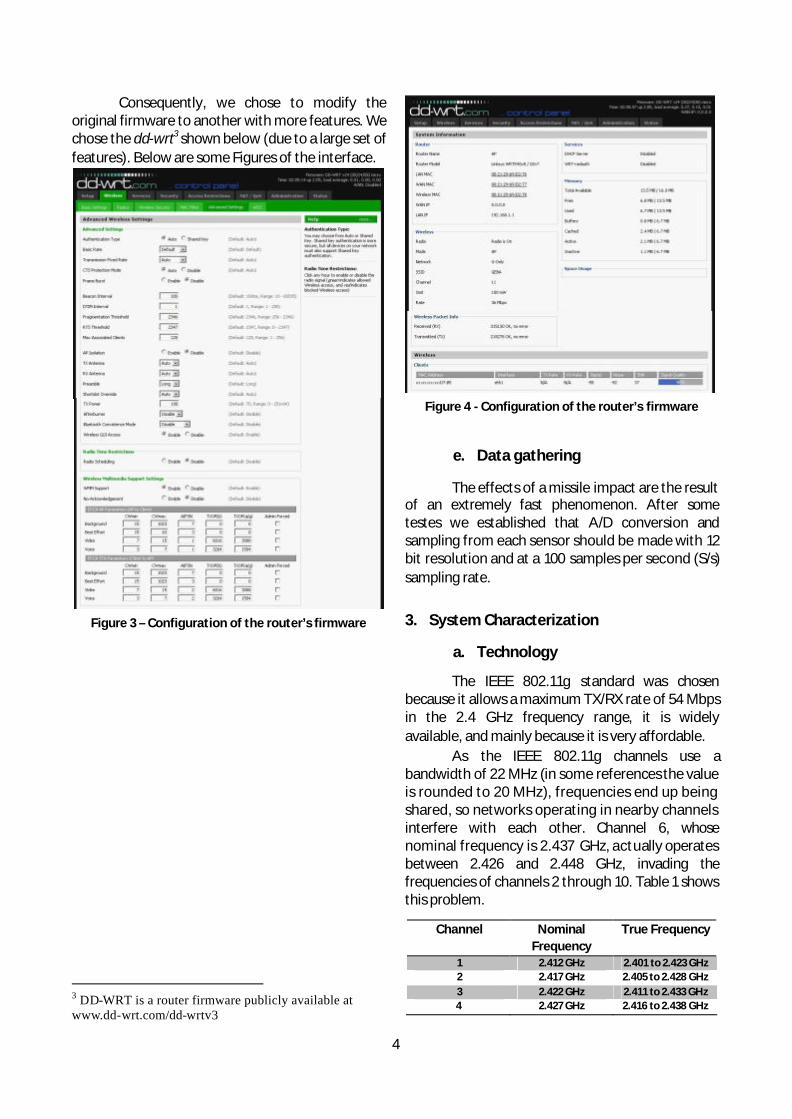
Because technical data about the receiving circuit’s sensitivity wasn’t available, we used NetStumbler2 software and multiple wireless cards to check what signal level would be expected. Signal levels were around -70 dBm. For an Intel Pro wireless card installed in a PC Asus A3F, it was still considered a good level, as shown below through Figures 3 and 4.
2 NetStumbler is wireless interface card monitor, that is freely available under GNU at: www.netsumbler.com/downloads
Figure 2 – Signal from Intel Pro card
Figure4 – Signal from the Intel PRO card,
measured by NetStumbler
d. Firmware
The routers were equipped with the manufacturer’s firmware which was very limited. It was impossible to define one of the routers as Access Point (AP) or change the transmission power. It was also impossible to make the essential measurements (SNR and bit rate).
4
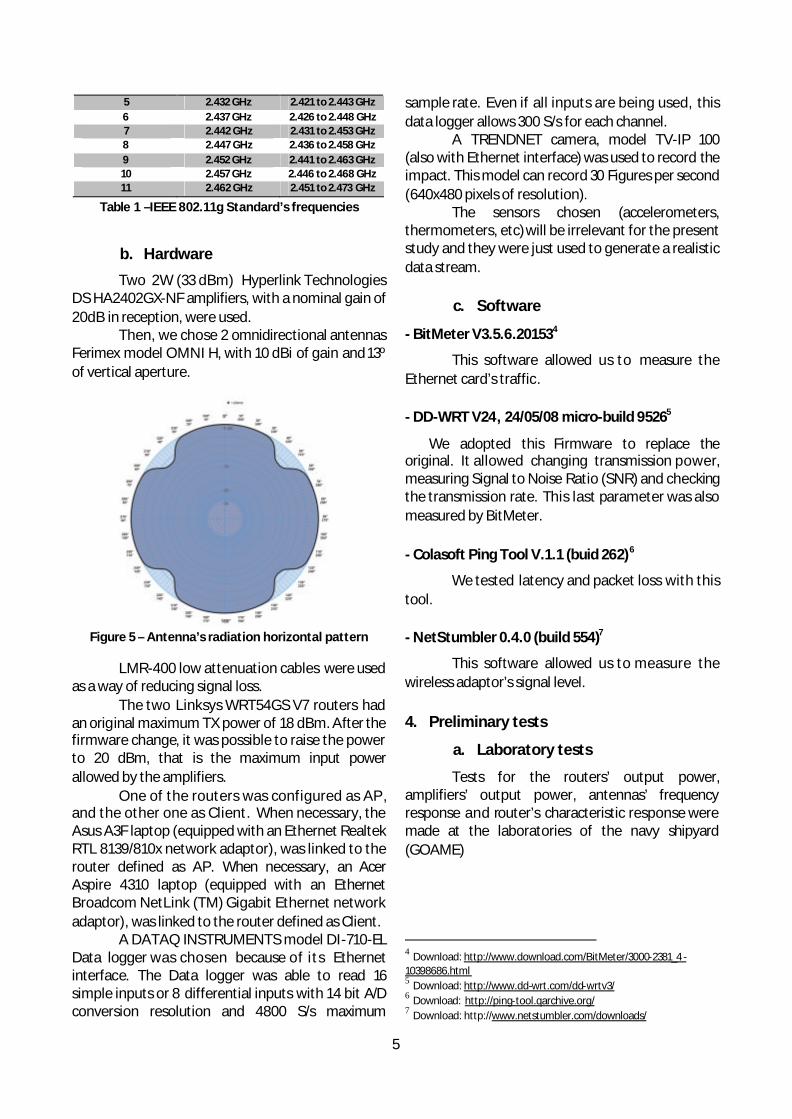
Consequently, we chose to modify the original firmware to another with more features. We chose the dd-wrt3 shown below (due to a large set of features). Below are some Figures of the interface.
Figure 3 – Configuration of the router’s firmware
3 DD-WRT is a router firmware publicly available at www.dd-wrt.com/dd-wrtv3
Figure 4 - Configuration of the router’s firmware
e. Data gathering
The effects of a missile impact are the result of an extremely fast phenomenon. After some testes we established that A/D conversion and sampling from each sensor should be made with 12 bit resolution and at a 100 samples per second (S/s) sampling rate.
3. System Characterization
a. Technology
The IEEE 802.11g standard was chosen because it allows a maximum TX/RX rate of 54 Mbps in the 2.4 GHz frequency range, it is widely available, and mainly because it is very affordable.
As the IEEE 802.11g channels use a bandwidth of 22 MHz (in some references the value is rounded to 20 MHz), frequencies end up being shared, so networks operating in nearby channels interfere with each other. Channel 6, whose nominal frequency is 2.437 GHz, actually operates between 2.426 and 2.448 GHz, invading the frequencies of channels 2 through 10. Table 1 shows this problem.
Channel Nominal Frequency
True Frequency
1 2.412 GHz 2.401 to 2.423 GHz 2 2.417 GHz 2.405 to 2.428 GHz 3 2.422 GHz 2.411 to 2.433 GHz 4 2.427 GHz 2.416 to 2.438 GHz
5
5 2.432 GHz 2.421 to 2.443 GHz 6 2.437 GHz 2.426 to 2.448 GHz 7 2.442 GHz 2.431 to 2.453 GHz 8 2.447 GHz 2.436 to 2.458 GHz 9 2.452 GHz 2.441 to 2.463 GHz 10 2.457 GHz 2.446 to 2.468 GHz 11 2.462 GHz 2.451 to 2.473 GHz
Table 1 –IEEE 802.11g Standard’s frequencies
b. Hardware
Two 2W (33 dBm) Hyperlink Technologies DS HA2402GX-NF amplifiers, with a nominal gain of 20dB in reception, were used.
Then, we chose 2 omnidirectional antennas Ferimex model OMNI H, with 10 dBi of gain and 13º of vertical aperture.
Figure 5 – Antenna’s radiation horizontal pattern
LMR-400 low attenuation cables were used as a way of reducing signal loss.
The two Linksys WRT54GS V7 routers had an original maximum TX power of 18 dBm. After the firmware change, it was possible to raise the power to 20 dBm, that is the maximum input power allowed by the amplifiers.
One of the routers was configured as AP, and the other one as Client. When necessary, the Asus A3F laptop (equipped with an Ethernet Realtek RTL 8139/810x network adaptor), was linked to the router defined as AP. When necessary, an Acer Aspire 4310 laptop (equipped with an Ethernet Broadcom NetLink (TM) Gigabit Ethernet network adaptor), was linked to the router defined as Client.
A DATAQ INSTRUMENTS model DI-710-EL Data logger was chosen because of its Ethernet interface. The Data logger was able to read 16 simple inputs or 8 differential inputs with 14 bit A/D conversion resolution and 4800 S/s maximum
sample rate. Even if all inputs are being used, this data logger allows 300 S/s for each channel.
A TRENDNET camera, model TV-IP 100 (also with Ethernet interface) was used to record the impact. This model can record 30 Figures per second (640x480 pixels of resolution).
The sensors chosen (accelerometers, thermometers, etc) will be irrelevant for the present study and they were just used to generate a realistic data stream.
c. Software
- BitMeter V3.5.6.201534
This software allowed us to measure the Ethernet card’s traffic.
- DD-WRT V24, 24/05/08 micro-build 95265
We adopted this Firmware to replace the original. It allowed changing transmission power, measuring Signal to Noise Ratio (SNR) and checking the transmission rate. This last parameter was also measured by BitMeter.
- Colasoft Ping Tool V.1.1 (buid 262)6
We tested latency and packet loss with this tool.
- NetStumbler 0.4.0 (build 554)7
This software allowed us to measure the wireless adaptor’s signal level. 4. Preliminary tests
a. Laboratory tests
Tests for the routers’ output power, amplifiers’ output power, antennas’ frequency response and router’s characteristic response were made at the laboratories of the navy shipyard (GOAME)
4 Download: http://www.download.com/BitMeter/3000-2381_4 -10398686.html 5 Download: http://www.dd-wrt.com/dd-wrtv3/ 6 Download: http://ping-tool.qarchive.org/ 7 Download: http://www.netstumbler.com/downloads/

6
i. Router’s output power Once the Routers’ Firmware was changed, it
was necessary to confirm if the output power was 20 dBm. Despite the possibility of changing the output power to higher values, this wasn’t an option because the maximum input power for the amplifiers is 20 dBm.
We obtained 20 dBm of power using a Spectrum Analyser Advantest R3271. This can be confirmed by the Figures bellow.
Figure 6 – Router’s average signal level
Figure 7 – Router’s average noise level
ii. Antenna’s output power
Because of the values shown in the last paragraph, an extra amplification of 13 dBm was expected. A 6 dB attenuator (ATT=6dB) was used during the tests. Consequently, in the next Figure, 10,41 dBm correspond to 16,41 dBm. The expected amplification of 13 dBm is obtained subtracting these two values from the maximum value of the Figure 8 (2.03 dBm).
Figure 8 – Amplifier’s signal level (with ATT= 6dB)
iii. Antenna’s frequency response
The antennas’ SWR (Standing Wave Ratio) was measured with a HP 8720D network analyzer. One of the antennas had a uniform response, but the other one didn’t. This conditioned the choice of frequency (channel). We noticed that channel 11 (2.462 GHz) is the best channel, because for the two antennas, this channel allows the best VSWR (Voltage Standing Wave Ratio).
Figure 9 – Antenna 1 SWR
Figure 10 – Antenna 2 SWR

7
iv. Router’s frequency response
The WRT54GS router has two antennas. After the firmware’s modification, the router was tested in different configurations. For the tests, routers were at 1m of distance. Five possible cases of study were identified:
ROUTER 1 ANTENNAS
ROUTER 2 ANTENNAS CONFIGURATION
Right Left Right Left
1 TX/RX OFF TX/RX OFF 2 AUTO AUTO AUTO AUTO 3 OFF TX/RX OFF TX/RX 4 TX/RX OFF OFF TX/RX 5 OFF TX/RX TX/RX OFF
Table 2 – Antennas’ configurations
Figure 11 – Antennas’ test schematic
The next graphics show the results obtained from the received signal level, SNR and channel capacity
Graphic 1 – Received signal level
Graphic 2 - SNR
Graphic 3 – Channel capacity
It is evident that the best antenna configuration is configuration 5 (Table 2). In the final test (range test) we used this configuration.
With this configuration, removing the antenna that was turned off there was a very sharp drop of the signal in the router’s measures. For this reason, and despite the fact that we did not understand why, it was decided to keep both antennas permanently connected during the tests.
The receiving circuit’s sensitivity was tested by measuring SNR at different distances.
8
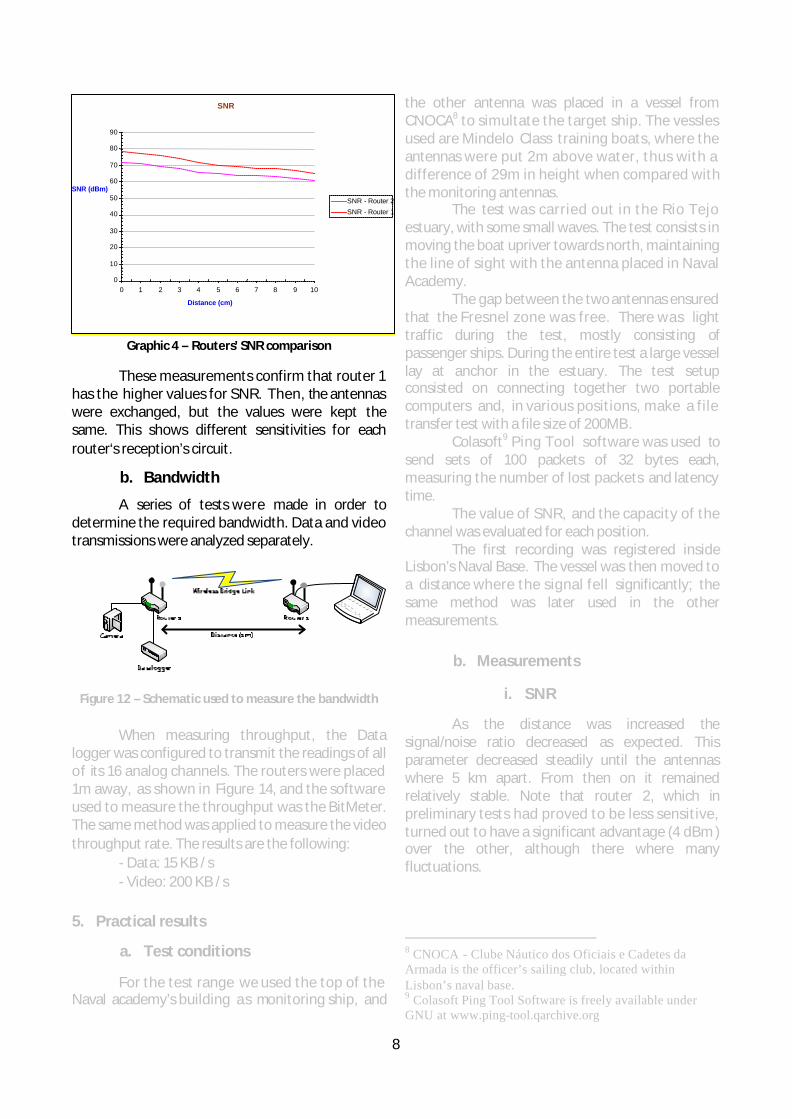
Graphic 4 – Routers’ SNR comparison
These measurements confirm that router 1 has the higher values for SNR. Then, the antennas were exchanged, but the values were kept the same. This shows different sensitivities for each router‘s reception’s circuit.
b. Bandwidth
A series of tests were made in order to determine the required bandwidth. Data and video transmissions were analyzed separately.
Figure 12 – Schematic used to measure the bandwidth When measuring throughput, the Data
logger was configured to transmit the readings of all of its 16 analog channels. The routers were placed 1m away, as shown in Figure 14, and the software used to measure the throughput was the BitMeter. The same method was applied to measure the video throughput rate. The results are the following:
- Data: 15 KB / s - Video: 200 KB / s
5. Practical results
a. Test conditions
For the test range we used the top of the Naval academy’s building as monitoring ship, and
the other antenna was placed in a vessel from CNOCA8 to simultate the target ship. The vessles used are Mindelo Class training boats, where the antennas were put 2m above water, thus with a difference of 29m in height when compared with the monitoring antennas.
The test was carried out in the Rio Tejo estuary, with some small waves. The test consists in moving the boat upriver towards north, maintaining the line of sight with the antenna placed in Naval Academy.
The gap between the two antennas ensured that the Fresnel zone was free. There was light traffic during the test, mostly consisting of passenger ships. During the entire test a large vessel lay at anchor in the estuary. The test setup consisted on connecting together two portable computers and, in various positions, make a file transfer test with a file size of 200MB.
Colasoft9 Ping Tool software was used to send sets of 100 packets of 32 bytes each, measuring the number of lost packets and latency time.
The value of SNR, and the capacity of the channel was evaluated for each position.
The first recording was registered inside Lisbon’s Naval Base. The vessel was then moved to a distance where the signal fell significantly; the same method was later used in the other measurements.
b. Measurements
i. SNR
As the distance was increased the signal/noise ratio decreased as expected. This parameter decreased steadily until the antennas where 5 km apart. From then on it remained relatively stable. Note that router 2, which in preliminary tests had proved to be less sensitive, turned out to have a significant advantage (4 dBm ) over the other, although there where many fluctuations.
8 CNOCA - Clube Náutico dos Oficiais e Cadetes da Armada is the officer’s sailing club, located within Lisbon’s naval base. 9 Colasoft Ping Tool Software is freely available under GNU at www.ping-tool.qarchive.org
SNR
0 10 20 30 40 50 60 70 80 90
0 1 2 3 4 5 6 7 8 9 10 Distance (cm)
SNR - Router 2
SNR - Router 1
SNR (dBm)

9
Graphic 5 – Routers SNR relation
The received signal started at -41dBm for
the first router and -47dBm for the second. Like in the previous graph, router 2 has a relatively better performance when the distance increases. At 7.49 km, the signal has a level of -74 dBm for router 1, and -75dBm for the other.
Graphic 6 – Received signal level
i. Throughput rate
The transmission throughput, at close quarters, started at 644 MBps or 5.1 Mbps. It decreased up to a distance of 3.5 Km. At this point throughput stabilized at 70 KBps (560 kbps), maintaining slightly better rates from then onwards. At 7.49 Km throughput dropped to 68 MBps (544 Kbps).
Graphic 7 – Throughput rate
ii. Latency
Different parameters of latency were measured: maximum, minimum and average latency. The minimum latency is fairly low; but the maximum latency was quite above average, and showed some inconstancy.
The average latency started at 40 ms then reduced to a minimum of 20 ms at 5 Km. Then it raised to 263 ms and remained relatively stable at 246 ms (at the farthest position).
Graphic 8 – Latency times
iii. Lost Packets
With Colasoft Ping Tool, 100 packets with 32 bytes of data were sent at every test distance. Every single transmitted packet was successfully received.
The next step was to read all data that is given by the routers’ Firmware. Those data are the number of total send and received packets during
10
the tests. Router 1 received 451666 packets and sent 244367. No error was obtained in this measure. The router 2 received 209846 packets and sent 451666. 63 transmission errors where recorded in this experiment, corresponding to a 0,015% error rate. 6. Conclusions
This work highlights the potential of Wi-Fi technology in data transmission or communication over long distances.
The low packet loss rate during the trials, leads us to believe that with an increase in transmission power, higher distances can easily be achieved. Amplifiers using this technology, with 10W transmition power are available in the market (but much more expensive than the 2W models).
In this precise case, the available bandwith at 7.49 Km allows the transmission of data but not of video. For video twice the recorded value would be necessary.
The losses obtained in the tests were higher than predicted. According to Friis Formula, at 5 Nautical Miles the expected signal power would be -66 dBm but at 4 Nautical Miles the signal was already -75 dBm. However the frequency used is very susceptible to interferences (Gummadi, Wethwral et al. 2007) and for the required distance it is very difficult to find areas for tests totally free of interferences.
The objective of using a vessel in this test was to approximate the real operating conditions. Even with the instability of the platforms and difference in heights of antennas, tests suggest that the system is very robust up to a distance of 710m, and degrades gracefully up to distances of 7.49 km, at which point it can still convey the necessary information (excluding video).
7. Future Work
After analyzing the promising results, we propose that the future work should concentrate on:
a. Varying the packet size and analyzing the influence of this factor in the performance of the channel and in the lost packet ratio.
b. Make transmission tests with RTS/CTS (Anastasi, Borgia et al. 2004), and evaluate the throughput rate variation.
c. Make tests at high sea. d. Design and construct high-gain
directional antennas for use on the monitoring ship, where they can easily be pointed to the target.
Finally, a lot of work must still be done in analyzing the data collected by the sensors, and in optimizing the sensors and sensor layout.
REFERENCES
Anastasi, G., E. Borgia, M. Conti and E. Gregori (2004). Wi-Fi Ad Hoc Mode: A Measurement Study. Second IEEE International Conference on Pervasive Computing and Communications (PerCom'04).
Anastasi, G., M. Conti and E. Gregori (2004). IEEE 802.11 Ad Hoc Networks: Protocols Performance and Open Issues, New York, NY, USA.
Flickenger, R., S. Okay, E. Pietrosemoli and M. Zennaro (2008). Very Long Distance Wi-Fi Network. NSDR'08, Seattle, Washington,USA.
Gummadi, R., D. Wethwral, B. Greenstein and S. Seshan (2007). Understanding and Mitigating the impact of RF interference on 802.11 Networks. SIGCOMM'07, Kyoto,Japan.
Hamilton, S. J. A. and D. Hamilton (2007). Validating a Network simulation testbed for army UAVS. Proceedings of the 2007 Winter Simulation Conference.
Seybold, J. S. (2005). Introduction to RF Propagation. New Jersey, USA, John Wiley & Sons.