teck 2006 annual report
DESCRIPTION
2006 saw strong demand and prices which rose accordingly, resulting in earnings that are unmatched in the Company’s history. None of this would have been possible without our infrastructure, planning, and above all, the Teck Cominco people who rose to the challenge to meet the unprecedented demand for our products.TRANSCRIPT

A N N U A L R E P O R T 2 0 0 6
This is More than a Rock
Red Dog
Pogo
Fort Hills
Hemlo
Highland Valley CopperElk Valley Coal
TrailPend Oreille
FAIRBANKS
TORONTO
VANCOUVER
Antamina
LIMA
Lennard Shelf
PERTH
Lennard Shelf
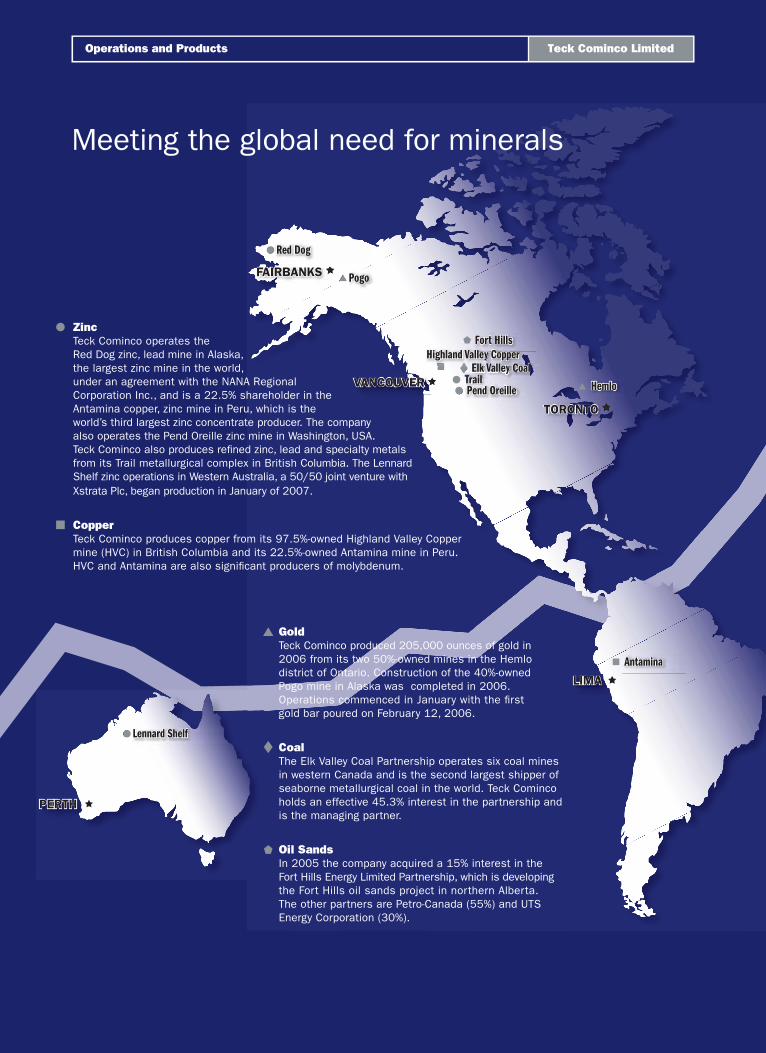
GoldTeck Cominco produced 205,000 ounces of gold in 2006 from its two 50%-owned mines in the Hemlo district of Ontario. Construction of the 40%-owned Pogo mine in Alaska was completed in 2006. Operations commenced in January with the fi rst gold bar poured on February 12, 2006.
CoalThe Elk Valley Coal Partnership operates six coal mines in western Canada and is the second largest shipper of seaborne metallurgical coal in the world. Teck Cominco holds an effective 45.3% interest in the partnership and is the managing partner.
Oil SandsIn 2005 the company acquired a 15% interest in the Fort Hills Energy Limited Partnership, which is developing the Fort Hills oil sands project in northern Alberta. The other partners are Petro-Canada (55%) and UTS Energy Corporation (30%).
ZincTeck Cominco operates the Red Dog zinc, lead mine in Alaska, the largest zinc mine in the world, under an agreement with the NANA Regional Corporation Inc., and is a 22.5% shareholder in the Antamina copper, zinc mine in Peru, which is the world’s third largest zinc concentrate producer. The company also operates the Pend Oreille zinc mine in Washington, USA. Teck Cominco also produces refi ned zinc, lead and specialty metals from its Trail metallurgical complex in British Columbia. The Lennard Shelf zinc operations in Western Australia, a 50/50 joint venture with Xstrata Plc, began production in January of 2007.
CopperTeck Cominco produces copper from its 97.5%-owned Highland Valley Copper mine (HVC) in British Columbia and its 22.5%-owned Antamina mine in Peru. HVC and Antamina are also signifi cant producers of molybdenum.
Meeting the global need for minerals
Teck Cominco LimitedOperations and Products
NET EARNINGS($ million)
CASH FLOW($ million)
REVENUE($ million)
05
1,3
45
04
61
7
03
13
4
02
13
06
2,4
31
06
2,6
06
04
1,1
09
05
1,6
47
03
31
4
02
18
5
06
6,5
39
05
4,4
15
04
3,4
28
03
2,2
28
02
2,0
42
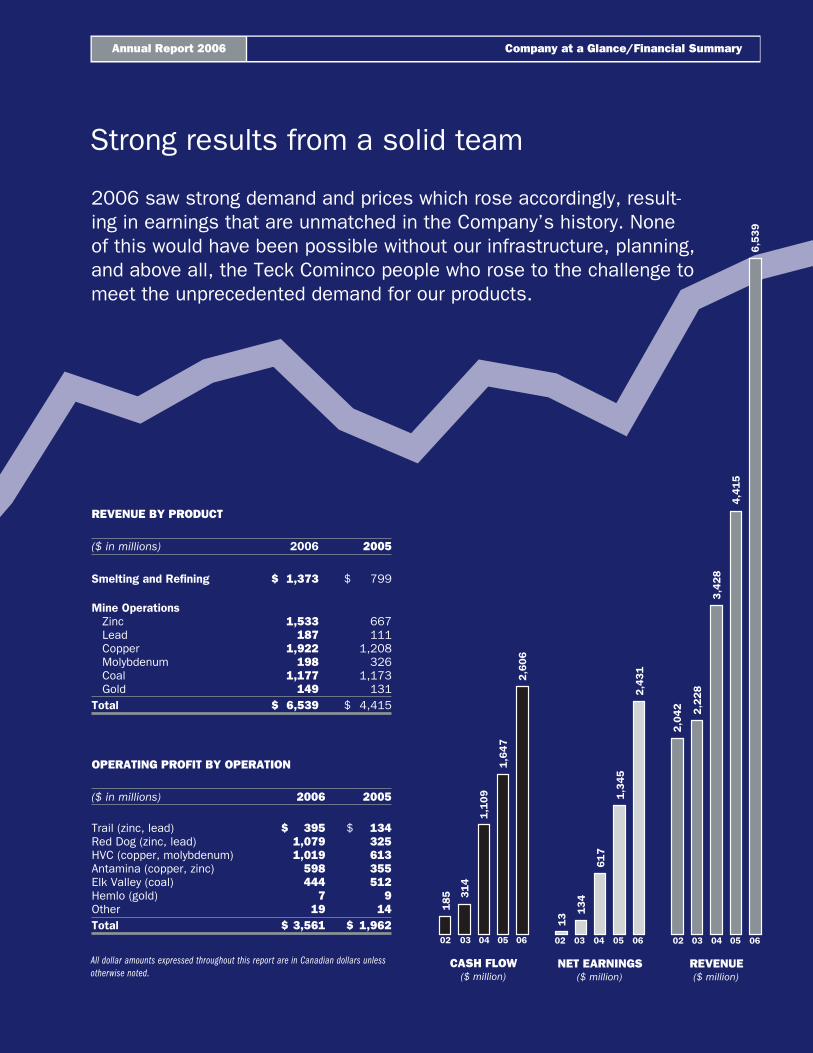
2006 saw strong demand and prices which rose accordingly, result-ing in earnings that are unmatched in the Company’s history. None of this would have been possible without our infrastructure, planning, and above all, the Teck Cominco people who rose to the challenge to meet the unprecedented demand for our products.
REVENUE BY PRODUCT
($ in millions) 2006 2005
Smelting and Refining $ 1,373 $ 799
Mine OperationsZinc 1,533 667Lead 187 111Copper 1,922 1,208Molybdenum 198 326Coal 1,177 1,173Gold 149 131
Total $ 6,539 $ 4,415
OPERATING PROFIT BY OPERATION
($ in millions) 2006 2005
Trail (zinc, lead) $ 395 $ 134Red Dog (zinc, lead) 1,079 325HVC (copper, molybdenum) 1,019 613Antamina (copper, zinc) 598 355Elk Valley (coal) 444 512Hemlo (gold) 7 9Other 19 14Total $ 3,561 $ 1,962
All dollar amounts expressed throughout this report are in Canadian dollars unless otherwise noted.
Strong results from a solid team
Annual Report 2006 Company at a Glance/Financial Summary
ANNUAL MEETING The annual meeting of the shareholders will be held at 11:00 a.m., April 25, 2007, in Waterfront Ballroom C, Fairmont Waterfront Hotel, 900 Canada Place Way, Vancouver, British Columbia.
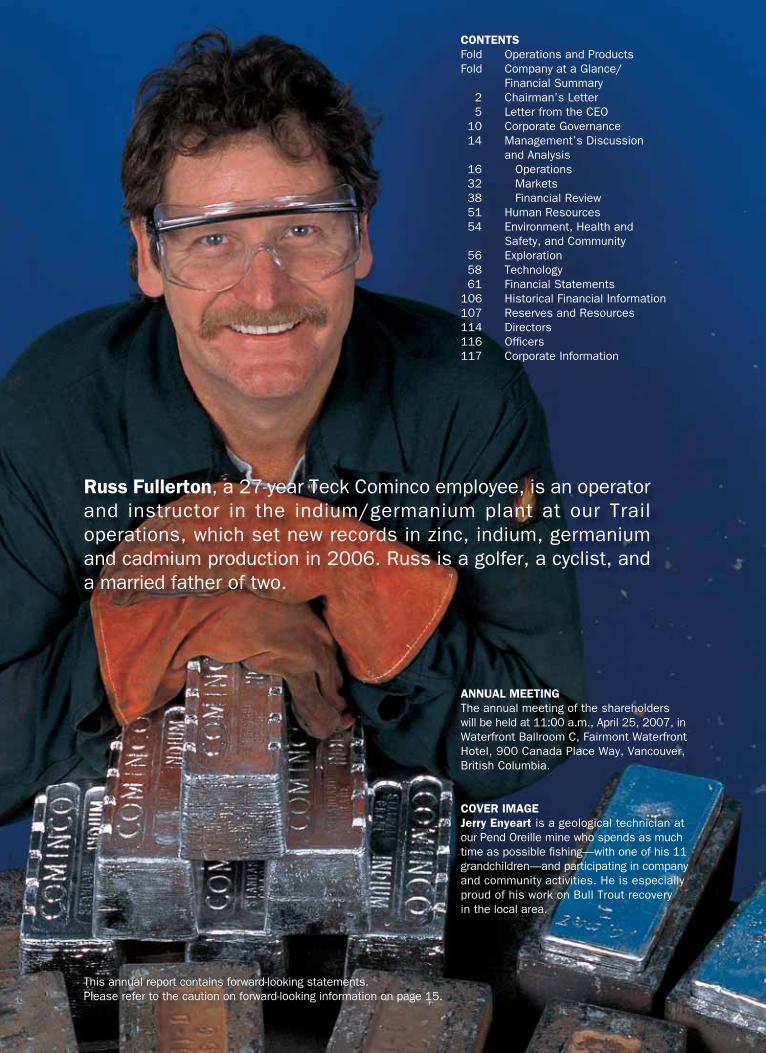
COVER IMAGEJerry Enyeart is a geological technician at our Pend Oreille mine who spends as much time as possible fi shing—with one of his 11 grandchildren—and participating in company and community activities. He is especially proud of his work on Bull Trout recovery in the local area.
Russ Fullerton, a 27-year Teck Cominco employee, is an operator and instructor in the indium/germanium plant at our Trail operations, which set new records in zinc, indium, germaniumand cadmium production in 2006. Russ is a golfer, a cyclist, and a married father of two.
CONTENTS Fold Operations and Products Fold Company at a Glance/ Financial Summary 2 Chairman’s Letter 5 Letter from the CEO 10 Corporate Governance 14 Management’s Discussion and Analysis 16 Operations 32 Markets 38 Financial Review 51 Human Resources 54 Environment, Health and Safety, and Community 56 Exploration 58 Technology 61 Financial Statements 106 Historical Financial Information107 Reserves and Resources 114 Directors 116 Offi cers 117 Corporate Information
This annual report contains forward-looking statements. Please refer to the caution on forward-looking information on page 15.
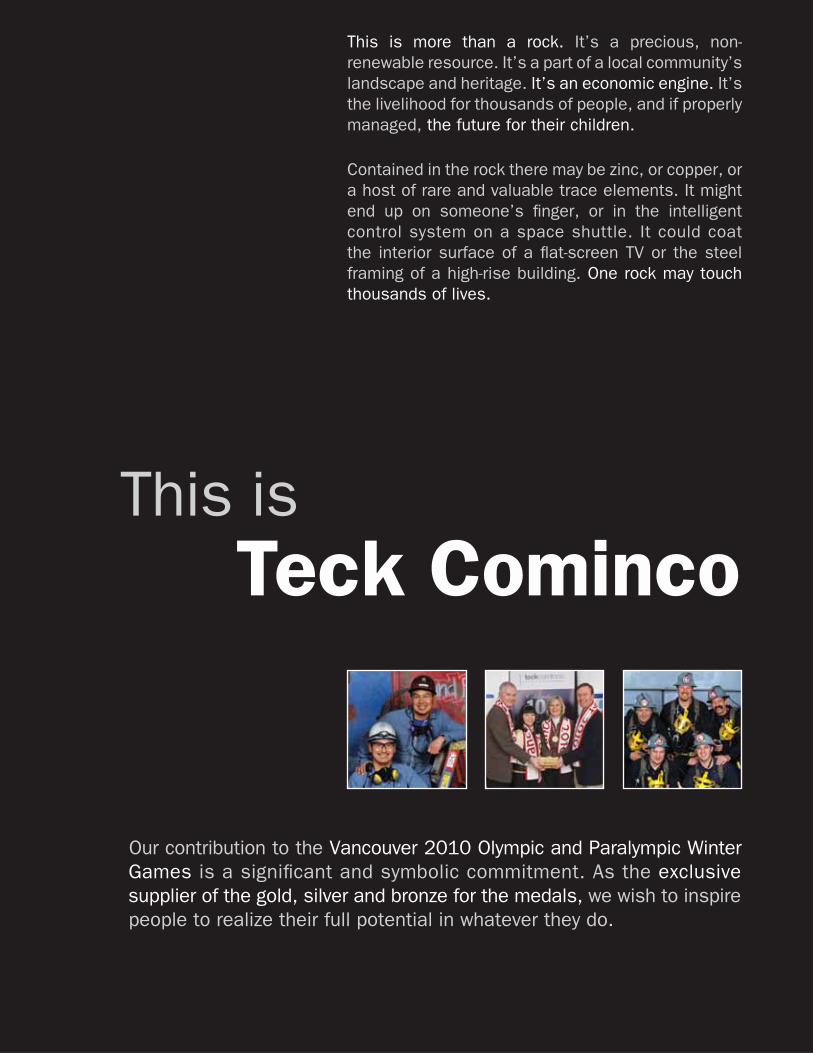
This isTeck Cominco
This is more than a rock. It’s a precious, non-renewable resource. It’s a part of a local community’s landscape and heritage. It’s an economic engine. It’s the livelihood for thousands of people, and if properly managed, the future for their children.
Contained in the rock there may be zinc, or copper, or a host of rare and valuable trace elements. It might end up on someone’s fi nger, or in the intelligent control system on a space shuttle. It could coat the interior surface of a fl at-screen TV or the steel framing of a high-rise building. One rock may touch thousands of lives.
Our contribution to the Vancouver 2010 Olympic and Paralympic Winter Games is a signifi cant and symbolic commitment. As the exclusive supplier of the gold, silver and bronze for the medals, we wish to inspire people to realize their full potential in whatever they do.
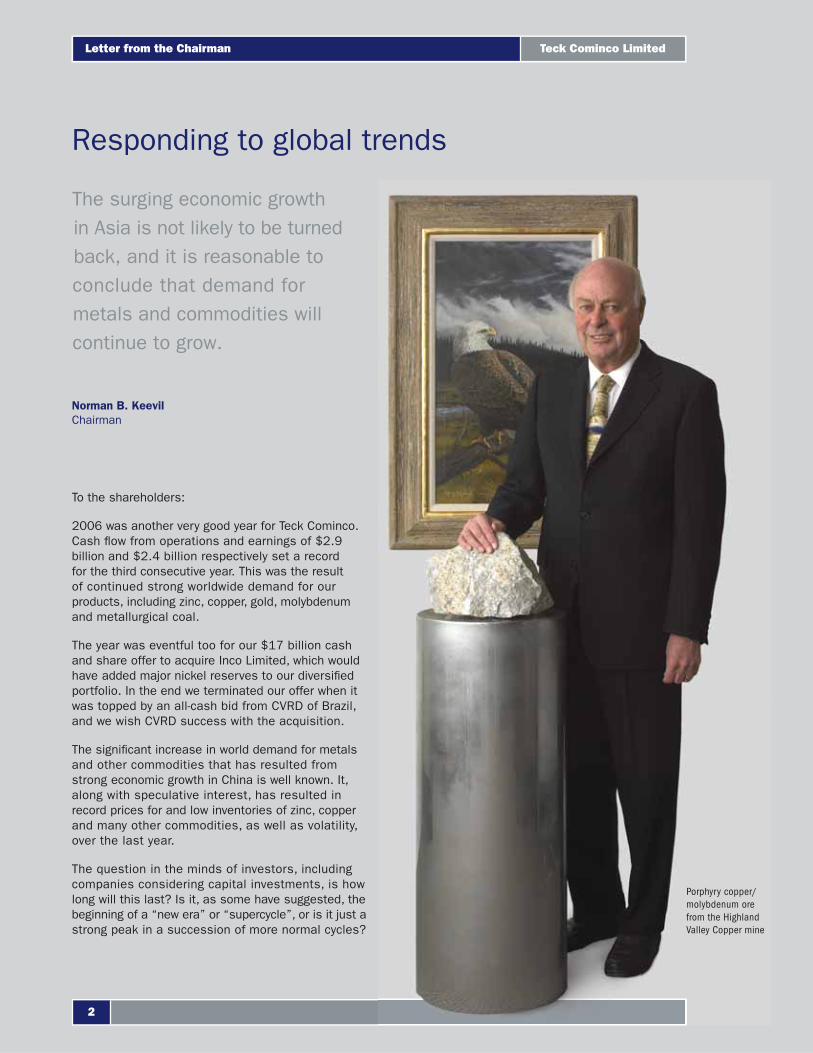
The surging economic growth in Asia is not likely to be turned back, and it is reasonable to conclude that demand for metals and commodities will continue to grow.
To the shareholders:
2006 was another very good year for Teck Cominco. Cash fl ow from operations and earnings of $2.9 billion and $2.4 billion respectively set a record for the third consecutive year. This was the result of continued strong worldwide demand for our products, including zinc, copper, gold, molybdenum and metallurgical coal.
The year was eventful too for our $17 billion cash and share offer to acquire Inco Limited, which would have added major nickel reserves to our diversifi ed portfolio. In the end we terminated our offer when it was topped by an all-cash bid from CVRD of Brazil, and we wish CVRD success with the acquisition.
The signifi cant increase in world demand for metals and other commodities that has resulted from strong economic growth in China is well known. It, along with speculative interest, has resulted in record prices for and low inventories of zinc, copper and many other commodities, as well as volatility, over the last year.
The question in the minds of investors, including companies considering capital investments, is how long will this last? Is it, as some have suggested, the beginning of a “new era” or “supercycle”, or is it just a strong peak in a succession of more normal cycles?
Responding to global trends
Norman B. KeevilChairman
Teck Cominco Limited
2
Letter from the Chairman
Porphyry copper/molybdenum ore from the Highland Valley Copper mine
To the shareholders:
2006 was another very good year for Teck Cominco. Cash fl ow from operations and earnings of $2.9 billion and $2.4 billion respectively set a record for the third consecutive year. This was the result of continued strong worldwide demand for our products, including zinc, copper, gold, molybdenum and metallurgical coal.
The year was eventful too for our $17 billion cash and share offer to acquire Inco Limited, which would have added major nickel reserves to our diversifi ed portfolio. In the end we terminated our offer when it was topped by an all-cash bid from CVRD of Brazil, and we wish CVRD success with the acquisition.
The signifi cant increase in world demand for metals and other commodities that has resulted from strong economic growth in China is well known. It, along with speculative interest, has resulted in record prices for and low inventories of zinc, copper and many other commodities, as well as volatility, over the last year.
The question in the minds of investors, including companies considering capital investments, is how long will this last? Is it, as some have suggested, the beginning of a “new era” or “supercycle”, or is it just a strong peak in a succession of more normal cycles?
There are a number of facts that suggest that we are in store for a prolonged period of better metal prices than we experienced in the previous two decades.
First, the current strong demand should not be a surprise to anyone who follows the business. In a presentation on “Mining in the Next 20 Years” to the Cordilleran Round-Up Conference four years ago we noted that China’s consumption of copper had doubled in each of the preceding fi ve-year periods to 2001. It has doubled again in the ensuing four-year period. The story for zinc and nickel consumption is similar. While this has become more widely understood recently, the trend has been in place for some time.
Second, it was noted in our 2003 annual report that the intensity of use (consumption per capita) of metals and other commodities is much lower in emerging countries than in mature economies. China then stood at 5 pounds of copper per capita, compared with some 20 pounds in the Western world. India was at 1 pound per capita. The population of these two countries is about half that of the entire world. Both are intent on improving the standard of living of their citizens. Neither is likely to reverse this intent, although there will be ups and downs.
With emerging countries now accounting for about half of the world’s GDP, it can be assumed that intensity of use of the necessary raw materials, and thus overall demand, will continue to increase.
The supply side is the other half of the equation. It is a fact that, faced with strong demand, entrepreneurial people will seek new ways to supply it. This applies to all sectors such as automobiles and semi-conductors, for example, as well as mining. Overcapacity and cyclical downturns are a natural result of human nature. Markets work.
This is what led to the 20 years of declining commodity prices, in real terms, we experienced at the end of the last century. Virtually all of the remaining known, apparently economic mineral deposits in secure jurisdictions were developed in that period, resulting in periods of oversupply and low prices until demand caught up.
While there have been some important discoveries since and there will be more given the increase in worldwide exploration efforts, the majority are in jurisdictions that are less than secure. In addition, high prices have encouraged rising nationalism and even expropriation, neither of which will encourage rapid development of new, capital-intensive projects.
Add to this shortages of essential supplies, such as tires, trucks and grinding mills, shortages of trained operating people (which resulted from the years of declining enrolment in our universities) and the trend towards industry consolidation of the last 10 years, which has reduced dramatically the number of senior operating companies worldwide, and one can conclude that rapid response on the supply side may be less likely than in earlier years.
To some extent, the more entrepreneurial or junior companies can be expected to take up the slack, and this rejuvenation of the industry is to be encouraged, but the shortage of resources and political instability will still have to be dealt with.
It is a reasonable conclusion that demand will continue to grow, with emerging economies not easily turned back, and that the response on the supply side, while inevitable, will not overbalance this for the foreseeable future.
We will continue to look for opportunities to improve the Company. They will occur, as they always have, but ones that will make a substantial difference do not occur on call, and the search process requires discipline, including resisting the temptation to overpay. Our strategy will continue to focus on quality ore reserves, people and fi nancial strength.
In the latter respect, Teck Cominco ended the year with a cash position of $5.3 billion, and on February 12, 2007, we announced a program to buy back up to 20 million Class B shares under a normal course issuer bid over the next year. This permits the return of signifi cant capital to shareholders while still retaining the fl exibility to pursue growth prospects.
3
Annual Report 2006 Letter from the Chairman
Mike Lipkewich retired as Senior Vice President, Mine Operations in 2006, after 36 years with the company. He was responsible for a succession of on-time, on-budget construction projects for Teck over the years, including Antamina, as well as ongoing mines, and we are fortunate that he will be available to continue to advise on the Fort Hills oil sands project as it moves ahead. His position has been filled capably by Peter Kukielski, previously COO of Falconbridge.
In October, we were fortunate to have Derek Pannell join our Board of Directors. Derek was CEO of Falconbridge prior to its takeover by Xstrata and was a key player with us in the partnership that built Antamina successfully. He adds another dimension to a strong, independent Board.
David Thompson, who retired as CEO in 2005, will not be standing for re-election at the next Annual Meeting, having been appointed Chair of the B.C. Coastal Health Authority. Dr. Lloyd Barber will also not be standing for re-election, having reached the Company’s mandatory retirement age prior to our Annual Meeting. Their dedication and contributions to Teck Cominco over the years have been substantial and are highly appreciated by everyone in the company.
In closing, let me thank all of the people in the field, at our operations and research facilities and at head office who work every day to make this a better company.
On behalf of the Board,
Norman B. KeevilChairman
February 26, 2007
Teck Cominco Limited
�
Letter from the Chairman
More than a rock, indeed. At Teck Cominco, rocks are our livelihood and our passion. We search for the right rocks all over the world. When we fi nd them, we know how to assess them and how to determine economic viability. We know how to build mines and processing plants in remote areas and how to do so on a sustainable basis. We have a great team of people who are highly skilled and, most importantly, who are passionate about doing things the right way wherever we operate in the world. This is who we are; it is our very identity: Teck Cominco.
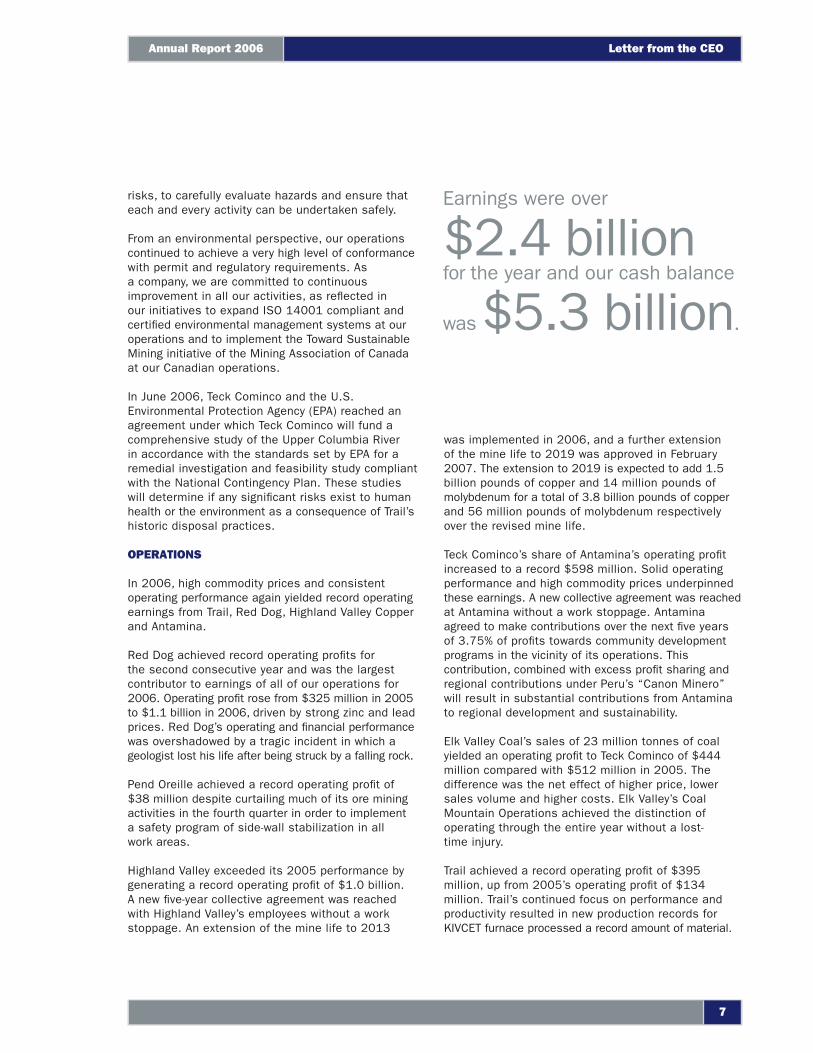
Our position at the end of 2006 was, quite simply, rock solid. Earnings were over $2.4 billion for the year and our year end cash balance was $5.3 billion. Further fi nancial strength and growth capacity is demonstrated by looking at our debt maturity schedule. Notwithstanding the $5.3 billion cash balance, we have no debt due in the next fi ve years and over half of the $1.5 billion in debt we do have doesn’t mature for 29 more years. Meanwhile, in 2006 we generated over $2 billion in free cash fl ow.
Clearly one of our key challenges is how best to deploy this fi nancial capacity. It is not easy; good opportunities are scarce, valuations are often quite high and our competition is also well funded. But there is no rush. These are, by their very nature, long-term decisions, and sometimes one just has to take one’s time to get it right. One example was Inco. It was a unique opportunity, so we launched a bid. With each of its fi ve core assets we had a clear plan
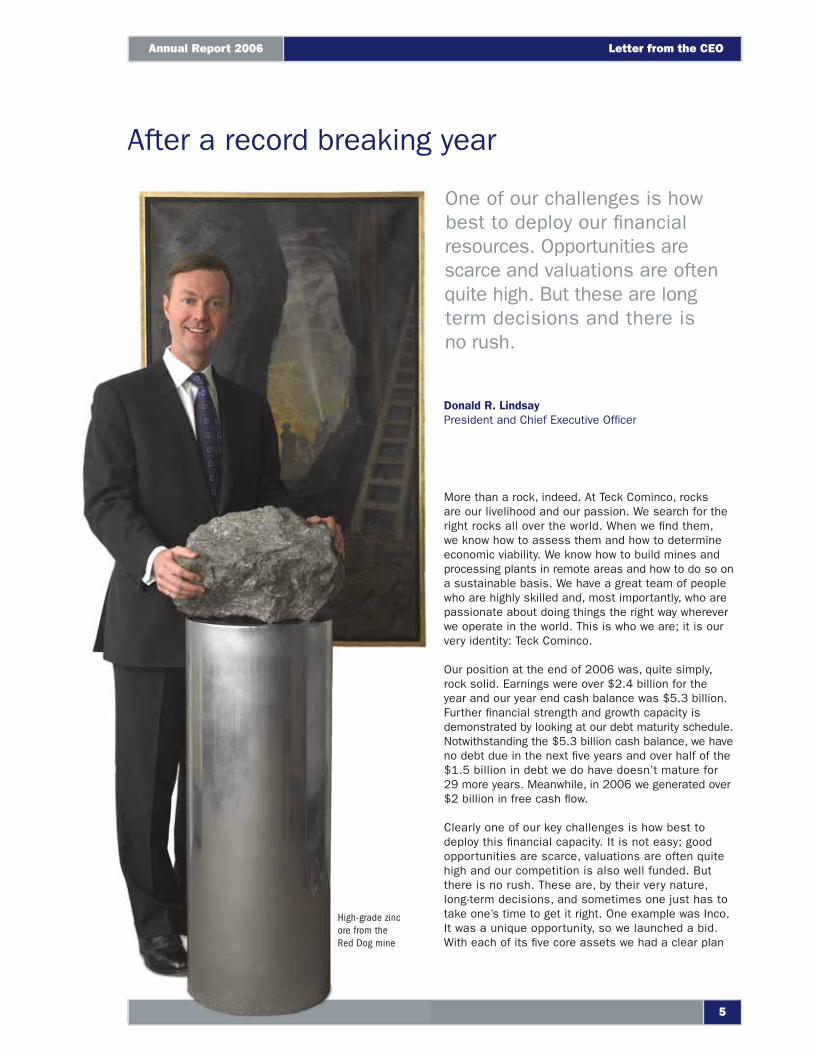
One of our challenges is how best to deploy our fi nancial resources. Opportunities are scarce and valuations are often quite high. But these are long term decisions and there is no rush.
After a record breaking year
Donald R. LindsayPresident and Chief Executive Offi cer
5
Annual Report 2006 Letter from the CEO
High-grade zinc ore from the Red Dog mine
on how to add value, so it was a good fi t for us. But when CVRD, a competitor that was several times our size, decided to offer all cash, it became clear that it was not to be. We could not put our own shareholders at risk by offering over $20 billion in cash and taking on an extremely high level of debt. So we took our $130 million profi t on our investment and we moved on. In the end, the Core Values we discussed in this report last year prevailed. It is who we are: Teck Cominco.
It is hard to know what 2007 holds for us. As this letter is being written, the cycle continues and commodity prices have corrected sharply. Ironically, this may create opportunities for us to grow our Company by investing at better, less lofty valuations. We will see…
MANAGEMENT
Mike Lipkewich, Senior Vice President, Mining retired during the year following 36 years of service with the Company. Mike was instrumental in building Teck Cominco into a world-class mining company. During his career, Mike played a central role in the Company’s growth, including the creation of the Elk Valley Coal Partnership and our investment in the Fort Hills oil sands project. Throughout his career, Mike was a leader in our industry as well as a mentor for many mining engineers and managers.
Jim Popowich, President and Chief Executive Offi cer of the Elk Valley Coal Partnership, retired during the year following 37 years of service with Elk Valley Coal and its predecessors. Since the formation of Elk Valley Coal, Jim was instrumental in integrating the operations of Elk Valley Coal and achieving our synergy targets there.
I want to thank Mike and Jim for their outstanding contributions to our Company and wish them a long and very happy retirement.
During the year, a number of executive appointments were made. Peter Kukielski was appointed Executive Vice President and Chief Operating Offi cer. Prior to joining Teck Cominco, Peter was EVP and Chief Operating Offi cer at Falconbridge Ltd. Earlier in his career he held senior engineering and project management roles with BHP Billiton and Fluor Corporation. Peter is responsible for our mining and metal refi ning operations, marketing and sales and project development.
Boyd Payne was appointed President and Chief Executive Offi cer of the Elk Valley Coal Partnership. Prior to joining Elk Valley, Boyd was Vice President, Marketing, for BHP Billiton Mitsubishi Alliance. Earlier, Boyd held senior marketing positions with Fording Coal and Manalta Coal.
Len Manuel was appointed Senior Vice President and General Counsel. Len is the Company’s chief counsel, advising the Board and management on legal and governance affairs while managing the Company’s legal functions.
Dale Andres was appointed Vice President, International Mining, responsible for Antamina and Lennard Shelf as well as the Pogo and Hemlo gold mines. Most recently, Dale was General Manager, Underground Mines.
Greg Waller was appointed Vice President, Investor Relations and Strategic Analysis. In his new role, Greg continues to be responsible for investor relations with added responsibilities in the Company’s Corporate Development function.
I am very pleased to welcome these individuals in their new roles within our senior management team, each bringing a wealth of knowledge, experience and capability to his position.
I would like to recognize the hard work and dedication of our employees in achieving outstanding results this year. Our success would not have been possible without their contribution and commitment. These achievements are recognized through incentive programs that are linked to the success of the organization on performance measures related to safety, health and environment as well as production and costs.
SAFETY AND ENVIRONMENT
Employee safety and health is one of our core values and we have worked continuously towards developing a culture of safety that transcends the workday and extends into our family lives as well. Despite our efforts, 2006 was marred by six fatalities. We were all deeply saddened by these tragic losses, and on behalf of Teck Cominco, I wish to again express my deepest sympathy and condolences to the families, friends and colleagues of these individuals. We believe that the attainment of zero incidents is achievable, and we urge our workforce and all individuals not to take
Teck Cominco Limited
6
Letter from the CEO
risks, to carefully evaluate hazards and ensure that each and every activity can be undertaken safely.
From an environmental perspective, our operations continued to achieve a very high level of conformance with permit and regulatory requirements. As a company, we are committed to continuous improvement in all our activities, as refl ected in our initiatives to expand ISO 14001 compliant and certifi ed environmental management systems at our operations and to implement the Toward Sustainable Mining initiative of the Mining Association of Canada at our Canadian operations.
In June 2006, Teck Cominco and the U.S. Environmental Protection Agency (EPA) reached an agreement under which Teck Cominco will fund a comprehensive study of the Upper Columbia River in accordance with the standards set by EPA for a remedial investigation and feasibility study compliant with the National Contingency Plan. These studies will determine if any signifi cant risks exist to human health or the environment as a consequence of Trail’s historic disposal practices.
OPERATIONS
In 2006, high commodity prices and consistent operating performance again yielded record operating earnings from Trail, Red Dog, Highland Valley Copper and Antamina.
Red Dog achieved record operating profi ts for the second consecutive year and was the largest contributor to earnings of all of our operations for 2006. Operating profi t rose from $325 million in 2005 to $1.1 billion in 2006, driven by strong zinc and lead prices. Red Dog’s operating and fi nancial performance was overshadowed by a tragic incident in which a geologist lost his life after being struck by a falling rock.
Pend Oreille achieved a record operating profi t of $38 million despite curtailing much of its ore mining activities in the fourth quarter in order to implement a safety program of side-wall stabilization in all work areas.
Highland Valley exceeded its 2005 performance by generating a record operating profi t of $1.0 billion. A new fi ve-year collective agreement was reached with Highland Valley’s employees without a work stoppage. An extension of the mine life to 2013
was implemented in 2006, and a further extension of the mine life to 2019 was approved in February 2007. The extension to 2019 is expected to add 1.5 billion pounds of copper and 14 million pounds of molybdenum for a total of 3.8 billion pounds of copper and 56 million pounds of molybdenum respectively over the revised mine life.
Teck Cominco’s share of Antamina’s operating profi t increased to a record $598 million. Solid operating performance and high commodity prices underpinned these earnings. A new collective agreement was reached at Antamina without a work stoppage. Antamina agreed to make contributions over the next fi ve years of 3.75% of profi ts towards community development programs in the vicinity of its operations. This contribution, combined with excess profi t sharing and regional contributions under Peru’s “Canon Minero” will result in substantial contributions from Antamina to regional development and sustainability.
Elk Valley Coal’s sales of 23 million tonnes of coal yielded an operating profi t to Teck Cominco of $444 million compared with $512 million in 2005. The difference was the net effect of higher price, lower sales volume and higher costs. Elk Valley’s Coal Mountain Operations achieved the distinction of operating through the entire year without a lost-time injury.
Trail achieved a record operating profi t of $395 million, up from 2005’s operating profi t of $134 million. Trail’s continued focus on performance and productivity resulted in new production records for KIVCET furnace processed a record amount of material.
Earnings were over
$2.4 billion for the year and our cash balance
was $5.3 billion.
7
Annual Report 2006 Letter from the CEO
In 2006, Trail commenced the processing of electronic scrap. Once proven, this process will address a critical environmental issue. In September, I had the pleasure of joining more than 4,000 people in Trail at a community celebration of its 100th anniversary.
Pogo’s construction was completed in the fi rst quarter of 2006 except for the installation of the underground ore conveying system, which was completed in the second quarter. The fi nal construction cost for the project was US$350 million. The Pogo mine commenced operations in January 2006, with the fi rst gold bar poured on February 12th. However, mill throughput did not reach design capacity in 2006 as production was limited by tailings fi ltration capacity, bottlenecks in the paste backfi ll system, and a construction incident in October that severely damaged mine electrical systems. Commercial production is expected to be reached in the second quarter of 2007. Annual gold production of 350,000 to 450,000 ounces is expected over the 10 year life of the mine.
Hemlo’s operating profi ts declined to $7 million as gold production declined. Hemlo operations continued to excel in safety, receiving the highest safety awards for both large and small mines in Ontario. There were no lost-time injuries at the David Bell Mine in 2006.
SUSTAINABLE DEVELOPMENT
We believe that our performance today is crucial to building tomorrow’s relationships and opportunities. Our sustainability reporting is not only a report card on our performance; it’s also a “show and tell” to share how we bring value to our shareholders. Ultimately, we aim to be a company that delivers value to its shareholders through sustainable operations.
In 2006, we committed to apply the Global Reporting Initiative “G3” guidelines in our annual sustainability reporting. With this expanded level of reporting, we are striving to enable our stakeholders to be better informed on the contributions that we can make in achieving sustainable development and the challenges and achievements we have encountered along that path. Our 2006 Sustainability Report has been issued as a companion to this report and is available on-line at www.teckcominco.com.
EXPLORATION
Highlights of the Company’s exploration activities included signifi cant copper intersections on the Carrapateena project in South Australia, encouraging drill intersections on several gold properties in Turkey, initiation of a pre-feasibility study on the Morelos gold project in Mexico, undertaking a scoping study on the Santa Fe nickel project in Brazil, and the discovery of a new diamond-bearing kimberlitic fi eld in northern Canada. These projects, along with several exciting new opportunities in zinc (Ireland), copper (Namibia), nickel (Brazil) and gold (S. America), will be advanced in 2007.
CORPORATE DEVELOPMENT
While we ultimately chose not to take on excessive leverage in pursuit of Inco, the team performed very well throughout a very complex international process, and that performance has instilled confi dence and enthusiasm throughout the organization.
Other Corporate Development initiatives in 2006 were successful on a number of fronts. Our 15% share of the contingent resource estimate for the Fort Hills oil sands project represents approximately 580 million barrels of synthetic crude oil or roughly equivalent to the whole of the original Hibernia oil fi eld. In addition, we have jointly acquired 277 thousand acres of prospective Athabasca oil sands leases with UTS Energy Corporation, which is over four times the area of the Fort Hills project and represents a 14-fold increase in our pro-rata oil sands lease area position.
In addition, during the fourth quarter we made a number of relatively small but important strategic investments. These new or expanded relationships with Tahera, a Canadian diamond producer, Nautilus, a leader in sea bed mineral exploration, and ZincOx, a leader in developing technology to recover zinc from dust generated from recycled steel, should provide us with potential for attractive future growth. In each case, we will be working directly with company management to help ensure their success.
Our Technology Division completed its fi rst full year and is now an established corporate resource for researching and implementing specifi c operational
Teck Cominco Limited
8
Letter from the CEO
and environmental improvements, effective technology transfer between operating units and the generation of business development opportunities.The CESL plant being constructed by CVRD in Brazil is now expected to start up later this year and a number of other CESL initiatives were advanced that could enable us to leverage this valuable process technology into direct interests in new projects.
We are optimistic that these and other growth initiatives in 2007 will yield many exciting, value-enhancing opportunities for our company. Our primary focus continues to be on acquisition and development of high quality, long life resources in commodities with positive fundamental outlooks. Competition for assets from other well-fi nanced industry participants is intense, but we are fortunate to have the fi nancial resources and skills necessary to compete effectively and make Teck Cominco an even stronger company.
OBJECTIVES
Our objectives for 2006 included the completion of a management succession program, further development of our opportunity base in oil sands and advancing several of our new and existing projects towards production, all of which were achieved. We also had the objective of surfacing additional value contained in our gold business unit, which was deferred pending completion of the Pogo mine, and generating another new income source, which was only partially achieved.
Our objectives for 2007 are to invest a signifi cant amount of our excess cash in productive assets or
high quality resources, to pursue surfacing additional value from our gold assets, to extend the mine life of our core copper operation at Highland Valley and to once again generate another new income source through exploration, development or acquisition.
Both David Thompson and Dr. Lloyd Barber will be retiring from the Board at our Annual General Meeting and I would like to express my appreciation for their tremendous contribution to Teck Cominco. I would also like to welcome Derek Pannell who joined our Board in November, 2006 and I look forward to working with Janice Rennie who has been nominated to join the Board at our Annual General Meeting.
2006 was a great year. While we cannot predict how 2007 will turn out, it does look like it will be just as interesting and challenging as 2006. In closing, I would like to congratulate all of our employees on an outstanding year and thank them for their contribution to our record results.
Donald R. Lindsay President and Chief Executive Offi cer
February 26, 2007
9
Annual Report 2006 Letter from the CEO
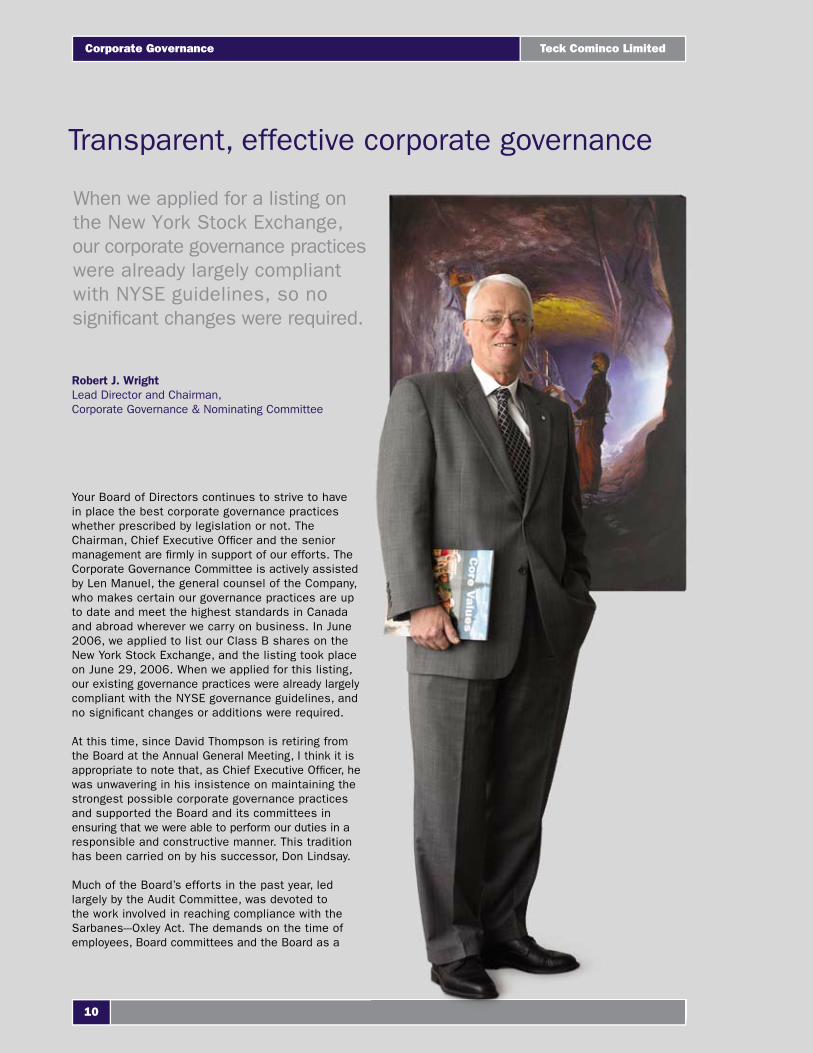
Your Board of Directors continues to strive to have in place the best corporate governance practices whether prescribed by legislation or not. The Chairman, Chief Executive Of� cer and the senior management are � rmly in support of our efforts. The Corporate Governance Committee is actively assisted by Len Manuel, the general counsel of the Company, who makes certain our governance practices are up to date and meet the highest standards in Canada and abroad wherever we carry on business. In June 2006, we applied to list our Class B shares on the New York Stock Exchange, and the listing took place on June 29, 2006. When we applied for this listing, our existing governance practices were already largely compliant with the NYSE governance guidelines, and no signi� cant changes or additions were required.
At this time, since David Thompson is retiring from the Board at the Annual General Meeting, I think it is appropriate to note that, as Chief Executive Of� cer, he was unwavering in his insistence on maintaining the strongest possible corporate governance practices and supported the Board and its committees in ensuring that we were able to perform our duties in a responsible and constructive manner. This tradition has been carried on by his successor, Don Lindsay.
Much of the Board’s efforts in the past year, led largely by the Audit Committee, was devoted to the work involved in reaching compliance with the Sarbanes---Oxley Act. The demands on the time of employees, Board committees and the Board as a
When we applied for a listing on the New York Stock Exchange, our corporate governance practices were already largely compliant with NYSE guidelines, so no signi� cant changes were required.
Robert J. WrightLead Director and Chairman,Corporate Governance & Nominating Committee
Transparent, effective corporate governance
Teck Cominco Limited
10
Corporate Governance
whole in this matter have been extensive. Our direct involvement in a new and exciting strategic planning process that Don Lindsay has implemented, involving management at many different levels and various Board members, has energized and engaged the Board.
The majority of the directors are unrelated and independent. A brief biography of each director is included in this report and in our Information Circular. In the past the Board has followed a practice of meeting without management at each of its meetings.
All of the key committees—Audit, Compensation, Corporate Governance and Nominating—are comprised entirely of independent directors. All of the other committees are made up of a majority of unrelated directors. All of the members of the Audit Committee are fi nancially literate, and Hugh J. Bolton, Chairman of the Committee, is the Company’s designated Audit Committee fi nancial expert.
Our Audit Committee plays a very important role in the oversight of the fi nancial affairs and internal controls of the Company. The mandate of the Committee is reviewed annually. The Audit Committee oversees the progress of the assessment and certifi cation of our fi nancial controls. The purpose of this program is to build an auditable and sustainable program to comply with the U.S. Sarbanes-Oxley Act of 2002 related to internal controls over fi nancial reporting and equivalent rules.
We have completed regular Board surveys to assess both the performance of the Board and individual directors. Each director is interviewed with respect to the responses and any other concerns they may have. We largely rely on the self-assessment approach to individual director performance and have found this, combined with the follow-up interview, to be an effective way of improving our performance collectively and individually.
One of the principal responsibilities of the Corporate Governance Committee is Board renewal. We are pleased to welcome Derek Pannell to the Board of the Company. Derek has extensive experience in our industry and will make a signifi cant contribution to the
Board. The Board will be nominating Janice Rennie at the Annual General Meeting in April. Janice is currently a director of several publicly listed companies, including West Fraser Timber Co. Ltd., Methanex Corp., Matrikon Inc. and Canadian Hotel Properties REIT. She is a chartered accountant and was the winner of the Gold medal in Alberta and the Silver medal in Canada for the highest and second highest marks respectively in the Canadian Uniform Final Examinations.
I am confi dent that Teck Cominco’s governance practice and procedures continue to ensure transparency and support our strategic objectives.
Robert J. Wright Lead Director and Chairman, Corporate Governance & Nominating Committee
February 26, 2007
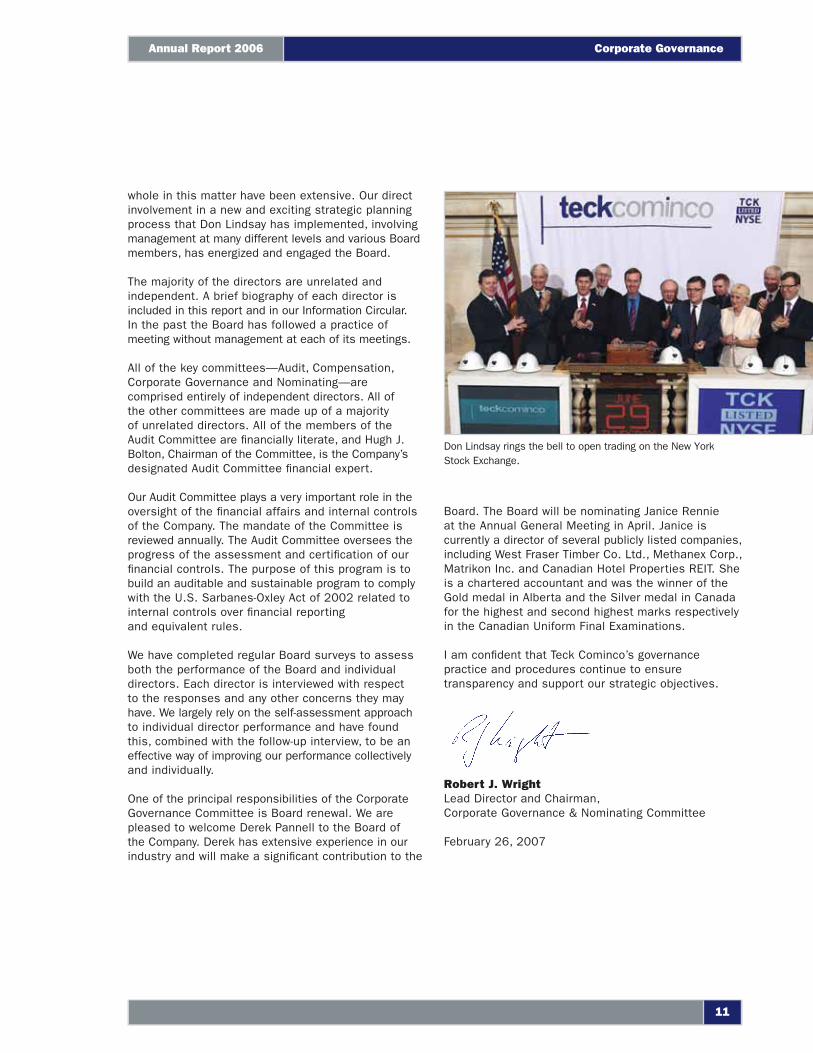
Don Lindsay rings the bell to open trading on the New York Stock Exchange.
11
Annual Report 2006 Corporate Governance
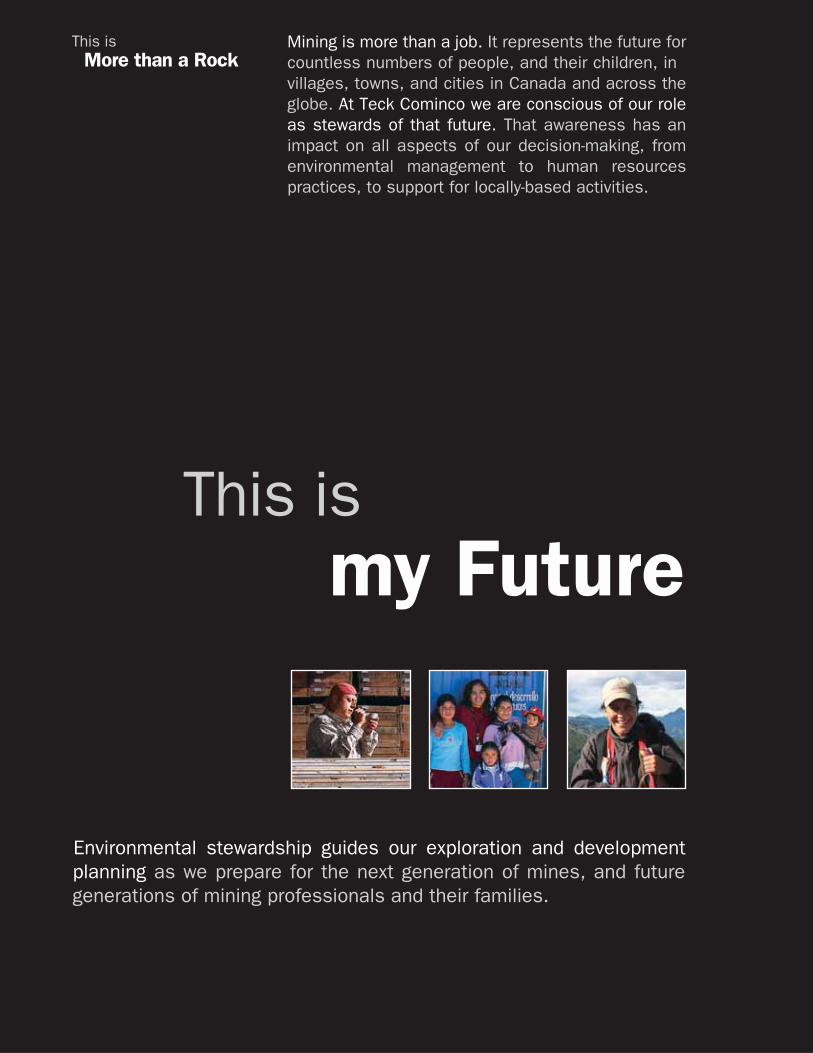
This ismy Future
Mining is more than a job. It represents the future for countless numbers of people, and their children, in villages, towns, and cities in Canada and across the globe. At Teck Cominco we are conscious of our role as stewards of that future. That awareness has an impact on all aspects of our decision-making, from environmental management to human resources practices, to support for locally-based activities.
Environmental stewardship guides our exploration and development planning as we prepare for the next generation of mines, and future generations of mining professionals and their families.
This is More than a Rock
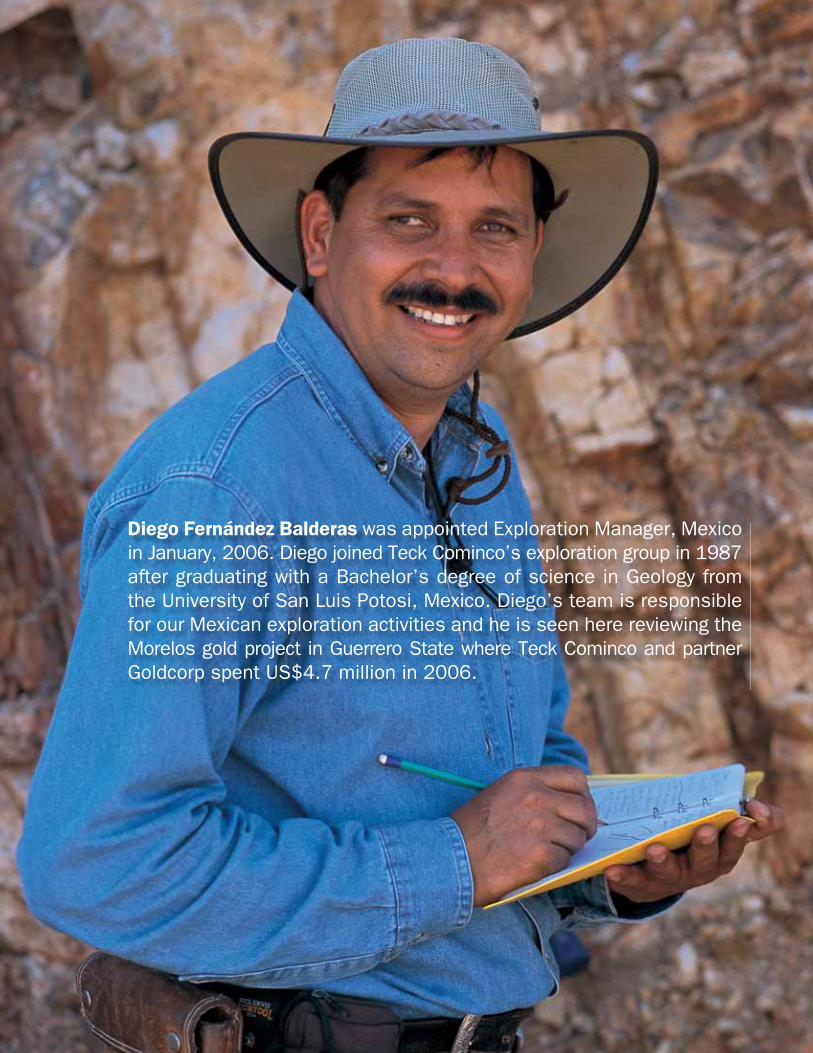
Diego Fernández Balderas was appointed Exploration Manager, Mexico in January, 2006. Diego joined Teck Cominco’s exploration group in 1987 after graduating with a Bachelor’s degree of science in Geology from the University of San Luis Potosi, Mexico. Diego’s team is responsible for our Mexican exploration activities and he is seen here reviewing the Morelos gold project in Guerrero State where Teck Cominco and partner Goldcorp spent US$4.7 million in 2006.
Management’s Discussion and Analysis of Financial Positionand Operating Results
This discussion and analysis of fi nancial position and results of operations of Teck Cominco Limited is prepared
as at February 26, 2007, and should be read in conjunction with the audited consolidated fi nancial statements
of Teck Cominco Limited and the notes thereto for the year ended December 31, 2006. In this discussion,
unless the context otherwise dictates, a reference to Teck Cominco, the Company, or us, we or our, refers to
Teck Cominco Limited and its subsidiaries including Teck Cominco Metals Ltd., and a reference to TCML refers
to Teck Cominco Metals Ltd. and its subsidiaries. Additional information relating to the Company, including the
Company’s annual information form, is available on SEDAR at www.sedar.com.
MD&A CONTENTS
General 14 - 15
Operations 16 - 29
Markets 32 - 35
Financial Review 38 - 50
Pages 30, 31 and 36, 37 and photographs and associated captions on pages 14–50 do not form part of the Management’s Discussion and Analysis.
Management’s Discussion and Analysis
Teck Cominco Limited
14
Management’s Discussion and Analysis
CAUTION ON FORWARD-LOOKING INFORMATION
This report contains certain statements which constitute forward-looking information. These forward-looking statements are not descriptive of historical matters and may refer to management’s expectations or plans. These statements include but are not limited to statements concerning our business objectives and plans; future trends in our industry; future production costs and volumes; mineral grades, reserve and resource estimates and ore types; sales volumes and realized prices; capital spending plans; exploration plans; expansion plans; expected metallurgical coal market fundamentals and prices; availability of equipment and supplies; expected plant availability; success of process changes; our processing technologies; global economic growth and industrial demand; production of coal, base metal concentrates and refi ned metal by our operations; future metal prices and treatment charges; future royalties payable; changes in global metal and concentrate inventories; currency exchange rates; costs of energy, materials and supplies; the outcome of disputes and legal proceedings in which we are involved; future effective tax rates; and future benefi ts costs.
Inherent in forward-looking statements are risks and uncertainties beyond our ability to predict or control including risks that may affect our operating or capital plans, including generally encountered in the development and operation of mineral properties and processing facilities such as unusual or unexpected geological formations, unanticipated metallurgical diffi culties, ground control problems, process upsets and equipment malfunctions; risks associated with labour disturbances and unavailability of skilled labour; fl uctuations in the market prices of our principal products, which are cyclical and subject to substantial price fl uctuations; risks created through competition for mining properties; risks associated with lack of access to markets; risks associated with mineral and oil and gas reserve and resource estimates, including the risk of errors in assumptions or methodologies; risks posed by fl uctuations in exchange rates and interest rates, as well as general economic conditions; risks associated with environmental compliance and permitting, including those created by changes in environmental legislation and regulation; risks associated with our dependence on third parties in the provision of transportation and other critical services; risks associated with aboriginal title claims and other title risks; social and political risks associated with operations in foreign countries; and risks associated with legal proceedings.
Actual results and developments are likely to differ, and may differ materially, from those expressed or implied by the forward-looking statements contained in this annual report. Such statements are based on a number of assumptions which may prove to be incorrect, including, but not limited to, the following assumptions: that there is no material deterioration in general business and economic conditions; that there is no unanticipated fl uctuation of interest rates and foreign exchange rates; that the supply and demand for, deliveries of and the level and volatility of prices of zinc, copper, coal and gold and our other primary metals and minerals as well as oil, natural gas and petroleum products develop as expected; that we receive regulatory and governmental approvals for our development projects and other operations on a timely basis; that we are able to obtain fi nancing for our development projects on reasonable terms; that there is no unforeseen deterioration in our costs of production or our production and productivity levels; that we are able to continue to secure adequate transportation for our products; that we are able to procure mining equipment and operating supplies (including tires) in suffi cient quantities and on a timely basis; that engineering and construction timetables and capital costs for our development and expansion projects are not incorrectly estimated or affected by unforeseen circumstances; that costs of closure of various operations are accurately estimated; that there are no unanticipated changes to market competition; that our reserve estimates are within reasonable bounds of accuracy (including with respect to size, grade and recoverability) and that the geological, operational and price assumptions on which these are based are reasonable; that we realize expected premiums over London Metal Exchange cash and other benchmark prices; that our coal price negotiations with customers will be resolved on acceptable terms as to price and volume; that environmental and other proceedings or disputes are satisfactorily resolved; and that we maintain our ongoing relations with our employees and with our business partners and joint venturers.
We caution you that the foregoing list of important factors and assumptions is not exhaustive. Events or circumstances could cause our actual results to differ materially from those estimated or projected and expressed in, or implied by, these forward-looking statements. You should also carefully consider the matters discussed under “Risk Factors” in our Annual Information Form. We undertake no obligation to update publicly or otherwise revise any forward-looking statements or the foregoing list of factors, whether as a result of new information or future events or otherwise, except as may be required under applicable laws.
15
Annual Report 2006 Management’s Discussion and Analysis
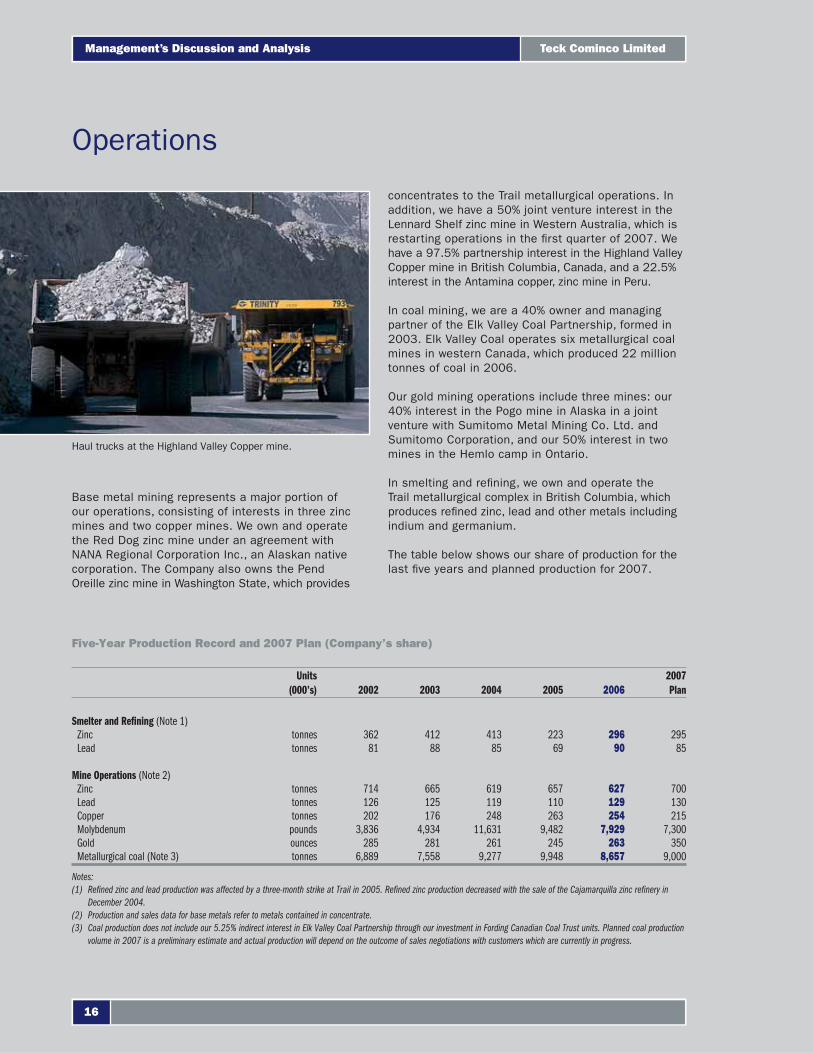
Base metal mining represents a major portion of our operations, consisting of interests in three zinc mines and two copper mines. We own and operate the Red Dog zinc mine under an agreement with NANA Regional Corporation Inc., an Alaskan native corporation. The Company also owns the Pend Oreille zinc mine in Washington State, which provides
concentrates to the Trail metallurgical operations. In addition, we have a 50% joint venture interest in the Lennard Shelf zinc mine in Western Australia, which is restarting operations in the fi rst quarter of 2007. We have a 97.5% partnership interest in the Highland Valley Copper mine in British Columbia, Canada, and a 22.5% interest in the Antamina copper, zinc mine in Peru.
In coal mining, we are a 40% owner and managing partner of the Elk Valley Coal Partnership, formed in 2003. Elk Valley Coal operates six metallurgical coal mines in western Canada, which produced 22 million tonnes of coal in 2006.
Our gold mining operations include three mines: our 40% interest in the Pogo mine in Alaska in a joint venture with Sumitomo Metal Mining Co. Ltd. and Sumitomo Corporation, and our 50% interest in two mines in the Hemlo camp in Ontario.
In smelting and refi ning, we own and operate the Trail metallurgical complex in British Columbia, which produces refi ned zinc, lead and other metals including indium and germanium.
The table below shows our share of production for the last fi ve years and planned production for 2007.
Operations
Five-Year Production Record and 2007 Plan (Company’s share)
Units (000’s) 2002 2003 2004 2005 2006
2007 Plan
Smelter and Refining (Note 1)Zinc tonnes 362 412 413 223 296 295Lead tonnes 81 88 85 69 90 85
Mine Operations (Note 2)Zinc tonnes 714 665 619 657 627 700Lead tonnes 126 125 119 110 129 130Copper tonnes 202 176 248 263 254 215Molybdenum pounds 3,836 4,934 11,631 9,482 7,929 7,300Gold ounces 285 281 261 245 263 350Metallurgical coal (Note 3) tonnes 6,889 7,558 9,277 9,948 8,657 9,000
Notes:(1) Refi ned zinc and lead production was affected by a three-month strike at Trail in 2005. Refi ned zinc production decreased with the sale of the Cajamarquilla zinc refi nery in
December 2004.(2) Production and sales data for base metals refer to metals contained in concentrate.(3) Coal production does not include our 5.25% indirect interest in Elk Valley Coal Partnership through our investment in Fording Canadian Coal Trust units. Planned coal production
volume in 2007 is a preliminary estimate and actual production will depend on the outcome of sales negotiations with customers which are currently in progress.
Haul trucks at the Highland Valley Copper mine.
Teck Cominco Limited
16
Management’s Discussion and Analysis
Zinc
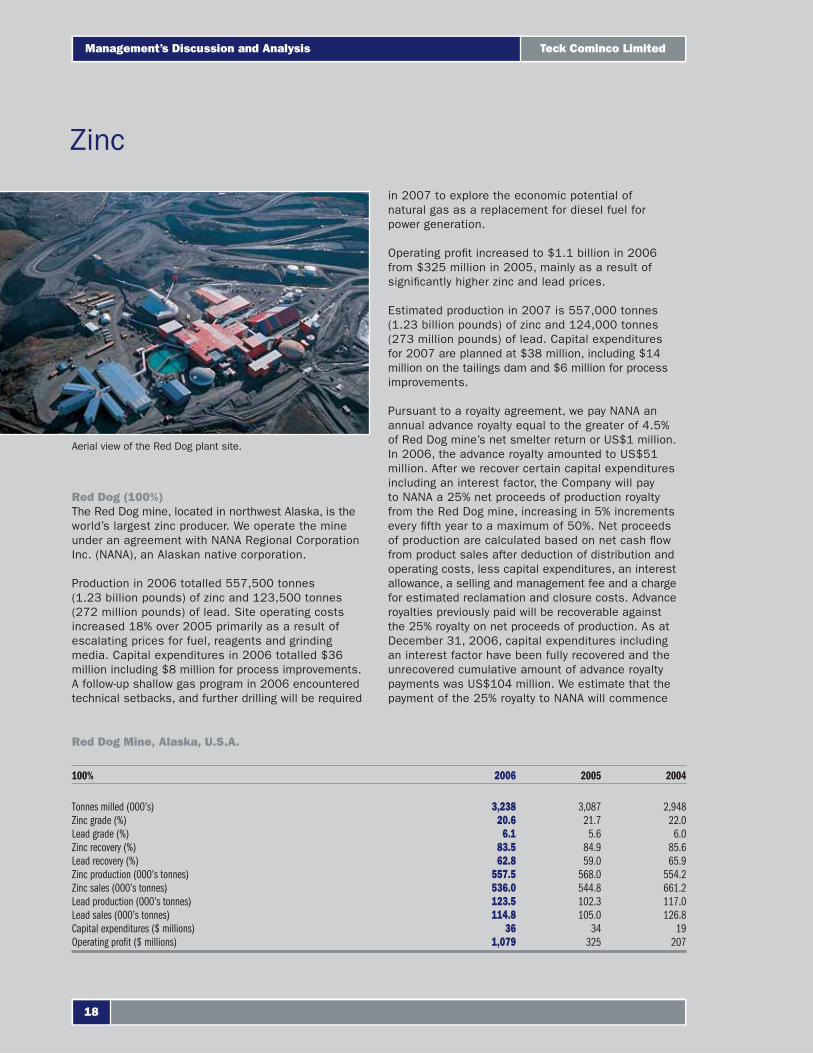
Red Dog (100%)The Red Dog mine, located in northwest Alaska, is the world’s largest zinc producer. We operate the mine under an agreement with NANA Regional Corporation Inc. (NANA), an Alaskan native corporation.
Production in 2006 totalled 557,500 tonnes (1.23 billion pounds) of zinc and 123,500 tonnes (272 million pounds) of lead. Site operating costs increased 18% over 2005 primarily as a result of escalating prices for fuel, reagents and grinding media. Capital expenditures in 2006 totalled $36 million including $8 million for process improvements. A follow-up shallow gas program in 2006 encountered technical setbacks, and further drilling will be required
in 2007 to explore the economic potential of natural gas as a replacement for diesel fuel for power generation.
Operating profi t increased to $1.1 billion in 2006 from $325 million in 2005, mainly as a result of signifi cantly higher zinc and lead prices.
Estimated production in 2007 is 557,000 tonnes (1.23 billion pounds) of zinc and 124,000 tonnes (273 million pounds) of lead. Capital expenditures for 2007 are planned at $38 million, including $14 million on the tailings dam and $6 million for process improvements.
Pursuant to a royalty agreement, we pay NANA an annual advance royalty equal to the greater of 4.5% of Red Dog mine’s net smelter return or US$1 million. In 2006, the advance royalty amounted to US$51 million. After we recover certain capital expenditures including an interest factor, the Company will pay to NANA a 25% net proceeds of production royalty from the Red Dog mine, increasing in 5% increments every fi fth year to a maximum of 50%. Net proceeds of production are calculated based on net cash fl ow from product sales after deduction of distribution and operating costs, less capital expenditures, an interest allowance, a selling and management fee and a charge for estimated reclamation and closure costs. Advance royalties previously paid will be recoverable against the 25% royalty on net proceeds of production. As at December 31, 2006, capital expenditures including an interest factor have been fully recovered and the unrecovered cumulative amount of advance royalty payments was US$104 million. We estimate that the payment of the 25% royalty to NANA will commence
Red Dog Mine, Alaska, U.S.A.
100% 2006 2005 2004
Tonnes milled (000’s) 3,238 3,087 2,948Zinc grade (%) 20.6 21.7 22.0Lead grade (%) 6.1 5.6 6.0Zinc recovery (%) 83.5 84.9 85.6Lead recovery (%) 62.8 59.0 65.9Zinc production (000’s tonnes) 557.5 568.0 554.2Zinc sales (000’s tonnes) 536.0 544.8 661.2Lead production (000’s tonnes) 123.5 102.3 117.0Lead sales (000’s tonnes) 114.8 105.0 126.8Capital expenditures ($ millions) 36 34 19Operating profi t ($ millions) 1,079 325 207
Aerial view of the Red Dog plant site.
Teck Cominco Limited
18
Management’s Discussion and Analysis
in the fourth quarter of 2007 after we have recovered all advance royalty payments, but the actual timing is highly dependent on metal prices, sales volumes and other items affecting the calculation of net proceeds.
Pend Oreille (100%)The Pend Oreille mine, located in northeastern Washington State, provides zinc and lead concentrates to the Trail smelter 80 kilometres north of the mine in British Columbia. Mine production in 2006 was 34,000 tonnes of zinc and 5,000 tonnes of lead. Zinc production in 2006 was 11,000 tonnes lower than 2005, primarily as a result of the implementation of a revised ground control plan. Production in 2007 is planned to be 45,000 tonnes of zinc and 8,000 tonnes of lead. Exploration in the immediate vicinity of the mine returned encouraging results with intersections similar to current mining areas, and further drilling will continue in 2007.
We have observed signifi cant negative zinc grade variances between the reserve model and mill feed and have experienced higher mining costs than anticipated. A revised mine plan and reserve model have been developed, and Pend Oreille’s ore reserves have been substantially reduced due to changes in mine design, revised ore grades and higher operating costs assumptions, offset by higher metal price projections. Reserve and mine life will be highly sensitive to zinc prices, but we expect the remaining mine life to exceed four years.
Lennard Shelf (50%)The Lennard Shelf operations are located in the Kimberley region of Western Australia, 400 kilometres east of Broome and 2,600 kilometres north of Perth. They are owned by Teck Cominco Limited (50%) and Xstrata Plc (50%) through Lennard Shelf Pty Ltd.
The operations have been on care and maintenance since October 2003. A decision to restart the Pillara mine was made in April 2006, and production began in the fi rst quarter of 2007. The operation is anticipated to produce approximately 75,000 tonnes of zinc and 15,000 tonnes of lead in concentrates, on an annual basis, over its anticipated mine life of four years. Concentrate shipments are expected to start in the second quarter of 2007.
An active exploration program designed to increase reserves at the Pillara mine and to look for other economic deposits in the region is continuing. Since the acquisition of this property in late 2003, there has also been extensive cleanup and rehabilitation of past producing mine sites (Kapok, Goongewa and Cadjebut) operated by the previous owner.
Red Dog operating profi t increased to $1.1 billion in
2006 from $325 million in 2005.
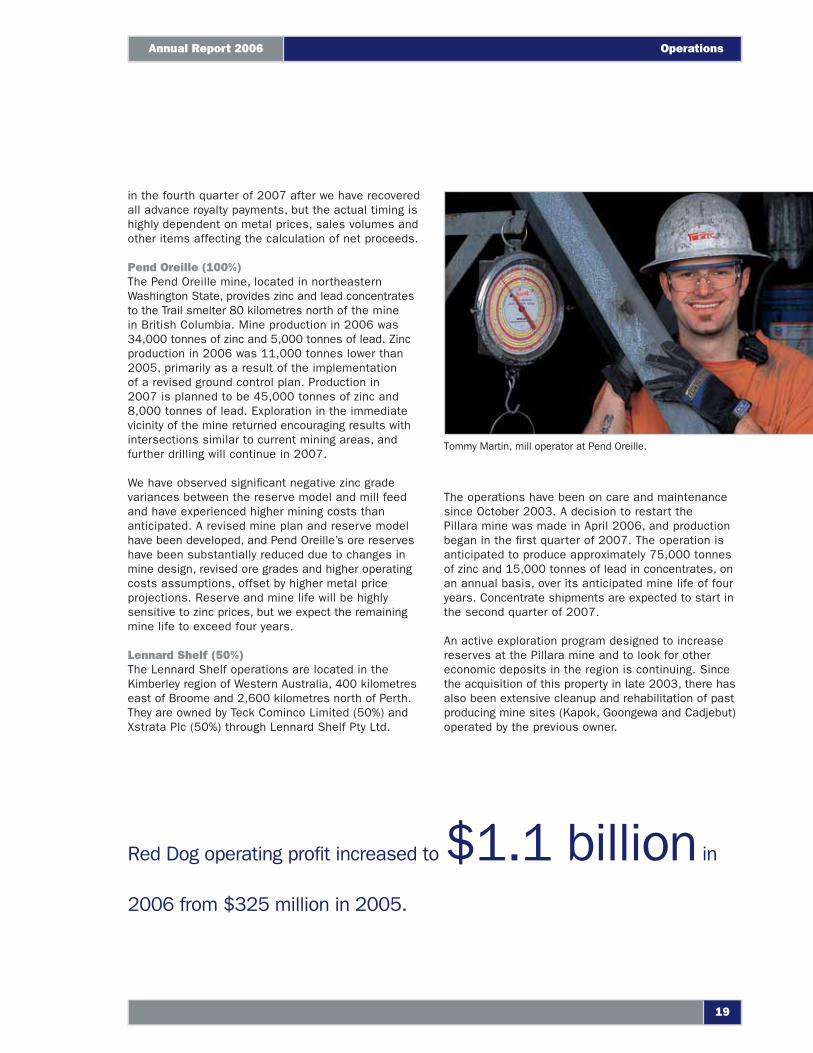
Tommy Martin, mill operator at Pend Oreille.
19
Annual Report 2006 Operations
Copper
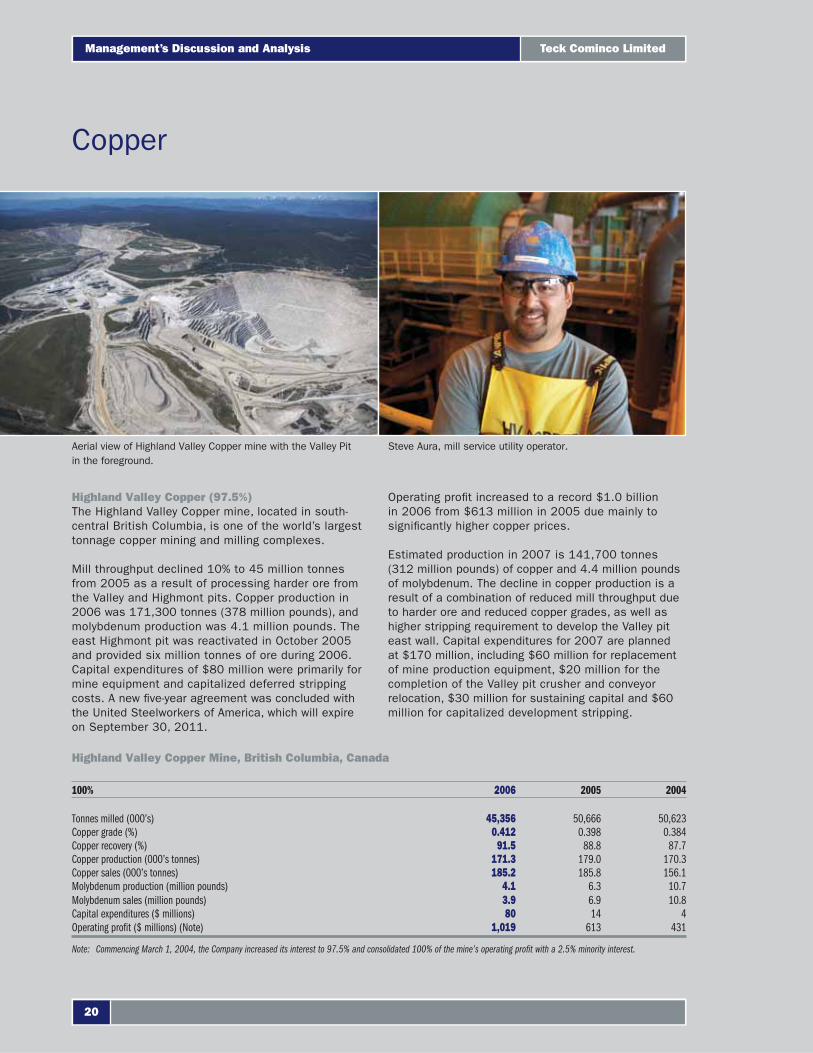
Highland Valley Copper (97.5%)The Highland Valley Copper mine, located in south-central British Columbia, is one of the world’s largest tonnage copper mining and milling complexes.
Mill throughput declined 10% to 45 million tonnes from 2005 as a result of processing harder ore from the Valley and Highmont pits. Copper production in 2006 was 171,300 tonnes (378 million pounds), and molybdenum production was 4.1 million pounds. The east Highmont pit was reactivated in October 2005 and provided six million tonnes of ore during 2006. Capital expenditures of $80 million were primarily for mine equipment and capitalized deferred stripping costs. A new fi ve-year agreement was concluded with the United Steelworkers of America, which will expire on September 30, 2011.
Operating profi t increased to a record $1.0 billion in 2006 from $613 million in 2005 due mainly to signifi cantly higher copper prices.
Estimated production in 2007 is 141,700 tonnes (312 million pounds) of copper and 4.4 million pounds of molybdenum. The decline in copper production is a result of a combination of reduced mill throughput due to harder ore and reduced copper grades, as well as higher stripping requirement to develop the Valley pit east wall. Capital expenditures for 2007 are planned at $170 million, including $60 million for replacement of mine production equipment, $20 million for the completion of the Valley pit crusher and conveyor relocation, $30 million for sustaining capital and $60 million for capitalized development stripping.
Highland Valley Copper Mine, British Columbia, Canada
100% 2006 2005 2004
Tonnes milled (000’s) 45,356 50,666 50,623Copper grade (%) 0.412 0.398 0.384Copper recovery (%) 91.5 88.8 87.7Copper production (000’s tonnes) 171.3 179.0 170.3Copper sales (000’s tonnes) 185.2 185.8 156.1Molybdenum production (million pounds) 4.1 6.3 10.7Molybdenum sales (million pounds) 3.9 6.9 10.8Capital expenditures ($ millions) 80 14 4Operating profi t ($ millions) (Note) 1,019 613 431
Note: Commencing March 1, 2004, the Company increased its interest to 97.5% and consolidated 100% of the mine’s operating profi t with a 2.5% minority interest.
Aerial view of Highland Valley Copper mine with the Valley Pit in the foreground.
Steve Aura, mill service utility operator.
Teck Cominco Limited
20
Management’s Discussion and Analysis
Following months of extensive study, we have decided to extend the mine life of Highland Valley Copper by an additional six years to 2019. The new mine plan will require a push-back of the west wall of the Valley pit to produce an average of 125,000 tonnes of copper per year after 2013. Life of mine copper and molybdenum grades are expected to decline by approximately 10% as a result of the inclusion of lower grade ore in the mine plan. Total capital costs of the project are estimated at $300 million, including $130 million for capital equipment and the balance in pre-production stripping over the period of 2009 through 2013. Approximately $50 million of mobile mining equipment will be ordered in 2007 to permit waste stripping to commence in 2009.
Our feasibility study to determine the viability of the construction of a new CESL hydrometallurgical refi nery to process Highland Valley concentrates was inconclusive. The principle advantages of the CESL process, which include the effi cient, environmentally friendly treatment of lower grade, higher impurity concentrates, are less relevant in the treatment of the readily marketable, high grade, clean concentrates that are produced at Highland Valley. We will continue to evaluate the potential for accessing other, better suited feed sources in the region that could improve the overall economics and justify the construction of a new refi nery.
$1.0 billion in operating profi t —a record in 2006 from Highland Valley Copper.
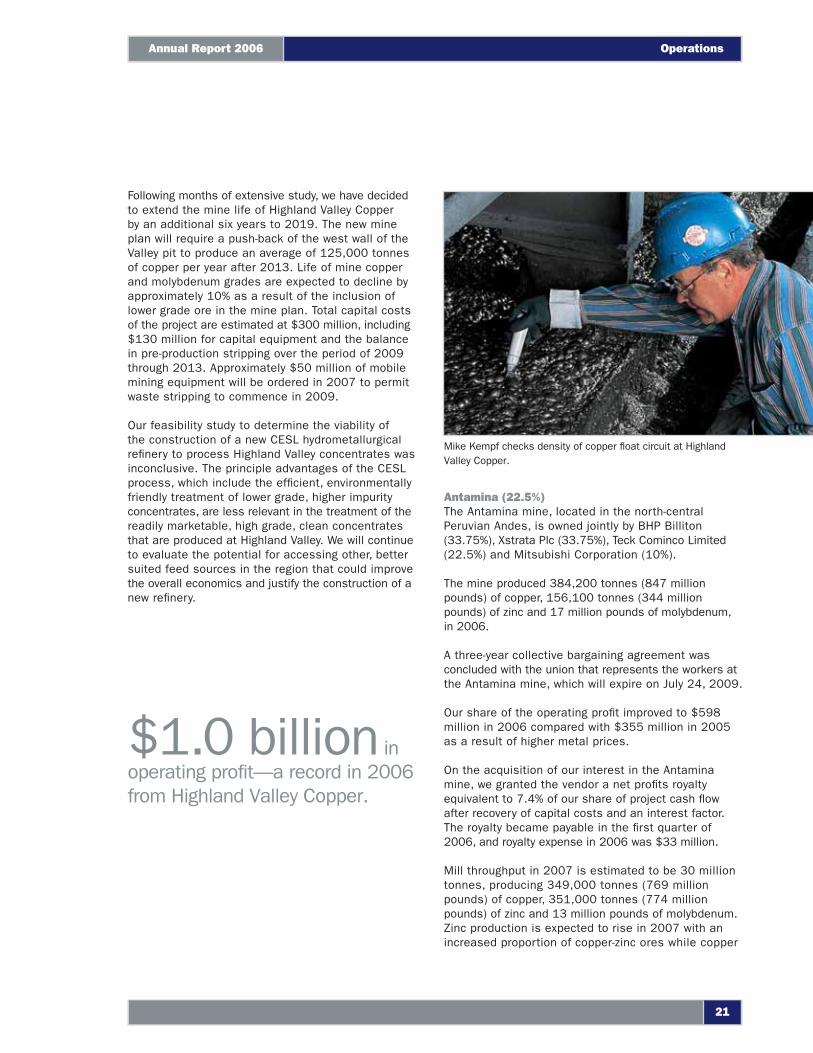
Mike Kempf checks density of copper fl oat circuit at Highland Valley Copper.
Antamina (22.5%)The Antamina mine, located in the north-central Peruvian Andes, is owned jointly by BHP Billiton (33.75%), Xstrata Plc (33.75%), Teck Cominco Limited (22.5%) and Mitsubishi Corporation (10%).
The mine produced 384,200 tonnes (847 million pounds) of copper, 156,100 tonnes (344 million pounds) of zinc and 17 million pounds of molybdenum, in 2006.
A three-year collective bargaining agreement was concluded with the union that represents the workers at the Antamina mine, which will expire on July 24, 2009.
Our share of the operating profi t improved to $598 million in 2006 compared with $355 million in 2005 as a result of higher metal prices.
On the acquisition of our interest in the Antamina mine, we granted the vendor a net profi ts royalty equivalent to 7.4% of our share of project cash fl ow after recovery of capital costs and an interest factor. The royalty became payable in the fi rst quarter of 2006, and royalty expense in 2006 was $33 million.
Mill throughput in 2007 is estimated to be 30 million tonnes, producing 349,000 tonnes (769 million pounds) of copper, 351,000 tonnes (774 million pounds) of zinc and 13 million pounds of molybdenum. Zinc production is expected to rise in 2007 with an increased proportion of copper-zinc ores while copper
21
Annual Report 2006 Operations
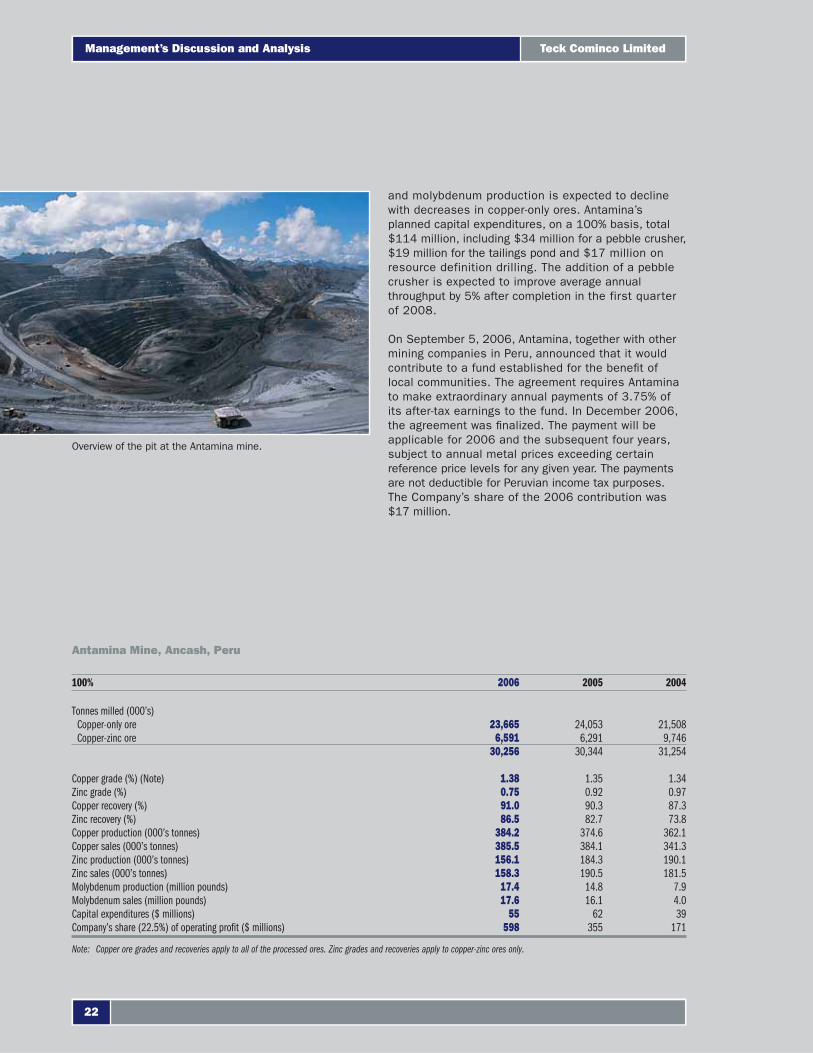
and molybdenum production is expected to decline with decreases in copper-only ores. Antamina’s planned capital expenditures, on a 100% basis, total $114 million, including $34 million for a pebble crusher, $19 million for the tailings pond and $17 million on resource definition drilling. The addition of a pebble crusher is expected to improve average annual throughput by 5% after completion in the first quarter of 2008.
On September 5, 2006, Antamina, together with other mining companies in Peru, announced that it would contribute to a fund established for the benefi t of local communities. The agreement requires Antamina to make extraordinary annual payments of 3.75% of its after-tax earnings to the fund. In December 2006, the agreement was fi nalized. The payment will be applicable for 2006 and the subsequent four years, subject to annual metal prices exceeding certain reference price levels for any given year. The payments are not deductible for Peruvian income tax purposes. The Company’s share of the 2006 contribution was $17 million.
Overview of the pit at the Antamina mine.
Antamina Mine, Ancash, Peru
100% 2006 2005 2004
Tonnes milled (000’s)Copper-only ore 23,665 24,053 21,508Copper-zinc ore 6,591 6,291 9,746
30,256 30,344 31,254
Copper grade (%) (Note) 1.38 1.35 1.34Zinc grade (%) 0.75 0.92 0.97Copper recovery (%) 91.0 90.3 87.3Zinc recovery (%) 86.5 82.7 73.8Copper production (000’s tonnes) 384.2 374.6 362.1Copper sales (000’s tonnes) 385.5 384.1 341.3Zinc production (000’s tonnes) 156.1 184.3 190.1Zinc sales (000’s tonnes) 158.3 190.5 181.5Molybdenum production (million pounds) 17.4 14.8 7.9Molybdenum sales (million pounds) 17.6 16.1 4.0Capital expenditures ($ millions) 55 62 39Company’s share (22.5%) of operating profi t ($ millions) 598 355 171
Note: Copper ore grades and recoveries apply to all of the processed ores. Zinc grades and recoveries apply to copper-zinc ores only.
Teck Cominco Limited
22
Management’s Discussion and Analysis
Gold
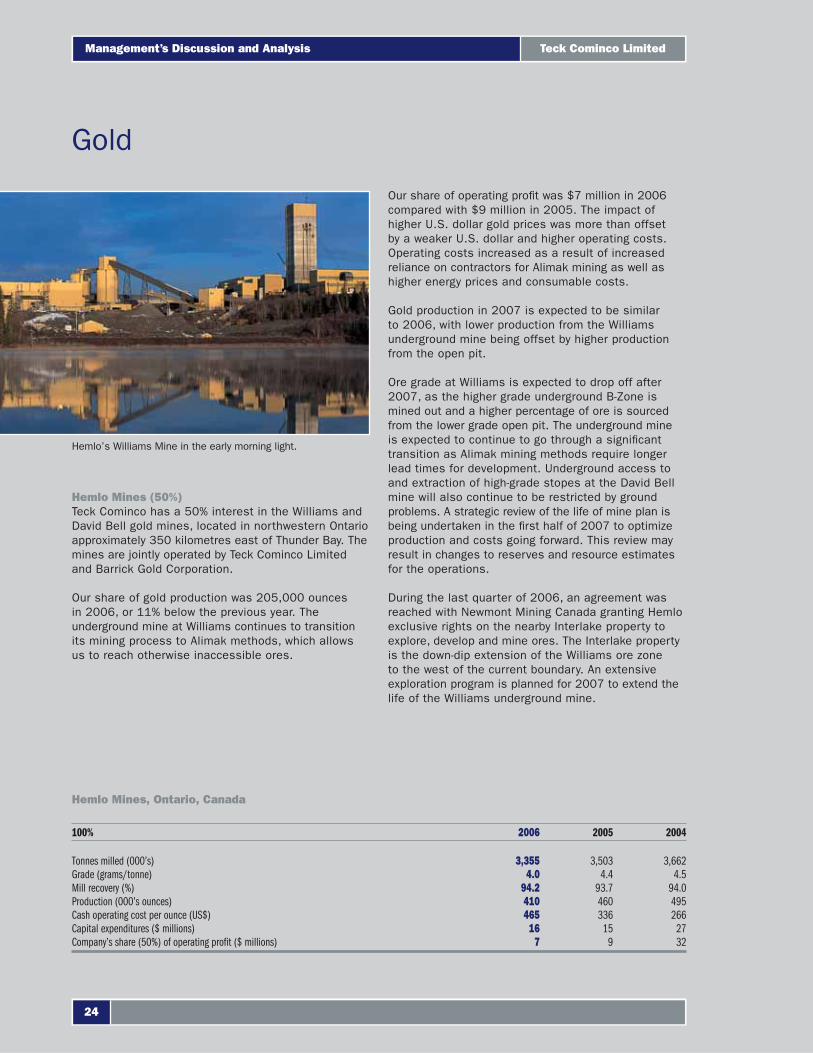
Hemlo Mines (50%)Teck Cominco has a 50% interest in the Williams and David Bell gold mines, located in northwestern Ontario approximately 350 kilometres east of Thunder Bay. The mines are jointly operated by Teck Cominco Limited and Barrick Gold Corporation.
Our share of gold production was 205,000 ounces in 2006, or 11% below the previous year. The underground mine at Williams continues to transition its mining process to Alimak methods, which allows us to reach otherwise inaccessible ores.
Our share of operating profi t was $7 million in 2006 compared with $9 million in 2005. The impact of higher U.S. dollar gold prices was more than offset by a weaker U.S. dollar and higher operating costs. Operating costs increased as a result of increased reliance on contractors for Alimak mining as well as higher energy prices and consumable costs.
Gold production in 2007 is expected to be similar to 2006, with lower production from the Williams underground mine being offset by higher production from the open pit.
Ore grade at Williams is expected to drop off after 2007, as the higher grade underground B-Zone is mined out and a higher percentage of ore is sourced from the lower grade open pit. The underground mine is expected to continue to go through a signifi cant transition as Alimak mining methods require longer lead times for development. Underground access to and extraction of high-grade stopes at the David Bell mine will also continue to be restricted by ground problems. A strategic review of the life of mine plan is being undertaken in the fi rst half of 2007 to optimize production and costs going forward. This review may result in changes to reserves and resource estimates for the operations.
During the last quarter of 2006, an agreement was reached with Newmont Mining Canada granting Hemlo exclusive rights on the nearby Interlake property to explore, develop and mine ores. The Interlake property is the down-dip extension of the Williams ore zone to the west of the current boundary. An extensive exploration program is planned for 2007 to extend the life of the Williams underground mine.
Hemlo Mines, Ontario, Canada
100% 2006 2005 2004
Tonnes milled (000’s) 3,355 3,503 3,662Grade (grams/tonne) 4.0 4.4 4.5Mill recovery (%) 94.2 93.7 94.0Production (000’s ounces) 410 460 495Cash operating cost per ounce (US$) 465 336 266Capital expenditures ($ millions) 16 15 27Company’s share (50%) of operating profi t ($ millions) 7 9 32
Hemlo’s Williams Mine in the early morning light.
Teck Cominco Limited
24
Management’s Discussion and Analysis

Pogo (40%)The Pogo gold mine is located 145 kilometres southeast of Fairbanks, Alaska. It is a joint venture with Sumitomo Metal Mining Co. Ltd. (51%) and Sumitomo Corporation (9%). Teck Cominco Limited has a 40% interest in the mine and is the operator.
Construction of the Pogo mine was completed in the fi rst quarter of 2006, and the installation of the underground ore conveying system was completed in the second quarter with total construction cost of US$350 million. The Pogo mine commenced operations in January, with the fi rst gold bar poured on February 12, 2006.
Mill throughput did not reach design capacity in 2006 as originally planned as it was limited by tailings fi ltration capacity and bottlenecks in the paste backfi ll system. When operating, the overall plant was processing ore at 70% of design capacity during the last half of 2006. The mill grinding and fl otation circuits capability was confi rmed as the mill operated at design capacity of 2,500 tonnes per day for short periods of time.
A third fi lter press was installed in the latter part of 2006 to improve fi ltration capacity and was commissioned in January 2007. Modifi cations to the fi ltered tailings handling system to improve paste backfi lling will be completed in the fi rst quarter of 2007. These two projects are estimated to cost an additional US$21 million.
On October 19, a construction accident severely damaged electrical systems at the mine site, resulting in a total loss of electrical power. Maintenance activities and construction projects recommenced on October 22, and underground mining resumed on October 28. Mill operations resumed when line power was restored in mid-December. There was a stockpile of 99,000 tonnes of ore on surface by the end of the year.
Commercial production for accounting purposes is expected to commence in the second quarter of 2007 following the completion of the fi lter plant projects. Full production is anticipated by May 2007, and gold production in 2007 is scheduled to be 340,000 ounces. Annual gold production is expected to be 350,000 to 450,000 ounces over the 10-year life of the project.
The surface exploration program completed 37,048 feet of drilling over a three-month period in 2006. The program focused on advancing previously discovered quartz veins and drill testing early stage targets. Information collected from the program in 2006 will be used to defi ne the 2007 program.
Pogo gold production is scheduled to be 340,000
ounces in 2007.
Neal Keithley, jumbo drill operator at the Pogo mine.
25
Annual Report 2006 Operations
Coal
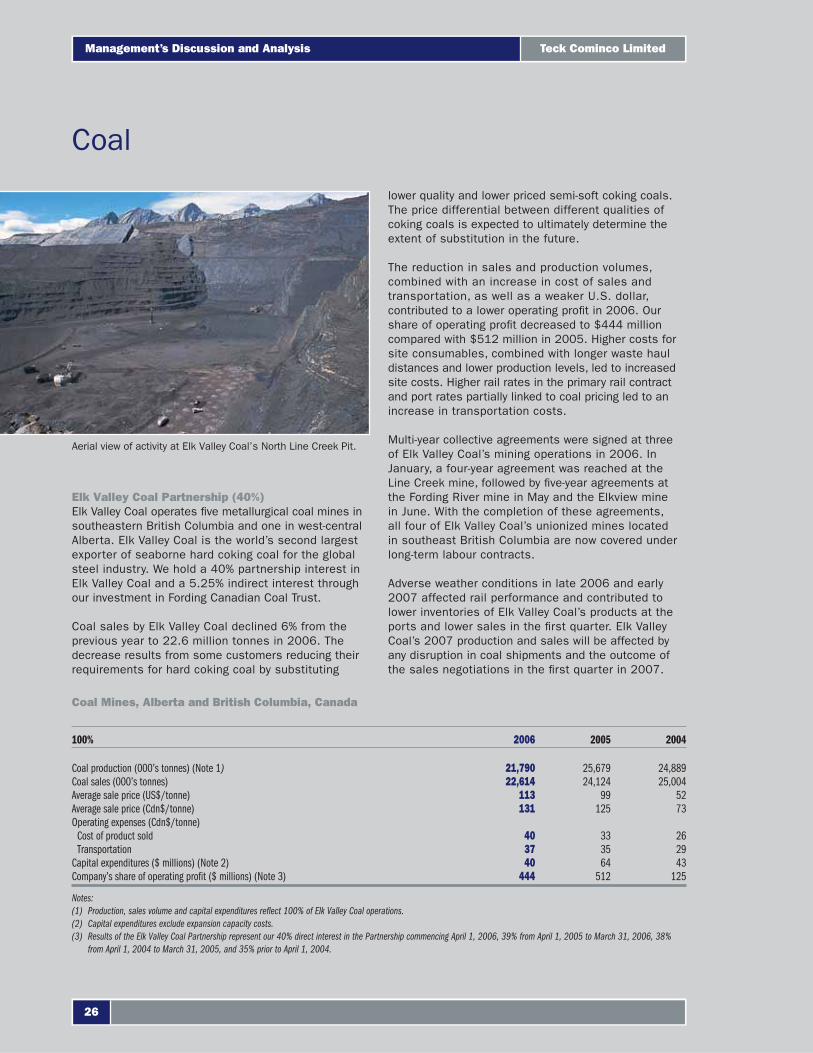
Elk Valley Coal Partnership (40%)Elk Valley Coal operates fi ve metallurgical coal mines in southeastern British Columbia and one in west-central Alberta. Elk Valley Coal is the world’s second largest exporter of seaborne hard coking coal for the global steel industry. We hold a 40% partnership interest in Elk Valley Coal and a 5.25% indirect interest through our investment in Fording Canadian Coal Trust.
Coal sales by Elk Valley Coal declined 6% from the previous year to 22.6 million tonnes in 2006. The decrease results from some customers reducing their requirements for hard coking coal by substituting
lower quality and lower priced semi-soft coking coals. The price differential between different qualities of coking coals is expected to ultimately determine the extent of substitution in the future.
The reduction in sales and production volumes, combined with an increase in cost of sales and transportation, as well as a weaker U.S. dollar, contributed to a lower operating profi t in 2006. Our share of operating profi t decreased to $444 million compared with $512 million in 2005. Higher costs for site consumables, combined with longer waste haul distances and lower production levels, led to increased site costs. Higher rail rates in the primary rail contract and port rates partially linked to coal pricing led to an increase in transportation costs.
Multi-year collective agreements were signed at three of Elk Valley Coal’s mining operations in 2006. In January, a four-year agreement was reached at the Line Creek mine, followed by fi ve-year agreements at the Fording River mine in May and the Elkview mine in June. With the completion of these agreements, all four of Elk Valley Coal’s unionized mines located in southeast British Columbia are now covered under long-term labour contracts.
Adverse weather conditions in late 2006 and early 2007 affected rail performance and contributed to lower inventories of Elk Valley Coal’s products at the ports and lower sales in the fi rst quarter. Elk Valley Coal’s 2007 production and sales will be affected by any disruption in coal shipments and the outcome of the sales negotiations in the fi rst quarter in 2007.
Coal Mines, Alberta and British Columbia, Canada
100% 2006 2005 2004
Coal production (000’s tonnes) (Note 1) 21,790 25,679 24,889Coal sales (000’s tonnes) 22,614 24,124 25,004Average sale price (US$/tonne) 113 99 52Average sale price (Cdn$/tonne) 131 125 73Operating expenses (Cdn$/tonne)
Cost of product sold 40 33 26Transportation 37 35 29
Capital expenditures ($ millions) (Note 2) 40 64 43Company’s share of operating profi t ($ millions) (Note 3) 444 512 125
Notes:(1) Production, sales volume and capital expenditures refl ect 100% of Elk Valley Coal operations.(2) Capital expenditures exclude expansion capacity costs.(3) Results of the Elk Valley Coal Partnership represent our 40% direct interest in the Partnership commencing April 1, 2006, 39% from April 1, 2005 to March 31, 2006, 38%
from April 1, 2004 to March 31, 2005, and 35% prior to April 1, 2004.
Aerial view of activity at Elk Valley Coal’s North Line Creek Pit.
Teck Cominco Limited
26
Management’s Discussion and Analysis
Oil Sands
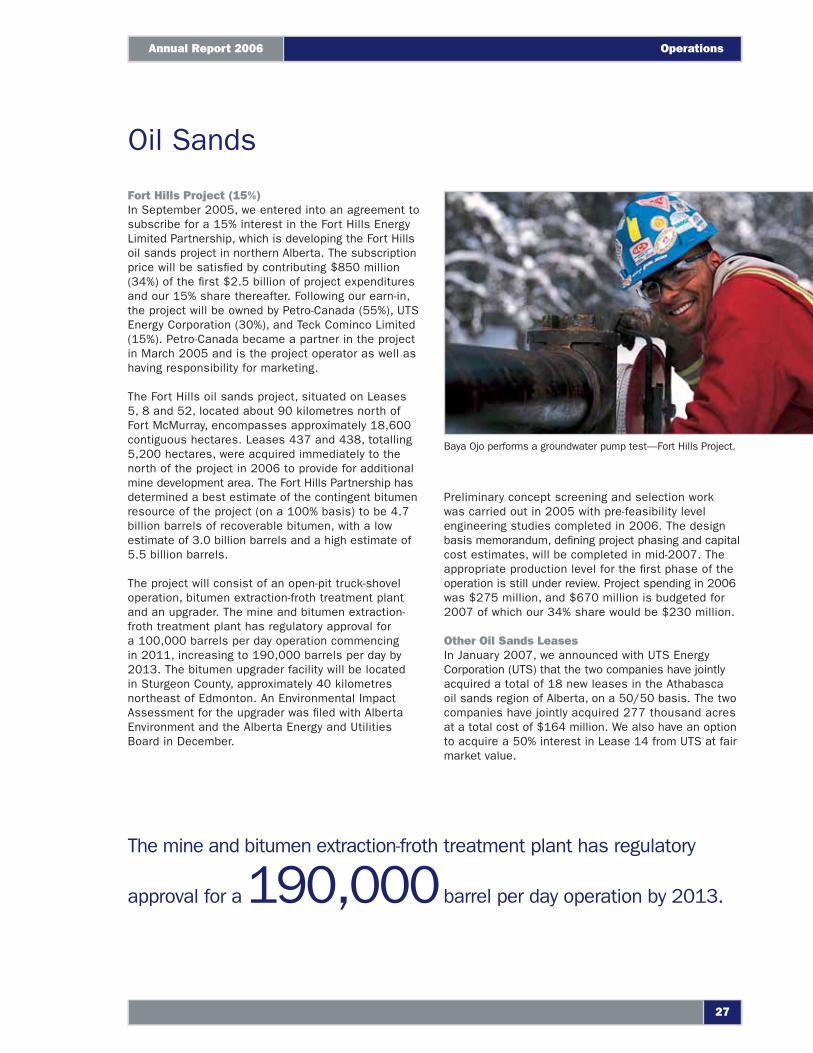
Fort Hills Project (15%)In September 2005, we entered into an agreement to subscribe for a 15% interest in the Fort Hills Energy Limited Partnership, which is developing the Fort Hills oil sands project in northern Alberta. The subscription price will be satisfi ed by contributing $850 million (34%) of the fi rst $2.5 billion of project expenditures and our 15% share thereafter. Following our earn-in, the project will be owned by Petro-Canada (55%), UTS Energy Corporation (30%), and Teck Cominco Limited (15%). Petro-Canada became a partner in the project in March 2005 and is the project operator as well as having responsibility for marketing.
The Fort Hills oil sands project, situated on Leases 5, 8 and 52, located about 90 kilometres north of Fort McMurray, encompasses approximately 18,600 contiguous hectares. Leases 437 and 438, totalling 5,200 hectares, were acquired immediately to the north of the project in 2006 to provide for additional mine development area. The Fort Hills Partnership has determined a best estimate of the contingent bitumen resource of the project (on a 100% basis) to be 4.7 billion barrels of recoverable bitumen, with a low estimate of 3.0 billion barrels and a high estimate of 5.5 billion barrels.
The project will consist of an open-pit truck-shovel operation, bitumen extraction-froth treatment plant and an upgrader. The mine and bitumen extraction-froth treatment plant has regulatory approval for a 100,000 barrels per day operation commencing in 2011, increasing to 190,000 barrels per day by 2013. The bitumen upgrader facility will be located in Sturgeon County, approximately 40 kilometres northeast of Edmonton. An Environmental Impact Assessment for the upgrader was fi led with Alberta Environment and the Alberta Energy and Utilities Board in December.
Preliminary concept screening and selection work was carried out in 2005 with pre-feasibility level engineering studies completed in 2006. The design basis memorandum, defi ning project phasing and capital cost estimates, will be completed in mid-2007. The appropriate production level for the fi rst phase of the operation is still under review. Project spending in 2006 was $275 million, and $670 million is budgeted for 2007 of which our 34% share would be $230 million.
Other Oil Sands LeasesIn January 2007, we announced with UTS Energy Corporation (UTS) that the two companies have jointly acquired a total of 18 new leases in the Athabasca oil sands region of Alberta, on a 50/50 basis. The two companies have jointly acquired 277 thousand acres at a total cost of $164 million. We also have an option to acquire a 50% interest in Lease 14 from UTS at fair market value.
The mine and bitumen extraction-froth treatment plant has regulatory
approval for a 190,000 barrel per day operation by 2013.
Baya Ojo performs a groundwater pump test—Fort Hills Project.
27
Annual Report 2006 Operations
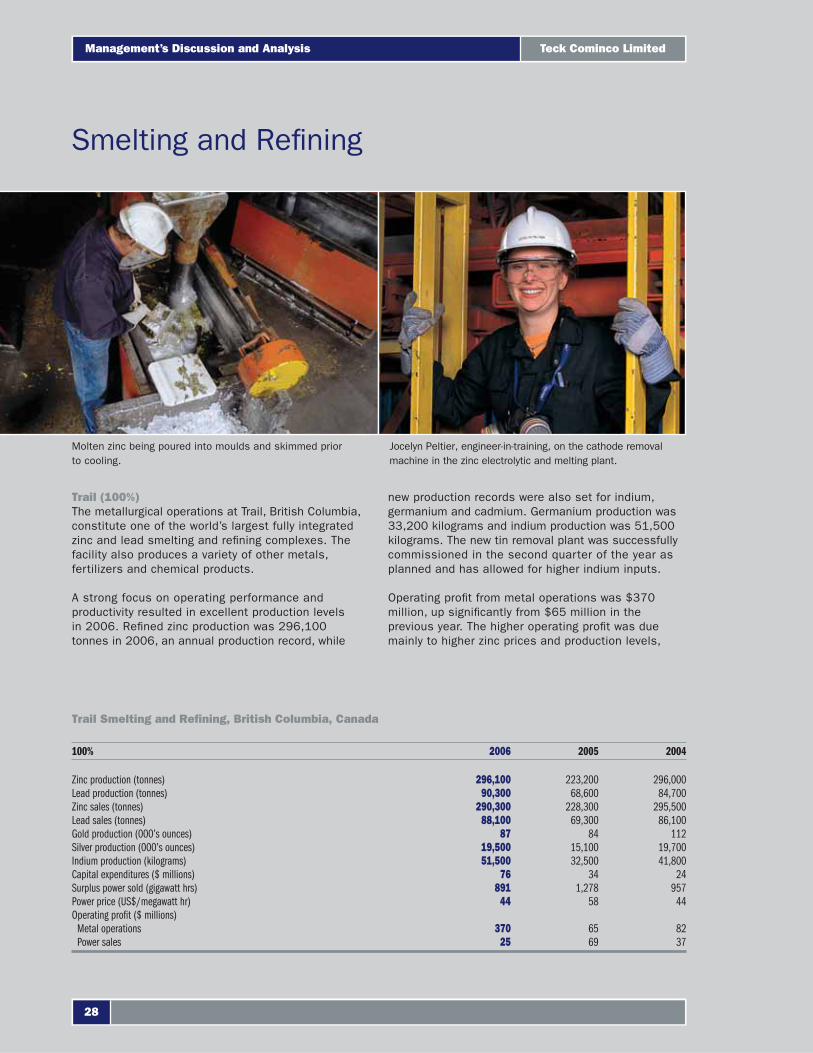
Trail (100%)The metallurgical operations at Trail, British Columbia, constitute one of the world’s largest fully integrated zinc and lead smelting and refi ning complexes. The facility also produces a variety of other metals, fertilizers and chemical products.
A strong focus on operating performance and productivity resulted in excellent production levels in 2006. Refi ned zinc production was 296,100 tonnes in 2006, an annual production record, while
new production records were also set for indium, germanium and cadmium. Germanium production was 33,200 kilograms and indium production was 51,500 kilograms. The new tin removal plant was successfully commissioned in the second quarter of the year as planned and has allowed for higher indium inputs.
Operating profi t from metal operations was $370 million, up signifi cantly from $65 million in the previous year. The higher operating profi t was due mainly to higher zinc prices and production levels,
Trail Smelting and Refi ning, British Columbia, Canada
100% 2006 2005 2004
Zinc production (tonnes) 296,100 223,200 296,000Lead production (tonnes) 90,300 68,600 84,700Zinc sales (tonnes) 290,300 228,300 295,500Lead sales (tonnes) 88,100 69,300 86,100Gold production (000’s ounces) 87 84 112Silver production (000’s ounces) 19,500 15,100 19,700Indium production (kilograms) 51,500 32,500 41,800Capital expenditures ($ millions) 76 34 24Surplus power sold (gigawatt hrs) 891 1,278 957Power price (US$/megawatt hr) 44 58 44Operating profi t ($ millions)
Metal operations 370 65 82Power sales 25 69 37
Smelting and Refi ning
Molten zinc being poured into moulds and skimmed prior to cooling.
Jocelyn Peltier, engineer-in-training, on the cathode removal machine in the zinc electrolytic and melting plant.
Teck Cominco Limited
28
Management’s Discussion and Analysis
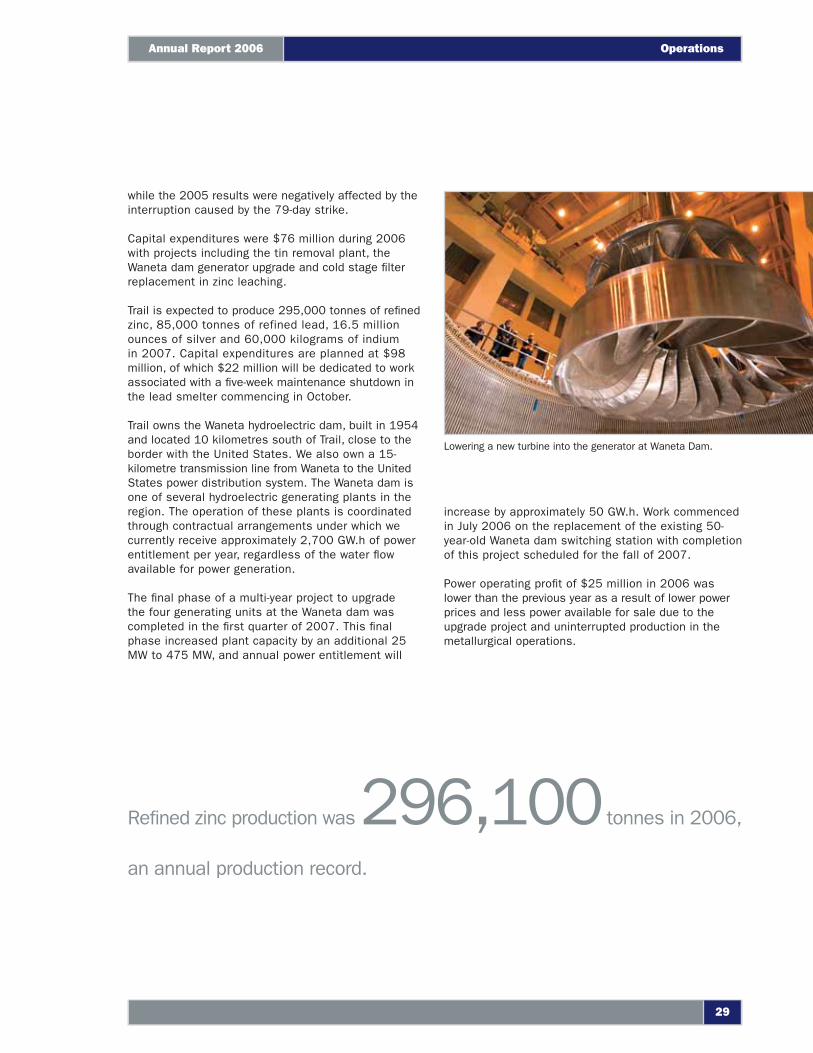
increase by approximately 50 GW.h. Work commenced in July 2006 on the replacement of the existing 50-year-old Waneta dam switching station with completion of this project scheduled for the fall of 2007.
Power operating profi t of $25 million in 2006 was lower than the previous year as a result of lower power prices and less power available for sale due to the upgrade project and uninterrupted production in the metallurgical operations.
while the 2005 results were negatively affected by the interruption caused by the 79-day strike.
Capital expenditures were $76 million during 2006 with projects including the tin removal plant, the Waneta dam generator upgrade and cold stage fi lter replacement in zinc leaching.
Trail is expected to produce 295,000 tonnes of refi ned zinc, 85,000 tonnes of refined lead, 16.5 million ounces of silver and 60,000 kilograms of indium in 2007. Capital expenditures are planned at $98 million, of which $22 million will be dedicated to work associated with a fi ve-week maintenance shutdown in the lead smelter commencing in October.
Trail owns the Waneta hydroelectric dam, built in 1954 and located 10 kilometres south of Trail, close to the border with the United States. We also own a 15-kilometre transmission line from Waneta to the United States power distribution system. The Waneta dam is one of several hydroelectric generating plants in the region. The operation of these plants is coordinated through contractual arrangements under which we currently receive approximately 2,700 GW.h of power entitlement per year, regardless of the water fl ow available for power generation.
The fi nal phase of a multi-year project to upgrade the four generating units at the Waneta dam was completed in the fi rst quarter of 2007. This fi nal phase increased plant capacity by an additional 25 MW to 475 MW, and annual power entitlement will
Refi ned zinc production was 296,100 tonnes in 2006,
an annual production record.
Lowering a new turbine into the generator at Waneta Dam.
29
Annual Report 2006 Operations
This ismy Technology
What goes on at a mine site—where large, heavy equipment digs, blasts, and grinds at the surface of the earth—is a part of a carefully controlled, technologically advanced discipline, operating with the highest possible effi ciency and safety. At Teck Cominco, we employ sophisticated extraction technologies and innovative mining/metallurgical processes, and we are in a continual search for new technologies to extract mineral resources and maximize the utilization of our products, while minimizing our impact on the environment.
Mining is essential to our high-tech society. Imagine a world without copper for wiring—or gold for high-effi ciency connectors and coatings—or zinc for batteries. Recently, indium and germanium—elements which are recovered during zinc processing—have gained importance, as essential elements in the manufacture of fl at panel displays.
This is More than a Rock

Sam Boateng joined Teck Cominco immediately after graduating from the University of British Columbia with a Bachelor’s degree in Science. Previous summer employment in the Zinc Electrolytic Plant in Trail had given Sam the experience and a fascination with the science of mineral processing. As a process operator in the CESL Copper Pilot Plant, he has made valuable contributions to CESL’s copper and gold processes.
Commodities in GeneralOur principal products are zinc, copper and metallurgical coal, accounting for 34%, 29% and 18% of revenues respectively in 2006. Molybdenum is a signifi cant by-product of the Company’s copper operations and accounted for 3% of revenue in 2006. Other products include gold, silver, lead, indium and germanium. Lead concentrate sales represented 3% of our revenues in 2006 and are included in the revenues of the zinc mines.
Demand for all our major products, with the exception of coal, increased in 2006, with strong global economic growth led by China. As the accompanying charts illustrate, inventories for copper and zinc have declined as prices have strengthened.
If current trends in global economic conditions continue, we expect that prices of our principal products will remain strong over the medium term, with periods of price volatility. Our assessment of market dynamics suggests that economic growth and production capacity in China will continue to be a major factor infl uencing global supply and demand for commodities.
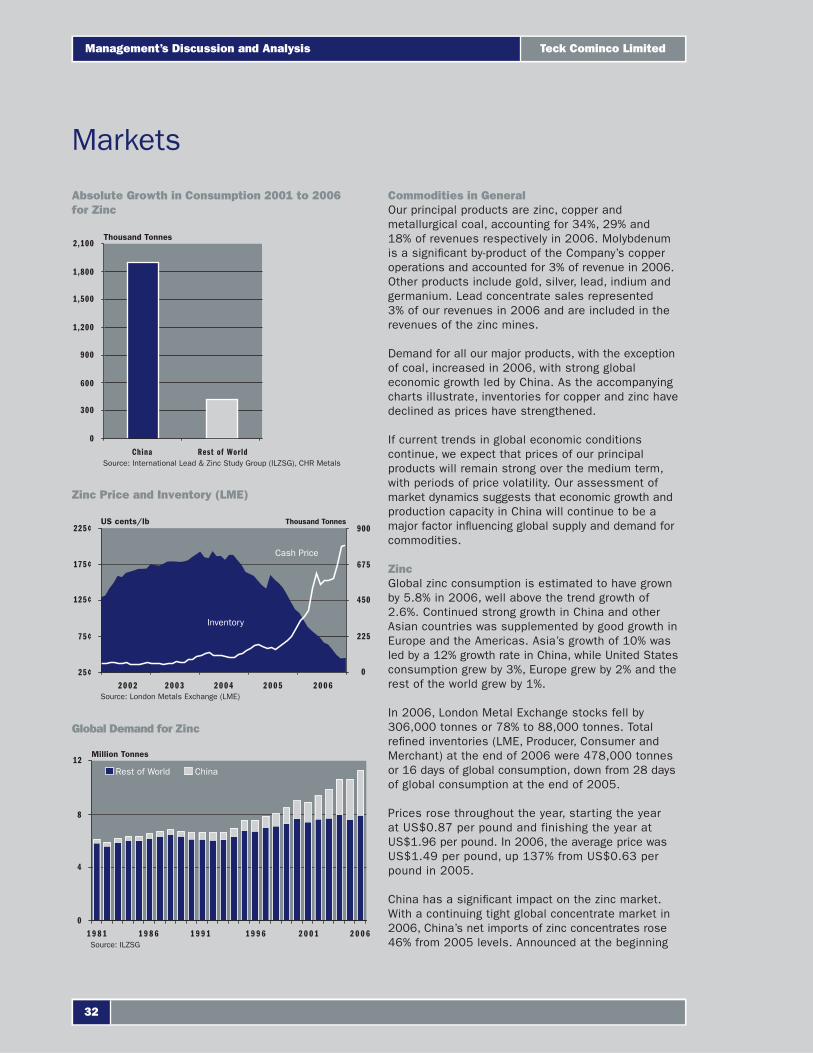
ZincGlobal zinc consumption is estimated to have grown by 5.8% in 2006, well above the trend growth of 2.6%. Continued strong growth in China and other Asian countries was supplemented by good growth in Europe and the Americas. Asia’s growth of 10% was led by a 12% growth rate in China, while United States consumption grew by 3%, Europe grew by 2% and the rest of the world grew by 1%.
In 2006, London Metal Exchange stocks fell by 306,000 tonnes or 78% to 88,000 tonnes. Total refi ned inventories (LME, Producer, Consumer and Merchant) at the end of 2006 were 478,000 tonnes or 16 days of global consumption, down from 28 days of global consumption at the end of 2005.
Prices rose throughout the year, starting the year at US$0.87 per pound and finishing the year at US$1.96 per pound. In 2006, the average price was US$1.49 per pound, up 137% from US$0.63 per pound in 2005.
China has a signifi cant impact on the zinc market. With a continuing tight global concentrate market in 2006, China’s net imports of zinc concentrates rose 46% from 2005 levels. Announced at the beginning
Absolute Growth in Consumption 2001 to 2006 for Zinc
1,800
2,100
1,500
1,200
900
600
300
0
Thousand Tonnes
China Rest of WorldSource: International Lead & Zinc Study Group (ILZSG), CHR Metals
Zinc Price and Inventory (LME)
Source: London Metals Exchange (LME)
Thousand TonnesUS cents/lb
Inventory
0
900
675
450
225
225¢
175¢
125¢
75¢
25¢
5002400230022002 6002
Cash Price
Inventory
Global Demand for Zinc
4
0
8
21
600210026991199168911891Source: ILZSG
Million Tonnes
Rest of World China
Markets
Teck Cominco Limited
32
Management’s Discussion and Analysis
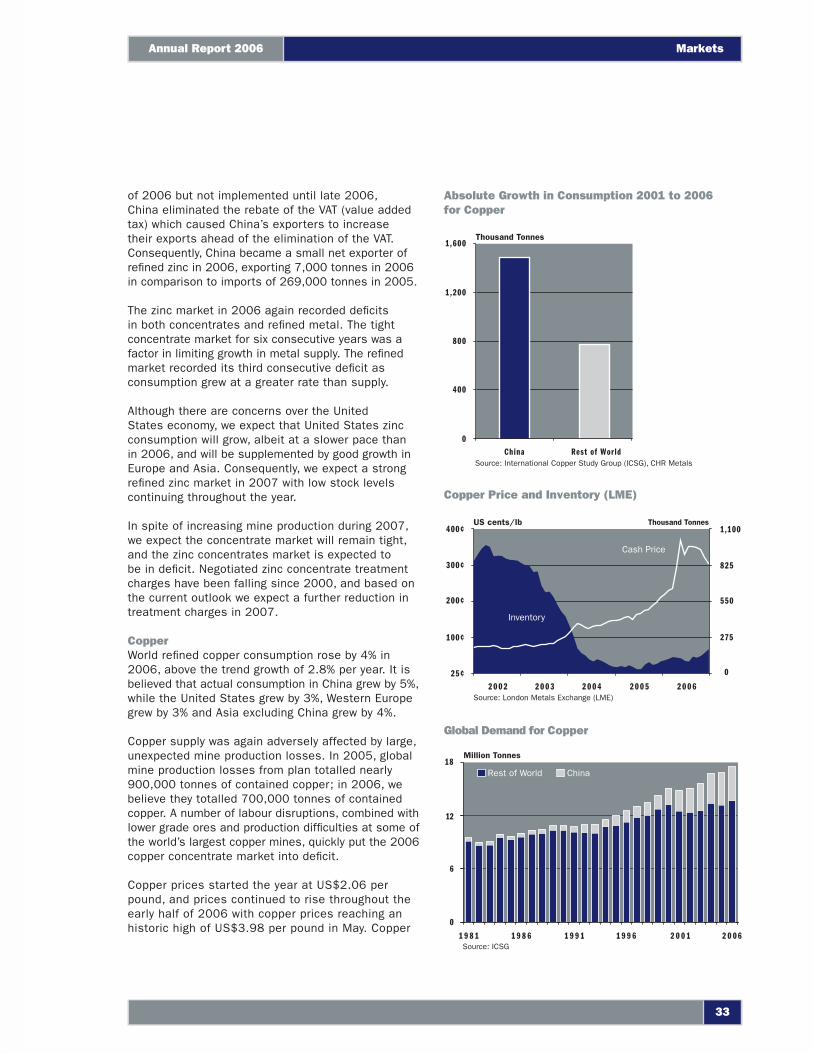
of 2006 but not implemented until late 2006, China eliminated the rebate of the VAT (value added tax) which caused China’s exporters to increase their exports ahead of the elimination of the VAT. Consequently, China became a small net exporter of refi ned zinc in 2006, exporting 7,000 tonnes in 2006 in comparison to imports of 269,000 tonnes in 2005.
The zinc market in 2006 again recorded defi cits in both concentrates and refi ned metal. The tight concentrate market for six consecutive years was a factor in limiting growth in metal supply. The refi ned market recorded its third consecutive defi cit as consumption grew at a greater rate than supply.
Although there are concerns over the United States economy, we expect that United States zinc consumption will grow, albeit at a slower pace than in 2006, and will be supplemented by good growth in Europe and Asia. Consequently, we expect a strong refi ned zinc market in 2007 with low stock levels continuing throughout the year.
In spite of increasing mine production during 2007, we expect the concentrate market will remain tight, and the zinc concentrates market is expected to be in defi cit. Negotiated zinc concentrate treatment charges have been falling since 2000, and based on the current outlook we expect a further reduction in treatment charges in 2007.
CopperWorld refi ned copper consumption rose by 4% in 2006, above the trend growth of 2.8% per year. It is believed that actual consumption in China grew by 5%, while the United States grew by 3%, Western Europe grew by 3% and Asia excluding China grew by 4%.
Copper supply was again adversely affected by large, unexpected mine production losses. In 2005, global mine production losses from plan totalled nearly 900,000 tonnes of contained copper; in 2006, we believe they totalled 700,000 tonnes of contained copper. A number of labour disruptions, combined with lower grade ores and production diffi culties at some of the world’s largest copper mines, quickly put the 2006 copper concentrate market into defi cit.
Copper prices started the year at US$2.06 per pound, and prices continued to rise throughout the early half of 2006 with copper prices reaching an historic high of US$3.98 per pound in May. Copper
Absolute Growth in Consumption 2001 to 2006 for Copper
1,600
1,200
800
400
0
Thousand Tonnes
China Rest of WorldSource: International Copper Study Group (ICSG), CHR Metals
Copper Price and Inventory (LME)
Source: London Metals Exchange (LME)
Thousand TonnesUS cents/lb
Cash Price
0
1,100
825
550
275
400¢
300¢
200¢
100¢
25¢60025002400230022002
Inventory
Global Demand for Copper
6
12
81
600210026991199168911891Source: ICSG
Million Tonnes
Rest of World China
0
33
MarketsAnnual Report 2006
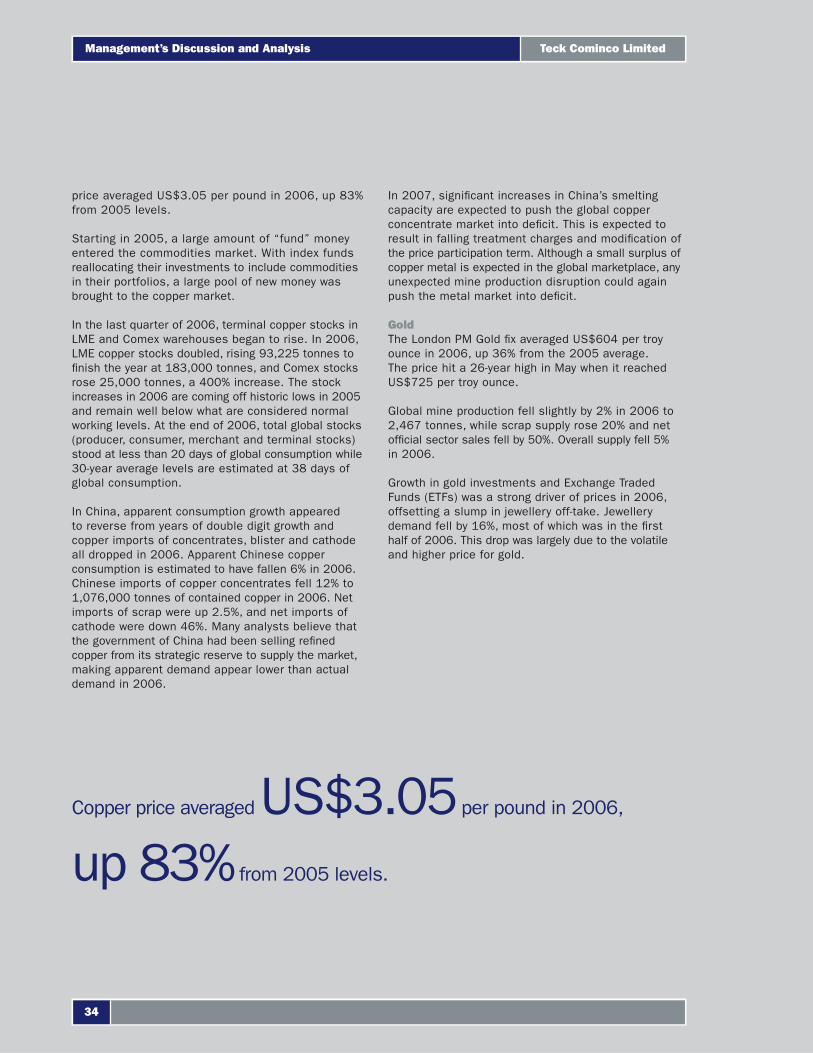
price averaged US$3.05 per pound in 2006, up 83% from 2005 levels.
Starting in 2005, a large amount of “fund” money entered the commodities market. With index funds reallocating their investments to include commodities in their portfolios, a large pool of new money was brought to the copper market.
In the last quarter of 2006, terminal copper stocks in LME and Comex warehouses began to rise. In 2006, LME copper stocks doubled, rising 93,225 tonnes to fi nish the year at 183,000 tonnes, and Comex stocks rose 25,000 tonnes, a 400% increase. The stock increases in 2006 are coming off historic lows in 2005 and remain well below what are considered normal working levels. At the end of 2006, total global stocks (producer, consumer, merchant and terminal stocks) stood at less than 20 days of global consumption while 30-year average levels are estimated at 38 days of global consumption.
In China, apparent consumption growth appeared to reverse from years of double digit growth and copper imports of concentrates, blister and cathode all dropped in 2006. Apparent Chinese copper consumption is estimated to have fallen 6% in 2006. Chinese imports of copper concentrates fell 12% to 1,076,000 tonnes of contained copper in 2006. Net imports of scrap were up 2.5%, and net imports of cathode were down 46%. Many analysts believe that the government of China had been selling refi ned copper from its strategic reserve to supply the market, making apparent demand appear lower than actual demand in 2006.
In 2007, signifi cant increases in China’s smelting capacity are expected to push the global copper concentrate market into defi cit. This is expected to result in falling treatment charges and modifi cation of the price participation term. Although a small surplus of copper metal is expected in the global marketplace, any unexpected mine production disruption could again push the metal market into defi cit.
GoldThe London PM Gold fi x averaged US$604 per troy ounce in 2006, up 36% from the 2005 average. The price hit a 26-year high in May when it reached US$725 per troy ounce.
Global mine production fell slightly by 2% in 2006 to 2,467 tonnes, while scrap supply rose 20% and net offi cial sector sales fell by 50%. Overall supply fell 5% in 2006.
Growth in gold investments and Exchange Traded Funds (ETFs) was a strong driver of prices in 2006, offsetting a slump in jewellery off-take. Jewellery demand fell by 16%, most of which was in the fi rst half of 2006. This drop was largely due to the volatile and higher price for gold.
Copper price averaged US$3.05 per pound in 2006,
up 83% from 2005 levels.
Teck Cominco Limited
34
Management’s Discussion and Analysis
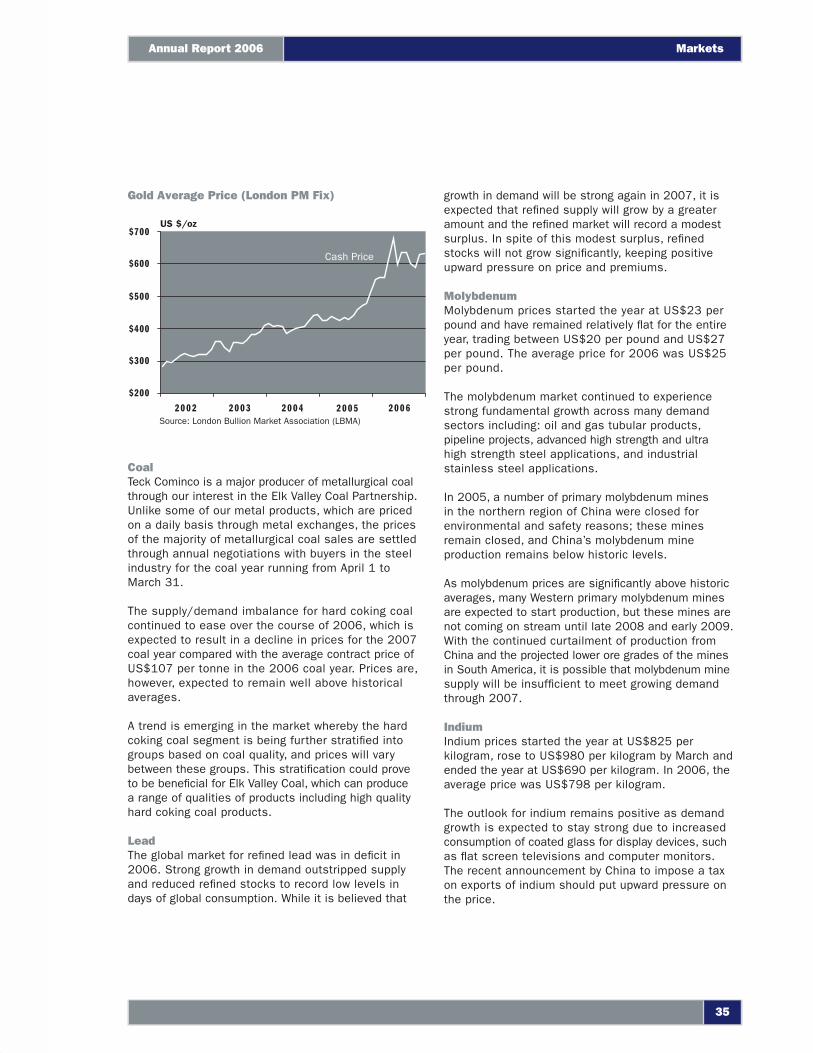
Gold Average Price (London PM Fix)
Source: London Bullion Market Association (LBMA)
US $/oz
Cash Price
$700
$600
$500
$400
$300
$200
60025002400230022002
CoalTeck Cominco is a major producer of metallurgical coal through our interest in the Elk Valley Coal Partnership. Unlike some of our metal products, which are priced on a daily basis through metal exchanges, the prices of the majority of metallurgical coal sales are settled through annual negotiations with buyers in the steel industry for the coal year running from April 1 to March 31.
The supply/demand imbalance for hard coking coal continued to ease over the course of 2006, which is expected to result in a decline in prices for the 2007 coal year compared with the average contract price of US$107 per tonne in the 2006 coal year. Prices are, however, expected to remain well above historical averages.
A trend is emerging in the market whereby the hard coking coal segment is being further stratifi ed into groups based on coal quality, and prices will vary between these groups. This stratifi cation could prove to be benefi cial for Elk Valley Coal, which can produce a range of qualities of products including high quality hard coking coal products.
LeadThe global market for refi ned lead was in defi cit in 2006. Strong growth in demand outstripped supply and reduced refi ned stocks to record low levels in days of global consumption. While it is believed that
growth in demand will be strong again in 2007, it is expected that refi ned supply will grow by a greater amount and the refi ned market will record a modest surplus. In spite of this modest surplus, refi ned stocks will not grow signifi cantly, keeping positive upward pressure on price and premiums.
MolybdenumMolybdenum prices started the year at US$23 per pound and have remained relatively fl at for the entire year, trading between US$20 per pound and US$27 per pound. The average price for 2006 was US$25 per pound.
The molybdenum market continued to experience strong fundamental growth across many demand sectors including: oil and gas tubular products, pipeline projects, advanced high strength and ultra high strength steel applications, and industrial stainless steel applications.
In 2005, a number of primary molybdenum mines in the northern region of China were closed for environmental and safety reasons; these mines remain closed, and China’s molybdenum mine production remains below historic levels.
As molybdenum prices are signifi cantly above historic averages, many Western primary molybdenum mines are expected to start production, but these mines are not coming on stream until late 2008 and early 2009. With the continued curtailment of production from China and the projected lower ore grades of the mines in South America, it is possible that molybdenum mine supply will be insuffi cient to meet growing demand through 2007.
IndiumIndium prices started the year at US$825 per kilogram, rose to US$980 per kilogram by March and ended the year at US$690 per kilogram. In 2006, the average price was US$798 per kilogram.
The outlook for indium remains positive as demand growth is expected to stay strong due to increased consumption of coated glass for display devices, such as fl at screen televisions and computer monitors. The recent announcement by China to impose a tax on exports of indium should put upward pressure on the price.
35
Annual Report 2006 Markets
This ismy Achievement
This was a year of record achievements for Teck Cominco. Record economic performance—record operating results—strong environmental performance—growth in the management team and throughout the company—and promising developments in our resource properties. The Company is on a strong foundation for continued success in the future.
This record of achievement is shared among every one of us, from head offi ce to mining operations, from R&D labs to the exploration teams in the fi eld.
This is More than a Rock

Rory Edson is a gold refiner at our Pogo operation and a committed community volunteer. He’s a captain of the Pogo Fire Team, a member of the Search and Rescue Squad, and, in his spare time, can usually be found in the great outdoors with his two sons.
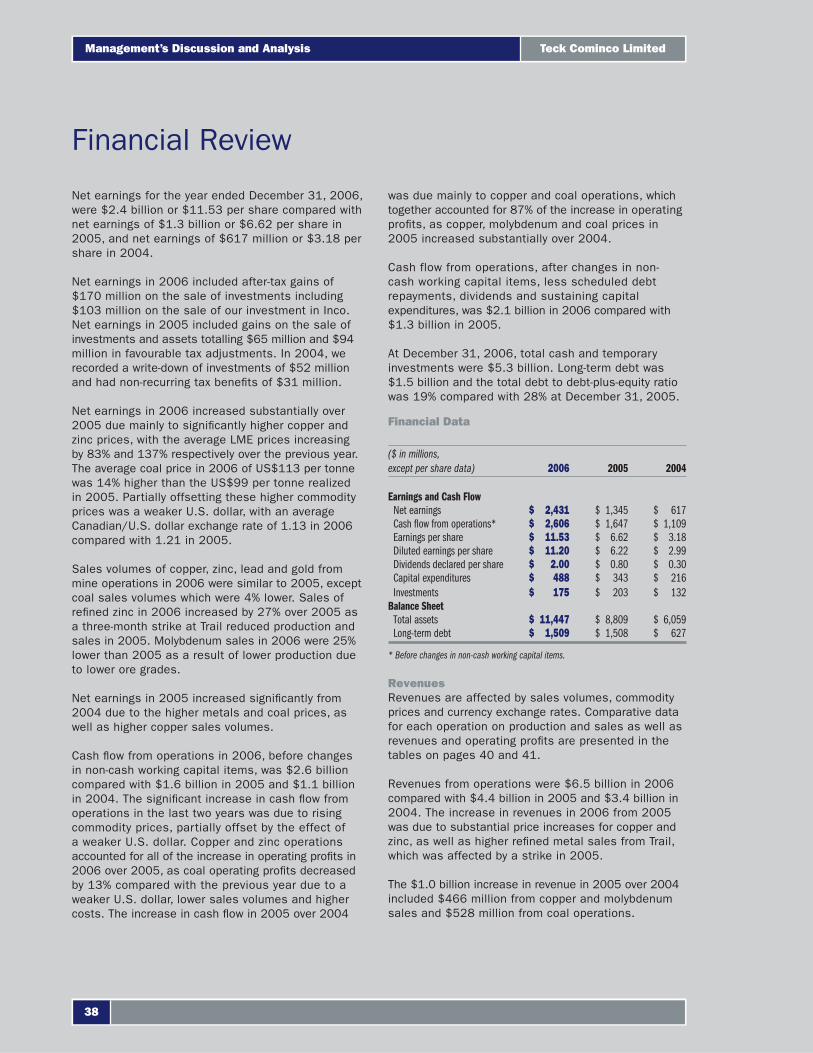
Financial Review
Net earnings for the year ended December 31, 2006, were $2.4 billion or $11.53 per share compared with net earnings of $1.3 billion or $6.62 per share in 2005, and net earnings of $617 million or $3.18 per share in 2004.
Net earnings in 2006 included after-tax gains of $170 million on the sale of investments including $103 million on the sale of our investment in Inco. Net earnings in 2005 included gains on the sale of investments and assets totalling $65 million and $94 million in favourable tax adjustments. In 2004, we recorded a write-down of investments of $52 million and had non-recurring tax benefi ts of $31 million.
Net earnings in 2006 increased substantially over 2005 due mainly to signifi cantly higher copper and zinc prices, with the average LME prices increasing by 83% and 137% respectively over the previous year. The average coal price in 2006 of US$113 per tonne was 14% higher than the US$99 per tonne realized in 2005. Partially offsetting these higher commodity prices was a weaker U.S. dollar, with an average Canadian/U.S. dollar exchange rate of 1.13 in 2006 compared with 1.21 in 2005.
Sales volumes of copper, zinc, lead and gold from mine operations in 2006 were similar to 2005, except coal sales volumes which were 4% lower. Sales of refi ned zinc in 2006 increased by 27% over 2005 as a three-month strike at Trail reduced production and sales in 2005. Molybdenum sales in 2006 were 25% lower than 2005 as a result of lower production due to lower ore grades.
Net earnings in 2005 increased signifi cantly from 2004 due to the higher metals and coal prices, as well as higher copper sales volumes.
Cash fl ow from operations in 2006, before changes in non-cash working capital items, was $2.6 billion compared with $1.6 billion in 2005 and $1.1 billion in 2004. The signifi cant increase in cash fl ow from operations in the last two years was due to rising commodity prices, partially offset by the effect of a weaker U.S. dollar. Copper and zinc operations accounted for all of the increase in operating profi ts in 2006 over 2005, as coal operating profi ts decreased by 13% compared with the previous year due to a weaker U.S. dollar, lower sales volumes and higher costs. The increase in cash fl ow in 2005 over 2004
was due mainly to copper and coal operations, which together accounted for 87% of the increase in operating profi ts, as copper, molybdenum and coal prices in 2005 increased substantially over 2004.
Cash flow from operations, after changes in non-cash working capital items, less scheduled debt repayments, dividends and sustaining capital expenditures, was $2.1 billion in 2006 compared with $1.3 billion in 2005.
At December 31, 2006, total cash and temporary investments were $5.3 billion. Long-term debt was $1.5 billion and the total debt to debt-plus-equity ratio was 19% compared with 28% at December 31, 2005.
Financial Data
($ in millions, except per share data) 2006 2005 2004
Earnings and Cash FlowNet earnings $ 2,431 $ 1,345 $ 617Cash fl ow from operations* $ 2,606 $ 1,647 $ 1,109Earnings per share $ 11.53 $ 6.62 $ 3.18Diluted earnings per share $ 11.20 $ 6.22 $ 2.99Dividends declared per share $ 2.00 $ 0.80 $ 0.30Capital expenditures $ 488 $ 343 $ 216Investments $ 175 $ 203 $ 132
Balance SheetTotal assets $ 11,447 $ 8,809 $ 6,059Long-term debt $ 1,509 $ 1,508 $ 627
* Before changes in non-cash working capital items.
RevenuesRevenues are affected by sales volumes, commodity prices and currency exchange rates. Comparative data for each operation on production and sales as well as revenues and operating profi ts are presented in the tables on pages 40 and 41.
Revenues from operations were $6.5 billion in 2006 compared with $4.4 billion in 2005 and $3.4 billion in 2004. The increase in revenues in 2006 from 2005 was due to substantial price increases for copper and zinc, as well as higher refi ned metal sales from Trail, which was affected by a strike in 2005.
The $1.0 billion increase in revenue in 2005 over 2004 included $466 million from copper and molybdenum sales and $528 million from coal operations.
Teck Cominco Limited
38
Management’s Discussion and Analysis
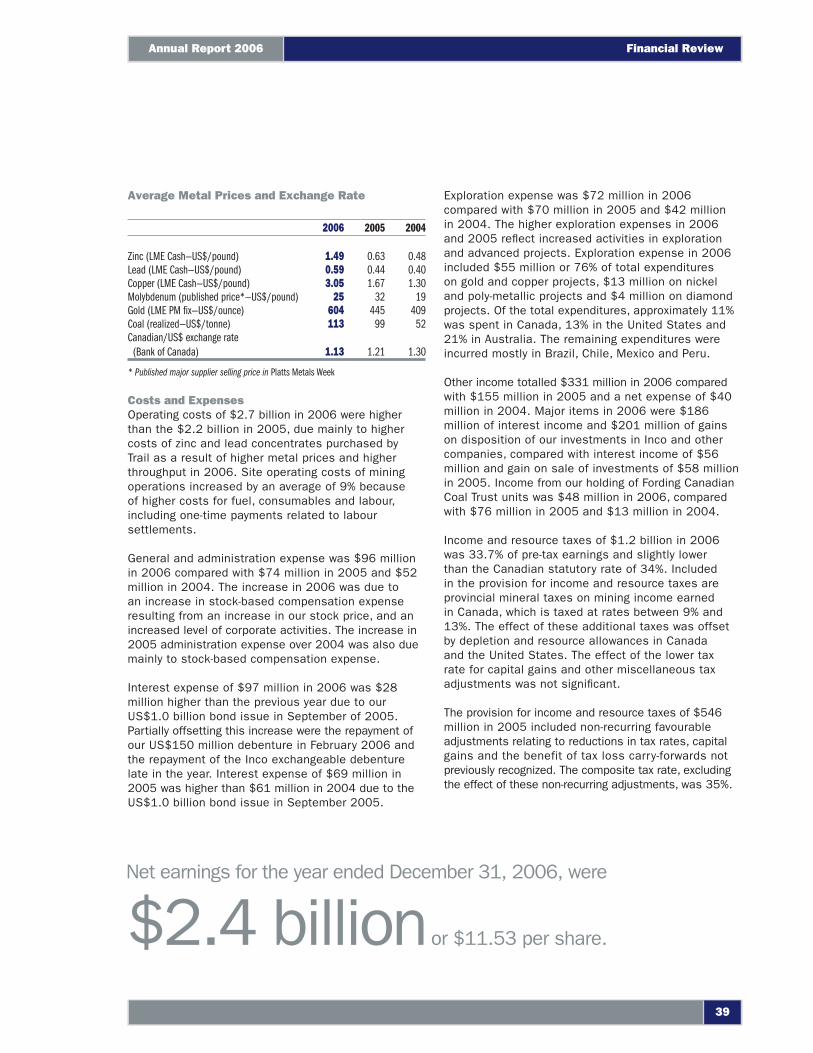
Exploration expense was $72 million in 2006 compared with $70 million in 2005 and $42 million in 2004. The higher exploration expenses in 2006 and 2005 refl ect increased activities in exploration and advanced projects. Exploration expense in 2006 included $55 million or 76% of total expenditures on gold and copper projects, $13 million on nickel and poly-metallic projects and $4 million on diamond projects. Of the total expenditures, approximately 11% was spent in Canada, 13% in the United States and 21% in Australia. The remaining expenditures were incurred mostly in Brazil, Chile, Mexico and Peru.
Other income totalled $331 million in 2006 compared with $155 million in 2005 and a net expense of $40 million in 2004. Major items in 2006 were $186 million of interest income and $201 million of gains on disposition of our investments in Inco and other companies, compared with interest income of $56 million and gain on sale of investments of $58 million in 2005. Income from our holding of Fording Canadian Coal Trust units was $48 million in 2006, compared with $76 million in 2005 and $13 million in 2004.
Income and resource taxes of $1.2 billion in 2006 was 33.7% of pre-tax earnings and slightly lower than the Canadian statutory rate of 34%. Included in the provision for income and resource taxes are provincial mineral taxes on mining income earned in Canada, which is taxed at rates between 9% and 13%. The effect of these additional taxes was offset by depletion and resource allowances in Canada and the United States. The effect of the lower tax rate for capital gains and other miscellaneous tax adjustments was not signifi cant.
The provision for income and resource taxes of $546 million in 2005 included non-recurring favourable adjustments relating to reductions in tax rates, capital gains and the benefit of tax loss carry-forwards not previously recognized. The composite tax rate, excluding the effect of these non-recurring adjustments, was 35%.
Average Metal Prices and Exchange Rate
2006 2005 2004
Zinc (LME Cash—US$/pound) 1.49 0.63 0.48Lead (LME Cash—US$/pound) 0.59 0.44 0.40Copper (LME Cash—US$/pound) 3.05 1.67 1.30Molybdenum (published price*—US$/pound) 25 32 19Gold (LME PM fi x—US$/ounce) 604 445 409Coal (realized—US$/tonne) 113 99 52Canadian/US$ exchange rate
(Bank of Canada) 1.13 1.21 1.30
* Published major supplier selling price in Platts Metals Week
Costs and ExpensesOperating costs of $2.7 billion in 2006 were higher than the $2.2 billion in 2005, due mainly to higher costs of zinc and lead concentrates purchased by Trail as a result of higher metal prices and higher throughput in 2006. Site operating costs of mining operations increased by an average of 9% because of higher costs for fuel, consumables and labour, including one-time payments related to labour settlements.
General and administration expense was $96 million in 2006 compared with $74 million in 2005 and $52 million in 2004. The increase in 2006 was due to an increase in stock-based compensation expense resulting from an increase in our stock price, and an increased level of corporate activities. The increase in 2005 administration expense over 2004 was also due mainly to stock-based compensation expense.
Interest expense of $97 million in 2006 was $28 million higher than the previous year due to our US$1.0 billion bond issue in September of 2005. Partially offsetting this increase were the repayment of our US$150 million debenture in February 2006 and the repayment of the Inco exchangeable debenture late in the year. Interest expense of $69 million in 2005 was higher than $61 million in 2004 due to the US$1.0 billion bond issue in September 2005.
Net earnings for the year ended December 31, 2006, were
$2.4 billion or $11.53 per share.
39
Annual Report 2006 Financial Review

Production and Sales Statistics (Note 1)
Production Sales
Years ended December 31 2006 2005 2004 2006 2005 2004
TRAIL OPERATIONS
Refined Zinc (thousand tonnes) 296 223 296 290 228 296Refined Lead (thousand tonnes) 90 69 85 88 69 86Surplus Power (GW.h) — — — 891 1,278 957
BASE METALS (Note 2)
Zinc (thousand tonnes) Red Dog 558 568 554 536 545 651Antamina 35 41 43 36 43 41Pend Oreille 34 45 17 35 44 17Louvicourt — 3 5 — 3 5
627 657 619 607 635 714
Lead (thousand tonnes) Red Dog 124 102 117 115 105 127Pend Oreille 5 8 2 5 8 3
129 110 119 120 113 130
Copper (thousand tonnes)Highland Valley Copper (Note 3) 167 175 158 180 181 140Antamina 87 84 82 87 87 77Louvicourt — 4 8 — 4 8
254 263 248 267 272 225
Molybdenum (thousand pounds) Highland Valley Copper 4,023 6,149 9,853 3,764 6,682 10,130Antamina 3,906 3,333 1,778 3,948 3,628 903
7,929 9,482 11,631 7,712 10,310 11,033
GOLD (thousand ounces) Hemlo 205 230 247 207 230 246Pogo 45 — — 39 — —Other 13 15 14 11 12 13
263 245 261 257 242 259
COAL (thousand tonnes) Elk Valley Coal (Note 4) 8,657 9,948 9,277 8,994 9,352 9,333
Notes:(1) The above production and sales volumes refer to the Company’s share.(2) Production and sales volumes of base metal mines refer to metals contained in concentrate.(3) The Company owns 97.5% of Highland Valley Copper since March 1, 2004, and owned 63.9% prior to that date.(4) Results of the Elk Valley Coal Partnership represent the Company’s 40% direct interest in the Partnership commencing April 1, 2006, 39% from April 1, 2005 to March 31,
2006, 38% from April 1, 2004 to March 31, 2005, and 35% prior to April 1, 2004.
Teck Cominco Limited
40
Management’s Discussion and Analysis
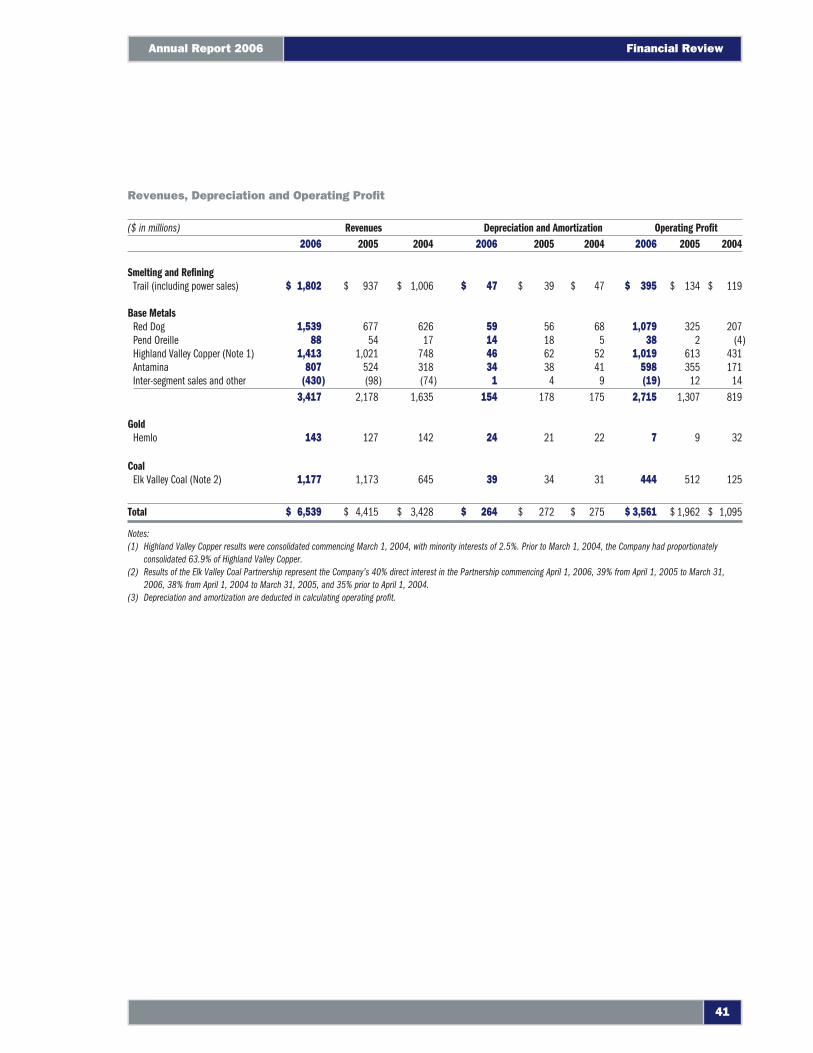
Revenues, Depreciation and Operating Profi t
($ in millions) Revenues Depreciation and Amortization Operating Profit2006 2005 2004 2006 2005 2004 2006 2005 2004
Smelting and RefiningTrail (including power sales) $ 1,802 $ 937 $ 1,006 $ 47 $ 39 $ 47 $ 395 $ 134 $ 119
Base MetalsRed Dog 1,539 677 626 59 56 68 1,079 325 207Pend Oreille 88 54 17 14 18 5 38 2 (4)Highland Valley Copper (Note 1) 1,413 1,021 748 46 62 52 1,019 613 431Antamina 807 524 318 34 38 41 598 355 171Inter-segment sales and other (430) (98) (74) 1 4 9 (19) 12 14
3,417 2,178 1,635 154 178 175 2,715 1,307 819
GoldHemlo 143 127 142 24 21 22 7 9 32
CoalElk Valley Coal (Note 2) 1,177 1,173 645 39 34 31 444 512 125
Total $ 6,539 $ 4,415 $ 3,428 $ 264 $ 272 $ 275 $ 3,561 $ 1,962 $ 1,095
Notes:(1) Highland Valley Copper results were consolidated commencing March 1, 2004, with minority interests of 2.5%. Prior to March 1, 2004, the Company had proportionately
consolidated 63.9% of Highland Valley Copper.(2) Results of the Elk Valley Coal Partnership represent the Company’s 40% direct interest in the Partnership commencing April 1, 2006, 39% from April 1, 2005 to March 31,
2006, 38% from April 1, 2004 to March 31, 2005, and 35% prior to April 1, 2004.(3) Depreciation and amortization are deducted in calculating operating profi t.
41
Annual Report 2006 Financial Review
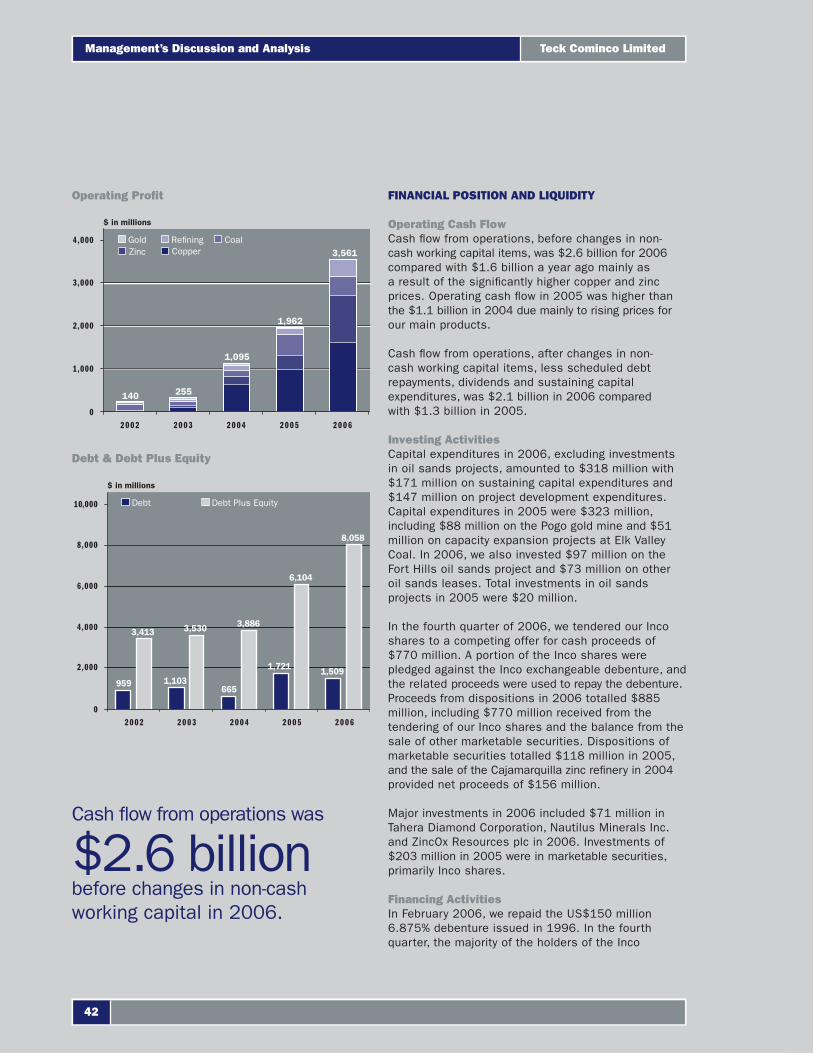
FINANCIAL POSITION AND LIQUIDITY
Operating Cash FlowCash fl ow from operations, before changes in non-cash working capital items, was $2.6 billion for 2006 compared with $1.6 billion a year ago mainly as a result of the signifi cantly higher copper and zinc prices. Operating cash fl ow in 2005 was higher than the $1.1 billion in 2004 due mainly to rising prices for our main products.
Cash fl ow from operations, after changes in non-cash working capital items, less scheduled debt repayments, dividends and sustaining capital expenditures, was $2.1 billion in 2006 compared with $1.3 billion in 2005.
Investing ActivitiesCapital expenditures in 2006, excluding investments in oil sands projects, amounted to $318 million with $171 million on sustaining capital expenditures and $147 million on project development expenditures. Capital expenditures in 2005 were $323 million, including $88 million on the Pogo gold mine and $51 million on capacity expansion projects at Elk Valley Coal. In 2006, we also invested $97 million on the Fort Hills oil sands project and $73 million on other oil sands leases. Total investments in oil sands projects in 2005 were $20 million.
In the fourth quarter of 2006, we tendered our Inco shares to a competing offer for cash proceeds of $770 million. A portion of the Inco shares were pledged against the Inco exchangeable debenture, and the related proceeds were used to repay the debenture. Proceeds from dispositions in 2006 totalled $885 million, including $770 million received from the tendering of our Inco shares and the balance from the sale of other marketable securities. Dispositions of marketable securities totalled $118 million in 2005, and the sale of the Cajamarquilla zinc refi nery in 2004 provided net proceeds of $156 million.
Major investments in 2006 included $71 million in Tahera Diamond Corporation, Nautilus Minerals Inc. and ZincOx Resources plc in 2006. Investments of $203 million in 2005 were in marketable securities, primarily Inco shares.
Financing ActivitiesIn February 2006, we repaid the US$150 million 6.875% debenture issued in 1996. In the fourth quarter, the majority of the holders of the Inco
Cash fl ow from operations was
$2.6 billion before changes in non-cash working capital in 2006.
Operating Profi t
0
$ in millions
4,000
3,000
2,000
1,000
60025002400230022002
Gold Refining Coal
1,095
1,962
3,561
255140
Zinc Copper
Debt & Debt Plus Equity
60025002400230022002
$ in millions
0
8,000
10,000
6,000
4,000
2,000
Debt Debt Plus Equity
1,5091,721
6651,103959
3,886
6,104
8,058
3,413 3,530
Teck Cominco Limited
42
Management’s Discussion and Analysis
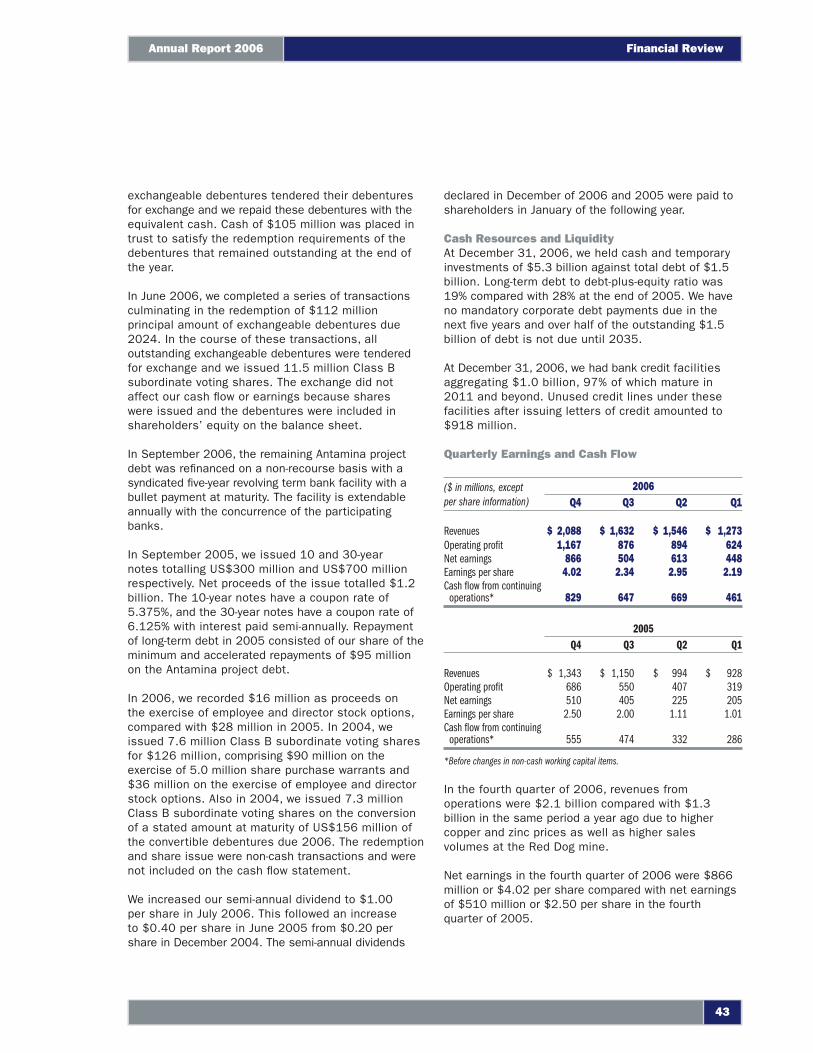
exchangeable debentures tendered their debentures for exchange and we repaid these debentures with the equivalent cash. Cash of $105 million was placed in trust to satisfy the redemption requirements of the debentures that remained outstanding at the end of the year.
In June 2006, we completed a series of transactions culminating in the redemption of $112 million principal amount of exchangeable debentures due 2024. In the course of these transactions, all outstanding exchangeable debentures were tendered for exchange and we issued 11.5 million Class B subordinate voting shares. The exchange did not affect our cash fl ow or earnings because shares were issued and the debentures were included in shareholders’ equity on the balance sheet.
In September 2006, the remaining Antamina project debt was refi nanced on a non-recourse basis with a syndicated fi ve-year revolving term bank facility with a bullet payment at maturity. The facility is extendable annually with the concurrence of the participating banks.
In September 2005, we issued 10 and 30-year notes totalling US$300 million and US$700 million respectively. Net proceeds of the issue totalled $1.2 billion. The 10-year notes have a coupon rate of 5.375%, and the 30-year notes have a coupon rate of 6.125% with interest paid semi-annually. Repayment of long-term debt in 2005 consisted of our share of the minimum and accelerated repayments of $95 million on the Antamina project debt.
In 2006, we recorded $16 million as proceeds on the exercise of employee and director stock options, compared with $28 million in 2005. In 2004, we issued 7.6 million Class B subordinate voting shares for $126 million, comprising $90 million on the exercise of 5.0 million share purchase warrants and $36 million on the exercise of employee and director stock options. Also in 2004, we issued 7.3 million Class B subordinate voting shares on the conversion of a stated amount at maturity of US$156 million of the convertible debentures due 2006. The redemption and share issue were non-cash transactions and were not included on the cash fl ow statement.
We increased our semi-annual dividend to $1.00 per share in July 2006. This followed an increase to $0.40 per share in June 2005 from $0.20 per share in December 2004. The semi-annual dividends
declared in December of 2006 and 2005 were paid to shareholders in January of the following year.
Cash Resources and LiquidityAt December 31, 2006, we held cash and temporary investments of $5.3 billion against total debt of $1.5 billion. Long-term debt to debt-plus-equity ratio was 19% compared with 28% at the end of 2005. We have no mandatory corporate debt payments due in the next fi ve years and over half of the outstanding $1.5 billion of debt is not due until 2035.
At December 31, 2006, we had bank credit facilities aggregating $1.0 billion, 97% of which mature in 2011 and beyond. Unused credit lines under these facilities after issuing letters of credit amounted to $918 million.
Quarterly Earnings and Cash Flow
($ in millions, except per share information)
2006Q4 Q3 Q2 Q1
Revenues $ 2,088 $ 1,632 $ 1,546 $ 1,273Operating profi t 1,167 876 894 624Net earnings 866 504 613 448Earnings per share 4.02 2.34 2.95 2.19Cash fl ow from continuing
operations* 829 647 669 461
2005Q4 Q3 Q2 Q1
Revenues $ 1,343 $ 1,150 $ 994 $ 928Operating profi t 686 550 407 319Net earnings 510 405 225 205Earnings per share 2.50 2.00 1.11 1.01Cash fl ow from continuing
operations* 555 474 332 286
*Before changes in non-cash working capital items.
In the fourth quarter of 2006, revenues from operations were $2.1 billion compared with $1.3 billion in the same period a year ago due to higher copper and zinc prices as well as higher sales volumes at the Red Dog mine.
Net earnings in the fourth quarter of 2006 were $866 million or $4.02 per share compared with net earnings of $510 million or $2.50 per share in the fourth quarter of 2005.
43
Annual Report 2006 Financial Review
The higher earnings in the fourth quarter of 2006 were principally a result of higher copper and zinc prices and higher zinc sales volumes at Red Dog. The average LME prices for copper and zinc were US$3.21 and US$1.91 per pound respectively in the quarter, up 65% and 158% from the same period a year earlier. A weaker U.S. dollar of $1.14 in the fourth quarter compared with $1.17 in the fourth quarter of 2005 partially offset the effect of the higher commodity prices.
Included in fourth quarter earnings was an after-tax net gain of $115 million on the disposition of our position in Inco. In the fourth quarter of 2005, net earnings included a favourable tax adjustment of $52 million for the reduction of a future income tax liability and an after-tax gain on the sale of investments of $17 million.
Cash fl ow from operations, before changes to non-cash working capital items, was $829 million in the fourth quarter of 2006 compared with $555 million in the fourth quarter of 2005 with the increase due mainly to signifi cantly higher operating profi ts from zinc and copper operations.
OUTLOOK
Trail’s refi ned zinc and lead sales are expected to be 10%–15% lower than production in the fi rst quarter due to seasonality and softness in the U.S. markets. We expect the shortfall will be recovered in the typically stronger second and third quarters of the year.
Sales and profi ts of the Red Dog mine follow a seasonal pattern, with higher sales volumes of zinc and most of the lead sales occurring in the last fi ve months of the year following the commencement of the shipping season in July.
Copper production at Highland Valley Copper in 2007 is expected to decrease by approximately 30,000 tonnes from the 2006 production level, as the mine begins a three-year transitional mining period in 2007 to develop the Valley pit east wall and mill throughput decreases as a result of higher stripping levels.
At Antamina, our share of copper production in 2007 is expected to decrease from 2006 by 8,000 tonnes, while our share of zinc production is expected to increase by 40,000 tonnes due to the changes in ore mix and ore grades.
The Lennard Shelf mine, expected to commence operation in the fi rst quarter of 2007, will result in approximately 30,000 tonnes of additional zinc production for the company in 2007.
Gold production is expected to increase by approximately 85,000 ounces in 2007 compared with 2006 due to higher planned production from the Pogo mine. Our share of gold production from Pogo is estimated to be 136,000 ounces, while our share of production from the Hemlo joint venture is expected to be similar to 2006 at approximately 205,000 ounces.
Adverse weather conditions in late 2006 and early 2007 affected rail performance and contributed to lower inventories of Elk Valley Coal’s products at the ports and lower sales in the fi rst quarter. Elk Valley Coal’s 2007 production and sales will be affected by any disruption in coal shipments and the outcome of the sales negotiations in the fi rst quarter in 2007.
We reported record profi ts in 2006 due to signifi cantly higher commodity prices. Prices for copper and zinc declined in January 2007. In January, 40% of the receivables outstanding at December 31, 2006, were fi nal priced resulting in negative revenue adjustments of $43 million on a before-tax basis. The total amount of fi nal pricing revenue adjustments to be recorded in the fi rst quarter of 2007 will depend on average metal prices in February and March.
Coal prices in the fi rst quarter of 2007 are expected to be similar to the fourth quarter average price of US$106 per tonne (Cdn$123 per tonne). Negotiations are under way for coal prices and volumes for the coal year commencing April 1, 2007. The hard coking coal market is not as strong as the past two years as new sources of supply from competitors are coming on stream and infrastructure constraints in Australia are being mitigated.
In addition to the recording of any negative fi nal pricing adjustments and the impact of delayed coal shipments due to poor weather, fi rst quarter performance will also be affected by the seasonality of Red Dog zinc and lead sales, as well as any unrealized mark-to-market gain or loss on fi nancial instruments as a result of the adoption of new accounting rules.
Under new accounting rules that are effective January 1, 2007, the Company will record a receivable of $139 million on January 1, 2007 related to contingent
Teck Cominco Limited
44
Management’s Discussion and Analysis
payments that we may receive from the purchaser of the Cajamarquilla zinc refi nery that was sold in 2004. The payments occur until 2009 in years in which the average annual zinc price exceeds US$0.454 per pound. The $139 million receivable is estimated based on the zinc forward curve in effect at the end of 2006. This receivable will be marked to market using the zinc forward curve in effect at the end of each subsequent quarter with any gain or loss taken into income during that quarter.
Any strengthening of the Canadian dollar relative to the U.S. dollar has a negative impact on our earnings as the prices of our products are denominated in U.S. dollars and a signifi cant portion of our operating costs are Canadian dollar based.
Earnings SensitivitySensitivity of annual earnings to changes in metal prices and the U.S. dollar exchange rate based on the Company’s 2007 production plan is as follows:
Change
Estimated Impact on Annual After-
Tax Earnings EPS(Cdn$ millions)
Zinc US$0.01/pound $ 10 4.6¢Lead US$0.01/pound $ 3 1.4¢Copper US$0.01/pound $ 3 1.4¢Molybdenum US$1/pound $ 5 2.3¢Gold US$10/ounce $ 2 1.0¢Coal US$1/tonne $ 7 3.2¢Power US$10/MW.h $ 8 3.7¢US$1 = Cdn Cdn$0.01 $ 22 10.2¢
Note: The effect on the Company’s earnings of commodity price and exchange rate movements will vary from quarter to quarter depending on sales volumes.
Increases in site operating costs are expected to be lower in 2007 compared with the previous two years, as pressure on commodity prices and oil prices appears to be easing and no major one-time payments related to labour settlements are anticipated.
Our capital expenditures are estimated to be $775 million in 2007, including $210 million of sustaining capital expenditures at our operations and $265 million on development projects. In addition, we expect to spend $300 million on our share of costs in the Fort Hills oil sands project and various oil sands properties jointly owned with UTS Energy Corporation.
CONTINGENCIES
Legal ProceedingsOn November 11, 2004, the District Court for Eastern Washington State denied a motion by Teck Cominco Metals Ltd. (TCML) to dismiss, for want of jurisdiction, a citizen’s suit brought by two members of the Confederated Tribes of the Colville Reservation (the “Tribes”) supported by the State of Washington. The citizen’s suit was brought pursuant to Section 310(a)(i) of the Comprehensive Environmental Response, Compensation, and Liability Act (CERCLA) to enforce a unilateral administrative order issued by the U.S. Environmental Protection Agency (EPA) on December 11, 2003 (the “UAO”), purporting to require TCML to conduct a remedial investigation and feasibility study with respect to metal contamination in the sediments of the Upper Columbia River and Lake Roosevelt. On February 14, 2005, the Federal Court of Appeals for the 9th Circuit granted TCML’s petition for permission to appeal that decision and the District Court entered a stay of proceedings (the “Stay”) pending a fi nal decision on the appeal. In September 2005, the District Court lifted the Stay to allow the State of Washington and the Tribes to add the Tribes as an additional plaintiff and to fi le amended complaints adding the State’s and the Tribes’ claims for natural resource damages and cost recovery under CERCLA. On September 29, 2005, the individual plaintiffs also served notice of their intention to fi le suit under the U.S. Resource Conservation and Recovery Act (RCRA) seeking injunctive relief and costs. As far as we are aware, no suit has been fi led under RCRA.
On July 3, 2006, the 9th Circuit affi rmed the District Court’s denial of TCML’s motion to dismiss the citizen’s suit and on October 30, 2006, denied our petition for a rehearing. On November 6, 2006, the Court granted our motion for a stay pending a further application for leave to appeal to the U.S. Supreme Court. We are preparing the application, which must be fi led prior to February 27, 2007.
On June 2, 2006, TCML and its US affi liate, Teck Cominco American Incorporated (TCAI), entered into a Settlement Agreement (the “Agreement”) with the EPA and the United States under which TCAI is paying for and conducting a remedial investigation and feasibility study (the “Studies”) that, while not carried out under an administrative or judicial order, is consistent with the U.S. National Contingency Plan. TCAI is paying EPA’s oversight costs and providing US$1.1 million in annual
Financial Review
45
Annual Report 2006
funding to the EPA to facilitate the full participation of the Tribes, the State and the U.S. Department of Interior, and TCML has guaranteed TCAI’s performance of the Agreement. TCAI has placed US$20 million in escrow as fi nancial assurance of its obligations under the Agreement. Contemporaneously with the execution of the Agreement, the EPA withdrew the UAO. The recent decision of the 9th Circuit will not affect the Agreement.
There can be no assurance that the agreement to conduct and fund the Studies and the withdrawal of the UAO will be suffi cient to resolve the matter or that TCML or its affi liates will not be faced with further liability in relation to this matter. Until the studies are completed, it is not possible to estimate the extent and cost, if any, of remediation that may be required.
CRITICAL ACCOUNTING ESTIMATES
In preparing fi nancial statements, management has to make estimates and assumptions that affect the reported amounts of assets, liabilities, revenues and expenses. Based on historical experience, current conditions and expert advice, management makes assumptions that are believed to be reasonable under the circumstances. These estimates and assumptions form the basis for judgments about the carrying value of assets and liabilities and reported amounts for revenues and expenses. Different assumptions would result in different estimates, and actual results may differ from results based on these estimates. These estimates and assumptions are also affected by management’s application of accounting policies. Critical accounting estimates are those that affect the consolidated fi nancial statements materially and involve a signifi cant level of judgment by management. Management’s critical accounting estimates apply to the assessment for the impairment of property, plant and equipment and the valuation of other assets and liabilities such as inventory, plant and equipment, investments, restoration and post-closure costs, accounting for income and resource taxes, mineral reserves, contingencies and pension and other post-retirement benefi ts.
Property, Plant and EquipmentThe Company capitalizes the development costs of mining projects when resources as defi ned under National Instrument 43–101 are present and it is expected that the expenditure can be recovered by future exploitation or sale. Upon commencement of
commercial production, these costs are amortized over the proven and probable reserves to which they relate calculated on a units of production basis. The estimation of the extent of reserves is a complex task in which a number of estimates and assumptions are made. These involve the use of geological sampling and models as well as estimates of future costs. New knowledge derived from further exploration and development of the ore body may affect reserve estimates. In addition, the estimation of economic reserves depends on assumptions regarding long-term commodity prices and in some cases exchange rates.
Where impairment conditions may exist, the expected undiscounted future cash fl ows from an asset are compared with its carrying value. These future cash fl ows are developed using assumptions that refl ect the long-term operating plans for an asset given management’s best estimate of the most probable set of economic conditions. Commodity prices used reflect market conditions at the time the model is developed. These models are updated from time to time, and lower prices are used should market conditions deteriorate. Inherent in these assumptions are signifi cant risks and uncertainties. In management’s view, based on assumptions which management believes to be reasonable, a reduction in the carrying value of property, plant and equipment is not required at December 31, 2006. Changes in market conditions, reserve estimates and other assumptions used in these estimates may result in future write-downs.
Income and Resource TaxesThe determination of the Company’s tax expense for the year and its future tax liabilities and assets involves signifi cant management estimation and judgment involving a number of assumptions. In determining these amounts, management interprets tax legislation in a variety of jurisdictions and makes estimates of the expected timing of the reversal of future tax assets and liabilities. Management also makes estimates of the future earnings which affect the extent to which potential future tax benefi ts may be used. The Company is subject to assessments by various taxation authorities which may interpret tax legislation differently. These differences may affect the fi nal amount or the timing of the payment of taxes. The Company provides for such differences where known based on management’s best estimate of the probable outcome of these matters.
Teck Cominco Limited
46
Management’s Discussion and Analysis
Pension and Other Post-Retirement Benefi tsThe cost of providing benefi ts through defi ned benefi t pension plans and post-retirement benefi t plans is actuarially determined. Cost and obligation estimates depend on management’s assumptions about future events, which are used by the actuaries in calculating such amounts. These include assumptions with respect to discount rates, the expected plan investment performance, future compensation increases, health care cost trends and retirement dates of employees. In addition, actuarial consultants utilize subjective factors such as withdrawal and mortality rates. Actual results may differ materially from those estimates based on these assumptions.
Asset Retirement ObligationsThe amounts recorded for asset retirement costs are based on estimates included in closure and remediation plans. These estimates are based on engineering studies of the work that is required by environmental laws or public statements by management which result in an obligation. These estimates include an assumption on the rate at which costs may infl ate in future periods. Actual costs and the timing of expenditures could differ from these estimates.
Recognition of ContingenciesThe Company is subject to a number of lawsuits and threatened lawsuits. A provision is made for amounts claimed through these lawsuits when management believes that it is more likely than not that the plaintiffs will be awarded damages or a monetary settlement will be made. Management seeks the advice of outside counsel in making such judgments when the amounts involved are material.
ADOPTION OF NEW ACCOUNTING STANDARDS
Deferred StrippingEffective January 1, 2006, the Company adopted CICA Emerging Issues Committee Abstract 160 (EIC–160), “Stripping Costs Incurred in the Production Phase of a Mining Operation”. EIC–160 requires stripping costs to be accounted for as variable production costs to be included in the costs of inventory produced, unless the stripping activity can be shown to be a betterment of the mineral property. Betterment occurs when stripping activity increases future output of the mine by providing access to additional sources of reserves. Capitalized stripping costs are amortized on a unit
of production basis over the proven and probable reserves to which they relate.
The prospective application of this standard permits the existing deferred stripping costs incurred in the production phase to be amortized on a unit of production basis over the remaining life of the mine. As at January 1, 2006, the opening balance of capitalized stripping costs was $52 million. Stripping costs relating to the mine expansion at Highland Valley Copper, which is considered to be a betterment of the property, are capitalized and amounted to $25 million as at December 31, 2006 (2005 – $3 million).
Mineral Properties CostsEffective January 1, 2006, the Company amended its accounting policy on the treatment of costs for the acquisition, exploration and evaluation of mineral properties.
Under this policy, acquisition, exploration and evaluation costs are charged to earnings in the year in which they are incurred, except where these costs relate to specific properties for which resources as defined under National Policy Statement 43–101 exist and it is expected that the expenditure can be recovered by future exploitation or sale, in which case they are deferred.
Previously, the Company capitalized acquisition, exploration and evaluation costs only when economically recoverable reserves as shown by economic studies were believed to exist. This change has been applied retroactively but did not have any effect on the Company’s reported earnings or retained earnings.
Conditional Asset Retirement ObligationsDuring 2006, the Company applied the interpretations of CICA Emerging Issues Committee Abstract 159 (EIC–159), “Conditional Asset Retirement Obligations”. EIC–159 requires the recognition of a liability if the entity has sufficient information to reasonably estimate the fair value of the asset retirement obligation, even if the timing and/or method of settling the legal obligation are conditional on a future event. If suffi cient information is not available at the time the liability is incurred, a liability should be recognized in the period in which suffi cient information becomes available. The application of EIC–159 did not have any impact on the Company’s consolidated financial statements.
47
Annual Report 2006 Financial Review
Stock-Based Compensation for Employees Eligible to Retire Before the Vesting DateEffective December 31, 2006, the Company adopted the new CICA Emerging Issues Committee Abstract 162 (EIC–162) “Stock-Based Compensation for Employees Eligible to Retire before the Vesting Date”. EIC–162 requires that stock-based compensation costs are to be recorded over the period from the grant date of the awards to the time employees are eligible to retire as opposed to being recorded over the stated vesting period of the awards. These new provisions are applied with retroactive restatement. The adoption of the new standard did not have any affect on the Company’s reported earnings or retained earnings.
FINANCIAL INSTRUMENTS
In 2006, the Company’s commodity price and foreign exchange hedging activities increased the Company’s revenues by $43 million. The unrealized mark-to-market loss on our derivatives and fi nancial instruments totalled $73 million as at December 31, 2006.
RECENT CANADIAN ACCOUNTING PRONOUNCEMENTS
Canadian Accounting Pronouncements Effective for 2007In September 2006, the Emerging Issues Committee issued Abstract 163 (EIC–163), “Determining the Variability to Be Considered in Applying AcG–15”. EIC–163 provides clarifi cation of how an entity should determine the variability in assessment of a Variable Interest Entity. EIC–163 requires an analysis of the design of the entity in determining the variability to be considered in applying AcG–15 using a two-step approach. The guidance will be applied to all entities (including newly created entities) when an enterprise fi rst becomes involved and to all entities previously required to be analyzed under AcG–15 when a reconsideration event has occurred, subsequent to January 1, 2007.
In July 2006, the CICA revised Section 1506, “Accounting Changes”, which now requires that: (a) a voluntary change in accounting principles can be made if, and only if, the change results in more reliable and relevant information, (b) changes in accounting policies are accompanied with disclosures of prior period amounts and justifi cation for the change and (c) for changes in estimates, nature and amount of the change should be disclosed. The revised section is effective for the Company’s fi nancial year beginning January 1, 2007.
In April 2005, the Accounting Standards Board issued three new accounting standards dealing with the recognition, measurement and disclosure of fi nancial instruments, hedges and comprehensive income, together with many consequential amendments throughout the CICA Handbook. These new standards will affect the Company’s interim and annual fi nancial statements beginning with the fi rst quarter of 2007.
(i) Financial Instruments – Recognition and Measurement, Section 3855
This standard prescribes when a fi nancial asset, fi nancial liability, or non-fi nancial derivative is to be recognized on the balance sheet and whether fair value or cost-based measures are used to measure the recorded amounts. It also specifi es how fi nancial instrument gains and losses are to be presented.
The Company’s cash equivalents, temporary investments and investments in marketable securities will be classifi ed as available for sale and thus will be recorded at fair value on the balance sheet. Changes in the fair value of these instruments will be refl ected in other comprehensive income.
All derivatives will be recorded on the balance sheet at fair value. Mark-to-market adjustments on these instruments will be included in net income, unless designated as part of a cash fl ow hedge relationship.
All other fi nancial instruments will be recorded at cost or amortized cost, subject to impairment reviews. Transaction costs incurred to acquire fi nancial instruments will be included in the underlying balance.
(ii) Hedges, Section 3865
This standard is applicable when a company chooses to designate a hedging relationship for accounting purposes. It builds on the existing AcG–13, “Hedging Relationships”, and Section 1650, “Foreign Currency Translation”, by specifying how hedge accounting is applied and what disclosures are necessary when it is applied.
Teck Cominco Limited
48
Management’s Discussion and Analysis
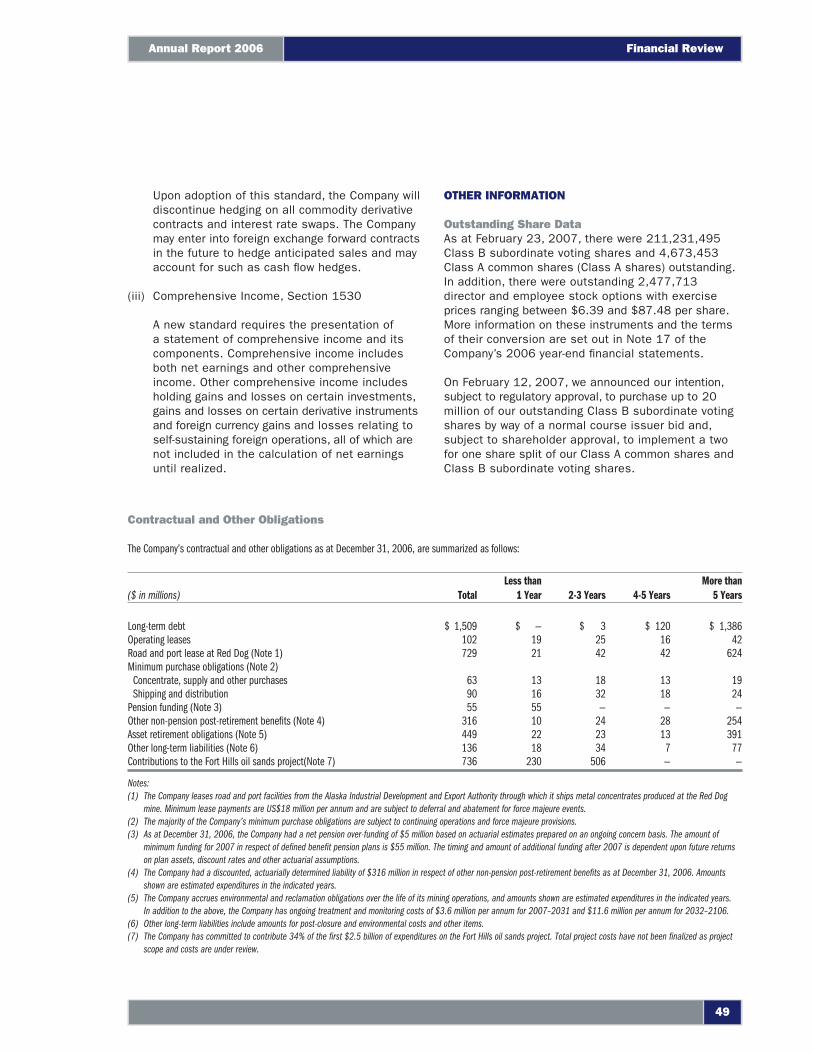
Upon adoption of this standard, the Company will discontinue hedging on all commodity derivative contracts and interest rate swaps. The Company may enter into foreign exchange forward contracts in the future to hedge anticipated sales and may account for such as cash fl ow hedges.
(iii) Comprehensive Income, Section 1530
A new standard requires the presentation of a statement of comprehensive income and its components. Comprehensive income includes both net earnings and other comprehensive income. Other comprehensive income includes holding gains and losses on certain investments, gains and losses on certain derivative instruments and foreign currency gains and losses relating to self-sustaining foreign operations, all of which are not included in the calculation of net earnings until realized.
Contractual and Other Obligations
The Company’s contractual and other obligations as at December 31, 2006, are summarized as follows:
($ in millions) TotalLess than
1 Year 2-3 Years 4-5 YearsMore than
5 Years
Long-term debt $ 1,509 $ — $ 3 $ 120 $ 1,386Operating leases 102 19 25 16 42Road and port lease at Red Dog (Note 1) 729 21 42 42 624Minimum purchase obligations (Note 2)
Concentrate, supply and other purchases 63 13 18 13 19Shipping and distribution 90 16 32 18 24
Pension funding (Note 3) 55 55 — — —Other non-pension post-retirement benefi ts (Note 4) 316 10 24 28 254Asset retirement obligations (Note 5) 449 22 23 13 391Other long-term liabilities (Note 6) 136 18 34 7 77Contributions to the Fort Hills oil sands project(Note 7) 736 230 506 — —
Notes:(1) The Company leases road and port facilities from the Alaska Industrial Development and Export Authority through which it ships metal concentrates produced at the Red Dog
mine. Minimum lease payments are US$18 million per annum and are subject to deferral and abatement for force majeure events.(2) The majority of the Company’s minimum purchase obligations are subject to continuing operations and force majeure provisions.(3) As at December 31, 2006, the Company had a net pension over-funding of $5 million based on actuarial estimates prepared on an ongoing concern basis. The amount of
minimum funding for 2007 in respect of defi ned benefi t pension plans is $55 million. The timing and amount of additional funding after 2007 is dependent upon future returns on plan assets, discount rates and other actuarial assumptions.
(4) The Company had a discounted, actuarially determined liability of $316 million in respect of other non-pension post-retirement benefi ts as at December 31, 2006. Amounts shown are estimated expenditures in the indicated years.
(5) The Company accrues environmental and reclamation obligations over the life of its mining operations, and amounts shown are estimated expenditures in the indicated years. In addition to the above, the Company has ongoing treatment and monitoring costs of $3.6 million per annum for 2007–2031 and $11.6 million per annum for 2032–2106.
(6) Other long-term liabilities include amounts for post-closure and environmental costs and other items. (7) The Company has committed to contribute 34% of the fi rst $2.5 billion of expenditures on the Fort Hills oil sands project. Total project costs have not been fi nalized as project
scope and costs are under review.
OTHER INFORMATION
Outstanding Share DataAs at February 23, 2007, there were 211,231,495 Class B subordinate voting shares and 4,673,453 Class A common shares (Class A shares) outstanding. In addition, there were outstanding 2,477,713 director and employee stock options with exercise prices ranging between $6.39 and $87.48 per share. More information on these instruments and the terms of their conversion are set out in Note 17 of the Company’s 2006 year-end fi nancial statements.
On February 12, 2007, we announced our intention, subject to regulatory approval, to purchase up to 20 million of our outstanding Class B subordinate voting shares by way of a normal course issuer bid and, subject to shareholder approval, to implement a two for one share split of our Class A common shares and Class B subordinate voting shares.
49
Annual Report 2006 Financial Review
DISCLOSURE CONTROLS AND INTERNAL CONTROL OVER FINANCIAL REPORTING
Disclosure Controls and ProceduresDisclosure controls and procedures are designed to provide reasonable assurance that material information is gathered and reported to senior management, including the Chief Executive Offi cer and Chief Financial Offi cer, as appropriate to permit timely decisions regarding public disclosure.
Management, including the Chief Executive Offi cer and Chief Financial Offi cer, has evaluated the effectiveness of the design and operation of the Company’s disclosure controls and procedures, as defi ned in the rules of the U.S. Securities and Exchange Commission and Canadian Securities Administration, as at December 31, 2006. Based on this evaluation, the Chief Executive Offi cer and Chief Financial Offi cer have concluded that the Company’s disclosure controls and procedures were effective to ensure that information required to be disclosed in reports fi led or submitted by the Company under United States and Canadian securities legislation is recorded, processed, summarized and reported within the time periods specifi ed in those rules.
Management’s Report on Internal Control Over Financial ReportingThe Company’s management is responsible for establishing and maintaining adequate internal control over fi nancial reporting. Any system of internal control over fi nancial reporting, no matter how well designed, has inherent limitations. Therefore, even those systems determined to be effective can provide only reasonable assurance with respect to fi nancial statement preparation and presentation.
Management has used the Committee of Sponsoring Organizations of the Treadway Commission (COSO) framework to evaluate the effectiveness of the Company’s internal control over fi nancial reporting. Based on this assessment, management has concluded that as at December 31, 2006, the Company’s internal control over fi nancial reporting was effective.
Management’s assessment of the effectiveness of internal control over fi nancial reporting has been audited by PricewaterhouseCoopers, an independent registered public accounting fi rm, who have expressed their opinion in their report included with the Company’s annual consolidated fi nancial statements.
Changes in Internal Control Over Financial ReportingThere have been no changes in the Company’s internal control over fi nancial reporting during the year ended December 31, 2006, that have materially affected, or are reasonably likely to materially affect, its internal control over fi nancial reporting.
Teck Cominco Limited
50
Management’s Discussion and Analysis
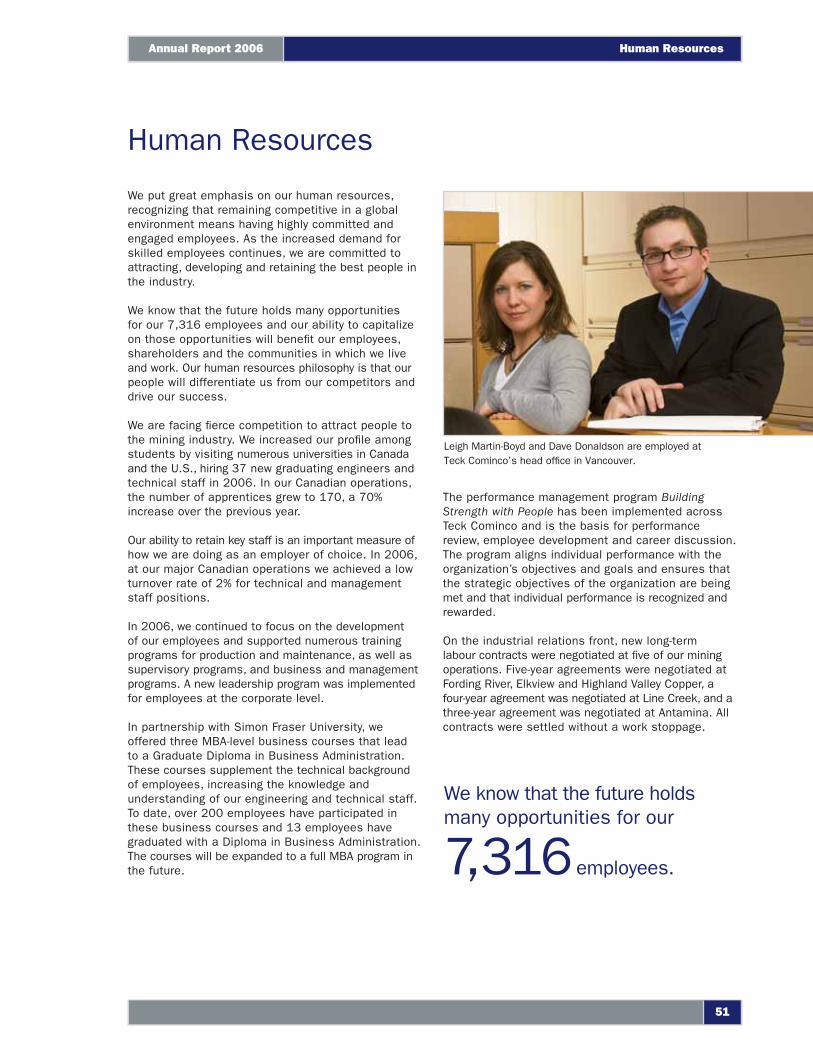
We put great emphasis on our human resources, recognizing that remaining competitive in a global environment means having highly committed and engaged employees. As the increased demand for skilled employees continues, we are committed to attracting, developing and retaining the best people in the industry.
We know that the future holds many opportunities for our 7,316 employees and our ability to capitalize on those opportunities will benefi t our employees, shareholders and the communities in which we live and work. Our human resources philosophy is that our people will differentiate us from our competitors and drive our success.
We are facing fi erce competition to attract people to the mining industry. We increased our profi le among students by visiting numerous universities in Canada and the U.S., hiring 37 new graduating engineers and technical staff in 2006. In our Canadian operations, the number of apprentices grew to 170, a 70% increase over the previous year.
Our ability to retain key staff is an important measure of how we are doing as an employer of choice. In 2006, at our major Canadian operations we achieved a low turnover rate of 2% for technical and management staff positions.
In 2006, we continued to focus on the development of our employees and supported numerous training programs for production and maintenance, as well as supervisory programs, and business and management programs. A new leadership program was implemented for employees at the corporate level.
In partnership with Simon Fraser University, we offered three MBA-level business courses that lead to a Graduate Diploma in Business Administration. These courses supplement the technical background of employees, increasing the knowledge and understanding of our engineering and technical staff. To date, over 200 employees have participated in these business courses and 13 employees have graduated with a Diploma in Business Administration. The courses will be expanded to a full MBA program in the future.
The performance management program Building Strength with People has been implemented across Teck Cominco and is the basis for performance review, employee development and career discussion. The program aligns individual performance with the organization’s objectives and goals and ensures that the strategic objectives of the organization are being met and that individual performance is recognized and rewarded.
On the industrial relations front, new long-term labour contracts were negotiated at fi ve of our mining operations. Five-year agreements were negotiated at Fording River, Elkview and Highland Valley Copper, a four-year agreement was negotiated at Line Creek, and a three-year agreement was negotiated at Antamina. All contracts were settled without a work stoppage.
We know that the future holds many opportunities for our
7,316 employees.
Human Resources
Leigh Martin-Boyd and Dave Donaldson are employed at Teck Cominco’s head offi ce in Vancouver.
51
Annual Report 2006 Human Resources
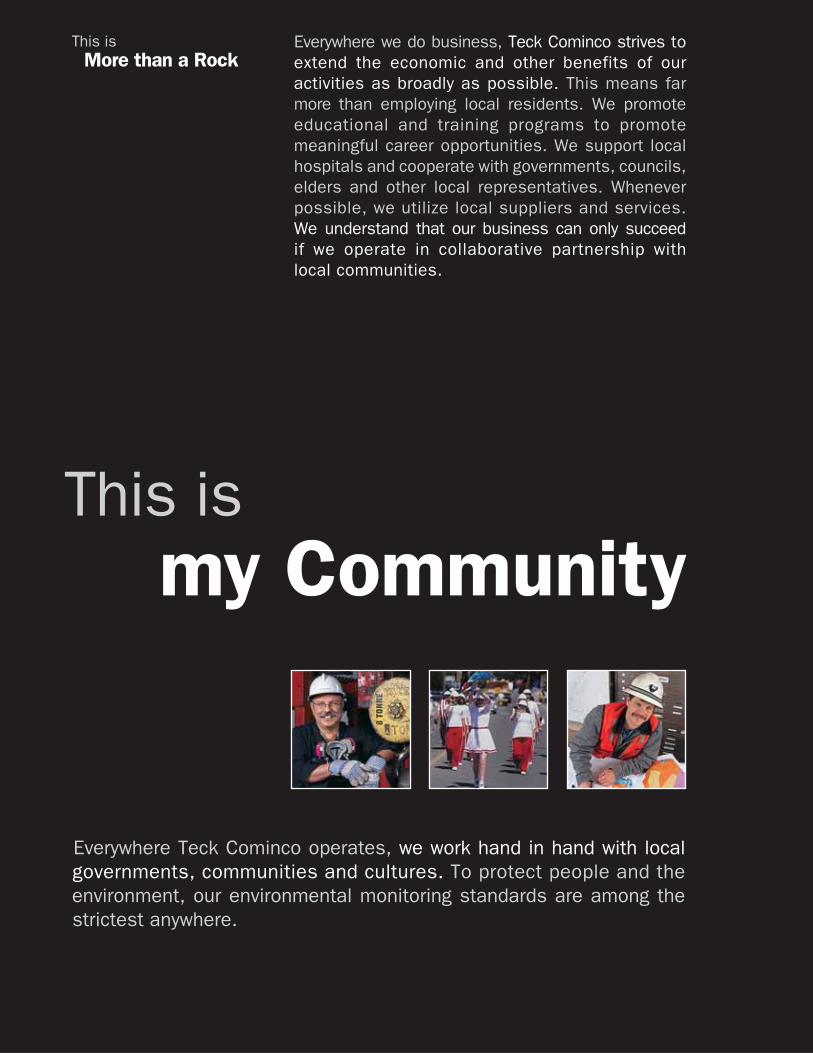
Everywhere Teck Cominco operates, we work hand in hand with local governments, communities and cultures. To protect people and the environment, our environmental monitoring standards are among the strictest anywhere.
Everywhere we do business, Teck Cominco strives to extend the economic and other benefits of our activities as broadly as possible. This means far more than employing local residents. We promote educational and training programs to promote meaningful career opportunities. We support local hospitals and cooperate with governments, councils, elders and other local representatives. Whenever possible, we utilize local suppliers and services. We understand that our business can only succeed if we operate in collaborative partnership with local communities.
This is More than a Rock
This ismy Community
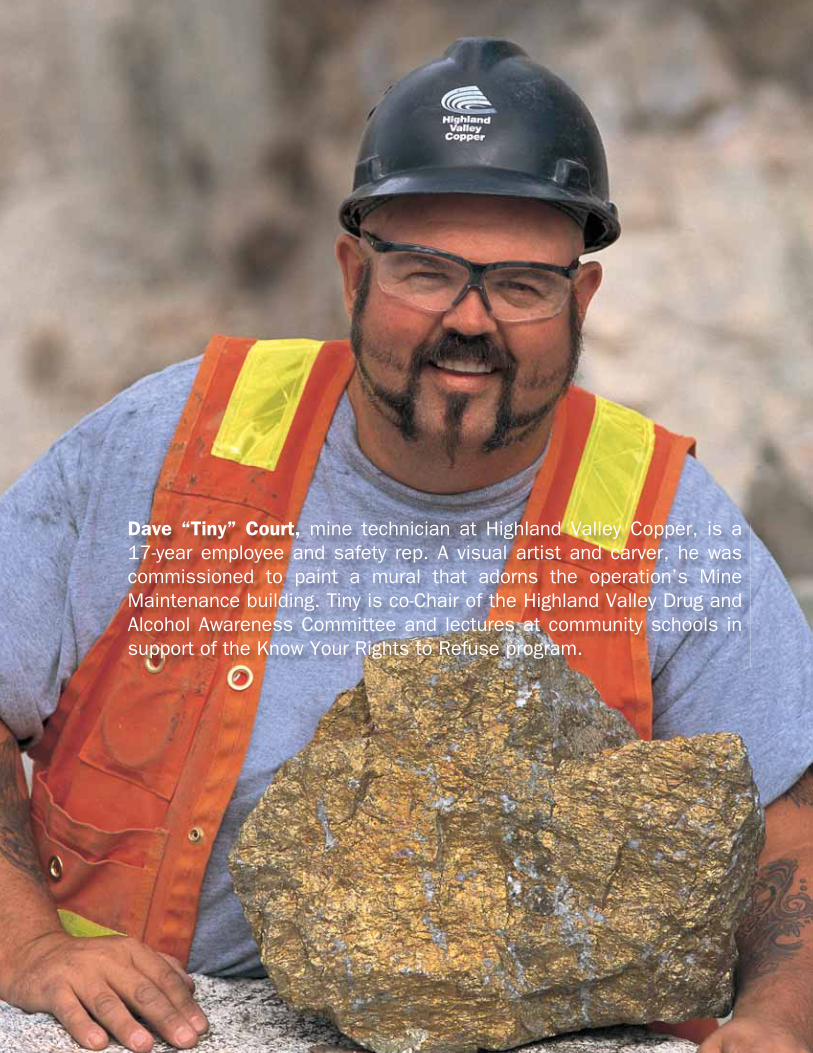
Dave “Tiny” Court, mine technician at Highland Valley Copper, is a 17-year employee and safety rep. A visual artist and carver, he was commissioned to paint a mural that adorns the operation’s Mine Maintenance building. Tiny is co-Chair of the Highland Valley Drug and Alcohol Awareness Committee and lectures at community schools in support of the Know Your Rights to Refuse program.
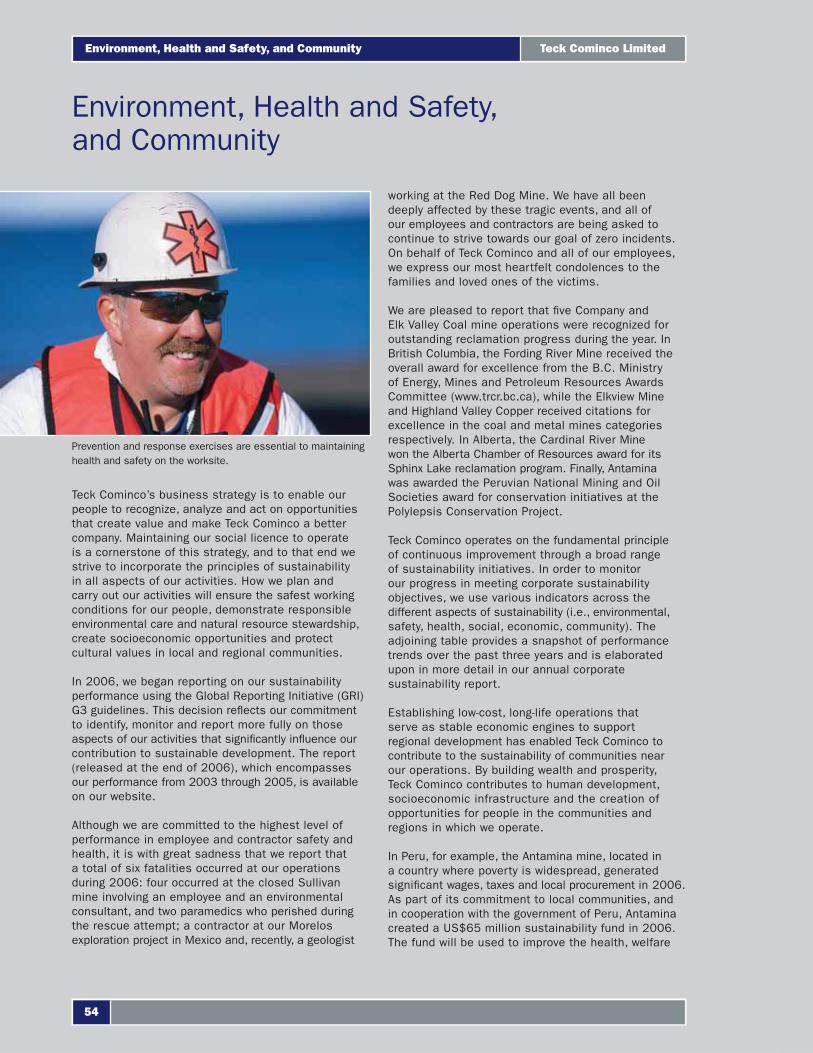
Environment, Health and Safety, and Community
Teck Cominco’s business strategy is to enable our people to recognize, analyze and act on opportunities that create value and make Teck Cominco a better company. Maintaining our social licence to operate is a cornerstone of this strategy, and to that end we strive to incorporate the principles of sustainability in all aspects of our activities. How we plan and carry out our activities will ensure the safest working conditions for our people, demonstrate responsible environmental care and natural resource stewardship, create socioeconomic opportunities and protect cultural values in local and regional communities.
In 2006, we began reporting on our sustainability performance using the Global Reporting Initiative (GRI) G3 guidelines. This decision refl ects our commitment to identify, monitor and report more fully on those aspects of our activities that signifi cantly infl uence our contribution to sustainable development. The report (released at the end of 2006), which encompasses our performance from 2003 through 2005, is available on our website.
Although we are committed to the highest level of performance in employee and contractor safety and health, it is with great sadness that we report that a total of six fatalities occurred at our operations during 2006: four occurred at the closed Sullivan mine involving an employee and an environmental consultant, and two paramedics who perished during the rescue attempt; a contractor at our Morelos exploration project in Mexico and, recently, a geologist
working at the Red Dog Mine. We have all been deeply affected by these tragic events, and all of our employees and contractors are being asked to continue to strive towards our goal of zero incidents. On behalf of Teck Cominco and all of our employees, we express our most heartfelt condolences to the families and loved ones of the victims.
We are pleased to report that fi ve Company and Elk Valley Coal mine operations were recognized for outstanding reclamation progress during the year. In British Columbia, the Fording River Mine received the overall award for excellence from the B.C. Ministry of Energy, Mines and Petroleum Resources Awards Committee (www.trcr.bc.ca), while the Elkview Mine and Highland Valley Copper received citations for excellence in the coal and metal mines categories respectively. In Alberta, the Cardinal River Mine won the Alberta Chamber of Resources award for its Sphinx Lake reclamation program. Finally, Antamina was awarded the Peruvian National Mining and Oil Societies award for conservation initiatives at the Polylepsis Conservation Project.
Teck Cominco operates on the fundamental principle of continuous improvement through a broad range of sustainability initiatives. In order to monitor our progress in meeting corporate sustainability objectives, we use various indicators across the different aspects of sustainability (i.e., environmental, safety, health, social, economic, community). The adjoining table provides a snapshot of performance trends over the past three years and is elaborated upon in more detail in our annual corporate sustainability report.
Establishing low-cost, long-life operations that serve as stable economic engines to support regional development has enabled Teck Cominco to contribute to the sustainability of communities near our operations. By building wealth and prosperity, Teck Cominco contributes to human development, socioeconomic infrastructure and the creation of opportunities for people in the communities and regions in which we operate.
In Peru, for example, the Antamina mine, located in a country where poverty is widespread, generated signifi cant wages, taxes and local procurement in 2006. As part of its commitment to local communities, and in cooperation with the government of Peru, Antamina created a US$65 million sustainability fund in 2006. The fund will be used to improve the health, welfare
Prevention and response exercises are essential to maintaining health and safety on the worksite.
Teck Cominco Limited
54
Environment, Health and Safety, and Community
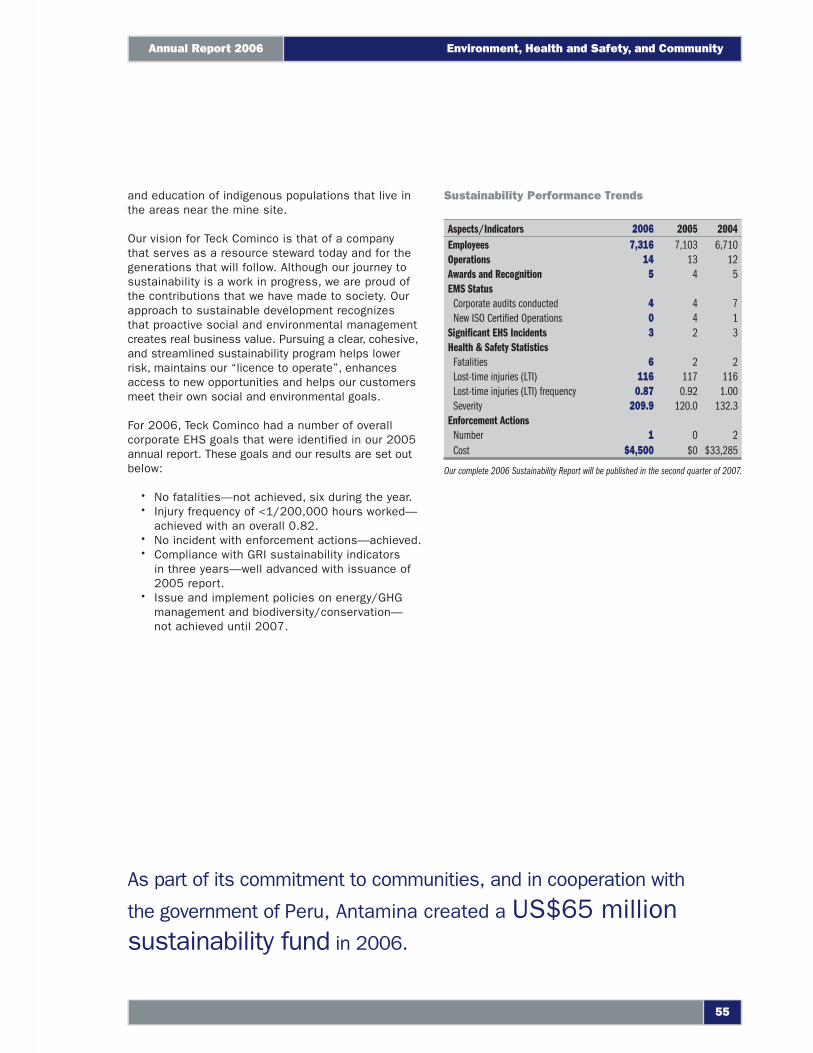
and education of indigenous populations that live in the areas near the mine site.
Our vision for Teck Cominco is that of a company that serves as a resource steward today and for the generations that will follow. Although our journey to sustainability is a work in progress, we are proud of the contributions that we have made to society. Our approach to sustainable development recognizes that proactive social and environmental management creates real business value. Pursuing a clear, cohesive, and streamlined sustainability program helps lower risk, maintains our “licence to operate”, enhances access to new opportunities and helps our customers meet their own social and environmental goals.
For 2006, Teck Cominco had a number of overall corporate EHS goals that were identifi ed in our 2005 annual report. These goals and our results are set out below:
No fatalities—not achieved, six during the year.Injury frequency of <1/200,000 hours worked—achieved with an overall 0.82.No incident with enforcement actions—achieved.Compliance with GRI sustainability indicators in three years—well advanced with issuance of 2005 report.Issue and implement policies on energy/GHG management and biodiversity/conservation—not achieved until 2007.
••
••
•
As part of its commitment to communities, and in cooperation with
the government of Peru, Antamina created a US$65 million sustainability fund in 2006.
Sustainability Performance Trends
Aspects/Indicators 2006 2005 2004Employees 7,316 7,103 6,710Operations 14 13 12Awards and Recognition 5 4 5EMS Status
Corporate audits conducted 4 4 7New ISO Certifi ed Operations 0 4 1
Significant EHS Incidents 3 2 3Health & Safety Statistics
Fatalities 6 2 2Lost-time injuries (LTI) 116 117 116Lost-time injuries (LTI) frequency 0.87 0.92 1.00Severity 209.9 120.0 132.3
Enforcement Actions Number 1 0 2Cost $4,500 $0 $33,285
Our complete 2006 Sustainability Report will be published in the second quarter of 2007.
55
Annual Report 2006 Environment, Health and Safety, and Community
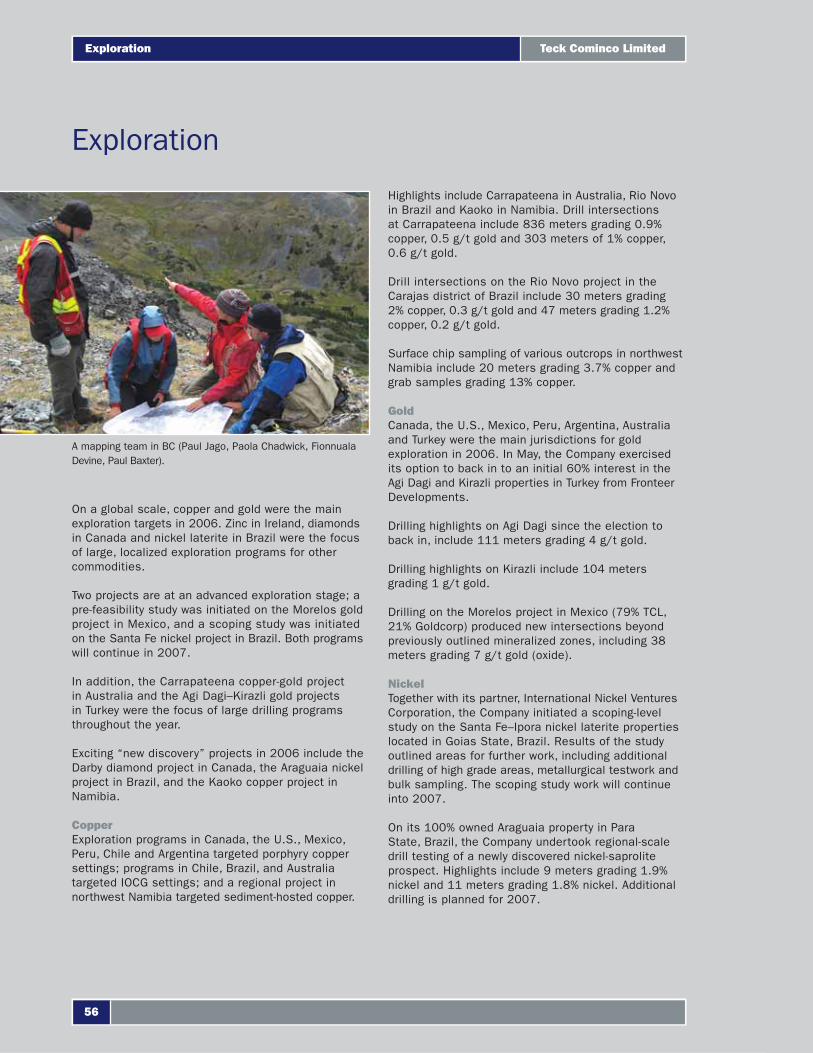
On a global scale, copper and gold were the main exploration targets in 2006. Zinc in Ireland, diamonds in Canada and nickel laterite in Brazil were the focus of large, localized exploration programs for other commodities.
Two projects are at an advanced exploration stage; a pre-feasibility study was initiated on the Morelos gold project in Mexico, and a scoping study was initiated on the Santa Fe nickel project in Brazil. Both programs will continue in 2007.
In addition, the Carrapateena copper-gold project in Australia and the Agi Dagi–Kirazli gold projects in Turkey were the focus of large drilling programs throughout the year.
Exciting “new discovery” projects in 2006 include the Darby diamond project in Canada, the Araguaia nickel project in Brazil, and the Kaoko copper project in Namibia.
CopperExploration programs in Canada, the U.S., Mexico, Peru, Chile and Argentina targeted porphyry copper settings; programs in Chile, Brazil, and Australia targeted IOCG settings; and a regional project in northwest Namibia targeted sediment-hosted copper.
Highlights include Carrapateena in Australia, Rio Novo in Brazil and Kaoko in Namibia. Drill intersections at Carrapateena include 836 meters grading 0.9% copper, 0.5 g/t gold and 303 meters of 1% copper, 0.6 g/t gold.
Drill intersections on the Rio Novo project in the Carajas district of Brazil include 30 meters grading 2% copper, 0.3 g/t gold and 47 meters grading 1.2% copper, 0.2 g/t gold.
Surface chip sampling of various outcrops in northwest Namibia include 20 meters grading 3.7% copper and grab samples grading 13% copper.
GoldCanada, the U.S., Mexico, Peru, Argentina, Australia and Turkey were the main jurisdictions for gold exploration in 2006. In May, the Company exercised its option to back in to an initial 60% interest in the Agi Dagi and Kirazli properties in Turkey from Fronteer Developments.
Drilling highlights on Agi Dagi since the election to back in, include 111 meters grading 4 g/t gold.
Drilling highlights on Kirazli include 104 meters grading 1 g/t gold.
Drilling on the Morelos project in Mexico (79% TCL, 21% Goldcorp) produced new intersections beyond previously outlined mineralized zones, including 38 meters grading 7 g/t gold (oxide).
NickelTogether with its partner, International Nickel Ventures Corporation, the Company initiated a scoping-level study on the Santa Fe–Ipora nickel laterite properties located in Goias State, Brazil. Results of the study outlined areas for further work, including additional drilling of high grade areas, metallurgical testwork and bulk sampling. The scoping study work will continue into 2007.
On its 100% owned Araguaia property in Para State, Brazil, the Company undertook regional-scale drill testing of a newly discovered nickel-saprolite prospect. Highlights include 9 meters grading 1.9% nickel and 11 meters grading 1.8% nickel. Additional drilling is planned for 2007.
Exploration
A mapping team in BC (Paul Jago, Paola Chadwick, Fionnuala Devine, Paul Baxter).
Teck Cominco Limited
56
Exploration
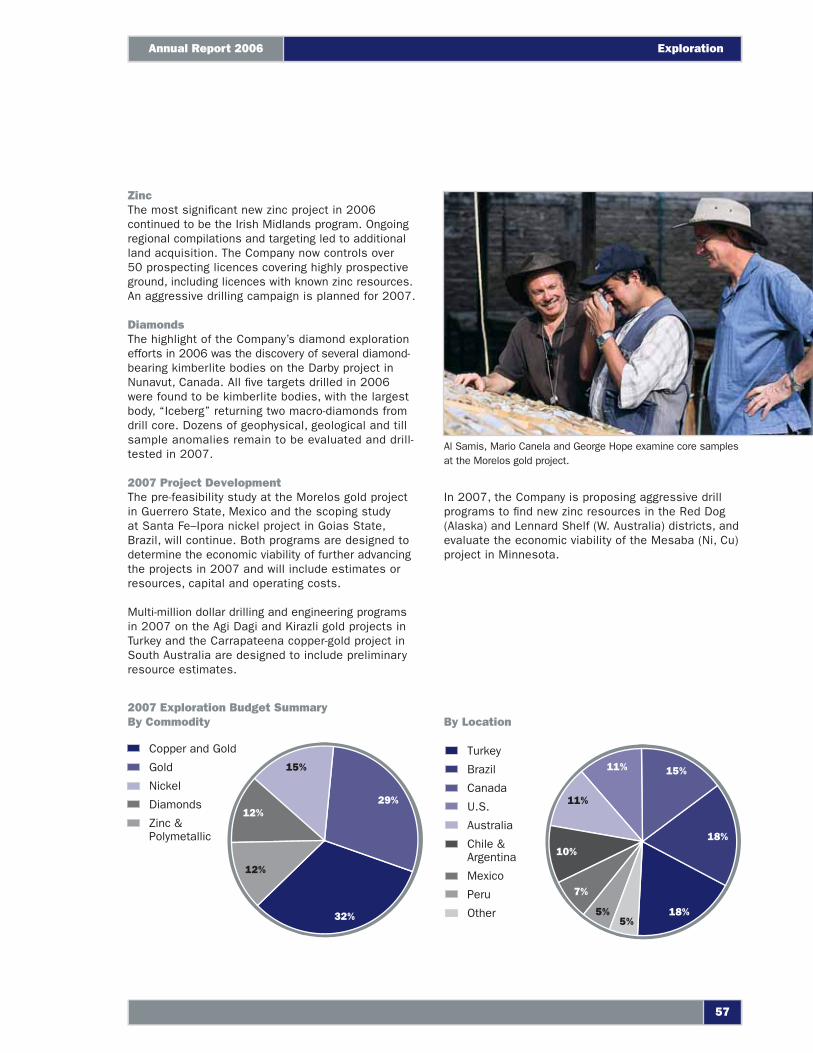
Copper and Gold
Gold
Nickel
Diamonds
Zinc &Polymetallic
29%
32%
12%
15%
12%
Turkey
Brazil
Canada
U.S.
Australia
Chile & Argentina
Mexico
Peru
Other
10%
11%
11%
18%
18%
15%
7%
5%5%
ZincThe most signifi cant new zinc project in 2006 continued to be the Irish Midlands program. Ongoing regional compilations and targeting led to additional land acquisition. The Company now controls over 50 prospecting licences covering highly prospective ground, including licences with known zinc resources. An aggressive drilling campaign is planned for 2007.
DiamondsThe highlight of the Company’s diamond exploration efforts in 2006 was the discovery of several diamond-bearing kimberlite bodies on the Darby project in Nunavut, Canada. All fi ve targets drilled in 2006 were found to be kimberlite bodies, with the largest body, “Iceberg” returning two macro-diamonds from drill core. Dozens of geophysical, geological and till sample anomalies remain to be evaluated and drill-tested in 2007.
2007 Project DevelopmentThe pre-feasibility study at the Morelos gold project in Guerrero State, Mexico and the scoping study at Santa Fe–Ipora nickel project in Goias State, Brazil, will continue. Both programs are designed to determine the economic viability of further advancing the projects in 2007 and will include estimates or resources, capital and operating costs.
Multi-million dollar drilling and engineering programs in 2007 on the Agi Dagi and Kirazli gold projects in Turkey and the Carrapateena copper-gold project in South Australia are designed to include preliminary resource estimates.
In 2007, the Company is proposing aggressive drill programs to fi nd new zinc resources in the Red Dog (Alaska) and Lennard Shelf (W. Australia) districts, and evaluate the economic viability of the Mesaba (Ni, Cu) project in Minnesota.
2007 Exploration Budget Summary By Commodity
By Location
Al Samis, Mario Canela and George Hope examine core samples at the Morelos gold project.
57
Annual Report 2006 Exploration
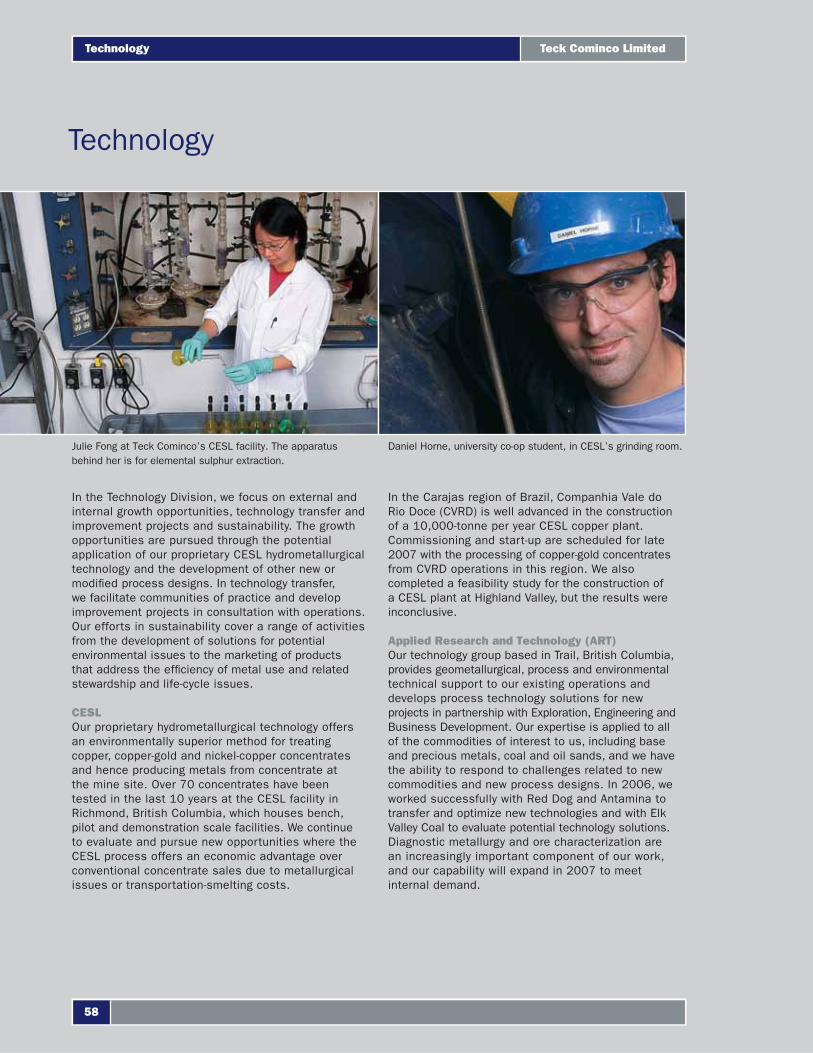
In the Technology Division, we focus on external and internal growth opportunities, technology transfer and improvement projects and sustainability. The growth opportunities are pursued through the potential application of our proprietary CESL hydrometallurgical technology and the development of other new or modifi ed process designs. In technology transfer, we facilitate communities of practice and develop improvement projects in consultation with operations. Our efforts in sustainability cover a range of activities from the development of solutions for potential environmental issues to the marketing of products that address the effi ciency of metal use and related stewardship and life-cycle issues.
CESLOur proprietary hydrometallurgical technology offers an environmentally superior method for treating copper, copper-gold and nickel-copper concentrates and hence producing metals from concentrate at the mine site. Over 70 concentrates have been tested in the last 10 years at the CESL facility in Richmond, British Columbia, which houses bench, pilot and demonstration scale facilities. We continue to evaluate and pursue new opportunities where the CESL process offers an economic advantage over conventional concentrate sales due to metallurgical issues or transportation-smelting costs.
In the Carajas region of Brazil, Companhia Vale do Rio Doce (CVRD) is well advanced in the construction of a 10,000-tonne per year CESL copper plant. Commissioning and start-up are scheduled for late 2007 with the processing of copper-gold concentrates from CVRD operations in this region. We also completed a feasibility study for the construction of a CESL plant at Highland Valley, but the results were inconclusive.
Applied Research and Technology (ART)Our technology group based in Trail, British Columbia, provides geometallurgical, process and environmental technical support to our existing operations and develops process technology solutions for new projects in partnership with Exploration, Engineering and Business Development. Our expertise is applied to all of the commodities of interest to us, including base and precious metals, coal and oil sands, and we have the ability to respond to challenges related to new commodities and new process designs. In 2006, we worked successfully with Red Dog and Antamina to transfer and optimize new technologies and with Elk Valley Coal to evaluate potential technology solutions. Diagnostic metallurgy and ore characterization are an increasingly important component of our work, and our capability will expand in 2007 to meet internal demand.
Technology
Julie Fong at Teck Cominco’s CESL facility. The apparatus behind her is for elemental sulphur extraction.
Daniel Horne, university co-op student, in CESL’s grinding room.
Teck Cominco Limited
58
Technology
Environmental technology is directed at fi nding innovative solutions to potential impacts at operations. Our work has focused on water treatment options for Red Dog, Pend Oreille and Elk Valley Coal.
Product Technology Centre (PTC)Our group in the Product Technology Centre in Mississauga, Ontario, has a long history of developing products and technologies that support metal sales and our customers, particularly related to zinc and lead but also various specialty metals. Much of our work is based on the principles of sustainability, product stewardship and metal life cycles, for example by decreasing the thickness of galvanizing coatings while increasing their corrosion resistance.
Our battery technology group at PTC supplies manufacturing equipment for the effi cient production of lead-acid batteries. In collaboration with our wholly owned subsidiary H. Folke Sandelin AB in Sweden, we are developing new products to manufacture lighter plates for cheaper and more reliable lead-acid batteries—all desirable features in the drive for effi ciency in the automotive sector. We are also involved in research into new innovative batteries using zinc in various forms. Our zinc-air battery has been tested at various scales, and further trials are proposed for 2007.
Other Technology ActivitiesIn addition to the three main research groups, our Knowledge-Technology group facilitates knowledge sharing and knowledge protection activities. This group supports other business units and works closely with Information Technology.
In 2006, we re-engaged with ZincOx Resources, a company that we have backed from initiation in 1999. ZincOx has a new business model for zinc recycling based on the use of proprietary technology to process electric arc furnace dust. Our recent investments expose us to this attractive business, which is consistent with our sustainability goals. Strategic investments of this type increase our exposure to new technologies and their application.
Much of our long-term research is levered through collaborative programs either organized through AMIRA International and other similar research brokers or developed directly with universities. The galvanizing simulator laboratory at PTC is a partnership with McMaster University. In the past we have supported fi ve research chairs fully or in partnership with others. We maintain strong relationships with many universities and participate in industry advisory committees to programs at the University of British Columbia and Laurentian University. Our interaction with universities is critical to the search for future technical employees.
Rajindra Singh, technician, at Teck Cominco’s Product Technology Centre.
59
Annual Report 2006 Technology
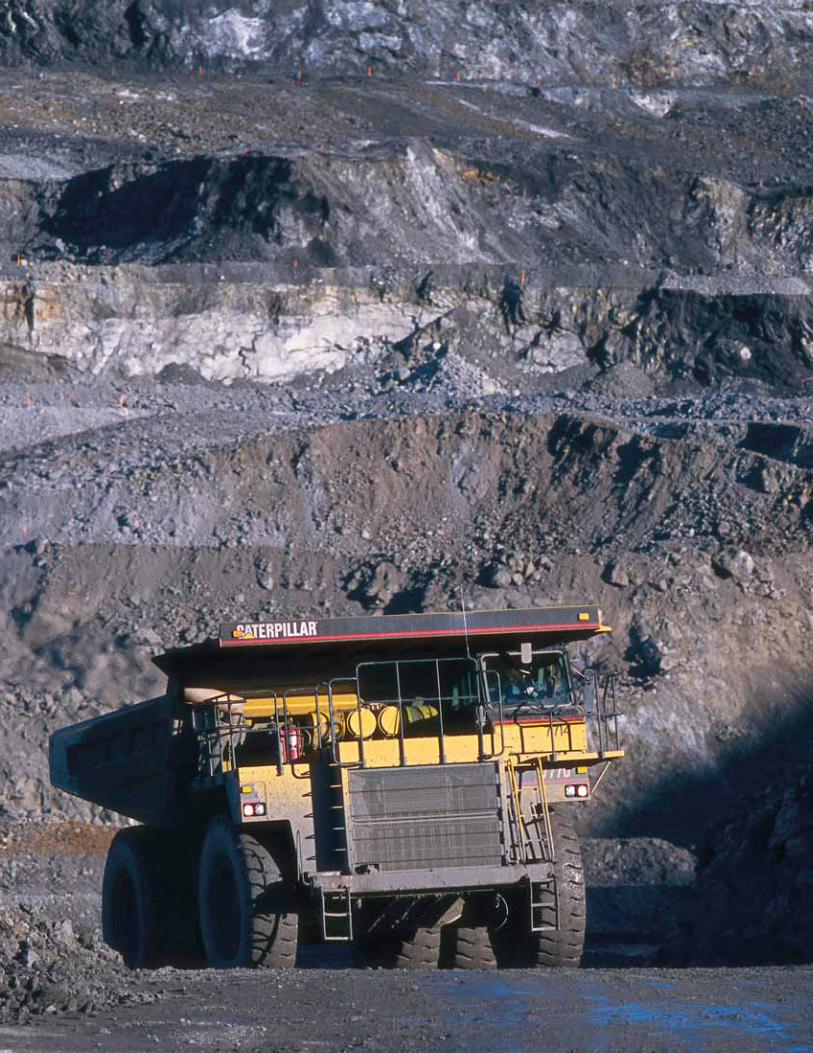
the Company’s internal auditors and the independent auditors to review the scope and results of the annual audit and to review the fi nancial statements and related fi nancial reporting and internal control matters before the fi nancial statements are approved by the Board of Directors and submitted to the shareholders of the Company.
PricewaterhouseCoopers, an independent registered public accounting fi rm, appointed by the shareholders, have audited the Company’s fi nancial statements in accordance with Canadian generally accepted auditing standards and have expressed their opinion in the auditor’s report. Management’s assessment of the effectiveness of the Company’s internal control over fi nancial reporting as at December 31, 2006 has also been audited by PricewaterhouseCoopers, and their opinion is included in their report.
Donald R. LindsayPresident and Chief Executive Offi cer
Ronald A. MillosSenior Vice President, Financeand Chief Financial Offi cer
February 26, 2007
Management’s Responsibility for Financial Reporting
Management of Teck Cominco Limited is responsible for the integrity and fair presentation of the fi nancial information contained in this annual report. Where appropriate, the fi nancial information, including fi nancial statements, refl ects amounts based on the best estimates and judgments of management. The fi nancial statements have been prepared in accordance with accounting principles generally accepted in Canada. Financial information presented elsewhere in the annual report is consistent with that disclosed in the fi nancial statements.
Management is responsible for establishing and maintaining adequate internal control over fi nancial reporting. Any system of internal control over fi nancial reporting, no matter how well designed, has inherent limitations. Therefore, even those systems determined to be effective can provide only reasonable assurance with respect to fi nancial statement preparation and presentation. The system of controls is also supported by a professional staff of internal auditors who conduct periodic audits of many aspects of the Company’s operations and report their fi ndings to management and the Audit Committee.
Management has a process in place to evaluate internal control over fi nancial reporting based on the criteria established by the Committee of Sponsoring Organizations of the Treadway Commission (COSO) in Internal Control—Integrated Framework. Based on that evaluation, management has concluded that internal control over fi nancial reporting was effective as of December 31, 2006.
The Board of Directors oversees management’s responsibility for fi nancial reporting and internal control systems through an Audit Committee, which is composed entirely of independent directors. The Audit Committee meets periodically with management,
61
Annual Report 2006 Management’s Responsibility for Financial Reporting
Independent Auditor’s Report
To the Shareholders of Teck Cominco Limited
We have completed an integrated audit of the consolidated fi nancial statements and internal control over fi nancial reporting of Teck Cominco Limited as of December 31, 2006 and audits of the Company’s December 31, 2005, and December 31, 2004, consolidated fi nancial statements. Our opinions, based on our audits, are presented below.
Consolidated fi nancial statements We have audited the accompanying consolidated balance sheets of Teck Cominco Limited as at December 31, 2006, and December 31, 2005, and the related consolidated statements of earnings, retained earnings and cash fl ows for each of the three years in the period ended December 31, 2006. These fi nancial statements are the responsibility of the Company’s management. Our responsibility is to express an opinion on these fi nancial statements based on our audits.
We conducted our audit of the Company’s fi nancial statements as at December 31, 2006, and for the year then ended in accordance with Canadian generally accepted auditing standards and the standards of the Public Company Accounting Oversight Board (United States). We conducted our audits of the Company’s fi nancial statements as at December 31, 2005 and December 31, 2004, and for each of the two years in the period ended December 31, 2005, in accordance with Canadian generally accepted auditing standards. Those standards require that we plan and perform an audit to obtain reasonable assurance about whether the fi nancial statements are free of material misstatement. An audit of fi nancial statements includes examining, on a test basis, evidence supporting the amounts and disclosures in the fi nancial statements. A fi nancial statement audit also includes assessing the accounting principles used and signifi cant estimates made by management, and evaluating the overall fi nancial statement presentation.
In our opinion, the consolidated fi nancial statements referred to above present fairly, in all material respects, the fi nancial position of the Company as at December 31, 2006, and December 31, 2005, and the results of its operations and its cash fl ows for each of the three years in the period ended December 31, 2006, in accordance with Canadian generally accepted accounting principles.
Internal control over fi nancial reporting We have also audited management’s assessment, set out in Management’s Report on Internal Control over Financial Reporting included in Management’s Discussion and Analysis of Financial Position and Operating Results, that the Company maintained effective internal control over fi nancial reporting as of December 31, 2006, based on criteria established in Internal Control—Integrated Framework issued by the Committee of Sponsoring Organizations of the Treadway Commission (COSO). The Company’s management is responsible for maintaining effective internal control over fi nancial reporting and for its assessment of the effectiveness of internal control over fi nancial reporting. Our responsibility is to express opinions on management’s assessment and on the effectiveness of the Company’s internal control over fi nancial reporting based on our audit.
We conducted our audit of internal control over fi nancial reporting in accordance with the standards of the Public Company Accounting Oversight Board (United States). Those standards require that we plan and perform the audit to obtain reasonable assurance about whether effective internal control over fi nancial reporting was maintained in all material respects. An audit of internal control over fi nancial reporting includes obtaining an understanding of internal control over fi nancial reporting, evaluating management’s assessment, testing and evaluating the design and operating effectiveness of internal control, and performing such other procedures as we consider necessary in the circumstances. We believe that our audit provides a reasonable basis for our opinions.
A company’s internal control over fi nancial reporting is a process designed to provide reasonable assurance regarding the reliability of fi nancial reporting and the preparation of fi nancial statements for external purposes in accordance with generally accepted accounting principles. A company’s internal control over fi nancial reporting includes those policies and procedures that (i) pertain to the maintenance of records that, in reasonable detail, accurately and fairly refl ect the transactions and dispositions of the assets of the company; (ii) provide reasonable assurance that transactions are recorded as necessary to permit preparation of fi nancial statements in accordance with generally accepted accounting principles, and that receipts and expenditures of the company are
Teck Cominco Limited
62
Independent Auditor’s Report
being made only in accordance with authorizations of management and directors of the company; and (iii) provide reasonable assurance regarding prevention or timely detection of the unauthorized acquisition, use, or disposition of the company’s assets that could have a material effect on the fi nancial statements.
Because of its inherent limitations, internal control over fi nancial reporting may not prevent or detect misstatements. Also, projections of any evaluation of effectiveness to future periods are subject to the risk that controls may become inadequate because of changes in conditions, or that the degree of compliance with the policies or procedures may deteriorate.
In our opinion, management’s assessment that the Company maintained effective internal control over fi nancial reporting as at December 31, 2006 is fairly stated, in all material respects, based on criteria established in Internal Control—Integrated Framework issued by the COSO. Furthermore, in our opinion, the Company maintained, in all material respects, effective internal control over fi nancial reporting as of December 31, 2006 based on criteria established in Internal Control—Integrated Framework issued by the COSO.
Chartered AccountantsVancouver, British ColumbiaFebruary 26, 2007
63
Annual Report 2006 Independent Auditor’s Report
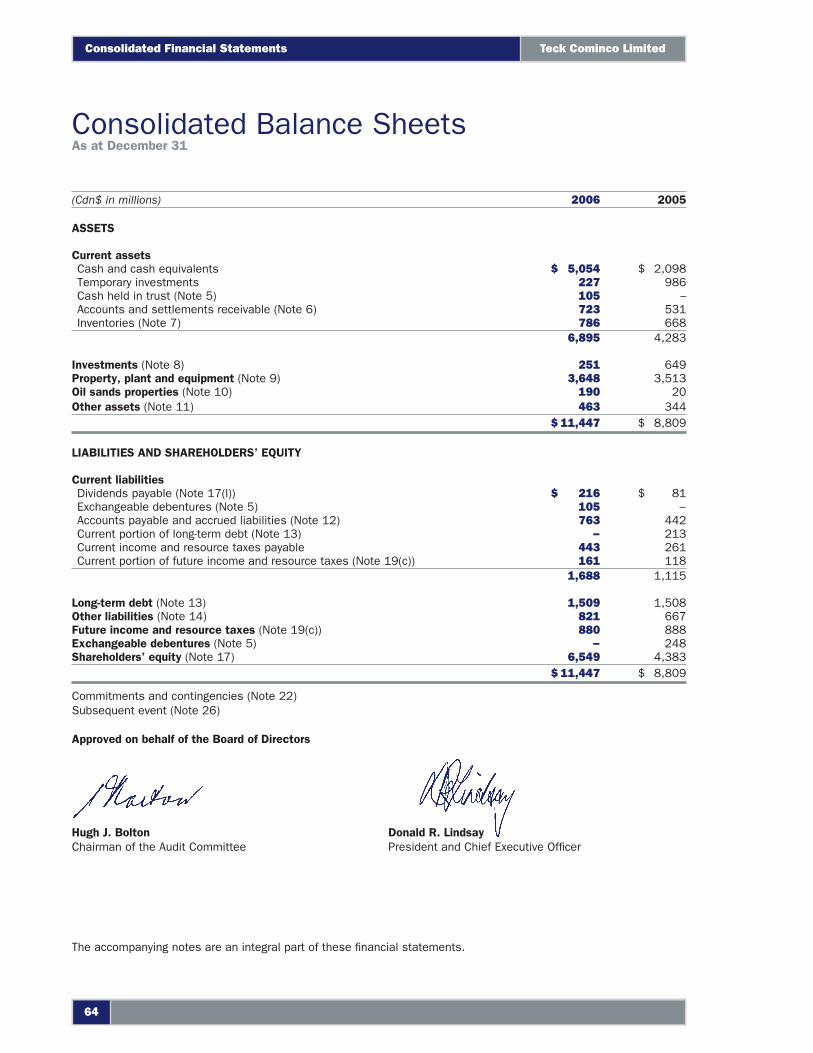
(Cdn$ in millions) 2006 2005
ASSETS
Current assetsCash and cash equivalents $ 5,054 $ 2,098Temporary investments 227 986Cash held in trust (Note 5) 105 –Accounts and settlements receivable (Note 6) 723 531Inventories (Note 7) 786 668
6,895 4,283
Investments (Note 8) 251 649Property, plant and equipment (Note 9) 3,648 3,513Oil sands properties (Note 10) 190 20Other assets (Note 11) 463 344
$ 11,447 $ 8,809
LIABILITIES AND SHAREHOLDERS’ EQUITY
Current liabilitiesDividends payable (Note 17(l)) $ 216 $ 81Exchangeable debentures (Note 5) 105 −Accounts payable and accrued liabilities (Note 12) 763 442Current portion of long-term debt (Note 13) − 213Current income and resource taxes payable 443 261Current portion of future income and resource taxes (Note 19(c)) 161 118
1,688 1,115
Long-term debt (Note 13) 1,509 1,508Other liabilities (Note 14) 821 667Future income and resource taxes (Note 19(c)) 880 888Exchangeable debentures (Note 5) − 248Shareholders’ equity (Note 17) 6,549 4,383
$ 11,447 $ 8,809
Commitments and contingencies (Note 22)Subsequent event (Note 26)
Approved on behalf of the Board of Directors
Hugh J. Bolton Donald R. LindsayChairman of the Audit Committee President and Chief Executive Offi cer
Consolidated Balance SheetsAs at December 31
The accompanying notes are an integral part of these fi nancial statements.
Teck Cominco Limited
64
Consolidated Financial Statements
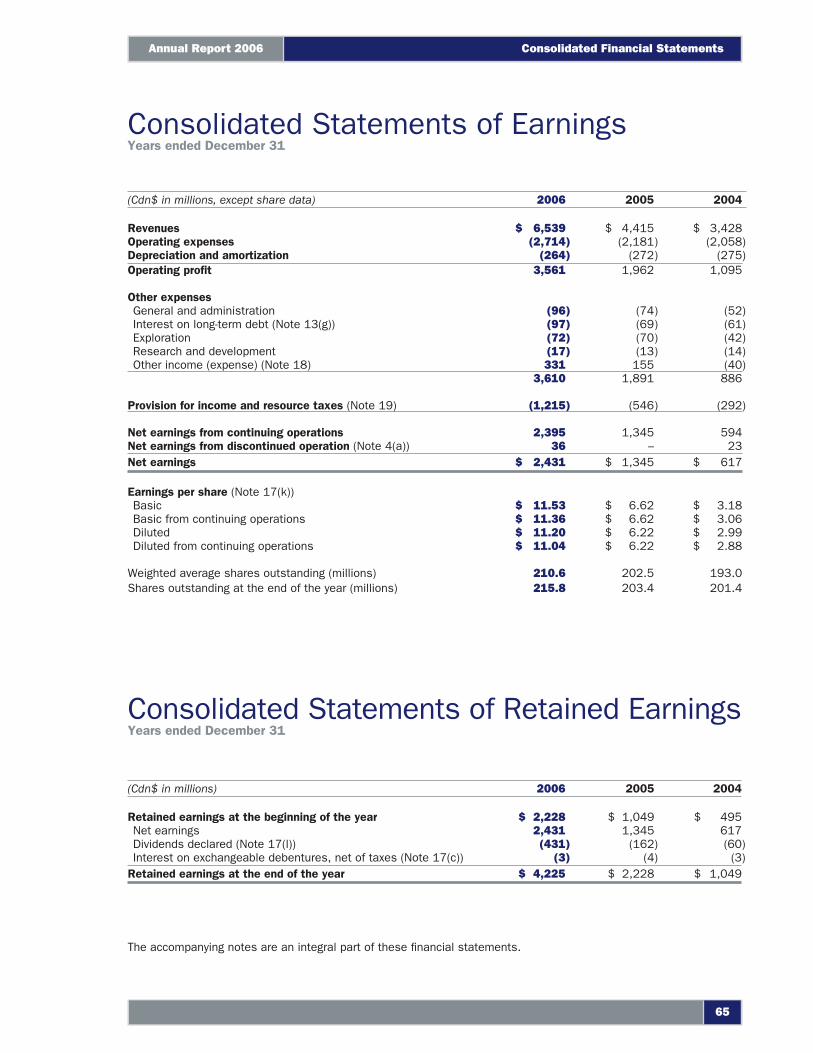
(Cdn$ in millions, except share data) 2006 2005 2004
Revenues $ 6,539 $ 4,415 $ 3,428Operating expenses (2,714) (2,181) (2,058)Depreciation and amortization (264) (272) (275)Operating profi t 3,561 1,962 1,095
Other expensesGeneral and administration (96) (74) (52)Interest on long-term debt (Note 13(g)) (97) (69) (61)Exploration (72) (70) (42)Research and development (17) (13) (14)Other income (expense) (Note 18) 331 155 (40)
3,610 1,891 886
Provision for income and resource taxes (Note 19) (1,215) (546) (292)
Net earnings from continuing operations 2,395 1,345 594Net earnings from discontinued operation (Note 4(a)) 36 – 23Net earnings $ 2,431 $ 1,345 $ 617
Earnings per share (Note 17(k))Basic $ 11.53 $ 6.62 $ 3.18Basic from continuing operations $ 11.36 $ 6.62 $ 3.06Diluted $ 11.20 $ 6.22 $ 2.99Diluted from continuing operations $ 11.04 $ 6.22 $ 2.88
Weighted average shares outstanding (millions) 210.6 202.5 193.0Shares outstanding at the end of the year (millions) 215.8 203.4 201.4
(Cdn$ in millions) 2006 2005 2004
Retained earnings at the beginning of the year $ 2,228 $ 1,049 $ 495Net earnings 2,431 1,345 617Dividends declared (Note 17(l)) (431) (162) (60)Interest on exchangeable debentures, net of taxes (Note 17(c)) (3) (4) (3)
Retained earnings at the end of the year $ 4,225 $ 2,228 $ 1,049
Consolidated Statements of Retained EarningsYears ended December 31
The accompanying notes are an integral part of these fi nancial statements.
Consolidated Statements of EarningsYears ended December 31
65
Annual Report 2006 Consolidated Financial Statements
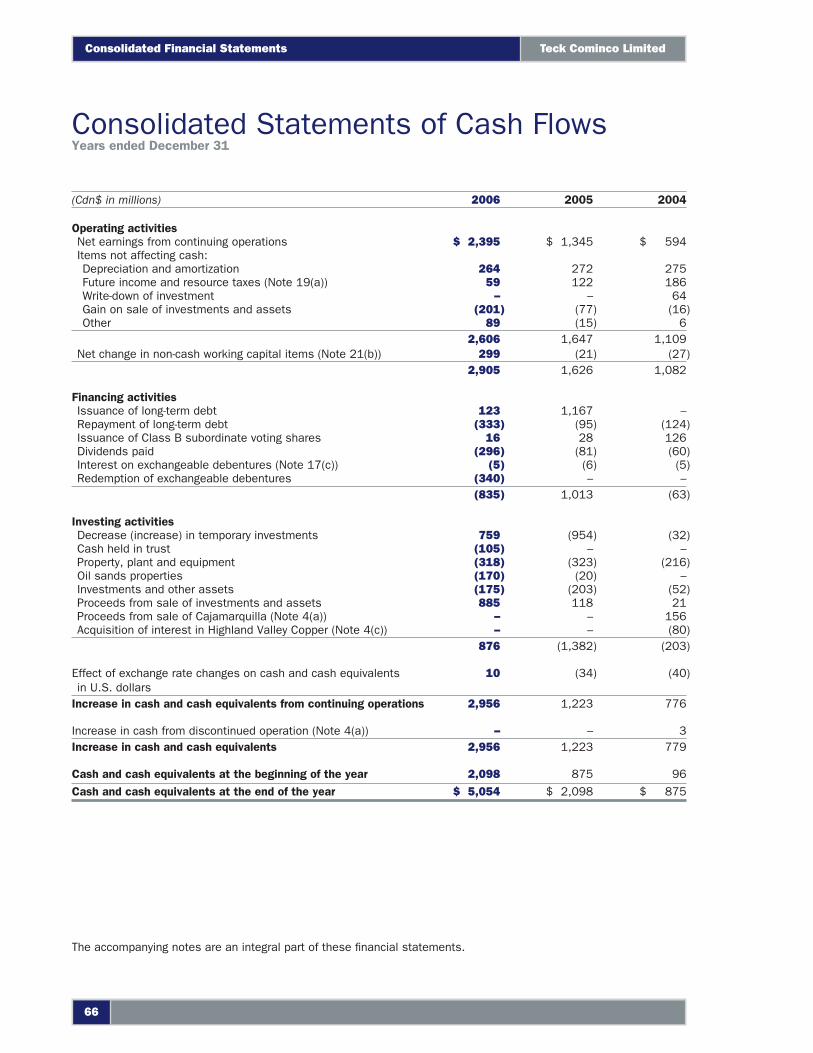
(Cdn$ in millions) 2006 2005 2004
Operating activitiesNet earnings from continuing operations $ 2,395 $ 1,345 $ 594Items not affecting cash:Depreciation and amortization 264 272 275Future income and resource taxes (Note 19(a)) 59 122 186Write-down of investment – – 64Gain on sale of investments and assets (201) (77) (16)Other 89 (15) 6
2,606 1,647 1,109Net change in non-cash working capital items (Note 21(b)) 299 (21) (27)
2,905 1,626 1,082
Financing activitiesIssuance of long-term debt 123 1,167 –Repayment of long-term debt (333) (95) (124)Issuance of Class B subordinate voting shares 16 28 126Dividends paid (296) (81) (60)Interest on exchangeable debentures (Note 17(c)) (5) (6) (5)Redemption of exchangeable debentures (340) – –
(835) 1,013 (63)
Investing activitiesDecrease (increase) in temporary investments 759 (954) (32)Cash held in trust (105) – –Property, plant and equipment (318) (323) (216)Oil sands properties (170) (20) –Investments and other assets (175) (203) (52)Proceeds from sale of investments and assets 885 118 21Proceeds from sale of Cajamarquilla (Note 4(a)) – – 156Acquisition of interest in Highland Valley Copper (Note 4(c)) – – (80)
876 (1,382) (203)
Effect of exchange rate changes on cash and cash equivalents in U.S. dollars
10 (34) (40)
Increase in cash and cash equivalents from continuing operations 2,956 1,223 776
Increase in cash from discontinued operation (Note 4(a)) – – 3Increase in cash and cash equivalents 2,956 1,223 779
Cash and cash equivalents at the beginning of the year 2,098 875 96
Cash and cash equivalents at the end of the year $ 5,054 $ 2,098 $ 875
The accompanying notes are an integral part of these fi nancial statements.
Consolidated Statements of Cash FlowsYears ended December 31
Teck Cominco Limited
66
Consolidated Financial Statements
1. NATURE OF OPERATIONS
Teck Cominco Limited (referred to as the “Company”) is engaged in mining and related activities including exploration, development, processing, smelting and refi ning. The Company’s major products are zinc, copper and metallurgical coal. The Company also produces precious metals, lead, molybdenum, electrical power, fertilizers and various specialty metals. Metal products are sold as refi ned metals, concentrates or both. The Company also owns an interest in certain oil sands leases and has a partnership interest in an oil sands development project.
2. SIGNIFICANT ACCOUNTING POLICIES
Generally Accepted Accounting PrinciplesThese consolidated fi nancial statements are prepared using Generally Accepted Accounting Principles (GAAP) in Canada. Note 25 reconciles the consolidated fi nancial statements prepared in accordance with accounting principles generally accepted in Canada to fi nancial statements prepared with accounting principles generally accepted in the United States.
Basis of PresentationThese consolidated fi nancial statements include the accounts of the Company and all of its subsidiaries. The signifi cant subsidiaries include Teck Cominco Metals Ltd. (TCML), Teck Cominco American Inc. (TCAI) and Teck Cominco Alaska Inc. (TCAK). Many of the Company’s mining activities are conducted through interests in entities where the Company shares joint control including Compañìa Minera Antamina (Antamina), Elk Valley Coal Partnership (Elk Valley Coal), and Pogo Joint Venture (Pogo). These entities are accounted for using the proportionate consolidation method.
Certain comparative fi gures have been reclassifi ed to conform with the presentation adopted for the current period.
Use of EstimatesThe preparation of fi nancial statements in conformity with GAAP requires management to make estimates and assumptions that affect the amounts reported in the consolidated fi nancial statements. Signifi cant areas where management’s judgment is applied include asset and investment valuations, ore reserve
estimations, fi nished and in-process inventory quantities, plant and equipment lives, contingent liabilities including matters in litigation, tax provisions and future tax balances including valuation allowances in respect of future tax balances, asset retirement obligations and other environmental liabilities, pension and other post- retirement benefi ts and other accrued liabilities. Actual results could differ from these estimates.
Translation of Foreign CurrenciesThe Company’s functional currency is the Canadian dollar. For integrated foreign operations, monetary assets and liabilities are translated at year-end exchange rates and other assets and liabilities are translated at historical rates. Revenues, expenses and cash fl ows are translated at monthly average exchange rates. Gains and losses on translation of monetary assets and monetary liabilities are charged to earnings.
The accounts of self-sustaining foreign operations are translated at year-end exchange rates, and revenues and expenses are translated at monthly average exchange rates. Differences arising from these foreign currency translations are recorded in shareholders’ equity as a cumulative translation adjustment until they are realized by a reduction in the investment.
Cash and Cash EquivalentsCash and cash equivalents include cash on account, demand deposits and money market investments with maturities from the date of acquisition of three months or less which are readily convertible to known amounts of cash and are subject to insignifi cant changes in value.
Temporary InvestmentsTemporary investments are carried at cost and translated at year-end foreign exchange rates. They include money market investments with maturities from the date of acquisition of greater than three months.
InventoriesFinished products, work in process and raw material inventories are valued at the lower of cost and net realizable value. Raw materials include concentrates for use at smelting and refi ning operations. Work in process inventory includes inventory in the milling, smelting or refi ning process and stockpiled ore at mining operations.
Notes to Consolidated Financial StatementsYears ended December 31, 2006, 2005 and 2004
Consolidated Financial Statements
67
Annual Report 2006
Supplies inventory is valued at the lower of average cost and replacement value.
For work in process and fi nished product inventories, cost includes all direct costs incurred in production including direct labour and materials, freight, depreciation and amortization and directly attributable overhead costs. For supplies and raw materials, cost includes acquisition, freight and other directly attributable costs.
The Company uses both joint-product and by-product costing for work in process and fi nished product inventories. Joint costing is applied to primary products at the Red Dog, Antamina and Pend Oreille mines and the Trail operations, where the profi tability of the operation is dependent upon the production of a number of primary products. Joint costing allocates total production costs based on the relative values of the products. Where by-product costing is used, by-products are allocated the incremental costs of processes that are specifi c to the production of that product.
InvestmentsInvestments in Fording Canadian Coal Trust (Fording) and the Fort Hills Energy Limited Partnership (Fort Hills) are accounted for using the equity method as the Company is considered to have signifi cant infl uence over these investments. Investments other than Fording and Fort Hills are carried at cost less any amounts written off to refl ect an impairment in value that is considered to be other than temporary.
Property, Plant and Equipment(a) Plant and equipment
Plant and equipment are recorded at cost. The cost of plant and processing equipment at the Company’s mining operations is amortized on a units of production basis over the lesser of the estimated useful life of the asset or the estimated proven and probable ore reserves. Amortization of plant and equipment at smelting operations is calculated on a straight-line basis over the estimated useful life of the asset. Mobile equipment is depreciated over the estimated equipment operating hours. Buildings are amortized on a straight-line basis
over their estimated useful life, not exceeding the estimated life of the mine.
(b) Mineral properties and development costs
Acquisition, exploration and evaluation costs are charged to earnings in the year in which they are incurred, except where these costs relate to specifi c properties for which resources as defi ned under National Instrument 43–101 exist and it is expected that the expenditure can be recovered by future exploitation or sale, in which case they are deferred.
When the Company incurs debt directly related to the construction of a new operation or major expansion, the interest and fi nancing costs associated with such debt are capitalized during the construction period.
Upon commencement of commercial production, mineral properties and deferred costs relating to mines are amortized over the estimated life of the proven and probable reserves to which they relate calculated on a units of production basis.
(c) Underground development costs
Underground development costs are amortized using the block amortization method. Under this method development costs associated with each section of the mine are amortized over the reserves of that particular section of the mine.
(d) Asset impairment
The Company performs impairment tests on its property, plant and equipment when events or changes in circumstance indicate that the carrying value of an asset may not be recoverable. These tests compare expected undiscounted future cash fl ows from these assets to their carrying values. If shortfalls exist, assets are written down to the discounted value of the future cash fl ows based on the Company’s average cost of borrowing.
2. SIGNIFICANT ACCOUNTING POLICIES, continued
Consolidated Financial Statements Teck Cominco Limited
68
(e) Repairs and maintenance
Repairs and maintenance, including shutdown maintenance costs, are charged to expense as incurred except when these repairs signifi cantly extend asset life or result in an operating improvement. In these instances the portion of these repairs relating to the betterment is capitalized as part of plant and equipment.
Revenue RecognitionSales are recognized when title transfers and the rights and obligations of ownership pass to the customer. The majority of the Company’s metal concentrates are sold under pricing arrangements where fi nal prices are determined by quoted market prices in a period subsequent to the date of sale. In these circumstances, revenues are recorded at the time of sale based on forward prices for the expected date of the fi nal settlement. Subsequent variations in prices are recognized as revenue adjustments as they occur.
Income and Resource TaxesCurrent income taxes are recorded based on the estimated income and resource taxes payable on taxable income for the current year. Future income tax assets and liabilities are recognized based on the difference between the tax and accounting value of assets and liabilities and are calculated using the tax rates for the periods in which the differences are expected to reverse. Tax rate changes are recognized in earnings in the period of substantive enactment. Future tax assets are recognized to the extent that they are considered more likely than not to be realized.
The Company is subject to assessments by various taxation authorities which may interpret tax legislation differently. The fi nal amount of taxes to be paid depends on a number of factors including outcomes of audits, appeals, disputes, negotiations and litigation. The Company provides for such differences where known based on management’s best estimate of the probable outcome of these matters.
Pension and Other Employee Future Benefi ts(a) Defi ned benefi t pension plans
Defi ned benefi t pension plan obligations are based on actuarial determinations. The projected benefi t method prorated on services
has been used to determine the accrued benefi t obligation. Actuarial assumptions used in the determination of defi ned benefi t pension plan liabilities and non-pension post-retirement benefi ts are based upon management’s best estimates, including discount rate, expected plan performance, salary escalation, expected health care costs and retirement dates of employees. The expected return on plan assets is estimated based on the fair value of plan assets, asset allocation and expected long-term returns on these components.
Past service costs and transitional assets or liabilities are amortized on a straight-line basis over the expected average remaining service period of active employees expected to receive benefi ts under the plan up to the full eligibility date.
Differences between the actuarial liabilities and the amounts recorded in the fi nancial statements will arise from changes in plan assumptions, changes in benefi ts, or through experience as results differ from actuarial assumptions. Cumulative differences which are greater than 10% of either the fair value of the plan assets or the accrued benefi t obligation, whichever is greater, are amortized over the average remaining service life of the related employees.
(b) Defi ned contribution pension plans
The cost of providing benefi ts through defi ned contribution plans is charged to earnings as the obligation to contribute is incurred.
(c) Non-pension post-retirement plans
The Company provides certain health care benefi ts for certain employees when they retire. The cost of these benefi ts is expensed over the period in which the employees render services. These non-pension post-retirement benefi ts are funded by the Company as they become due.
Stock-Based CompensationThe fair value method of accounting is used for stock-based awards. Under this method, the compensation cost of options and other stock-based compensation arrangements are estimated at fair value at the grant date and charged to
Consolidated Financial Statements
69
Annual Report 2006

earnings over the vesting period. For employees eligible for normal retirement before vesting, the expense is charged to earnings over the period from the grant date to the date they are eligible for retirement.
Stock-based compensation expense relating to deferred and restricted share units is accrued over the vesting period of the units based on the quoted market value of Class B subordinate voting shares. The expense and liability are adjusted each reporting period for changes in the underlying share price.
Research and DevelopmentResearch costs are expensed as incurred. Development costs are only deferred when the product or process is clearly defi ned, the technical feasibility has been established, the future market for the product or process is clearly defi ned and the Company is committed to and has the resources to complete the project.
Asset Retirement ObligationsFuture obligations to retire an asset including dismantling, remediation and ongoing treatment and monitoring of the site are initially recognized and recorded as a liability at fair value, based on estimated future cash fl ows, the Company’s current credit adjusted risk-free discount rate and an estimated infl ation factor. The liability is adjusted for changes in the expected amounts and timing of cash fl ows required to discharge the liability and accreted to full value over time through periodic charges to earnings. For operating properties, the amount of the asset retirement liability initially recognized and any subsequent adjustments are capitalized as part of the asset’s carrying value and amortized over the asset’s estimated useful life.
For closed properties, any adjustments to the liability are charged to other income (expense). Future asset retirement obligations are only recorded when the timing or amount of remediation costs can be reasonably estimated.
Earnings Per ShareEarnings per share is calculated based on the weighted average number of shares outstanding during the year. The Company follows the treasury stock method in the calculation of diluted earnings per share. Under this method, dilution is calculated based upon the net number of common shares issued should “in the money” options and warrants be exercised and the proceeds be used to repurchase common shares at the average market price in the year. Dilution from convertible securities is calculated based on the number of shares to be issued after taking into account the reduction of the related after-tax interest expense.
Derivatives and Hedging ActivitiesThe Company’s risk management policy is to mitigate the impact of market risks to enable the Company to plan its business with greater certainty. In particular, the Company may use foreign exchange forward contracts, commodity price contracts and interest rate swaps to manage exposure to fl uctuations in foreign exchange, metal prices and interest rates. The Company’s use of derivatives is based on established practices and parameters which are subject to the oversight of the Board of Directors.
Certain of the Company’s commodity and foreign exchange forward contracts are accounted for as cash fl ow hedges of anticipated commodity sales. Gains or losses on these contracts are recognized in revenue when the hedged sale occurs. The Inco exchangeable debentures were also accounted for as a cash fl ow hedge prior to the sale of the Inco shares in November 2006. The Company’s interest rate swaps are accounted for as fair value hedges, with gains or losses recognized in interest expense. From time to time, the Company also designates a portion of its U.S. dollar debt as a hedge of a portion of its net investment in foreign subsidiaries whose functional currency is the U.S. dollar. Foreign exchange gains and losses on the designated debt are included in the cumulative translation adjustment in shareholders’ equity.
The fair values of the derivative instruments that do not qualify for hedge accounting are recorded on the balance sheet with realized and unrealized gains and losses charged to other income (expense).
2. SIGNIFICANT ACCOUNTING POLICIES, continued
Consolidated Financial Statements Teck Cominco Limited
70
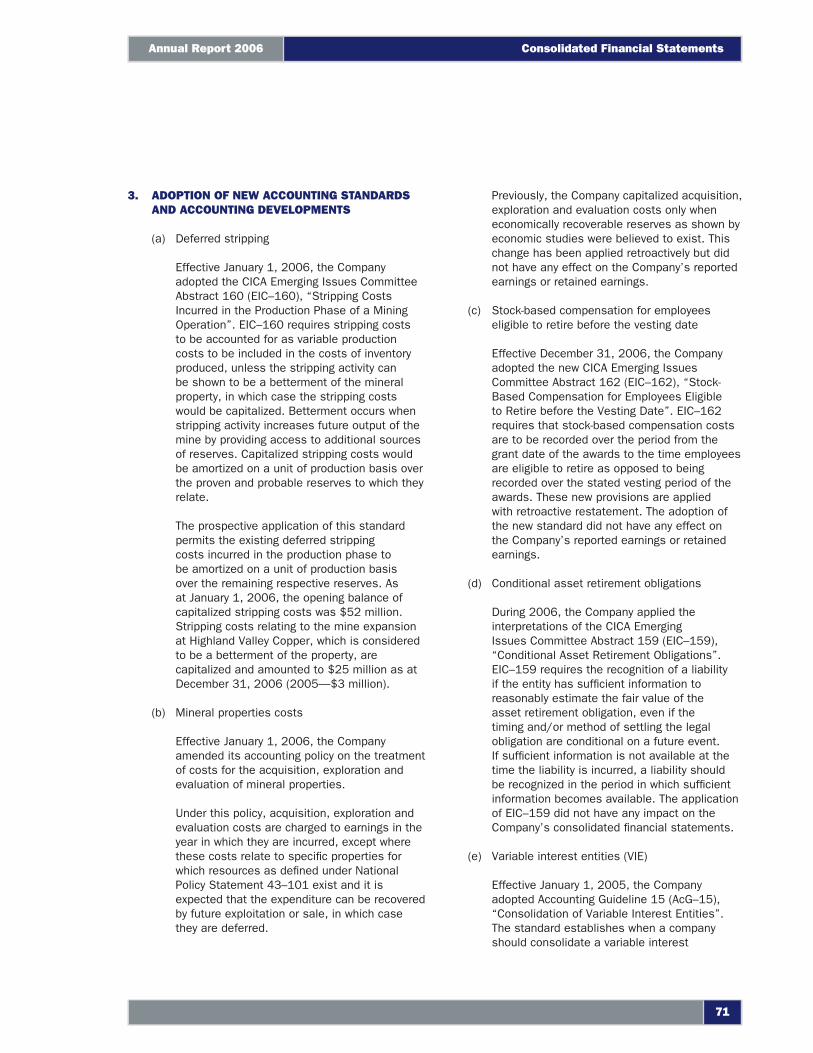
3. ADOPTION OF NEW ACCOUNTING STANDARDS AND ACCOUNTING DEVELOPMENTS
(a) Deferred stripping
Effective January 1, 2006, the Company adopted the CICA Emerging Issues Committee Abstract 160 (EIC–160), “Stripping Costs Incurred in the Production Phase of a Mining Operation”. EIC–160 requires stripping costs to be accounted for as variable production costs to be included in the costs of inventory produced, unless the stripping activity can be shown to be a betterment of the mineral property, in which case the stripping costs would be capitalized. Betterment occurs when stripping activity increases future output of the mine by providing access to additional sources of reserves. Capitalized stripping costs would be amortized on a unit of production basis over the proven and probable reserves to which they relate.
The prospective application of this standard permits the existing deferred stripping costs incurred in the production phase to be amortized on a unit of production basis over the remaining respective reserves. As at January 1, 2006, the opening balance of capitalized stripping costs was $52 million. Stripping costs relating to the mine expansion at Highland Valley Copper, which is considered to be a betterment of the property, are capitalized and amounted to $25 million as at December 31, 2006 (2005—$3 million).
(b) Mineral properties costs
Effective January 1, 2006, the Company amended its accounting policy on the treatment of costs for the acquisition, exploration and evaluation of mineral properties.
Under this policy, acquisition, exploration and evaluation costs are charged to earnings in the year in which they are incurred, except where these costs relate to specifi c properties for which resources as defi ned under National Policy Statement 43–101 exist and it is expected that the expenditure can be recovered by future exploitation or sale, in which case they are deferred.
Previously, the Company capitalized acquisition, exploration and evaluation costs only when economically recoverable reserves as shown by economic studies were believed to exist. This change has been applied retroactively but did not have any effect on the Company’s reported earnings or retained earnings.
(c) Stock-based compensation for employees eligible to retire before the vesting date
Effective December 31, 2006, the Company adopted the new CICA Emerging Issues Committee Abstract 162 (EIC–162), “Stock-Based Compensation for Employees Eligible to Retire before the Vesting Date”. EIC–162 requires that stock-based compensation costs are to be recorded over the period from the grant date of the awards to the time employees are eligible to retire as opposed to being recorded over the stated vesting period of the awards. These new provisions are applied with retroactive restatement. The adoption of the new standard did not have any effect on the Company’s reported earnings or retained earnings.
(d) Conditional asset retirement obligations
During 2006, the Company applied the interpretations of the CICA Emerging Issues Committee Abstract 159 (EIC–159), “Conditional Asset Retirement Obligations”. EIC–159 requires the recognition of a liability if the entity has suffi cient information to reasonably estimate the fair value of the asset retirement obligation, even if the timing and/or method of settling the legal obligation are conditional on a future event. If suffi cient information is not available at the time the liability is incurred, a liability should be recognized in the period in which suffi cient information becomes available. The application of EIC–159 did not have any impact on the Company’s consolidated fi nancial statements.
(e) Variable interest entities (VIE)
Effective January 1, 2005, the Company adopted Accounting Guideline 15 (AcG–15), “Consolidation of Variable Interest Entities”. The standard establishes when a company should consolidate a variable interest
Consolidated Financial Statements
71
Annual Report 2006
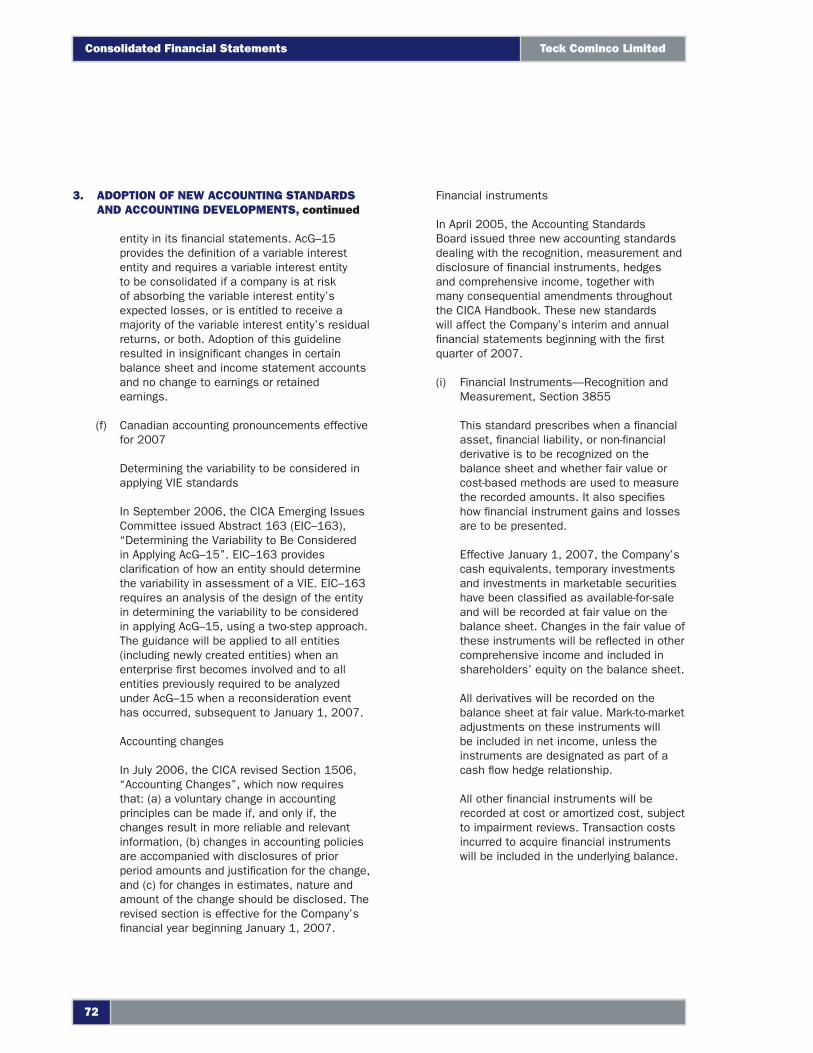
entity in its fi nancial statements. AcG–15 provides the defi nition of a variable interest entity and requires a variable interest entity to be consolidated if a company is at risk of absorbing the variable interest entity’s expected losses, or is entitled to receive a majority of the variable interest entity’s residual returns, or both. Adoption of this guideline resulted in insignifi cant changes in certain balance sheet and income statement accounts and no change to earnings or retained earnings.
(f) Canadian accounting pronouncements effective for 2007
Determining the variability to be considered in applying VIE standards
In September 2006, the CICA Emerging Issues Committee issued Abstract 163 (EIC–163), “Determining the Variability to Be Considered in Applying AcG–15”. EIC–163 provides clarifi cation of how an entity should determine the variability in assessment of a VIE. EIC–163 requires an analysis of the design of the entity in determining the variability to be considered in applying AcG–15, using a two-step approach. The guidance will be applied to all entities (including newly created entities) when an enterprise fi rst becomes involved and to all entities previously required to be analyzed under AcG–15 when a reconsideration event has occurred, subsequent to January 1, 2007.
Accounting changes
In July 2006, the CICA revised Section 1506, “Accounting Changes”, which now requires that: (a) a voluntary change in accounting principles can be made if, and only if, the changes result in more reliable and relevant information, (b) changes in accounting policies are accompanied with disclosures of prior period amounts and justifi cation for the change, and (c) for changes in estimates, nature and amount of the change should be disclosed. The revised section is effective for the Company’s fi nancial year beginning January 1, 2007.
Financial instruments
In April 2005, the Accounting Standards Board issued three new accounting standards dealing with the recognition, measurement and disclosure of fi nancial instruments, hedges and comprehensive income, together with many consequential amendments throughout the CICA Handbook. These new standards will affect the Company’s interim and annual fi nancial statements beginning with the fi rst quarter of 2007.
(i) Financial Instruments—Recognition and Measurement, Section 3855
This standard prescribes when a fi nancial asset, fi nancial liability, or non-fi nancial derivative is to be recognized on the balance sheet and whether fair value or cost-based methods are used to measure the recorded amounts. It also specifi es how fi nancial instrument gains and losses are to be presented.
Effective January 1, 2007, the Company’s cash equivalents, temporary investments and investments in marketable securities have been classifi ed as available-for-sale and will be recorded at fair value on the balance sheet. Changes in the fair value of these instruments will be refl ected in other comprehensive income and included in shareholders’ equity on the balance sheet.
All derivatives will be recorded on the balance sheet at fair value. Mark-to-market adjustments on these instruments will be included in net income, unless the instruments are designated as part of a cash fl ow hedge relationship.
All other fi nancial instruments will be recorded at cost or amortized cost, subject to impairment reviews. Transaction costs incurred to acquire fi nancial instruments will be included in the underlying balance.
3. ADOPTION OF NEW ACCOUNTING STANDARDS AND ACCOUNTING DEVELOPMENTS, continued
Consolidated Financial Statements Teck Cominco Limited
72
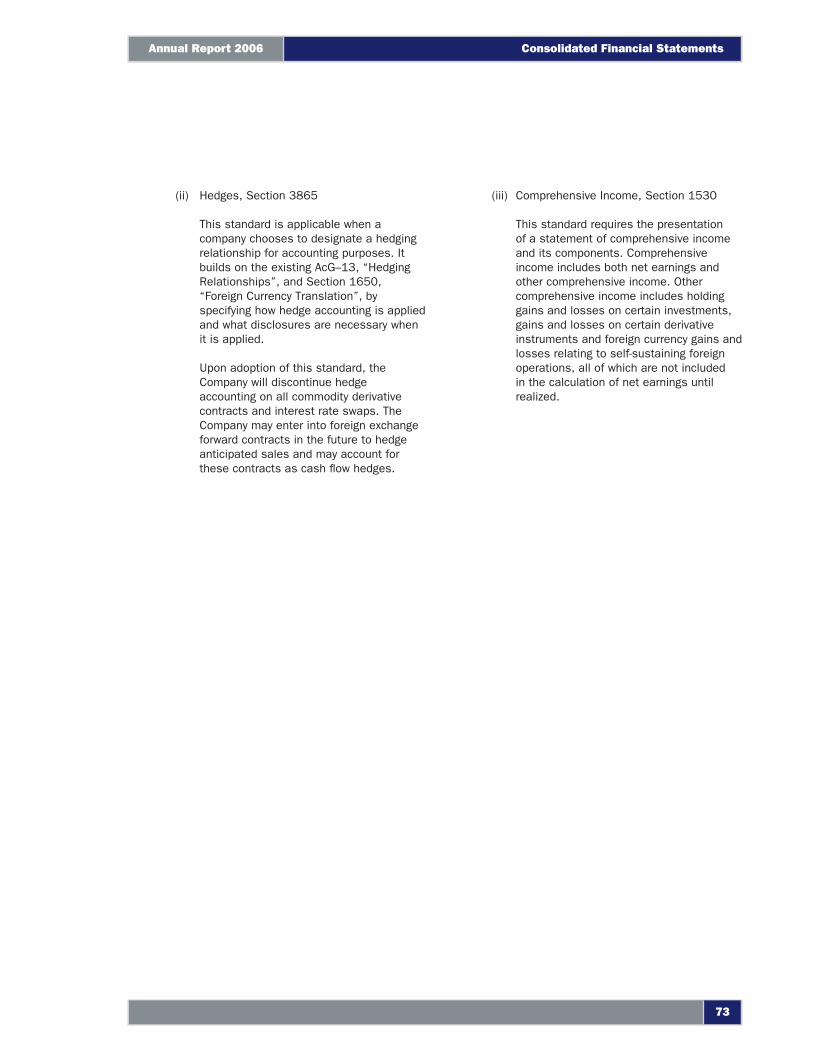
(ii) Hedges, Section 3865
This standard is applicable when a company chooses to designate a hedging relationship for accounting purposes. It builds on the existing AcG–13, “Hedging Relationships”, and Section 1650, “Foreign Currency Translation”, by specifying how hedge accounting is applied and what disclosures are necessary when it is applied.
Upon adoption of this standard, the Company will discontinue hedge accounting on all commodity derivative contracts and interest rate swaps. The Company may enter into foreign exchange forward contracts in the future to hedge anticipated sales and may account for these contracts as cash fl ow hedges.
(iii) Comprehensive Income, Section 1530
This standard requires the presentation of a statement of comprehensive income and its components. Comprehensive income includes both net earnings and other comprehensive income. Other comprehensive income includes holding gains and losses on certain investments, gains and losses on certain derivative instruments and foreign currency gains and losses relating to self-sustaining foreign operations, all of which are not included in the calculation of net earnings until realized.
Consolidated Financial Statements
73
Annual Report 2006
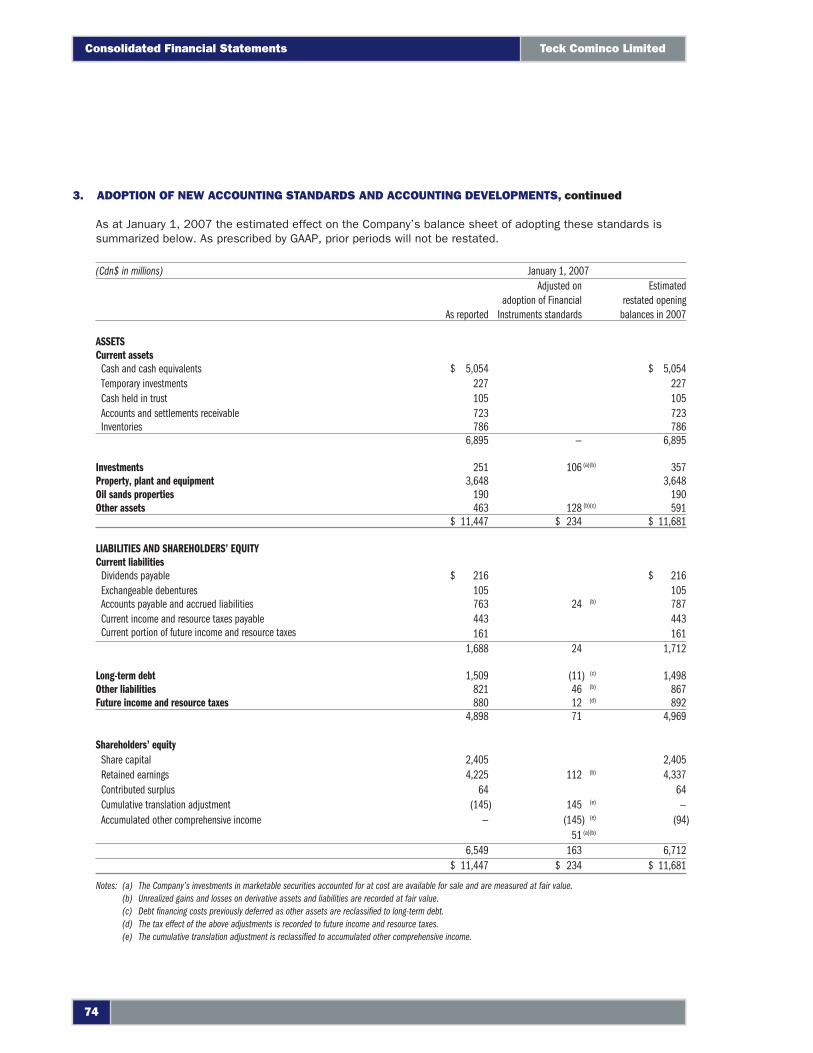
As at January 1, 2007 the estimated effect on the Company’s balance sheet of adopting these standards is summarized below. As prescribed by GAAP, prior periods will not be restated.
(Cdn$ in millions) January 1, 2007
As reported
Adjusted on adoption of Financial
Instruments standards
Estimated restated opening
balances in 2007
ASSETSCurrent assets
Cash and cash equivalents $ 5,054 $ 5,054Temporary investments 227 227Cash held in trust 105 105Accounts and settlements receivable 723 723Inventories 786 786
6,895 — 6,895
Investments 251 106 (a)(b) 357Property, plant and equipment 3,648 3,648Oil sands properties 190 190Other assets 463 128 (b)(c) 591
$ 11,447 $ 234 $ 11,681
LIABILITIES AND SHAREHOLDERS’ EQUITYCurrent liabilities
Dividends payable $ 216 $ 216Exchangeable debentures 105 105Accounts payable and accrued liabilities 763 24 (b) 787Current income and resource taxes payable 443 443Current portion of future income and resource taxes 161 161
1,688 24 1,712
Long-term debt 1,509 (11) (c) 1,498Other liabilities 821 46 (b) 867Future income and resource taxes 880 12 (d) 892
4,898 71 4,969
Shareholders’ equityShare capital 2,405 2,405Retained earnings 4,225 112 (b) 4,337Contributed surplus 64 64Cumulative translation adjustment (145) 145 (e) —Accumulated other comprehensive income — (145) (e) (94)
51 (a)(b)
6,549 163 6,712$ 11,447 $ 234 $ 11,681
Notes: (a) The Company’s investments in marketable securities accounted for at cost are available for sale and are measured at fair value. (b) Unrealized gains and losses on derivative assets and liabilities are recorded at fair value. (c) Debt fi nancing costs previously deferred as other assets are reclassifi ed to long-term debt. (d) The tax effect of the above adjustments is recorded to future income and resource taxes. (e) The cumulative translation adjustment is reclassifi ed to accumulated other comprehensive income.
3. ADOPTION OF NEW ACCOUNTING STANDARDS AND ACCOUNTING DEVELOPMENTS, continued
Consolidated Financial Statements Teck Cominco Limited
74
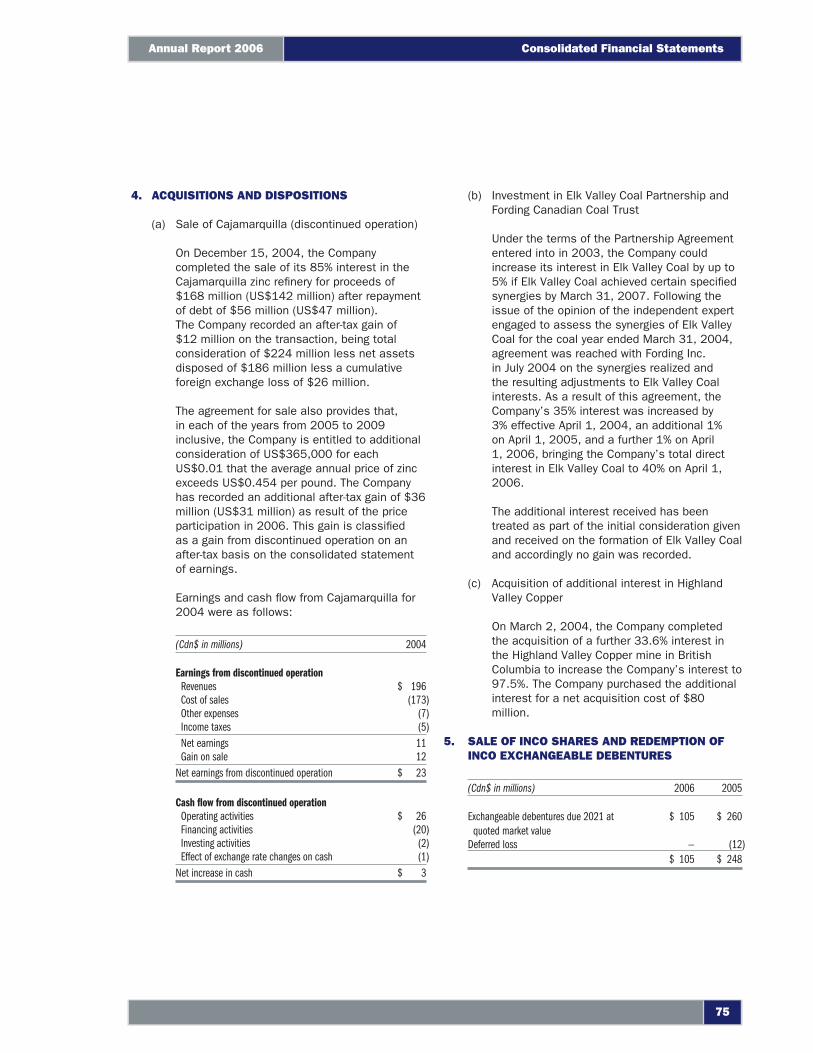
4. ACQUISITIONS AND DISPOSITIONS
(a) Sale of Cajamarquilla (discontinued operation)
On December 15, 2004, the Company completed the sale of its 85% interest in the Cajamarquilla zinc refi nery for proceeds of $168 million (US$142 million) after repayment of debt of $56 million (US$47 million). The Company recorded an after-tax gain of $12 million on the transaction, being total consideration of $224 million less net assets disposed of $186 million less a cumulative foreign exchange loss of $26 million.
The agreement for sale also provides that, in each of the years from 2005 to 2009 inclusive, the Company is entitled to additional consideration of US$365,000 for each US$0.01 that the average annual price of zinc exceeds US$0.454 per pound. The Company has recorded an additional after-tax gain of $36 million (US$31 million) as result of the price participation in 2006. This gain is classifi ed as a gain from discontinued operation on an after-tax basis on the consolidated statement of earnings.
Earnings and cash fl ow from Cajamarquilla for 2004 were as follows:
(Cdn$ in millions) 2004
Earnings from discontinued operationRevenues $ 196Cost of sales (173)Other expenses (7)Income taxes (5)Net earnings 11Gain on sale 12
Net earnings from discontinued operation $ 23
Cash fl ow from discontinued operationOperating activities $ 26Financing activities (20)Investing activities (2)Effect of exchange rate changes on cash (1)
Net increase in cash $ 3
(b) Investment in Elk Valley Coal Partnership and Fording Canadian Coal Trust
Under the terms of the Partnership Agreement entered into in 2003, the Company could increase its interest in Elk Valley Coal by up to 5% if Elk Valley Coal achieved certain specifi ed synergies by March 31, 2007. Following the issue of the opinion of the independent expert engaged to assess the synergies of Elk Valley Coal for the coal year ended March 31, 2004, agreement was reached with Fording Inc. in July 2004 on the synergies realized and the resulting adjustments to Elk Valley Coal interests. As a result of this agreement, the Company’s 35% interest was increased by 3% effective April 1, 2004, an additional 1% on April 1, 2005, and a further 1% on April 1, 2006, bringing the Company’s total direct interest in Elk Valley Coal to 40% on April 1, 2006.
The additional interest received has been treated as part of the initial consideration given and received on the formation of Elk Valley Coal and accordingly no gain was recorded.
(c) Acquisition of additional interest in Highland Valley Copper
On March 2, 2004, the Company completed the acquisition of a further 33.6% interest in the Highland Valley Copper mine in British Columbia to increase the Company’s interest to 97.5%. The Company purchased the additional interest for a net acquisition cost of $80 million.
5. SALE OF INCO SHARES AND REDEMPTION OF INCO EXCHANGEABLE DEBENTURES
(Cdn$ in millions) 2006 2005
Exchangeable debentures due 2021 at quoted market value
$ 105 $ 260
Deferred loss — (12)$ 105 $ 248
Consolidated Financial Statements
75
Annual Report 2006
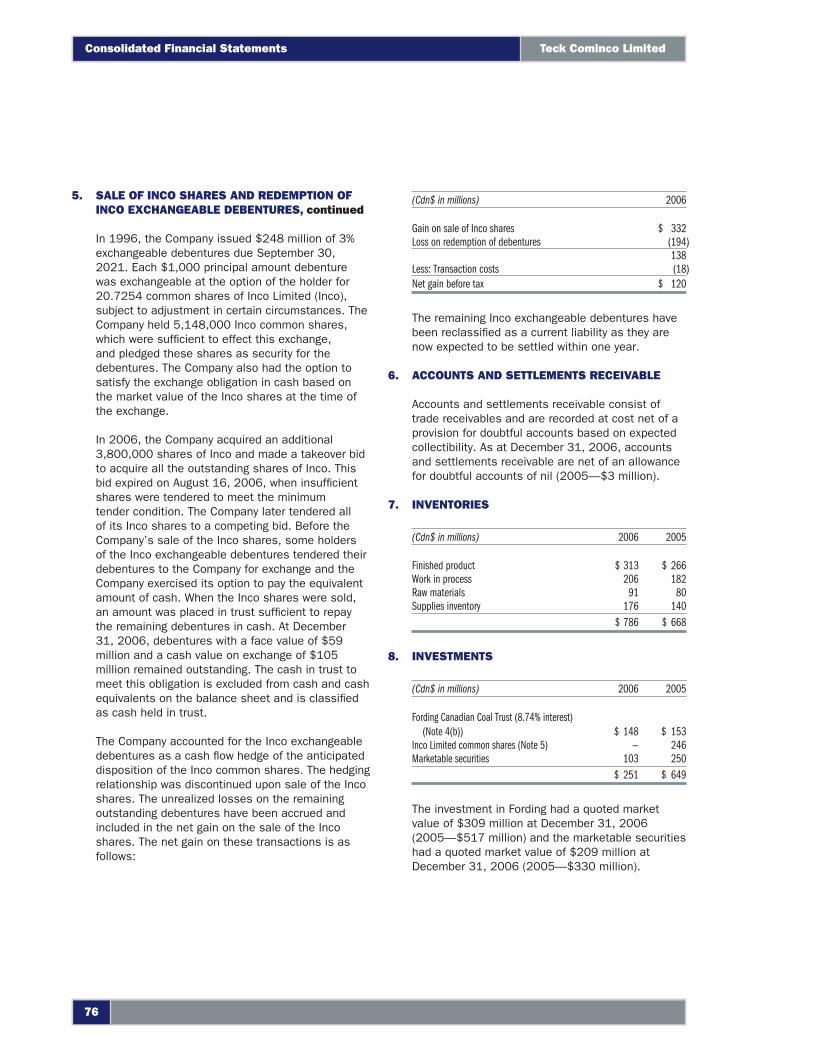
In 1996, the Company issued $248 million of 3% exchangeable debentures due September 30, 2021. Each $1,000 principal amount debenture was exchangeable at the option of the holder for 20.7254 common shares of Inco Limited (Inco), subject to adjustment in certain circumstances. The Company held 5,148,000 Inco common shares, which were suffi cient to effect this exchange, and pledged these shares as security for the debentures. The Company also had the option to satisfy the exchange obligation in cash based on the market value of the Inco shares at the time of the exchange.
In 2006, the Company acquired an additional 3,800,000 shares of Inco and made a takeover bid to acquire all the outstanding shares of Inco. This bid expired on August 16, 2006, when insuffi cient shares were tendered to meet the minimum tender condition. The Company later tendered all of its Inco shares to a competing bid. Before the Company’s sale of the Inco shares, some holders of the Inco exchangeable debentures tendered their debentures to the Company for exchange and the Company exercised its option to pay the equivalent amount of cash. When the Inco shares were sold, an amount was placed in trust suffi cient to repay the remaining debentures in cash. At December 31, 2006, debentures with a face value of $59 million and a cash value on exchange of $105 million remained outstanding. The cash in trust to meet this obligation is excluded from cash and cash equivalents on the balance sheet and is classifi ed as cash held in trust.
The Company accounted for the Inco exchangeable debentures as a cash fl ow hedge of the anticipated disposition of the Inco common shares. The hedging relationship was discontinued upon sale of the Inco shares. The unrealized losses on the remaining outstanding debentures have been accrued and included in the net gain on the sale of the Inco shares. The net gain on these transactions is as follows:
(Cdn$ in millions) 2006
Gain on sale of Inco shares $ 332Loss on redemption of debentures (194)
138Less: Transaction costs (18)Net gain before tax $ 120
The remaining Inco exchangeable debentures have been reclassifi ed as a current liability as they are now expected to be settled within one year.
6. ACCOUNTS AND SETTLEMENTS RECEIVABLE
Accounts and settlements receivable consist of trade receivables and are recorded at cost net of a provision for doubtful accounts based on expected collectibility. As at December 31, 2006, accounts and settlements receivable are net of an allowance for doubtful accounts of nil (2005—$3 million).
7. INVENTORIES
(Cdn$ in millions) 2006 2005
Finished product $ 313 $ 266Work in process 206 182Raw materials 91 80Supplies inventory 176 140
$ 786 $ 668
8. INVESTMENTS
(Cdn$ in millions) 2006 2005
Fording Canadian Coal Trust (8.74% interest) (Note 4(b)) $ 148 $ 153
Inco Limited common shares (Note 5) — 246Marketable securities 103 250
$ 251 $ 649
The investment in Fording had a quoted market value of $309 million at December 31, 2006 (2005—$517 million) and the marketable securities had a quoted market value of $209 million at December 31, 2006 (2005—$330 million).
5. SALE OF INCO SHARES AND REDEMPTION OF INCO EXCHANGEABLE DEBENTURES, continued
Consolidated Financial Statements Teck Cominco Limited
76

9. PROPERTY, PLANT AND EQUIPMENT
(Cdn$ in millions) 2006 2005
OperationsMines and mining facilities $ 4,827 $ 4,635Accumulated depreciation and amortization (2,620) (2,463)
2,207 2,172
Smelter and refi neries 1,722 1,649Accumulated depreciation and amortization (694) (650)
1,028 999
Properties in development 413 342$ 3,648 $ 3,513
10. OIL SANDS PROPERTIES
(Cdn$ in millions) 2006 2005
Fort Hills Energy Limited Partnership (a) $ 114 $ 17Oil sands leases (b) 76 3
$ 190 $ 20
(a) Fort Hills Energy Limited Partnership
In November 2005, the Company completed an agreement to acquire a 15% interest in the Fort Hills Energy Limited Partnership, which is developing the Fort Hills oil sands project in Alberta, Canada. As consideration for its 15% interest the Company is required to contribute 34% of the fi rst $2.5 billion of project expenditures and its 15% share of project expenditures thereafter (Note 22(d)). Tax benefi ts arising from these expenditures are allocated to the contributing partner. The interest in Fort Hills is recorded as an investment using the equity method.
(b) Oil sands leases
The Company has a 50% partnership interest with UTS Energy Corporation (UTS) in oil sands leases covering 277,000 acres in the Athabasca oil sands region in Alberta. In addition, the Company has a right to acquire from UTS a 50% interest in an oil sands lease covering 7,064 additional acres.
11. OTHER ASSETS
(Cdn$ in millions) 2006 2005
Pension assets (Note 16(a)) $ 194 $ 151Future income and resource tax assets (Note 19(c)) 103 115Long-term receivables 109 47Other 57 31
$ 463 $ 344
12. ACCOUNTS PAYABLE AND ACCRUED LIABILITIES
(Cdn$ in millions) 2006 2005
Trade payables $ 415 $ 228Commercial and government royalties 118 —Payroll related liabilities 101 99Capital project accruals 44 39Current portion of asset retirement obligations
(Note 15) 22 31Accrued interest 24 35Other 39 10
$ 763 $ 442
13. LONG-TERM DEBT
(Cdn$ in millions) 2006 2005
6.125% debentures due October 2035 (US$700 million) (a) $ 806 $ 806
5.375% debentures due October 2015 (US$300 million) (a) 349 349
7.000% debentures due September 2012 (US$200 million) 231 231
6.875% debentures due February 2006 (US$150 million) — 175
Antamina senior revolving credit facility due August 2011 (b) 108 —
Antamina senior debt (nil; 2005—US$125 million) (b) — 146
Other 15 141,509 1,721
Less current portion (f) — (213)$ 1,509 $ 1,508
Consolidated Financial Statements
77
Annual Report 2006
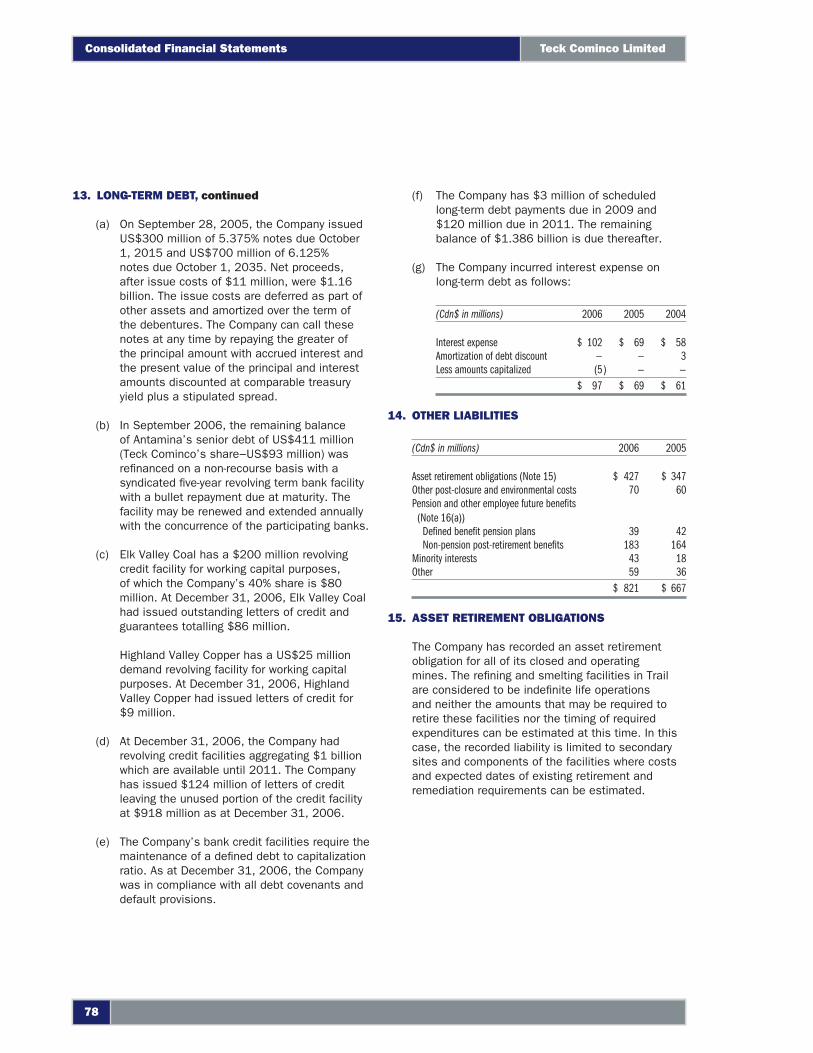
(a) On September 28, 2005, the Company issued US$300 million of 5.375% notes due October 1, 2015 and US$700 million of 6.125% notes due October 1, 2035. Net proceeds, after issue costs of $11 million, were $1.16 billion. The issue costs are deferred as part of other assets and amortized over the term of the debentures. The Company can call these notes at any time by repaying the greater of the principal amount with accrued interest and the present value of the principal and interest amounts discounted at comparable treasury yield plus a stipulated spread.
(b) In September 2006, the remaining balance of Antamina’s senior debt of US$411 million (Teck Cominco’s share−US$93 million) was refi nanced on a non-recourse basis with a syndicated fi ve-year revolving term bank facility with a bullet repayment due at maturity. The facility may be renewed and extended annually with the concurrence of the participating banks.
(c) Elk Valley Coal has a $200 million revolving credit facility for working capital purposes, of which the Company’s 40% share is $80 million. At December 31, 2006, Elk Valley Coal had issued outstanding letters of credit and guarantees totalling $86 million.
Highland Valley Copper has a US$25 million demand revolving facility for working capital purposes. At December 31, 2006, Highland Valley Copper had issued letters of credit for $9 million.
(d) At December 31, 2006, the Company had revolving credit facilities aggregating $1 billion which are available until 2011. The Company has issued $124 million of letters of credit leaving the unused portion of the credit facility at $918 million as at December 31, 2006.
(e) The Company’s bank credit facilities require the maintenance of a defi ned debt to capitalization ratio. As at December 31, 2006, the Company was in compliance with all debt covenants and default provisions.
(f) The Company has $3 million of scheduled long-term debt payments due in 2009 and $120 million due in 2011. The remaining balance of $1.386 billion is due thereafter.
(g) The Company incurred interest expense on long-term debt as follows:
(Cdn$ in millions) 2006 2005 2004
Interest expense $ 102 $ 69 $ 58Amortization of debt discount — — 3Less amounts capitalized (5) — —
$ 97 $ 69 $ 61
14. OTHER LIABILITIES
(Cdn$ in millions) 2006 2005
Asset retirement obligations (Note 15) $ 427 $ 347Other post-closure and environmental costs 70 60Pension and other employee future benefi ts
(Note 16(a))Defi ned benefi t pension plans 39 42Non-pension post-retirement benefi ts 183 164
Minority interests 43 18Other 59 36
$ 821 $ 667
15. ASSET RETIREMENT OBLIGATIONS
The Company has recorded an asset retirement obligation for all of its closed and operating mines. The refi ning and smelting facilities in Trail are considered to be indefi nite life operations and neither the amounts that may be required to retire these facilities nor the timing of required expenditures can be estimated at this time. In this case, the recorded liability is limited to secondary sites and components of the facilities where costs and expected dates of existing retirement and remediation requirements can be estimated.
13. LONG-TERM DEBT, continued
Consolidated Financial Statements Teck Cominco Limited
78
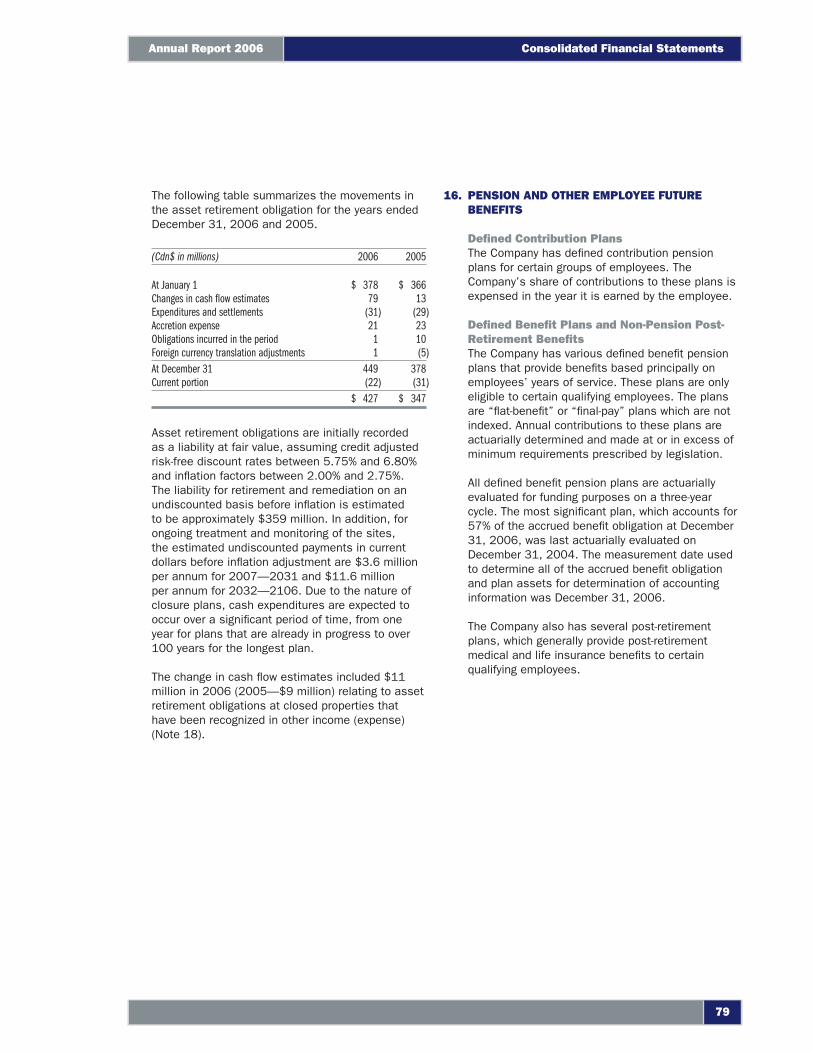
The following table summarizes the movements in the asset retirement obligation for the years ended December 31, 2006 and 2005.
(Cdn$ in millions) 2006 2005
At January 1 $ 378 $ 366Changes in cash fl ow estimates 79 13Expenditures and settlements (31) (29)Accretion expense 21 23Obligations incurred in the period 1 10Foreign currency translation adjustments 1 (5)At December 31 449 378Current portion (22) (31)
$ 427 $ 347
Asset retirement obligations are initially recorded as a liability at fair value, assuming credit adjusted risk-free discount rates between 5.75% and 6.80% and infl ation factors between 2.00% and 2.75%. The liability for retirement and remediation on an undiscounted basis before infl ation is estimated to be approximately $359 million. In addition, for ongoing treatment and monitoring of the sites, the estimated undiscounted payments in current dollars before infl ation adjustment are $3.6 million per annum for 2007—2031 and $11.6 million per annum for 2032—2106. Due to the nature of closure plans, cash expenditures are expected to occur over a signifi cant period of time, from one year for plans that are already in progress to over 100 years for the longest plan.
The change in cash fl ow estimates included $11 million in 2006 (2005—$9 million) relating to asset retirement obligations at closed properties that have been recognized in other income (expense) (Note 18).
16. PENSION AND OTHER EMPLOYEE FUTURE BENEFITS
Defi ned Contribution PlansThe Company has defi ned contribution pension plans for certain groups of employees. The Company’s share of contributions to these plans is expensed in the year it is earned by the employee.
Defi ned Benefi t Plans and Non-Pension Post-Retirement Benefi tsThe Company has various defi ned benefi t pension plans that provide benefi ts based principally on employees’ years of service. These plans are only eligible to certain qualifying employees. The plans are “fl at-benefi t” or “fi nal-pay” plans which are not indexed. Annual contributions to these plans are actuarially determined and made at or in excess of minimum requirements prescribed by legislation.
All defi ned benefi t pension plans are actuarially evaluated for funding purposes on a three-year cycle. The most signifi cant plan, which accounts for 57% of the accrued benefi t obligation at December 31, 2006, was last actuarially evaluated on December 31, 2004. The measurement date used to determine all of the accrued benefi t obligation and plan assets for determination of accounting information was December 31, 2006.
The Company also has several post-retirement plans, which generally provide post-retirement medical and life insurance benefi ts to certain qualifying employees.
Consolidated Financial Statements
79
Annual Report 2006
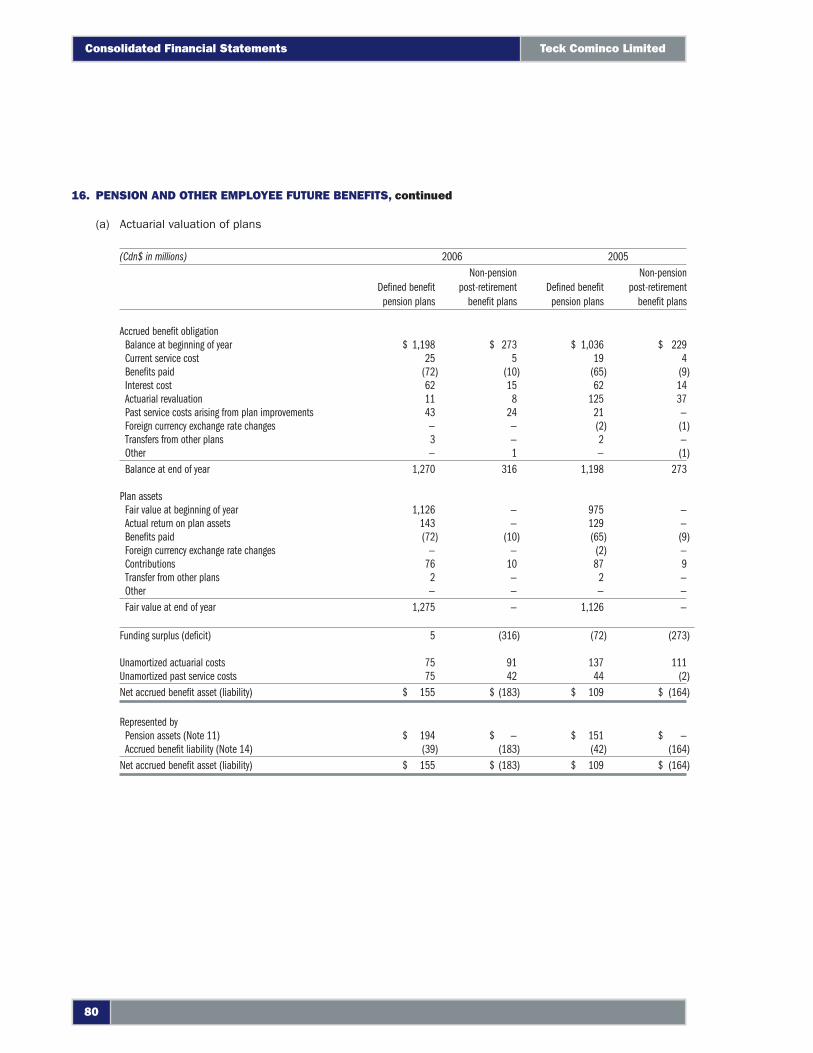
(a) Actuarial valuation of plans
(Cdn$ in millions) 2006 2005
Defi ned benefi t pension plans
Non-pension post-retirement
benefi t plansDefi ned benefi t
pension plans
Non-pension post-retirement
benefi t plans
Accrued benefi t obligationBalance at beginning of year $ 1,198 $ 273 $ 1,036 $ 229Current service cost 25 5 19 4Benefi ts paid (72) (10) (65) (9)Interest cost 62 15 62 14Actuarial revaluation 11 8 125 37Past service costs arising from plan improvements 43 24 21 —Foreign currency exchange rate changes — — (2) (1)Transfers from other plans 3 — 2 —Other — 1 — (1)Balance at end of year 1,270 316 1,198 273
Plan assetsFair value at beginning of year 1,126 — 975 —Actual return on plan assets 143 — 129 —Benefi ts paid (72) (10) (65) (9)Foreign currency exchange rate changes — — (2) —Contributions 76 10 87 9Transfer from other plans 2 — 2 —Other — — — —Fair value at end of year 1,275 — 1,126 —
Funding surplus (defi cit) 5 (316) (72) (273)
Unamortized actuarial costs 75 91 137 111Unamortized past service costs 75 42 44 (2)Net accrued benefi t asset (liability) $ 155 $ (183) $ 109 $ (164)
Represented byPension assets (Note 11) $ 194 $ — $ 151 $ —Accrued benefi t liability (Note 14) (39) (183) (42) (164)
Net accrued benefi t asset (liability) $ 155 $ (183) $ 109 $ (164)
16. PENSION AND OTHER EMPLOYEE FUTURE BENEFITS, continued
Consolidated Financial Statements Teck Cominco Limited
80
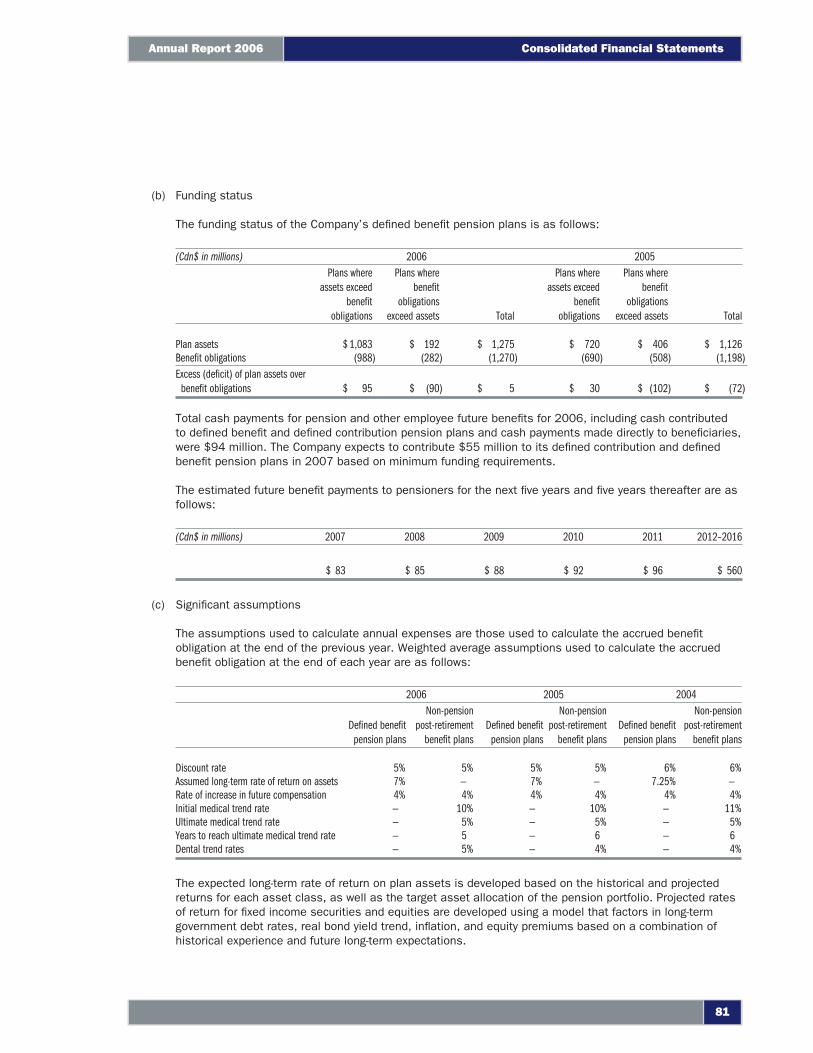
(b) Funding status
The funding status of the Company’s defi ned benefi t pension plans is as follows:
(Cdn$ in millions) 2006 2005Plans where
assets exceed benefi t
obligations
Plans where benefi t
obligations exceed assets Total
Plans where assets exceed
benefi t obligations
Plans where benefi t
obligations exceed assets Total
Plan assets $ 1,083 $ 192 $ 1,275 $ 720 $ 406 $ 1,126Benefi t obligations (988) (282) (1,270) (690) (508) (1,198)Excess (defi cit) of plan assets over
benefi t obligations $ 95 $ (90) $ 5 $ 30 $ (102) $ (72)
Total cash payments for pension and other employee future benefi ts for 2006, including cash contributed to defi ned benefi t and defi ned contribution pension plans and cash payments made directly to benefi ciaries, were $94 million. The Company expects to contribute $55 million to its defi ned contribution and defi ned benefi t pension plans in 2007 based on minimum funding requirements.
The estimated future benefi t payments to pensioners for the next fi ve years and fi ve years thereafter are as follows:
(Cdn$ in millions) 2007 2008 2009 2010 2011 2012 –2016
$ 83 $ 85 $ 88 $ 92 $ 96 $ 560
(c) Signifi cant assumptions
The assumptions used to calculate annual expenses are those used to calculate the accrued benefi t obligation at the end of the previous year. Weighted average assumptions used to calculate the accrued benefi t obligation at the end of each year are as follows:
2006 2005 2004
Defi ned benefi t pension plans
Non-pension post-retirement
benefi t plansDefi ned benefi t
pension plans
Non-pension post-retirement
benefi t plansDefi ned benefi t
pension plans
Non-pension post-retirement
benefi t plans
Discount rate 5% 5% 5% 5% 6% 6%Assumed long-term rate of return on assets 7% — 7% — 7.25% —Rate of increase in future compensation 4% 4% 4% 4% 4% 4%Initial medical trend rate — 10% — 10% — 11%Ultimate medical trend rate — 5% — 5% — 5%Years to reach ultimate medical trend rate — 5 — 6 — 6Dental trend rates — 5% — 4% — 4%
The expected long-term rate of return on plan assets is developed based on the historical and projected returns for each asset class, as well as the target asset allocation of the pension portfolio. Projected rates of return for fi xed income securities and equities are developed using a model that factors in long-term government debt rates, real bond yield trend, infl ation, and equity premiums based on a combination of historical experience and future long-term expectations.
Consolidated Financial Statements
81
Annual Report 2006
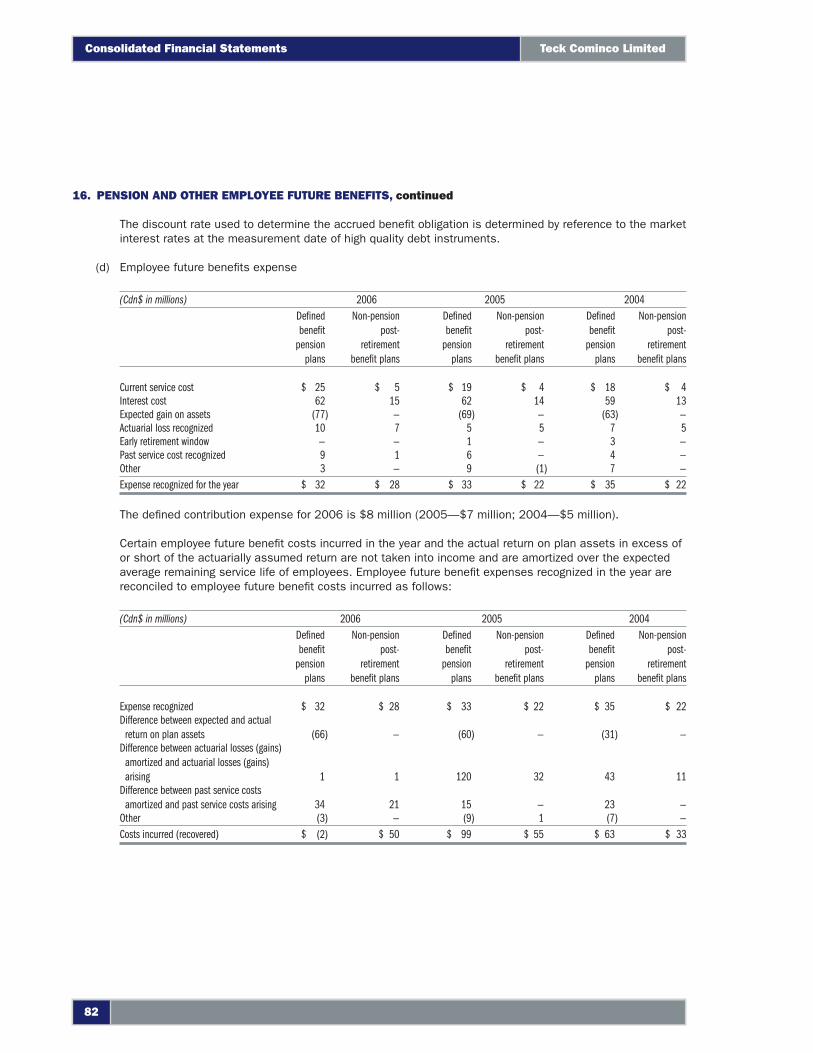
The discount rate used to determine the accrued benefi t obligation is determined by reference to the market interest rates at the measurement date of high quality debt instruments.
(d) Employee future benefi ts expense
(Cdn$ in millions) 2006 2005 2004Defi ned benefi t
pension plans
Non-pension post-
retirement benefi t plans
Defi ned benefi t
pension plans
Non-pension post-
retirement benefi t plans
Defi ned benefi t
pension plans
Non-pension post-
retirement benefi t plans
Current service cost $ 25 $ 5 $ 19 $ 4 $ 18 $ 4Interest cost 62 15 62 14 59 13Expected gain on assets (77) — (69) — (63) —Actuarial loss recognized 10 7 5 5 7 5Early retirement window — — 1 — 3 —Past service cost recognized 9 1 6 — 4 —Other 3 — 9 (1) 7 —Expense recognized for the year $ 32 $ 28 $ 33 $ 22 $ 35 $ 22
The defi ned contribution expense for 2006 is $8 million (2005—$7 million; 2004—$5 million).
Certain employee future benefi t costs incurred in the year and the actual return on plan assets in excess of or short of the actuarially assumed return are not taken into income and are amortized over the expected average remaining service life of employees. Employee future benefi t expenses recognized in the year are reconciled to employee future benefi t costs incurred as follows:
(Cdn$ in millions) 2006 2005 2004Defi ned benefi t
pension plans
Non-pension post-
retirement benefi t plans
Defi ned benefi t
pension plans
Non-pension post-
retirement benefi t plans
Defi ned benefi t
pension plans
Non-pension post-
retirement benefi t plans
Expense recognized $ 32 $ 28 $ 33 $ 22 $ 35 $ 22Difference between expected and actual
return on plan assets (66) — (60) — (31) —Difference between actuarial losses (gains)
amortized and actuarial losses (gains) arising 1 1 120 32 43 11
Difference between past service costs amortized and past service costs arising 34 21 15 — 23 —
Other (3) — (9) 1 (7) —Costs incurred (recovered) $ (2) $ 50 $ 99 $ 55 $ 63 $ 33
16. PENSION AND OTHER EMPLOYEE FUTURE BENEFITS, continued
Consolidated Financial Statements Teck Cominco Limited
82
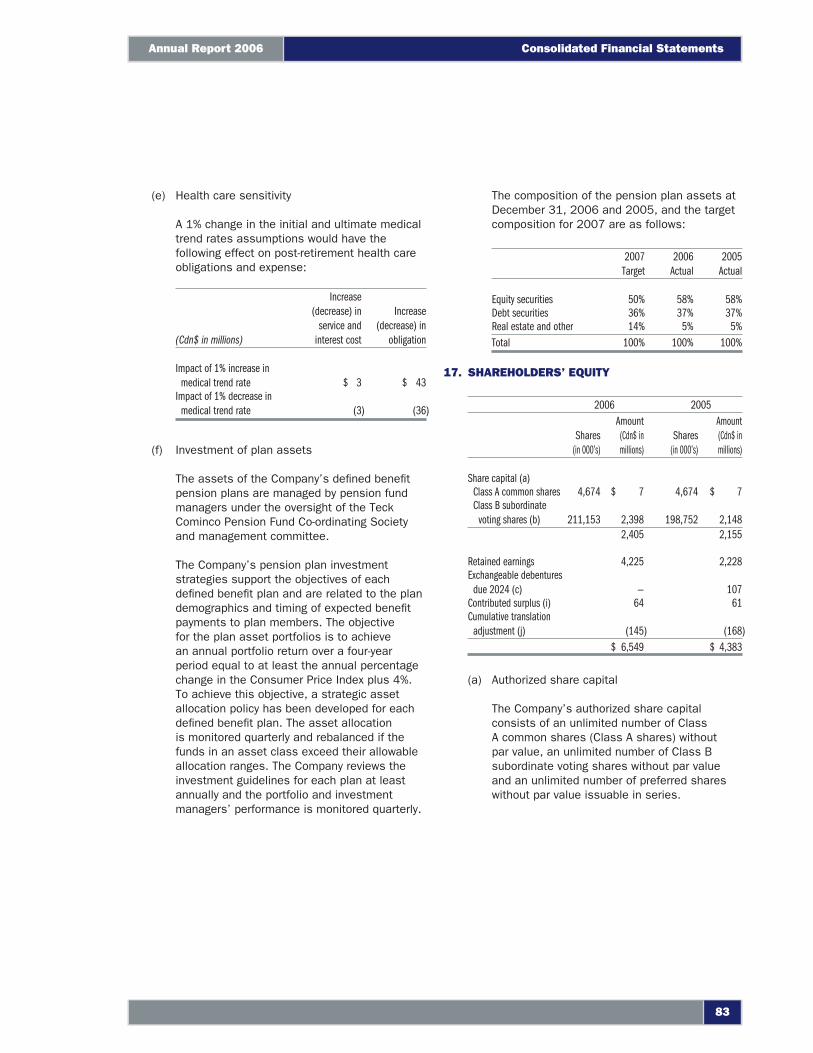
(e) Health care sensitivity
A 1% change in the initial and ultimate medical trend rates assumptions would have the following effect on post-retirement health care obligations and expense:
(Cdn$ in millions)
Increase (decrease) in
service and interest cost
Increase (decrease) in
obligation
Impact of 1% increase in medical trend rate $ 3 $ 43
Impact of 1% decrease in medical trend rate (3) (36)
(f) Investment of plan assets
The assets of the Company’s defi ned benefi t pension plans are managed by pension fund managers under the oversight of the Teck Cominco Pension Fund Co-ordinating Society and management committee.
The Company’s pension plan investment strategies support the objectives of each defi ned benefi t plan and are related to the plan demographics and timing of expected benefi t payments to plan members. The objective for the plan asset portfolios is to achieve an annual portfolio return over a four-year period equal to at least the annual percentage change in the Consumer Price Index plus 4%. To achieve this objective, a strategic asset allocation policy has been developed for each defi ned benefi t plan. The asset allocation is monitored quarterly and rebalanced if the funds in an asset class exceed their allowable allocation ranges. The Company reviews the investment guidelines for each plan at least annually and the portfolio and investment managers’ performance is monitored quarterly.
The composition of the pension plan assets at December 31, 2006 and 2005, and the target composition for 2007 are as follows:
2007 Target
2006 Actual
2005Actual
Equity securities 50% 58% 58%Debt securities 36% 37% 37%Real estate and other 14% 5% 5%Total 100% 100% 100%
17. SHAREHOLDERS’ EQUITY
2006 2005
Shares (in 000’s)
Amount(Cdn$ in millions)
Shares (in 000’s)
Amount(Cdn$ in millions)
Share capital (a)Class A common shares 4,674 $ 7 4,674 $ 7Class B subordinate
voting shares (b) 211,153 2,398 198,752 2,1482,405 2,155
Retained earnings 4,225 2,228Exchangeable debentures
due 2024 (c) — 107Contributed surplus (i) 64 61Cumulative translation
adjustment (j) (145) (168)$ 6,549 $ 4,383
(a) Authorized share capital
The Company’s authorized share capital consists of an unlimited number of Class A common shares (Class A shares) without par value, an unlimited number of Class B subordinate voting shares without par value and an unlimited number of preferred shares without par value issuable in series.
Consolidated Financial Statements
83
Annual Report 2006
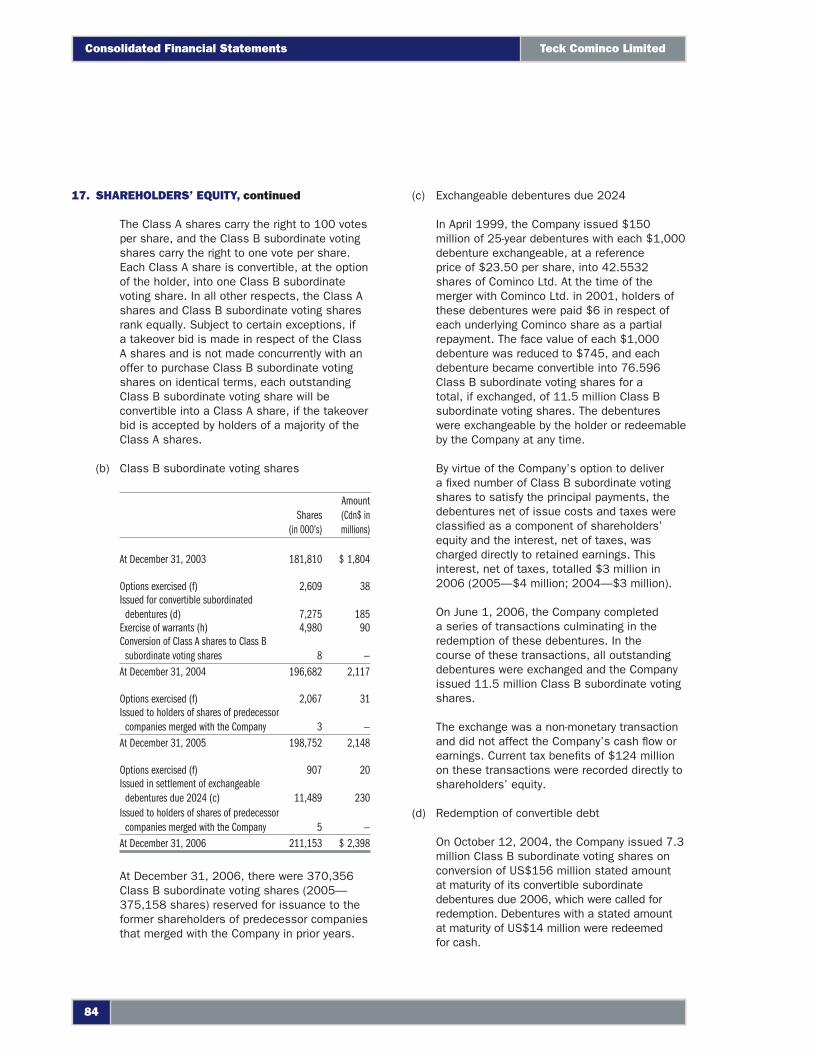
The Class A shares carry the right to 100 votes per share, and the Class B subordinate voting shares carry the right to one vote per share. Each Class A share is convertible, at the option of the holder, into one Class B subordinate voting share. In all other respects, the Class A shares and Class B subordinate voting shares rank equally. Subject to certain exceptions, if a takeover bid is made in respect of the Class A shares and is not made concurrently with an offer to purchase Class B subordinate voting shares on identical terms, each outstanding Class B subordinate voting share will be convertible into a Class A share, if the takeover bid is accepted by holders of a majority of the Class A shares.
(b) Class B subordinate voting shares
Shares (in 000’s)
Amount(Cdn$ in millions)
At December 31, 2003 181,810 $ 1,804
Options exercised (f) 2,609 38Issued for convertible subordinated
debentures (d) 7,275 185Exercise of warrants (h) 4,980 90Conversion of Class A shares to Class B
subordinate voting shares 8 —At December 31, 2004 196,682 2,117
Options exercised (f) 2,067 31Issued to holders of shares of predecessor
companies merged with the Company 3 —At December 31, 2005 198,752 2,148
Options exercised (f) 907 20Issued in settlement of exchangeable
debentures due 2024 (c) 11,489 230Issued to holders of shares of predecessor
companies merged with the Company 5 —At December 31, 2006 211,153 $ 2,398
At December 31, 2006, there were 370,356 Class B subordinate voting shares (2005—375,158 shares) reserved for issuance to the former shareholders of predecessor companies that merged with the Company in prior years.
(c) Exchangeable debentures due 2024
In April 1999, the Company issued $150 million of 25-year debentures with each $1,000 debenture exchangeable, at a reference price of $23.50 per share, into 42.5532 shares of Cominco Ltd. At the time of the merger with Cominco Ltd. in 2001, holders of these debentures were paid $6 in respect of each underlying Cominco share as a partial repayment. The face value of each $1,000 debenture was reduced to $745, and each debenture became convertible into 76.596 Class B subordinate voting shares for a total, if exchanged, of 11.5 million Class B subordinate voting shares. The debentures were exchangeable by the holder or redeemable by the Company at any time.
By virtue of the Company’s option to deliver a fi xed number of Class B subordinate voting shares to satisfy the principal payments, the debentures net of issue costs and taxes were classifi ed as a component of shareholders’ equity and the interest, net of taxes, was charged directly to retained earnings. This interest, net of taxes, totalled $3 million in 2006 (2005 —$4 million; 2004—$3 million).
On June 1, 2006, the Company completed a series of transactions culminating in the redemption of these debentures. In the course of these transactions, all outstanding debentures were exchanged and the Company issued 11.5 million Class B subordinate voting shares.
The exchange was a non-monetary transaction and did not affect the Company’s cash fl ow or earnings. Current tax benefi ts of $124 million on these transactions were recorded directly to shareholders’ equity.
(d) Redemption of convertible debt
On October 12, 2004, the Company issued 7.3 million Class B subordinate voting shares on conversion of US$156 million stated amount at maturity of its convertible subordinate debentures due 2006, which were called for redemption. Debentures with a stated amount at maturity of US$14 million were redeemed for cash.
17. SHAREHOLDERS’ EQUITY, continued
Consolidated Financial Statements Teck Cominco Limited
84
(e) Preference shares
In November 2003, the Articles of the Company were amended and the Company issued 790,000 Series 1 and 550,000 Series 2 preference shares to replace certain preference shares of its wholly owned subsidiary, TCML (formerly Cominco Ltd.). These shares entitle the holders to receive dividends and redemptions based upon a rate of return index governed by world prices for lead and silver. The rate of return index had been insuffi cient to trigger any dividend or redemption; therefore these shares expired in April 2006 without any payment.
(f) Share options
Under the Company’s share option plan, 9 million Class B subordinate voting shares have been set aside for grant of share options to full-time employees and directors of the Company and its affi liates. The exercise price for each option is the closing price for Class B subordinate voting shares on the last trading day before the date of grant. The Company issues new shares upon exercise of share options.
In the year ended December 31, 2006, the Company granted 355,450 Class B subordinate voting share options at market price to employees. These share options have an exercise price of $66.40, a vesting period of three years and expire in 2014.
The weighted average fair value of Class B subordinate voting share options granted in the year was estimated as $23 per share option (2005—$18; 2004—$10) at the grant date based on the Black-Scholes option-pricing model using the following assumptions:
2006 2005 2004
Dividend yield 1.04% 0.88% 0.80%Risk-free interest rate 4.11% 3.75% 3.50%Expected life 5.0 years 4.7 years 4.5 yearsExpected volatility 35% 36% 36%
Outstanding share options
2006 2005
Shares(in 000’s)
Weighted average
exercise priceShares
(in 000’s)
Weightedaverage
exercise price
Outstanding at beginning of year 2,691 $ 20.04 4,426 $ 15.09Granted 355 66.40 367 45.28Exercised (907) 17.45 (2,067) 13.77Expired — — (14) 25.09Forfeited (2) 61.73 (21) 31.39Outstanding at end of year 2,137 $ 28.79 2,691 $ 20.04
Vested and exercisable at end of year 1,278 $ 16.07 1,803 $ 13.51
Consolidated Financial Statements
85
Annual Report 2006
Information relating to share options outstanding at December 31, 2006:
Outstanding share
options (in 000’s)
Vested share
options (in 000’s) Price range
Weighted average exercise price on
outstanding options
Weighted average exercise price on options currently
exercisable
Weighted average remaining life on
outstanding options (months)
33 33 $ 6.39 — $ 9.59 $ 7.16 $ 7.16 28912 912 $ 9.60 — $ 14.39 $ 11.80 $ 11.80 2863 63 $ 14.40 — $ 21.60 $ 15.73 $ 15.73 4
447 182 $ 21.61 — $ 32.42 $ 25.09 $ 25.09 38329 88 $ 32.43 — $ 48.65 $ 45.28 $ 45.28 50353 — $ 48.66 — $ 66.40 $ 66.40 $ — 86
2,137 1,278 $ 6.39 — $ 66.40 $ 28.79 $ 16.07 42
The intrinsic value of a share option is the difference between the current market price for the Company’s Class B subordinate voting share and the exercise price of the option. For options outstanding, vested and exercisable at December 31, 2006, the aggregate intrinsic value, based on the December 31, 2006 closing price of $87.90 for the Class B subordinate voting share, was $126 million and $92 million respectively.
Further information about our share options
(Cdn$ in millions) 2006 2005 2004
Total compensation cost recognized $ 7 $ 6 $ 4
Total fair value of shares vested 5 3 —Total intrinsic value of share
options exercised 54 70 37
The unrecognized compensation costs for non-vested share options at December 31, 2006 were $5 million. The weighted average period over which it is expected to be recognized is 1.4 years.
(g) Deferred Share Units and Restricted Share Units
Under the Deferred Share Unit (DSU) or Restricted Share Unit (RSU) plan, directors and employees may receive either DSUs or RSUs, each of which entitle the holder to a cash payment equal to the market value of a Class B subordinate voting share of the Company at the time they are redeemed. In the case of directors, these units vest immediately. The units granted to employees vest after three years. Upon normal retirement the units vest immediately and when early retirement occurs, units vest on a pro-rata basis. Should employees be terminated without cause, units would vest on a pro-rata basis. Should employees be terminated with cause, units would be forfeited. DSUs may only be redeemed within twelve months from the time a holder ceases to be an employee or director while RSUs must be redeemed at the end of a three-year period measured from the end of the year immediately preceding the grant. Additional units are issued to refl ect dividends paid on Class B subordinate voting shares and other adjustments to the Class B subordinate voting shares.
17. SHAREHOLDERS’ EQUITY, continued
Consolidated Financial Statements Teck Cominco Limited
86
As at December 31, 2006, total outstanding DSUs and RSUs issued were 503,909.
Non-vested DSU and RSU activity for the year ended December 31, 2006
DSU and RSU
(in 000’s)
Weighted average grant
date fair value
Non-vested at beginning of year 215 $ 40.45Granted 244 70.23Expired — —Forfeited (1) 58.01Vested (99) 47.23Non-vested at end of year 359 $ 58.72
Further information about our DSUs and RSUs
(Cdn$ in millions, except weighted average) 2006 2005 2004
Weighted average fair value of the units $ 71.25 $ 43.68 $ 20.15
Total fair value of units vested 8 2 2Total compensation cost
recognized 17 12 3Tax benefi ts realized 2 — —Cash used to settle DSUs
and RSUs 6 — —
The unrecognized compensation cost for non-vested DSUs and RSUs at December 31, 2006 was $18 million. The weighted average period over which it is expected to be recognized is 1.8 years.
(h) Warrants
In May 2004, the Company received $90 million on the exercise of the 4,980,000 remaining warrants to purchase Class B subordinate voting shares at a price of $18 per share. The warrants were issued in 1999.
(i) Contributed surplus
(Cdn$ in millions) 2006 2005 2004
Beginning of year $ 61 $ 58 $ 57Stock-based compensation
expense (f) 7 6 4Transfer to Class B subordinate
voting shares on exercise of share options (4) (3) (2)
Redemption of convertible debt (d) — — (1)End of year $ 64 $ 61 $ 58
(j) Cumulative translation adjustment
The cumulative translation adjustment represents the net unrealized foreign exchange gains (losses) on translation of the accounts of self-sustaining foreign subsidiaries, net of foreign exchange losses on the portion of U.S. dollar denominated debt designated as hedges against these investments.
(Cdn$ in millions) 2006 2005 2004
Cumulative translation adjustment at beginning of year $ (168) $ (117) $ (43)
Exchange differences on investments in foreign subsidiaries 20 (53) (134)
Exchange differences on debt designated as a hedge of self-sustaining foreign subsidiaries 1 — 34
Exchange loss realized on reduction or disposal of foreign investment 2 2 26
Cumulative translation adjustment at end of year $ (145) $ (168) $ (117)
Consolidated Financial Statements
87
Annual Report 2006
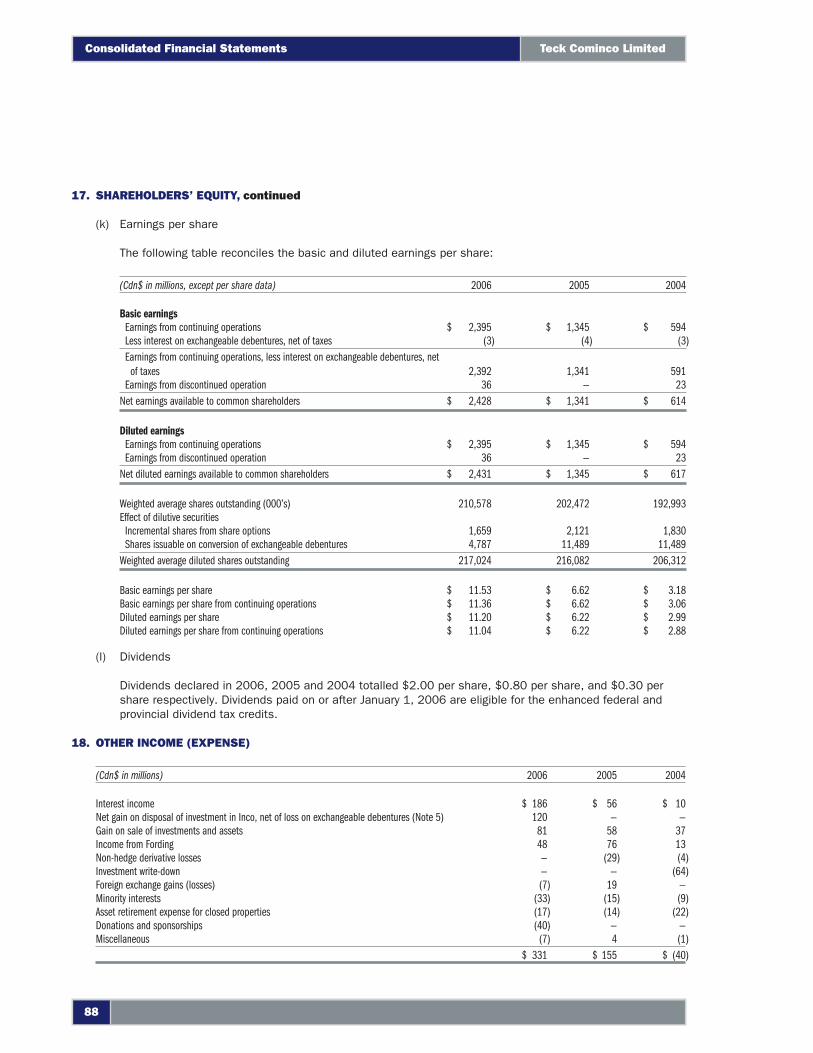
(k) Earnings per share
The following table reconciles the basic and diluted earnings per share:
(Cdn$ in millions, except per share data) 2006 2005 2004
Basic earningsEarnings from continuing operations $ 2,395 $ 1,345 $ 594Less interest on exchangeable debentures, net of taxes (3) (4) (3)Earnings from continuing operations, less interest on exchangeable debentures, net
of taxes 2,392 1,341 591Earnings from discontinued operation 36 — 23
Net earnings available to common shareholders $ 2,428 $ 1,341 $ 614
Diluted earningsEarnings from continuing operations $ 2,395 $ 1,345 $ 594Earnings from discontinued operation 36 — 23
Net diluted earnings available to common shareholders $ 2,431 $ 1,345 $ 617
Weighted average shares outstanding (000’s) 210,578 202,472 192,993Effect of dilutive securities
Incremental shares from share options 1,659 2,121 1,830Shares issuable on conversion of exchangeable debentures 4,787 11,489 11,489
Weighted average diluted shares outstanding 217,024 216,082 206,312
Basic earnings per share $ 11.53 $ 6.62 $ 3.18Basic earnings per share from continuing operations $ 11.36 $ 6.62 $ 3.06Diluted earnings per share $ 11.20 $ 6.22 $ 2.99Diluted earnings per share from continuing operations $ 11.04 $ 6.22 $ 2.88
(l) Dividends
Dividends declared in 2006, 2005 and 2004 totalled $2.00 per share, $0.80 per share, and $0.30 per share respectively. Dividends paid on or after January 1, 2006 are eligible for the enhanced federal and provincial dividend tax credits.
18. OTHER INCOME (EXPENSE)
(Cdn$ in millions) 2006 2005 2004
Interest income $ 186 $ 56 $ 10Net gain on disposal of investment in Inco, net of loss on exchangeable debentures (Note 5) 120 — —Gain on sale of investments and assets 81 58 37Income from Fording 48 76 13Non-hedge derivative losses — (29) (4)Investment write-down — — (64)Foreign exchange gains (losses) (7) 19 —Minority interests (33) (15) (9)Asset retirement expense for closed properties (17) (14) (22)Donations and sponsorships (40) — —Miscellaneous (7) 4 (1)
$ 331 $ 155 $ (40)
17. SHAREHOLDERS’ EQUITY, continued
Consolidated Financial Statements Teck Cominco Limited
88
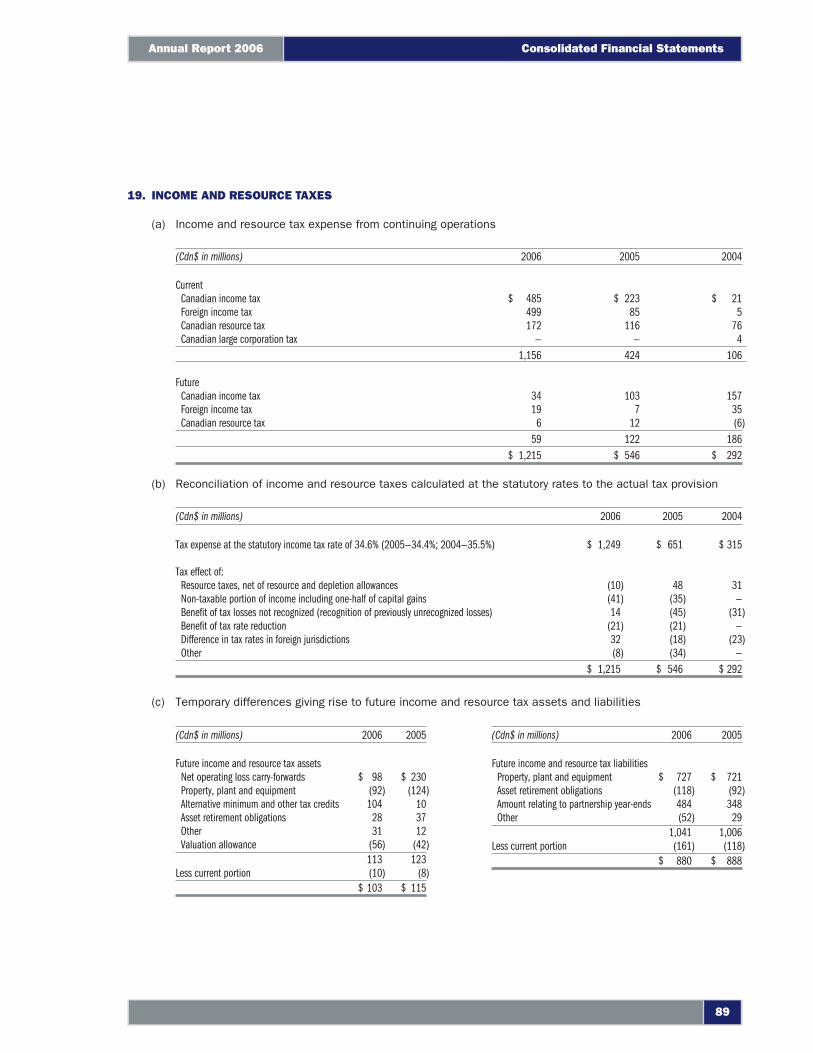
19. INCOME AND RESOURCE TAXES
(a) Income and resource tax expense from continuing operations
(Cdn$ in millions) 2006 2005 2004
CurrentCanadian income tax $ 485 $ 223 $ 21Foreign income tax 499 85 5Canadian resource tax 172 116 76Canadian large corporation tax — — 4
1,156 424 106
FutureCanadian income tax 34 103 157Foreign income tax 19 7 35Canadian resource tax 6 12 (6)
59 122 186$ 1,215 $ 546 $ 292
(b) Reconciliation of income and resource taxes calculated at the statutory rates to the actual tax provision
(Cdn$ in millions) 2006 2005 2004
Tax expense at the statutory income tax rate of 34.6% (2005—34.4%; 2004 —35.5%) $ 1,249 $ 651 $ 315
Tax effect of:Resource taxes, net of resource and depletion allowances (10) 48 31Non-taxable portion of income including one-half of capital gains (41) (35) —Benefi t of tax losses not recognized (recognition of previously unrecognized losses) 14 (45) (31)Benefi t of tax rate reduction (21) (21) —Difference in tax rates in foreign jurisdictions 32 (18) (23)Other (8) (34) —
$ 1,215 $ 546 $ 292
(c) Temporary differences giving rise to future income and resource tax assets and liabilities
(Cdn$ in millions) 2006 2005
Future income and resource tax assetsNet operating loss carry-forwards $ 98 $ 230Property, plant and equipment (92) (124)Alternative minimum and other tax credits 104 10Asset retirement obligations 28 37Other 31 12Valuation allowance (56) (42)
113 123Less current portion (10) (8)
$ 103 $ 115
(Cdn$ in millions) 2006 2005
Future income and resource tax liabilitiesProperty, plant and equipment $ 727 $ 721Asset retirement obligations (118) (92)Amount relating to partnership year-ends 484 348Other (52) 29
1,041 1,006Less current portion (161) (118)
$ 880 $ 888
Consolidated Financial Statements
89
Annual Report 2006
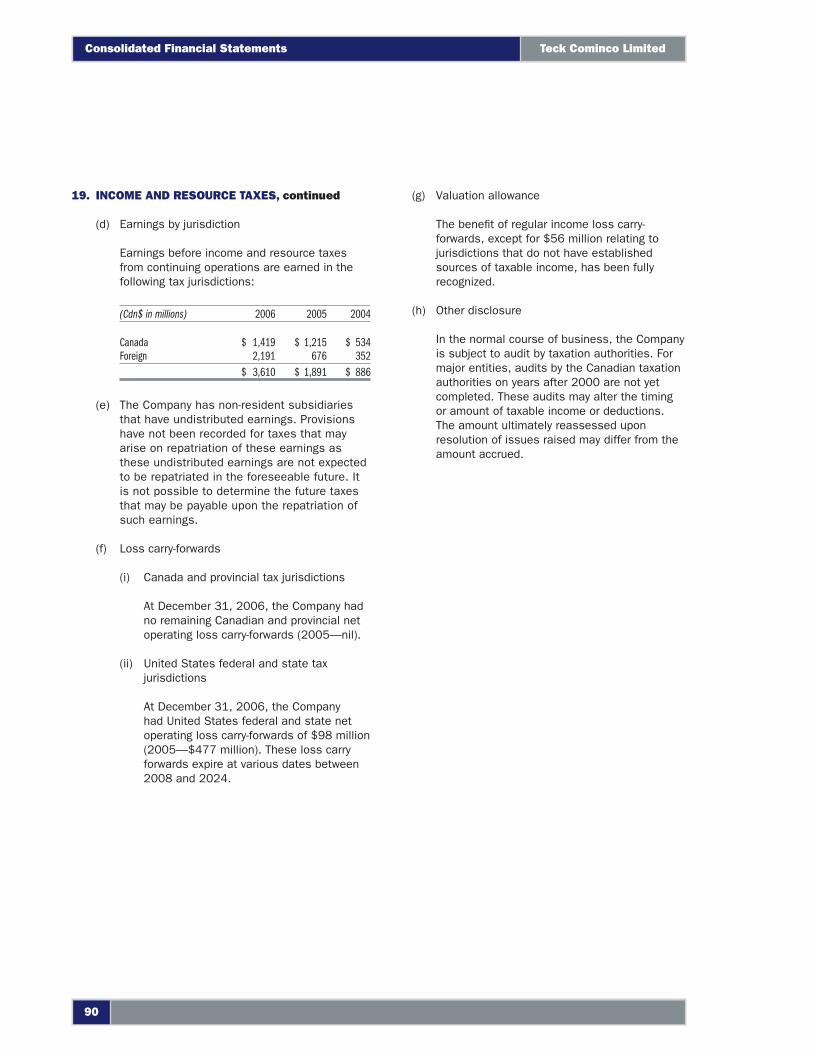
(d) Earnings by jurisdiction
Earnings before income and resource taxes from continuing operations are earned in the following tax jurisdictions:
(Cdn$ in millions) 2006 2005 2004
Canada $ 1,419 $ 1,215 $ 534Foreign 2,191 676 352
$ 3,610 $ 1,891 $ 886
(e) The Company has non-resident subsidiaries that have undistributed earnings. Provisions have not been recorded for taxes that may arise on repatriation of these earnings as these undistributed earnings are not expected to be repatriated in the foreseeable future. It is not possible to determine the future taxes that may be payable upon the repatriation of such earnings.
(f) Loss carry-forwards
(i) Canada and provincial tax jurisdictions
At December 31, 2006, the Company had no remaining Canadian and provincial net operating loss carry-forwards (2005—nil).
(ii) United States federal and state tax jurisdictions
At December 31, 2006, the Company had United States federal and state net operating loss carry-forwards of $98 million (2005—$477 million). These loss carry forwards expire at various dates between 2008 and 2024.
(g) Valuation allowance
The benefi t of regular income loss carry-forwards, except for $56 million relating to jurisdictions that do not have established sources of taxable income, has been fully recognized.
(h) Other disclosure
In the normal course of business, the Company is subject to audit by taxation authorities. For major entities, audits by the Canadian taxation authorities on years after 2000 are not yet completed. These audits may alter the timing or amount of taxable income or deductions. The amount ultimately reassessed upon resolution of issues raised may differ from the amount accrued.
19. INCOME AND RESOURCE TAXES, continued
Consolidated Financial Statements Teck Cominco Limited
90
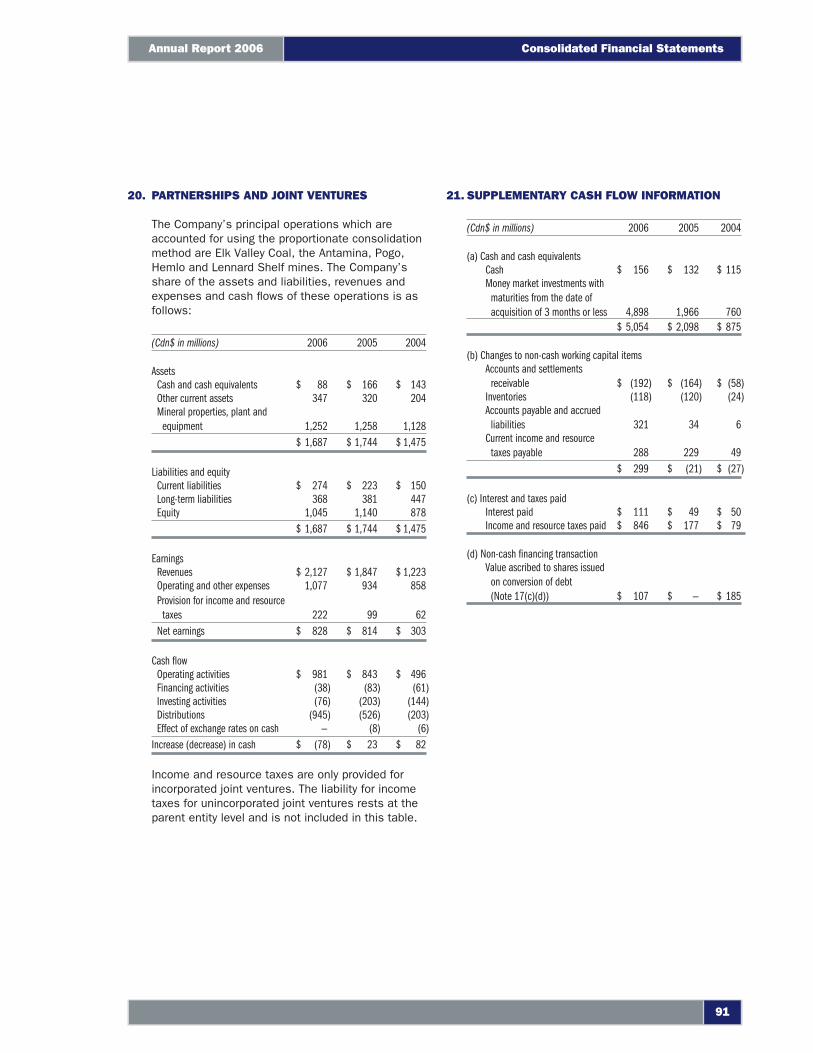
20. PARTNERSHIPS AND JOINT VENTURES
The Company’s principal operations which are accounted for using the proportionate consolidation method are Elk Valley Coal, the Antamina, Pogo, Hemlo and Lennard Shelf mines. The Company’s share of the assets and liabilities, revenues and expenses and cash fl ows of these operations is as follows:
(Cdn$ in millions) 2006 2005 2004
AssetsCash and cash equivalents $ 88 $ 166 $ 143Other current assets 347 320 204Mineral properties, plant and
equipment 1,252 1,258 1,128$ 1,687 $ 1,744 $ 1,475
Liabilities and equityCurrent liabilities $ 274 $ 223 $ 150Long-term liabilities 368 381 447Equity 1,045 1,140 878
$ 1,687 $ 1,744 $ 1,475
EarningsRevenues $ 2,127 $ 1,847 $ 1,223Operating and other expenses 1,077 934 858Provision for income and resource
taxes 222 99 62Net earnings $ 828 $ 814 $ 303
Cash fl owOperating activities $ 981 $ 843 $ 496Financing activities (38) (83) (61)Investing activities (76) (203) (144)Distributions (945) (526) (203)Effect of exchange rates on cash — (8) (6)
Increase (decrease) in cash $ (78) $ 23 $ 82
Income and resource taxes are only provided for incorporated joint ventures. The liability for income taxes for unincorporated joint ventures rests at the parent entity level and is not included in this table.
21. SUPPLEMENTARY CASH FLOW INFORMATION
(Cdn$ in millions) 2006 2005 2004
(a) Cash and cash equivalentsCash $ 156 $ 132 $ 115Money market investments with
maturities from the date of acquisition of 3 months or less 4,898 1,966 760
$ 5,054 $ 2,098 $ 875
(b) Changes to non-cash working capital itemsAccounts and settlements
receivable $ (192) $ (164) $ (58)Inventories (118) (120) (24)Accounts payable and accrued
liabilities 321 34 6Current income and resource
taxes payable 288 229 49$ 299 $ (21) $ (27)
(c) Interest and taxes paidInterest paid $ 111 $ 49 $ 50Income and resource taxes paid $ 846 $ 177 $ 79
(d) Non-cash fi nancing transactionValue ascribed to shares issued
on conversion of debt (Note 17(c)(d)) $ 107 $ — $ 185
Consolidated Financial Statements
91
Annual Report 2006
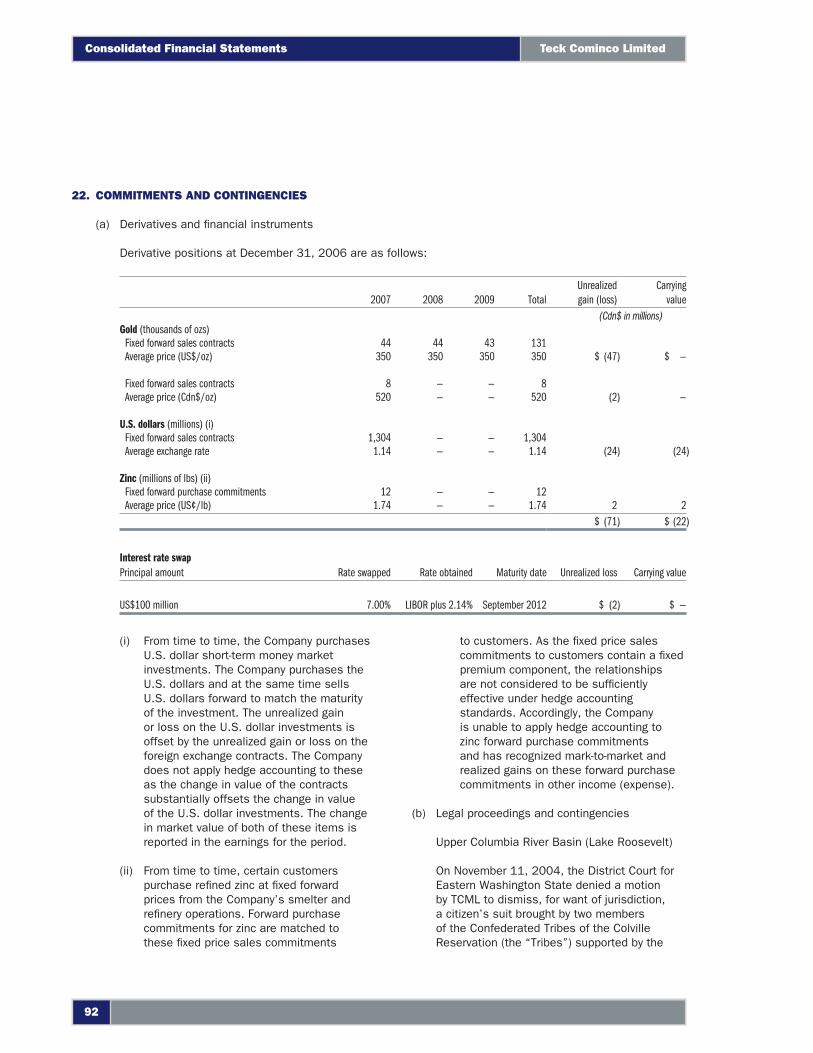
22. COMMITMENTS AND CONTINGENCIES
(a) Derivatives and fi nancial instruments
Derivative positions at December 31, 2006 are as follows:
2007 2008 2009 TotalUnrealizedgain (loss)
Carrying value
(Cdn$ in millions)Gold (thousands of ozs)
Fixed forward sales contracts 44 44 43 131Average price (US$/oz) 350 350 350 350 $ (47) $ —
Fixed forward sales contracts 8 — — 8Average price (Cdn$/oz) 520 — — 520 (2) —
U.S. dollars (millions) (i)Fixed forward sales contracts 1,304 — — 1,304Average exchange rate 1.14 — — 1.14 (24) (24)
Zinc (millions of lbs) (ii)Fixed forward purchase commitments 12 — — 12Average price (US¢/lb) 1.74 — — 1.74 2 2
$ (71) $ (22)
Interest rate swapPrincipal amount Rate swapped Rate obtained Maturity date Unrealized loss Carrying value
US$100 million 7.00% LIBOR plus 2.14% September 2012 $ (2) $ —
(i) From time to time, the Company purchases U.S. dollar short-term money market investments. The Company purchases the U.S. dollars and at the same time sells U.S. dollars forward to match the maturity of the investment. The unrealized gain or loss on the U.S. dollar investments is offset by the unrealized gain or loss on the foreign exchange contracts. The Company does not apply hedge accounting to these as the change in value of the contracts substantially offsets the change in value of the U.S. dollar investments. The change in market value of both of these items is reported in the earnings for the period.
(ii) From time to time, certain customers purchase refi ned zinc at fi xed forward prices from the Company’s smelter and refi nery operations. Forward purchase commitments for zinc are matched to these fi xed price sales commitments
to customers. As the fi xed price sales commitments to customers contain a fi xed premium component, the relationships are not considered to be suffi ciently effective under hedge accounting standards. Accordingly, the Company is unable to apply hedge accounting to zinc forward purchase commitments and has recognized mark-to-market and realized gains on these forward purchase commitments in other income (expense).
(b) Legal proceedings and contingencies
Upper Columbia River Basin (Lake Roosevelt)
On November 11, 2004, the District Court for Eastern Washington State denied a motion by TCML to dismiss, for want of jurisdiction, a citizen’s suit brought by two members of the Confederated Tribes of the Colville Reservation (the “Tribes”) supported by the
Consolidated Financial Statements Teck Cominco Limited
92
State of Washington. The citizen’s suit was brought pursuant to Section 310(a)(i) of the Comprehensive Environmental Response, Compensation, and Liability Act (CERCLA) to enforce a unilateral administrative order issued by the U.S. Environmental Protection Agency (EPA) on December 11, 2003 (the “UAO”), purporting to require TCML to conduct a remedial investigation and feasibility study with respect to metal contamination in the sediments of the Upper Columbia River and Lake Roosevelt. On February 14, 2005, the Federal Court of Appeals for the 9th Circuit granted TCML’s petition for permission to appeal that decision and the District Court entered a stay of proceedings (the “Stay”) pending a fi nal decision on the appeal. In September 2005, the District Court lifted the Stay to allow the State of Washington and the Tribes to add the Tribes as an additional plaintiff and to fi le amended complaints adding the State’s and the Tribes’ claims for natural resource damages and cost recovery under CERCLA. On September 29, 2005, the individual plaintiffs also served notice of their intention to fi le suit under the U.S. Resource Conservation and Recovery Act (RCRA) seeking injunctive relief and costs. As far as the Company is aware, no suit has been fi led under RCRA.
On July 3, 2006, the 9th Circuit affi rmed the District Court’s denial of TCML’s motion to dismiss the citizen’s suit. On October 30, 2006, the 9th Circuit denied TCML’s petition for a rehearing and subsequently granted a stay of mandate until March 6, 2007, pending the fi ling of an application for further appeal to the U.S. Supreme Court. The Company is preparing the application, which must be fi led before February 27, 2007.
On June 2, 2006, TCML and its U.S. affi liate, TCAI, entered into a Settlement Agreement (the “Agreement”) with the EPA and the United States under which TCAI is paying for and conducting a remedial investigation and feasibility study (the “Studies”) that, while not carried out under an administrative or judicial order, is consistent with the U.S. National Contingency Plan. TCAI is paying EPA’s oversight costs and providing US$1.1 million in annual funding to the EPA to facilitate
the full participation of the Tribes, the State and the U.S. Department of Interior, and TCML guaranteed TCAI’s performance of the Agreement. TCAI has placed US$20 million in escrow as fi nancial assurance of its obligations under the Agreement. Contemporaneously with the execution of the Agreement, the EPA withdrew the UAO. The recent decision of the 9th Circuit will not affect the Agreement.
There can be no assurance that the agreement to conduct and fund the Studies and the withdrawal of the UAO will be suffi cient to resolve the matter or that TCML or its affi liates will not be faced with further liability in relation to this matter. Until the studies are completed, it is not possible to estimate the extent and cost, if any, of remediation that may be required.
The Company considers provisions for all our outstanding and pending legal claims to be adequate. The fi nal outcome with respect to actions outstanding or pending as at December 31, 2006, or with respect to future claims, cannot be predicted with certainty.
(c) Mining royalty in Peru
On June 25, 2004, legislation that established a mining royalty of up to 3% of the value of sales of concentrate came into force. Management and its legal advisors are of the opinion that, under current legislation as well as the mining stability agreement subscribed with the Peruvian government, this royalty is not applicable to Compañìa Minera Antamina S.A. (CMA) until the expiration of such mining stability agreement on December 31, 2015. On June 28, 2006, however, the Peruvian Congress passed a law that requires all mining companies in Peru to pay the mining royalty regardless of whether they have been granted protection under a mining stability agreement; the law was observed by the Peruvian president and returned to Congress to be reviewed. The Company and its legal advisors are of the opinion that any change to the law that unilaterally imposes a royalty payment to a mining company protected under a Mining Stability Agreement is illegal and unconstitutional. In addition, in December CMA entered into an agreement with the government
Consolidated Financial Statements
93
Annual Report 2006
of Peru providing for voluntary contributions to funds established for the benefi t of communities affected by mining operations. These contributions are to be suspended in the event that CMA becomes subject to new royalties or mining levies. As a consequence, no provision for the mining royalty has been made in the fi nancial statements.
(d) Commitments and guarantees
Red Dog commitments
Pursuant to a royalty agreement with NANA Regional Corporation Inc. (NANA), TCAK pays NANA an annual advance royalty equal to the greater of 4.5% of Red Dog mine’s net smelter return or US$1 million. After the Company recovers certain capital expenditures including an interest factor, TCAK will pay to NANA 25% of net proceeds of production from the Red Dog mine, increasing in 5% increments every fi fth year to a maximum of 50%. Advance royalties previously paid will be recoverable against the 25% royalty on net proceeds of production. As at December 31, 2006, expenditures including an interest factor have been fully recovered. The unrecovered cumulative amount of advance royalties paid was US$104 million (2005—US$114 million). Based on the average realized zinc and lead prices in 2006, the Company estimates that the payment of the 25% royalty to NANA will commence in the fourth quarter of 2007 after the Company has recovered all advance royalty payments.
TCAK leases road and port facilities from the Alaska Industrial Development and Export Authority through which it ships all concentrates produced at the Red Dog mine. The lease requires TCAK to pay a minimum annual user fee of US$18 million but has no minimum tonnage requirements. There are also fee escalation provisions based on zinc price and annual tonnage.
TCAK has also entered into agreements for the transportation and handling of concentrates from the millsite. These agreements have varying terms expiring at various dates through 2010 and include provisions for extensions.
There are minimum tonnage requirements and the minimum annual fees amount to approximately US$9 million, with adjustment provisions based on variable cost factors.
Antamina royalty
On the acquisition of the Company’s interest in the Antamina mine, the vendor was granted a net profi ts royalty equivalent to 7.4% of the Company’s share of the project’s free cash fl ow after recovery of capital costs and an interest factor on approximately 60% of project costs. The recovery of accumulated capital costs together with interest was completed in 2006 and an expense of $33 million was recorded in the year in respect of this royalty.
Fort Hills
Under the Fort Hills agreement, the Company has committed to contribute 34% of the fi rst $2.5 billion of partnership expenditures on the Fort Hills project. In the event that the project is abandoned, all limited partners are required to make additional contributions such that the aggregate contributions of all partners equal $2.5 billion and any amounts unexpended will be distributed to the partners according to their partnership interest.
Elk Valley Coal Partnership guarantee
Elk Valley Coal has provided an unsecured guarantee, limited in recourse against the Company to the assets of Elk Valley Coal and the interest of the Company therein, with respect to up to $200 million of borrowings by Fording incurred principally in connection with the fi nancing of the transaction pursuant to which the Company acquired its interest in Elk Valley Coal. As at December 31, 2006, Fording had $30 million outstanding under these borrowings of which the Company’s 40% share was $12 million.
Operating leases
Amounts payable under operating leases are $102 million, with annual payments of $19 million in 2007, $14 million in 2008, $11 million in 2009, $9 million in 2010, $7 million in 2011, and $42 million thereafter. The
22. COMMITMENTS AND CONTINGENCIES, continued
Consolidated Financial Statements Teck Cominco Limited
94
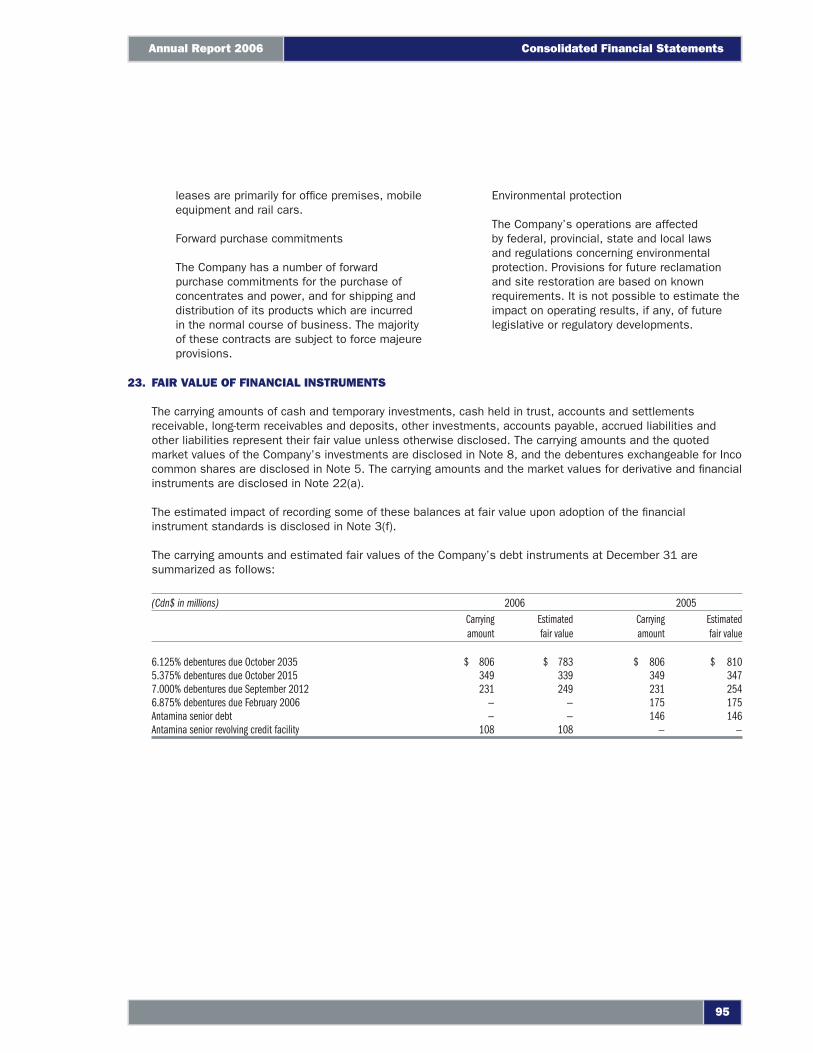
leases are primarily for offi ce premises, mobile equipment and rail cars.
Forward purchase commitments
The Company has a number of forward purchase commitments for the purchase of concentrates and power, and for shipping and distribution of its products which are incurred in the normal course of business. The majority of these contracts are subject to force majeure provisions.
Environmental protection
The Company’s operations are affected by federal, provincial, state and local laws and regulations concerning environmental protection. Provisions for future reclamation and site restoration are based on known requirements. It is not possible to estimate the impact on operating results, if any, of future legislative or regulatory developments.
23. FAIR VALUE OF FINANCIAL INSTRUMENTS
The carrying amounts of cash and temporary investments, cash held in trust, accounts and settlements receivable, long-term receivables and deposits, other investments, accounts payable, accrued liabilities and other liabilities represent their fair value unless otherwise disclosed. The carrying amounts and the quoted market values of the Company’s investments are disclosed in Note 8, and the debentures exchangeable for Inco common shares are disclosed in Note 5. The carrying amounts and the market values for derivative and fi nancial instruments are disclosed in Note 22(a).
The estimated impact of recording some of these balances at fair value upon adoption of the fi nancial instrument standards is disclosed in Note 3(f).
The carrying amounts and estimated fair values of the Company’s debt instruments at December 31 are summarized as follows:
(Cdn$ in millions) 2006 2005Carrying amount
Estimated fair value
Carrying amount
Estimated fair value
6.125% debentures due October 2035 $ 806 $ 783 $ 806 $ 8105.375% debentures due October 2015 349 339 349 3477.000% debentures due September 2012 231 249 231 2546.875% debentures due February 2006 — — 175 175Antamina senior debt — — 146 146Antamina senior revolving credit facility 108 108 — —
Consolidated Financial Statements
95
Annual Report 2006
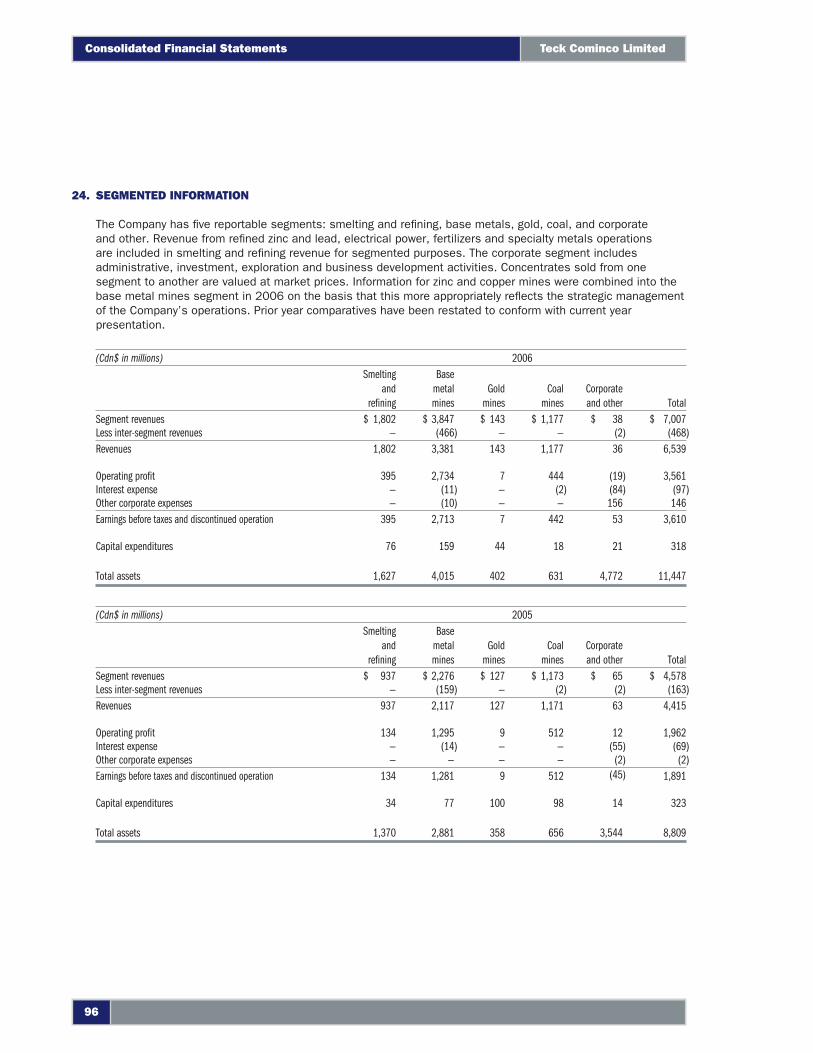
24. SEGMENTED INFORMATION
The Company has fi ve reportable segments: smelting and refi ning, base metals, gold, coal, and corporate and other. Revenue from refi ned zinc and lead, electrical power, fertilizers and specialty metals operations are included in smelting and refi ning revenue for segmented purposes. The corporate segment includes administrative, investment, exploration and business development activities. Concentrates sold from one segment to another are valued at market prices. Information for zinc and copper mines were combined into the base metal mines segment in 2006 on the basis that this more appropriately refl ects the strategic management of the Company’s operations. Prior year comparatives have been restated to conform with current year presentation.
(Cdn$ in millions) 2006Smelting
and refi ning
Base metal mines
Gold mines
Coal mines
Corporate and other Total
Segment revenues $ 1,802 $ 3,847 $ 143 $ 1,177 $ 38 $ 7,007Less inter-segment revenues — (466) — — (2) (468)Revenues 1,802 3,381 143 1,177 36 6,539
Operating profi t 395 2,734 7 444 (19) 3,561Interest expense — (11) — (2) (84) (97)Other corporate expenses — (10) — — 156 146Earnings before taxes and discontinued operation 395 2,713 7 442 53 3,610
Capital expenditures 76 159 44 18 21 318
Total assets 1,627 4,015 402 631 4,772 11,447
(Cdn$ in millions) 2005Smelting
and refi ning
Base metal mines
Gold mines
Coal mines
Corporate and other Total
Segment revenues $ 937 $ 2,276 $ 127 $ 1,173 $ 65 $ 4,578Less inter-segment revenues — (159) — (2) (2) (163)Revenues 937 2,117 127 1,171 63 4,415
Operating profi t 134 1,295 9 512 12 1,962Interest expense — (14) — — (55) (69)Other corporate expenses — — — — (2) (2)Earnings before taxes and discontinued operation 134 1,281 9 512 (45) 1,891
Capital expenditures 34 77 100 98 14 323
Total assets 1,370 2,881 358 656 3,544 8,809
Consolidated Financial Statements Teck Cominco Limited
96
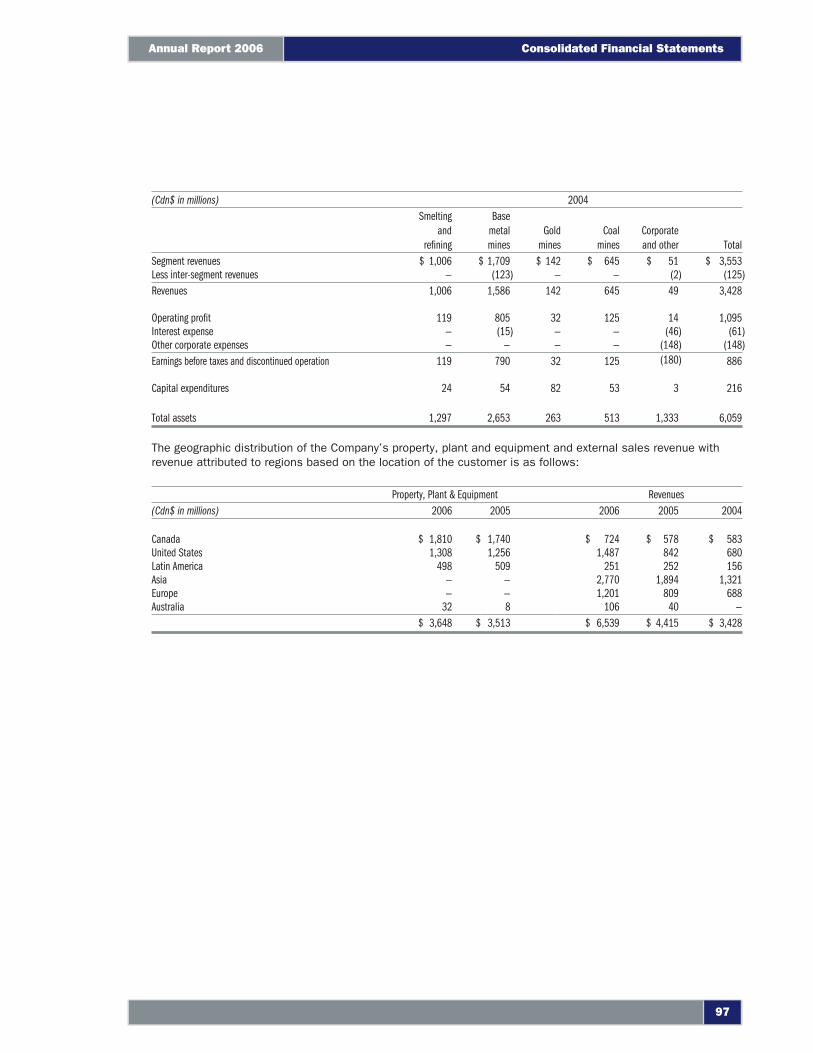
(Cdn$ in millions) 2004Smelting
and refi ning
Base metal mines
Gold mines
Coal mines
Corporate and other Total
Segment revenues $ 1,006 $ 1,709 $ 142 $ 645 $ 51 $ 3,553Less inter-segment revenues — (123) — — (2) (125)Revenues 1,006 1,586 142 645 49 3,428
Operating profi t 119 805 32 125 14 1,095Interest expense — (15) — — (46) (61)Other corporate expenses — — — — (148) (148)Earnings before taxes and discontinued operation 119 790 32 125 (180) 886
Capital expenditures 24 54 82 53 3 216
Total assets 1,297 2,653 263 513 1,333 6,059
The geographic distribution of the Company’s property, plant and equipment and external sales revenue with revenue attributed to regions based on the location of the customer is as follows:
Property, Plant & Equipment Revenues(Cdn$ in millions) 2006 2005 2006 2005 2004
Canada $ 1,810 $ 1,740 $ 724 $ 578 $ 583United States 1,308 1,256 1,487 842 680Latin America 498 509 251 252 156Asia — — 2,770 1,894 1,321Europe — — 1,201 809 688Australia 32 8 106 40 —
$ 3,648 $ 3,513 $ 6,539 $ 4,415 $ 3,428
Consolidated Financial Statements
97
Annual Report 2006
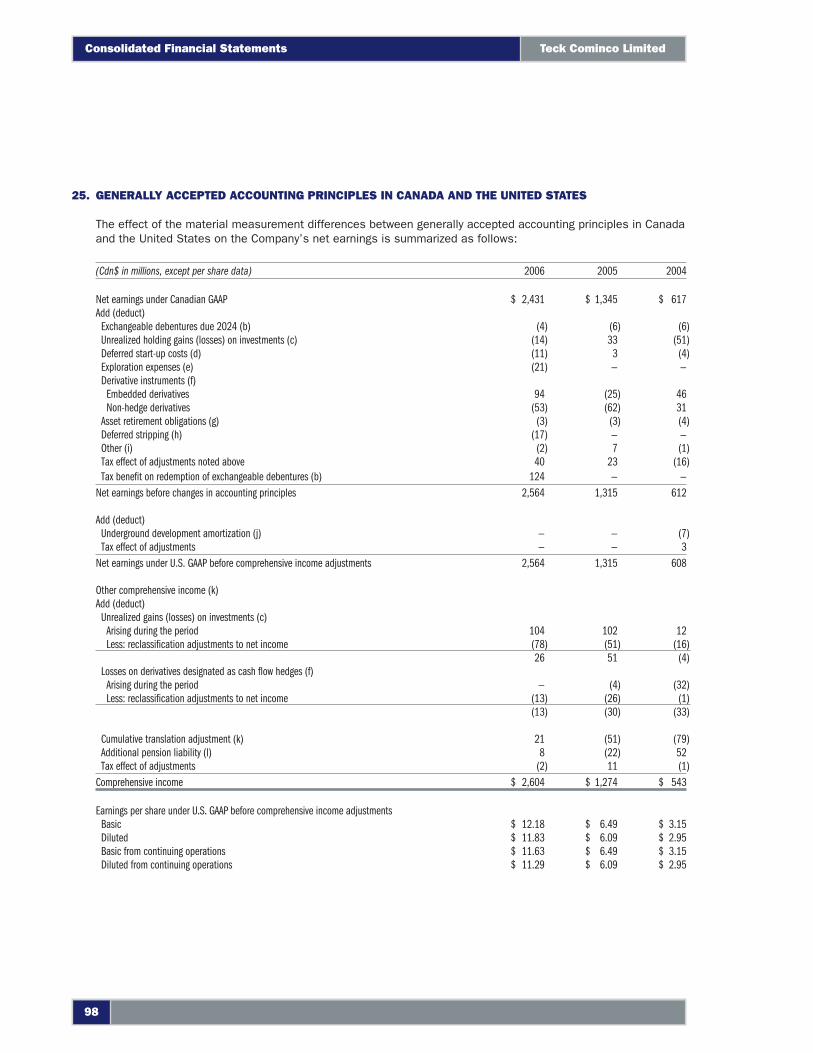
25. GENERALLY ACCEPTED ACCOUNTING PRINCIPLES IN CANADA AND THE UNITED STATES
The effect of the material measurement differences between generally accepted accounting principles in Canada and the United States on the Company’s net earnings is summarized as follows:
(Cdn$ in millions, except per share data) 2006 2005 2004
Net earnings under Canadian GAAP $ 2,431 $ 1,345 $ 617Add (deduct)
Exchangeable debentures due 2024 (b) (4) (6) (6)Unrealized holding gains (losses) on investments (c) (14) 33 (51)Deferred start-up costs (d) (11) 3 (4)Exploration expenses (e) (21) — —Derivative instruments (f)
Embedded derivatives 94 (25) 46Non-hedge derivatives (53) (62) 31
Asset retirement obligations (g) (3) (3) (4)Deferred stripping (h) (17) — —Other (i) (2) 7 (1)Tax effect of adjustments noted above 40 23 (16)Tax benefi t on redemption of exchangeable debentures (b) 124 — —
Net earnings before changes in accounting principles 2,564 1,315 612
Add (deduct)Underground development amortization (j) — — (7)Tax effect of adjustments — — 3
Net earnings under U.S. GAAP before comprehensive income adjustments 2,564 1,315 608
Other comprehensive income (k)Add (deduct)
Unrealized gains (losses) on investments (c) Arising during the period 104 102 12Less: reclassifi cation adjustments to net income (78) (51) (16)
26 51 (4)Losses on derivatives designated as cash fl ow hedges (f)
Arising during the period — (4) (32)Less: reclassifi cation adjustments to net income (13) (26) (1)
(13) (30) (33)
Cumulative translation adjustment (k) 21 (51) (79)Additional pension liability (l) 8 (22) 52Tax effect of adjustments (2) 11 (1)
Comprehensive income $ 2,604 $ 1,274 $ 543
Earnings per share under U.S. GAAP before comprehensive income adjustmentsBasic $ 12.18 $ 6.49 $ 3.15Diluted $ 11.83 $ 6.09 $ 2.95Basic from continuing operations $ 11.63 $ 6.49 $ 3.15Diluted from continuing operations $ 11.29 $ 6.09 $ 2.95
Teck Cominco 2005Consolidated Financial Statements Teck Cominco Limited
98
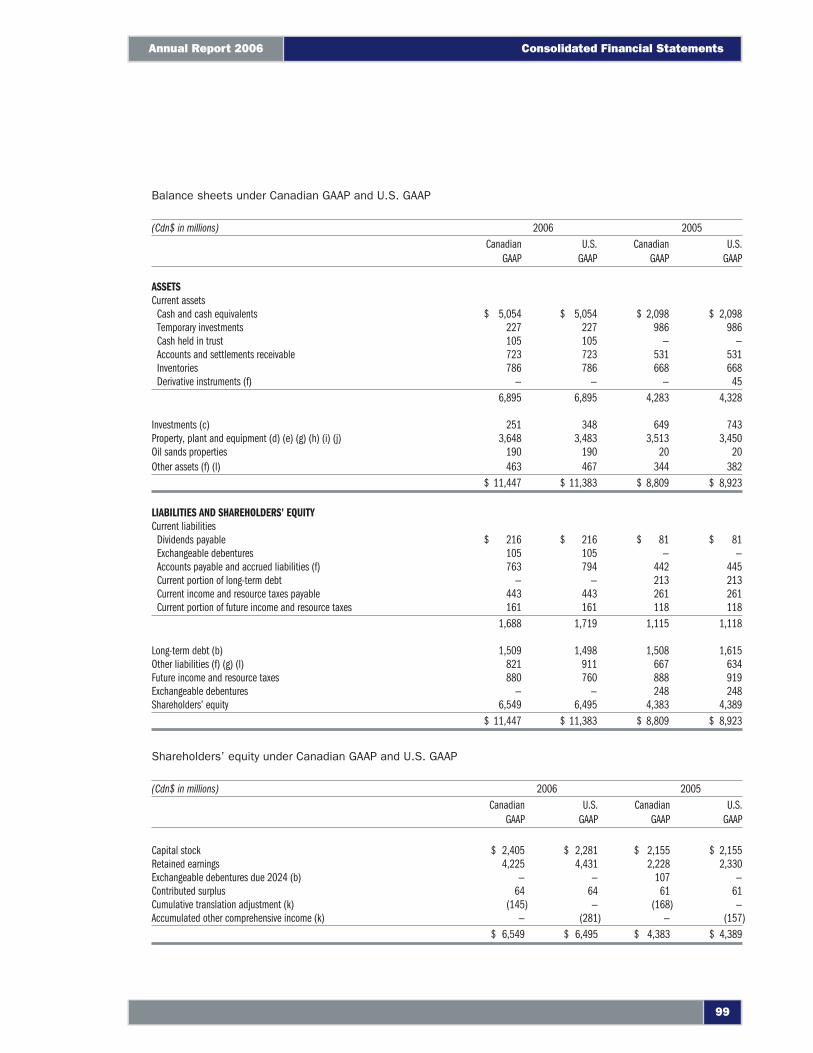
Balance sheets under Canadian GAAP and U.S. GAAP
(Cdn$ in millions) 2006 2005Canadian
GAAPU.S.
GAAPCanadian
GAAPU.S.
GAAP
ASSETSCurrent assets
Cash and cash equivalents $ 5,054 $ 5,054 $ 2,098 $ 2,098Temporary investments 227 227 986 986Cash held in trust 105 105 — —Accounts and settlements receivable 723 723 531 531Inventories 786 786 668 668Derivative instruments (f) — — — 45
6,895 6,895 4,283 4,328
Investments (c) 251 348 649 743Property, plant and equipment (d) (e) (g) (h) (i) (j) 3,648 3,483 3,513 3,450Oil sands properties 190 190 20 20Other assets (f) (l) 463 467 344 382
$ 11,447 $ 11,383 $ 8,809 $ 8,923
LIABILITIES AND SHAREHOLDERS’ EQUITYCurrent liabilities
Dividends payable $ 216 $ 216 $ 81 $ 81Exchangeable debentures 105 105 — —Accounts payable and accrued liabilities (f) 763 794 442 445Current portion of long-term debt — — 213 213Current income and resource taxes payable 443 443 261 261Current portion of future income and resource taxes 161 161 118 118
1,688 1,719 1,115 1,118
Long-term debt (b) 1,509 1,498 1,508 1,615Other liabilities (f) (g) (l) 821 911 667 634Future income and resource taxes 880 760 888 919Exchangeable debentures — — 248 248Shareholders’ equity 6,549 6,495 4,383 4,389
$ 11,447 $ 11,383 $ 8,809 $ 8,923
Shareholders’ equity under Canadian GAAP and U.S. GAAP
(Cdn$ in millions) 2006 2005Canadian
GAAPU.S.
GAAPCanadian
GAAPU.S.
GAAP
Capital stock $ 2,405 $ 2,281 $ 2,155 $ 2,155Retained earnings 4,225 4,431 2,228 2,330Exchangeable debentures due 2024 (b) — — 107 —Contributed surplus 64 64 61 61Cumulative translation adjustment (k) (145) — (168) —Accumulated other comprehensive income (k) — (281) — (157)
$ 6,549 $ 6,495 $ 4,383 $ 4,389
Consolidated Financial Statements
99
Annual Report 2006
(a) Adoption of new accounting standards
(i) Accounting for defi ned benefi t pension and other post-retirement plans
During the year, the Company adopted FASB Statement No. 158, “Employers’ Accounting for Defi ned Benefi t Pension and Other Post-Retirement Plans—An Amendment of FASB Statements No. 87, 88, 106 and 132(R)”. Under SFAS No. 158, employers must recognize a net liability or asset to report the funded or underfunded status of their defi ned benefi t pension and other post-retirement benefi t plans on their balance sheets. Changes in the funded status during the year will be recorded in other comprehensive income. The standard does not change the calculation of periodic pension expense under U.S. GAAP but will affect other comprehensive income in future years. Before adoption of this standard, the Company had an additional minimum pension liability of $21 million. The adoption of this standard resulted in a $263 million charge, net of $99 million of taxes, directly to ending accumulated other comprehensive income and had no impact on the Company’s net earnings or retained earnings.
(ii) Post-production stripping costs
Effective January 1, 2006, under U.S. GAAP, the Company adopted EITF 04–6, “Accounting for Stripping Costs Incurred during Production in the Mining Industry”. It requires stripping costs to be accounted for as a variable production cost to be included in the costs of inventory produced during the production phase.
Under Canadian GAAP, the Company has elected to prospectively adopt EIC-160, the related Canadian standard, and amortizes
the existing balance sheet amount relating to deferred stripping costs over the reserves to which it relates. Under U.S. GAAP, the Company has retroactively adopted EITF 04–06 and has elected to recognize the cumulative effect of the adjustment in the opening balance of retained earnings. This resulted in an initial U.S. GAAP difference to decrease property, plant and equipment by $52 million, decrease future income tax liability by $23 million and decrease retained earnings by $29 million.
Canadian GAAP permits capitalization of stripping activity which represents a betterment of a mineral property. Betterment occurs when the stripping activity increases future output of the mine by providing access to additional sources of reserves. Capitalized stripping costs are amortized on a unit of production basis over the proven and probable reserves to which they relate. Under U.S. GAAP, all stripping costs are treated as variable production costs.
(iii) Accounting changes and error corrections
On January 1, 2006, the Company adopted SFAS No. 154, “Accounting for Changes and Error Corrections”. The new standard requires that entities that make a voluntary change in accounting principle apply that change retroactively to prior period fi nancial statements, unless this would be impracticable. For changes in methods of depreciation and amortization for long-lived assets, the change must be accounted for prospectively, as a change in estimate. The adoption of this standard did not result in a material impact to the Company’s consolidated fi nancial statements.
25. GENERALLY ACCEPTED ACCOUNTING PRINCIPLES IN CANADA AND THE UNITED STATES, continued
Consolidated Financial Statements Teck Cominco Limited
100
(iv) Quantifying misstatements in the fi nancial statements
In 2006, the Company applied Staffi ng Accounting Bulletin No. 108 issued by the Securities and Exchange Commission. The bulletin provides interpretive guidance on the consideration of the effects of prior year misstatements in quantifying current year misstatements for the purpose of materiality assessment. The standard uses a dual approach that includes both an income statement and balance sheet assessment of any misstatement. The implementation of this guidance did not result in a material impact to the Company’s consolidated fi nancial statements.
(b) Exchangeable debentures due 2024
The exchangeable debentures due 2024, redeemed in 2006, were classifi ed as equity with related interest being charged directly to retained earnings. Under U.S. GAAP, these were classifi ed as liabilities and interest was charged against current period earnings. The redemption of the debentures in 2006 (Note 17(c)) was treated as a non-monetary transaction and the carrying value of the debentures was transferred to share capital. Tax benefi ts arising on the settlement were recorded in earnings for U.S. GAAP purposes.
(c) Unrealized holding gains (losses) on investments
For US GAAP purposes, certain of the Company’s marketable securities are considered to be either available-for-sale securities or trading securities. Available-for-sale securities are carried at market value with unrealized gains or losses included in other comprehensive income until realized or until an other-than-temporary decline occurs. The Company’s trading securities are carried at market value with unrealized gains or losses included in net earnings.
(d) Deferred start-up costs
Under Canadian GAAP, mine start-up costs are deferred until the mine reaches commercial levels of production and are amortized over the life of the project. Under U.S. GAAP, these costs are expensed as incurred.
(e) Exploration expense
Under Canadian GAAP, the Company capitalizes exploration expenditures where resources as defi ned under National Instrument 43-101 exist and it is expected that the expenditures can be recovered by future exploitation or sale. For U.S. GAAP, exploration expenditures are expensed unless proven and probable reserves have been established by a feasibility study.
(f) Derivative instruments
Under Canadian GAAP, derivative instruments to which hedge accounting is applied are held off-balance sheet with realized gains and losses recorded in net earnings. Non-hedge derivative instruments are recorded on the balance sheet at fair value with changes in fair value recorded in other income (Note 22(a)).
For U.S. GAAP purposes, all derivatives are recorded on the balance sheet as either assets or liabilities at fair value. The accounting for changes in the fair value of derivatives depends on whether the derivative has been designated as a fair value or cash fl ow hedge and whether it qualifi es as part of a hedging relationship.
(i) For fair value hedges, the effective portion of the changes in fair value of the derivatives is offset by changes in the fair value of the hedged item in net earnings. For cash fl ow hedges, the effective portion of the changes in fair value is accumulated in other comprehensive income and released into net earnings when the hedged item affects net earnings. For derivatives not accounted for as part of a hedging relationship, changes in fair value are included in net earnings.
Consolidated Financial Statements
101
Annual Report 2006
(ii) The Company’s Inco exchangeable debentures include an option to settle the debt with Inco shares. Under U.S. GAAP, this option constitutes an embedded derivative which is accounted for as a separate derivative instrument and recorded on the balance sheet at fair value with changes in fair value included in net earnings.
(iii) TCAK’s agreement with the Northwest Arctic Borough includes an escalation clause based on zinc price. This constitutes an embedded derivative under U.S. GAAP, and the derivative instrument has been separately valued and recorded at fair value on the balance sheet. Changes in fair value are included in net earnings.
(iv) The Company’s contingent consideration from the sale of Cajamarquilla based on zinc prices (Note 4(a)) constitutes an embedded derivative under U.S. GAAP, and the derivative instrument has been separately valued and recorded at fair value on the balance sheet. Changes in fair value are included in net earnings.
In 2005 and 2004, certain instruments entered into by Elk Valley Coal were designated as cash fl ow hedges. For U.S. GAAP purposes, the Company did not designate any other derivatives as hedges under SFAS 133 in the periods presented.
(g) Asset retirement obligations
For U.S. GAAP purposes, the Company adopted FASB Statement No. 143, “Accounting for Asset Retirement Obligations”, effective January 1, 2003. The Company adopted the provisions of CICA 3110, “Asset Retirement Obligations”, for Canadian GAAP purposes effective January 1, 2004.
The Canadian and U.S. standards for asset retirement obligations are substantially the same; however, due to the difference in adoption dates, different discount rate assumptions were used in initial liability recognition. This resulted in differences in the asset and liability balances on adoption and will result in different amortization and accretion charges over time.
(h) Deferred stripping
Canadian GAAP differs from U.S. GAAP in that it allows the capitalization of deferred stripping costs when such costs are considered a betterment of the asset.
(i) Other
Other adjustments include differences in respect of equity earnings, long-term debt discounts, interest capitalization and other items.
25. GENERALLY ACCEPTED ACCOUNTING PRINCIPLES IN CANADA AND THE UNITED STATES, continued
Consolidated Financial Statements Teck Cominco Limited
102
(j) Underground development amortization
Under Canadian GAAP, the Company retroactively adopted the block method of underground amortization, effective January 1, 2004, which resulted in a $4 million charge to opening retained earnings. U.S. GAAP requires that such a change be accounted for as a cumulative adjustment through the current period income statement. Net earnings under U.S. GAAP were reduced by $4 million after-tax during 2004.
(k) Comprehensive income
Under US GAAP, comprehensive income is recognized and measured in accordance with FASB Statement No. 130, “Reporting Comprehensive Income”. Comprehensive income includes all changes in equity other than those resulting from investments by owners and distributions to owners. Comprehensive income includes two components, net income and other comprehensive income. Other comprehensive income includes amounts that are recorded as an element of shareholders’ equity but
are excluded from net income as these transactions or events were attributable to changes from non-owner sources. These items include pension liability adjustments, holding gains and losses on certain investments, gains and losses on certain derivative instruments and foreign currency gains and losses related to self-sustaining foreign operations (cumulative translation adjustment). A standard for comprehensive income and other comprehensive income was effective under Canadian GAAP on January 1, 2007.
(l) Pension liability
For U.S. GAAP purposes, the Company is required to report the overfunded asset or underfunded liability of the Company’s defi ned benefi t pension and other post-retirement plans on the balance sheet. Changes in the funded status are recorded through other comprehensive income. The information set out below should be read in conjunction with the information disclosed under Canadian GAAP requirements for pension and other employee future benefi ts provided in Note 16.
Consolidated Financial Statements
103
Annual Report 2006
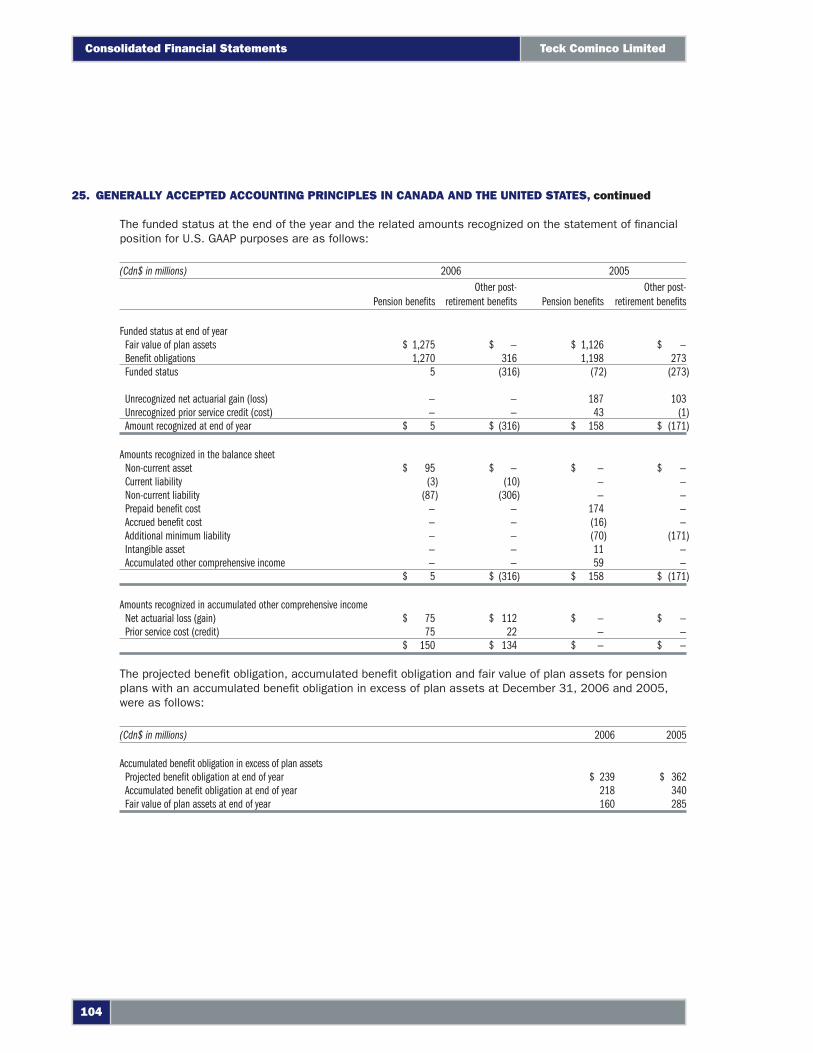
The funded status at the end of the year and the related amounts recognized on the statement of fi nancial position for U.S. GAAP purposes are as follows:
(Cdn$ in millions) 2006 2005
Pension benefi tsOther post-
retirement benefi ts Pension benefi tsOther post-
retirement benefi ts
Funded status at end of yearFair value of plan assets $ 1,275 $ — $ 1,126 $ —Benefi t obligations 1,270 316 1,198 273Funded status 5 (316) (72) (273)
Unrecognized net actuarial gain (loss) — — 187 103Unrecognized prior service credit (cost) — — 43 (1)Amount recognized at end of year $ 5 $ (316) $ 158 $ (171)
Amounts recognized in the balance sheetNon-current asset $ 95 $ — $ — $ —Current liability (3) (10) — —Non-current liability (87) (306) — —Prepaid benefi t cost — — 174 —Accrued benefi t cost — — (16) —Additional minimum liability — — (70) (171)Intangible asset — — 11 —Accumulated other comprehensive income — — 59 —
$ 5 $ (316) $ 158 $ (171)
Amounts recognized in accumulated other comprehensive incomeNet actuarial loss (gain) $ 75 $ 112 $ — $ —Prior service cost (credit) 75 22 — —
$ 150 $ 134 $ — $ —
The projected benefi t obligation, accumulated benefi t obligation and fair value of plan assets for pension plans with an accumulated benefi t obligation in excess of plan assets at December 31, 2006 and 2005, were as follows:
(Cdn$ in millions) 2006 2005
Accumulated benefi t obligation in excess of plan assetsProjected benefi t obligation at end of year $ 239 $ 362Accumulated benefi t obligation at end of year 218 340Fair value of plan assets at end of year 160 285
25. GENERALLY ACCEPTED ACCOUNTING PRINCIPLES IN CANADA AND THE UNITED STATES, continued
Consolidated Financial Statements Teck Cominco Limited
104
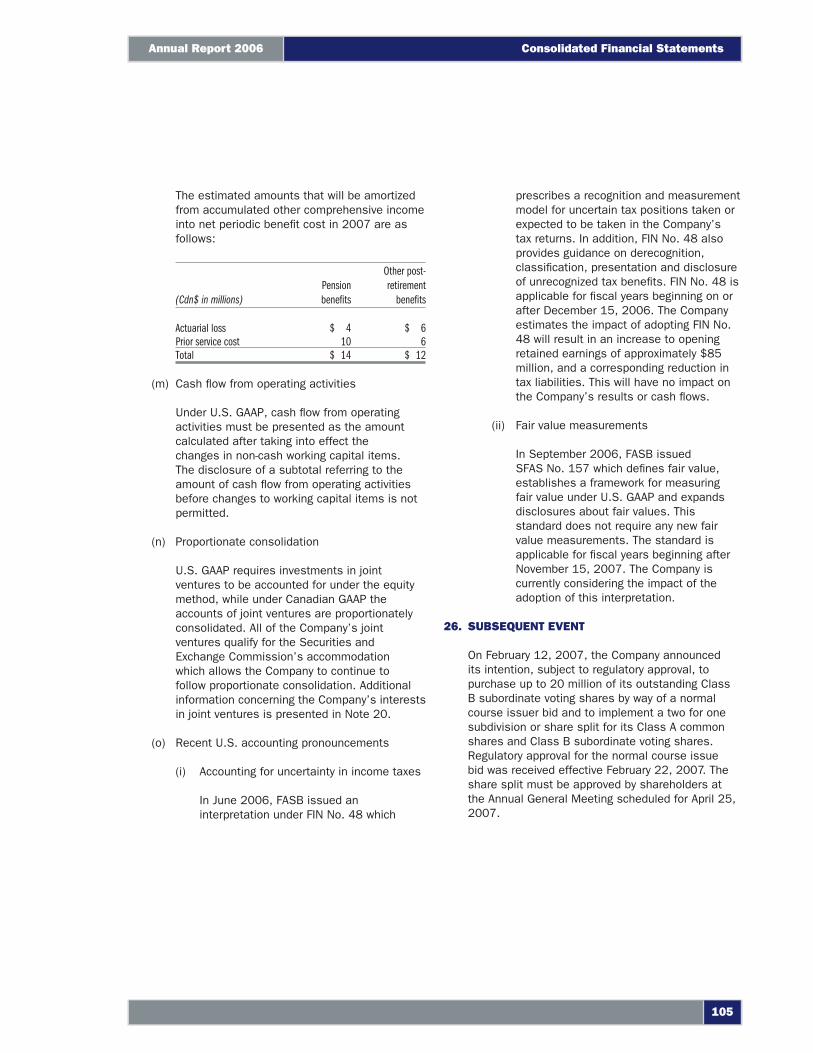
The estimated amounts that will be amortized from accumulated other comprehensive income into net periodic benefi t cost in 2007 are as follows:
(Cdn$ in millions)Pension benefi ts
Other post-retirement
benefi ts
Actuarial loss $ 4 $ 6Prior service cost 10 6Total $ 14 $ 12
(m) Cash fl ow from operating activities
Under U.S. GAAP, cash fl ow from operating activities must be presented as the amount calculated after taking into effect the changes in non-cash working capital items. The disclosure of a subtotal referring to the amount of cash fl ow from operating activities before changes to working capital items is not permitted.
(n) Proportionate consolidation
U.S. GAAP requires investments in joint ventures to be accounted for under the equity method, while under Canadian GAAP the accounts of joint ventures are proportionately consolidated. All of the Company’s joint ventures qualify for the Securities and Exchange Commission’s accommodation which allows the Company to continue to follow proportionate consolidation. Additional information concerning the Company’s interests in joint ventures is presented in Note 20.
(o) Recent U.S. accounting pronouncements
(i) Accounting for uncertainty in income taxes
In June 2006, FASB issued an interpretation under FIN No. 48 which
prescribes a recognition and measurement model for uncertain tax positions taken or expected to be taken in the Company’s tax returns. In addition, FIN No. 48 also provides guidance on derecognition, classifi cation, presentation and disclosure of unrecognized tax benefi ts. FIN No. 48 is applicable for fi scal years beginning on or after December 15, 2006. The Company estimates the impact of adopting FIN No. 48 will result in an increase to opening retained earnings of approximately $85 million, and a corresponding reduction in tax liabilities. This will have no impact on the Company’s results or cash fl ows.
(ii) Fair value measurements
In September 2006, FASB issued SFAS No. 157 which defi nes fair value, establishes a framework for measuring fair value under U.S. GAAP and expands disclosures about fair values. This standard does not require any new fair value measurements. The standard is applicable for fi scal years beginning after November 15, 2007. The Company is currently considering the impact of the adoption of this interpretation.
26. SUBSEQUENT EVENT
On February 12, 2007, the Company announced its intention, subject to regulatory approval, to purchase up to 20 million of its outstanding Class B subordinate voting shares by way of a normal course issuer bid and to implement a two for one subdivision or share split for its Class A common shares and Class B subordinate voting shares. Regulatory approval for the normal course issue bid was received effective February 22, 2007. The share split must be approved by shareholders at the Annual General Meeting scheduled for April 25, 2007.
Consolidated Financial Statements
105
Annual Report 2006
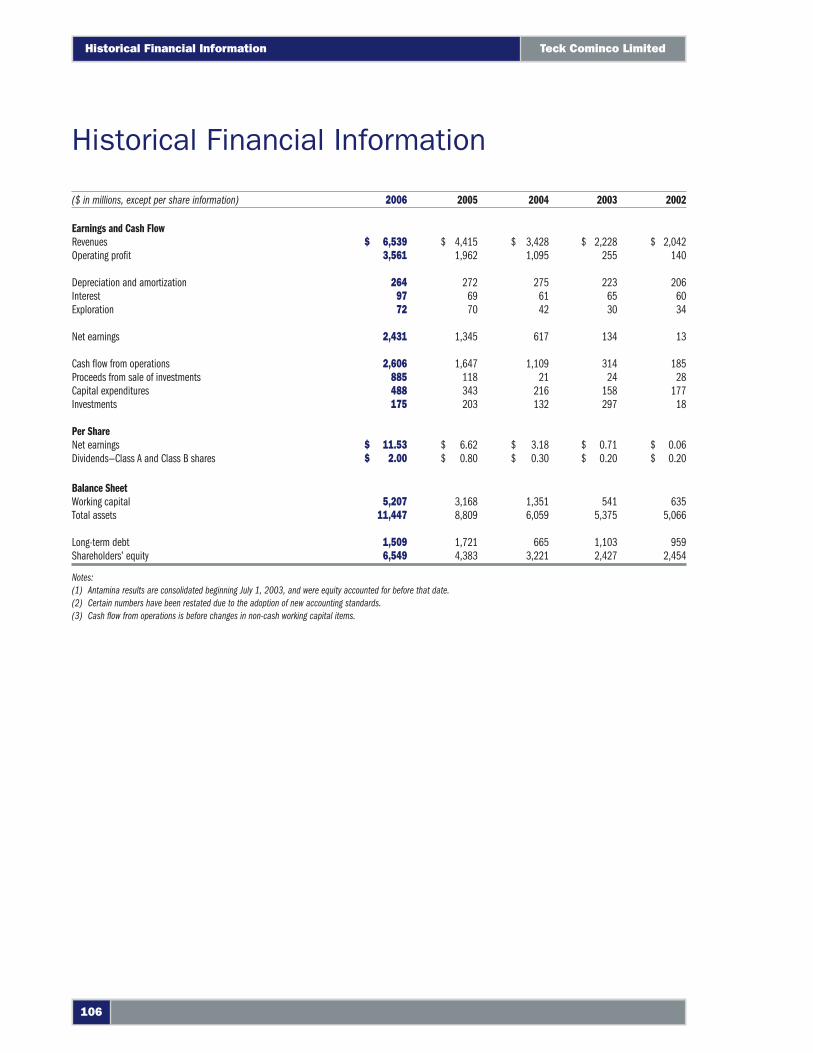
Historical Financial Information
($ in millions, except per share information) 2006 2005 2004 2003 2002
Earnings and Cash FlowRevenues $ 6,539 $ 4,415 $ 3,428 $ 2,228 $ 2,042Operating profi t 3,561 1,962 1,095 255 140
Depreciation and amortization 264 272 275 223 206Interest 97 69 61 65 60Exploration 72 70 42 30 34
Net earnings 2,431 1,345 617 134 13
Cash fl ow from operations 2,606 1,647 1,109 314 185Proceeds from sale of investments 885 118 21 24 28Capital expenditures 488 343 216 158 177Investments 175 203 132 297 18
Per ShareNet earnings $ 11.53 $ 6.62 $ 3.18 $ 0.71 $ 0.06Dividends—Class A and Class B shares $ 2.00 $ 0.80 $ 0.30 $ 0.20 $ 0.20
Balance SheetWorking capital 5,207 3,168 1,351 541 635Total assets 11,447 8,809 6,059 5,375 5,066
Long-term debt 1,509 1,721 665 1,103 959Shareholders’ equity 6,549 4,383 3,221 2,427 2,454
Notes:(1) Antamina results are consolidated beginning July 1, 2003, and were equity accounted for before that date.(2) Certain numbers have been restated due to the adoption of new accounting standards.(3) Cash fl ow from operations is before changes in non-cash working capital items.
Teck Cominco Limited
106
Historical Financial Information
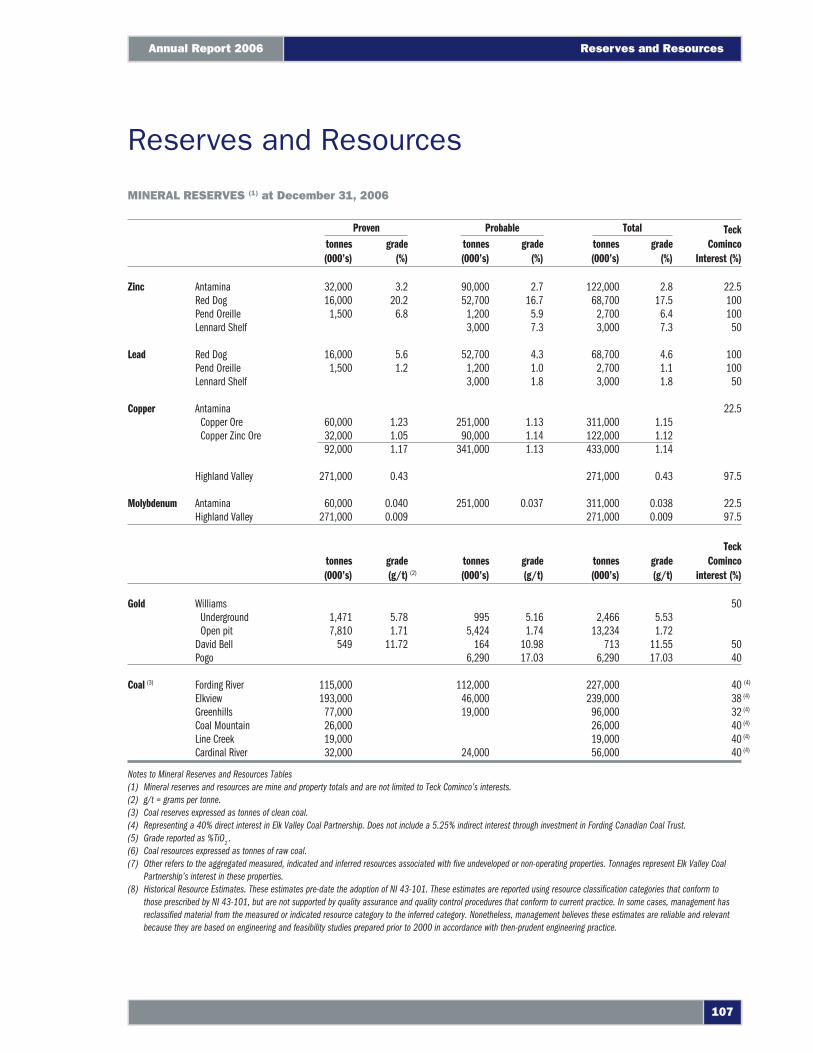
MINERAL RESERVES (1) at December 31, 2006
Proven Probable Total Teck Cominco
Interest (%)tonnes (000’s)
grade (%)
tonnes (000’s)
grade (%)
tonnes (000’s)
grade (%)
Zinc Antamina 32,000 3.2 90,000 2.7 122,000 2.8 22.5Red Dog 16,000 20.2 52,700 16.7 68,700 17.5 100Pend Oreille 1,500 6.8 1,200 5.9 2,700 6.4 100Lennard Shelf 3,000 7.3 3,000 7.3 50
Lead Red Dog 16,000 5.6 52,700 4.3 68,700 4.6 100Pend Oreille 1,500 1.2 1,200 1.0 2,700 1.1 100Lennard Shelf 3,000 1.8 3,000 1.8 50
Copper Antamina 22.5Copper Ore 60,000 1.23 251,000 1.13 311,000 1.15Copper Zinc Ore 32,000 1.05 90,000 1.14 122,000 1.12
92,000 1.17 341,000 1.13 433,000 1.14
Highland Valley 271,000 0.43 271,000 0.43 97.5
Molybdenum Antamina 60,000 0.040 251,000 0.037 311,000 0.038 22.5Highland Valley 271,000 0.009 271,000 0.009 97.5
tonnes (000’s)
grade (g/t) (2)
tonnes (000’s)
grade (g/t)
tonnes (000’s)
grade (g/t)
Teck Cominco
interest (%)
Gold Williams 50Underground 1,471 5.78 995 5.16 2,466 5.53Open pit 7,810 1.71 5,424 1.74 13,234 1.72
David Bell 549 11.72 164 10.98 713 11.55 50Pogo 6,290 17.03 6,290 17.03 40
Coal (3) Fording River 115,000 112,000 227,000 40 (4)
Elkview 193,000 46,000 239,000 38 (4)
Greenhills 77,000 19,000 96,000 32 (4)
Coal Mountain 26,000 26,000 40 (4)
Line Creek 19,000 19,000 40 (4)
Cardinal River 32,000 24,000 56,000 40 (4)
Notes to Mineral Reserves and Resources Tables(1) Mineral reserves and resources are mine and property totals and are not limited to Teck Cominco’s interests.(2) g/t = grams per tonne.(3) Coal reserves expressed as tonnes of clean coal.(4) Representing a 40% direct interest in Elk Valley Coal Partnership. Does not include a 5.25% indirect interest through investment in Fording Canadian Coal Trust.(5) Grade reported as %TiO
2 .
(6) Coal resources expressed as tonnes of raw coal.(7) Other refers to the aggregated measured, indicated and inferred resources associated with fi ve undeveloped or non-operating properties. Tonnages represent Elk Valley Coal
Partnership’s interest in these properties.(8) Historical Resource Estimates. These estimates pre-date the adoption of NI 43-101. These estimates are reported using resource classifi cation categories that conform to
those prescribed by NI 43-101, but are not supported by quality assurance and quality control procedures that conform to current practice. In some cases, management has reclassifi ed material from the measured or indicated resource category to the inferred category. Nonetheless, management believes these estimates are reliable and relevant because they are based on engineering and feasibility studies prepared prior to 2000 in accordance with then-prudent engineering practice.
Reserves and Resources
107
Annual Report 2006 Reserves and Resources
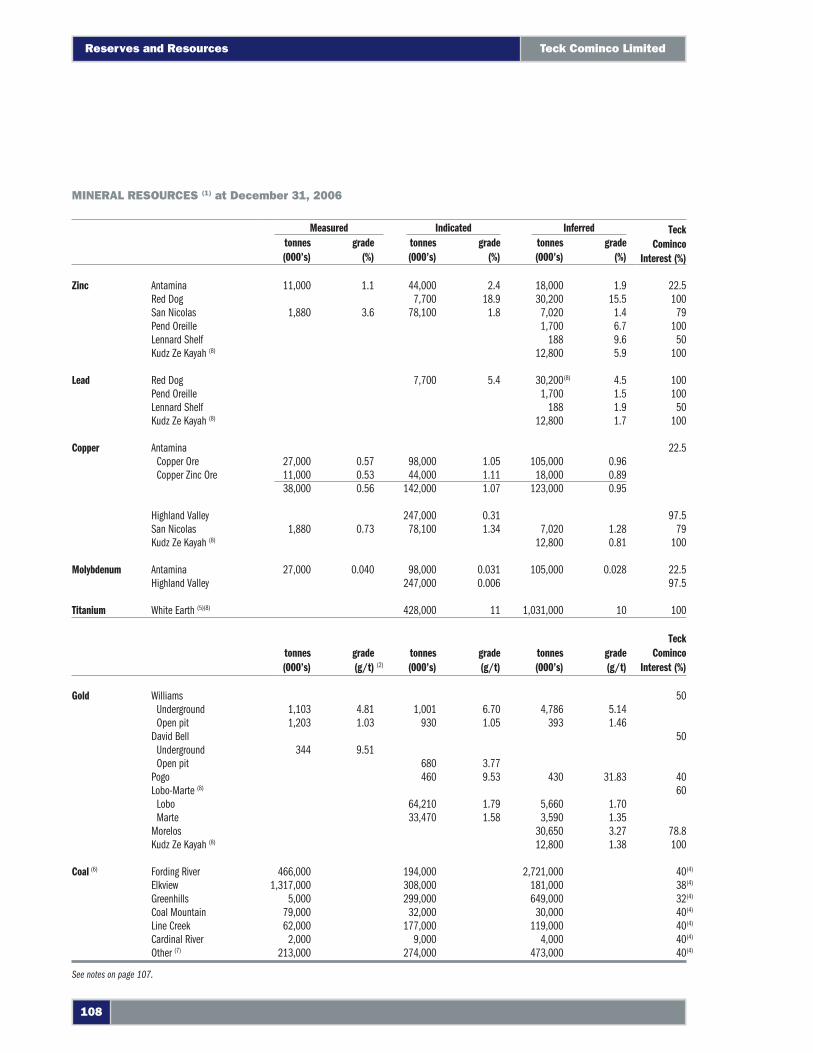
MINERAL RESOURCES (1) at December 31, 2006
Measured Indicated Inferred Teck Cominco
Interest (%)tonnes (000’s)
grade (%)
tonnes (000’s)
grade (%)
tonnes (000’s)
grade (%)
Zinc Antamina 11,000 1.1 44,000 2.4 18,000 1.9 22.5Red Dog 7,700 18.9 30,200 15.5 100San Nicolas 1,880 3.6 78,100 1.8 7,020 1.4 79Pend Oreille 1,700 6.7 100Lennard Shelf 188 9.6 50Kudz Ze Kayah (8) 12,800 5.9 100
Lead Red Dog 7,700 5.4 30,200(8) 4.5 100Pend Oreille 1,700 1.5 100Lennard Shelf 188 1.9 50Kudz Ze Kayah (8) 12,800 1.7 100
Copper Antamina 22.5Copper Ore 27,000 0.57 98,000 1.05 105,000 0.96Copper Zinc Ore 11,000 0.53 44,000 1.11 18,000 0.89
38,000 0.56 142,000 1.07 123,000 0.95
Highland Valley 247,000 0.31 97.5San Nicolas 1,880 0.73 78,100 1.34 7,020 1.28 79Kudz Ze Kayah (8) 12,800 0.81 100
Molybdenum Antamina 27,000 0.040 98,000 0.031 105,000 0.028 22.5Highland Valley 247,000 0.006 97.5
Titanium White Earth (5)(8) 428,000 11 1,031,000 10 100
tonnes (000’s)
grade (g/t) (2)
tonnes (000’s)
grade (g/t)
tonnes (000’s)
grade (g/t)
Teck Cominco
Interest (%)
Gold Williams 50Underground 1,103 4.81 1,001 6.70 4,786 5.14Open pit 1,203 1.03 930 1.05 393 1.46
David Bell 50Underground 344 9.51Open pit 680 3.77
Pogo 460 9.53 430 31.83 40Lobo-Marte (8) 60
Lobo 64,210 1.79 5,660 1.70Marte 33,470 1.58 3,590 1.35
Morelos 30,650 3.27 78.8Kudz Ze Kayah (8) 12,800 1.38 100
Coal (6) Fording River 466,000 194,000 2,721,000 40(4)
Elkview 1,317,000 308,000 181,000 38(4)
Greenhills 5,000 299,000 649,000 32(4)
Coal Mountain 79,000 32,000 30,000 40(4)
Line Creek 62,000 177,000 119,000 40(4)
Cardinal River 2,000 9,000 4,000 40(4)
Other (7) 213,000 274,000 473,000 40(4)
See notes on page 107.
Teck Cominco Limited
108
Reserves and Resources
STANDARD
Proven and Probable Mineral Reserves and Measured, Indicated and Inferred Mineral Resources have been estimated in accordance with the defi nitions of these terms adopted by the Canadian Institute of Mining, Metallurgy and Petroleum (“CIM”) in November 2005 and incorporated in National Instrument 43-101, “Standards of Disclosure for Mineral Projects” (“NI 43-101”), by Canadian securities regulatory authorities. Estimates of coal reserves and resources have been prepared and classifi ed using guidance from the Geological Survey of Canada Paper 88-21. Classifi cation terminology for coal conforms to CIM defi nitions incorporated into NI 43-101. Mineral Resources are reported separately from and do not include that portion of the Mineral Resources that is classifi ed as Mineral Reserves. That portion of Mineral Resource which is not classifi ed as Mineral Reserve does not have demonstrated economic value.
DEFINITIONS
The CIM defi nitions on Mineral Resources and Mineral Reserves provide as follows:
A Mineral Resource is a concentration or occurrence of diamonds, natural solid inorganic material, or natural solid fossilized organic material including base and precious metals, coal, and industrial minerals in or on the earth’s crust in such form and quantity and of such a grade or quality that it has reasonable prospects for economic extraction. The location, quantity, grade, geological characteristics and continuity of a Mineral Resource are known, estimated or interpreted from specifi c geological evidence and knowledge.
An Inferred Mineral Resource is that part of a Mineral Resource for which quantity and grade or quality can be estimated on the basis of geological evidence and limited sampling and reasonably assumed, but not verifi ed, geological and grade continuity. The estimate is based on limited information and sampling gathered through appropriate techniques from locations such as outcrops, trenches, pits, workings and drill holes.
An Indicated Mineral Resource is that part of a Mineral Resource for which quantity, grade or quality, densities, shape and physical characteristics, can be estimated with a level of confi dence suffi cient to allow the appropriate application of technical and economic parameters, to support mine planning and evaluation of the economic viability of the deposit. The estimate is based on detailed and reliable exploration and testing information gathered
through appropriate techniques from locations such as outcrops, trenches, pits, workings and drill holes that are spaced closely enough for geological and grade continuity to be reasonably assumed.
A Measured Mineral Resource is that part of a Mineral Resource for which quantity, grade or quality, densities, shape, and physical characteristics are so well established that they can be estimated with confi dence suffi cient to allow the appropriate application of technical and economic parameters, to support production planning and evaluation of the economic viability of the deposit. The estimate is based on detailed and reliable exploration, sampling and testing information gathered through appropriate techniques from locations such as outcrops, trenches, pits, workings and drill holes that are spaced closely enough to confi rm both geological and grade continuity.
A Mineral Reserve is the economically mineable part of a Measured or Indicated Mineral Resource demonstrated by at least a Preliminary Feasibility Study. This Study must include adequate information on mining, processing, metallurgical, economic and other relevant factors that demonstrate, at the time of reporting, that economic extraction can be justifi ed. A Mineral Reserve includes diluting materials and allowances for losses that may occur when the material is mined.
A Probable Mineral Reserve is the economically mineable part of an Indicated and, in some circumstances, a Measured Mineral Resource demonstrated by at least a Preliminary Feasibility Study. This Study must include adequate information on mining, processing, metallurgical, economic, and other relevant factors that demonstrate, at the time of reporting, that economic extraction can be justifi ed.
A Proven Mineral Reserve is the economically mineable part of a Measured Mineral Resource demonstrated by at least a Preliminary Feasibility Study. This Study must include adequate information on mining, processing, metallurgical, economic, and other relevant factors that demonstrate, at the time of reporting, that economic extraction is justifi ed.
METHODOLOGIES AND ASSUMPTIONS
Mineral reserve and resource estimates are based on various assumptions relating to operating matters, including with respect to production costs, mining and processing recoveries, mining dilution, cut-off values or grades, as well as assumptions relating to long-term
Mineral Reserves and Mineral Resources
109
Annual Report 2006 Reserves and Resources
commodity prices and, in some cases, exchange rates. Cost estimates are based on feasibility study estimates or operating history.
Methodologies used in reserve and resource estimates vary from property to property depending on the style of mineralization, geology and other factors. Geostatistical methods appropriate to the style of mineralization have been used in the estimation of reserves at the Company’s material base metal and gold properties.
Assumed metal prices vary from property to property for a number of reasons. The Company has interests in a number of joint ventures, for which assumed metal prices are a joint venture decision. In certain cases, assumed metal prices are historical assumptions made at the time of the relevant reserve and resource estimates. For operations with short remaining lives, assumed metal prices may refl ect shorter-term commodity price forecasts.
AntaminaMineral reserves at Antamina were estimated using assumed metal prices of US$0.95/lb copper, US$0.50/lb zinc and US$7.50/lb molybdenum. Two general ore types occur at Antamina. These are copper ores, from which copper and molybdenum concentrates are produced, and copper/zinc ores, from which copper and zinc concentrates are recovered. Reserves and resources are reported by general ore type. In 2006, mine production reduced reserves by 30 million tonnes. This reduction was offset by 42 million tonnes of resource that was drill defi ned to reserve status. A new production and cut-off schedule developed in 2006 transferred 19 million tonnes of low grade reserve to resource stockpile. Changes in pit design and block modelling methodology contributed to small reserve reductions.
Signifi cant increases in resource resulted from engineering studies completed on material below the current ultimate pit. The 2006 resource estimate includes 137 million tonnes of additional measured and indicated resource and 93 million tonnes of additional inferred resource. Evaluations indicate the new resource has reasonable prospects for economic extraction at US$0.95/lb copper and US$0.50/lb zinc. Other changes include the 42 million tonne transfer from resource to reserve and the transfer of 19 million tonnes from reserve to resource stockpile, both described above, and a 24 million tonne increase due to lower cut-off.
Highland Valley CopperMine production in 2006 removed 40 million tonnes at the Valley and Lornex pits and 6.3 million tonnes from the Highmont pit. Mine production included 5.4 million tonnes of low grade material which was not previously included in reserve but was processed to take advantage of short-term metal prices. In 2006, the assumed copper price for reserves was increased from US$0.92 to US$1.10 per pound for Valley and Lornex, resulting in a 5.2 million tonne reserve increase. The assumed molybdenum price remained at US$5.00/lb. An additional 5 million tonnes of reserve was added in the Highmont pit, using an assumed metal price of US$1.40/lb copper and US$20/lb molybdenum, refl ecting short-term metal price forecasts. All reserve and resource estimates assume a C$1.20 per US$1.00 exchange rate.
Reserves have been drill defi ned at 60 to 115 metre centres and resources at 125 metre centres. In 2006, the indicated resource at Valley West increased by 71 million tonnes. The increase was largely attributed to the use of higher assumed metal prices. Indicated resources at Valley West and Highmont assume a US$1.64/lb copper price and US$9.50/lb molybdenum price. Resource tonnage is very sensitive to copper prices above US$1.10/lb.
Red DogMine production removed 3.2 million tonnes of reserves from the Main pit in 2006. Although reserves at Main were updated with current geologic and sample information, there was no material change associated with model revisions or pit design. Probable reserves at the Aqqaluk deposit did not change in 2006, although 79 defi nition drill holes were completed. The Aqqaluk models will be updated in early 2007 when remaining assay results from these holes are available. Proven reserves have been drill defi ned at 30 metre centres, probable reserves at 60 metre centres and indicated resources at greater than 60 metre centres. All mineral reserves and indicated resources are mineable by open pit and assume a US$0.55/lb zinc price and US$0.25/lb lead price. Operating costs and cut-off grades are based on a 2004 engineering study. Ultimate pit limits will be reviewed in 2007 in light of current costs and metal prices.
Inferred resources are reported for two underground deposits on the basis of an assumed zinc price of US$0.70/lb.
Mineral Reserves and Mineral ResourcesTeck Cominco Limited
110
Reserves and Resources
Pend OreilleExperience gained in mining over the past two years, particularly along the margins of the Pend Oreille orebody, has resulted in reserve reductions beyond normal mining depletion. Reductions are attributed to new mine design, higher operating costs, defi nition drilling and new grade models. Reserve reductions were partially offset by higher assumed metal prices. Mineral reserves and resources adopt a 4% zinc cut-off which corresponds to an assumed zinc price of US$0.83/lb and lead price of US$0.37/lb. Proven reserves occur between or below mined areas and have been defi ned by underground development and sampling. Probable reserves were drill defi ned at 20 metre centres and inferred resources at 80 to 100 metre centres. Inferred resources at Washington Rock assume US$0.60/lb zinc and US$ 0.25/lb lead.
Lennard ShelfThe Lennard Shelf operation resumed operations in early 2007. Mineral resource estimates reported at year-end 2005 have been upgraded to reserve status. Reserve and resource estimates were prepared using an assumed zinc price of US$0.70/lb and lead price of US$0.35/lb, at an assumed exchange rate of A$1 = US$0.75.
Other ResourcesMineral resource estimates at San Nicolas were based on assumed prices of US$0.90/lb copper and US$0.50/lb zinc (2001 study). Historic estimates at Kudz Ze Kayah were prepared in 1995 prior to the adoption of NI 43-101 reporting standards. These estimates are reported using resource classifi cation categories that conform to those prescribed by NI 43-101 but are not supported by quality assurance and quality control procedures that conform to current practice. Management has reclassifi ed material from the measured or indicated resource category to the inferred category. Nonetheless, management believes these estimates are reliable and relevant because they are based on engineering studies prepared prior to 2000 in accordance with then-prudent engineering practice.
Elk Valley CoalCoal reserves are reported in metric tonnes of clean coal after mining and processing losses. Reserve estimates assume a US$65/tonne coking coal price (free on board) at Roberts Bank terminal and include 2.5 million tonnes of thermal coal used for plant operations. Mine production in 2006, at the six operating coal mines, reduced reserves by 22.7 million tonnes. Reserves at Line Creek increased by 4.7 million tonnes due to a revised pit design at Horseshoe Ridge and MSA West Extension. Resources are reported as raw coal, have not been subject to recent economic review and do not
include losses for mining and processing. All reserve and resource estimates assume a C$1.18 per US$1.00 exchange rate.
PogoDuring 2006, mine operations removed and milled 312,000 tonnes of ore from reserve. Defi nition diamond drilling added 346,000 tonnes. Changes in the mine plan added 703,000 tonnes at an average grade of 0.93 g/t gold.
Mineral reserve and resource estimates assume a US$400/oz gold price for reserves and US$450/oz price for resources. Higher assumed operating costs, offset to some extent by the higher gold price, resulted in an increase in cut-off grade, reducing reserves by 1.4 million tonnes.
David Bell Mine production in 2006 removed 335,000 tonnes from reserves and 6,000 tonnes from resource. Defi nition drilling transferred 10,000 tonnes from resource to reserve and added 7,000 tonnes of new reserve in previously undefi ned areas. Refi nement of the mine plan transferred 42,000 tonnes from reserve to resource and removed 11,000 tonnes due to stope losses.
Mineral reserve and resource estimates assume a gold price of US$475/oz for reserves and US$525/oz for resources. Higher operating costs, offset to some extent by the higher gold price, reduced reserves by 54,000 tonnes. All reserve and resource estimates assume a C$1.21 per US$1.00 exchange rate.
Williams Mineral reserve and resource estimates on the Williams property assume a US$475/oz gold price for reserves, US$525/oz price for resources and a C$1.21 per US$1.00 exchange rate. Mine production in 2006 removed 3.4 million tonnes from reserve. The use of higher assumed gold prices added 1.0 million tonnes to the C Zone open pit reserve. During 2006, an increasing proportion of production was mined from the C Zone where mineralization has proven to be diffuse and irregular.
In 2006, open pit and underground production from the C Zone produced signifi cantly fewer ounces than predicted. Additional geologic modelling, changes in economic assumptions and the long-term cost structure of the mine may affect future mineral reserve and resource estimates. An engineering review for the C Zone is expected to be completed by mid 2007.
111
Annual Report 2006 Reserves and Resources
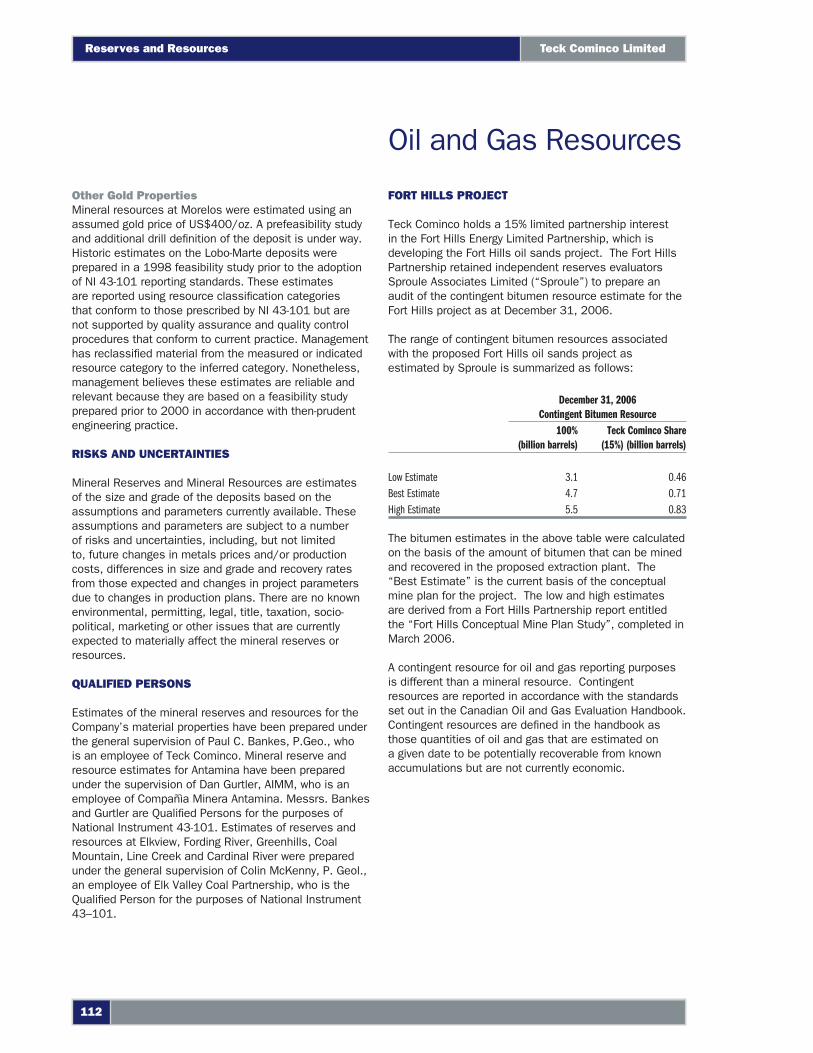
Other Gold PropertiesMineral resources at Morelos were estimated using an assumed gold price of US$400/oz. A prefeasibility study and additional drill defi nition of the deposit is under way. Historic estimates on the Lobo-Marte deposits were prepared in a 1998 feasibility study prior to the adoption of NI 43-101 reporting standards. These estimates are reported using resource classifi cation categories that conform to those prescribed by NI 43-101 but are not supported by quality assurance and quality control procedures that conform to current practice. Management has reclassifi ed material from the measured or indicated resource category to the inferred category. Nonetheless, management believes these estimates are reliable and relevant because they are based on a feasibility study prepared prior to 2000 in accordance with then-prudent engineering practice.
RISKS AND UNCERTAINTIES
Mineral Reserves and Mineral Resources are estimates of the size and grade of the deposits based on the assumptions and parameters currently available. These assumptions and parameters are subject to a number of risks and uncertainties, including, but not limited to, future changes in metals prices and/or production costs, differences in size and grade and recovery rates from those expected and changes in project parameters due to changes in production plans. There are no known environmental, permitting, legal, title, taxation, socio-political, marketing or other issues that are currently expected to materially affect the mineral reserves or resources.
QUALIFIED PERSONS
Estimates of the mineral reserves and resources for the Company’s material properties have been prepared under the general supervision of Paul C. Bankes, P.Geo., who is an employee of Teck Cominco. Mineral reserve and resource estimates for Antamina have been prepared under the supervision of Dan Gurtler, AIMM, who is an employee of Compañìa Minera Antamina. Messrs. Bankes and Gurtler are Qualifi ed Persons for the purposes of National Instrument 43-101. Estimates of reserves and resources at Elkview, Fording River, Greenhills, Coal Mountain, Line Creek and Cardinal River were prepared under the general supervision of Colin McKenny, P. Geol., an employee of Elk Valley Coal Partnership, who is the Qualifi ed Person for the purposes of National Instrument 43–101.
FORT HILLS PROJECT
Teck Cominco holds a 15% limited partnership interest in the Fort Hills Energy Limited Partnership, which is developing the Fort Hills oil sands project. The Fort Hills Partnership retained independent reserves evaluators Sproule Associates Limited (“Sproule”) to prepare an audit of the contingent bitumen resource estimate for the Fort Hills project as at December 31, 2006.
The range of contingent bitumen resources associated with the proposed Fort Hills oil sands project as estimated by Sproule is summarized as follows:
December 31, 2006 Contingent Bitumen Resource
100% (billion barrels)
Teck Cominco Share (15%) (billion barrels)
Low Estimate 3.1 0.46Best Estimate 4.7 0.71High Estimate 5.5 0.83
The bitumen estimates in the above table were calculated on the basis of the amount of bitumen that can be mined and recovered in the proposed extraction plant. The “Best Estimate” is the current basis of the conceptual mine plan for the project. The low and high estimates are derived from a Fort Hills Partnership report entitled the “Fort Hills Conceptual Mine Plan Study”, completed in March 2006.
A contingent resource for oil and gas reporting purposes is different than a mineral resource. Contingent resources are reported in accordance with the standards set out in the Canadian Oil and Gas Evaluation Handbook. Contingent resources are defi ned in the handbook as those quantities of oil and gas that are estimated on a given date to be potentially recoverable from known accumulations but are not currently economic.
Oil and Gas Resources
Teck Cominco Limited
112
Reserves and Resources
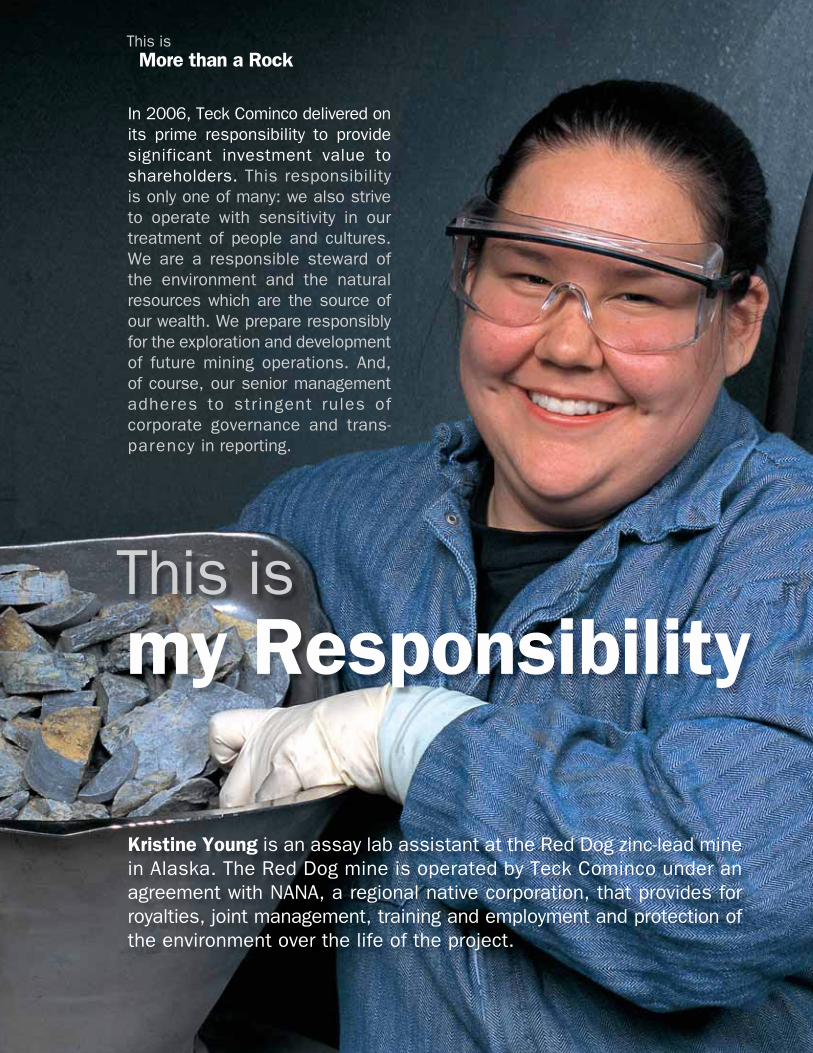
In 2006, Teck Cominco delivered on its prime responsibility to provide significant investment value to shareholders. This responsibility is only one of many: we also strive to operate with sensitivity in our treatment of people and cultures. We are a responsible steward of the environment and the natural resources which are the source of our wealth. We prepare responsibly for the exploration and development of future mining operations. And, of course, our senior management adheres to stringent rules of corporate governance and trans- parency in reporting.
This ismy Responsibility
This is More than a Rock
Kristine Young is an assay lab assistant at the Red Dog zinc-lead mine in Alaska. The Red Dog mine is operated by Teck Cominco under an agreement with NANA, a regional native corporation, that provides for royalties, joint management, training and employment and protection of the environment over the life of the project.
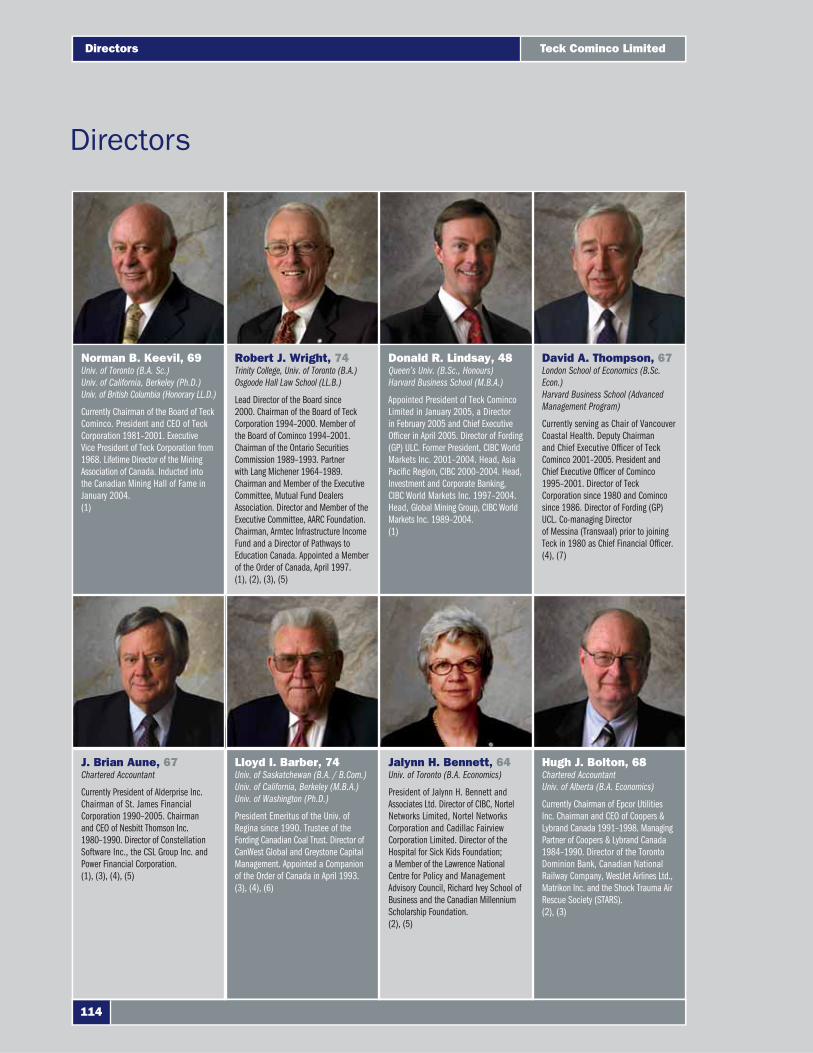
J. Brian Aune, 67Chartered Accountant
Currently President of Alderprise Inc. Chairman of St. James Financial Corporation 1990–2005. Chairman and CEO of Nesbitt Thomson Inc. 1980–1990. Director of Constellation Software Inc., the CSL Group Inc. and Power Financial Corporation.(1), (3), (4), (5)
Lloyd I. Barber, 74Univ. of Saskatchewan (B.A. / B.Com.)Univ. of California, Berkeley (M.B.A.)Univ. of Washington (Ph.D.)
President Emeritus of the Univ. of Regina since 1990. Trustee of the Fording Canadian Coal Trust. Director of CanWest Global and Greystone Capital Management. Appointed a Companion of the Order of Canada in April 1993. (3), (4), (6)
Jalynn H. Bennett, 64Univ. of Toronto (B.A. Economics)
President of Jalynn H. Bennett and Associates Ltd. Director of CIBC, Nortel Networks Limited, Nortel Networks Corporation and Cadillac Fairview Corporation Limited. Director of the Hospital for Sick Kids Foundation; a Member of the Lawrence National Centre for Policy and Management Advisory Council, Richard Ivey School of Business and the Canadian Millennium Scholarship Foundation.(2), (5)
Hugh J. Bolton, 68Chartered AccountantUniv. of Alberta (B.A. Economics)
Currently Chairman of Epcor Utilities Inc. Chairman and CEO of Coopers & Lybrand Canada 1991–1998. Managing Partner of Coopers & Lybrand Canada 1984–1990. Director of the Toronto Dominion Bank, Canadian National Railway Company, WestJet Airlines Ltd., Matrikon Inc. and the Shock Trauma Air Rescue Society (STARS).(2), (3)
Directors
David A. Thompson, 67London School of Economics (B.Sc. Econ.)Harvard Business School (Advanced Management Program)
Currently serving as Chair of Vancouver Coastal Health. Deputy Chairman and Chief Executive Offi cer of Teck Cominco 2001–2005. President and Chief Executive Offi cer of Cominco 1995–2001. Director of Teck Corporation since 1980 and Cominco since 1986. Director of Fording (GP) UCL. Co-managing Director of Messina (Transvaal) prior to joining Teck in 1980 as Chief Financial Offi cer.(4), (7)
Donald R. Lindsay, 48Queen’s Univ. (B.Sc., Honours)Harvard Business School (M.B.A.)
Appointed President of Teck Cominco Limited in January 2005, a Director in February 2005 and Chief Executive Offi cer in April 2005. Director of Fording (GP) ULC. Former President, CIBC World Markets Inc. 2001–2004. Head, Asia Pacifi c Region, CIBC 2000–2004. Head, Investment and Corporate Banking, CIBC World Markets Inc. 1997–2004. Head, Global Mining Group, CIBC World Markets Inc. 1989–2004.(1)
Robert J. Wright, 74Trinity College, Univ. of Toronto (B.A.)Osgoode Hall Law School (LL.B.)
Lead Director of the Board since 2000. Chairman of the Board of Teck Corporation 1994–2000. Member of the Board of Cominco 1994–2001. Chairman of the Ontario Securities Commission 1989–1993. Partner with Lang Michener 1964–1989. Chairman and Member of the Executive Committee, Mutual Fund Dealers Association. Director and Member of the Executive Committee, AARC Foundation. Chairman, Armtec Infrastructure Income Fund and a Director of Pathways to Education Canada. Appointed a Member of the Order of Canada, April 1997. (1), (2), (3), (5)
Norman B. Keevil, 69Univ. of Toronto (B.A. Sc.)Univ. of California, Berkeley (Ph.D.)Univ. of British Columbia (Honorary LL.D.)
Currently Chairman of the Board of Teck Cominco. President and CEO of Teck Corporation 1981–2001. Executive Vice President of Teck Corporation from 1968. Lifetime Director of the Mining Association of Canada. Inducted into the Canadian Mining Hall of Fame in January 2004.(1)
Teck Cominco Limited
114
Directors
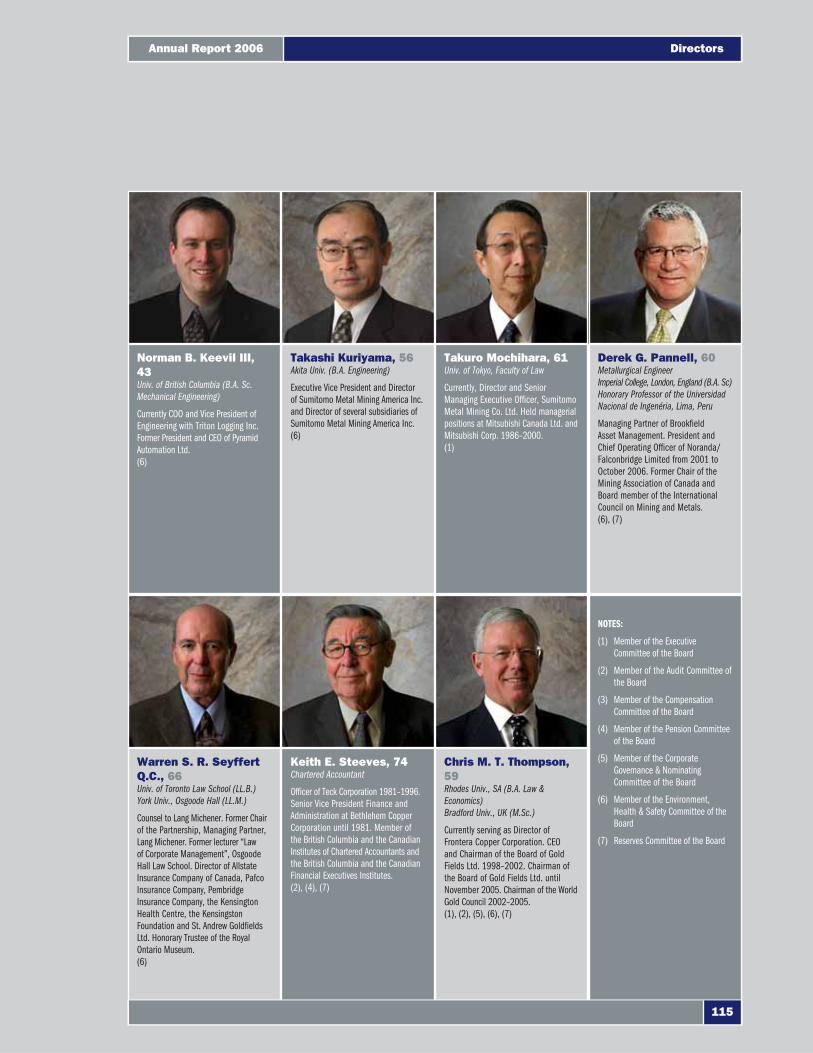
Warren S. R. Seyffert Q.C., 66Univ. of Toronto Law School (LL.B.)York Univ., Osgoode Hall (LL.M.)
Counsel to Lang Michener. Former Chair of the Partnership, Managing Partner, Lang Michener. Former lecturer “Law of Corporate Management”, Osgoode Hall Law School. Director of Allstate Insurance Company of Canada, Pafco Insurance Company, Pembridge Insurance Company, the Kensington Health Centre, the Kensingston Foundation and St. Andrew Goldfi elds Ltd. Honorary Trustee of the Royal Ontario Museum.(6)
Keith E. Steeves, 74Chartered Accountant
Offi cer of Teck Corporation 1981–1996. Senior Vice President Finance and Administration at Bethlehem Copper Corporation until 1981. Member of the British Columbia and the Canadian Institutes of Chartered Accountants and the British Columbia and the Canadian Financial Executives Institutes. (2), (4), (7)
Chris M. T. Thompson, 59Rhodes Univ., SA (B.A. Law & Economics)Bradford Univ., UK (M.Sc.)
Currently serving as Director of Frontera Copper Corporation. CEO and Chairman of the Board of Gold Fields Ltd. 1998–2002. Chairman of the Board of Gold Fields Ltd. until November 2005. Chairman of the World Gold Council 2002–2005.(1), (2), (5), (6), (7)
NOTES:
(1) Member of the Executive Committee of the Board
(2) Member of the Audit Committee of the Board
(3) Member of the Compensation Committee of the Board
(4) Member of the Pension Committee of the Board
(5) Member of the Corporate Governance & Nominating Committee of the Board
(6) Member of the Environment, Health & Safety Committee of the Board
(7) Reserves Committee of the Board
Takashi Kuriyama, 56Akita Univ. (B.A. Engineering)
Executive Vice President and Director of Sumitomo Metal Mining America Inc. and Director of several subsidiaries of Sumitomo Metal Mining America Inc.(6)
Norman B. Keevil III, 43Univ. of British Columbia (B.A. Sc. Mechanical Engineering)
Currently COO and Vice President of Engineering with Triton Logging Inc. Former President and CEO of Pyramid Automation Ltd. (6)
Takuro Mochihara, 61Univ. of Tokyo, Faculty of Law
Currently, Director and Senior Managing Executive Offi cer, Sumitomo Metal Mining Co. Ltd. Held managerial positions at Mitsubishi Canada Ltd. and Mitsubishi Corp. 1986–2000.(1)
Derek G. Pannell, 60Metallurgical EngineerImperial College, London, England (B.A. Sc)Honorary Professor of the Universidad Nacional de Ingenéria, Lima, Peru
Managing Partner of Brookfi eld Asset Management. President and Chief Operating Offi cer of Noranda/Falconbridge Limited from 2001 to October 2006. Former Chair of the Mining Association of Canada and Board member of the International Council on Mining and Metals.(6), (7)
Annual Report 2006
115
Directors
Offi cers
Fred S. DaleyVice President, Exploration
Michel P. FilionVice President, Environment, Health and Safety
Gary M. JonesVice President, Business Development
Robert G. ScottVice President, North American Mining
Andrew A. StonkusVice President, Concentrate Marketing
John F. H. ThompsonVice President, Technology
James A. UtleyVice President, Human Resources
Gregory A. WallerVice President, Investor Relations and Strategic Analysis
Karen L. DunfeeCorporate Secretary
Howard C. ChuController
Lawrence A. MackwoodTreasurer
Anthony A. ZoobkoffSenior Counsel and Assistant Secretary
Norman B. KeevilChairman
Robert J. WrightLead Director
Donald R. LindsayPresident and Chief Executive Offi cer
Peter KukielskiExecutive Vice President and Chief Operating Offi cer
Douglas H. HorswillSenior Vice President, Environment and Corporate Affairs
G. Leonard ManuelSenior Vice President and General Counsel
Ronald A. MillosSenior Vice President, Finance and Chief Financial Offi cer
Peter C. RozeeSenior Vice President, Commercial Affairs
Ronald J. VanceSenior Vice President, Corporate Development
Michael E. AggVice President, Refi ning and Metal Sales
Michael J. AllanVice President, Engineering
Dale E. AndresVice President, International Mining
Teck Cominco Limited
116
Offi cers
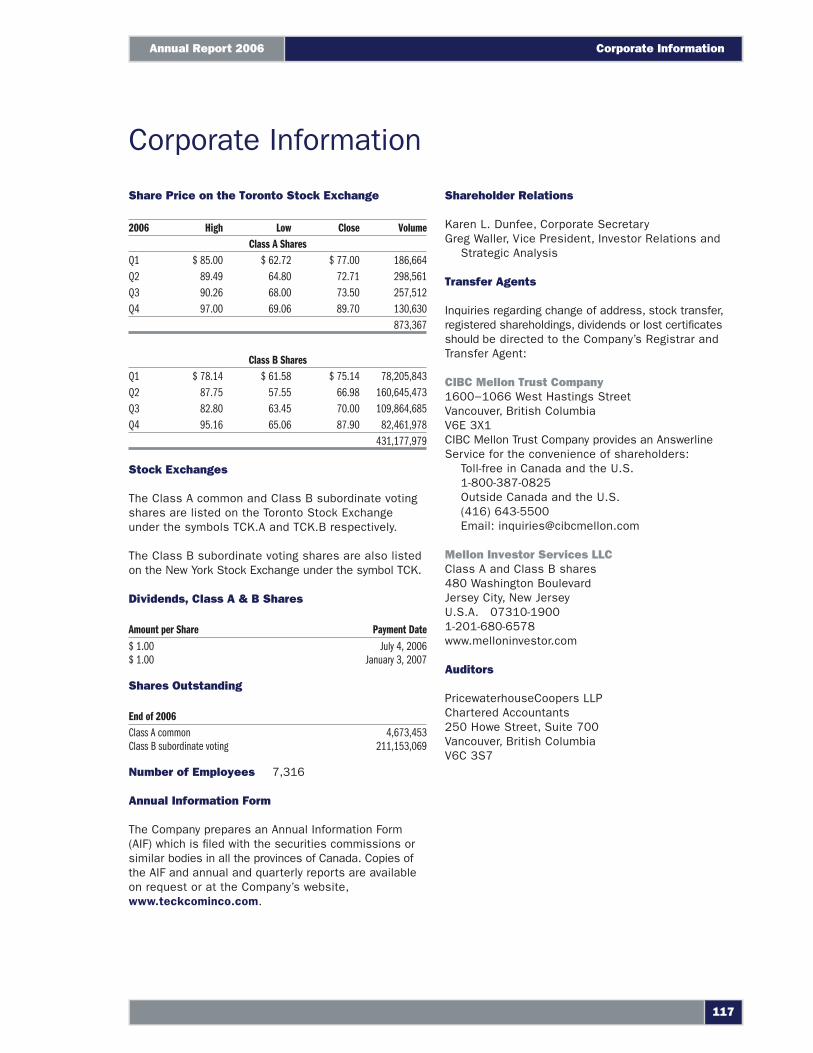
Corporate Information
Share Price on the Toronto Stock Exchange
2006 High Low Close VolumeClass A Shares
Q1 $ 85.00 $ 62.72 $ 77.00 186,664Q2 89.49 64.80 72.71 298,561Q3 90.26 68.00 73.50 257,512Q4 97.00 69.06 89.70 130,630
873,367
Class B SharesQ1 $ 78.14 $ 61.58 $ 75.14 78,205,843Q2 87.75 57.55 66.98 160,645,473Q3 82.80 63.45 70.00 109,864,685Q4 95.16 65.06 87.90 82,461,978
431,177,979
Stock Exchanges
The Class A common and Class B subordinate votingshares are listed on the Toronto Stock Exchangeunder the symbols TCK.A and TCK.B respectively.
The Class B subordinate voting shares are also listedon the New York Stock Exchange under the symbol TCK.
Dividends, Class A & B Shares
Amount per Share Payment Date$ 1.00 July 4, 2006$ 1.00 January 3, 2007
Shares Outstanding
End of 2006Class A common 4,673,453Class B subordinate voting 211,153,069
Number of Employees 7,316
Annual Information Form
The Company prepares an Annual Information Form(AIF) which is fi led with the securities commissions orsimilar bodies in all the provinces of Canada. Copies ofthe AIF and annual and quarterly reports are availableon request or at the Company’s website,www.teckcominco.com.
Shareholder Relations
Karen L. Dunfee, Corporate SecretaryGreg Waller, Vice President, Investor Relations and Strategic Analysis
Transfer Agents
Inquiries regarding change of address, stock transfer,registered shareholdings, dividends or lost certifi catesshould be directed to the Company’s Registrar andTransfer Agent:
CIBC Mellon Trust Company1600−1066 West Hastings StreetVancouver, British ColumbiaV6E 3X1CIBC Mellon Trust Company provides an AnswerlineService for the convenience of shareholders:
Toll-free in Canada and the U.S.1-800-387-0825Outside Canada and the U.S.(416) 643-5500Email: [email protected]
Mellon Investor Services LLCClass A and Class B shares480 Washington BoulevardJersey City, New JerseyU.S.A. 07310-19001-201-680-6578www.melloninvestor.com
Auditors
PricewaterhouseCoopers LLPChartered Accountants250 Howe Street, Suite 700Vancouver, British ColumbiaV6C 3S7
Corporate Information
117
Annual Report 2006
Teck Cominco Limited
600 − 200 Burrard StreetVancouver, BCCanada V6C 3L9
T: 604.687.1117F: 604.687.6100
www.teckcominco.com
Community
Environment
Achievement
Sustainability
Stewardship
Collaboration
Technology
Diversification
This is
The editorial section of this annual report is printed on FSC certified paper. By choosing FSC certified paper, Teck Cominco is supporting the growth of responsible forest management.
Designed by: RedRocketCreative.com / Printed in Canada