technology readiness of school teachers: an empirical ...€¦ · technology readiness of school...
TRANSCRIPT
Journal of Information Technology Education: Research Volume 13, 2014 Cite as: Badri, M., Al Rashedi, A., Yang, G., Mohaidat, J., & Al Hammadi, A. (2014). Technology readiness of school teachers: An empirical study of measurement and segmentation. Journal of Information Technology Education: Re-search, 13, 257-275. Retrieved from http://www.jite.org/documents/Vol13/JITEv13ResearchP257-275Badri0616.pdf
Editor: Keith Willoughby Submitted: March 10, 2014; Revised: November 19, 2014; Accepted: December 6, 2014
Technology Readiness of School Teachers: An Empirical Study of Measurement
and Segmentation Masood Badri, Asma Al Rashedi, Guang Yang,
Jihad Mohaidat, and Arif Al Hammadi Abu Dhabi Education Council, Abu Dhabi, United Arab Emirates
[email protected] [email protected] [email protected] [email protected]
Abstract The Technology Readiness Index (TRI) developed by Parasuraman (2000) was adapted to meas-ure the technology readiness of public school teachers in Abu Dhabi, United Arab Emirates. The study aims at better understanding the factors (mostly demographics) that affect such readiness levels. In addition, Abu Dhabi teachers are segmented into five main groups, with the highest percentage being “laggards” and “explorers”. The findings of this study suggest that the TRI could also be considered a cross-culturally valid measurement scale for Abu Dhabi teachers. The study sample consisted of 796 teachers in 105 different public schools. The teachers’ overall mean technology-readiness level was 3.5767. With regard to TRI self-perception, there are no significant differences among teachers across subject areas and the grade levels they teach. There are significant differences with regard to the teachers’ gender, backgrounds (nationality), and the number of students a teacher is responsible for. Other variables, such as teachers’ ages, experi-ence, education, and work location, had partial effects.
Keywords: Technology Readiness Index, TRI, technology integration, teachers, public schools, teacher segmentation, Abu Dhabi.
Introduction Most educators define the integration of information and communication technology (ICT) into education as using ICT effectively and efficiently in all dimensions of the educational process, including the necessary infrastructure, curriculum and teaching-learning environments (Earle, 2002; Wozney, Venkatesh, & Abrami, 2006; Yildirim, 2007). Many studies have addressed the
challenges that exist when integrating technologies into education. Summak, Baglibel, and Samancioglu (2010) have summarized a list of such challenges. Among the challenges are factors related to lack of computers, lack of time, tech-nical difficulties, resistance to change, poor administrative support, low levels of computer literacy, technology misa-ligned with the curriculum, lack of in-centives, poor training opportunities,
Material published as part of this publication, either on-line or in print, is copyrighted by the Informing Science Institute. Permission to make digital or paper copy of part or all of these works for personal or classroom use is granted without fee provided that the copies are not made or distributed for profit or commercial advantage AND that copies 1) bear this notice in full and 2) give the full citation on the first page. It is per-missible to abstract these works so long as credit is given. To copy in all other cases or to republish or to post on a server or to redistribute to lists requires specific permission and payment of a fee. Contact [email protected] to request redistribution permission.
Technology Readiness of School Teachers
258
lack of vision as to how to integrate technology into learning processes, and teacher-related diffi-culties such as negative attitudes and beliefs towards technology, and unwillingness to engage with technology. Other studies have confirmed these difficulties (Anderson, Varnhagen, & Campbell, 1998; Bariso, 2003; Beggs, 2000; Pelgrum, 2001; Snoeyink & Ertmer, 2002).
Many believe that the success of technology integration and the effective use of technology in education mostly depend on teachers’ willingness to adopt and attitudes toward technology (Ca-vas, Cavas, Karaoglan, & Kalsa, 2009; Christiensen, 2002; Hew & Brush, 2007; Jacobsen, Clifford, & Frieson, 2002). Yalcin, Kahraman, and Yilmaz (2011) point out that teachers’ peda-gogical beliefs are an important variable that influences teachers’ use of technology in the class-room. Also teachers’ attitudes and beliefs toward technology are of great importance in their de-cisions to adopt and frequently use technology in the classroom (Becker, 1994). Badri, Elmourad, and Ferrandino (2013) point out that the perceived self-efficacy of teachers plays an important role in many aspects related to the school environment. The efficacy of teachers with regard to technology use and integration in the classroom will enhance the effectiveness and self-belief of teachers in their teaching capabilities (Albion, 2001, Eyyam, Menevis, & Dogruer, 2010; Russell, Bebell, O’Dwyer, & O’Connor, 2003,). In addition, teachers who have negative attitudes towards technology are not expected to fully benefit from this field or to insert technology efficiently into the education-teaching environment (Gulbahar & Guven, 2008).
Parasuraman (2000) developed the Technology Readiness Index (TRI) to measure consumers’ enduring propensities to embrace new technologies. He introduces four dimensions of technology belief that impact an individual’s level of techno-readiness. The four dimensions are optimism, innovativeness, discomfort, and insecurity. Both the optimism and innovativeness dimensions are referred to as being drivers of technology readiness, whereas discomfort and insecurity are re-ferred to as inhibitors. The construct can be viewed as an overall state of mind resulting from a gestalt of mental enablers and inhibitors that collectively determine a person’s tendency to use new technologies (Colby & Albert, 2003).
For teachers in a school, we may refer to “optimism” as a teacher who has a positive view of technology and a belief that it offers students and teachers increased control, flexibility, and effi-ciency in their lives in the school and at home; to “innovativeness” as a tendency to be a technol-ogy pioneer and thought teacher and leader both inside and outside of the classroom; to “discom-fort” as a perceived lack of control over technology and a feeling of being overwhelmed by it; and to “insecurity” as a distrust of technology and skepticism about its ability to work properly inside and outside of the classroom.
Further, people can be segmented into distinct groups based on their patterns of scores on the four dimensions. Based on cluster analyses of TR scores on the four dimensions, Parasuraman and Colby (2001) have identified five distinct customer segments, which they label as explorers (who are the lead users most prone to adopt and experiment with new technologies), pioneers, and, in decreasing order of adoption propensity, skeptics, paranoids, and laggards.
In Abu Dhabi, the reform agenda that started in 2008 has focused many strategic initiatives on educational technology. Some objectives of the education system in the New School Model (NSM) indicate strengthening ICT infrastructure in schools and developing methods for support-ing the use of ICT in classrooms, with optimum integration in the various curriculums starting from Cycle I, grades 1 to 6, as Phase I. The Abu Dhabi Education Council (ADEC) has financed many projects to achieve technology integration in educational settings in Abu Dhabi. These ini-tiatives included the upgrading of infrastructure in all public schools in Abu Dhabi, the start of the I-Class project, and the integration of technology in the curriculum.
For the ADEC effectively segmenting and targeting teachers based on the likelihood of their inte-grating technology in their classes could help it better capitalize on their ICT investments in the
Badri, Al Rashedi, Yang, Mohaidat, & Al Hammadi
259
schools by maximizing the effectiveness of teacher professional development programs. The re-sults could help the ADEC decision makers design the best means of integrating technology into teacher preparation and preparing teachers to do the same in their classrooms. In addition, it helps in the efficient and effective utilization of school resources.
This study explores the technological readiness of teachers. It has several major objectives:
• To test the validity of the TRI introduced by Parasuraman (2000) and explore the possi-bility of using a modified version of the TRI to find out the technology-readiness level of Abu Dhabi public school teachers.
• To further classify technology users (teachers) into five technology readiness segments, namely, explorers, pioneers, skeptics, paranoids, and laggards.
• To identify the relationship between teachers’ technology-readiness levels and their de-mographic variables such as gender, age, nationality, education, years of teaching experi-ence, marital status, grade or cycle taught, number of students taught, school location, subject taught, specialization, and technology self-rating.
Literature Review Studies of Parasuraman’s (2000) technology-readiness concept are widespread. The areas of ap-plication mostly include the business marketing domain, where research focuses on identifying the segments of the market that are likely to adopt new technologies such as mobile data services (Massey, Khatri, & Montoya-Weiss,, 2007). Other areas of application include consumer market-ing (Meng, Elliott, & Hall, 2010); internet acceptance models (Lim & Dubinsky, 2004); account-ing-related consumers (Lai, 2008); human resources (Walczuch, Lemmink, & Streukens, 2007); distance education (Andaleeb, Idrus, Ismail, & Mokaram, 2010); healthcare (Caison, Bulman, Pai, & Neville, 2008); construction (Jaafar, Ramayah, Abdul-Aziz, & Saad, 2007); the hotel in-dustry (Victorino, Karniouchina, & Verma, 2009); small businesses (Ramayah, Jantan, Roslin, & Siron, 2003); banks (Berndt, Saunders, & Petzer, 2010); and online insurance (Taylor, Celuch, & Goodwin, 2002). In most of the studies, the authors found the technology-readiness model to be effective for studying respondents’ propensity to adopt new technologies. Many have called for further validation and extension of the TRI to increase its generalizability (Andaleeb et al., 2010; Elliot, Hall, & Meng, 2008; Lin & Hsieh, 2012; Parasuraman, 2000; Tsikriktsis, 2004; Venkatesh & Morris, 2000; Verhoef et al., 2009).
Based on an individual’s technology-readiness score and the TRI, Parasuraman and Colby (2001) used cluster analysis to further classify technology users (customers) into five technology-readiness segments, namely, explorers, pioneers, skeptics, paranoids, and laggards. They stated that “explorers” are highly optimistic and innovative individuals who score highly in technology readiness; “pioneers” are relatively early adopters of new technology, but they are simultaneously held back by inherent discomfort and insecurity; “skeptics” are fairly techno-ready, but they have low motivation and need to be convinced of the benefits of using the emerging technology; “par-anoids” are more insecure and are later adopters of new technology; and “laggards” are the re-sistant individuals who are likely to be the last adopters of new technology (Lai, 2008; Parasura-man & Colby, 2001).
Some studies examined the relationships between technology readiness and technology ac-ceptance by using an aggregated measure of the four TR constructs (Liljander, Gillberg, Gummerus, & Van Riel, 2006; Parasuraman, 2000; Parasuraman & Colby, 2001). As pointed out by some researchers, these approaches may have limited value because the four dimensions clear-ly have different meanings and relate to different psychological processes underlying technology acceptance (Lam, Chiang, & Parasuraman, 2008; Son & Han, 2011).
Technology Readiness of School Teachers
260
Lee, Chiu, Chiang, and Chiu (2009) used the TR Index to serve as an insight into a person’s own motivations and inhibitions regarding the adoption of technology. The TRI is calculated by sub-tracting the discomfort and insecurity item-scores from the optimism and innovativeness item-scores. For the current study we are using a total of 35 items, where 16 items are considered con-tributors and 17 are considered inhibitors.
Many TRI studies have attempted to test the effect of other demographic or related variables on the dimensions of this instrument. Research on technology acceptance suggests that an individu-al’s personality, as well as demographics, may affect the acceptance (Lam et al. 2008; Meuter, Ostrom, Bitner, & Roundtree, 2003; Parasuraman, 2000; Son & Han, 2011). In the education con-text, the TR relates to how prepared teachers are for a new technology or integration of technolo-gy to be used in the classroom.
A significant effect was observed among respondents regarding gender and the various dimen-sions of TRI or overall TRI. In most cases and applications, male teachers reported a significantly higher mean score than female teachers (Caison et al., 2008, for healthcare students; Summak et al., 2010, for primary school teachers).
With regard to age, some studies found significant differences between younger and older re-spondents. Summak et al. (2010) found no significant differences in terms of technology readi-ness across age of the teachers. Lee et al. (2009) also found no significant differences when ap-plied to electronic business. Parasuraman and Colby (2001) have found skepticism about technol-ogy to be higher among older users of technology who feel utilizing new technology to accom-plish tasks does not necessarily yield a better outcome. Caison et al. (2008) found TR scores to go lower as age increases. They found nursing students in Canada over 25 years of age to have a negative technology-readiness score while those under 25 had a positive technology-readiness score.
Ramayah et al. (2003) found no significant differences when applied in the small-business envi-ronment. Colby and Albert (2003) found a higher proportion of pioneers among African Ameri-cans, while Latinos had the highest percentage of skeptics. Interestingly though, the overall level of technology readiness was equal for all three groups – African Americans, Latinos, and White Americans.
With regard to the level of education attained, studies in small-business management found that managers with a master’s-level education tend to experience less insecurity compared to manag-ers with a lower level of education. The overall TRI score shows that managers with a degree-level education have a higher technology readiness compared to managers without a degree (Ra-mayah et al., 2003).
Summak et al. (2010) found no significant differences in terms of technology readiness across the subject area of the teachers.
Our extensive search of the literature found no evidence of any research exploring the effect of self-assessment, work location, number of students, or marital status on teachers’ technology readiness.
TRI applications to education systems, particularly involving teachers, have been limited. Sum-mak et al. (2010) used the TRI to assess the technology readiness of primary school teachers in Gaziantep, Turkey. They also examined the demographics of the teachers to determine the effect of demographics on the technology-readiness level. The TRI developed by Parasuraman was adapted to measure the technology readiness of the teachers. The sample of the study was 207 teachers in 11 different schools. The teachers’ overall technology-readiness level was moderate. Based on the technology readiness index, Lai (2008) found that professional accounting students were neither highly techno-ready nor highly techno-resistant towards new technologies. Overall,
Badri, Al Rashedi, Yang, Mohaidat, & Al Hammadi
261
the survey found that the respondents had a moderate level of internet self-efficacy and compu-ting experience.
In summary, scholarly research focusing on the technology readiness of teachers is scarce. More-over, extensive studies focusing on the factors that affect the TR of teachers are limited too. Therefore this study is important as it provides more insights by presenting an international un-derstanding of the technology readiness of teachers and creating a general awareness of the sub-ject. It tests the applicability of the TRI for public school teachers in Abu Dhabi. The study utiliz-es the specification of the four diminutions of TRI to construct profile segmentation of teachers. The study further explores the relationship between teachers’ technology-readiness levels and their demographic variables.
Methods
Study Sample The target population for this study was Abu Dhabi public school teachers during the school year 2011–2012. A simple random sampling was used. All public school teachers were invited to par-ticipate in an online survey that was posted on the ADEC website for three weeks. The survey was available in both Arabic and English versions. All teachers in the ADEC are registered in the ERP (Enterprise Resource System). Teachers were contacted with emails and short mobile mes-sages (SMS). In addition, school principals were sent a letter from the ADEC Director General asking them to encourage their teachers to participate. The sample also included participants with other responsibilities besides teaching, such as cluster managers and heads of faculty.
A total of 796 teachers responded to the survey. However, 109 teachers did not respond to all questions; as a result, their responses were not included in further analysis. Male teachers made up 42.1 percent of the sample, and female teachers 57.9 percent. The average age of respondents was 37.6 years old. Teachers with college degrees were 78.2 percent of the sample, while 16.5 percent of them had master’s degrees. The rest had pre-college diplomas (2.9%) or doctorate de-grees (2.4%). The teachers came from ten different nationalities. UAE teachers comprised 43.7 percent, 38.1 percent were other Arab nationals, and 11.9 percent were Westerners. The length of the teachers’ teaching experience ranged from one to 40 years, with a mean of 15.08 years. Of the teachers, 84.4 percent were married. The teachers came from kindergarten (KG – 15.49%), Cycle I (32.9%), Cycle II (35.2%), and Cycle III (16.4%). The teachers represented all three education zones in Abu Dhabi: Al Ain zone teachers (34.2%); Abu Dhabi zone teachers (51%); and Gharbia zone teachers (14.7%). The teachers taught a range of 20 subjects.
Study Instrument The 36-item TRI (Parasuraman, 2000) was used in this study with the written permission of A. Parasuraman and Rockbridge Associates, Inc., 1999. The TRI was adapted into an Arabic-language translation. Reverse translation was used to check for similarity and consistency. The discomfort and insecurity components’ scores were reverse coded due to the negative meaning of their statements. The items on both dimensions are positively worded in favor of the human ele-ment and away from the technology factor.
The Cronbach reliability alphas for the four dimensions (36 items) were 0.812 for optimism statements, 0.559 for innovative statements, 0.703 for insecure statements, and 0.720 for discom-fort statements. It is obvious that the coefficient for innovative statement is below the acceptable level. However, when one item, “It seems your friends are learning more about the newest tech-nologies than you” is removed from that dimension, the reliability jumps to 0.764. As a result, a
Technology Readiness of School Teachers
262
modified version is used with 35 items only. The split half reliability for the 36 items was 0.802, and for the 35 items was 0.805.
Respondents were asked to rate their degree of agreement on a 5-point Likert scale for each item (i.e., 1 = strongly disagree, to 5 = strongly agree) and complete 12 demographic questions.
Analysis Methods The TRI (Technology Readiness Index) identifies four dimensions of technology belief that im-pact a teacher’s level of techno-readiness (optimism, innovativeness, discomfort, and insecurity). The current study used a 35-item version with one item being removed from the second dimen-sion. After appropriate reverse coding, a factor analysis was run with regard to each dimension separately to test if the dimension would split into more than one unique dimension. Descriptive statistics (means and standard deviations) were obtained for all items and dimensions in the sur-vey.
In this study the segmentation suggested by Parasuraman and Colby (2001) and Lee et al. (2009) was used to find out the percentage of respondents falling within each of the five segments. Clus-ter analysis was used for that purpose.
An independent-samples t-test was conducted to compare the levels of technology readiness of teachers in terms of gender and marital status. To test differences between groups (in terms of age, education level, nationality, subjects taught, years of teaching experience, teaching cycle, work location, and TRI self rating), the analysis of variance (ANOVA) test was used.
As Parasuraman (2000) considered optimism and innovation to be contributors to technology readiness while discomfort and insecurity were inhibitors, it was possible to determine a total technology-readiness score by designating the inhibitors as having negative values and the con-tributors as having positive values (Caison et al., 2008). For the original TRI instrument without the reversing of items, by subtracting the inhibitors from the contributors, a mean total technolo-gy-readiness (TR) score could be calculated. A positive TRI reflected a preponderance of teach-ers’ attitudes and opinions suggestive of a ‘‘technology-ready’’ orientation, while a negative mean TRI suggested a ‘‘non-technology-ready’’ orientation. This method was used to assign teachers as “technology ready” or “non-technology ready”.
Simply speaking, k-means clustering is an algorithm to classify or group objects (teachers in this case) based on attributes or features into k number of groups. The k is a positive integer number. The grouping is done by minimizing the sum of squares of distances between data and the corre-sponding cluster centroid. Thus, for the current study, the purpose of k-means clustering is to classify the data. Cluster analysis was used to sort the responding teachers into the categories of explorers, pioneers, skeptics, paranoids, and laggards, as suggested by Parasuraman and Colby (2001). The groups were also categorized with regard to the four dimensions of TRI.
After obtaining the results of the study, several focus-group discussions were held with teachers of different backgrounds. In particular, and upon reviewing the results, the focus group had dis-cussions with regard to many outcomes. The discussions focused on two main points: 1) future professional development needed, and 2) the impact of TRI segmentations in relation to the cur-riculum development efforts in the ADEC. However, the discussion agenda also covered other issues. They included the mechanism for integrating technology into teaching, and the effect of some demographic variables on TRI. The teachers’ comments were added to the discussion sec-tion as appropriate.
Badri, Al Rashedi, Yang, Mohaidat, & Al Hammadi
263
Results Each hypothesized dimension was subject to a factor analysis to check if the dimension would form one dimension only. Factor analysis (FA) of optimism with a Varimax rotation yielded a unique factor with 62.33 percent of the variance explained. FA for innovativeness also yielded a unique factor with 60.41 percent of the variance explained. Meanwhile, FA for the discomfort dimension yielded a single factor with 59.59 percent of the variance explained. However, FA for the insecurity dimension yielded three different factors with 54.77 percent of the variance ex-plained. This result indicated that future analysis might require splitting the dimension into three factors. However, it was decided to depend on the confirmatory factor analysis (CFA) result of the four-dimension model (without splitting the insecurity dimension) to make the final decision on whether to split the dimension or not.
Next, confirmatory factor analysis was conducted to further test the factor structure of the modi-fied TRI (TRI with one element missing from innovativeness). However, to get an acceptable CFA model, it was necessary to add a total of 12 correlated error covariance paths between the variables. The LISREL 8.83 solution provides an adequate fit with Chi-square of 1381.86, with 569 degrees of freedom, RMSEA of 0.04, GFI of 0.95, and NFI of 0.94. As a result of the CFA, it was decided to do the t-test and ANOVA tests without splitting any TRI dimensions.
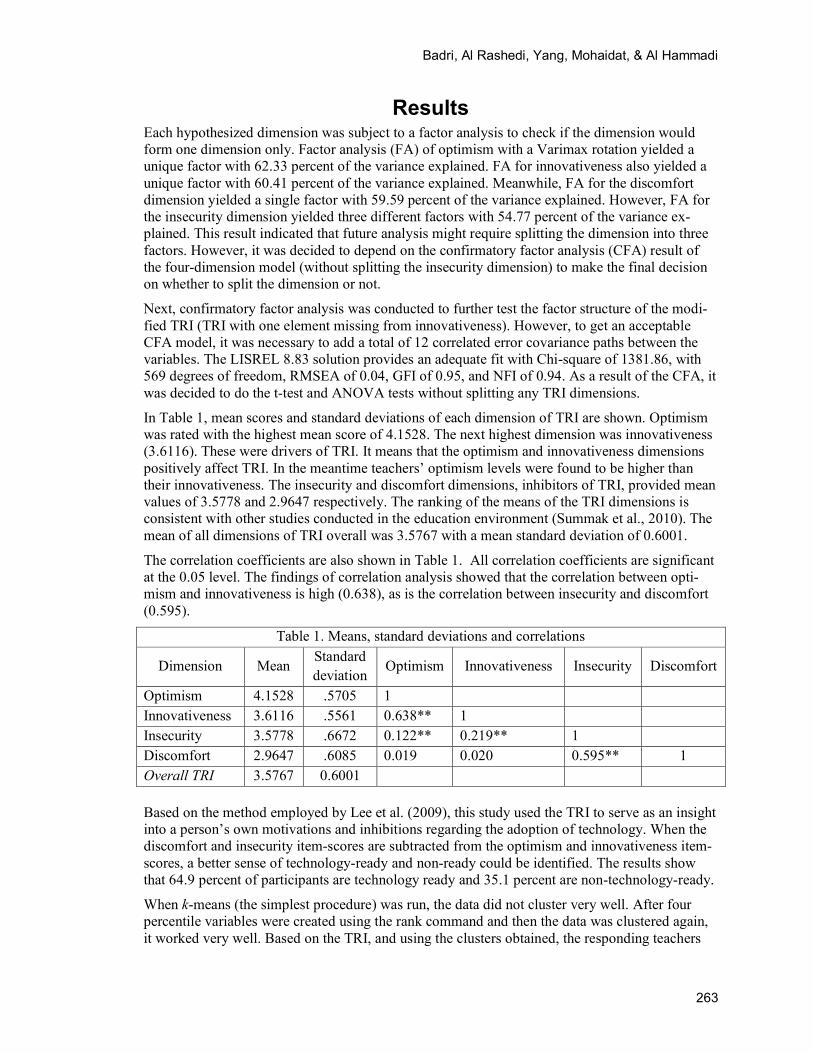
In Table 1, mean scores and standard deviations of each dimension of TRI are shown. Optimism was rated with the highest mean score of 4.1528. The next highest dimension was innovativeness (3.6116). These were drivers of TRI. It means that the optimism and innovativeness dimensions positively affect TRI. In the meantime teachers’ optimism levels were found to be higher than their innovativeness. The insecurity and discomfort dimensions, inhibitors of TRI, provided mean values of 3.5778 and 2.9647 respectively. The ranking of the means of the TRI dimensions is consistent with other studies conducted in the education environment (Summak et al., 2010). The mean of all dimensions of TRI overall was 3.5767 with a mean standard deviation of 0.6001.
The correlation coefficients are also shown in Table 1. All correlation coefficients are significant at the 0.05 level. The findings of correlation analysis showed that the correlation between opti-mism and innovativeness is high (0.638), as is the correlation between insecurity and discomfort (0.595).
Table 1. Means, standard deviations and correlations
Dimension Mean Standard deviation Optimism Innovativeness Insecurity Discomfort
Optimism 4.1528 .5705 1 Innovativeness 3.6116 .5561 0.638** 1 Insecurity 3.5778 .6672 0.122** 0.219** 1 Discomfort 2.9647 .6085 0.019 0.020 0.595** 1 Overall TRI 3.5767 0.6001 Based on the method employed by Lee et al. (2009), this study used the TRI to serve as an insight into a person’s own motivations and inhibitions regarding the adoption of technology. When the discomfort and insecurity item-scores are subtracted from the optimism and innovativeness item-scores, a better sense of technology-ready and non-ready could be identified. The results show that 64.9 percent of participants are technology ready and 35.1 percent are non-technology-ready.
When k-means (the simplest procedure) was run, the data did not cluster very well. After four percentile variables were created using the rank command and then the data was clustered again, it worked very well. Based on the TRI, and using the clusters obtained, the responding teachers
Technology Readiness of School Teachers
264
were categorized into five different segments, namely explorers, pioneers, skeptics, paranoids, and laggards. Among Abu Dhabi teachers, explorers make up 21.48 percent of the sample. They are the most techno-ready of all the segments, and this group is strongly motivated to adopt tech-nology, with few inhibitions. Explorers are more affluent, younger, and more likely to be male. Parasuraman and Colby (2001) asserted that explorers are an easy group to attract when a new technology is introduced, and they will comprise the first wave of customers.
Of the sample teachers, 15.45 percent fall into the pioneer category. Pioneers are highly motivat-ed to adopt technology, but at the same time they are inhibited by a high level of insecurity and discomfort. They are the most ethnically diverse of any segment. The ADEC faces the challenge of helping them overcome their inhibitions about using technology through support, encourage-ment, training, friendly design, and reassurance. Pioneers desire the benefits of the new technolo-gy in the class, but they were more practical about the difficulties and obstacles involved. Teacher pioneers need help in making the technology work for them and require some degree of assur-ance. Pioneers were usually the next group in line to try new technology.
Skeptics represent 22.49 percent of the sample. This group of teachers is not too far behind the pioneers; however, these teachers not only have little motivation to adopt technology in the class, but also few inhibitions about it. The ADEC should take advantage and convince them of the un-derlying benefits of integrating technology in teaching and learning. This group did loathe tech-nology, but once they were convinced of the benefits of the technology, they could readily adopt it because there were few reasons to hold back.
The paranoid group comprises 15.82 percent of the teacher sample. This group believes in tech-nology’s benefits, but it is constrained by a high level of insecurity and discomfort. Analysis shows that paranoids tend to be older and are more likely to be female. This group was concerned about the risks, discomfort, and insecurity of technology.
The least techno-ready segment, laggards make up 24.45 percent of the sample. They have little motivation to adopt technology and a high level of resistance to using new technologies in class. They are much older and are more likely to be female. ADEC may reach out to them by develop-ing streamlined, easy-to-use educational resources and offerings. Some suggest that the members of this group may never use new technology unless they are forced to do so.
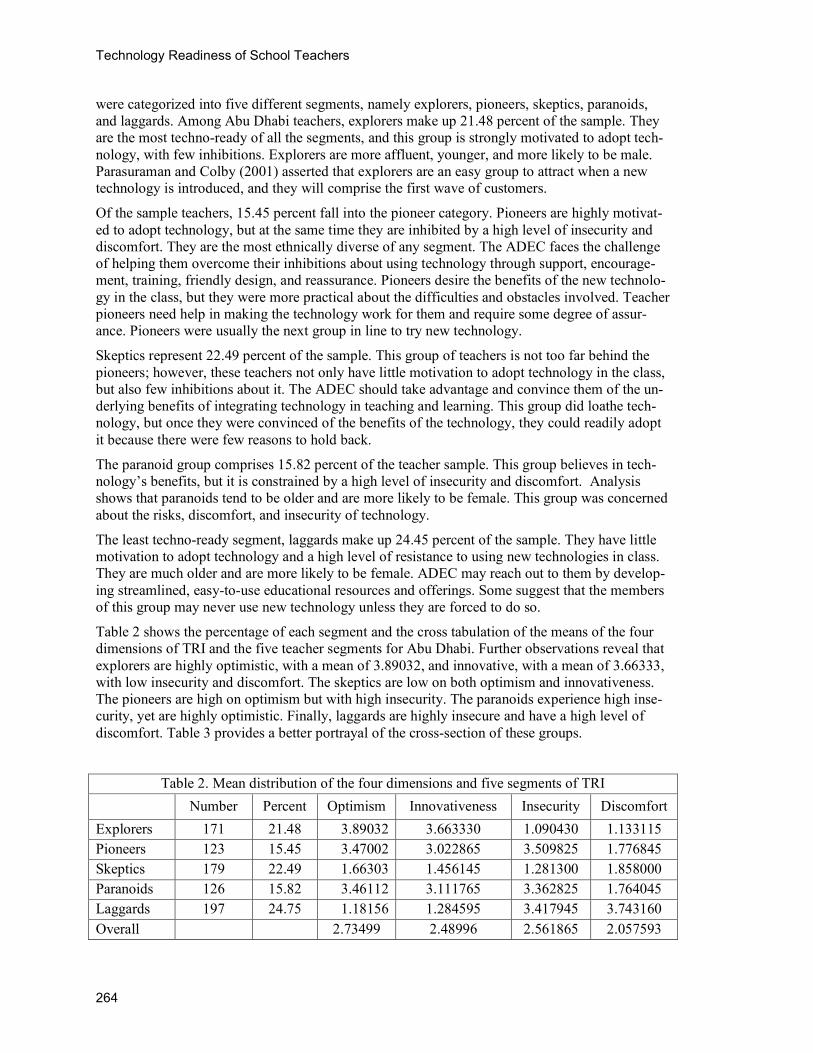
Table 2 shows the percentage of each segment and the cross tabulation of the means of the four dimensions of TRI and the five teacher segments for Abu Dhabi. Further observations reveal that explorers are highly optimistic, with a mean of 3.89032, and innovative, with a mean of 3.66333, with low insecurity and discomfort. The skeptics are low on both optimism and innovativeness. The pioneers are high on optimism but with high insecurity. The paranoids experience high inse-curity, yet are highly optimistic. Finally, laggards are highly insecure and have a high level of discomfort. Table 3 provides a better portrayal of the cross-section of these groups.
Table 2. Mean distribution of the four dimensions and five segments of TRI Number Percent Optimism Innovativeness Insecurity Discomfort Explorers 171 21.48 3.89032 3.663330 1.090430 1.133115 Pioneers 123 15.45 3.47002 3.022865 3.509825 1.776845 Skeptics 179 22.49 1.66303 1.456145 1.281300 1.858000 Paranoids 126 15.82 3.46112 3.111765 3.362825 1.764045 Laggards 197 24.75 1.18156 1.284595 3.417945 3.743160 Overall 2.73499 2.48996 2.561865 2.057593
Badri, Al Rashedi, Yang, Mohaidat, & Al Hammadi
265
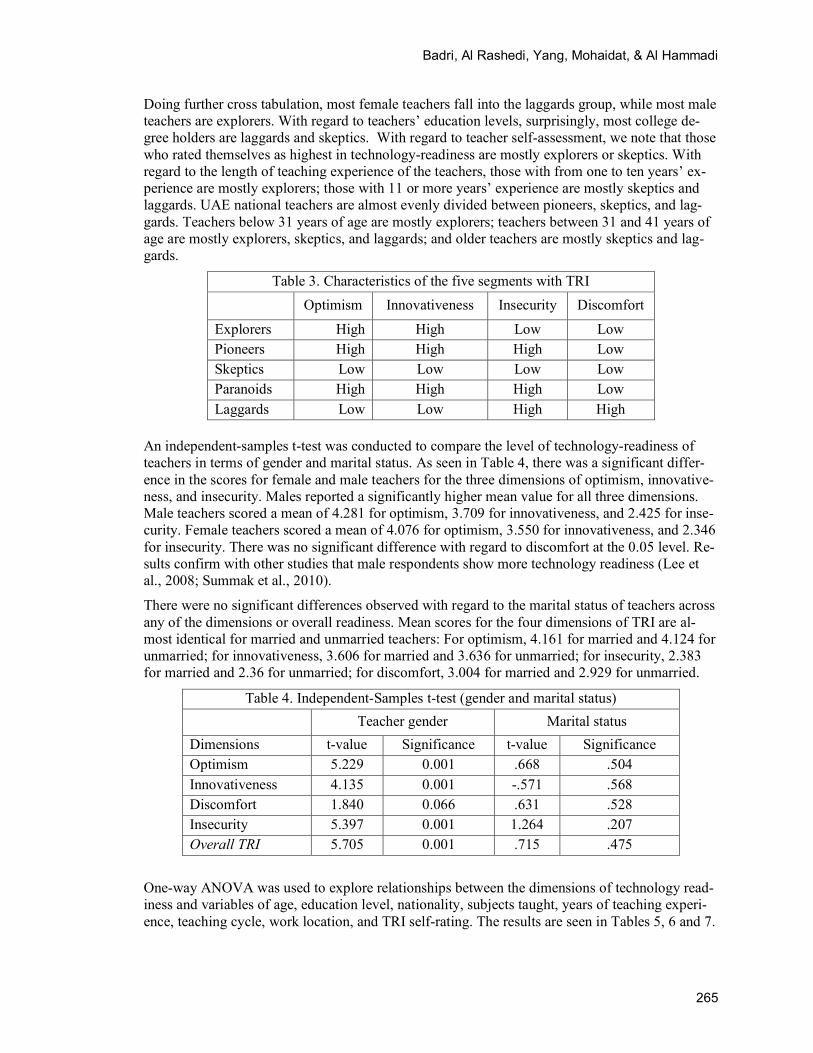
Doing further cross tabulation, most female teachers fall into the laggards group, while most male teachers are explorers. With regard to teachers’ education levels, surprisingly, most college de-gree holders are laggards and skeptics. With regard to teacher self-assessment, we note that those who rated themselves as highest in technology-readiness are mostly explorers or skeptics. With regard to the length of teaching experience of the teachers, those with from one to ten years’ ex-perience are mostly explorers; those with 11 or more years’ experience are mostly skeptics and laggards. UAE national teachers are almost evenly divided between pioneers, skeptics, and lag-gards. Teachers below 31 years of age are mostly explorers; teachers between 31 and 41 years of age are mostly explorers, skeptics, and laggards; and older teachers are mostly skeptics and lag-gards.
Table 3. Characteristics of the five segments with TRI Optimism Innovativeness Insecurity Discomfort
Explorers High High Low Low Pioneers High High High Low Skeptics Low Low Low Low Paranoids High High High Low Laggards Low Low High High
An independent-samples t-test was conducted to compare the level of technology-readiness of teachers in terms of gender and marital status. As seen in Table 4, there was a significant differ-ence in the scores for female and male teachers for the three dimensions of optimism, innovative-ness, and insecurity. Males reported a significantly higher mean value for all three dimensions. Male teachers scored a mean of 4.281 for optimism, 3.709 for innovativeness, and 2.425 for inse-curity. Female teachers scored a mean of 4.076 for optimism, 3.550 for innovativeness, and 2.346 for insecurity. There was no significant difference with regard to discomfort at the 0.05 level. Re-sults confirm with other studies that male respondents show more technology readiness (Lee et al., 2008; Summak et al., 2010).
There were no significant differences observed with regard to the marital status of teachers across any of the dimensions or overall readiness. Mean scores for the four dimensions of TRI are al-most identical for married and unmarried teachers: For optimism, 4.161 for married and 4.124 for unmarried; for innovativeness, 3.606 for married and 3.636 for unmarried; for insecurity, 2.383 for married and 2.36 for unmarried; for discomfort, 3.004 for married and 2.929 for unmarried.
Table 4. Independent-Samples t-test (gender and marital status) Teacher gender Marital status Dimensions t-value Significance t-value Significance Optimism 5.229 0.001 .668 .504 Innovativeness 4.135 0.001 -.571 .568 Discomfort 1.840 0.066 .631 .528 Insecurity 5.397 0.001 1.264 .207 Overall TRI 5.705 0.001 .715 .475
One-way ANOVA was used to explore relationships between the dimensions of technology read-iness and variables of age, education level, nationality, subjects taught, years of teaching experi-ence, teaching cycle, work location, and TRI self-rating. The results are seen in Tables 5, 6 and 7.
Technology Readiness of School Teachers
266
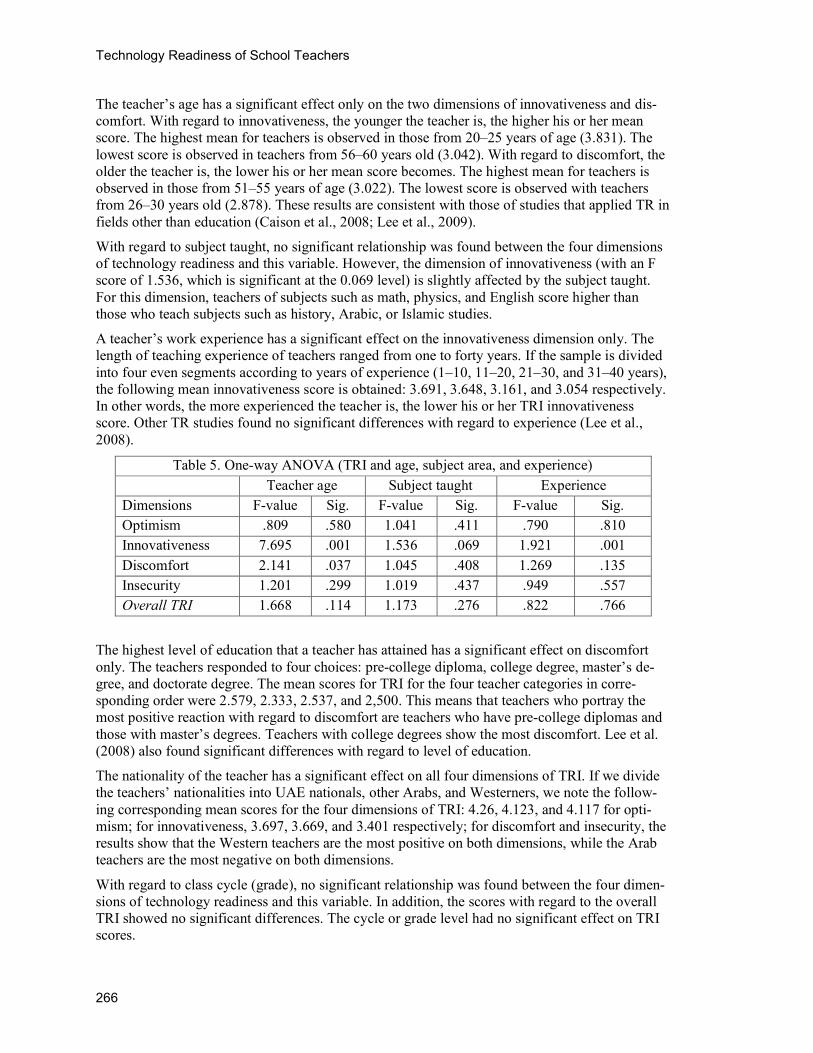
The teacher’s age has a significant effect only on the two dimensions of innovativeness and dis-comfort. With regard to innovativeness, the younger the teacher is, the higher his or her mean score. The highest mean for teachers is observed in those from 20–25 years of age (3.831). The lowest score is observed in teachers from 56–60 years old (3.042). With regard to discomfort, the older the teacher is, the lower his or her mean score becomes. The highest mean for teachers is observed in those from 51–55 years of age (3.022). The lowest score is observed with teachers from 26–30 years old (2.878). These results are consistent with those of studies that applied TR in fields other than education (Caison et al., 2008; Lee et al., 2009).
With regard to subject taught, no significant relationship was found between the four dimensions of technology readiness and this variable. However, the dimension of innovativeness (with an F score of 1.536, which is significant at the 0.069 level) is slightly affected by the subject taught. For this dimension, teachers of subjects such as math, physics, and English score higher than those who teach subjects such as history, Arabic, or Islamic studies.
A teacher’s work experience has a significant effect on the innovativeness dimension only. The length of teaching experience of teachers ranged from one to forty years. If the sample is divided into four even segments according to years of experience (1–10, 11–20, 21–30, and 31–40 years), the following mean innovativeness score is obtained: 3.691, 3.648, 3.161, and 3.054 respectively. In other words, the more experienced the teacher is, the lower his or her TRI innovativeness score. Other TR studies found no significant differences with regard to experience (Lee et al., 2008).
Table 5. One-way ANOVA (TRI and age, subject area, and experience) Teacher age Subject taught Experience Dimensions F-value Sig. F-value Sig. F-value Sig. Optimism .809 .580 1.041 .411 .790 .810 Innovativeness 7.695 .001 1.536 .069 1.921 .001 Discomfort 2.141 .037 1.045 .408 1.269 .135 Insecurity 1.201 .299 1.019 .437 .949 .557 Overall TRI 1.668 .114 1.173 .276 .822 .766
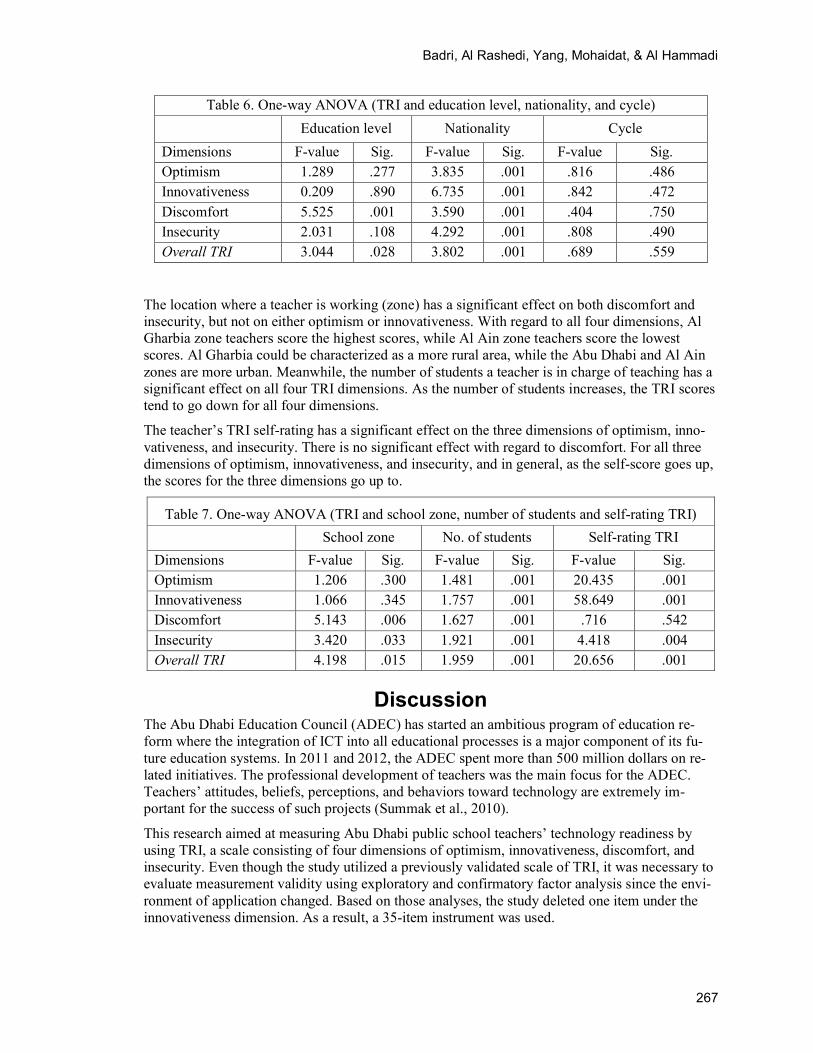
The highest level of education that a teacher has attained has a significant effect on discomfort only. The teachers responded to four choices: pre-college diploma, college degree, master’s de-gree, and doctorate degree. The mean scores for TRI for the four teacher categories in corre-sponding order were 2.579, 2.333, 2.537, and 2,500. This means that teachers who portray the most positive reaction with regard to discomfort are teachers who have pre-college diplomas and those with master’s degrees. Teachers with college degrees show the most discomfort. Lee et al. (2008) also found significant differences with regard to level of education.
The nationality of the teacher has a significant effect on all four dimensions of TRI. If we divide the teachers’ nationalities into UAE nationals, other Arabs, and Westerners, we note the follow-ing corresponding mean scores for the four dimensions of TRI: 4.26, 4.123, and 4.117 for opti-mism; for innovativeness, 3.697, 3.669, and 3.401 respectively; for discomfort and insecurity, the results show that the Western teachers are the most positive on both dimensions, while the Arab teachers are the most negative on both dimensions.
With regard to class cycle (grade), no significant relationship was found between the four dimen-sions of technology readiness and this variable. In addition, the scores with regard to the overall TRI showed no significant differences. The cycle or grade level had no significant effect on TRI scores.
Badri, Al Rashedi, Yang, Mohaidat, & Al Hammadi
267
Table 6. One-way ANOVA (TRI and education level, nationality, and cycle) Education level Nationality Cycle Dimensions F-value Sig. F-value Sig. F-value Sig. Optimism 1.289 .277 3.835 .001 .816 .486 Innovativeness 0.209 .890 6.735 .001 .842 .472 Discomfort 5.525 .001 3.590 .001 .404 .750 Insecurity 2.031 .108 4.292 .001 .808 .490 Overall TRI 3.044 .028 3.802 .001 .689 .559
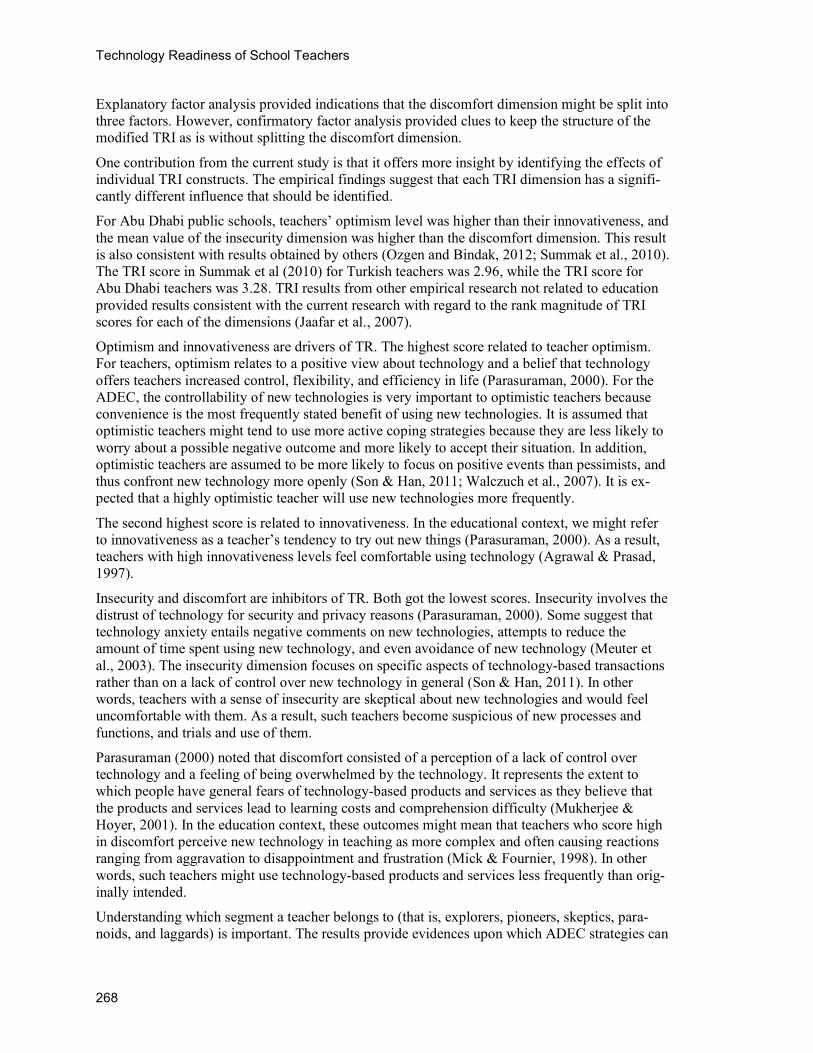
The location where a teacher is working (zone) has a significant effect on both discomfort and insecurity, but not on either optimism or innovativeness. With regard to all four dimensions, Al Gharbia zone teachers score the highest scores, while Al Ain zone teachers score the lowest scores. Al Gharbia could be characterized as a more rural area, while the Abu Dhabi and Al Ain zones are more urban. Meanwhile, the number of students a teacher is in charge of teaching has a significant effect on all four TRI dimensions. As the number of students increases, the TRI scores tend to go down for all four dimensions.
The teacher’s TRI self-rating has a significant effect on the three dimensions of optimism, inno-vativeness, and insecurity. There is no significant effect with regard to discomfort. For all three dimensions of optimism, innovativeness, and insecurity, and in general, as the self-score goes up, the scores for the three dimensions go up to.
Table 7. One-way ANOVA (TRI and school zone, number of students and self-rating TRI) School zone No. of students Self-rating TRI Dimensions F-value Sig. F-value Sig. F-value Sig. Optimism 1.206 .300 1.481 .001 20.435 .001 Innovativeness 1.066 .345 1.757 .001 58.649 .001 Discomfort 5.143 .006 1.627 .001 .716 .542 Insecurity 3.420 .033 1.921 .001 4.418 .004 Overall TRI 4.198 .015 1.959 .001 20.656 .001
Discussion The Abu Dhabi Education Council (ADEC) has started an ambitious program of education re-form where the integration of ICT into all educational processes is a major component of its fu-ture education systems. In 2011 and 2012, the ADEC spent more than 500 million dollars on re-lated initiatives. The professional development of teachers was the main focus for the ADEC. Teachers’ attitudes, beliefs, perceptions, and behaviors toward technology are extremely im-portant for the success of such projects (Summak et al., 2010).
This research aimed at measuring Abu Dhabi public school teachers’ technology readiness by using TRI, a scale consisting of four dimensions of optimism, innovativeness, discomfort, and insecurity. Even though the study utilized a previously validated scale of TRI, it was necessary to evaluate measurement validity using exploratory and confirmatory factor analysis since the envi-ronment of application changed. Based on those analyses, the study deleted one item under the innovativeness dimension. As a result, a 35-item instrument was used.
Technology Readiness of School Teachers
268
Explanatory factor analysis provided indications that the discomfort dimension might be split into three factors. However, confirmatory factor analysis provided clues to keep the structure of the modified TRI as is without splitting the discomfort dimension.
One contribution from the current study is that it offers more insight by identifying the effects of individual TRI constructs. The empirical findings suggest that each TRI dimension has a signifi-cantly different influence that should be identified.
For Abu Dhabi public schools, teachers’ optimism level was higher than their innovativeness, and the mean value of the insecurity dimension was higher than the discomfort dimension. This result is also consistent with results obtained by others (Ozgen and Bindak, 2012; Summak et al., 2010). The TRI score in Summak et al (2010) for Turkish teachers was 2.96, while the TRI score for Abu Dhabi teachers was 3.28. TRI results from other empirical research not related to education provided results consistent with the current research with regard to the rank magnitude of TRI scores for each of the dimensions (Jaafar et al., 2007).
Optimism and innovativeness are drivers of TR. The highest score related to teacher optimism. For teachers, optimism relates to a positive view about technology and a belief that technology offers teachers increased control, flexibility, and efficiency in life (Parasuraman, 2000). For the ADEC, the controllability of new technologies is very important to optimistic teachers because convenience is the most frequently stated benefit of using new technologies. It is assumed that optimistic teachers might tend to use more active coping strategies because they are less likely to worry about a possible negative outcome and more likely to accept their situation. In addition, optimistic teachers are assumed to be more likely to focus on positive events than pessimists, and thus confront new technology more openly (Son & Han, 2011; Walczuch et al., 2007). It is ex-pected that a highly optimistic teacher will use new technologies more frequently.
The second highest score is related to innovativeness. In the educational context, we might refer to innovativeness as a teacher’s tendency to try out new things (Parasuraman, 2000). As a result, teachers with high innovativeness levels feel comfortable using technology (Agrawal & Prasad, 1997).
Insecurity and discomfort are inhibitors of TR. Both got the lowest scores. Insecurity involves the distrust of technology for security and privacy reasons (Parasuraman, 2000). Some suggest that technology anxiety entails negative comments on new technologies, attempts to reduce the amount of time spent using new technology, and even avoidance of new technology (Meuter et al., 2003). The insecurity dimension focuses on specific aspects of technology-based transactions rather than on a lack of control over new technology in general (Son & Han, 2011). In other words, teachers with a sense of insecurity are skeptical about new technologies and would feel uncomfortable with them. As a result, such teachers become suspicious of new processes and functions, and trials and use of them.
Parasuraman (2000) noted that discomfort consisted of a perception of a lack of control over technology and a feeling of being overwhelmed by the technology. It represents the extent to which people have general fears of technology-based products and services as they believe that the products and services lead to learning costs and comprehension difficulty (Mukherjee & Hoyer, 2001). In the education context, these outcomes might mean that teachers who score high in discomfort perceive new technology in teaching as more complex and often causing reactions ranging from aggravation to disappointment and frustration (Mick & Fournier, 1998). In other words, such teachers might use technology-based products and services less frequently than orig-inally intended.
Understanding which segment a teacher belongs to (that is, explorers, pioneers, skeptics, para-noids, and laggards) is important. The results provide evidences upon which ADEC strategies can
Badri, Al Rashedi, Yang, Mohaidat, & Al Hammadi
269
be developed to increase the rate of integration of new technologies into the curriculum and ped-agogy. For example, we noted that while explorers and pioneers are optimistic and innovative, they also are slightly resistant to technology. Therefore it will be important to provide reassurance about the integration of new technology to this segment of teachers and ensure that the practical benefits of technology and instructions on how to use it are clearly communicated. Providing help and assistance will assist these segments to adopt new technology sooner. These findings contrib-ute to our understanding of teachers’ behavior patterns and can be beneficial when applying inte-gration of new technologies.
With regard to teachers and TRI, and other demographic variables, it was not possible to compare the results of this study with previous research as few researchers have conducted related research on education (or teachers). The lack of previous research was observed with the education level of teachers, their nationalities, the number of students they teach, and their length of experience as teachers. It also involves the cycle (or grade level) they teach and the subject they teach. How-ever, some TRI studies conducted in other disciplines did investigate those variables.
A significant difference was found with regard to teachers’ gender and their attitudes to TR. Male teachers demonstrated a higher overall technology readiness score than female teachers. Similar-ly, some studies indicated that male teachers’ attitudes toward computer technology are more pos-itive than female teachers’ attitudes (Caison et al., 2008; Ertmer, Addison, Lane, Ross, & Woods, 1999; Summak et al., 2010). Some studies did not find any differences between genders (Rama-yah et al., 2003). In Abu Dhabi public schools, male and female teachers do not always teach in the same schools. Male teachers work in boys’ schools, while female teachers might teach in KG and Cycle I of boys’ schools too. Most female teachers feel overwhelmed by domestic duties and think that they might not have enough time to get involved in much professional development involving ICT.
In terms of the age of teachers, there was a significant difference between the technology readi-ness of teachers regarding innovativeness and insecurity. Some studies reported that there is no significant difference between attitudes with regard to TRI and age (Summak et al., 2010; Wood-row, 1991). Many older teachers feel that the new technology does not provide enough encour-agement to get involved. Many of these teachers are laggards, skeptics, or paranoids.
In terms of location, teachers in rural areas showed higher insecurity scores than urban teachers. For health professionals, Caison et al. (2008) observed that those in rural areas indicated signifi-cantly greater insecurity with technology than did their urban counterparts. Both Abu Dhabi and Al Ain are considered more urban than Gharbia, and those two regions usually offer more chanc-es to get involved with technology.
The nationality of teachers showed a great impact on the TR ratings. Some studies conducted in business found no significant differences with regard to ethnicity (Ramayah et al., 2003). It is likely that UAE nationals, with their tenured contracts, think in the long term when it comes to working in Abu Dhabi schools. This might explain why they scored higher TR ratings than teach-ers of other nationalities. Many Arab and Western teachers (with two-year contracts) might not exert themselves to make the extra effort to improve their ICT skills further.
With regard to the highest education attained by teachers, the results are consistent with the re-sults of studies conducted in small businesses. These studies found that managers with a degree-level education have a higher technology readiness compared to lower education achievers (Ra-mayah et al., 2003). In the current study, most high-scoring teachers are the younger ones, and they are mostly recent graduates from college. Younger college graduates might have had greater chances to learn newer teaching methods in college with more integration of technology in peda-gogy and the curriculum.
Technology Readiness of School Teachers
270
The number of students a teacher teaches is a significant factor in the TR scores. The score goes down as the number of students increases. In addition, there were significant differences with re-gard to teachers’ self-ratings on all four dimensions. A teacher with more students to teach might have greater responsibilities to manage students in the class.
Conclusions This study replicated Parasuraman’s (2000) technology readiness index (TRI) in the education context and in a different culture, which enhances its validity, applicability, and generalizability. In an educational context, the positive drivers of TR (optimism and innovativeness) encourage teachers to use technological products or services and hold positive attitudes toward technology. The negative drivers (discomfort and insecurity) inhibit teachers’ adoption of technology.
For the Abu Dhabi Education Council, the key to bolstering teachers’ TRI is the positive experi-ence teachers have with technology. Such experiences lead to more acceptance, comfort, and con-fidence, ultimately nurturing a positive attitude toward the integration of technology into curricu-la and teaching. For the effective integration of technology, the ADEC should educate teachers by advocating the benefits of technology and promoting a positive attitude toward technology within schools’ teaching practices. Feedback should be collected for continuous improvement of tech-nology integration. The ADEC should also spend time and effort on designing more user-friendly interfaces. Continuous feedback on interface successes and failures is vital to continual improve-ment and the overcoming of TR inhibitors. Schools could provide more professional training and education that ease teachers into new technology integration.
ADEC strategists may be in a much better position to plan technology integration strategies to encourage the diffusion of a technology-enhanced curriculum and pedagogy if they have a valid measurement and deep understanding of the four dimensions of technology readiness. Strategies could be targeted to whatever dimension is inhibiting or failing to contribute to technology readi-ness. This targeting would allow a much more efficient and effective use of strategic educational resources; knowing which of the dimensions to target should be of critical importance to the ADEC for effective technology integration.
As Abu Dhabi, among other nations, moves aggressively to adopt ICT in its education system to improve school practice and student outcomes, the success of these initiatives will increasingly depend on the willingness of teachers to embrace these technologies. In this study of the technol-ogy readiness of public school teachers, teachers working in more rural areas were found to be significantly more insecure with new technology than urban public school teachers. In addition, male teachers were found to be significantly more innovative than female teachers and older teachers were found to be less technology ready than younger ones. Before integrating technology into the curriculum, ADEC decision makers would be well served to support the needs of teachers working in more rural areas, female teachers, and those teachers with extensive teaching experi-ence but who are relatively older than newcomers to the profession of teaching. The ADEC should also pay more attention to and serve the needs of those falling in the skeptics and paranoid segments. In addition, patterns such as those observed in this study highlight areas of professional development that should receive more focus.
Teacher segmentation according to the four dimensions of the TRI show that the public school teachers sample is generally high in techno-readiness. This could be due to their education, which may be higher than the average person in the region. There is also the intriguing possibility that there is a cultural propensity toward innovation, which could have implications for economic de-velopment. It is interesting to note that Abu Dhabi is, in a way, akin to Iceland, Finland, Singa-pore, and so on; they are all small countries where there is potential for high tech. Many new cap-ital projects in Abu Dhabi are high tech in nature.
Badri, Al Rashedi, Yang, Mohaidat, & Al Hammadi
271
In conclusion, this study showed that Abu Dhabi public school teachers’ technology-readiness level was relatively moderate. This result might cause challenges for the ADEC with regard to its aggressiveness in the technology integration process, especially in connection with designing the appropriate professional development programs for teachers. ADEC strategists should note that those teachers who are high in the discomfort dimension should be approached with care.
Study Limitations Although we obtained samples from diverse groups of teachers, our samples may not be truly random across all categories of teachers. Future studies should encourage more participation of teachers from all backgrounds, and they should extend to teachers in private schools too. Fur-thermore, this study offers a static view with cross-sectional surveys. Future studies should con-sider using longitudinal measures to track changes in teachers’ technology readiness over time. Future studies could be conducted on a larger sample of teachers in order to give a more detailed understanding of the complete picture.
Even though the insecure dimension was represented by a single factor only, FA revealed that it might be comprised of three different factors. Future studies should look into this outcome with more care by considering the significance of such splitting.
It is important to note that the TRI and the technology segments presented here are not indicators of technical competence. It is also important to note that each group of teachers is diverse, so oth-er factors, such as ethnicity and age, are not a sole determinant of techno-readiness. For example, the most tech-savvy segment, explorers, represents 12 to 20 percent of each group.
Future studies should also explore empirically the integration of the TRI with other models, such as Fishbein and Ajzen’s generic Theory of Reasoned Action (TRA) that explains teachers’ atti-tudes towards technology in schools. TRA argues that a person’s behavior is predicted by his or her behavioral intention. This technology acceptance model (TAM) has three key variables: per-ceived usefulness (PU), perceived ease of use (PEU), and behavioral intention to use (BIU). Ac-cording to Venkatesh and Morris (2000), the parsimony of TAM combined with its predictive power makes it easy to apply to different situations. In the literature there are some studies to measure technology readiness and technology acceptance (Caison et al., 2008; Massey et al., 2007; Taylor et al., 2002; Walczuch et al., 2007). However, to our knowledge, no such study has been conducted in the area of education.
Future research could also consider showing how the TRI might influence teachers’ post-adoption behavior. It should investigate the complete or entire process of how the TRI affects teachers’ behavioral outcomes such as teacher satisfaction and continued-use intention through usage pat-terns after the adoption of technology.
References Agarwal, R., & Prasad, J. (1997). The role of innovation characteristics and perceived voluntariness in the
acceptance of information technologies. Decision Sciences, 28, 557-582.
Albion, P. (2001). Some factors in the development of self-efficacy beliefs for computer use among teacher education students. Journal of Technology and Teacher Education, 9(3), 321-347.
Andaleeb, A., Idrus, A., Ismail, I., & Mokaram, A. (2010). Technology Readiness Index (TRI) among USM distance education students according to age. International Journal of Social Sciences, 5(3), 189-192.
Anderson, T., Varnhagen, S., & Campbell, K. (1998). Faculty adoption of teaching and learning technolo-gies: Contrasting earlier adopters and mainstream faculty. The Canadian Journal of Higher Education, 2(3), 71-98.
Technology Readiness of School Teachers
272
Badri, M.; Elmourad, T., & Ferrandino, V. (2013). The social cognitive model of work satisfaction among teachers: Testing and validation. International Journal of Educational Research, 17, 12-24.
Bariso, E. (2003). The computer revolution: Friend or foe to FE college staff. British Journal of Education-al Technology, 34(1), 85-88.
Becker, H. (1994). How exemplary computer-using teachers differ from other teachers: Implications for realizing the potential of computers in schools. Journal of Research on Computing in Education, 26(3), 291–321.
Beggs, T. (2000). Influences and barriers to the adoption of instructional technology. In Proceedings of the Mid-South Instructional Technology Conference. June 12, 2009.
Berndt, A., Saunders, S., & Petzer, D. (2010). Readiness for banking technologies in developing countries. Southern African Business Review, 14(3), 47-76.
Caison, A. L., Bulman, D., Pai, S., & Neville, D. (2008). Exploring the technology readiness of nursing and medical students at a Canadian University. Journal of Interprofessional Care, 22(3), 283-294.
Cavas, B., Cavas, P., Karaoglan, B., & Kalsa, T. (2009). A study on science teachers' attitudes toward in-formation and communication technologies in education. The Turkish Online Journal of Educational Technology, 8(2), 34-67.
Christiensen, R. (2002). Effects of technology integration education on the attitudes of teachers and stu-dents. Journal of Research on Technology in Education, 34(4), 411-433.
Colby, C., & Albert, T. (2003). The role of culture in technology adoption in the U. S.: Results of the Afri-can American and Latino technology readiness survey. Great Falls, VA: Rockbridge Associates.
Earle, R. (2002). The integration of instructional technology into public education: Promises and Challeng-es. ET Magazine, 42(1), 5-13.
Elliott, K., Hall, M., & Meng, J. (2008). Student technology readiness and its impact on cultural competen-cy. College Teaching Methods & Styles Journal, 4, 11-21.
Ertmer, P., Addison, P., Lane, M., Ross, E., & Woods, D. (1999). Examining teachers’ beliefs about the role of technology in the elementary classroom. Journal of Research on Computing in Education, 32(1), 54-71.
Eyyam, R., Menevis, I., & Dogruer, N. (2010). Perceptions of prospective teachers towards technology use in class. Procedia Social and Behavioral Sciences, 3, 88–93.
Gulbahar, Y., & Guven, I. (2008). A survey on ICT usage and the perceptions of social studies teachers in Turkey. Educational Technology & Society, 11(3), 37-51.
Hew, K., & Brush, T. (2007). Integrating technology into K-12 teaching and learning: Current knowledge gaps and recommendations for future research. Education Technology Research & Development, 55, 223–252.
Jaafar, M., Ramayah, T., Abdul-Aziz, A., & Saad, B. (2007), Technology readiness among managers of Malaysian construction firms. Engineering, Construction and Architectural Management, 14(2), 180-191.
Jacobsen, M., Clifford, P., & Frieson, S. (2002). Preparing teachers for technology integration: Creating a culture of inquiry in context of use. Contemporary Issues in Technology and Teacher Education, 2(3), 363-388.
Lai, M. (2008). Technology readiness, internet self-efficacy and computing experience of professional ac-counting students. Campus-Wide Information Systems, 25(1), 18 – 29.
Lam, S., Chiang, J., & Parasuraman, A. (2008). The effects of the dimensions of technology readiness on technology acceptance: An empirical analysis. Journal of Interactive Marketing, 22(4), 19-39.
Lee. W., Chiu, W., Chiang, M., & Chiu, C. (2009). Technology readiness in the quality-value-loyalty chain. International Journal of Electronic Business Management, 7, 112-126.
Badri, Al Rashedi, Yang, Mohaidat, & Al Hammadi
273
Liljander, V., Gillberg, F., Gummerus, J., & Van Riel, A. (2006). Technology readiness and the evaluation and adoption of self-service technologies. Journal of Retail Consumer Services, 13(3), 177-191.
Lim H., & Dubinsky, A. (2004). Consumers’ perceptions of e-shopping characteristics: An expectancy-value approach. Journal of Service Marketing, 18, 500-513.
Lin, J., & Hsieh, P. (2012). Refinement of the technology readiness index scale: A replication and cross-validation in the self-service technology context. Journal of Services Management, 23(1), 34-53.
Massey, A., Khatri, V., & Montoya-Weiss, M. (2007). Usability of online services: The role of technology readiness and context. Decision Sciences, 38, 277-308.
Meng, J., Elliott, K., & Hall, M. (2010). Technology Readiness Index (TRI): Assessing cross-cultural valid-ity. Journal of International Consumer Marketing, 22,19–31.
Meuter, L., Ostrom, L., Bitner, J., & Roundtree, R. (2003). The influence of technology anxiety on con-sumer use and experiences with self-service technologies. Journal of Business Research, 56(11), 899-906.
Mick, D., & Fournier, S. (1998). Paradoxes of technology: Consumer cognizance, emotions, and coping strategies. Journal of Consumer Research, 25(2), 123-144.
Mukherjee, A., & Hoyer, W. (2001). The effect of novel attributes on product evaluation. Journal of Con-sumer Research, 28(3), 462-472.
Ozgen, K., & Bindak, R. (2012). Examining student opinions on computer use based on the learning styles in mathematics education. The Turkish Online Journal of Educational Technology, 11(1), 79-93.
Parasuraman, A. (2000). Technology Readiness Index (TRI). A multiple-item scale to measure readiness to embrace new technologies. Journal of Service Research, 2(4), 307-320.
Parasuraman, A., & Colby, C. L. (2001). Techno-ready marketing: How and why your customers adopt technology. New York, NY: The Free Press.
Pelgrum, W. (2001). Obstacles to the integration of ICT in education: Results from a worldwide education-al assessment. Computers & Education, 37, 163-178.
Ramayah, T., Jantan, M., Roslin, R., & Siron, R. (2003). Technology readiness of owners/managers of SMEs. The International Journal of Knowledge, Culture and Change Management, 3, 475-86.
Russell, M., Bebell, D., O’Dwyer, L., & O’Connor, K. (2003). Examining teacher technology use implica-tions for pre-service and in-service teacher preparation. Journal of Teacher Education, 54(4), 297-310.
Snoeyink, R., & Ertmer, P. (2002). Thrust into technology: How veteran teachers respond. Journal of Edu-cational Technology Systems, 30(1), 85-111.
Son, M., & Han, K. (2011). Beyond the technology adoption: Technology readiness effects on post-adoption behavior. Journal of Business Research, 64, 1178–1182.
Summak, M., Baglibel, M., & Samancioglu. (2010). Technology readiness of primary school teachers: A case study in Turkey. Procedia Social and Behavioral Sciences, 2, 2671–2675.
Taylor, S., Celuch, K., & Goodwin, S. (2002). Technology readiness in the e-insurance industry: An ex-ploratory investigation and development of an agent technology e-consumption model. Journal of In-surance Issues, 25(2), 142-166.
Tsikriktsis, N. (2004). A technology readiness-based taxonomy of customers: A replication and extension. Journal of Service Research, 7(1), 42–52.
Venkatesh, V., & Morris, M. (2000). Why don't men ever stop to ask for directions: Gender, social influ-ence, and their role in technology acceptance and usage behavior. MIS Quarterly, 24(1), 115-139.
Verhoef, C., Lemon, N., Parasuraman, A., Roggeveen, A., Tsiros, M., & Schlesinger, L.A. (2009). Cus-tomer experience creation: Determinants, dynamics and management strategies. Journal of Retailing, 85(1), 31-41.
Technology Readiness of School Teachers
274
Victorino, L., Karniouchina, E., & Verma, R. (2009). Exploring the use of the abbreviated technology read-iness index for hotel customer segmentation. Cornell Hospitality Quarterly, 50(3), 342-359.
Walczuch, R., Lemmink, J., & Streukens, S. (2007). The effect of service employees’ technology readiness on technology acceptance. Information & Management, 44, 206–215.
Woodrow, J. (1991). A comparison of four computer attitude scales. Journal of Education and Computer Research, 7, 165-167.
Wozney, L., Venkatesh, V., & Abrami, P. (2006). Implementing computer technologies: Teachers’ percep-tions and practices. Journal of Technology and Teacher Education, 14(1), 173-207.
Yalcin, S., Kahraman, S., & Yilmaz, Z. (2011). Primary school teachers of instructional technologies self-efficacy levels. Procedia – Social and Behavioral Sciences, 28, 499-5002.
Yildirim, S. (2007). Current utilization of ICT in Turkish basic education schools: A review of teacher's ICT use and barriers to integration. International Journal of Instructional Media, 34(2) 171-186.
Biographies Currently Masood Abdulla Badri is the Executive Director, Research and Planning, Abu Dhabi Education Council. Seconded from the UAE University where he is a Professor of Operations Management / Logis-tics and Supply Chain Management. He received his PhD in 1989 from the University of Mississippi in Production and Operations Manage-ment, MBA from University of San Diego, and BS in Mechanical En-gineering from the University of California in San Diego. He pub-lished more than 100 papers in international journals. His recent re-search interests, among other interests, include strategic and policy planning, education reform, quality planning in public and private in-stitutions, and causal analysis of determinants of strategic and policy implementation outcomes.
Asma AlRashedi is a senior research assistant at Abu Dhabi Educa-tion Council, UAE. She received her Bachelor’s degree in Information Technology from United Arab Emirates University. She completed her Master’s degree in Computing and Information Science at Masdar In-stitute. Asma has experience in designing, developing, and implement-ing surveys that investigate educational issues and practices.
Badri, Al Rashedi, Yang, Mohaidat, & Al Hammadi
275
Dr. Guang Yang is the research program manager at the Office of Re-search and Planning, Abu Dhabi Research Council. He received his Master’s degree in Development Studies from the International Insti-tute of Social Studies, Erasmus University Rotterdam and Doctor in Social Science from the School of Management, University of Leices-ter. Previously worked in the field of labour market and employment relations, he has currently worked on various topics in educational studies. His main research interests include teacher effectiveness, par-ent involvement, student engagement, science education, and student learning.
Dr. Jihad Mohaidat earned his PhD in microelectronics engineering from the City University of New York in 1994. Currently Dr. Mohaidat is managing the Global Partnerships department for the Abu Dhabi Education counsel; where the sought after partnerships are those that will lead Abu Dhabi to the highest international standards in education and research.
Prior to Abu Dhabi Educational counsel, Dr. Mohaidat was the tech-nology advisor for the renowned Abu Dhabi initiative “MASDAR” where he spent 3 years screening, selecting and approving renewable energy technologies for investments and manufacturing. In addition, Dr. Mohaidat managed MASDAR’s international research funding
Network and scholarship programs. The MASDAR experience was preceded by an 8 year profes-sorship carrier in academia both in the USA and United Arab Emirates University where he held an associate professor rank. Before that Dr. Mohaidat was with the New York state center for ad-vanced technology.
Dr. Mohaidat has a long list of publications in many world class peer reviewed journals and con-ferences.
Dr. Arif Al Hammadi has a professional experience in the Academic and Telecommunications fields. Currently, he is serving in Abu Dhabi Education Council as the Executive Director of the Higher Education Sector and in Khalifa University of Science Technology and Research as the Executive Vice President. He is the Chairman of Gulf Nuclear Infrastructure Institute, and the one who led the establishment of the ETISALAT_ BT Innovation Center (EBTIC). In addition to that, the founding Chair of the UAE Mobile Application Contest and the UAE ICT Research Forum. He is also a board member at Strata, Mubadala’s composite aero-structures manufacturing facility and previously served as a board member in the UAE ICT fund. He has lectured and pub-lished on various subjects and specializations within Computer and
Communication Networks, including network performance engineering, network simulation and modeling, quality of service (QoS) control and congestion control mechanisms in addition to ap-plications of artificial intelligence and multimedia. He is a holder of a PhD Degree in Telecom-munications which he obtained from the Queen Mary, University of London, and a holder of a Bachelor Degree in Telecommunications Engineering with Honors from Etisalat University Col-lege.