technology, data capture, & the mechanical contractor
TRANSCRIPT

Technology, Data Capture, andthe Role of the Mechanical Contractor
Nathan WoodFounder, SpectrumAEC

[email protected]@NathanCWood650.454.5334
NathanCWood.com
Nathan Wood has emerged as a thought leader for innovation across the Architecture, Engineering, and Construction (AEC) industry. As SpectrumAEC’s founder and chief enabling officer, he leverages his international experience with BIM, Lean, and Integrated Project Delivery (IPD) to develop strategic implementation plans that balance the needs of people, process, and technology. He has a unique ability to identify the root causes preventing new technology implementation, and works alongside project stakeholders and technical leads to align the team around clear goals with shared incentives.
Outside of SpectrumAEC, Nathan continues to support industry progress through conference presentations, academic papers, and as a leader in the Construction PDF Coalition (www.cpcoalition.com).
linkedin.com/in/nathanaec
BIMBuilding Information
Modeling
VDCVirtual Design &
Construction
LEANAGC CM-Lean
Instructor
IPDIntegrated Project
Delivery
Nathan C. Wood Innovation Evangelist | Adoption Strategist

Construction is NOT a ‘Digital’ Industry
http://www.mckinsey.com/industries/capital-projects-and-infrastructure/our-insights/imagining-constructions-digital-future
3
CDP 2016The digital future of constructionExhibit 2 of 9
Labor productivity, gross value added per hour worked, constant prices,1 index: 100 = 1995
Construction labor productivity has not kept pace with overall economic productivity.
1 Based on 2010 prices.
Source: Organisation for Economic Co-operation and Development
120
100
110
130
02007 2001 1997 2011 2013 2012 1995 2009 1999 2003 2014 1998 2002 2010 2004 2000 1996 2008 2006 2005
Total economy
Construction
Germany
Germany
United Kingdom
United Kingdom
Exhibit 2
CDP 2016The digital future of constructionExhibit 3 of 9
McKinsey Global Institute industry digitization index; 2015 or latest available data
The construction industry is among the least digitized.
Assets Usage Labor
Sector
ICT2
Media Professional services Finance and insurance Wholesale trade Advanced manufacturing Oil and gas Utilities Chemicals and pharmaceuticals Basic goods manufacturing Mining Real estate Transportation and warehousing Education Retail trade Entertainment and recreation Personal and local services Government Healthcare Hospitality Construction Agriculture and hunting
1Based on a set of metrics to assess digitization of assets (8 metrics), usage (11 metrics), and labor (8 metrics).2Information and communications technology.
Source: AppBrain; Bluewolf; Computer Economics; eMarketer; Gartner; IDC Research; LiveChat; US Bureau of Economic Analysis; US Bureau of Labor Statistics; US Census Bureau; McKinsey Global Institute analysis
Overall
digitization 1
Digital spending
on workers
Digital capital
deepening
Digitization
of work
Interactions
Business
processes
Market m
aking
Digital
spending
Digital
asset stock
Transactions
Relatively lowdigitization
Relatively highdigitization
Digital leaders within relatively undigitized sectors
Exhibit 3

0 1 2 3 4 5 6 7
Construction
Energy
Manufacturing
Transportation
Healthcare
Education
Finance
IT Spending as a % of Revenue, By Industry [Gartner 2014]
It Requires more Technology Investment People
ProcessTechnology
3.3%Cross-Industry
Average3.3xInvestment Gap

It Requires a Process Disruption People
ProcessTechnology

It Requires an Incentive to Collaborate
“Virtually everyone in the construction supply chain works on contracts where the incentive is to maximize their gain at the expense of others”
Just follow the money…
People
ProcessTechnology
John Macomber, ASCE Report, 2003“Follow the Money: What Really Drives Technology Innovation in Construction”

www.bestppt.com
FlawedPerformance Management
Limited
Talent
Management
Inadequate Communication Poor Organization
Contractual Misunderstandings
Poor Short Term Planning
Insufficient Risk Management
Missed Connections

2016 World Economic Forum Report
www.bestppt.com
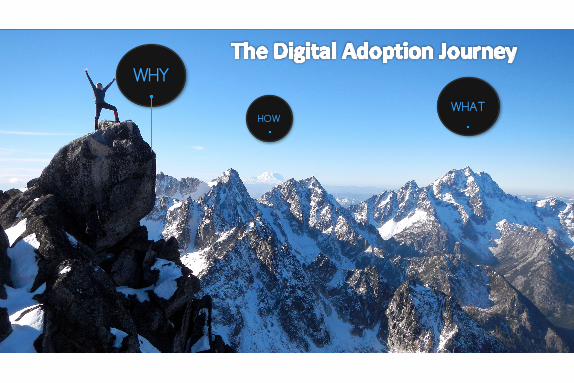
WHATHOW
WHY

www.bestppt.com
MY ADOPTION JOURNEYThe People. The Process. The Technology
@nathancwood@SpectrumAEC

Boulder,CO
Austin,TX
SanFrancisco,CA
FallsChurch,VA
The Journey to DPR Construction & BIM

SUTTERCASTROVALLEY
WHY: Sutter Health + OSHPD State RequirementsSeismicFaultLinesSanFranciscoBay,CA

Christian,D.,Bredbury,J.,Emdanat,S.,Haase,F.,Kunz,A.,Rubel,Z.andBallard,G.(2014).“Four-phaseprojectdeliveryandthepathwaytoperfection.”In:Proc.22ndAnn.Conf.oftheInt’lGroupforLeanConstruction,IGLC-22,Oslo,Norway,June25- 27. Availableat<www.iglc.net>
WHAT: Integrated Design to Construction

30%ReductioninSchedule
NoRework(MEP)
As-BuiltModel
IncreaseFieldCrewProduction
HOW: BIM + Lean + Integrated Project Delivery

3DDetailingandCoordinationinTekla
ShopDrawingGenerationisDirectOutputfromTeklaModel
Benefit: Direct 3D to 2D Field Drawings

TheFirstDiscovery:Rebarvs.PrecastSleeve• 200+FacadepenetrationsorembedwerecoordinatedwithrebarandMEP.• Precastsubcontractordidnotoriginallyaccountforrebarspacingduringdesign.• Over25%ofConnectiondesignswerechangedduetoBIMCoordination
Risk: Precast Façade Connections

BIM=BetterProductivity&QualityBenefit: Quality Control + Increased Productivity
DPRConcretereported10%ProductivityIncreasefromBIMshopdrawingsprocess.

2D Detail Constructability Review

BIM + Lean: Last Responsible Moment
• OPTION#2:RoofSloperedesigned4weekspriortoroofconcretepour• Required3newdrainstobecoordinatedwithexistingMEPBIM

TRUST:CONSTRUCTABILITYINPUTHOW? Shared Risk & Reward with MEP Trades• Routed3additionaldrainstoanearbyriserinBIM• Newdrainagecalculationoftheredesignedsloping• ConfirmedLEEDrequirementsofroofstillheld• Pouredconcreteroofslabonschedule

TRUST:TRADESINSTALLFROMBIMAutomated Spool Fabrication from BIM
CourtesyofMcClanahanPlumbing

SYNERGY:BIM +TOTALSTATIONIntegrated Total Station Layout
UseofRoboticTotalStation(RTS)inConjunctionwithCoordinatedMEPInsertsinBIM
4XProductivityComparedtoConventionalLayoutCourtesyofMcClanahanPlumbing

DrywallSpoolSheetsDirectfromCoordinatedBIM
TRUST:IMPROVEDFRAMINGPROCESSDrywall Framing Productivity & Rework
Credit:DPRDrywall

50-95%Reduction in Rework
Benefits: Installation Metrics (Castro Valley)
0%
5%
10%
Mech PlumbElectrical Drywall
Rework(%)ByTrade
Baseline
Actual
5-28%Increase in Productivity
0%
10%
20%
30%
Mech PlumbElectrical
Drywall
ProductivityIncrease%ByTrade
Planned
Actual

SUTTERCASTROVALLEY
SUTTERALTABATES
Fall 2010: Transferring Lessons to Alta Bates
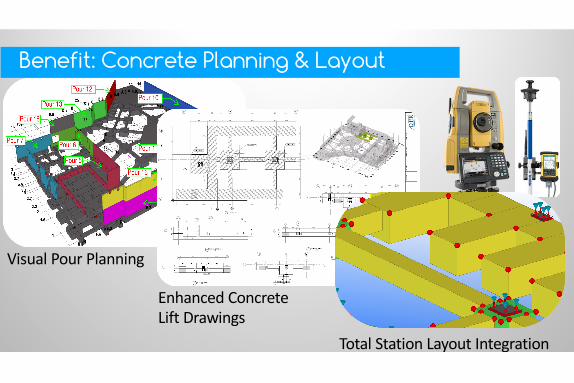
VisualPourPlanning
Benefit: Concrete Planning & Layout
EnhancedConcreteLiftDrawings
TotalStationLayoutIntegration
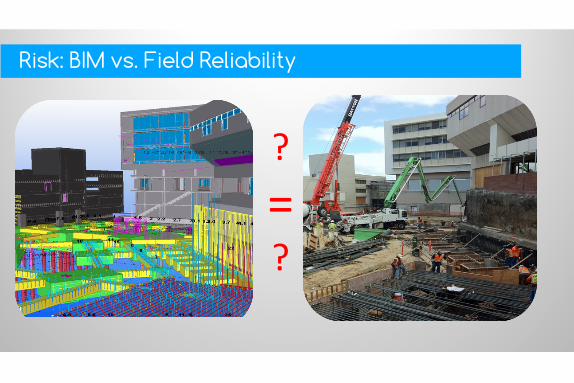
ProjectChallengesRisk: BIM vs. Field Reliability
?=?

New Project, New Risks: Sutter Alta Bates
ComplexProjectSite
Unforseen Conditions
SeismicExpansionJointConnections

CourtesyofTrimbleNavigationltd.
Benefit: Modeling of Unforseen Conditions

Risk: Civil/Structural Design Coordination

Innovation: Overlay of Revit Structure & Civil 3D

Countermeasure: Define Rebar Design in BIM

Pull 2D Detail from BIM for OSHPD Drawing

Integrate x,y,z Total Station Layout from BIM

=
Success Metric: Early Schedule Savings
Concrete Foundations
31 DaysOf Critical Path Schedule
Recovered over 10 Months
33% Time Savings Per Submittal Review


A Tale of Two Projects: IPD Lessons Learned
Castro Valley Delivered
6 WeeksAhead of Schedule
MaintainedTarget Cost
Alta Bates Delivered
6 MonthsBehind Schedule
20 Million Over Target Cost

BIM?IPD? LEAN?

The Castro Valley Difference: Culture
Teammemberschorus:Don’ttrythiswithstrangers.Expectlengthycontractnegotiationsandendlessmeetings.
Bevigilantaboutcommunicating.
“Theactualeffortrequiredwasunderestimatedonboththedesignandconstructionsides,”saysJamesMobley,aDevenney principal.

Mistakes are Part of Innovation. Who’s to Blame?
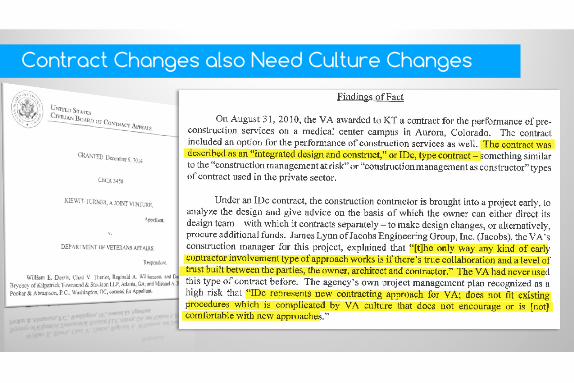
Contract Changes also Need Culture Changes

The Digital Adoption Tipping Point Starts with….


www.bestppt.com
WHAT
WHY

2016 World Economic Forum: The ‘What’

The Potential of Big Data: Predix by GE

The Reality of Big Data

IFTHEN

The Truth About Trusting Bad Data

Barriers to Adoption of Integrated Data
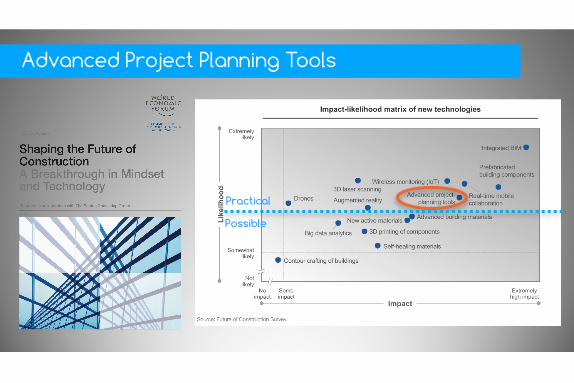
https://www.weforum.org/reports/shaping-the-future-of-construction-a-breakthrough-in-mindset-and-technology

Impact-Likelihood Matrix of Construction Tech
Practical
Possible

Virtual Reality vs. Augmented Reality
http://futurism.com/images/vr-ar-and-mr-whats-the-difference-infographic-2/

‘Proof of Concept’ Video (Trimble & Hololens)
https://www.youtube.com/watch?v=kXVW4sUsh3A


http://strxur.com/no-plans-no-problem-building-ar/
StrXur.com – Framing Layout with Hololens

Nerding Out: Hololens Location Accuracy

Pop Quiz: VR or AR?
http://www.bimanywhere.com/

Drones
Practical
Possible

www.bestppt.com© 2011 DPR Construction All Rights Reserved
Advanced Project Planning Tools
Practical
Possible

BIM + CPM Schedule IntegrationBIM + CPM Schedule Integration (4D Visualization)

OVERALLBIMBENEFITS– DEPENDSFully Integrated 5D (Cost & Time) Planning

The Lean Last Planner System (LPS) ®

Advanced Design Planning Tools
http://software.adeptmanagement.org/index.htmlhttp://www.myvplanner.com/

Prefabricated Building Components
Practical
Possible

Single Trade Modular Prefabrication
Credit:SuperiorAirHandlingCompany

Multi-Trade Prefabrication: www.bloxbuilt.com

Real-time Mobile Collaboration
Practical
Possible

TheProcess
2DShopDrawings
ShopDrawingReview
FabricateRebar
InstallRebar
3DModel
Lean Innovation: Cloud Rebar Submittal Reviews

Cloud Comment Responses = No Resubmittal

DataCentric
IntegrationBringsEfficiency&Reliability
DrawingCentric
TaskCentric
BIMCentric
TimeCentric
MediaCentric
Integrated Data Requires Integrated Platforms
APIIntegrationsDatabaseStandards

Elements of a Cooperative PartnershipFigure 11: Elements of a Cooperative Partnership61
Collaborative decision-making and control1
Third-party mediation and conciliation
Decision by adjudicator or arbitrator
Internal dispute resolution via negotiation
Conflict resolution
Premium for early project delivery
Incentives for cost optimization
Alternative cost models, such as target cost
Shared risk/reward (“pain share, gain share”)
Incentive mechanisms
Project charter with common project goals
Transparent financials (“open books”)
Co-location of teams (“big rooms”)
Common data platform (e.g. BIM)
Project culture
Choosing most efficient, not cheapest
Early involve- ment of key participants
Multi-party con-tract with clear accountabilities
Tendering and contract
Prudent manage-ment and appropri-ate allocation of risk
1 Potentially including liability waivers among participantsSource: World Economic Forum; The Boston Consulting Group

2016 World Economic Forum Report
Practical
Possible

Material Asset Tracking (RFID, Barcode, Bluetooth)

Manpower / Safety Tracking of Workforce

Discussion: Tracking “Assets” in the Field
WorkforceTracking:IsValueofSafety/ProductivityData>FearofBigBrother?Material/EquipmentTracking:WhatistheLikelihoodofPoor/MissingDataCapture?

3D Laser Scanning
Practical
Possible

RoboticTotalStation
Betterformodelvs.fieldcomparisonoflargeareas/entiresite
Countermeasure: Digital As-Builting
Betterforspecificpoints(endofwall,bottomofdoorthreshold,etc)
LaserScanning

Update Virtual to Match Physical

Confirm Late Design Changes are Coordinated

www.bestppt.com

360 Photos + Immersive Navigation

2016 World Economic Forum Report
Practical
Possible

www.bestppt.com
“A digital representation of physical and functional characteristics of a facility. A BIM is a
shared knowledge resource for information about a facility forming a reliable basis for
decisions during its life-cycle; defined as existing from earliest conception to demolition.”
National BIM Standard v1, 2007

Use Data Throughout the Lifecycle

Project Data Handover: Theory vs Reality

3DModel 2DDrawings
Desig
nFabrica
tion
87
Challenge: BIM Handoffs in the Real World

• Doesthis…..
• Equalthis?
DesignModel
FabricationModel
88
Risk: Loss of Reliable BIM for Coordination

Bringing Back Reliability: Laser Scan + GenMEP

3DModel 2DDrawings
Desig
ner
Detailer
90
Risk: New Process, Old Contract?

HandoverData
DesignInput
CoordinationInput
As-BuiltInput
CustomerInput
ProjectD
ata
Assumptions&Miscommunication
ContractRiskManagement
UnreliableData
Programing Design Coordination OperationsConstruction
91
Where Does the Data get Lost?

TOOL
SHIFTINGTHEINDUSTRYPARADIGM
PEOPLE PROCESS
BIMisjustaTool1
ThisTool isonlyasgoodasthePeople usingIt
2
ThePeople canonlybeaseffectiveastheProcess allowsthemtobe
3
The Role of BIM in Design & Construction

www.bestppt.com
WHATHOW
WHY
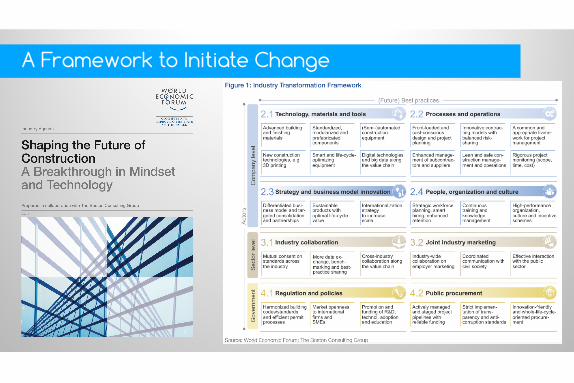
A Framework to Initiate Change

www.bestppt.com
Ideal State
Current State

Disruptive Innovation Requires Balance
Digital Standards
Aligned Incentives
Lean Integrations

How Do We Bridge the Gap? Industry Level

TheBusinessValueofBIMtoOwners
http://i2sl.org/elibrary/documents/Business_Value_of_BIM_for_Owners_SMR_(2014).pdf
What BIM Data Means to Owners

OwnersImpactonBIMStandards
http://i2sl.org/elibrary/documents/Business_Value_of_BIM_for_Owners_SMR_(2014).pdf
The Impact on Standards Adoption

W.I.I.F.M.What’sInItForMe?
Discussion #1: Why Go Digital At All?

Who’s Pushing the Adoption of BIM?
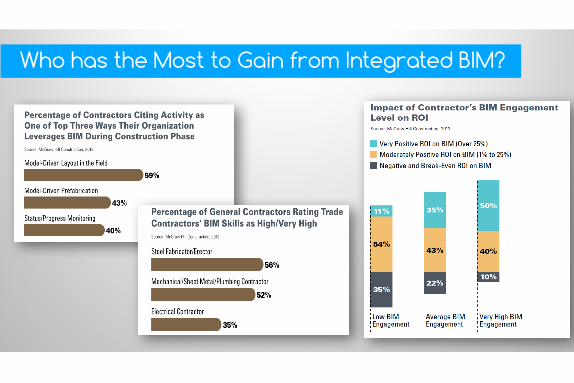
Who has the Most to Gain from Integrated BIM?

“It’smorelikely…thatnewfirmswithnewbusinessmodelsandnewareasoffocuswillleveragethefinancialandtechnologicalinnovationsthatwillchangethenatureofcompetition”
-ClaytonChristensen,1997
“Innovationisdrivenbytechnologiesthatenabletheriseofdisruptivebusinessmodels”
-BowerandChristensen,2000
Disrupt….or be Disrupted!

Mechanical Firms are Leading the Way!
http://www.builtworlds.com/news/2016/6/13/mechanical-contractors-urged-to-seize-disruptive-opportunities

End Users
Return on Investment
Implementation Certainty
Easy to Integrate
Maintain Budget
Executives
Managers
Easy to Use
Save Time
There is also an Internal Battle to be Addressed

How Do We Bridge the Gap? Company Level

Time
Value
CurrentState
DesiredState
ROIPoten
tial
TimetoAdopt
TimetoAdopt/Fail
LostROI
70% Source:JohnKotterInternational
Adoption Starts by Managing Expectations

Assess Align Advance
Adoption of Requires Early Input

Time
Value
CurrentState
IdealState
30%TimetoAdopt
ROIPoten
tial
TimetoAdopt/Fail
LostROI
70% Source:JohnKotterInternational
SharedDefinitionKeyPerformance
Indicators
A3 Workshops Provide Early Input
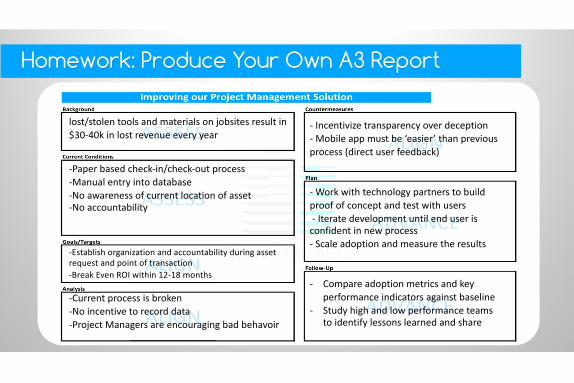
Homework: Produce Your Own A3 Report
lost/stolentoolsandmaterialsonjobsitesresultin$30-40kinlostrevenueeveryyear
-Paperbasedcheck-in/check-outprocess-Manualentryintodatabase-Noawarenessofcurrentlocationofasset-Noaccountability
-Establishorganizationandaccountabilityduringassetrequestandpointoftransaction-BreakEvenROIwithin12-18months
-Currentprocessisbroken-Noincentivetorecorddata-ProjectManagersareencouragingbadbehavoir
- Incentivizetransparencyoverdeception- Mobileappmustbe‘easier’thanpreviousprocess(directuserfeedback)
- Workwithtechnologypartnerstobuildproofofconceptandtestwithusers- Iteratedevelopmentuntilenduserisconfidentinnewprocess- Scaleadoptionandmeasuretheresults
- Compareadoptionmetricsandkeyperformanceindicatorsagainstbaseline
- Studyhighandlowperformanceteamstoidentifylessonslearnedandshare

www.bestppt.com
@nathancwood@SpectrumAEC