techno-economic comparison of ethanol and electricity
TRANSCRIPT
Petersen et al. Biotechnology for Biofuels 2014, 7:105http://www.biotechnologyforbiofuels.com/content/7/1/105
RESEARCH Open Access
Techno-economic comparison of ethanol andelectricity coproduction schemes from sugarcaneresidues at existing sugar mills in Southern AfricaAbdul M Petersen, Mathew C Aneke and Johann F Görgens*
Abstract
Background: The economics of producing only electricity from residues, which comprise of surplus bagasse and50% post-harvest residues, at an existing sugar mill in South Africa was compared to the coproduction of ethanolfrom the hemicelluloses and electricity from the remaining solid fractions. Six different energy schemes wereevaluated. They include: (1) exclusive electricity generation by combustion with high pressure steam cycles(CHPSC-EE), (2) biomass integrated gasification with combined cycles (BIGCC-EE), (3) coproduction of ethanol (usingconventional distillation (CD)) and electricity (using BIGCC), (4) coproduction of ethanol (using CD) and electricity(using CHPSC), (5) coproduction of ethanol (using vacuum distillation (VD)) and electricity (using BIGCC), and (6)coproduction of ethanol (using VD) and electricity (using CHPSC). The pricing strategies in the economic analysisconsidered an upper and lower premium for electricity, on the standard price of the South African Energy ProviderEskom’ of 31 and 103% respectively and ethanol prices were projected from two sets of historical prices.
Results: From an energy balance perspective, ethanol coproduction with electricity was superior to electricityproduction alone. The VD/BIGCC combination had the highest process energy efficiency of 32.91% while theCHPSC-EE has the lowest energy efficiency of 15.44%. Regarding the economic comparison, it was seen that at themost conservative and optimistic pricing strategies, the ethanol production using VD/BIGCC had the highestinternal rate of returns at 29.42 and 40.74% respectively.
Conclusions: It was shown that bioethanol coproduction from the hemicellulose fractions of sugarcane residues,with electricity cogeneration from cellulose and lignin, is more efficient and economically viable than the exclusiveelectricity generation technologies considered, under the constraints in a South African context.
BackgroundSugarcane processing industries in Southern Africagenerate bagasse at a yield of 0.30 tons per ton of caneprocessed [1]. In most sugar mills in Southern Africa,the generated bagasse is mostly burnt to provide heatand electricity for the sugar milling operations [1,2].South African sugar mills (from crushing to raw sugarproduction) typically have poor efficiency and the averagesteam demand is 0.58 tons per ton of sugarcane processed[3] (58% on cane). When such process designs are coupledwith low efficiency biomass-to-energy conversion systems,then no surplus bagasse is generated by the sugar mill andtherefore no export of electricity occurs [4,5]. If efficient
* Correspondence: [email protected] of Process Engineering, University of Stellenbosch, CnrBanghoek Road & Joubert Street, Stellenbosch 7600, South Africa
© 2014 Petersen et al.; licensee BioMed CentraCommons Attribution License (http://creativecreproduction in any medium, provided the orDedication waiver (http://creativecommons.orunless otherwise stated.
sugar mills that have steam demands below 40% [5,6] arecoupled with efficient systems that convert biomass toenergy [6], then excess bagasse becomes available. Thisexcess, if combined with other post-harvest residues likesugarcane trash, could provide the feedstock for the pro-duction of bio-energetic products in an integrated facility.The costs associated with the utilization of such residueswould include the cost of collection and transport, andthe investment costs required to upgrade the energy effi-ciency of existing sugar mills to enable the liberation ofsurplus bagasse. These costs are significantly lower thanthe purchasing costs of biomass [7] that hinders theeconomic viability of ‘stand-alone’ facilities for biomassconversion to energy [8].The low efficiency biomass-to-energy systems in older
cane milling operations utilized combustion systems that
l Ltd. This is an Open Access article distributed under the terms of the Creativeommons.org/licenses/by/2.0), which permits unrestricted use, distribution, andiginal work is properly credited. The Creative Commons Public Domaing/publicdomain/zero/1.0/) applies to the data made available in this article,
Petersen et al. Biotechnology for Biofuels 2014, 7:105 Page 2 of 19http://www.biotechnologyforbiofuels.com/content/7/1/105
had raised steam to pressures of between 15 and 22 bar[5,9]. Such systems also provided a low cost means ofdisposing of bagasse [1,9] at a time when exporting elec-tricity was not economically interesting. For that means,combustion with high pressure steam cycles allowed forgreater turbine efficiency in the conversion of steam toelectricity and thus, pressures of 82 to 85 bar [1,10]would have typically been preferred. At a pressure of 60bar, it has been shown that a net electricity export of 72kW (per ton of cane processed per hour) was possible foran efficient sugarcane mill, where a steam demand of 0.4tons per ton of cane was required [5]. This amount ofexport electricity could have been increased substantiallyif the harvesting residues (trash) was also considered[5,7,11]. The electrical efficiencies resulting from biomasspower plants utilizing combustion and high pressure steamcycles are reported to be between 23 and 26% on an HHV(Higher Heating Value) basis [12,13], while efficiencies re-ported for Biomass Integrated Gasification and CombinedCycles system (BIGCC) were at 34 to 40% [14]. The imple-mentation of BIGCC in industry has been limited due tothe reportedly high capital investment that is required[12,13,15]. The capital estimates of BIGCC systems inprevious techno-economic assessments [12,13,16] how-ever, were based on the estimates in a period where BIGCCtechnology was still new (1990 to the early 2000s) [17], andthus, capital estimates based on the vendor quotes in thisperiod would have reflected the pioneer plant costs. A cap-ital estimate based on a matured estimate could be signifi-cantly lower than the pioneer estimate [18].As an alternative to the conversion of all of the avail-
able lignocellulose residues to electricity, a fraction ofthe bagasse and post-harvest residues could be used toproduce ethanol, with co-generation of electricity. Thehemicellulose, which makes up about 20 to 35% [19] ofthe biomass matrix, can be solubilized by steam explo-sion or dilute acid hydrolysis and converted to ethanol,while the remaining cellulose-lignin fractions are con-verted to heat and power [20,21]. This scenario for thecoproduction of ethanol and electricity from lignocellu-lose has been proposed for the South African industry[20], but a detailed process flow sheet and techno-economic investigation of such for existing sugar millsis not available. Of particular interest would be thetechno-economic comparison of coproduction of etha-nol and electricity against a scenario where the residuesare used exclusively for electricity generation. Previousstudies have compared electricity generation alone withthe complete lignocellulose conversion to ethanol (hemicel-lulose and cellulose) as options for integration with sugarmills [22] and autonomous distilleries [7,11]. The ethanolgeneration scheme in this study builds on the concept of‘value prior to combustion’ that has previously been evalu-ated as a green-field (stand-alone) scenario [21].
There has been a considerable success in developing mi-crobial strains that efficiently converts pentose-rich hydro-lysates to ethanol [23], which is the key area of importanceif the proposed technology is to be feasible. Using adaptedstrains of a the native pentose fermenting yeast Pichiastipitis, Kurian et al. [24] converted 82.5% of the hemi-cellulose sugars in a hydrolysate derived from sorghumbagasse that contained 92 g/l of dissolved sugars, whileNigam [25] converted 80.0% in an acid hydrolysate fromwheat straw, containing 80 g/l sugars. The developmentof robust recombinant strains, such as the Saccharomycescerevisiae TMB400, have resulted in pentose conversionsin excess of 85% in toxic environments in simultaneoussaccharification and fermentation experiments [26].More recently, the National Renewable Energy Labora-tory (NREL) achieved an ethanol yield of 92% on hemi-cellulose sugars in a toxic enzymatic hydrolysate thatcontained a total of about 150 g/l of sugars, using theZymomonas mobilis strain that was genetically engineeredby Du Pont [27]. Thus, fermentation technology for con-verting pentose sugars in hydrolysates to ethanol has beensuccessfully demonstrated on a laboratory scale.The present study provides a detailed techno-economic
comparison of scenarios that entail ethanol coproductionwith export electricity, produced either by combustion orBIGCC systems, against those that produce only exportelectricity using the same systems. For either scenario,the upgrading costs of the existing sugar mill to achievean energy efficiency of 0.40 ton of steam per ton ofcane, is included in the capital investments consideredin the economic analysis. The development of processmodels for the ethanol coproduction scenario will bebased on established flow sheets and process perfor-mances for lignocellulosic ethanol [28,29], and will alsoconsider various processing options to ensure the mostenergy efficient and economical flow sheet. The projectsare assumed to be in Kwa-Zulu Natal where the sugarcane crushing plants are concentrated. All South Africanlegislations would apply.Energy efficiency for all of the scenarios will be maxi-
mized through pinch point analysis (PPA) for the heat in-tegration of the processing streams [30-32]. This approachwill ensure that the energy utilities for ethanol productionare kept to a minimum [29,30], consequently maximizingthe export electricity while still providing the energyrequirements of the (energy efficient) mill [33]. Fromthe process simulations (mass- and energy-balances) forthe various scenarios economic evaluations, incorporatingcapital and operational costs as well as sales prices, will beperformed from an economic risk perspective [34-37].These methods are based on Monte Carlo simulations thatare super-imposed on standard methods for process eco-nomic methods, in order to account for the risks associ-ated with the fluctuations in economic variables, thereby
Petersen et al. Biotechnology for Biofuels 2014, 7:105 Page 3 of 19http://www.biotechnologyforbiofuels.com/content/7/1/105
providing not only the estimates for investment returns,but also the probability of achieving economic success.
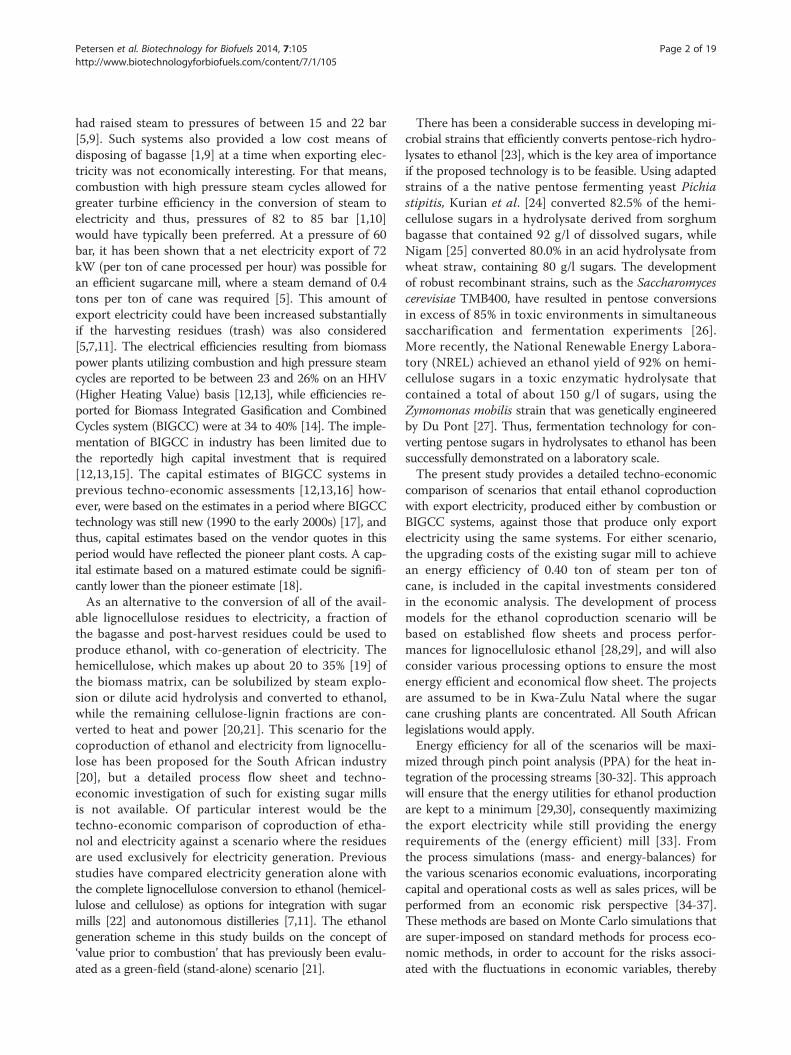
Results and discussionTechnical evaluationSix scenarios for the production of electricity from sugar-cane residues, either as the only energy product or withcoproduction of ethanol from hemicellulose, were evalu-ated through process modelling to estimate process energyefficiency and economics. The results of the energy char-acteristics for the various process alternatives that havebeen optimized by pinch point analysis are presented inTable 1. Furthermore, the amount of steam generated bythe heat and power facility in each scenario, whether thisfacility forms an exclusive electricity scenario or an energygeneration section of an ethanol coproduction scenario,is presented. If the facility utilizes the Combustion withHigh Pressure Steam Cycles (CHPSC) technology, thenthe gross steam generation refers to gross amount ofsteam generated by the biomass-fired boiler. If the heatand power plant utilizes the BIGCC technology then thegross steam generation refers to the steam generated bythe heat recovery steam generator (HRSG) that recoversheat from the gas turbine’s exhaust. The steam contin-gency refers to the amount of steam that is reserved once
Table 1 Bio-energetic product yields, utility demands and eneCHPSC – Ethanol Production with Conventional Distillation wCHPSC; CD/BIGCC – Ethanol production with Conventional Diresidues using BIGCC; VD/CHPSC – Ethanol Production with Vpretreatment residues using CHPSC; VD/BIGCC – Ethanol profrom pretreatment residues using BIGCC; CHPSC-EE – ExclusivCHPSC-EE (Dryer) – Exclusive electricity generation from residExclusive electricity generation from residues using BIGCC)
Ethanol coge
Scenarios CD/CHPSC CD/BIGCC V
Net Outputs
Bioethanol Production (l/hr) 9601 9577
Electricity Production (MW) 22.06 33.94
Steam Generation and Requirements
Gross Steam Generation (tons/hr) 204.58 146.43
Mill Steam Demand (tons/hr) 120.00 120.00
Ethanol Generation Steam Demand (tons/hr) 51.06 51.06
Steam Contingency (tons/hr) 33.53 −24.63
As percentage of Total Steam Demand 19.60 −14.40
Electricity Generation and Requirements
Gross Electricity Generation (MW) 38.52 187.50
Power (MW) 1.17 122.63
Ethanol Utilities (MW) 2.81 18.44
Mill Electricity Demand (MW) 12.49 12.49
Net Energy Efficiency 25.57% 29.17%
all the demands of the sugar mill and ethanol plants (inthe case of ethanol coproduction scenarios) are met, andis essentially an indication of the operating leeway the sce-nario offers in terms of meeting steam when fluctuationsin the plant occur. According to Pellegrini et al. [38], themaximum fluctuation of the steam demand in a sugar millwas measured at 2%.The ethanol production rate of all the coproduction
scenarios averages 9591 l/hr, which would equate to 62million liters per annum. Given that the total consump-tion of road transport fuel in South Africa is about 23billion liters per annum [39], this production rate wouldrepresent 0.27% of road transport fuels. This productionrate equates to an ethanol yield of 35 liters per ton ofcane crushed, where the hemicellulose fraction of thebagasse and 50% of the trash generated is converted toethanol. With regards to the exclusive electricity gener-ation, the BIGCC-EE and CHPSC-EE (EE - exclusive elec-tricity production using BIGCC and CHPSC respectively)scenarios generated 88.63 MW and 53.43 ± 2.43 MW ofelectricity (MWe) respectively. Given that the total outputof electricity supplied to the national grid is 34 GW [40],then the contribution to the grid would be 0.22% and0.13% for the BIGCC-EE and CHPSC-EE respectively. Thecoproduction of ethanol with electricity from sugarcane
rgy efficiencies (optimized by pinch point analysis) (CD/ith energy generation from pretreatment residues usingstillation with energy generation from pretreatmentacuum Distillation with energy generation fromduction with Vacuum Distillation with energy generatione electricity generation from residues using CHPSC;ues using CHPSC where biomass is dried; BIGCC-EE –
neration Exclusive electricity
D/CHPSC VD/BIGCC CHPSC-EE CHPSC –EE (Dryer) BIGCC-EE
9599 9575
23.42 46.47 51.00 55.85 88.63
204.58 146.42 277.22 294.71 191.98
120.00 120.00 120.00 120.00 120.00
30.25 30.25
54.34 −3.83 157.22 174.71 71.98
36.17 −2.55 131.02 145.59 59.99
40.76 187.51 65.49 70.50 263.36
1.36 122.63 2.00 2.15 162.24
3.49 5.91
12.49 12.49 12.49 12.49 12.49
25.98% 32.91% 15.44% 16.86% 26.83%
Petersen et al. Biotechnology for Biofuels 2014, 7:105 Page 4 of 19http://www.biotechnologyforbiofuels.com/content/7/1/105
residues available at sugar mills would reduce the potentialelectrical export by approximately 54% on average.With regards to the steam generation and demand, it
is seen that the gross generation of steam in the BIGCC-EE process is 32.86% less than the amount of the CHPSC-EE process, primarily because BIGCC technology is meantto maximize electricity generation, rather than steam gen-eration. The steam generated by the heat and power gen-eration facilities of the ethanol coproduction scenarios are28.4% lower when compared to their exclusive electricitycounterparts. The major implication of this reduction forsteam generation was that when BIGCC technology wascoupled with ethanol coproduction, the combined steamdemand of the sugar mill and the ethanol generationprocess exceeded the steam generated. This penalized theelectricity generated by the ethanol-BIGCC scenarios,as electricity was needed internally for heating pur-poses, at a rate of 2.43 MW and 15.63 MW for the VD/BIGCC and CD/BIGCC respectively. Thus, the vacuumdistillation scenarios offered a more feasible operatingscenario when BIGCC technology was considered, asthe lower steam consumption minimized the electricityconsumed for heating purposes.A further comparison of vacuum and conventional dis-
tillation shows that the application of vacuum distillationallowed for an extra 1.36 MW of electricity to be availablefor export (comparing CD/CHPSC and VD/CHPSC). Thiswas because the lower steam demand of the vacuum dis-tillation system on the steam utilities allowed for moresteam to expand through the exhaust steam turbine ofthe condensing extraction steam turbine (CEST). Fur-thermore, the multi-effect system also relieved the coolingduty of the condenser of the rectifier column, and thus, nofurther electricity was needed to deliver this cooling duty.So even though there was an additional process electricityrequirement for the vacuum pump that actuated themulti-effect distillation, the reduction in utility require-ments exceeded the requirement, which then resultedin a net positive electricity export.The energy efficiencies reported in Table 1 were based
on the net export of the bio-energetic products, which isthe ethanol sold and the electricity exported to the gridafter the mill requirements were accounted for. Generally,ethanol scenarios with BIGCC technology had the greatestnet export efficiency, followed by that of the BIGCC-EE,which was comparable to the ethanol-CHPSC scenarios,and the lowest being the CHPSC-EE scenario. The reduc-tion in steam consumption in vacuum distillation whenCHPSC and BIGCC technology are used for energy gener-ation is shown to improve the export electricity efficiencyby 0.41% and 3.74% respectively. The improvement whenBIGCC technology was integrated with vacuum distilla-tion is explained by the lower amount of electricity con-sumed internally for heating purposes. The lowest export
energy efficiency was attained by the CHPSC-EE scenario,due to the large amount of exhaust steam still presentafter the steam demand of the sugar mill was accountedfor. The energy contained in this steam is mostly spent tothe environment by the surface condenser. If a biomassdryer was used to de-moisture the biomass prior tocombustion, as in the case of the CHPSC-EE, then theexport efficiency improved by 1.42% because the steamand electricity generation had improved by 6.14% and7.65% respectively.In order to assess the benefits of pinch point analysis
(PPA), values in Table 1 are compared with the corre-sponding values in Table 2. Table 2 does not reportvalues for the exclusive electricity scenarios because ef-fective heat integration is implicit in the overall designof these processes. Regarding the CHPSC-EE, the designof Nsaful et al. [41], which is the source model for theCHPSC technology, was already optimized with PPA.As for the BIGCC-EE, PPA confirmed the heat integra-tion strategies that have previously been implemented,such as the cooling of the syngas to heat up air for thegasifier, improving steam generation, and also using theinter-cooler duty of the multistage compressor to im-prove steam generation [37].The comparison between Tables 1 and 2 shows that the
potential for exporting electricity from the ethanol-BIGCCscenarios are reduced by a margin of 30 to 38% if PPA isnot applied, mainly because the increase in steam demandresulted in more electricity consumed for heating pur-poses. Thus, the primary advantage of PPA is the reduc-tion of steam and electrical utilities, which then resultedin the net export of more electricity, and the general im-provement in the export energy efficiencies by 0.98% and3.99% for ethanol-CHPSC and ethanol-BIGCC scenariosrespectively. The effect of PPA on the scenario employingconventional distillation seems more apparent because thevacuum distillation already affected a substantial reductionin utilities by inducing multi-effect distillation.
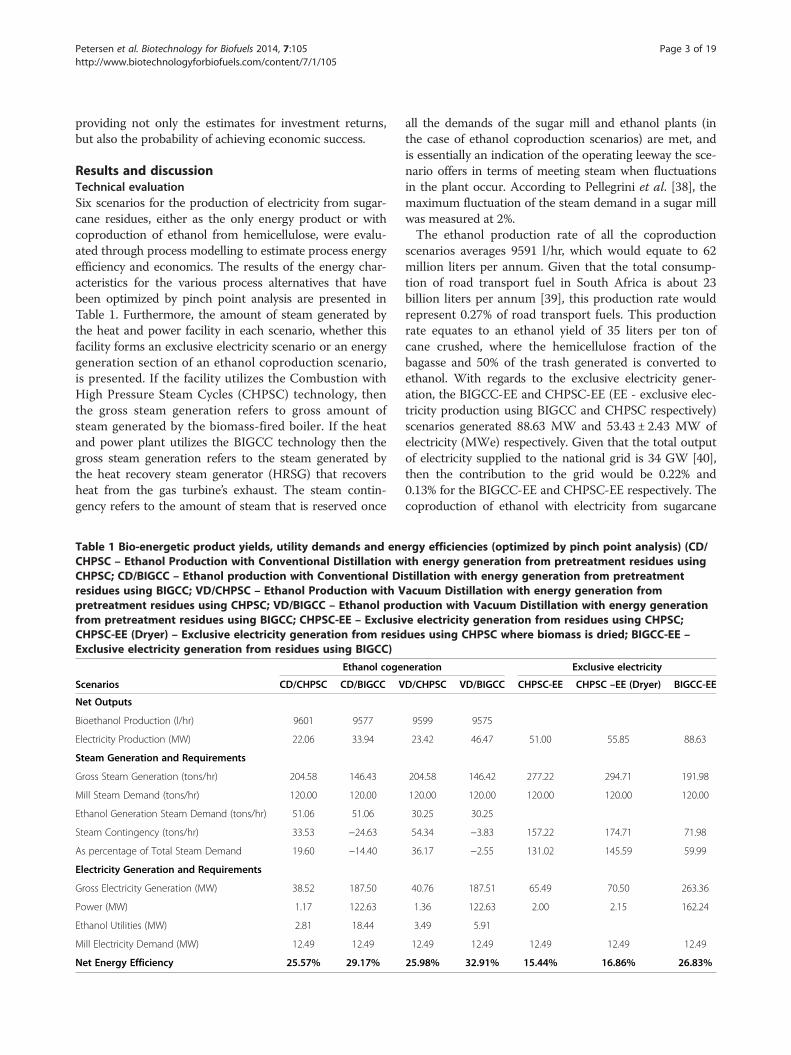
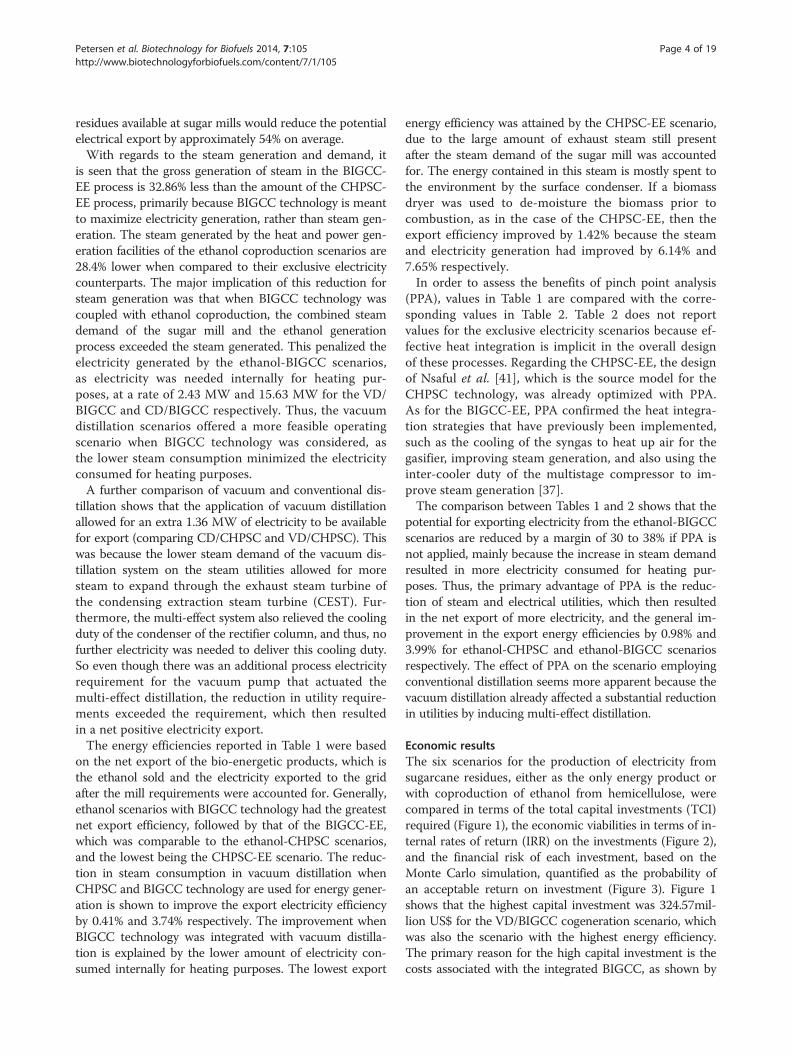
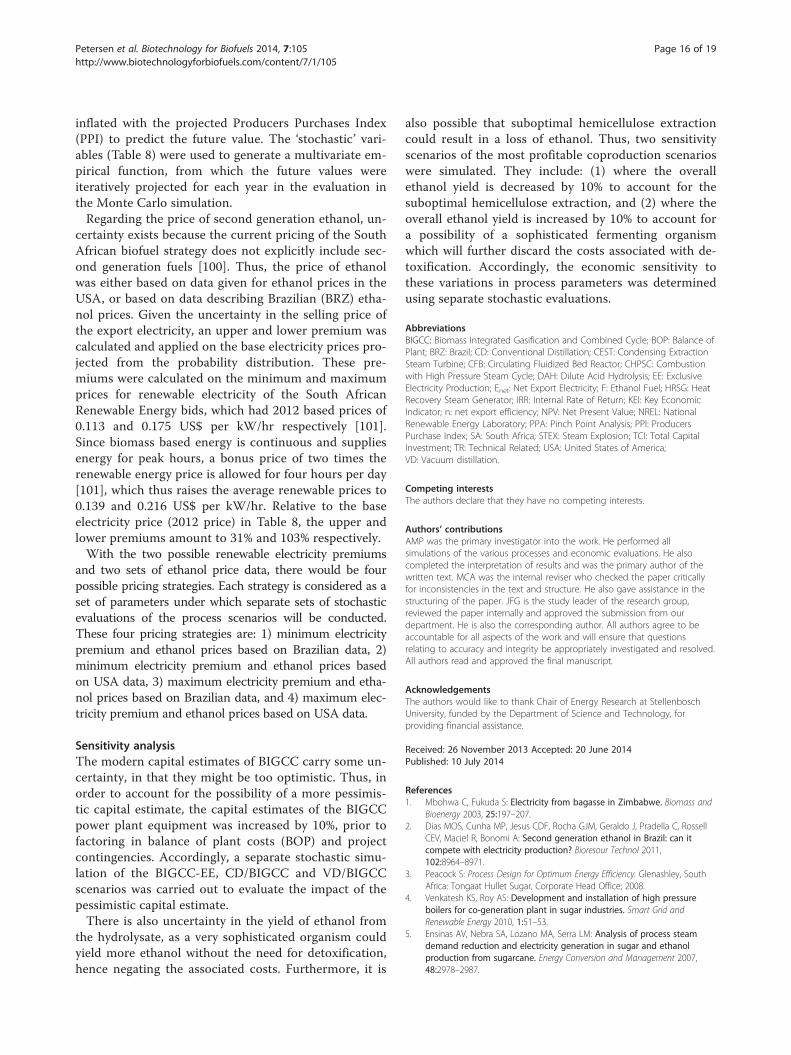
Economic resultsThe six scenarios for the production of electricity fromsugarcane residues, either as the only energy product orwith coproduction of ethanol from hemicellulose, werecompared in terms of the total capital investments (TCI)required (Figure 1), the economic viabilities in terms of in-ternal rates of return (IRR) on the investments (Figure 2),and the financial risk of each investment, based on theMonte Carlo simulation, quantified as the probability ofan acceptable return on investment (Figure 3). Figure 1shows that the highest capital investment was 324.57mil-lion US$ for the VD/BIGCC cogeneration scenario, whichwas also the scenario with the highest energy efficiency.The primary reason for the high capital investment is thecosts associated with the integrated BIGCC, as shown by
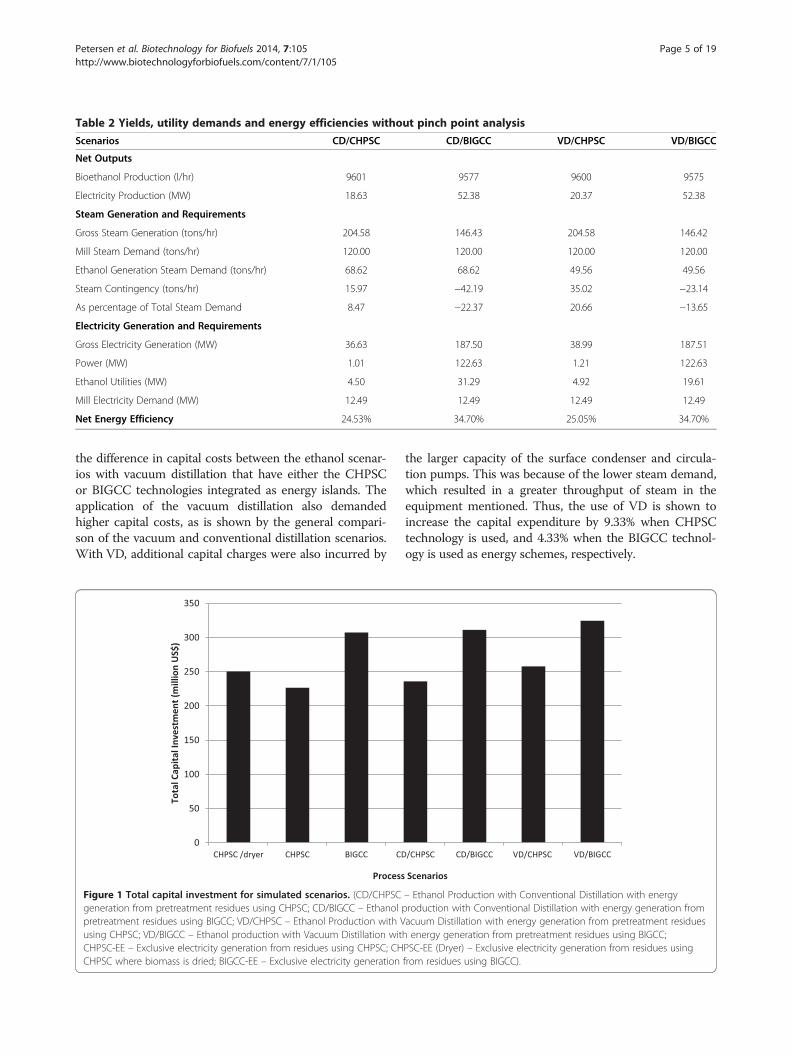
Table 2 Yields, utility demands and energy efficiencies without pinch point analysis
Scenarios CD/CHPSC CD/BIGCC VD/CHPSC VD/BIGCC
Net Outputs
Bioethanol Production (l/hr) 9601 9577 9600 9575
Electricity Production (MW) 18.63 52.38 20.37 52.38
Steam Generation and Requirements
Gross Steam Generation (tons/hr) 204.58 146.43 204.58 146.42
Mill Steam Demand (tons/hr) 120.00 120.00 120.00 120.00
Ethanol Generation Steam Demand (tons/hr) 68.62 68.62 49.56 49.56
Steam Contingency (tons/hr) 15.97 −42.19 35.02 −23.14
As percentage of Total Steam Demand 8.47 −22.37 20.66 −13.65
Electricity Generation and Requirements
Gross Electricity Generation (MW) 36.63 187.50 38.99 187.51
Power (MW) 1.01 122.63 1.21 122.63
Ethanol Utilities (MW) 4.50 31.29 4.92 19.61
Mill Electricity Demand (MW) 12.49 12.49 12.49 12.49
Net Energy Efficiency 24.53% 34.70% 25.05% 34.70%
Petersen et al. Biotechnology for Biofuels 2014, 7:105 Page 5 of 19http://www.biotechnologyforbiofuels.com/content/7/1/105
the difference in capital costs between the ethanol scenar-ios with vacuum distillation that have either the CHPSCor BIGCC technologies integrated as energy islands. Theapplication of the vacuum distillation also demandedhigher capital costs, as is shown by the general compari-son of the vacuum and conventional distillation scenarios.With VD, additional capital charges were also incurred by
0
50
100
150
200
250
300
350
CHPSC /dryer CHPSC BIGCC CD
Tota
l Cap
ital I
nves
tmen
t (m
illio
n U
S$)
Process
Figure 1 Total capital investment for simulated scenarios. (CD/CHPSCgeneration from pretreatment residues using CHPSC; CD/BIGCC – Ethanolpretreatment residues using BIGCC; VD/CHPSC – Ethanol Production with Vusing CHPSC; VD/BIGCC – Ethanol production with Vacuum Distillation witCHPSC-EE – Exclusive electricity generation from residues using CHPSC; CHCHPSC where biomass is dried; BIGCC-EE – Exclusive electricity generation
the larger capacity of the surface condenser and circula-tion pumps. This was because of the lower steam demand,which resulted in a greater throughput of steam in theequipment mentioned. Thus, the use of VD is shown toincrease the capital expenditure by 9.33% when CHPSCtechnology is used, and 4.33% when the BIGCC technol-ogy is used as energy schemes, respectively.
/CHPSC CD/BIGCC VD/CHPSC VD/BIGCC
Scenarios
– Ethanol Production with Conventional Distillation with energyproduction with Conventional Distillation with energy generation fromacuum Distillation with energy generation from pretreatment residuesh energy generation from pretreatment residues using BIGCC;PSC-EE (Dryer) – Exclusive electricity generation from residues usingfrom residues using BIGCC).

0%
5%
10%
15%
20%
25%
30%
35%
40%
45%
MinElect&BRZ.Etoh MinElect&USA.Etoh MaxElect&BRZ.etoh MaxElect&USA.Etoh
Mea
n IR
R (
%)
Product Pricing Strategy
CHPSC CHPSC-DRYER BIGCC CD - CHPSC VD - CHPSC VD - BIGCC CD-BIGCC
Figure 2 Comparison of processes profitability at varies strategies. “Mean IRR” refers to the average of the IRRs determined from eachiteration of the Financial Risk Simulation.
Petersen et al. Biotechnology for Biofuels 2014, 7:105 Page 6 of 19http://www.biotechnologyforbiofuels.com/content/7/1/105
The TCI of BIGCC-EE, which was based on a modernestimate [42], is 28.89% higher than the average TCI ofCHPSC-EE. This difference is much less than thoseattained in previous comparative studies that based theBIGCC capital estimates on pioneer costs. The relativedifference between BIGCC and the CHPSC technologiesin Dornburg et al. [43] and Bridgwater et al. [12] wasabout 50% and 77% respectively. The difference in thecomparison by Bridgewater et al. [12] had been excep-tionally large, since the scale on which the comparisonwas based was a 20 MWe. Trends shown by Bridgewateret al. [12] and Dornburg et al. [43] have indicated thatthe difference gets smaller as the scale increases.With regards to exclusive electricity production, it is
shown (Figure 2) that the lowest IRRs were attained bythe CHPSC-EE scenario, both inclusive and exclusive of
0%
20%
40%
60%
80%
100%
120%
MinElect&BRZ.Etoh MinElect&USA.E
Pro
bab
ility
IRR
<25
% (
%)
Prod
CHPSC CHPSC-DRYER BIGCC CD - CHP
Figure 3 Evaluation of financial risk at varies pricing strategies. The vsimulated for each scenario will fall below a standard value of 25% for the
the biomass dehydration prior to combustion. The IRRsobtained for the combustion scenarios did not differ sig-nificantly from each other, and on average were 22.38%(±0.98%) and 35.20% (±0.97%) at the minimum and max-imum premiums on electricity, respectively. In either case,the higher value was obtained when no dryer was consid-ered. Thus, the energy efficiency gained by employing abiomass dryer was not economically justified, due to theincreased capital expenditure. The IRR attained by theBIGCC-EE is 7% and 6% higher than those attained bythe CHPSC-EE scenario, when the minimum and max-imum premiums on electricity were considered, respect-ively. In previous studies where the capital estimates ofthe BIGCC technology were based on pioneer quotes, theprofitability of CHPSC technology was generally higher[12,43]. As the capital estimate of the BIGCC technology
toh MaxElect&BRZ.etoh MaxElect&USA.Etoh
uct Pricing Strategy
SC VD - CHPSC VD - BIGCC CD-BIGCC
alue on the vertical axis describes the probability to which the IRRsIRR.
Petersen et al. Biotechnology for Biofuels 2014, 7:105 Page 7 of 19http://www.biotechnologyforbiofuels.com/content/7/1/105
in this study was based on a modern estimate, it showsthat BIGCC-EE became more favorable, which had alsobeen demonstrated by Searcy and Flynn [15].It was calculated that on average, the ethanol prices
projected from Brazilian data were 47% greater thanthose based on US data, and therefore the overall mini-mum pricing strategy was the minimum electricity pre-mium for electricity with US-based ethanol prices. Atthis pricing scenario, the highest profitability of theethanol scenarios was attained by the VD/BIGCC. Theeconomic feasibility of integrating BIGCC technologyas the heat and power system of ethanol coproductionis advantageous over the CHPSC technology as theprofitability of the VD/BIGCC was higher than the VD/CHPSC. This result was expected since the BIGCC-EEwas more profitable than the CHPSC-EE when the ex-clusive electricity scenarios were compared due to thelarger surplus of electricity. With regards to the imple-mentation of VD, the IRR of the VD/CHPSC scenariowas 1.05% lower than that of the CD/CHPSC, whereasthe IRR of the VD/BIGCC was 1.48% higher than theCD/BIGCC. Thus, VD was not justified by the additionalcapital costs when integrated with CHPSC technology, butwas more profitable when integrated with BIGCC technol-ogy. Due to the high amount of electricity that was neededfor heating purposes in the CD/BIGCC scenario, the IRRswas lower than the VD/BIGCC, even though the capitalexpenditure was less.When the maximum electricity premium was consid-
ered, the IRR of the BIGCC-EE was 1.59% higher thanthe most profitable ethanol scenario (VD/BIGCC) ob-tained with the higher (Brazilian) ethanol prices. Underthe lower (US) ethanol pricing, the BIGCC-EE was5.44% higher than the VD/BIGCC scenario (still themost profitable of the ethanol scenarios). Regardingthe maximum electrical premium however, the IRRsshown in Figure 2 for exclusive electricity scenarios arewell in excess of the standard IRR of 17% that is im-posed by the National Energy Regulator of South Af-rica (NERSA) for independent power producers (IPPs)[44]. In order to diversify the renewable energy contri-bution of the South African electricity supply (for ex-ample, from solar or wind), the prices paid to IPPs areregulated by NERSA to maintain an IRR of 17%, inorder to promote equal investment opportunity in thevarious forms of renewable electricity [44]. Thus, asboth the BIGCC-EE and CHPSC-EE are shown to meetthis target at the minimum electricity premium, ahigher price for electricity generated in the sugar millswould not be allowed.With regards to assessing the scenarios from a financial
risk perspective (Figure 3), the maximum occurrence atwhich the IRR can be less than 25% (which is known toattract the interests of private investors [36,45]) was a
probability of 20% [41]. This qualification of 20% is anextension of a general criterion applied for the max-imum probability of the net present value (NPV) beingless than zero [41]. At the optimistic pricing scenarios,where high premiums on electricity are considered, allscenarios would be attractive for private investment(Figure 3) when the IRRs are evaluated against the IRRstandard of 25%. An evaluation at the minimum pricingscenario showed that all ethanol coproduction scenariosqualified for private investment, since the risks associatedwith an unfavorable return for private investment weregenerally less than 1%. The maximum risks were attachedto exclusive electricity production involving combustion,as the probabilities of the IRR falling below the standardof 25% were above 80.82% for the CHPSC-EE without dry-ing and 98.96% with drying.The status of the high risk imposed by the exclusive
electricity scenarios to private investment would not im-prove due to restrictions imposed by NERSA on IPPs inrespect of the standard IRR of 17%. However, sensitivityin the ethanol prices could allow for private investmentthat is virtually risk free when coproduction of ethanol isconsidered, as shown when ethanol prices are projectedfrom the Brazilian data. Under that circumstance, the risksof an unfeasible return for a private investor for all theethanol scenarios are acceptable, even when the minimumpremium for electricity is considered.
Comparison of the present study with similar studies inpublished literatureSince the CHPSC-EE scenario was modelled on the flowsheet of Nsaful et al. [41], the results of this scenariowas validated with the technical and economic results ofthe scenario using combustion and 82 bar steam cycle,in that study. The export efficiency calculated based onthe electrical export of 86.02 kW per ton of cane amountsto 12.70%, which is lower than the export efficiency of15.44% reported for the CHPSC-EE of this study. The ex-port efficiency of this study is higher because the electri-city generation was supplemented with sugarcane trash,which improved the amount of electricity available for ex-port. The IRR reported for the process modelled by Nsafulet al. [41] was 29%, when a bagasse and electricity price of56 US$/dry ton (data from 2010) and 0.248 U$ per kWhrare considered respectively. Under these conditions, themodel in this study yielded an IRR of 41.82%. The opti-mistic outcome arose because the supplementation bytrash improved the export electricity to 170.01 kW perton of cane processed. Furthermore, the incorporation oftrash, which costs just 30% of the bagasse price, reducesthe average specific cost paid for biomass in the model ofthis study to 41.53 U$/dry ton (data from 2010).The BIGCC-EE scenario was compared with the re-
sults of Craig and Mann [46], who conducted a techno-
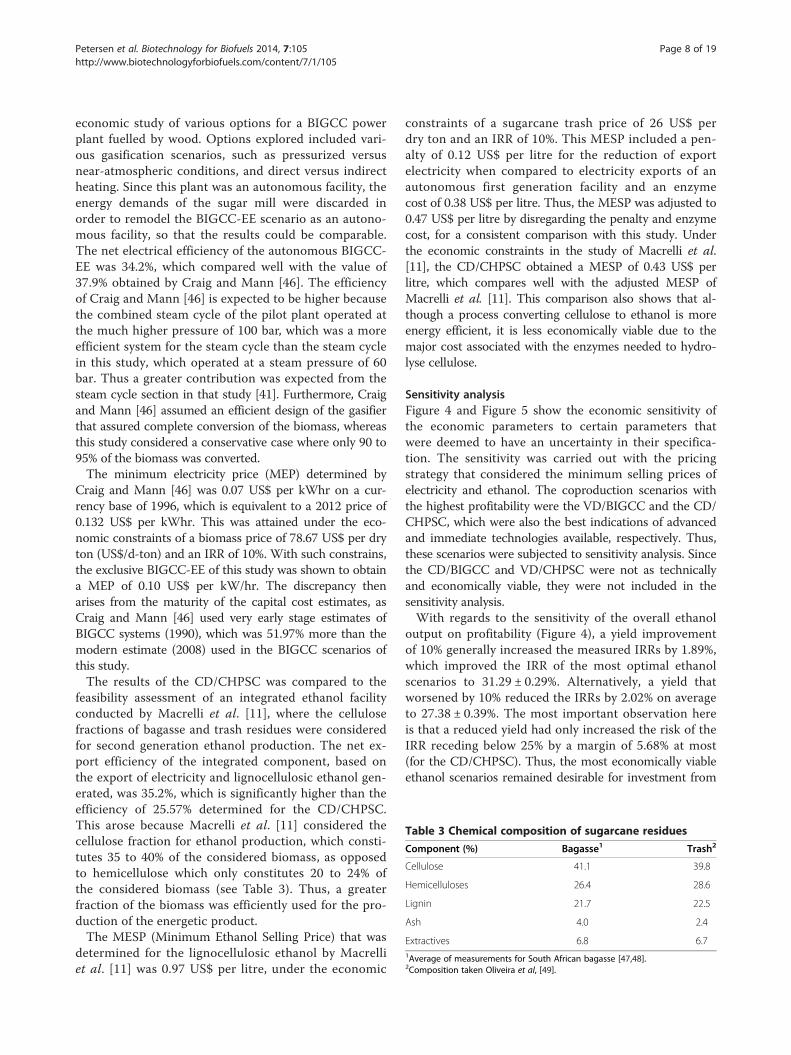
Table 3 Chemical composition of sugarcane residues
Component (%) Bagasse1 Trash2
Cellulose 41.1 39.8
Hemicelluloses 26.4 28.6
Lignin 21.7 22.5
Ash 4.0 2.4
Extractives 6.8 6.71Average of measurements for South African bagasse [47,48].2Composition taken Oliveira et al, [49].
Petersen et al. Biotechnology for Biofuels 2014, 7:105 Page 8 of 19http://www.biotechnologyforbiofuels.com/content/7/1/105
economic study of various options for a BIGCC powerplant fuelled by wood. Options explored included vari-ous gasification scenarios, such as pressurized versusnear-atmospheric conditions, and direct versus indirectheating. Since this plant was an autonomous facility, theenergy demands of the sugar mill were discarded inorder to remodel the BIGCC-EE scenario as an autono-mous facility, so that the results could be comparable.The net electrical efficiency of the autonomous BIGCC-EE was 34.2%, which compared well with the value of37.9% obtained by Craig and Mann [46]. The efficiencyof Craig and Mann [46] is expected to be higher becausethe combined steam cycle of the pilot plant operated atthe much higher pressure of 100 bar, which was a moreefficient system for the steam cycle than the steam cyclein this study, which operated at a steam pressure of 60bar. Thus a greater contribution was expected from thesteam cycle section in that study [41]. Furthermore, Craigand Mann [46] assumed an efficient design of the gasifierthat assured complete conversion of the biomass, whereasthis study considered a conservative case where only 90 to95% of the biomass was converted.The minimum electricity price (MEP) determined by
Craig and Mann [46] was 0.07 US$ per kWhr on a cur-rency base of 1996, which is equivalent to a 2012 price of0.132 US$ per kWhr. This was attained under the eco-nomic constraints of a biomass price of 78.67 US$ per dryton (US$/d-ton) and an IRR of 10%. With such constrains,the exclusive BIGCC-EE of this study was shown to obtaina MEP of 0.10 US$ per kW/hr. The discrepancy thenarises from the maturity of the capital cost estimates, asCraig and Mann [46] used very early stage estimates ofBIGCC systems (1990), which was 51.97% more than themodern estimate (2008) used in the BIGCC scenarios ofthis study.The results of the CD/CHPSC was compared to the
feasibility assessment of an integrated ethanol facilityconducted by Macrelli et al. [11], where the cellulosefractions of bagasse and trash residues were consideredfor second generation ethanol production. The net ex-port efficiency of the integrated component, based onthe export of electricity and lignocellulosic ethanol gen-erated, was 35.2%, which is significantly higher than theefficiency of 25.57% determined for the CD/CHPSC.This arose because Macrelli et al. [11] considered thecellulose fraction for ethanol production, which consti-tutes 35 to 40% of the considered biomass, as opposedto hemicellulose which only constitutes 20 to 24% ofthe considered biomass (see Table 3). Thus, a greaterfraction of the biomass was efficiently used for the pro-duction of the energetic product.The MESP (Minimum Ethanol Selling Price) that was
determined for the lignocellulosic ethanol by Macrelliet al. [11] was 0.97 US$ per litre, under the economic
constraints of a sugarcane trash price of 26 US$ perdry ton and an IRR of 10%. This MESP included a pen-alty of 0.12 US$ per litre for the reduction of exportelectricity when compared to electricity exports of anautonomous first generation facility and an enzymecost of 0.38 US$ per litre. Thus, the MESP was adjusted to0.47 US$ per litre by disregarding the penalty and enzymecost, for a consistent comparison with this study. Underthe economic constraints in the study of Macrelli et al.[11], the CD/CHPSC obtained a MESP of 0.43 US$ perlitre, which compares well with the adjusted MESP ofMacrelli et al. [11]. This comparison also shows that al-though a process converting cellulose to ethanol is moreenergy efficient, it is less economically viable due to themajor cost associated with the enzymes needed to hydro-lyse cellulose.
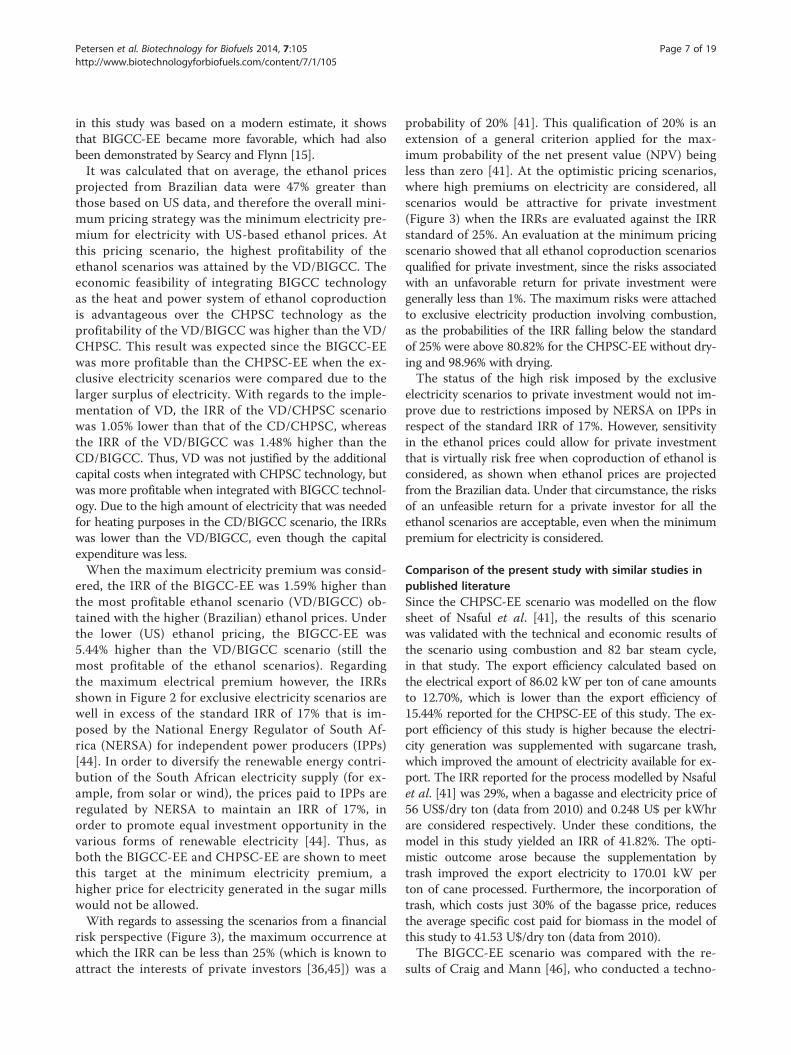
Sensitivity analysisFigure 4 and Figure 5 show the economic sensitivity ofthe economic parameters to certain parameters thatwere deemed to have an uncertainty in their specifica-tion. The sensitivity was carried out with the pricingstrategy that considered the minimum selling prices ofelectricity and ethanol. The coproduction scenarios withthe highest profitability were the VD/BIGCC and the CD/CHPSC, which were also the best indications of advancedand immediate technologies available, respectively. Thus,these scenarios were subjected to sensitivity analysis. Sincethe CD/BIGCC and VD/CHPSC were not as technicallyand economically viable, they were not included in thesensitivity analysis.With regards to the sensitivity of the overall ethanol
output on profitability (Figure 4), a yield improvementof 10% generally increased the measured IRRs by 1.89%,which improved the IRR of the most optimal ethanolscenarios to 31.29 ± 0.29%. Alternatively, a yield thatworsened by 10% reduced the IRRs by 2.02% on averageto 27.38 ± 0.39%. The most important observation hereis that a reduced yield had only increased the risk of theIRR receding below 25% by a margin of 5.68% at most(for the CD/CHPSC). Thus, the most economically viableethanol scenarios remained desirable for investment from
-4.00% -2.00% 0.00% 2.00% 4.00% 6.00% 8.00%
IRR (VD/BIGCC)
Pr(IRR<25) (VD/BIGCC)
IRR (CD/CHPSC)
Pr(IRR<25) (CD/CHPSC)
Sensitivity of the Ethanol Yield on Economic Performance
effects from -10% in ethanol yield effects from +10% in ethanol yield
Figure 4 Sensitivity of the ethanol yield on the VD/BIGCC and CD/CHPSC scenarios. IRR – Rate of Return; Pr(IRR<25) – probability of IRRfalling below 25%.
Petersen et al. Biotechnology for Biofuels 2014, 7:105 Page 9 of 19http://www.biotechnologyforbiofuels.com/content/7/1/105
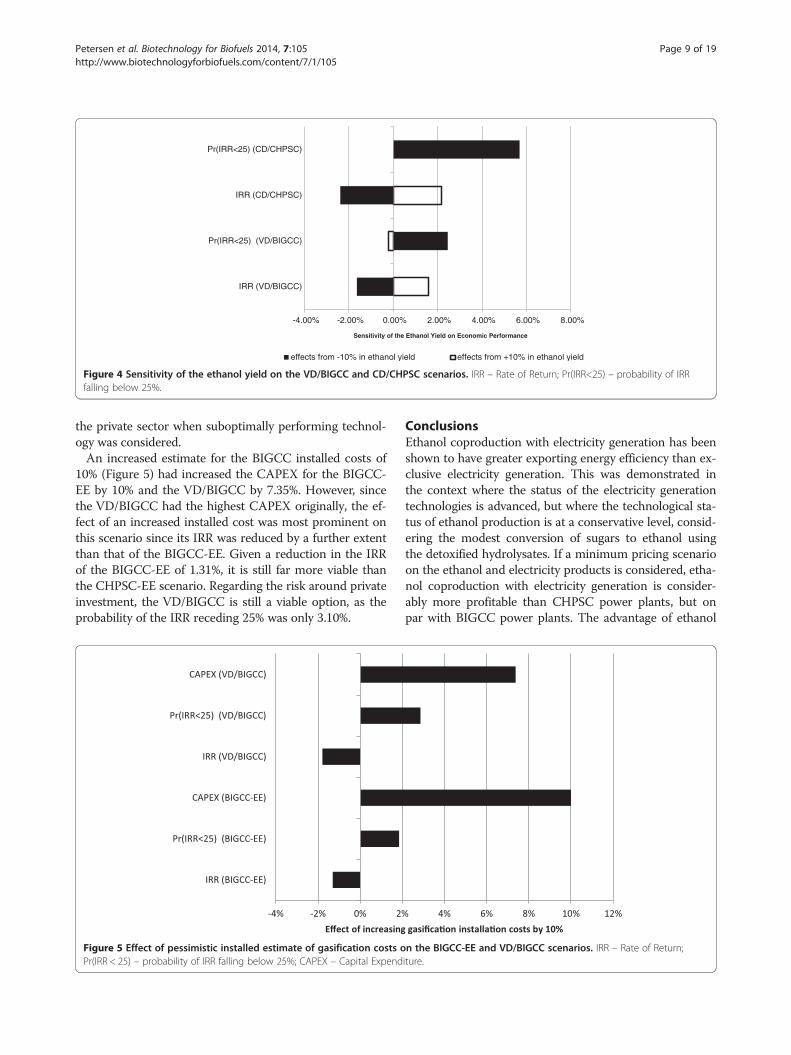
the private sector when suboptimally performing technol-ogy was considered.An increased estimate for the BIGCC installed costs of
10% (Figure 5) had increased the CAPEX for the BIGCC-EE by 10% and the VD/BIGCC by 7.35%. However, sincethe VD/BIGCC had the highest CAPEX originally, the ef-fect of an increased installed cost was most prominent onthis scenario since its IRR was reduced by a further extentthan that of the BIGCC-EE. Given a reduction in the IRRof the BIGCC-EE of 1.31%, it is still far more viable thanthe CHPSC-EE scenario. Regarding the risk around privateinvestment, the VD/BIGCC is still a viable option, as theprobability of the IRR receding 25% was only 3.10%.
-4% -2% 0% 2%
IRR (BIGCC-EE)
Pr(IRR<25) (BIGCC-EE)
CAPEX (BIGCC-EE)
IRR (VD/BIGCC)
Pr(IRR<25) (VD/BIGCC)
CAPEX (VD/BIGCC)
Effect of increasing
Figure 5 Effect of pessimistic installed estimate of gasification costs oPr(IRR < 25) – probability of IRR falling below 25%; CAPEX – Capital Expend
ConclusionsEthanol coproduction with electricity generation has beenshown to have greater exporting energy efficiency than ex-clusive electricity generation. This was demonstrated inthe context where the status of the electricity generationtechnologies is advanced, but where the technological sta-tus of ethanol production is at a conservative level, consid-ering the modest conversion of sugars to ethanol usingthe detoxified hydrolysates. If a minimum pricing scenarioon the ethanol and electricity products is considered, etha-nol coproduction with electricity generation is consider-ably more profitable than CHPSC power plants, but onpar with BIGCC power plants. The advantage of ethanol
4% 6% 8% 10% 12% gasifica�on installa�on costs by 10%
n the BIGCC-EE and VD/BIGCC scenarios. IRR – Rate of Return;iture.
Petersen et al. Biotechnology for Biofuels 2014, 7:105 Page 10 of 19http://www.biotechnologyforbiofuels.com/content/7/1/105
coproduction would become more pronounced as fermen-tation technology develops and matures as expected, andit would also become attractive for private investment. Ifthe fermentation of hemicellulose hydrolysates (thoughsuccessful on a bench-scale) can demonstrate that a pilot-scale conversion of at least 82.5% sugar to ethanol can beattained, it will confirm the technology proposed.While a high premium on electricity would promote
exclusive electricity production when ethanol prices areat a minimum, it is not likely that these premiums onelectricity would be attained under the current regulationsfor renewable electricity in South Africa. The reason is be-cause even at lower premiums, the IRR of the BIGCC-EEwas 30%, whereas the prices of electricity for IPPs areregulated to allow for a maximum IRR of 17%.The study showed that at the current scale, additional
capital investments for more energy efficient technologyis only justified when it effects a significant improvementin energy efficiency, as shown when BIGCC technologyis used instead of the direct combustion in the ethanolcoproduction schemes. Furthermore, it was found thatwhen a more energy efficient technology only effected aminor improvement in energy efficiency, such as VD ap-plied in the ethanol coproduction process or biomass de-hydration in a combustion process, the economic returnsdid not justify the capital investment. There would be situ-ations however, where the energy intensity of the processwould demand the implementation of such measures, ei-ther to reduce process steam demand or improve steamgeneration to a feasible operating range.
MethodsBasis for simulation and assumptionsAll of the scenarios analyzed in the present study assumethat the steam demand of the sugar mill itself will be 0.4tons per ton of cane processed The capital investments re-quired to upgrade existing sugar mills in South Africa toachieve this level of energy efficiency has been estimatedat US$ 17.32 million [3,50] (in 2012) for a 300 ton perhour crushing rate. The technical measures included theoptimisation of imbibitions rate to reduce the amount ofevaporation needed [50]; the conversion from the batchpans to continuous pans and reduce the pan movementwater [3,9,50]; using a five-effect evaporator where vapouris bled to the vacuum pans at a lower effect [9]; optimisa-tion of the flashing of condensates for steam recovery [50]and finally; electrifying the turbine drivers [3,4].The cane crushing capacities of mills in South Africa
range from 190 to 600 tons per hour [51,52], and thusthe representative average of 300 tons per hour was as-sumed for the present study. Based on a fibre content of0.14 kg/kg of cane [5], 42 tons per hour of bagassewould be generated from the cane crushing activities forenergy generation. Of the total harvesting residues,
amounting to 1.167 kg per kg of bagasse [53], 50% ofthis amount would be collected and co-fed with all thebagasse into an ‘energy island’ in the mill to generate theenergy requirements of the mill (40% steam on cane [41]and 41.64 kWe [4] per ton of cane) and the export en-ergy products. The composition of the residues is shownin Table 3.
Process technology considerationsExclusive electricity generation from lignocellulosic biomassNsaful et al. [41] developed a flow sheet for the conversionof bagasse from a sugarcane milling operation to steamand electricity with a high pressure steam system usingcombustion (Figure 6). They found that the optimumboiler pressure for efficient electricity generation was 82bar. Based on the net amount of export electricity, theelectrical generation efficiency was 21.5% for 82 bar and20% for 63 bar. Conversations with experts in the SouthAfrican sugar industry indicate that the design pressurefor boilers which will be used to retrofit the sugar mills is86 bar. Consequently, a boiler pressure of 86 bar is as-sumed in this study. Conventionally, biomass would enterthe combustor at about 45% moisture, though it could alsobe dried with flue gas to improve the boiler efficiency, withadditional capital charges. The minimum acceptable mois-ture content for bagasse is 30%, so as to avoid self-ignitionand/or a dust explosion [54]. Excess air is provided tothe boiler, which has been preheated to 250°C [41] bythe stack gas, to improve the overall efficiency. Theamount of air in excess is determined to ensure a mini-mum oxygen content of 6% in the flue gas, as per environ-mental regulations [55].The boiler would generate superheated steam at about
515°C [10] and 86 bar that would be expanded in a CESTto generate electricity. The intermediate pressures in theCEST are 13 and 4 bar, and the final vacuum pressure is0.2 bar [56]. The vacuum steam would then be condensedand returned to the steam cycle. Steam for the mill wouldbe extracted from the CEST at 4 bar. Regarding theperformance of the turbines, the isentropic efficiencywas 85% while the combined mechanical and electricalefficiencies were set at 96.06% (i.e. 98% for electricaland 98% for mechanical [57]).The general flow sheet of the BIGCC system (Figure 7)
for biomass conversion to electricity was adapted frommodels developed by the NREL [46,58] and previous re-ports [59-61]. The combined bagasse and trash would beinitially dried to a moisture content of 10 to 15% withexhaust flue gasses [59,60]. The moisture content withinthe biomass would serve as the gasification control agent[59] since steam injection is generally not considered forgasifier applications in the BIGCC systems. The amountof air added to the circulating fluidized bed (CFB) gasifierin the BIGCC system is to ensure the highest possible
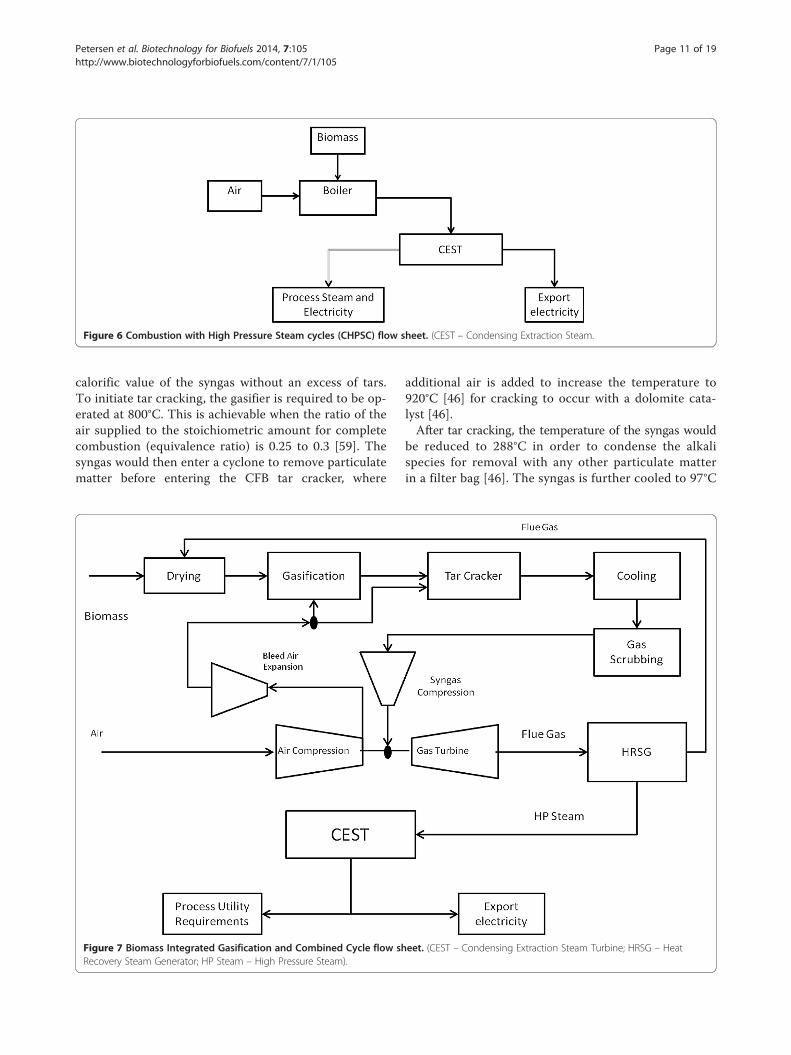
Figure 6 Combustion with High Pressure Steam cycles (CHPSC) flow sheet. (CEST – Condensing Extraction Steam.
Petersen et al. Biotechnology for Biofuels 2014, 7:105 Page 11 of 19http://www.biotechnologyforbiofuels.com/content/7/1/105
calorific value of the syngas without an excess of tars.To initiate tar cracking, the gasifier is required to be op-erated at 800°C. This is achievable when the ratio of theair supplied to the stoichiometric amount for completecombustion (equivalence ratio) is 0.25 to 0.3 [59]. Thesyngas would then enter a cyclone to remove particulatematter before entering the CFB tar cracker, where
Figure 7 Biomass Integrated Gasification and Combined Cycle flow shRecovery Steam Generator; HP Steam – High Pressure Steam).
additional air is added to increase the temperature to920°C [46] for cracking to occur with a dolomite cata-lyst [46].After tar cracking, the temperature of the syngas would
be reduced to 288°C in order to condense the alkalispecies for removal with any other particulate matterin a filter bag [46]. The syngas is further cooled to 97°C
eet. (CEST – Condensing Extraction Steam Turbine; HRSG – Heat
Petersen et al. Biotechnology for Biofuels 2014, 7:105 Page 12 of 19http://www.biotechnologyforbiofuels.com/content/7/1/105
before it is scrubbed with water to remove the nitro-genous and sulfurous compounds for the protection ofdownstream equipment, and to prevent nitrous andsulfurous oxide emissions [46,60]. The scrubbing alsohumidifies the syngas, which assists in the control ofthe temperature in the gas turbine [62].The syngas is compressed in a multi-stage compressor
(two compressors with an inter-stage cooler in-between)to 20 bar, which is 4 bar above the combustion pressureof the gas turbine [63], in order to allow for the pressuredrop across the feed nozzle [61]. At the inter-stage cooler,the syngas was cooled to 97°C at an intermediate pressureof 6 bar, which was determined by the optimization pro-cedure of Polyzakis et al. [63]. The air required for the gasturbine would be compressed in the compressor chamberof the gas turbine, and is fed at a mass ratio of 1:5.14 tothe syngas [64]. In order to compensate for the extra vol-umes of dilution gasses in the syngas that is not found innatural gas, such as CO2 and nitrogen, air would be bledfrom the compressor chamber before the air enters thecombustion chamber [46,60,64] since the gas turbines aredesigned for natural gas which does not contain inert gas-ses. The rate at which air is bled amounts to 13.3% of theair fed to the compression chamber, which is in excess ofthe air demands of the gasifier and cracker. The bleed airwould be expanded through a turbine to atmosphericpressure to improve the net electricity output [60]. Onceexpanded, the air would be preheated to the gasifiertemperature to be used to feed the gasifier and tar cracker.Regarding the efficiency of the gas turbine, the compressorsection has a polytrophic efficiency of 0.87% and the gasturbine has an isentropic efficiency of 89.77% [57]. The
Figure 8 Ethanol coproduction flow sheet. (BIGCC - Biomass IntegratedHigh Pressure Steam Cycle; S/L Separation – Solid Liquid Separation.
mechanical and electrical efficiencies are both set at98% [57].The combustion exhaust gas leaves the combustion
chamber at about 1100°C and is expanded to 1 bar inthe turbine section to generate the bulk of the electricaloutput by driving the generator. The heat of exhaust gas-ses of the turbine is captured in a HRSG to generate steamat 60 bar for the ‘combined’ steam cycle [58,60,61]. The su-perheated steam is generated with water that had beenpreheated with waste heats from the BIGCC system, asdetermined by PPA. The superheated steam is then ex-panded in a CEST to provide the steam demands and add-itional electricity. The exhaust gas of the HRSG has atemperature of 200°C and is used to dry the biomass thatentered the BIGCC system [60].
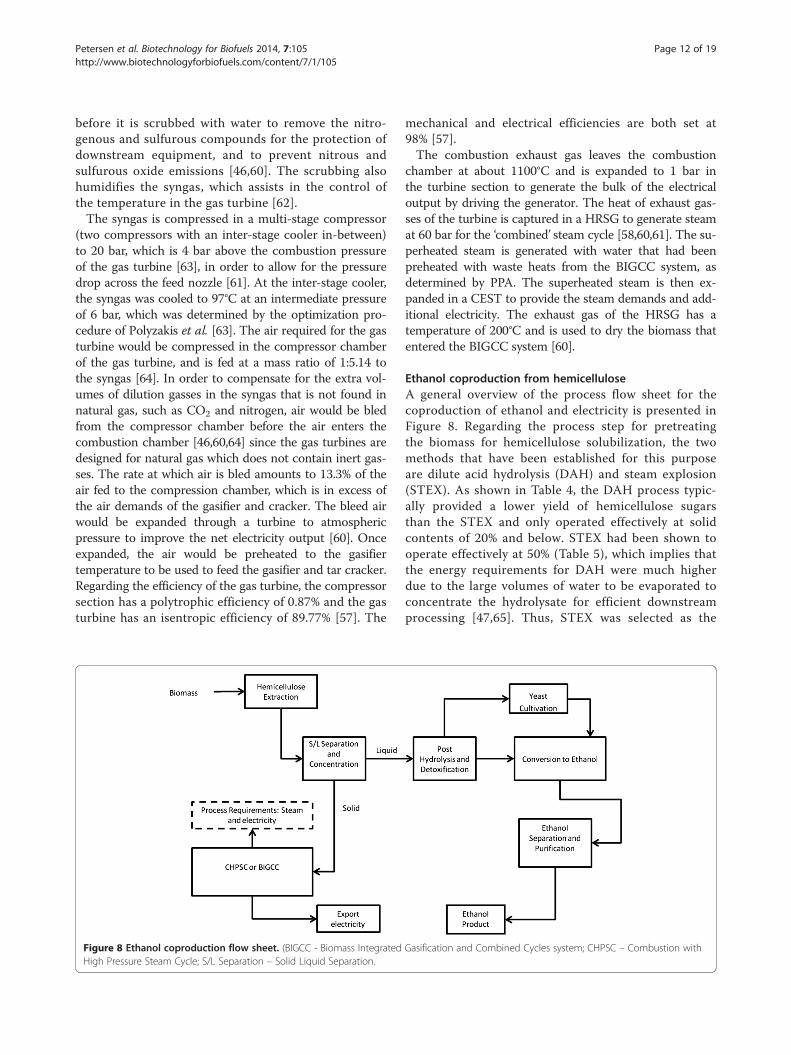
Ethanol coproduction from hemicelluloseA general overview of the process flow sheet for thecoproduction of ethanol and electricity is presented inFigure 8. Regarding the process step for pretreatingthe biomass for hemicellulose solubilization, the twomethods that have been established for this purposeare dilute acid hydrolysis (DAH) and steam explosion(STEX). As shown in Table 4, the DAH process typic-ally provided a lower yield of hemicellulose sugarsthan the STEX and only operated effectively at solidcontents of 20% and below. STEX had been shown tooperate effectively at 50% (Table 5), which implies thatthe energy requirements for DAH were much higherdue to the large volumes of water to be evaporated toconcentrate the hydrolysate for efficient downstreamprocessing [47,65]. Thus, STEX was selected as the
Gasification and Combined Cycles system; CHPSC – Combustion with
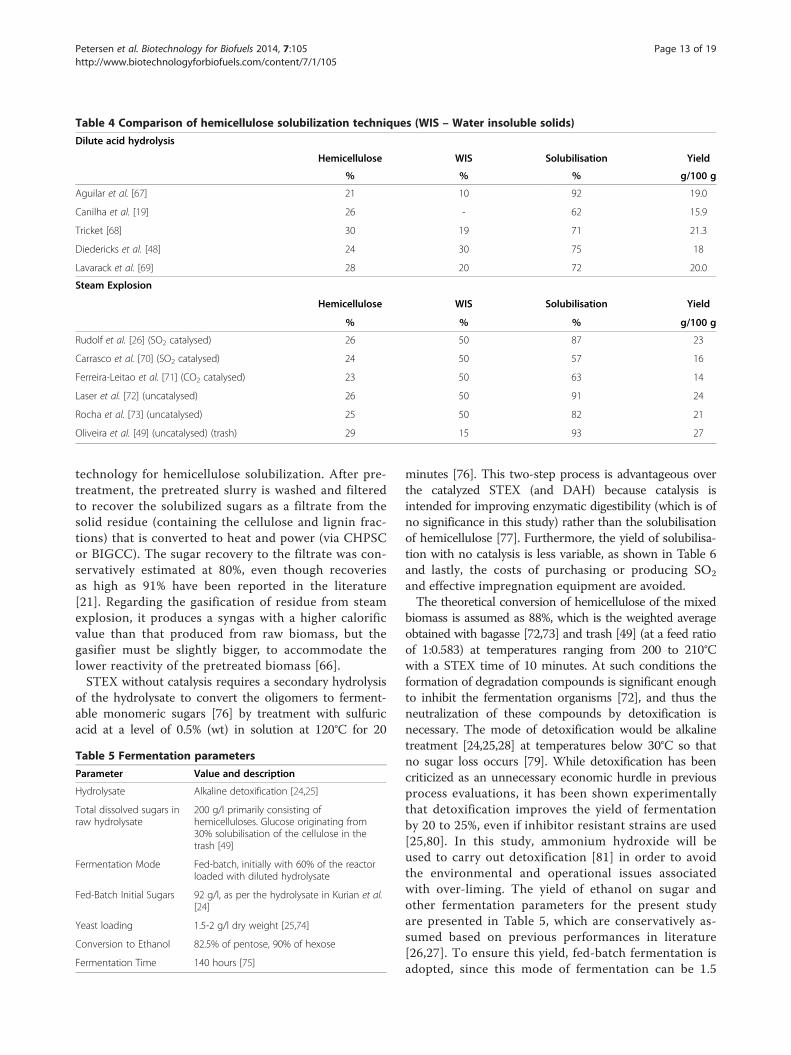
Table 4 Comparison of hemicellulose solubilization techniques (WIS – Water insoluble solids)
Dilute acid hydrolysis
Hemicellulose WIS Solubilisation Yield
% % % g/100 g
Aguilar et al. [67] 21 10 92 19.0
Canilha et al. [19] 26 - 62 15.9
Tricket [68] 30 19 71 21.3
Diedericks et al. [48] 24 30 75 18
Lavarack et al. [69] 28 20 72 20.0
Steam Explosion
Hemicellulose WIS Solubilisation Yield
% % % g/100 g
Rudolf et al. [26] (SO2 catalysed) 26 50 87 23
Carrasco et al. [70] (SO2 catalysed) 24 50 57 16
Ferreira-Leitao et al. [71] (CO2 catalysed) 23 50 63 14
Laser et al. [72] (uncatalysed) 26 50 91 24
Rocha et al. [73] (uncatalysed) 25 50 82 21
Oliveira et al. [49] (uncatalysed) (trash) 29 15 93 27
Petersen et al. Biotechnology for Biofuels 2014, 7:105 Page 13 of 19http://www.biotechnologyforbiofuels.com/content/7/1/105
technology for hemicellulose solubilization. After pre-treatment, the pretreated slurry is washed and filteredto recover the solubilized sugars as a filtrate from thesolid residue (containing the cellulose and lignin frac-tions) that is converted to heat and power (via CHPSCor BIGCC). The sugar recovery to the filtrate was con-servatively estimated at 80%, even though recoveriesas high as 91% have been reported in the literature[21]. Regarding the gasification of residue from steamexplosion, it produces a syngas with a higher calorificvalue than that produced from raw biomass, but thegasifier must be slightly bigger, to accommodate thelower reactivity of the pretreated biomass [66].STEX without catalysis requires a secondary hydrolysis
of the hydrolysate to convert the oligomers to ferment-able monomeric sugars [76] by treatment with sulfuricacid at a level of 0.5% (wt) in solution at 120°C for 20
Table 5 Fermentation parameters
Parameter Value and description
Hydrolysate Alkaline detoxification [24,25]
Total dissolved sugars inraw hydrolysate
200 g/l primarily consisting ofhemicelluloses. Glucose originating from30% solubilisation of the cellulose in thetrash [49]
Fermentation Mode Fed-batch, initially with 60% of the reactorloaded with diluted hydrolysate
Fed-Batch Initial Sugars 92 g/l, as per the hydrolysate in Kurian et al.[24]
Yeast loading 1.5-2 g/l dry weight [25,74]
Conversion to Ethanol 82.5% of pentose, 90% of hexose
Fermentation Time 140 hours [75]
minutes [76]. This two-step process is advantageous overthe catalyzed STEX (and DAH) because catalysis isintended for improving enzymatic digestibility (which is ofno significance in this study) rather than the solubilisationof hemicellulose [77]. Furthermore, the yield of solubilisa-tion with no catalysis is less variable, as shown in Table 6and lastly, the costs of purchasing or producing SO2
and effective impregnation equipment are avoided.The theoretical conversion of hemicellulose of the mixed
biomass is assumed as 88%, which is the weighted averageobtained with bagasse [72,73] and trash [49] (at a feed ratioof 1:0.583) at temperatures ranging from 200 to 210°Cwith a STEX time of 10 minutes. At such conditions theformation of degradation compounds is significant enoughto inhibit the fermentation organisms [72], and thus theneutralization of these compounds by detoxification isnecessary. The mode of detoxification would be alkalinetreatment [24,25,28] at temperatures below 30°C so thatno sugar loss occurs [79]. While detoxification has beencriticized as an unnecessary economic hurdle in previousprocess evaluations, it has been shown experimentallythat detoxification improves the yield of fermentationby 20 to 25%, even if inhibitor resistant strains are used[25,80]. In this study, ammonium hydroxide will beused to carry out detoxification [81] in order to avoidthe environmental and operational issues associatedwith over-liming. The yield of ethanol on sugar andother fermentation parameters for the present studyare presented in Table 5, which are conservatively as-sumed based on previous performances in literature[26,27]. To ensure this yield, fed-batch fermentation isadopted, since this mode of fermentation can be 1.5
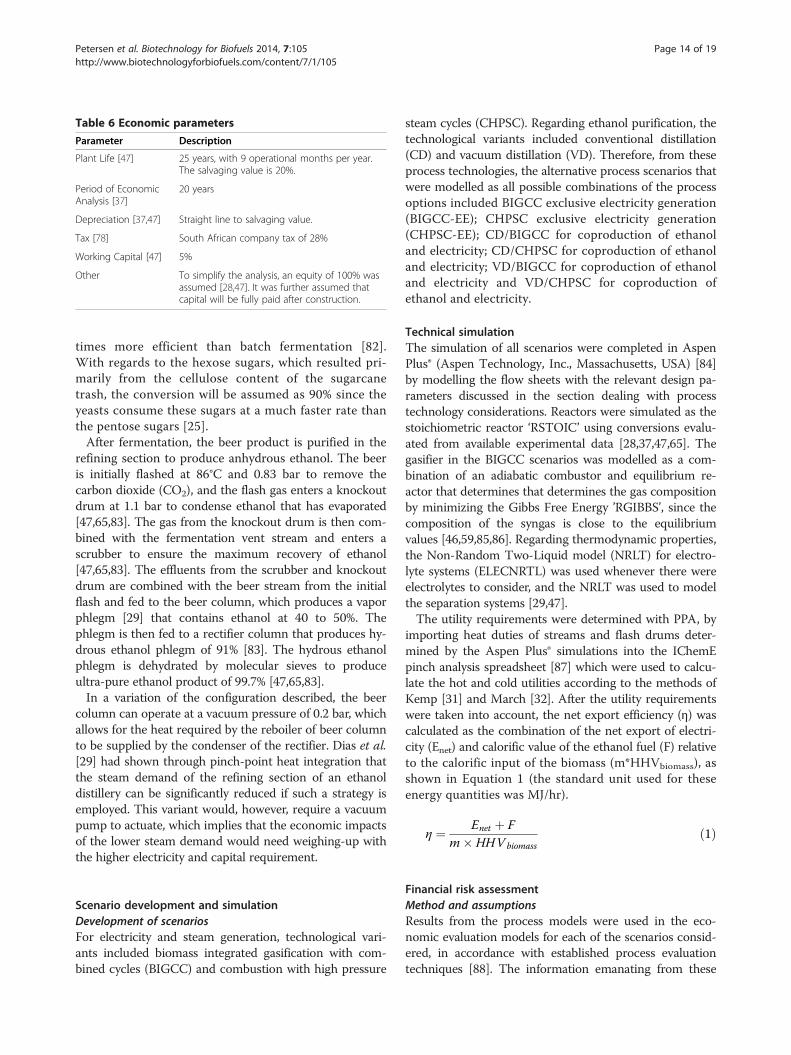
Table 6 Economic parameters
Parameter Description
Plant Life [47] 25 years, with 9 operational months per year.The salvaging value is 20%.
Period of EconomicAnalysis [37]
20 years
Depreciation [37,47] Straight line to salvaging value.
Tax [78] South African company tax of 28%
Working Capital [47] 5%
Other To simplify the analysis, an equity of 100% wasassumed [28,47]. It was further assumed thatcapital will be fully paid after construction.
Petersen et al. Biotechnology for Biofuels 2014, 7:105 Page 14 of 19http://www.biotechnologyforbiofuels.com/content/7/1/105
times more efficient than batch fermentation [82].With regards to the hexose sugars, which resulted pri-marily from the cellulose content of the sugarcanetrash, the conversion will be assumed as 90% since theyeasts consume these sugars at a much faster rate thanthe pentose sugars [25].After fermentation, the beer product is purified in the
refining section to produce anhydrous ethanol. The beeris initially flashed at 86°C and 0.83 bar to remove thecarbon dioxide (CO2), and the flash gas enters a knockoutdrum at 1.1 bar to condense ethanol that has evaporated[47,65,83]. The gas from the knockout drum is then com-bined with the fermentation vent stream and enters ascrubber to ensure the maximum recovery of ethanol[47,65,83]. The effluents from the scrubber and knockoutdrum are combined with the beer stream from the initialflash and fed to the beer column, which produces a vaporphlegm [29] that contains ethanol at 40 to 50%. Thephlegm is then fed to a rectifier column that produces hy-drous ethanol phlegm of 91% [83]. The hydrous ethanolphlegm is dehydrated by molecular sieves to produceultra-pure ethanol product of 99.7% [47,65,83].In a variation of the configuration described, the beer
column can operate at a vacuum pressure of 0.2 bar, whichallows for the heat required by the reboiler of beer columnto be supplied by the condenser of the rectifier. Dias et al.[29] had shown through pinch-point heat integration thatthe steam demand of the refining section of an ethanoldistillery can be significantly reduced if such a strategy isemployed. This variant would, however, require a vacuumpump to actuate, which implies that the economic impactsof the lower steam demand would need weighing-up withthe higher electricity and capital requirement.
Scenario development and simulationDevelopment of scenariosFor electricity and steam generation, technological vari-ants included biomass integrated gasification with com-bined cycles (BIGCC) and combustion with high pressure
steam cycles (CHPSC). Regarding ethanol purification, thetechnological variants included conventional distillation(CD) and vacuum distillation (VD). Therefore, from theseprocess technologies, the alternative process scenarios thatwere modelled as all possible combinations of the processoptions included BIGCC exclusive electricity generation(BIGCC-EE); CHPSC exclusive electricity generation(CHPSC-EE); CD/BIGCC for coproduction of ethanoland electricity; CD/CHPSC for coproduction of ethanoland electricity; VD/BIGCC for coproduction of ethanoland electricity and VD/CHPSC for coproduction ofethanol and electricity.
Technical simulationThe simulation of all scenarios were completed in AspenPlus® (Aspen Technology, Inc., Massachusetts, USA) [84]by modelling the flow sheets with the relevant design pa-rameters discussed in the section dealing with processtechnology considerations. Reactors were simulated as thestoichiometric reactor ‘RSTOIC’ using conversions evalu-ated from available experimental data [28,37,47,65]. Thegasifier in the BIGCC scenarios was modelled as a com-bination of an adiabatic combustor and equilibrium re-actor that determines that determines the gas compositionby minimizing the Gibbs Free Energy ’RGIBBS’, since thecomposition of the syngas is close to the equilibriumvalues [46,59,85,86]. Regarding thermodynamic properties,the Non-Random Two-Liquid model (NRLT) for electro-lyte systems (ELECNRTL) was used whenever there wereelectrolytes to consider, and the NRLT was used to modelthe separation systems [29,47].The utility requirements were determined with PPA, by
importing heat duties of streams and flash drums deter-mined by the Aspen Plus® simulations into the IChemEpinch analysis spreadsheet [87] which were used to calcu-late the hot and cold utilities according to the methods ofKemp [31] and March [32]. After the utility requirementswere taken into account, the net export efficiency (η) wascalculated as the combination of the net export of electri-city (Enet) and calorific value of the ethanol fuel (F) relativeto the calorific input of the biomass (m*HHVbiomass), asshown in Equation 1 (the standard unit used for theseenergy quantities was MJ/hr).
η ¼ Enet þ Fm� HHVbiomass
ð1Þ
Financial risk assessmentMethod and assumptionsResults from the process models were used in the eco-nomic evaluation models for each of the scenarios consid-ered, in accordance with established process evaluationtechniques [88]. The information emanating from these
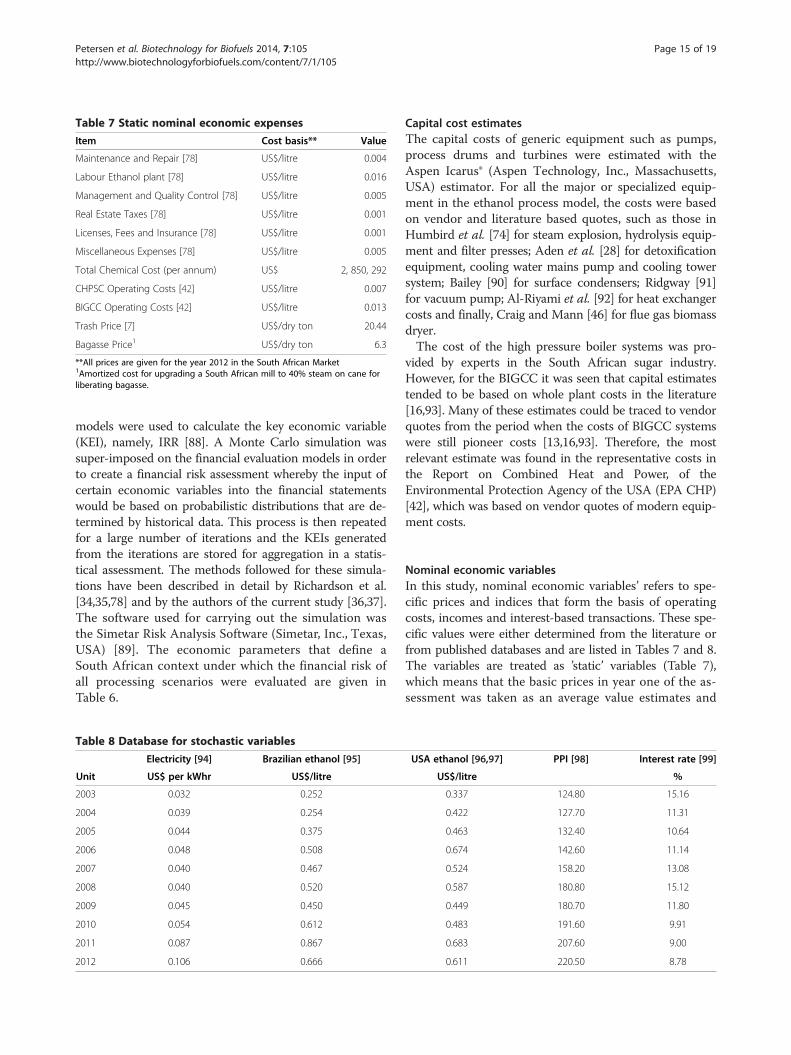
Table 7 Static nominal economic expenses
Item Cost basis** Value
Maintenance and Repair [78] US$/litre 0.004
Labour Ethanol plant [78] US$/litre 0.016
Management and Quality Control [78] US$/litre 0.005
Real Estate Taxes [78] US$/litre 0.001
Licenses, Fees and Insurance [78] US$/litre 0.001
Miscellaneous Expenses [78] US$/litre 0.005
Total Chemical Cost (per annum) US$ 2, 850, 292
CHPSC Operating Costs [42] US$/litre 0.007
BIGCC Operating Costs [42] US$/litre 0.013
Trash Price [7] US$/dry ton 20.44
Bagasse Price1 US$/dry ton 6.3
**All prices are given for the year 2012 in the South African Market1Amortized cost for upgrading a South African mill to 40% steam on cane forliberating bagasse.
Petersen et al. Biotechnology for Biofuels 2014, 7:105 Page 15 of 19http://www.biotechnologyforbiofuels.com/content/7/1/105
models were used to calculate the key economic variable(KEI), namely, IRR [88]. A Monte Carlo simulation wassuper-imposed on the financial evaluation models in orderto create a financial risk assessment whereby the input ofcertain economic variables into the financial statementswould be based on probabilistic distributions that are de-termined by historical data. This process is then repeatedfor a large number of iterations and the KEIs generatedfrom the iterations are stored for aggregation in a statis-tical assessment. The methods followed for these simula-tions have been described in detail by Richardson et al.[34,35,78] and by the authors of the current study [36,37].The software used for carrying out the simulation wasthe Simetar Risk Analysis Software (Simetar, Inc., Texas,USA) [89]. The economic parameters that define aSouth African context under which the financial risk ofall processing scenarios were evaluated are given inTable 6.
Table 8 Database for stochastic variables
Electricity [94] Brazilian ethanol [95]
Unit US$ per kWhr US$/litre
2003 0.032 0.252
2004 0.039 0.254
2005 0.044 0.375
2006 0.048 0.508
2007 0.040 0.467
2008 0.040 0.520
2009 0.045 0.450
2010 0.054 0.612
2011 0.087 0.867
2012 0.106 0.666
Capital cost estimatesThe capital costs of generic equipment such as pumps,process drums and turbines were estimated with theAspen Icarus® (Aspen Technology, Inc., Massachusetts,USA) estimator. For all the major or specialized equip-ment in the ethanol process model, the costs were basedon vendor and literature based quotes, such as those inHumbird et al. [74] for steam explosion, hydrolysis equip-ment and filter presses; Aden et al. [28] for detoxificationequipment, cooling water mains pump and cooling towersystem; Bailey [90] for surface condensers; Ridgway [91]for vacuum pump; Al-Riyami et al. [92] for heat exchangercosts and finally, Craig and Mann [46] for flue gas biomassdryer.The cost of the high pressure boiler systems was pro-
vided by experts in the South African sugar industry.However, for the BIGCC it was seen that capital estimatestended to be based on whole plant costs in the literature[16,93]. Many of these estimates could be traced to vendorquotes from the period when the costs of BIGCC systemswere still pioneer costs [13,16,93]. Therefore, the mostrelevant estimate was found in the representative costs inthe Report on Combined Heat and Power, of theEnvironmental Protection Agency of the USA (EPA CHP)[42], which was based on vendor quotes of modern equip-ment costs.
Nominal economic variablesIn this study, nominal economic variables’ refers to spe-cific prices and indices that form the basis of operatingcosts, incomes and interest-based transactions. These spe-cific values were either determined from the literature orfrom published databases and are listed in Tables 7 and 8.The variables are treated as ’static’ variables (Table 7),which means that the basic prices in year one of the as-sessment was taken as an average value estimates and
USA ethanol [96,97] PPI [98] Interest rate [99]
US$/litre %
0.337 124.80 15.16
0.422 127.70 11.31
0.463 132.40 10.64
0.674 142.60 11.14
0.524 158.20 13.08
0.587 180.80 15.12
0.449 180.70 11.80
0.483 191.60 9.91
0.683 207.60 9.00
0.611 220.50 8.78
Petersen et al. Biotechnology for Biofuels 2014, 7:105 Page 16 of 19http://www.biotechnologyforbiofuels.com/content/7/1/105
inflated with the projected Producers Purchases Index(PPI) to predict the future value. The ‘stochastic’ vari-ables (Table 8) were used to generate a multivariate em-pirical function, from which the future values wereiteratively projected for each year in the evaluation inthe Monte Carlo simulation.Regarding the price of second generation ethanol, un-
certainty exists because the current pricing of the SouthAfrican biofuel strategy does not explicitly include sec-ond generation fuels [100]. Thus, the price of ethanolwas either based on data given for ethanol prices in theUSA, or based on data describing Brazilian (BRZ) etha-nol prices. Given the uncertainty in the selling price ofthe export electricity, an upper and lower premium wascalculated and applied on the base electricity prices pro-jected from the probability distribution. These pre-miums were calculated on the minimum and maximumprices for renewable electricity of the South AfricanRenewable Energy bids, which had 2012 based prices of0.113 and 0.175 US$ per kW/hr respectively [101].Since biomass based energy is continuous and suppliesenergy for peak hours, a bonus price of two times therenewable energy price is allowed for four hours per day[101], which thus raises the average renewable prices to0.139 and 0.216 US$ per kW/hr. Relative to the baseelectricity price (2012 price) in Table 8, the upper andlower premiums amount to 31% and 103% respectively.With the two possible renewable electricity premiums
and two sets of ethanol price data, there would be fourpossible pricing strategies. Each strategy is considered as aset of parameters under which separate sets of stochasticevaluations of the process scenarios will be conducted.These four pricing strategies are: 1) minimum electricitypremium and ethanol prices based on Brazilian data, 2)minimum electricity premium and ethanol prices basedon USA data, 3) maximum electricity premium and etha-nol prices based on Brazilian data, and 4) maximum elec-tricity premium and ethanol prices based on USA data.
Sensitivity analysisThe modern capital estimates of BIGCC carry some un-certainty, in that they might be too optimistic. Thus, inorder to account for the possibility of a more pessimis-tic capital estimate, the capital estimates of the BIGCCpower plant equipment was increased by 10%, prior tofactoring in balance of plant costs (BOP) and projectcontingencies. Accordingly, a separate stochastic simu-lation of the BIGCC-EE, CD/BIGCC and VD/BIGCCscenarios was carried out to evaluate the impact of thepessimistic capital estimate.There is also uncertainty in the yield of ethanol from
the hydrolysate, as a very sophisticated organism couldyield more ethanol without the need for detoxification,hence negating the associated costs. Furthermore, it is
also possible that suboptimal hemicellulose extractioncould result in a loss of ethanol. Thus, two sensitivityscenarios of the most profitable coproduction scenarioswere simulated. They include: (1) where the overallethanol yield is decreased by 10% to account for thesuboptimal hemicellulose extraction, and (2) where theoverall ethanol yield is increased by 10% to account fora possibility of a sophisticated fermenting organismwhich will further discard the costs associated with de-toxification. Accordingly, the economic sensitivity tothese variations in process parameters was determinedusing separate stochastic evaluations.
AbbreviationsBIGCC: Biomass Integrated Gasification and Combined Cycle; BOP: Balance ofPlant; BRZ: Brazil; CD: Conventional Distillation; CEST: Condensing ExtractionSteam Turbine; CFB: Circulating Fluidized Bed Reactor; CHPSC: Combustionwith High Pressure Steam Cycle; DAH: Dilute Acid Hydrolysis; EE: ExclusiveElectricity Production; Enet: Net Export Electricity; F: Ethanol Fuel; HRSG: HeatRecovery Steam Generator; IRR: Internal Rate of Return; KEI: Key EconomicIndicator; n: net export efficiency; NPV: Net Present Value; NREL: NationalRenewable Energy Laboratory; PPA: Pinch Point Analysis; PPI: ProducersPurchase Index; SA: South Africa; STEX: Steam Explosion; TCI: Total CapitalInvestment; TR: Technical Related; USA: United States of America;VD: Vacuum distillation.
Competing interestsThe authors declare that they have no competing interests.
Authors’ contributionsAMP was the primary investigator into the work. He performed allsimulations of the various processes and economic evaluations. He alsocompleted the interpretation of results and was the primary author of thewritten text. MCA was the internal reviser who checked the paper criticallyfor inconsistencies in the text and structure. He also gave assistance in thestructuring of the paper. JFG is the study leader of the research group,reviewed the paper internally and approved the submission from ourdepartment. He is also the corresponding author. All authors agree to beaccountable for all aspects of the work and will ensure that questionsrelating to accuracy and integrity be appropriately investigated and resolved.All authors read and approved the final manuscript.
AcknowledgementsThe authors would like to thank Chair of Energy Research at StellenboschUniversity, funded by the Department of Science and Technology, forproviding financial assistance.
Received: 26 November 2013 Accepted: 20 June 2014Published: 10 July 2014
References1. Mbohwa C, Fukuda S: Electricity from bagasse in Zimbabwe. Biomass and
Bioenergy 2003, 25:197–207.2. Dias MOS, Cunha MP, Jesus CDF, Rocha GJM, Geraldo J, Pradella C, Rossell
CEV, Maciel R, Bonomi A: Second generation ethanol in Brazil: can itcompete with electricity production? Bioresour Technol 2011,102:8964–8971.
3. Peacock S: Process Design for Optimum Energy Efficiency. Glenashley, SouthAfrica: Tongaat Hullet Sugar, Corporate Head Office; 2008.
4. Venkatesh KS, Roy AS: Development and installation of high pressureboilers for co-generation plant in sugar industries. Smart Grid andRenewable Energy 2010, 1:51–53.
5. Ensinas AV, Nebra SA, Lozano MA, Serra LM: Analysis of process steamdemand reduction and electricity generation in sugar and ethanolproduction from sugarcane. Energy Conversion and Management 2007,48:2978–2987.

Petersen et al. Biotechnology for Biofuels 2014, 7:105 Page 17 of 19http://www.biotechnologyforbiofuels.com/content/7/1/105
6. Botha T, Von Blottnitz H: A comparison of the environmental benefits ofbagasse-derived electricity and fuel ethanol on a life-cycle basis. EnergyPolicy 2006, 34:2654–2661.
7. Dias MOS, Junqueira TL, Cavalett O, Cunha MP, Jesus CDF, Rossell CEV,Maciel R, Bonomi A: Integrated versus stand-alone second generationethanol production from sugarcane bagasse and trash. Bioresour Technol2012, 103:152–161.
8. Huang H-J, Ramaswamy S, Al-dajani W, Tschirner U, Cairncross RA: Effect ofbiomass species and plant size on cellulosic ethanol: a comparativeprocess and economic analysis. Biomass and Bioenergy 2009, 33:234–246.
9. Ogden J, Hochgreb S, Hylton M: Steam economy and cogeneration incane factories. Intenational Sugar Journal 1990, 92:131–140.
10. Moor B: Modern Sugar Equipment Assisting Cogeneration. In Proceedingsof the South African Sugar Technologists' Association (SASTA) Congress. MountEdgecombe, South Africa: SASTA; 2008:1–13.
11. Macrelli S, Mogensen J, Zacchi G: Techno-economic evaluation of 2ndgeneration bioethanol production from sugar cane bagasse and leavesintegrated with the sugar-based ethanol process. Biotechnol Biofuels 2012,5:22.
12. Bridgwater AV, Toft AJ, Brammer JG: A techno-economic comparison ofpower production by biomass fast pyrolysis with gasification andcombustion. Renew Sustain Energy Rev 2002, 6:181–248.
13. Caputo AC, Palumbo M, PMP Ã, Scacchia F: Economics of biomass energyutilization in combustion and gasification plants: effects of logisticvariables. Biomass and Bioenergy 2005, 28:35–51.
14. Wang L, Weller CL, Jones DD, Hanna MA: Contemporary issues in thermalgasification of biomass and its application to electricity and fuelproduction. Biomass and Bioenergy 2008, 32:573–581.
15. Searcy E, Flynn P: The Impact of biomass availability and processing coston optimum size and processing technology selection. Appl BiochemBiotechnol 2009, 154:271–286.
16. Uddin SN, Barreto L: Biomass-fired cogeneration systems with CO 2capture and storage. Renew Energy 2007, 32:1006–1019.
17. Faaij A: Modern biomass conversion technologies. Mitig Adapt Strat GlobChang 2006, 11:343–375.
18. Kazi FK, Fortman JA, Anex RP, Hsu DD, Aden A, Dutta A, Kothandaraman G:Techno-economic comparison of process technologies for biochemicalethanol production from corn stover q. Fuel 2010, 89:S20–S28.
19. Canilha L, Santos VT, Rocha GJ, e Silva Almeida J, Giulietti M, Silva S, FelipeMG, Ferraz A, Milagres AMF, Carvalho W: A study on the pretreatment of asugarcane bagasse sample with dilute sulfuric acid. J Ind MicrobiolBiotechnol 2011, 38:1467–75.
20. Purchase BBS, Walford SN, Waugh EJ: An update on progress in theproduction of ethanol from bagasse. Proceedings of the South AfricanSugar Technologists’ Association - June 1986, 1986(June):33–36.
21. Treasure T, Gonzalez R, Venditti R, Pu Y, Jameel H, Kelley S, Prestemon J:Co-production of electricity and ethanol, process economics of valueprior combustion. Energy Conversion and Management 2012, 62:141–153.
22. Gnansounou E, Dauriat A, Wyman CE: Refining sweet sorghum to ethanoland sugar: economic trade-offs in the context of North China. BioresourTechnol 2005, 96:985–1002.
23. Gírio FM, Fonseca C, Carvalheiro F, Duarte LC, Marques S, Bogel-Lukasik R:Hemicelluloses for fuel ethanol: a review. Bioresour Technol 2010,101:4775–4800.
24. Kurian J, Minu A, Banerji A, Kishore VV: Bioconversion of hemicellulosehydrolysate of sweet sorghum bagasse to ethanol by using Pichiastipitis NCIM 3497 and Debaryomyces hansenii SP. Bioresources 2010,5:2404–2416.
25. Nigam JN: Ethanol production from wheat straw hemicellulosehydrolysate by Pichia stipitis. J Biotechnol 2001, 87:17–27.
26. Rudolf A, Baudel H, Zacchi G: Simultaneous saccharification andfermentation of steam-pretreated bagasse using Saccharomycescerevisiae TMB3400 and Pichia stipitis CBS6054. Biotechnol Bioeng 2008,99:783–790.
27. Mcmillan JDJ: Progress on Advanced Liquid Biofuels in the USA Biofuels.In Presented at International Symposium on Alchohol Fuels (ISAF); 2013.Stellenbosch, South Afrca: ISAF; 2013.
28. Aden A, Ruth M, Ibsen K, Jechura J, Neeves K, Sheehan J, Wallace B,Montague L, Slayton A, Lukas J: Lignocellulosic Biomass to Ethanol ProcessDesign and Economics Utilizing Co-Current Dilute Acid Prehydrolysis andEnzymatic Hydrolysis for Corn Stover Lignocellulosic Biomass to Ethanol Process
Design and Economics Utilizing Co-Current Dilute Acid Prehyd. Colorado, USA:National Renewable Energy Laboratory (NREL); 2002.
29. Dias MOS, Modesto M, Ensinas AV, Nebra SA, Maciel R, Rossell CEV:Improving bioethanol production from sugarcane: evaluation ofdistillation, thermal integration and cogeneration systems. Energy 2011,36:3691–3703.
30. Grisales R, Cardona CA, Sanchez O, Guterrez L: Heat Integration ofFermentation and Recovery Steps for Fuel Ethanol Production fromLignocellulosic. Costa Verde, Brazil: 4th Mercosur Congress on ProcessSystems Engineering, EMPROMER; 2005.
31. Kemp I: Pinch Analysis and Process Integration: A User Guide on ProcessIntegration for the Efficient Use of Energy. Butterworth-Heinemann,Burlington, USA: Elsevier; 2007.
32. March L: Introduction to Pinch by Linnhoff March. Northwich, UnitedKingdom: Linnhoff March LTD; 1998.
33. Sue D-C, Chuang C-C: Engineering design and exergy analyses forcombustion gas turbine based power generation system. Energy 2004,29:1183–1205.
34. Richardson JW, Herbst BK, Outlaw JL, Anderson DP, Klose SL, Gill RC II: RiskAssessment in Economic Feasibility Analysis: The Case of Ethanol Production inTexas. Texas, USA: Agricultural and Food Policy Centre; 2006.
35. Richardson JW, Klose SL, Gray AW: An applied procedure for estimatingand simulating multivariate empirical (mve) probability distributions infarm-level risk assessment and policy analysis. Journal of Agricultural andApplied Economics 2000, 2(August):299–315.
36. Amigun B, Petrie D, Görgens J: Economic risk assessment of advancedprocess technologies for bioethanol production in South Africa: MonteCarlo analysis. Renew Energy 2011, 36:3178–3186.
37. Petersen A: Comparisons of the Technical, Financial Risk and Life CycleAssessments of Various Processing Options of Sugarcane Bagasse To Biofuels InSouth Africa. South Africa: Stellenbosch University; 2012.
38. Pellegrini LF, de Junior SO, de Burbano JC: Supercritical steam cycles andbiomass integrated gasification combined cycles for sugarcane mills.Energy 2010, 35:1172–1180.
39. South African Petroleum Industry Association (SAPIA): Annual Report.Sandton, South Africa: 2012.
40. Eskom: Grid Access: Scaling up for large scale renewable energy uptake.In Presentation to South African Photovoltaic Industry Association (SAPVIA).Cape Town, South Africa: South African Photovoltaic Industry Association.
41. Nsaful F, Görgens JF, Knoetze JH: Comparison of combustion andpyrolysis for energy generation in a sugarcane mill. Energy Conversion andManagement 2013, 74:524–534.
42. EPA: Biomass CHP Catalogue, Part 7: Representative Biomass CHP System Costand Performance Profiles. Washington DC, USA: Combined Heat and PowerPartnership; 2007.
43. Dornburg V, Faaij PC: Efficiency and economy of wood-fired biomassenergy systems in relation to scale regarding heat and power generationusing combustion and gasification technologies. Biomass and Bioenergy2001, 21:91–108.
44. National Energy Regulatory of South Africa (NERSA) Consultation PaperReview of Renewable Energy Feed. In Tariffs. Pretoria, South Africa: NersaOffice; 2011.
45. Justice S: Private Financing of Renewable Energy – A Guide for Policy Makers.Nairobi, Kenya: United Nations Environment Programme (UNEP); 2009.
46. Craig KR, Mann MK: Cost and Performance Analysis of Biomass-BasedIntegrated Gasification Combined-Cycle (BIGCC) Power Systems Cost andPerformance Analysis of Biomass-Based Integrated Gasification Combined-Cycle(BIGCC) Power Systems. Colorado, USA: National Renewable EnergyLaboratory; 1996.
47. Leibbrandt NH: Techno-Economics Study for Sugarcane Bagasse to LiquidBiofuels in South Africa: A Comparison between Biological andThermochemical Process Routes. Stellenbosch, South Africa: University ofStellenbosch; 2010.
48. Diedericks D, Rensburg EV, Görgens JF: Fractionation of sugarcanebagasse using a combined process of dilute acid and ionic liquidtreatments. Appl Biochem Biotechnol 2012, 167:1921–1937.
49. Oliveira FMV, Pinheiro IO, Souto-maior AM, Martin C, Gonçalves AR, RochaGJM: Industrial-scale steam explosion pretreatment of sugarcane strawfor enzymatic hydrolysis of cellulose for production of secondgeneration ethanol and value-added products. Bioresour Technol 2013,130:168–173.
Petersen et al. Biotechnology for Biofuels 2014, 7:105 Page 18 of 19http://www.biotechnologyforbiofuels.com/content/7/1/105
50. Wienese A, Purchase B, Wienese A, Purchase BS: Renewable Energy: AnOpportunity for The South African Sugar Industry? In Proceedings of theSouth African Sugar Technologists’ Association (SASTA), Volume 78. MountEdgecombe, South Africa: SASTA; 2004:39–54.
51. Van der Westhuizen WA: A Techno-Economic Evaluation of IntegratingFirst and Second Generation Bioethanol Production from Sugarcane InSub-Saharan Africa. Stellenbosch, South Africa: Stellenbosch University;2012.
52. South African Sugar Mills. www.huletts.co.za/ops/south_africa/mills/felixton.asp.
53. Seabra JEA, Tao L, Chum HL, Macedo IC: A techno-economic evaluation ofthe effects of centralized cellulosic ethanol and co-products refineryoptions with sugarcane mill clustering. Biomass and Bioenergy 2010,34:1065–1078.
54. Mendes AGP: Dust explosions. In Proceedings of The South African SugarTechnologists’ Association (SASTA) Congress: Volume 74, 1999. MountEdgecombe, South Africa: SASTA; 1999:282–288.
55. Department of Environmental Affairs and Tourism: AQA Implementation:Listed Activities and Minimum Emission Standards. Draft schedule forsection 21 Air Quality Act, Rev;: Department of Environmental Affairs andTourism. Pretoria, South Africa: 2008.
56. Nsaful F: Process Modelling Of Sugar Mill Biomass to Energy ConversionProcesses and Energy Integration of Pyrolysis. Stellenbosch, South Africa:Stellenbosch University; 2012.
57. Kreutz TG, Larson ED, Liu G, Williams RH: Fischer-Tropsch Fuels from Coaland Biomass. In 25th Annual International Pittsburgh Coal Conference: August2008. Pittsburgh, USA: 2008.
58. Mann MK, Spath SL: Life Cycle Assessment of a Biomass GasificationCombined-Cycle System. Colorado, USA: National Renewable EnergyLaboratory; 1997.
59. Li X, Grace JR, Lim CJ, Watkinson AP, Chen HP, Kim JR: Biomass gasificationin a circulating Fluidized bed. Biomass and Bioenergy 2004, 26:171–193.
60. Rodrigues M, Walter A, Faaij A: Performance evaluation of atmosphericbiomass integrated gasifier combined cycle systems under differentstrategies for the use of low calorific gases. Energy Conversion andManagement 2007, 48:1289–1301.
61. Fagbenle RL, Oguaka ABC, Olakoyejo OT: A thermodynamic analysis of abiogas-fired integrated gasification steam injected gas turbine (BIG/STIG)plant. Applied Thermal Engineering 2007, 27:2220–2225.
62. Lugo-Leyte R, Zamora-Mata JM, Toledo-Vela’zquez M, Salazar-pereyra M,Torres-aldaco A: Methodology to determine the appropriate amount ofexcess air for the operation of a gas turbine in a wet environment.Energy 2010, 35:550–555.
63. Polyzakis AL, Koroneos C, Xydis G: Optimum gas turbine cycle forcombined cycle power plant. Energy Conversion and Management 2008,49:551–563.
64. Ree RV, Oudhuis AB, Faaij A, Curvers APW: Modelling of a Biomass IntegratedGasifier Combined Cycle (BIG/CC) System with the Flow sheet SimulationProgramme Aspen Plus. Petten, Netherlands: Energy research Centre of theNetherlands (ECN); 1995.
65. Leibbrandt NH, Knoetze JH, Gorgens JF: Comparing biological andthermochemical processing of sugarcane bagasse: an energy balanceperspective. Biomass and Bioenergy 2011, 35:2117–2126.
66. Gunarathne DS, Chmielewski JK, Yang W: High Temperature Air/SteamGasification of Steam Exploded Biomass. Livomo, Italy: International FlameResearch Foundation; 2013:1–14.
67. Aguilar R, Ramırez J, Garrote G, Vazquez M: Kinetic study of the acidhydrolysis of sugar cane bagasse. J Food Eng 2002, 55:309–318.
68. Tricket R: Utilisation of Bagasse for the Production of C5 and C6 Sugars.Durban, South Africa: University of Natal; 1982.
69. Lavarack BP, Gri GJ, Rodman D: The acid hydrolysis of sugarcane bagassehemicellulose to produce xylose, arabinose, glucose and other products.Biomass and Bioenergy 2002, 23:367–380.
70. Carrasco C, Baudel HM, Sendelius J, Modig T, Galbe M, Zacchi G,Liden G: SO2 catalyzed steam pretreatment and fermentation ofenzymatically hydrolyzed sugarcane bagasse. Enzyme Microb Technol2010, 46:64–73.
71. Ferreira-leitão V, Perrone CC, Rodrigues J, Paula A, Franke M, Macrelli S,Zacchi G: An approach to the utilisation of CO 2 as impregnating agentin steam pretreatment of sugar cane bagasse and leaves for ethanolproduction. Biotechnol Biofuels 2010, 3:7.
72. Laser M, Schulman D, Allen SG, Lichwa J, Antal MJ, Lynd LR: A comparisonof liquid hot water and steam pretreatments of sugar cane bagasse forbioconversion to ethanol. Bioresour Technol 2002, 81:33–44.
73. Rocha GJM, Martín C, Vinícius FN, Gómez EO, Gonçalves AR: Massbalance of pilot-scale pretreatment of sugarcane bagasse by steamexplosion followed by alkaline delignification. Bioresour Technol 2012,111:447–452.
74. Humbird D, Davis R, Tao L, Kinchin C, Hsu D, Aden A, Schoen P, Lukas J,Olthof B, Worley MD: Sexton and DD: Process Design and Economics forBiochemical Conversion of Lignocellulosic Biomass to Ethanol Process Designand Economics for Biochemical Conversion of Lignocellulosic Biomass toEthanol. Colorado, USA: National Renewable Energy Laboratory; 2011.
75. Preez JC, Driessel BV, Prior BA: Applied microbiology biotechnologyethanol tolerance of Pichia stipitis and Candida shehatae strains infed-batch cultures at controlled low dissolved oxygen levels. ApplMicrobiol Biotechnol 1989, 30:53–58.
76. Shevchenko SM, Chang K, Robinson J, Saddler JN: Optimization ofmonosaccharide recovery by post-hydrolysis of the water-solublehemicellulose component after steam explosion of softwood chips.Bioresour Technol 2000, 72:207–211.
77. Martin C, Galbe M, Nilvebrant N, Jonsson L: Comparison of the fermentabilityof enzymatic hydrolyzates of sugarcane bagasse pretreated by steamexplosion. Appl Environ Microbiol 2002, 98–100:699–716.
78. Richardson JW, Lemmer WJ, Outlaw JL: Bioethanol production from wheatin the winter rainfall region of South Africa: a quantitative risk analysis.International Food and Agribusiness Management Review 2007, 10:181–204.
79. Nilverbrant N, Persson P, Reimann A, De Sousa F, Gorton L, Jonsson J:Limits for alkaline detoxification of dilute-acid lignocellulosehydrolysates. Appl Biochem Biotechnol 2003, 105–108:615–628.
80. Nigam JN: Ethanol production from hardwood spent sulfite liquor usingan adapted strain of Pichia stipitis. J Biotechnol 2001, 26:145–150.
81. Alriksson B, Horvath I, Sjode A, Nilverbrant N, Jonsson L: Ammoniumhydroxide detoxification of spruce acid hydrolysates. Appl BiochemBiotechnol 2005, 121–124:911–922.
82. Tantirungkij M, Izuishi T, Seki T, Yoshida T: Applied microbiologybiotechnoiogy fed-batch fermentation of xylose by a fast-growing mu-tant of xylose-assimilating recombinant Saccharomyces cerevisiae. ApplMicrobiol Biotechnol 1994, 8:8–12.
83. Mcaloon A, Taylor F, Yee W, Regional E, Ibsen K, Wooley R, Biotechnology N:Determining the Cost of Producing Ethanol from Corn Starch andLignocellulosic Feedstocks Determining the Cost of Producing Ethanol fromCorn Starch and Lignocellulosic. Colorado, USA: National Renewable EnergyLaboratory; 2000.
84. Aspen Technology Inc (Manufacturer): AspenPlus®, AspenIcarus®. 2008. http://www.aspentech.com/products/aspen-plus.aspx.
85. Aboyade A: Co-Gasification of Coal and Biomass: Impact on Condensate andSyngas Production. Stellenbosch, South Africa: University of Stellenbosch; 2012.
86. Chen C, Y-qi J, J-hua Y, Chi Y: Simulation of municipal solid wastegasification for syngas production in fixed bed reactors. J Zhenjiang UnivSci B 2010, 11:619–628.
87. IChemE: Pinch Point Analysis Spreadsheet. Rugby, United Kingdom: Instituteof Chemical Engineers; 2006.
88. Peters and Timmerhaus: Analysis of cost estimation profitability,alternative investments and replacements optimum design and designstrategy. In Plant Design and Economics for Chemical Engineers. 5th edition.Columbus, USA: McGraw Hill; 1997.
89. Richardson JW, Schumann K, Feldman P: Simeter - Simulation & EconometricsTo Analyze Risk. Texas USA: Simetar, Inc; 2008.
90. Bailey D: Issues Analysis of Retrofitting Once-Through Cooled Plants withClosed-Cycle Cooling. Electric Power Research Institute: USA; 2007.
91. Ridgway S: Projected Capital Costs of a Mist Lift OTEC Power Plant. New York,USA: The American Society of Mechanical Engineers; 1984.
92. Al-Riyami BA, Klimes J, Perry S: Heat integration retrofit analysis of a heatexchanger network of a fluid catalytic cracking plant. Applied ThermalEngineering 2001, 21:1449–1487.
93. Rhodes JS, Keith DW: Engineering economic analysis of biomass IGCCwith carbon capture and storage. Biomass and Bioenergy 2005, 29:440–450.
94. Eskom Tariffs and Charges. http://www.eskom.co.za/CustomerCare/TariffsAndCharges/Pages/Tariff_History.aspx.
95. CEPEA – Centro de Estudos Avancados em Economia Aplicada. http://www.cepea.esalq.usp.br/xls/SaaofmensalUS.xls.

Petersen et al. Biotechnology for Biofuels 2014, 7:105 Page 19 of 19http://www.biotechnologyforbiofuels.com/content/7/1/105
96. State of Nebraska Official Website. http://digitalcommons.unl.edu/cgi/viewcontent.cgi?article=1033&context=imsediss.
97. Center for Agricultural and Rural Development, Historical Ethanol Prices.http://www.card.iastate.edu/research/bio/tools/download_eth_csv.aspx.
98. Producer Purchases Index. http://beta2.statssa.gov.za/timeseriesdata/Excell/P0142.1%20PPI%20to%202012%20-%20discontinued.zip.
99. South African Reserve Bank: Historical Exchange and Interest Rates.http://www.resbank.co.za/Research/Rates/Pages/SelectedHistoricalExchangeAndInterestRates.aspx.
100. Department of Minerals and Energy: Biofuels Industrial Strategy of theRepublic of South Africa. Pretoria, South Africa: 2007.
101. Eberhard A: Grid-connected renewable energy in South Africa. InPresentation at the International Finance Corporation (IFC), Washington 2013.Washington, USA: IFC; 2013.
doi:10.1186/1754-6834-7-105Cite this article as: Petersen et al.: Techno-economic comparison ofethanol and electricity coproduction schemes from sugarcane residuesat existing sugar mills in Southern Africa. Biotechnology for Biofuels2014 7:105.
Submit your next manuscript to BioMed Centraland take full advantage of:
• Convenient online submission
• Thorough peer review
• No space constraints or color figure charges
• Immediate publication on acceptance
• Inclusion in PubMed, CAS, Scopus and Google Scholar
• Research which is freely available for redistribution
Submit your manuscript at www.biomedcentral.com/submit