technical review of the navajo nation drought … · technical review of the navajo nation drought...
TRANSCRIPT
Technical Review of the Navajo Nation Drought Contingency
Plan – Drought Monitoring Michael Crimmins, Nancy Selover, Karen Cozzetto, and Karletta Chief
Editor: Alison Meadow
ContentsClimatic Context 3
Water Resource Context 4
Historical Variability in Regional Climate 5
Short- vs. Long-term Drought 7
Current Drought Monitoring Procedures: An examination of the 6-month SPI Drought Index 8
SPI and Drought Monitoring: Shorter vs. longer timescales 9
A Closer Look at the 6-month SPI 10
Precipitation Seasonality and Drought Monitoring 12
Precipitation Data for Operational Drought Monitoring 14
Recommendations 16
References 19
APPENDIX A 20
APPENDIX B 21
APPENDIX C 23
APPENDIX D 23
TECHNICAL REVIEW OF THE NAVAJO NATION DROUGHT CONTINGENCY PLAN – DROUGHT MONITORING 3
IntroductionThe following review of the Navajo Nation Drought Contingency Plan, requested by the Navajo Nation Water Management Branch, was led by Michael Crimmins (University of Arizona), who recruited three additional reviewers: Nancy Selover (Arizona State University), Karen Cozzetto (University of Colorado), and Karletta Chief (University of Arizona). The specific request was for a technical review with a focus on the plan’s reliance on the 6-month Standardized Precipitation Index (SPI) as the trigger for Navajo Nation drought status. The report includes a description of the regional climate (including the prominence of climate variability in the region), the drought context in the Four Corners, a close look at the 6-month SPI and its value in drought planning, a discussion of regional drought monitoring, and a series of recommendation for the Water Management Branch based on the review of the plan and analysis of the climate data available to the reviewers.
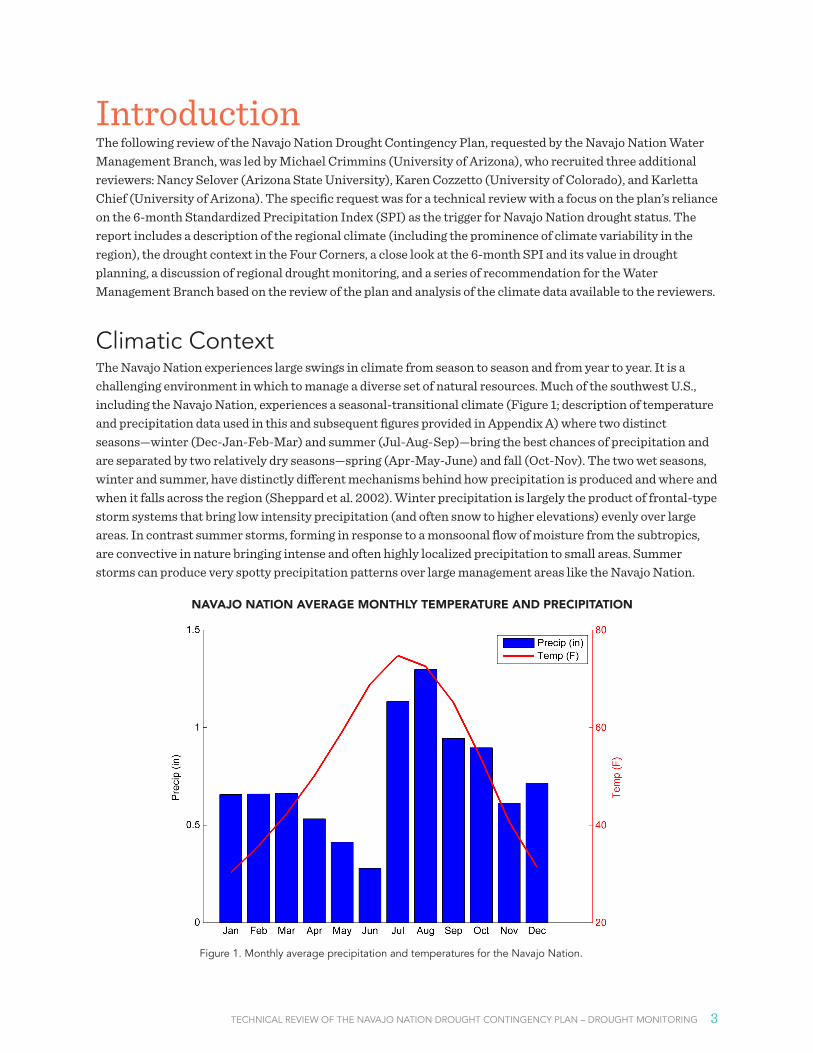
Climatic ContextThe Navajo Nation experiences large swings in climate from season to season and from year to year. It is a challenging environment in which to manage a diverse set of natural resources. Much of the southwest U.S., including the Navajo Nation, experiences a seasonal-transitional climate (Figure 1; description of temperature and precipitation data used in this and subsequent figures provided in Appendix A) where two distinct seasons—winter (Dec-Jan-Feb-Mar) and summer (Jul-Aug-Sep)—bring the best chances of precipitation and are separated by two relatively dry seasons—spring (Apr-May-June) and fall (Oct-Nov). The two wet seasons, winter and summer, have distinctly different mechanisms behind how precipitation is produced and where and when it falls across the region (Sheppard et al. 2002). Winter precipitation is largely the product of frontal-type storm systems that bring low intensity precipitation (and often snow to higher elevations) evenly over large areas. In contrast summer storms, forming in response to a monsoonal flow of moisture from the subtropics, are convective in nature bringing intense and often highly localized precipitation to small areas. Summer storms can produce very spotty precipitation patterns over large management areas like the Navajo Nation.
NAVAJO NATION AVERAGE MONTHLY TEMPERATURE AND PRECIPITATION
Figure 1. Monthly average precipitation and temperatures for the Navajo Nation.
TECHNICAL REVIEW OF THE NAVAJO NATION DROUGHT CONTINGENCY PLAN – DROUGHT MONITORING 4
This seasonal and natural ebb and flow of precipitation through the annual cycle supports a high level of biodiversity, but also creates a complex water budget with respect to surface water systems and an even more complex environment for drought monitoring. To add to this complexity, the region also experiences high levels of interannual variability in precipitation due to shifts in sea surface temperature and atmospheric circulation patterns across the Pacific Ocean related to the El Niño-Southern Oscillation (ENSO). Periodic shifts in ENSO bring enhanced chances of wet winter conditions to the Southwest during El Niño events or dry winter conditions during La Niña events. The impact of ENSO on summer precipitation is much weaker and less defined (Adams and Comrie 1997).
Water Resource ContextThe Draft Navajo Water Resources Development Strategy (2011) as well as reports from local resource managers indicate that the primary source of water for residents and small businesses served by public water systems on the Navajo Nation comes from a number of groundwater aquifers (up to or even over 90%), including the Coconino (C) Aquifer, the Navajo (N) Aquifer, the Dakota (D) Aquifer, the Morrison (M) Aquifer, the Mesa Verde Aquifer. Alluvial aquifers also contribute to the community water supply. The C Aquifer is recharged from outcrops on the Defiance Plateau, Mogollan Rim, and the San Francisco Mountains.
In addition, an estimated 30% of Navajo households are not served by public water systems. These households haul water from either potable watering points maintained by the Navajo Tribal Utility Authority (NTUA) or from nonpotable sources including private wells, livestock wells, and spring sources. Although they are not using public water systems, water haulers are nonetheless highly dependent on groundwater as well.
There are nearly 30 reservoirs—each with a surface area greater than 200 acres—that provide storage for agricultural irrigation water, recharge alluvial aquifers, and provide wildlife habitat and recreational and tourism opportunities. Additionally, the Navajo Agricultural Products Industry receives water from the San Juan River.
Water for livestock on the Navajo Nation comes from an estimated 7,500 stock ponds supplied by surface water runoff. These ponds are subject to evaporation and, if the ponds are not lined, infiltration. Windmill-powered wells can also tap into shallow alluvial aquifers and reduce water levels in stock ponds. The Navajo Nation Department of Water Resources maintains over 900 of these windmills. During drought, ranchers may also haul water for livestock. This hauled water may come from public water systems and thus groundwater sources.
TECHNICAL REVIEW OF THE NAVAJO NATION DROUGHT CONTINGENCY PLAN – DROUGHT MONITORING 5
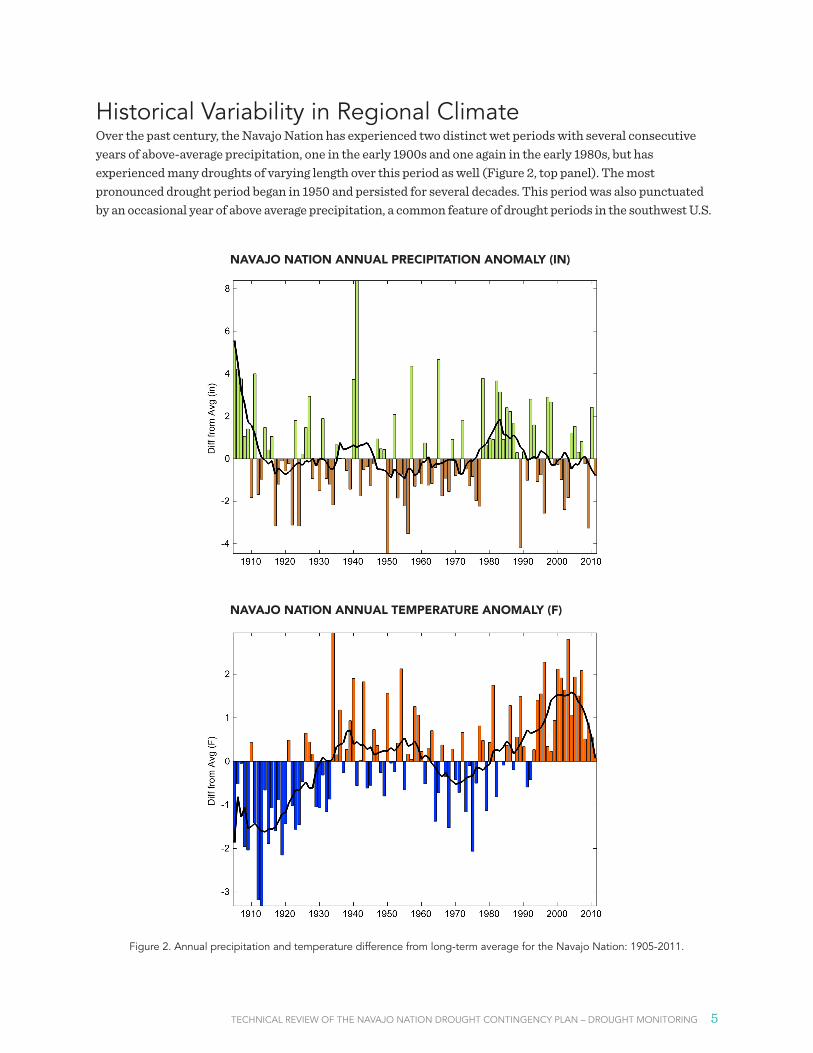
Historical Variability in Regional ClimateOver the past century, the Navajo Nation has experienced two distinct wet periods with several consecutive years of above-average precipitation, one in the early 1900s and one again in the early 1980s, but has experienced many droughts of varying length over this period as well (Figure 2, top panel). The most pronounced drought period began in 1950 and persisted for several decades. This period was also punctuated by an occasional year of above average precipitation, a common feature of drought periods in the southwest U.S.
NAVAJO NATION ANNUAL PRECIPITATION ANOMALY (IN)
NAVAJO NATION ANNUAL TEMPERATURE ANOMALY (F)
Figure 2. Annual precipitation and temperature difference from long-term average for the Navajo Nation: 1905-2011.

TECHNICAL REVIEW OF THE NAVAJO NATION DROUGHT CONTINGENCY PLAN – DROUGHT MONITORING 6
Precipitation variability over the past two decades (i.e., 1990s and 2000s) is somewhat different than the patterns observed earlier in the record. Since the wet period observed in the 1980s, annual precipitation amounts have switched rapidly between above-average and below-average levels leading to rapid swings between intense short-term drought conditions and unusually wet conditions. The 24-month SPI time series shown in Figure 3 depicts this rapid switching between unusually wet and dry conditions especially evident between 1990 and 2011. Note that variability in this period matches the wettest conditions of the 1980s (e.g. peak in 1997-98) and also the driest conditions of the 1950s (e.g. intense drought conditions in 2002). This pattern is also different than the periods observed in the early and mid-parts of the last century where more years were close to average (i.e. values close to 0 in Figure 3).
Figure 3. Monthly Standardized Precipitation Index (24 month window) values for the Navajo Nation: 1905-2011.
The mechanism causing the rapid switching between unusually wet and dry conditions over the past two decades is in part related to variability in ENSO events. The wet winter of 1997-1998 was related to a strong El Niño event and the intense 2002 drought event was related to a string of La Niña winters. It is unclear why interannual variability over this period is higher in comparison to earlier periods in the record (Goodrich and Ellis 2008). Nonetheless, this period has also been much warmer than any other period in the past 100 years (bottom panel, Figure 2). Warmer temperatures lead to higher rates of evapotranspiration creating additional water stress on plants and water resources. Several studies focusing on the southwest U.S. have demonstrated that the above-average temperatures observed in the past decade coincident with recent drought conditions have exacerbated drought stress and impacts across the region (Breshears et al. 2005, Weiss et al. 2012).
NAVAJO NATION AVERAGE STANDARDIZED PRECIPITATION INDEX (24 MONTHS: 1905-2011)

TECHNICAL REVIEW OF THE NAVAJO NATION DROUGHT CONTINGENCY PLAN – DROUGHT MONITORING 7
Short- vs. Long-term Drought The variability in precipitation and warming temperatures over the past two decades has created a unique and challenging set of conditions in which to monitor and manage drought impacts across the Southwest. When an intense drought event is followed by a short, but intense wet period it is often difficult to determine if and where drought conditions have improved. This situation necessitates examining drought indices that represent different timescales of drought. Often longer term drought conditions with impacts related to water resources and deeper rooted vegetation like trees can persist even though several months of above-average precipitation have helped improve short-term drought conditions related to agriculture and livestock production. Figure 4 is an illustration of how short- versus long-term drought conditions can differ at any given point in time. The graphic depicts monthly SPI values calculated from one to sixty months with longer time scales (longer-term drought) towards the top of the graphic. Green colors indicate wet conditions and yellows and browns indicate drought conditions. The color patterns lean to the right because immediate changes in monthly precipitation, either unusually wet or dry (Figure 4, bottom panel), impact slowly varying systems like surface water systems and ecosystems. With this drought index, what matters most is both the intensity of the monthly anomaly (whether a given month was above or below-average) and how many months were above or below average in a row. Note how intense drought conditions developed in 2002 over many months leading to very low SPI values at short and long timescales. Both short- and long-term drought conditions persisted for several years until a period of wet months occurred over the fall and winter of 2004-2005. This wet event helped improve both short- and long-term conditions. In contrast, intense drought conditions that developed in spring and summer of 2009 produced both short- and long-term drought conditions that were only marginally alleviated by wet winter conditions in January and February of 2010 (associated with a strong El Niño event). These wet winter conditions helped temporarily alleviate short-term drought conditions (green colors towards bottom of plot), but did little to improve the long-term drought situation (yellow colors toward the top of plot).
Long-term Drought (Example impacts: reduced flows in springs and rivers)
Very high SPI values at all time scales due to many consecutive months of above-average precipitation
DRY AVERAGE WET
Low SPI values at all time scales due to many consecutive months of below-average precipitation
Short-term Drought (Example impacts: poor rangeland conditions; agricultural impacts)
A short-run of above-average precip provides short-term drought relief, but long-term drought conditions remain at longer time-scales
NAVAJO NATION AVERAGE STANDARDIZED PRECIPITATION INDEX (1-60 MONTHS: 1970-2011)
Figure 4. Multi-scale Standardized Precipitation Index plot for Navajo Nation: 1970-2011.
TECHNICAL REVIEW OF THE NAVAJO NATION DROUGHT CONTINGENCY PLAN – DROUGHT MONITORING 8
Current Drought Monitoring Procedures: An examination of the 6-month SPI Drought IndexAs discussed earlier, seasonal variations in climate can lead to drought conditions emerging throughout the year related to unusually dry winter or summer conditions or some combination of both. Using a drought index that is sensitive to this seasonality is critical for drought monitoring plans operating in the southwest U.S. The 6-month SPI, currently used in the Navajo Nation Drought Contingency Plan (NNDCP) is a good choice given the seasonality of climate in the region, but this seasonality also influences how the index captures drought conditions through the annual cycle and over longer periods of time.
All the reviewers agreed that the 6-month SPI is a reasonable drought index for the region, but suggest that adding some additional metrics might help improve drought recognition and response times. Some concerns reviewers raised about over-reliance on the 6-month SPI are:
» It is not a long-term index and, therefore, might miss groundwater impacts.
» Alternately, the 6-month measure may be too long to capture the seasonal trends that impact shallow, alluvial aquifers or might impact farming decisions.
» SPI does not take temperature or evapotranspiration effect into account.
» Local resource managers have remarked that the 6-month SPI does not always match their assessments of on-the-ground conditions.
Below we provide some additional details about the strengths and weaknesses of different scales of SPI indices and approaches that can help make the 6-month SPI an even more functional drought monitoring tool.
TECHNICAL REVIEW OF THE NAVAJO NATION DROUGHT CONTINGENCY PLAN – DROUGHT MONITORING 9
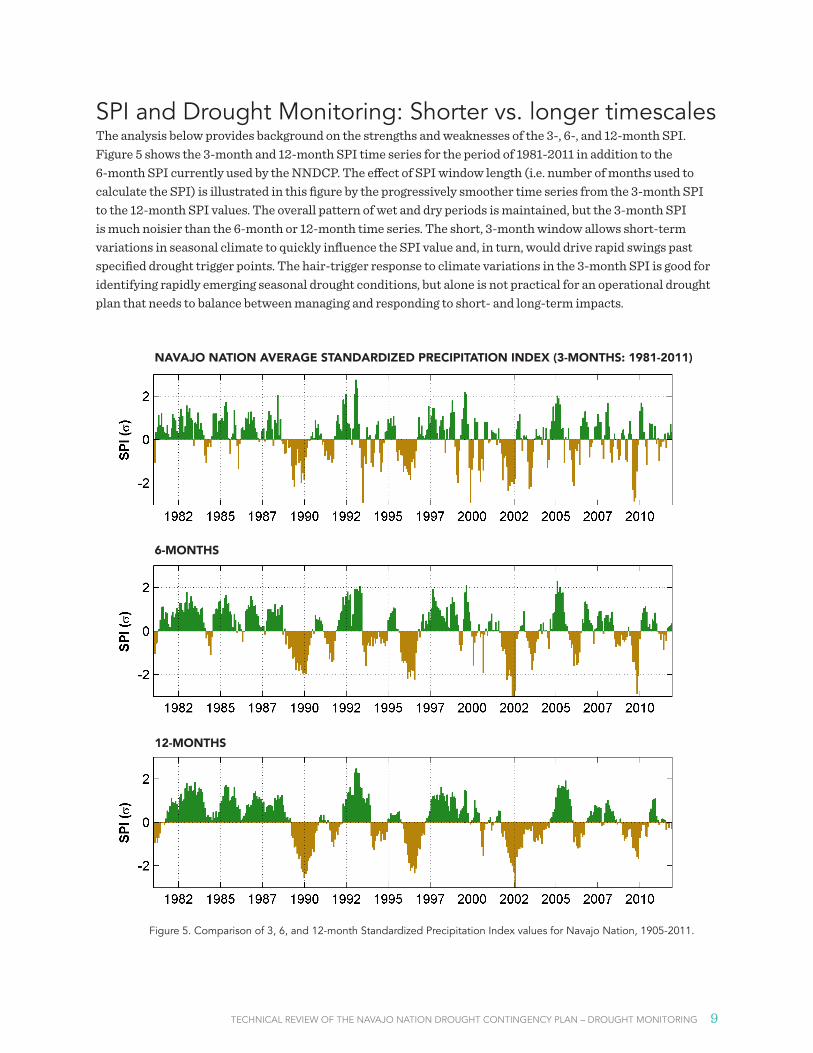
SPI and Drought Monitoring: Shorter vs. longer timescalesThe analysis below provides background on the strengths and weaknesses of the 3-, 6-, and 12-month SPI. Figure 5 shows the 3-month and 12-month SPI time series for the period of 1981-2011 in addition to the 6-month SPI currently used by the NNDCP. The effect of SPI window length (i.e. number of months used to calculate the SPI) is illustrated in this figure by the progressively smoother time series from the 3-month SPI to the 12-month SPI values. The overall pattern of wet and dry periods is maintained, but the 3-month SPI is much noisier than the 6-month or 12-month time series. The short, 3-month window allows short-term variations in seasonal climate to quickly influence the SPI value and, in turn, would drive rapid swings past specified drought trigger points. The hair-trigger response to climate variations in the 3-month SPI is good for identifying rapidly emerging seasonal drought conditions, but alone is not practical for an operational drought plan that needs to balance between managing and responding to short- and long-term impacts.
NAVAJO NATION AVERAGE STANDARDIZED PRECIPITATION INDEX (3-MONTHS: 1981-2011)
12-MONTHS
6-MONTHS
Figure 5. Comparison of 3, 6, and 12-month Standardized Precipitation Index values for Navajo Nation, 1905-2011.

TECHNICAL REVIEW OF THE NAVAJO NATION DROUGHT CONTINGENCY PLAN – DROUGHT MONITORING 10
In contrast, the 12-month SPI dampens the short-term seasonal variability, but may also mask rapidly emerging drought conditions that can arise in one season and quickly impact agricultural operations and rangeland conditions. The 6-month SPI appears to be a reasonable balance between the 3-month and 12-month indices, given that it preserves the seasonal precipitation signal that is important for the region, but also dampens some of the short-term variability that is also present in the region.
A Closer Look at the 6-month SPIGiven that the 6-month SPI is a reasonable choice for an operational drought-monitoring index it is useful to examine how it has varied historically and how it explicitly relates to drought triggers within the NNDCP. To achieve this we employed an analysis technique using multistate Markov models developed by Steinemann (2003) to evaluate drought indicators and triggers. Multistate Markov models, in this context, are created by examining historical time series and counting the number of times that drought conditions caused changes between different drought status categories. We used the drought status categories outlined in the NNDCP in this analysis (Figure 6).
6 mo SPI Status<‐1.5 Emergency
‐1 to ‐1.49 Warning0 t 0 99 Al t0 to ‐0.99 Alert
> 0 Normal
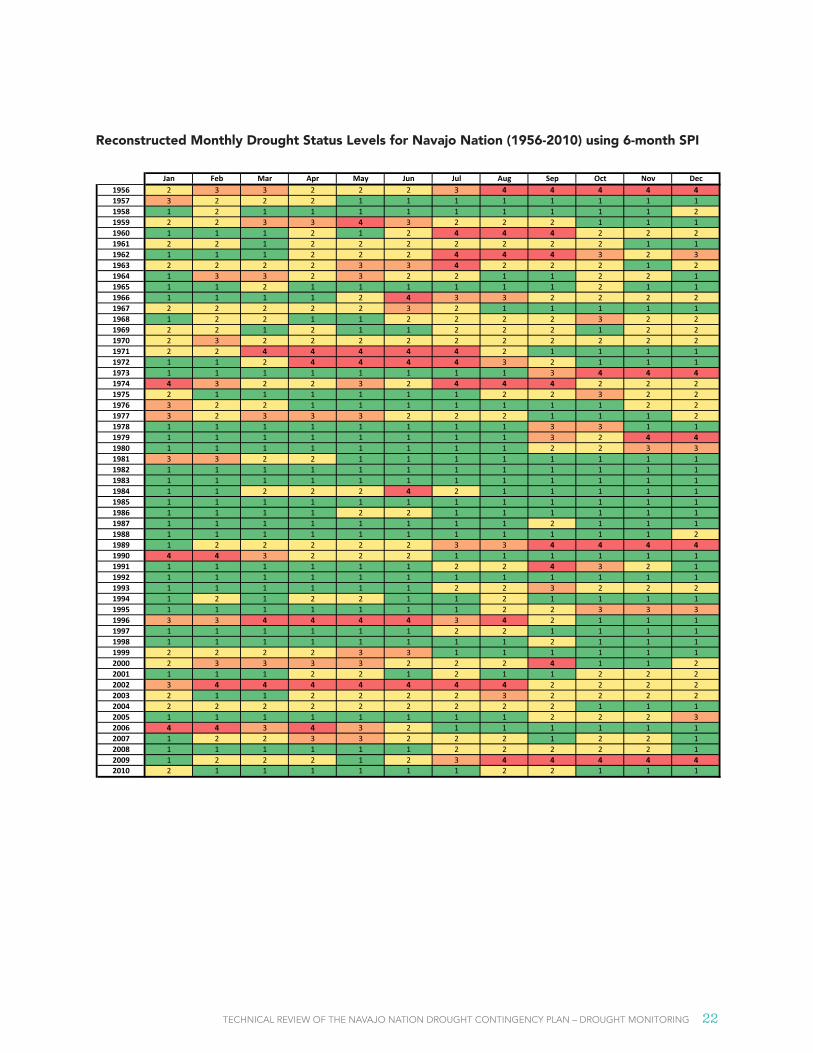
Drought status for each month was determined by first calculating the monthly value of the 6-month SPI between 1901 and 2010 using monthly precipitation data extracted from the PRISM gridded climate database (see Appendix A for more details). Depending on the SPI value with respect to the trigger levels defined in the NNDCP (shown in Figure 6), each month was assigned a drought status. The full matrix of historical monthly drought status levels is shown in Appendix B.
The first result examined is the mean and maximum duration in months of each drought status category (Figure 7). As would be expected, most stretches of months are spent in the Normal category, meaning that the index and trigger points are well specified to capture extreme events. What is interesting to note is that average duration of the Alert and Emergency levels are the same during the 1900-2010 period, meaning that less time is spent in the Warning level than either of these levels. This would mean that on average, Alert conditions would degrade quickly through the Warning level to the Emergency or just persist at the Alert level based on historical patterns. The longest durations (i.e. runs of consecutive months in each category) shown in the Max column also indicate that Emergency status ran longer than the Warning status in the historical record. This appears to be a function of the historical distribution of precipitation for the region and choice of trigger points. Moving the Warning status drought trigger point of 6-month SPI<-1 down to a lower value would even out the number of months spent in the Warning and Emergency categories. Ideally, fewer months would be at the Emergency level relative to the Warning level, but lowering the trigger point would come at the expense of early warnings when conditions worsened from Alert status to Warning. Reexamining drought trigger points and drought plan actions with respect to recent events would be a useful exercise to undertake to ensure that the trigger points are operating to the satisfaction of all parties being served by the NNDCP.
Also of note is that the longest durations (i.e. runs of consecutive months in each category) during
Figure 6. NNDCP 6-month SPI trigger points.
Status Average Max Average MaxEmergency 3.0 7 2.9 7Warning 1.5 5 1.8 5
1900‐2010 1981‐2010Drought Status Duration (months)
gAlert 3.0 13 2.5 13
Normal 6.4 34 7.4 34
Figure 7. Drought status duration statistics in months based on 6-month SPI and NNDCP trigger points.

TECHNICAL REVIEW OF THE NAVAJO NATION DROUGHT CONTINGENCY PLAN – DROUGHT MONITORING 11
the period of record from 1900-2010 all occurred in the past several decades (1981-2010). This is consistent with the rapid switching between extreme wet and dry conditions discussed earlier. This may also be a contributing factor to the skew towards longer stretches in either Alert or Emergency status.
To further explore how drought status categories varied over time, transition probabilities between each category were calculated as part of the Markov model analysis. Transition probabilities shown in the bottom table of Figure 8 were calculated by counting the number of transitions (shown in the top table of Figure 8) between categories for all months between 1900-2010 and then divided by the total number of transitions within that category. For example, if the drought status for January 1930 was Normal and was Normal again in February 1930, that would get added to the box that has a column heading of Normal and a row heading of Normal.
Transition Matrix FromNormal Alert Warning Emergency
To Normal 554 99 2 2Alert 96 308 48 12
Warning 6 44 34 18Emergency 0 13 19 64
Sum 656 464 103 96
Transition Probabilities FromNormal Alert Warning Emergency
To Normal 0.84 0.21 0.02 0.02Alert 0.15 0.66 0.47 0.13
Warning 0.01 0.09 0.33 0.19Emergency 0.00 0.03 0.18 0.67
Figure 8. Drought status transition counts (top) and probabilities (bottom) based on 6-month SPI and NNDCP trigger points.
The transition counts shown in the top table of Figure 8 show the number times there was a transition from (columns) one drought status to (rows) another status. The Normal to Normal category has the largest number (554 months) meaning that most months in the period of 1900-2010 were in the Normal status and did not transition from month to month. The second highest number was in the Alert to Alert transition with 308 months persisting at this status. The transition counts are more usefully interpreted in the context of transition probabilities displayed in the bottom table of Figure 8. These probabilities indicate the chance of staying or moving to another drought status category in any given month based on historical patterns. For example, if your drought status is Normal for the current month, you can look down the Normal column and see that there is an 84% chance that the next month will also be normal, a 15% chance that an Alert status will emerge, a 1% chance of a two category jump to Warning status and a 0% of a two category jump to Emergency status. Again, these are probabilities based on historical patterns in precipitation. These probabilities could change if substantially new patterns of precipitation variability emerge in the future, but are still useful in gauging the present behavior of the 6-month SPI and currently specified drought trigger points.
Within the transition probability matrix, note that one category transitions are much more common than two category transitions meaning that the drought trigger points connected to the 6-month SPI are dampening rapid transitions that jump categories, a favorable behavior for an operational drought monitoring index. Drought monitoring indices and trigger points should be sensitive enough to detect rapidly deteriorating conditions, but not overly sensitive so as not to respond to large swings in monthly precipitation. As discussed earlier, a smaller SPI window, like the 3 month SPI, would produce many more rapid transitions and two-
Transition Counts
TECHNICAL REVIEW OF THE NAVAJO NATION DROUGHT CONTINGENCY PLAN – DROUGHT MONITORING 12
category jumps making it overly sensitive to short-term variations in precipitation and requiring many, possibly premature, actions triggered in each drought status category.
Transition probabilities shown in Figure 8 associated with the Alert, Warning and Emergency drought status categories exhibit some interesting and important patterns with respect to drought monitoring and management within the NNDCP. Based on historical patterns, if the current month is in Alert status the probability matrix indicates that there is a 66% chance that Alert conditions will persist another month or 21% chance of moving back to normal conditions. The chance of moving from Alert to Warning is relatively small at 9% and a two category jump from Alert to Emergency is very unlikely at 3%. But if conditions do worsen to the Warning level the probabilities of worsening conditions increases dramatically. If the current month is at the Warning level there is a good chance (47%) that conditions may improve back to Alert status the next month, but also a decent chance (33%) of Warning conditions persisting or even worsening to Emergency status (18%). Once conditions worsen to Emergency status it is very likely (67%) that they will persist at least another month before improving. The historical analysis presented earlier notes that once an Emergency level drought has been triggered it will persist on average for 3 months, but can last as long as 7 months in a row.
A transition probability matrix like the one presented here can be useful in an operational sense by gauging immediate expectations of changes in drought status and potentially helping guide short-term drought planning and response decisions. For example, if the current status is at the Alert level, historical patterns would suggest that Alert conditions would persist for at least three months but as long as thirteen. This information could be used to anticipate potential drought response needs and provide time to facilitate communication and coordination among parties potentially impacted by developing drought conditions.
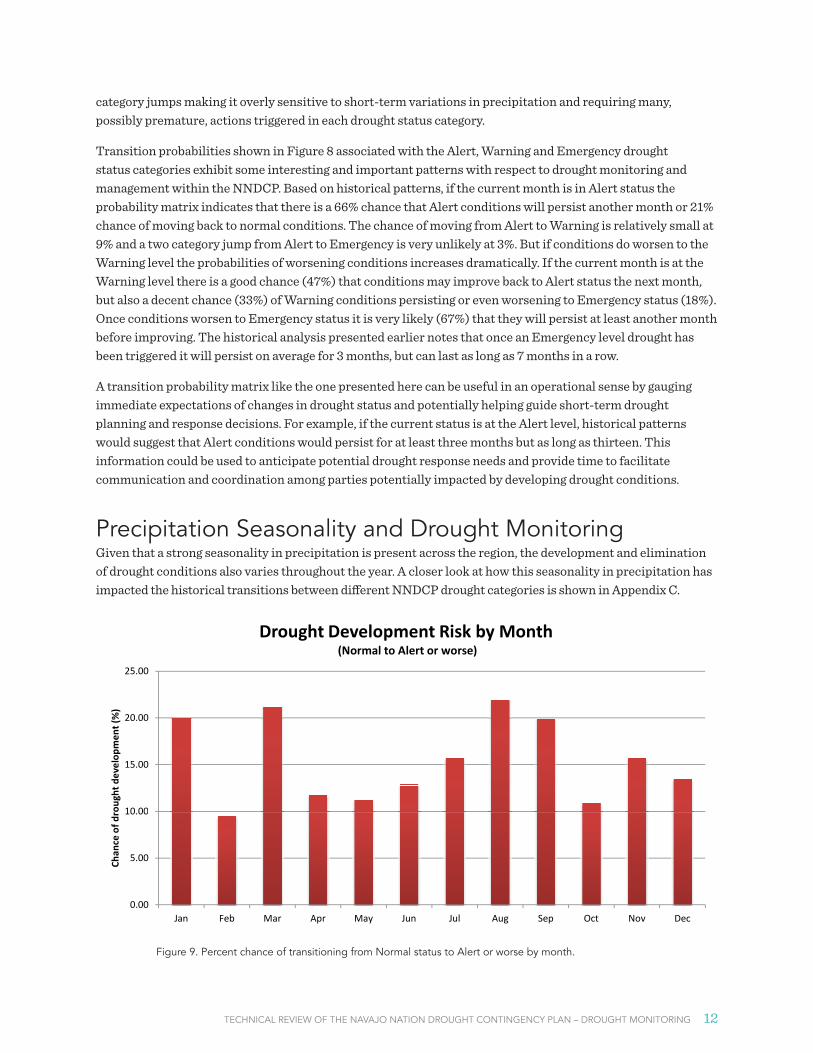
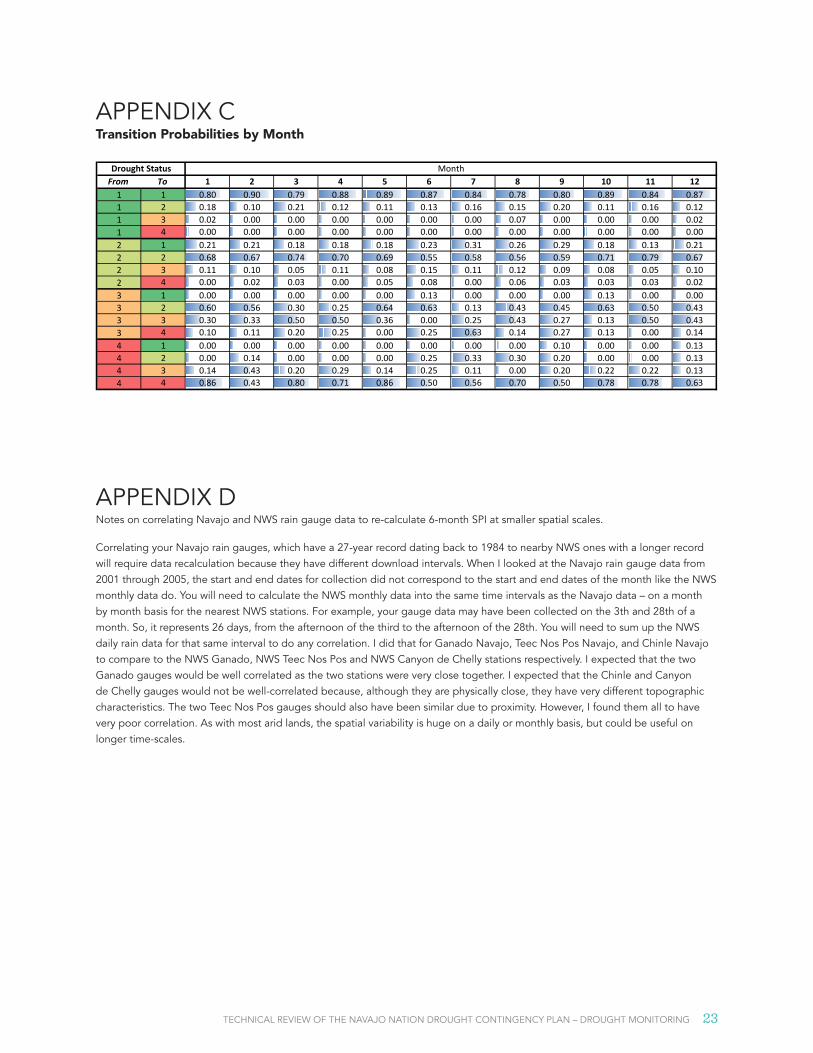
Precipitation Seasonality and Drought MonitoringGiven that a strong seasonality in precipitation is present across the region, the development and elimination of drought conditions also varies throughout the year. A closer look at how this seasonality in precipitation has impacted the historical transitions between different NNDCP drought categories is shown in Appendix C.
10 00
15.00
20.00
25.00
roug
ht develop
men
t (%)
Drought Development Risk by Month(Normal to Alert or worse)
0.00
5.00
10.00
Jan Feb Mar Apr May Jun Jul Aug Sep Oct Nov Dec
Chan
ce of d
r
Month
Figure 9. Percent chance of transitioning from Normal status to Alert or worse by month.
TECHNICAL REVIEW OF THE NAVAJO NATION DROUGHT CONTINGENCY PLAN – DROUGHT MONITORING 13
What this analysis highlights is that the risk of drought conditions developing typically peaks towards the end of each wet season. Figure 9 shows the drought development risk for each month, which is the percent chance of conditions worsening from a present Normal status. Note how the chance of drought developing follows closely the typical annual cycle in precipitation shown in Figure 1 with drought development chances exceeding 20% in March and August when seasonal precipitation totals will be good indicators of whether or not drought conditions have developed or not.
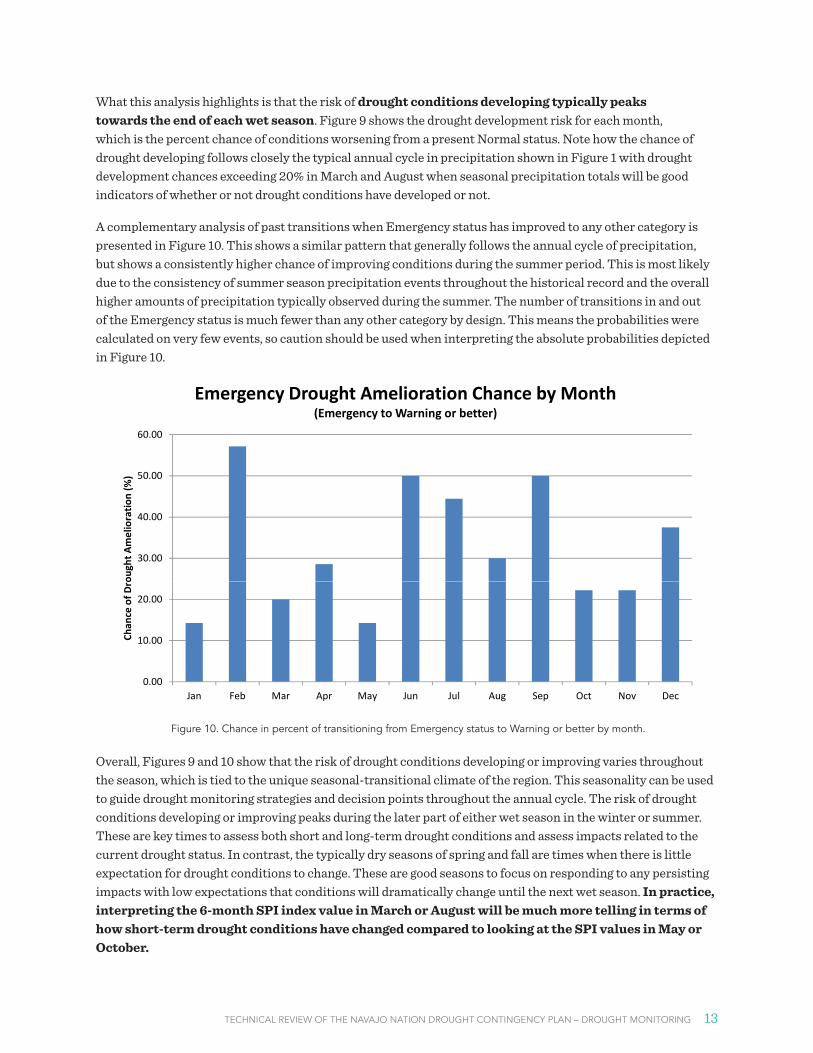
A complementary analysis of past transitions when Emergency status has improved to any other category is presented in Figure 10. This shows a similar pattern that generally follows the annual cycle of precipitation, but shows a consistently higher chance of improving conditions during the summer period. This is most likely due to the consistency of summer season precipitation events throughout the historical record and the overall higher amounts of precipitation typically observed during the summer. The number of transitions in and out of the Emergency status is much fewer than any other category by design. This means the probabilities were calculated on very few events, so caution should be used when interpreting the absolute probabilities depicted in Figure 10.
Figure 10. Chance in percent of transitioning from Emergency status to Warning or better by month.
30.00
40.00
50.00
60.00
ough
t Amelioratio
n (%
)
Emergency Drought Amelioration Chance by Month (Emergency to Warning or better)
0.00
10.00
20.00
Jan Feb Mar Apr May Jun Jul Aug Sep Oct Nov Dec
Chan
ce of D
ro
Month
Overall, Figures 9 and 10 show that the risk of drought conditions developing or improving varies throughout the season, which is tied to the unique seasonal-transitional climate of the region. This seasonality can be used to guide drought monitoring strategies and decision points throughout the annual cycle. The risk of drought conditions developing or improving peaks during the later part of either wet season in the winter or summer. These are key times to assess both short and long-term drought conditions and assess impacts related to the current drought status. In contrast, the typically dry seasons of spring and fall are times when there is little expectation for drought conditions to change. These are good seasons to focus on responding to any persisting impacts with low expectations that conditions will dramatically change until the next wet season. In practice, interpreting the 6-month SPI index value in March or August will be much more telling in terms of how short-term drought conditions have changed compared to looking at the SPI values in May or October.
TECHNICAL REVIEW OF THE NAVAJO NATION DROUGHT CONTINGENCY PLAN – DROUGHT MONITORING 14
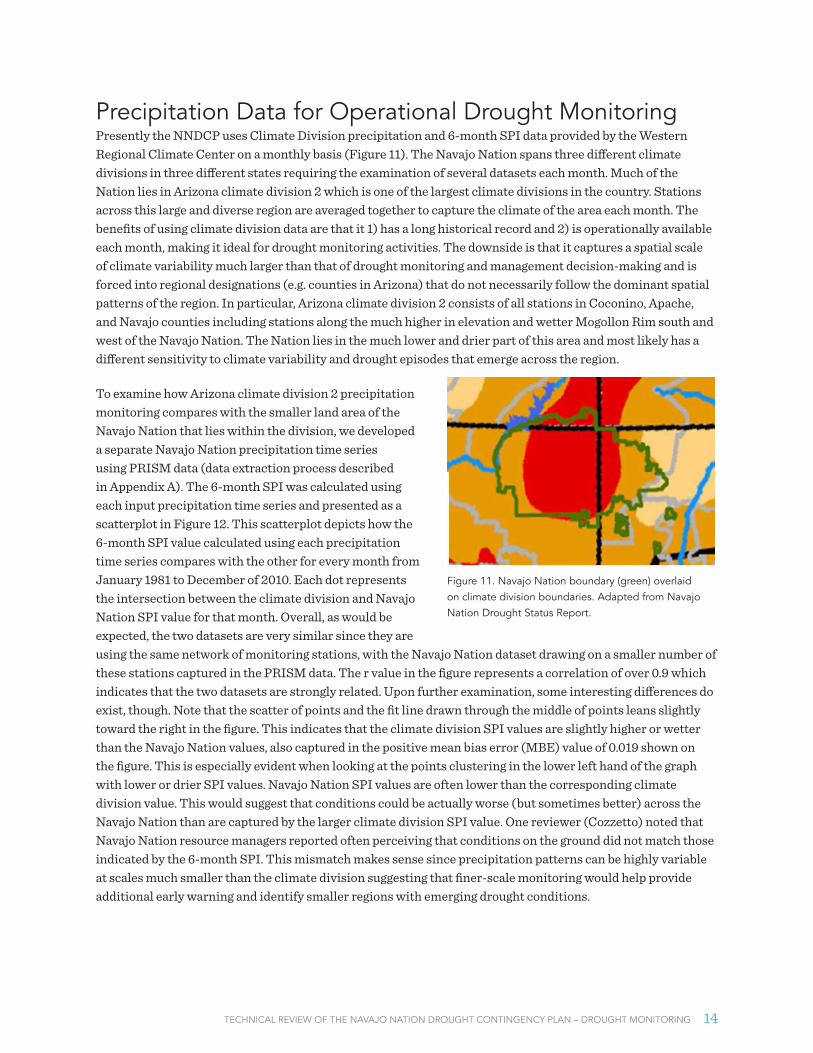
Precipitation Data for Operational Drought MonitoringPresently the NNDCP uses Climate Division precipitation and 6-month SPI data provided by the Western Regional Climate Center on a monthly basis (Figure 11). The Navajo Nation spans three different climate divisions in three different states requiring the examination of several datasets each month. Much of the Nation lies in Arizona climate division 2 which is one of the largest climate divisions in the country. Stations across this large and diverse region are averaged together to capture the climate of the area each month. The benefits of using climate division data are that it 1) has a long historical record and 2) is operationally available each month, making it ideal for drought monitoring activities. The downside is that it captures a spatial scale of climate variability much larger than that of drought monitoring and management decision-making and is forced into regional designations (e.g. counties in Arizona) that do not necessarily follow the dominant spatial patterns of the region. In particular, Arizona climate division 2 consists of all stations in Coconino, Apache, and Navajo counties including stations along the much higher in elevation and wetter Mogollon Rim south and west of the Navajo Nation. The Nation lies in the much lower and drier part of this area and most likely has a different sensitivity to climate variability and drought episodes that emerge across the region.
Figure 11. Navajo Nation boundary (green) overlaid on climate division boundaries. Adapted from Navajo Nation Drought Status Report.
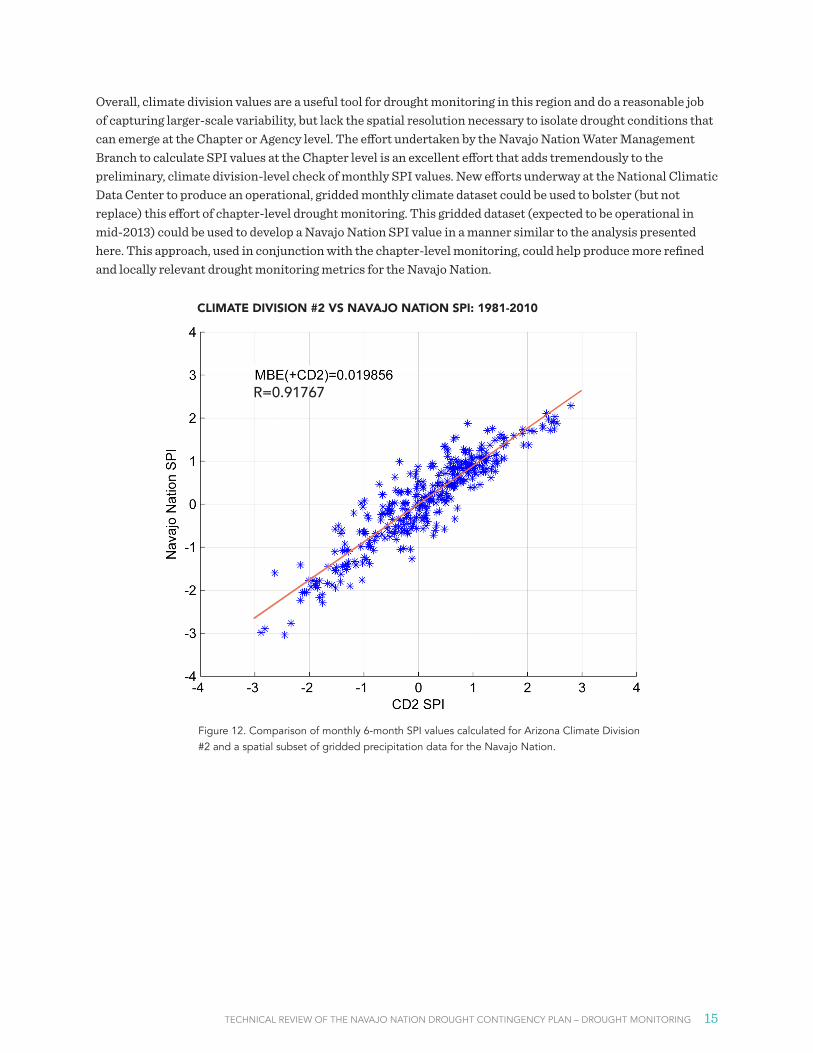
To examine how Arizona climate division 2 precipitation monitoring compares with the smaller land area of the Navajo Nation that lies within the division, we developed a separate Navajo Nation precipitation time series using PRISM data (data extraction process described in Appendix A). The 6-month SPI was calculated using each input precipitation time series and presented as a scatterplot in Figure 12. This scatterplot depicts how the 6-month SPI value calculated using each precipitation time series compares with the other for every month from January 1981 to December of 2010. Each dot represents the intersection between the climate division and Navajo Nation SPI value for that month. Overall, as would be expected, the two datasets are very similar since they are using the same network of monitoring stations, with the Navajo Nation dataset drawing on a smaller number of these stations captured in the PRISM data. The r value in the figure represents a correlation of over 0.9 which indicates that the two datasets are strongly related. Upon further examination, some interesting differences do exist, though. Note that the scatter of points and the fit line drawn through the middle of points leans slightly toward the right in the figure. This indicates that the climate division SPI values are slightly higher or wetter than the Navajo Nation values, also captured in the positive mean bias error (MBE) value of 0.019 shown on the figure. This is especially evident when looking at the points clustering in the lower left hand of the graph with lower or drier SPI values. Navajo Nation SPI values are often lower than the corresponding climate division value. This would suggest that conditions could be actually worse (but sometimes better) across the Navajo Nation than are captured by the larger climate division SPI value. One reviewer (Cozzetto) noted that Navajo Nation resource managers reported often perceiving that conditions on the ground did not match those indicated by the 6-month SPI. This mismatch makes sense since precipitation patterns can be highly variable at scales much smaller than the climate division suggesting that finer-scale monitoring would help provide additional early warning and identify smaller regions with emerging drought conditions.
TECHNICAL REVIEW OF THE NAVAJO NATION DROUGHT CONTINGENCY PLAN – DROUGHT MONITORING 15
Overall, climate division values are a useful tool for drought monitoring in this region and do a reasonable job of capturing larger-scale variability, but lack the spatial resolution necessary to isolate drought conditions that can emerge at the Chapter or Agency level. The effort undertaken by the Navajo Nation Water Management Branch to calculate SPI values at the Chapter level is an excellent effort that adds tremendously to the preliminary, climate division-level check of monthly SPI values. New efforts underway at the National Climatic Data Center to produce an operational, gridded monthly climate dataset could be used to bolster (but not replace) this effort of chapter-level drought monitoring. This gridded dataset (expected to be operational in mid-2013) could be used to develop a Navajo Nation SPI value in a manner similar to the analysis presented here. This approach, used in conjunction with the chapter-level monitoring, could help produce more refined and locally relevant drought monitoring metrics for the Navajo Nation.
Figure 12. Comparison of monthly 6-month SPI values calculated for Arizona Climate Division #2 and a spatial subset of gridded precipitation data for the Navajo Nation.
CLIMATE DIVISION #2 VS NAVAJO NATION SPI: 1981-2010
R=0.91767
TECHNICAL REVIEW OF THE NAVAJO NATION DROUGHT CONTINGENCY PLAN – DROUGHT MONITORING 16
RecommendationsAll reviewers agree that the 6-month SPI is a reasonable metric for monitoring drought on the Navajo Nation. However, we suggest a range of methods to improve monitoring both by slightly altering the way in which the 6-month SPI is used and by adding some additional metrics to the drought monitoring protocols.
1. GETTING MORE FROM THE 6-MONTH SPI
a. Evaluate trigger point thresholds. The performance of the 6-month SPI with respect to raising and/or rescinding drought declarations can be adjusted through the trigger point thresholds. The Markov analysis presented earlier reveals that the duration and frequency of various drought levels using the current trigger points is probably performing as would be expected based on a statistical analysis, but it is unclear whether these are the right trigger points and expected behavior based on actual drought decision making undertaken within the Navajo Nation. Consider revising the trigger points based on the drought impacts most important or of concern in the region. Integration of drought impacts into drought monitoring protocols is discussed below.
b. Refine metrics for changing drought categories. In addition to adjusting trigger points, how the monthly 6-month SPI value is interpreted with respect to changing drought status can also be constrained. Rather than allowing the drought status to change based solely on the current month’s SPI value, the number of months exceeding a trigger point can also be incorporated. For example, the Operational Drought Plan for the State of Arizona requires that a trigger point be exceeded for two months in a row before a change to a worsening drought status goes into effect. For improving conditions the constraint for persisting conditions is even higher. Four consecutive months have to show improving conditions before a drought status can move to a higher category. These modifications increase the sensitivity of the drought index in detecting the onset of drought, but dampen its ability to quickly move out of drought conditions prematurely.
c. Correlate Navajo Nation and NWS rain gauges. To assess how well the 6-month SPI reflects conditions at smaller spatial scales, the data from the Navajo Nation rain gauges could be correlated with data from NWS gauges. One reviewer (Selover), who is familiar with the Navajo rain gauge data, cautions that some additional work will be required to correlate the data because the download intervals between the two sets of gauges are different. She notes that a preliminary analysis indicates low correlation between Navajo rain gauges and NWS gauges – indicating that the NWS gauges may not be fully capturing conditions on the ground (see Appendix D for more details).
d. Focus drought monitoring on key times of year. Drought monitoring and planning activities could be focused on specific times of years. The historical analysis of SPI variability shows that late winter and late summer experience the largest and most frequent changes in drought status, consistent with the seasonality of precipitation across the region. This suggests that drought monitoring and planning activities could be organized around these periods throughout the year. It does not eliminate the need for monthly monitoring, but allows for seasonally adjusted expectations on how conditions may change, what type of monitoring activities to undertake, and what types of impacts to expect.
e. Apply different SPI scales to different water resources. Different time scales of SPI analysis can also be focused on different areas of the Navajo Nation, depending on how that area might be impacted by relatively shorter- or longer-term drought impacts. For example, calculate shorter-term (6-, 9-month) SPI for the Chuska Mountain/reservoir drainage basin. This could be a single SPI for the Chuska Mountains in general not for each individual reservoir. In addition calculate longer-term (e.g.
TECHNICAL REVIEW OF THE NAVAJO NATION DROUGHT CONTINGENCY PLAN – DROUGHT MONITORING 17
12- to 24-month) SPI indices for groundwater basins important for the Navajo Nation, in particular for the recharge areas of these groundwater basins if known. For instance, the C Aquifer is recharged from outcrops on the Defiance Plateau, Mogollan Rim, and the San Francisco Mountains. If there are sufficient Navajo precipitation cans and NWS stations, longer-term SPI indices could be calculated for this area. This approach requires consistent monitoring and recording of data from Navajo Nation precipitation monitors.
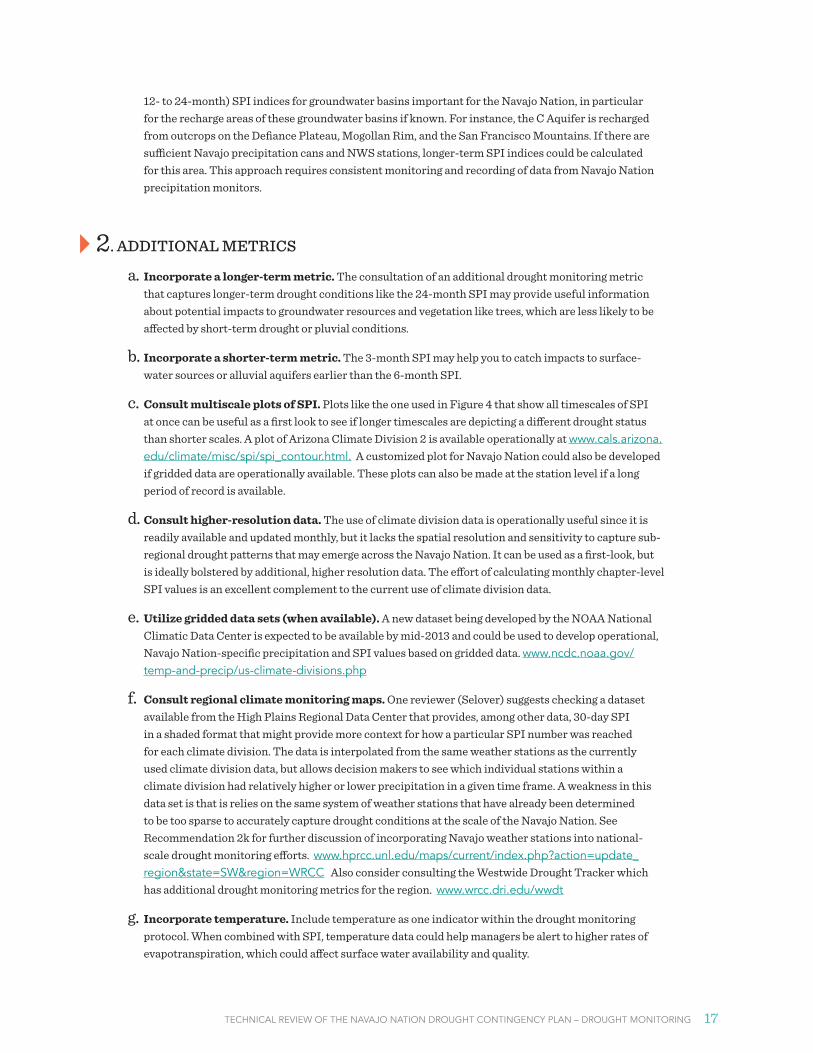
2. ADDITIONAL METRICS
a. Incorporate a longer-term metric. The consultation of an additional drought monitoring metric that captures longer-term drought conditions like the 24-month SPI may provide useful information about potential impacts to groundwater resources and vegetation like trees, which are less likely to be affected by short-term drought or pluvial conditions.
b. Incorporate a shorter-term metric. The 3-month SPI may help you to catch impacts to surface-water sources or alluvial aquifers earlier than the 6-month SPI.
c. Consult multiscale plots of SPI. Plots like the one used in Figure 4 that show all timescales of SPI at once can be useful as a first look to see if longer timescales are depicting a different drought status than shorter scales. A plot of Arizona Climate Division 2 is available operationally at www.cals.arizona.edu/climate/misc/spi/spi_contour.html. A customized plot for Navajo Nation could also be developed if gridded data are operationally available. These plots can also be made at the station level if a long period of record is available.
d. Consult higher-resolution data. The use of climate division data is operationally useful since it is readily available and updated monthly, but it lacks the spatial resolution and sensitivity to capture sub-regional drought patterns that may emerge across the Navajo Nation. It can be used as a first-look, but is ideally bolstered by additional, higher resolution data. The effort of calculating monthly chapter-level SPI values is an excellent complement to the current use of climate division data.
e. Utilize gridded data sets (when available). A new dataset being developed by the NOAA National Climatic Data Center is expected to be available by mid-2013 and could be used to develop operational, Navajo Nation-specific precipitation and SPI values based on gridded data. www.ncdc.noaa.gov/temp-and-precip/us-climate-divisions.php
f. Consult regional climate monitoring maps. One reviewer (Selover) suggests checking a dataset available from the High Plains Regional Data Center that provides, among other data, 30-day SPI in a shaded format that might provide more context for how a particular SPI number was reached for each climate division. The data is interpolated from the same weather stations as the currently used climate division data, but allows decision makers to see which individual stations within a climate division had relatively higher or lower precipitation in a given time frame. A weakness in this data set is that is relies on the same system of weather stations that have already been determined to be too sparse to accurately capture drought conditions at the scale of the Navajo Nation. See Recommendation 2k for further discussion of incorporating Navajo weather stations into national-scale drought monitoring efforts. www.hprcc.unl.edu/maps/current/index.php?action=update_region&state=SW®ion=WRCC Also consider consulting the Westwide Drought Tracker which has additional drought monitoring metrics for the region. www.wrcc.dri.edu/wwdt
g. Incorporate temperature. Include temperature as one indicator within the drought monitoring protocol. When combined with SPI, temperature data could help managers be alert to higher rates of evapotranspiration, which could affect surface water availability and quality.
TECHNICAL REVIEW OF THE NAVAJO NATION DROUGHT CONTINGENCY PLAN – DROUGHT MONITORING 18
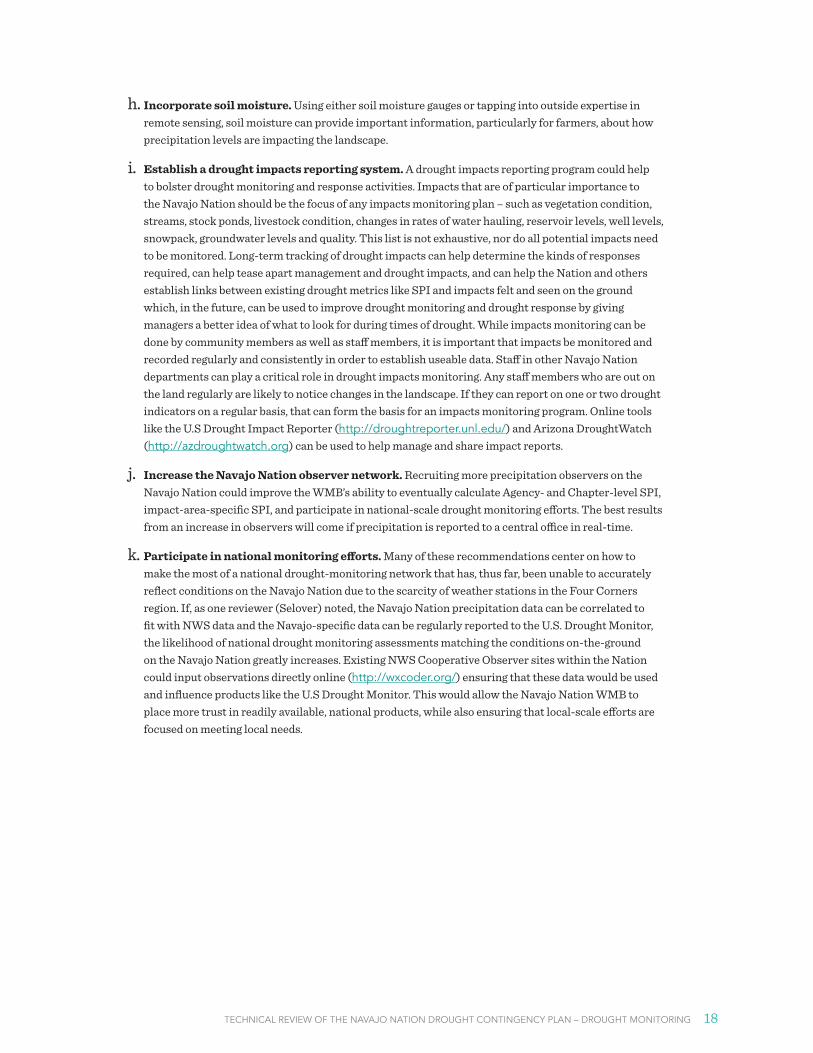
h. Incorporate soil moisture. Using either soil moisture gauges or tapping into outside expertise in remote sensing, soil moisture can provide important information, particularly for farmers, about how precipitation levels are impacting the landscape.
i. Establish a drought impacts reporting system. A drought impacts reporting program could help to bolster drought monitoring and response activities. Impacts that are of particular importance to the Navajo Nation should be the focus of any impacts monitoring plan – such as vegetation condition, streams, stock ponds, livestock condition, changes in rates of water hauling, reservoir levels, well levels, snowpack, groundwater levels and quality. This list is not exhaustive, nor do all potential impacts need to be monitored. Long-term tracking of drought impacts can help determine the kinds of responses required, can help tease apart management and drought impacts, and can help the Nation and others establish links between existing drought metrics like SPI and impacts felt and seen on the ground which, in the future, can be used to improve drought monitoring and drought response by giving managers a better idea of what to look for during times of drought. While impacts monitoring can be done by community members as well as staff members, it is important that impacts be monitored and recorded regularly and consistently in order to establish useable data. Staff in other Navajo Nation departments can play a critical role in drought impacts monitoring. Any staff members who are out on the land regularly are likely to notice changes in the landscape. If they can report on one or two drought indicators on a regular basis, that can form the basis for an impacts monitoring program. Online tools like the U.S Drought Impact Reporter (http://droughtreporter.unl.edu/) and Arizona DroughtWatch (http://azdroughtwatch.org) can be used to help manage and share impact reports.
j. Increase the Navajo Nation observer network. Recruiting more precipitation observers on the Navajo Nation could improve the WMB’s ability to eventually calculate Agency- and Chapter-level SPI, impact-area-specific SPI, and participate in national-scale drought monitoring efforts. The best results from an increase in observers will come if precipitation is reported to a central office in real-time.
k. Participate in national monitoring efforts. Many of these recommendations center on how to make the most of a national drought-monitoring network that has, thus far, been unable to accurately reflect conditions on the Navajo Nation due to the scarcity of weather stations in the Four Corners region. If, as one reviewer (Selover) noted, the Navajo Nation precipitation data can be correlated to fit with NWS data and the Navajo-specific data can be regularly reported to the U.S. Drought Monitor, the likelihood of national drought monitoring assessments matching the conditions on-the-ground on the Navajo Nation greatly increases. Existing NWS Cooperative Observer sites within the Nation could input observations directly online (http://wxcoder.org/) ensuring that these data would be used and influence products like the U.S Drought Monitor. This would allow the Navajo Nation WMB to place more trust in readily available, national products, while also ensuring that local-scale efforts are focused on meeting local needs.

TECHNICAL REVIEW OF THE NAVAJO NATION DROUGHT CONTINGENCY PLAN – DROUGHT MONITORING 19
ReferencesAdams, D.K. and A.C. Comrie. 1997. The North American Monsoon. Bulletin of the American Meteorological
Society 78: 2197-2213.
Breshears, D. D., N.S. Cobb, P.M. Rich, K.P. Price, C.D. Allen, R.G. Balice, W. H. Romme, et al. 2005. Regional Vegetation Die-off in Response to Global-change Type Drought. Proceedings of the National Academy of Sciences 102 (42): 15144-15148.
Goodrich, Gregory B, and Andrew W Ellis. 2008. Climatic Controls and Hydrologic Impacts of a Recent Extreme Seasonal Precipitation Reversal in Arizona. Journal of Applied Meteorology and Climatology 47 (2): 498-508.
Navajo Nation Department of Water Resources. 2011. Draft Water Resource Development Strategy for the Navajo Nation. July 2011. Accessed from http://www.tribesandclimatechange.org/docs/tribes_357.pdf.
Sheppard, P.R., A.C. Comrie, G.D. Packin, K. Angersbach, and M.K. Hughes. 2002. The Climate of the U.S. Southwest. Climate Research 21: 219-238.
Steinemann, A. 2003. Drought Indicators and Triggers: A Stochastic Approach to Evaluation. JAWRA Journal of the American Water Resources Association 39 (5): 1217–1233. doi:10.1111/j.1752-1688.2003.tb03704.x.
Weiss, J.L., J.L. Betancourt, and J.T. Overpeck. 2012. Climatic Limits on Foliar Growth During Major Droughts in the Southwestern USA. Journal of Geophysical Research 117 (G3) (September 20): G03031. doi:10.1029/2012JG001993.
TECHNICAL REVIEW OF THE NAVAJO NATION DROUGHT CONTINGENCY PLAN – DROUGHT MONITORING 20
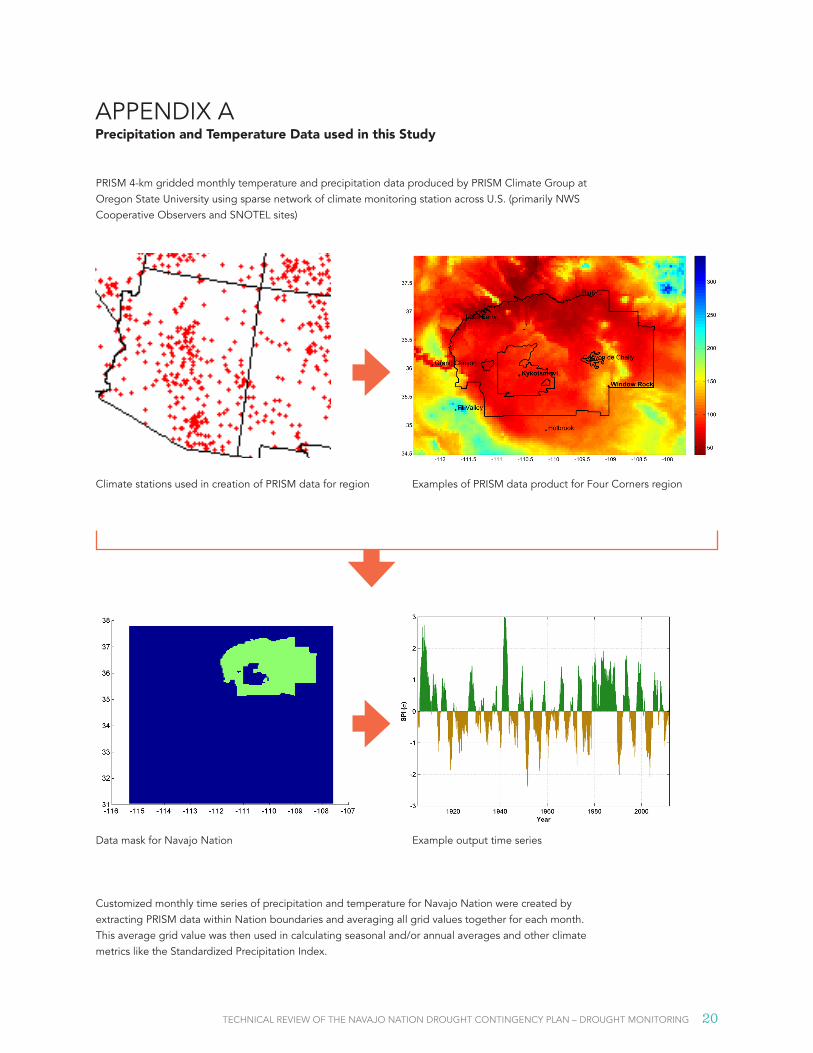
APPENDIX APrecipitation and Temperature Data used in this Study
PRISM 4-km gridded monthly temperature and precipitation data produced by PRISM Climate Group at Oregon State University using sparse network of climate monitoring station across U.S. (primarily NWS Cooperative Observers and SNOTEL sites)
Climate stations used in creation of PRISM data for region
Data mask for Navajo Nation
Customized monthly time series of precipitation and temperature for Navajo Nation were created by extracting PRISM data within Nation boundaries and averaging all grid values together for each month. This average grid value was then used in calculating seasonal and/or annual averages and other climate metrics like the Standardized Precipitation Index.
Examples of PRISM data product for Four Corners region
Example output time series
TECHNICAL REVIEW OF THE NAVAJO NATION DROUGHT CONTINGENCY PLAN – DROUGHT MONITORING 21
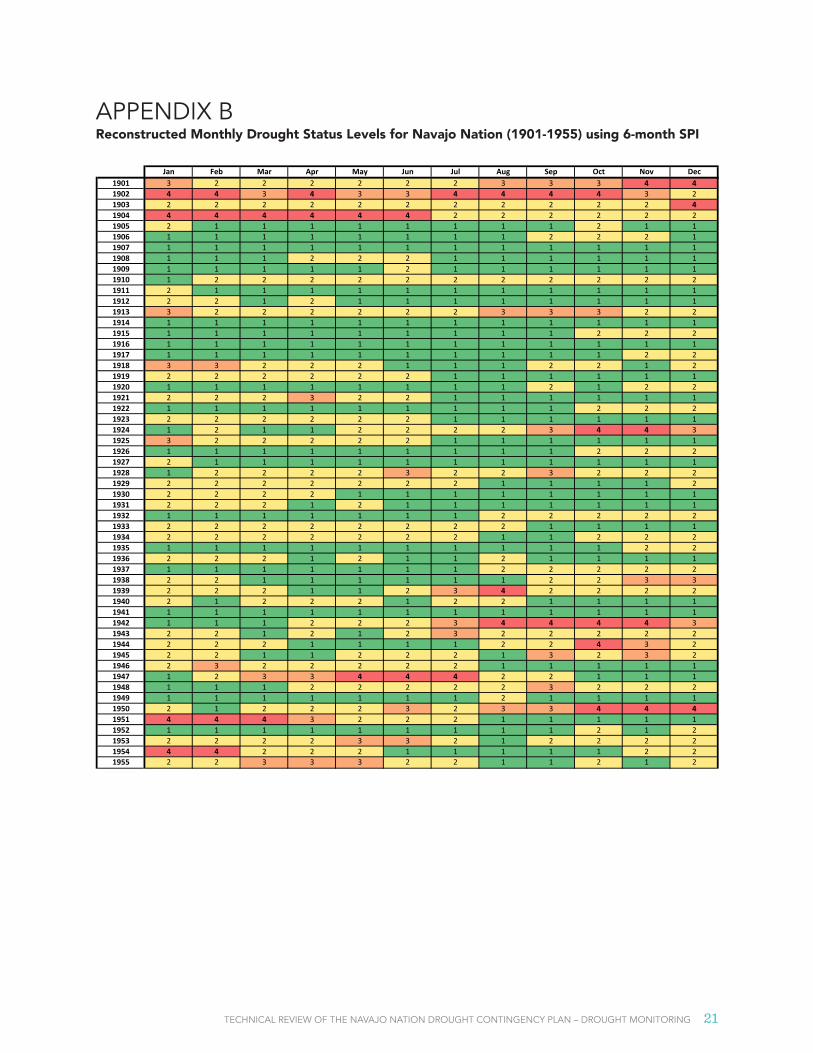
Jan Feb Mar Apr May Jun Jul Aug Sep Oct Nov Dec1901 3 2 2 2 2 2 2 3 3 3 4 41902 4 4 3 4 3 3 4 4 4 4 3 21903 2 2 2 2 2 2 2 2 2 2 2 41904 4 4 4 4 4 4 2 2 2 2 2 21905 2 1 1 1 1 1 1 1 1 2 1 11906 1 1 1 1 1 1 1 1 2 2 2 11907 1 1 1 1 1 1 1 1 1 1 1 11908 1 1 1 2 2 2 1 1 1 1 1 11909 1 1 1 1 1 2 1 1 1 1 1 11910 1 2 2 2 2 2 2 2 2 2 2 21911 2 1 1 1 1 1 1 1 1 1 1 11912 2 2 1 2 1 1 1 1 1 1 1 11913 3 2 2 2 2 2 2 3 3 3 2 21914 1 1 1 1 1 1 1 1 1 1 1 11915 1 1 1 1 1 1 1 1 1 2 2 21916 1 1 1 1 1 1 1 1 1 1 1 11917 1 1 1 1 1 1 1 1 1 1 2 21918 3 3 2 2 2 1 1 1 2 2 1 21919 2 2 2 2 2 2 1 1 1 1 1 11920 1 1 1 1 1 1 1 1 2 1 2 21921 2 2 2 3 2 2 1 1 1 1 1 11922 1 1 1 1 1 1 1 1 1 2 2 21923 2 2 2 2 2 2 1 1 1 1 1 11924 1 2 1 1 2 2 2 2 3 4 4 31925 3 2 2 2 2 2 1 1 1 1 1 11926 1 1 1 1 1 1 1 1 1 2 2 21927 2 1 1 1 1 1 1 1 1 1 1 11928 1 2 2 2 2 3 2 2 3 2 2 21929 2 2 2 2 2 2 2 1 1 1 1 21930 2 2 2 2 1 1 1 1 1 1 1 11931 2 2 2 1 2 1 1 1 1 1 1 11932 1 1 1 1 1 1 1 2 2 2 2 21933 2 2 2 2 2 2 2 2 1 1 1 11934 2 2 2 2 2 2 2 1 1 2 2 21935 1 1 1 1 1 1 1 1 1 1 2 21936 2 2 2 1 2 1 1 2 1 1 1 11937 1 1 1 1 1 1 1 2 2 2 2 21938 2 2 1 1 1 1 1 1 2 2 3 31939 2 2 2 1 1 2 3 4 2 2 2 21940 2 1 2 2 2 1 2 2 1 1 1 11941 1 1 1 1 1 1 1 1 1 1 1 11942 1 1 1 2 2 2 3 4 4 4 4 31943 2 2 1 2 1 2 3 2 2 2 2 21944 2 2 2 1 1 1 1 2 2 4 3 21945 2 2 1 1 2 2 2 1 3 2 3 21946 2 3 2 2 2 2 2 1 1 1 1 11947 1 2 3 3 4 4 4 2 2 1 1 11948 1 1 1 2 2 2 2 2 3 2 2 21949 1 1 1 1 1 1 1 2 1 1 1 11950 2 1 2 2 2 3 2 3 3 4 4 41951 4 4 4 3 2 2 2 1 1 1 1 11952 1 1 1 1 1 1 1 1 1 2 1 21953 2 2 2 2 3 3 2 1 2 2 2 21954 4 4 2 2 2 1 1 1 1 1 2 21955 2 2 3 3 3 2 2 1 1 2 1 2
APPENDIX BReconstructed Monthly Drought Status Levels for Navajo Nation (1901-1955) using 6-month SPI
TECHNICAL REVIEW OF THE NAVAJO NATION DROUGHT CONTINGENCY PLAN – DROUGHT MONITORING 22
Jan Feb Mar Apr May Jun Jul Aug Sep Oct Nov Dec1956 2 3 3 2 2 2 3 4 4 4 4 41957 3 2 2 2 1 1 1 1 1 1 1 11958 1 2 1 1 1 1 1 1 1 1 1 21959 2 2 3 3 4 3 2 2 2 1 1 11960 1 1 1 2 1 2 4 4 4 2 2 21961 2 2 1 2 2 2 2 2 2 2 1 11962 1 1 1 2 2 2 4 4 4 3 2 31963 2 2 2 2 3 3 4 2 2 2 1 21964 1 3 3 2 3 2 2 1 1 2 2 11965 1 1 2 1 1 1 1 1 1 2 1 11966 1 1 1 1 2 4 3 3 2 2 2 21967 2 2 2 2 2 3 2 1 1 1 1 11968 1 2 2 1 1 2 2 2 2 3 2 21969 2 2 1 2 1 1 2 2 2 1 2 21970 2 3 2 2 2 2 2 2 2 2 2 21971 2 2 4 4 4 4 4 2 1 1 1 11972 1 1 2 4 4 4 4 3 2 1 1 11973 1 1 1 1 1 1 1 1 3 4 4 41974 4 3 2 2 3 2 4 4 4 2 2 21975 2 1 1 1 1 1 1 2 2 3 2 21976 3 2 2 1 1 1 1 1 1 1 2 21977 3 2 3 3 3 2 2 2 1 1 1 21978 1 1 1 1 1 1 1 1 3 3 1 11979 1 1 1 1 1 1 1 1 3 2 4 41980 1 1 1 1 1 1 1 1 2 2 3 31981 3 3 2 2 1 1 1 1 1 1 1 11982 1 1 1 1 1 1 1 1 1 1 1 11983 1 1 1 1 1 1 1 1 1 1 1 11984 1 1 2 2 2 4 2 1 1 1 1 11985 1 1 1 1 1 1 1 1 1 1 1 11986 1 1 1 1 2 2 1 1 1 1 1 11987 1 1 1 1 1 1 1 1 2 1 1 11988 1 1 1 1 1 1 1 1 1 1 1 21989 1 2 2 2 2 2 3 3 4 4 4 41990 4 4 3 2 2 2 1 1 1 1 1 11991 1 1 1 1 1 1 2 2 4 3 2 11992 1 1 1 1 1 1 1 1 1 1 1 11993 1 1 1 1 1 1 2 2 3 2 2 21994 1 2 1 2 2 1 1 2 1 1 1 11995 1 1 1 1 1 1 1 2 2 3 3 31996 3 3 4 4 4 4 3 4 2 1 1 11997 1 1 1 1 1 1 2 2 1 1 1 11998 1 1 1 1 1 1 1 1 2 1 1 11999 2 2 2 2 3 3 1 1 1 1 1 12000 2 3 3 3 3 2 2 2 4 1 1 22001 1 1 1 2 2 1 2 1 1 2 2 22002 3 4 4 4 4 4 4 4 2 2 2 22003 2 1 1 2 2 2 2 3 2 2 2 22004 2 2 2 2 2 2 2 2 2 1 1 12005 1 1 1 1 1 1 1 1 2 2 2 32006 4 4 3 4 3 2 1 1 1 1 1 12007 1 2 2 3 3 2 2 2 1 2 2 12008 1 1 1 1 1 1 2 2 2 2 2 12009 1 2 2 2 1 2 3 4 4 4 4 42010 2 1 1 1 1 1 1 2 2 1 1 1
Reconstructed Monthly Drought Status Levels for Navajo Nation (1956-2010) using 6-month SPI
TECHNICAL REVIEW OF THE NAVAJO NATION DROUGHT CONTINGENCY PLAN – DROUGHT MONITORING 23
APPENDIX CTransition Probabilities by Month
From To 1 2 3 4 5 6 7 8 9 10 11 121 1 0.80 0.90 0.79 0.88 0.89 0.87 0.84 0.78 0.80 0.89 0.84 0.871 2 0.18 0.10 0.21 0.12 0.11 0.13 0.16 0.15 0.20 0.11 0.16 0.121 3 0.02 0.00 0.00 0.00 0.00 0.00 0.00 0.07 0.00 0.00 0.00 0.021 4 0.00 0.00 0.00 0.00 0.00 0.00 0.00 0.00 0.00 0.00 0.00 0.002 1 0.21 0.21 0.18 0.18 0.18 0.23 0.31 0.26 0.29 0.18 0.13 0.212 2 0.68 0.67 0.74 0.70 0.69 0.55 0.58 0.56 0.59 0.71 0.79 0.672 3 0.11 0.10 0.05 0.11 0.08 0.15 0.11 0.12 0.09 0.08 0.05 0.102 4 0.00 0.02 0.03 0.00 0.05 0.08 0.00 0.06 0.03 0.03 0.03 0.023 1 0.00 0.00 0.00 0.00 0.00 0.13 0.00 0.00 0.00 0.13 0.00 0.00
Drought Status MonthTransition Probabilities
3 2 0.60 0.56 0.30 0.25 0.64 0.63 0.13 0.43 0.45 0.63 0.50 0.433 3 0.30 0.33 0.50 0.50 0.36 0.00 0.25 0.43 0.27 0.13 0.50 0.433 4 0.10 0.11 0.20 0.25 0.00 0.25 0.63 0.14 0.27 0.13 0.00 0.144 1 0.00 0.00 0.00 0.00 0.00 0.00 0.00 0.00 0.10 0.00 0.00 0.134 2 0.00 0.14 0.00 0.00 0.00 0.25 0.33 0.30 0.20 0.00 0.00 0.134 3 0.14 0.43 0.20 0.29 0.14 0.25 0.11 0.00 0.20 0.22 0.22 0.134 4 0.86 0.43 0.80 0.71 0.86 0.50 0.56 0.70 0.50 0.78 0.78 0.63
APPENDIX DNotes on correlating Navajo and NWS rain gauge data to re-calculate 6-month SPI at smaller spatial scales.
Correlating your Navajo rain gauges, which have a 27-year record dating back to 1984 to nearby NWS ones with a longer record will require data recalculation because they have different download intervals. When I looked at the Navajo rain gauge data from 2001 through 2005, the start and end dates for collection did not correspond to the start and end dates of the month like the NWS monthly data do. You will need to calculate the NWS monthly data into the same time intervals as the Navajo data – on a month by month basis for the nearest NWS stations. For example, your gauge data may have been collected on the 3th and 28th of a month. So, it represents 26 days, from the afternoon of the third to the afternoon of the 28th. You will need to sum up the NWS daily rain data for that same interval to do any correlation. I did that for Ganado Navajo, Teec Nos Pos Navajo, and Chinle Navajo to compare to the NWS Ganado, NWS Teec Nos Pos and NWS Canyon de Chelly stations respectively. I expected that the two Ganado gauges would be well correlated as the two stations were very close together. I expected that the Chinle and Canyon de Chelly gauges would not be well-correlated because, although they are physically close, they have very different topographic characteristics. The two Teec Nos Pos gauges should also have been similar due to proximity. However, I found them all to have very poor correlation. As with most arid lands, the spatial variability is huge on a daily or monthly basis, but could be useful on longer time-scales.
TECHNICAL REVIEW OF THE NAVAJO NATION DROUGHT CONTINGENCY PLAN – DROUGHT MONITORING 24
This work is funded under grant NA10OAR4310183 by the Sectoral Applications Research Program (SARP) of the National Oceanic and Atmospheric Administration (NOAA) Climate Program Office. The views expressed in this report represent those of the authors and do not necessarily reflect the views or policies of NOAA.
This report was prepared and published by the Climate Assessment for the Southwest (CLIMAS) program in the Institute of the Environment at the University of Arizona in February 2013.
Suggested citation:
Crimmins, Michael, Nancy Selover, Karen Cozzetto, and Karletta Chief. 2013. Technical Review of the Navajo Nation Drought Contingency Plan – Drought Monitoring. Ed. Alison Meadow. Tucson, AZ: Climate Assessment for the
Southwest.
More information Michael A. Crimmins Department of Soil, Water, & Environmental Science The University of Arizona
[email protected] (520) 626-4244
Climate Assessment for the Southwest