teacher turnover, wastage and movements between …dera.ioe.ac.uk/5625/1/rr640.pdf · teacher...
TRANSCRIPT
Teacher Turnover, Wastage and Movementsbetween SchoolsAlan Smithers and Pamela RobinsonCentre for Education and Employment Research
Research Report RR640
RESEARCH
Research Report No 640
Teacher Turnover, Wastage and Movements between Schools
Alan Smithers and Pamela Robinson Centre for Education and Employment Research
The views expressed in this report are the authors’ and do not necessarily reflect those of the Department for Education and Skills. © Crown Copyright 2005 ISBN 1 84478 483 5
Contents
Executive Summary i
1. Introduction 1
2. Teacher Loss 9
3. Destinations 13
4. Turnover, Wastage and Moveage 23
5. Case Studies of Contrasting Turnover 31
6. Movers 47
7. Moves in Retrospect 66
8. Policy Pointers 78
References 82
Appendix A: Methods 84
Appendix B: Samples Compared to National Distributions 92
Appendix C: Case Studies of Secondary Schools 96
Appendix D: Case Studies of Primary Schools 104
i
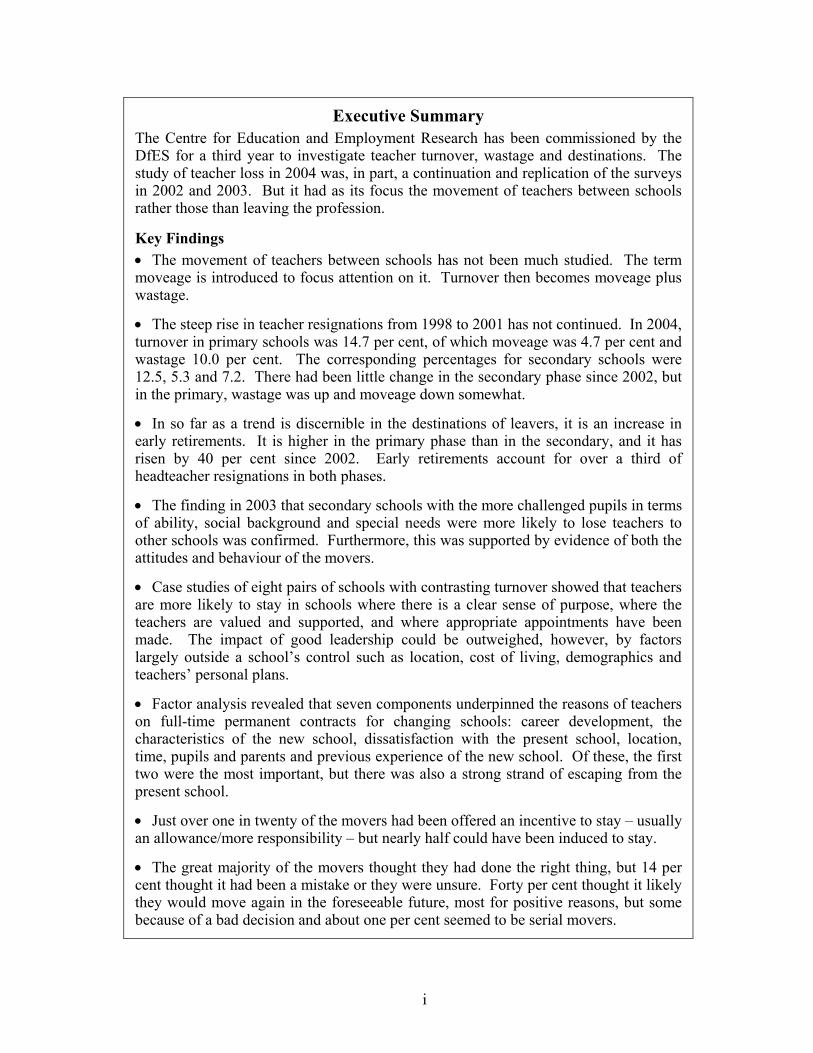
Executive Summary The Centre for Education and Employment Research has been commissioned by the DfES for a third year to investigate teacher turnover, wastage and destinations. The study of teacher loss in 2004 was, in part, a continuation and replication of the surveys in 2002 and 2003. But it had as its focus the movement of teachers between schools rather those than leaving the profession.
Key Findings • The movement of teachers between schools has not been much studied. The term moveage is introduced to focus attention on it. Turnover then becomes moveage plus wastage.
• The steep rise in teacher resignations from 1998 to 2001 has not continued. In 2004, turnover in primary schools was 14.7 per cent, of which moveage was 4.7 per cent and wastage 10.0 per cent. The corresponding percentages for secondary schools were 12.5, 5.3 and 7.2. There had been little change in the secondary phase since 2002, but in the primary, wastage was up and moveage down somewhat.
• In so far as a trend is discernible in the destinations of leavers, it is an increase in early retirements. It is higher in the primary phase than in the secondary, and it has risen by 40 per cent since 2002. Early retirements account for over a third of headteacher resignations in both phases.
• The finding in 2003 that secondary schools with the more challenged pupils in terms of ability, social background and special needs were more likely to lose teachers to other schools was confirmed. Furthermore, this was supported by evidence of both the attitudes and behaviour of the movers.
• Case studies of eight pairs of schools with contrasting turnover showed that teachers are more likely to stay in schools where there is a clear sense of purpose, where the teachers are valued and supported, and where appropriate appointments have been made. The impact of good leadership could be outweighed, however, by factors largely outside a school’s control such as location, cost of living, demographics and teachers’ personal plans.
• Factor analysis revealed that seven components underpinned the reasons of teachers on full-time permanent contracts for changing schools: career development, the characteristics of the new school, dissatisfaction with the present school, location, time, pupils and parents and previous experience of the new school. Of these, the first two were the most important, but there was also a strong strand of escaping from the present school.
• Just over one in twenty of the movers had been offered an incentive to stay – usually an allowance/more responsibility – but nearly half could have been induced to stay.
• The great majority of the movers thought they had done the right thing, but 14 per cent thought it had been a mistake or they were unsure. Forty per cent thought it likely they would move again in the foreseeable future, most for positive reasons, but some because of a bad decision and about one per cent seemed to be serial movers.
ii
Aims The investigation had four main aims:
• to quantify turnover and wastage of teachers in 2004 and compare the rates of loss with previous years;
• to record the destinations of those leaving;
• to conduct case studies of schools with higher than average or lower than average turnover;
• to quantify the relative importance of the factors influencing teachers’ decisions to move from one maintained school to another.
Background This series of surveys was originally commissioned against a background of rapidly rising resignations from maintained schools. The 2002 study focused on leavers from the profession with two main purposes: to provide an accurate picture of teacher loss; and to get behind the figures to tease out the underlying motivations of the teachers who were quitting. It found that turnover was lower in 2002 than the previous year, but that workload and pupil behaviour were prompting teachers to resign. The main survey was repeated in 2003 in part as a check on the picture emerging in 2002, but also to study specifically retention differences between schools. It found fewer resignations in 2003 than 2002, with the drop being due mainly to fewer moves between primary schools. Turnover, but not wastage, of teachers from secondary schools was found to correlate with GCSE results (inversely), eligibility for free school meals and special needs, suggesting that there tended to be movement away from schools in the more challenging circumstances. The present study has been commissioned as a further check on turnover overall, but also to study in detail teachers moving between schools.
Methodology The 2004 survey of teacher retention is a continuation of the study begun in 2002. Schools who had agreed to participate at the outset were asked to provide information for a third year. There were three main parts to the 2004 research:
• Schools Survey – schools were sent a questionnaire close to the end of each term asking them to provide details (without attaching names) of the teachers leaving them at the end of that term.
• Survey and Follow-Up Survey of Movers – teachers leaving a maintained school in summer 2004 to take a post in another maintained school were sent a questionnaire via the school they were leaving, and they were followed up in January 2005 to see how they viewed their decisions in retrospect.
• Case Studies – eight pairs of schools, four primary and four secondary, matched but with contrasting turnover, were compared to try to understand the considerable differences in teacher retention between schools.
iii
Response rates continued to be very good in 2004, ranging between 72 and 80 per cent in the three sweeps of the School Surveys. From among those schools responding on all three occasions, structured samples of 5 per cent of primary schools (N=888) and 10 per cent of secondary schools, including middle deemed secondary (N=341), were constructed to reflect the populations in terms of region and size. The samples also corresponded closely with the national distributions of schools in terms of other characteristics.
In summer 2004, the schools listed a total of 2,030 teachers leaving them to move to other schools. Questionnaires were sent, via the schools, to these movers and we received 736 replies (36.3 per cent of the questionnaires sent out though not necessarily passed on) by the time the data set was closed. Of these, 548 provided their names and agreed to be contacted in a follow-up. They were sent a questionnaire in January 2005 to see how they viewed their decisions to move in retrospect and 342 responded (62.4 per cent of those agreeing).
Case studies were conducted of eight pairs of schools with contrasting turnover. Schools who had returned the Schools Survey on all nine occasions were ranked, separately for primary and secondary, according to their turnover in the three years. Schools from the top and bottom of the ranking lists were matched on location, size and pupils’ eligibility for free school meals. All headteachers contacted agreed to allow us to visit their school and to discuss teacher recruitment and retention with us. These discussions were based on a framework common to all the schools but tailored to the specific circumstances.
Findings Teacher Loss: The steep rise in teacher resignations from 1998 to 2001 has not continued. Turnover, in 2004, at 14.7 per cent in primary schools and 12.5 per cent in secondary schools, has remained at about the same level over the three years. Wastage in the primary phase has risen slightly to 10 per cent, but remained at 7.2 per cent in the secondary phase. We have introduced the term moveage to express the rate at which teachers change schools. It is equal to turnover minus wastage. Moveage has fallen in primary schools from 6.0 per cent in 2002 to 4.7 per cent in 2004, and in secondary schools from 5.8 per cent to 5.3 per cent.
Destinations: The destinations of teachers leaving schools remain relatively consistent from year to year. In so far as a trend is discernible, it is for an increase in early retirement. This is particularly the case for headteachers where over a third of those leaving do so on early retirement. The proportion of early retirements is higher in the primary phase than in the secondary, and it has risen by 40 per cent since 2002. Resignations among female classroom teachers from primary schools are dominated by maternity which comes only second to moving to another school as the reason for leaving. Very few minority ethnic teachers took retirement.
Turnover, Wastage and Moveage: Moveage as well as wastage was higher in London, the East and South East. It did not always vary with wastage, however, since in the secondary phase in the South West it tended to be low while wastage was high.
iv
Resignations of physics, chemistry and foreign language teachers tended to be to leave the profession and those of geography, PE and RE teachers to move between schools. The important finding from 2003 that secondary schools with the more challenged pupils in terms of ability, social background and special needs were more likely to lose teachers to other schools was confirmed.
Case Studies of Contrasting Turnover: Teachers are more likely to stay in schools where there is a clear sense of purpose, where the needs of the staff are recognised and support is provided. Appointing the right teachers in the first place is also very important. Not all schools with high turnover lacked good leadership, but its impact could be outweighed by factors not necessarily under a school’s control such as the attractiveness of its location, the cost of living in the area, local demographics and the personal decisions to leave for career advancement, relationships or life plans. The statistical relationship between teacher retention and the ability or social background of the pupils came through on the ground in our case studies and it was the major difference between the two secondary schools we studied in Inner London. But we also saw a popular over-subscribed school with an above average intake and strong leadership which had high turnover.
Movers: Teachers moving from one school to another are mainly young, leaving their first post and having to make three applications or fewer. Two-thirds of the movers coming to the end of fixed-term contracts are taking permanent contracts. Outer London is the largest net loser of movers and the North East and South West are the main gainers. There is little movement between the phases. Secondary school teachers tended to be moving to schools with better examination results than those they were leaving. A quarter of the secondary movers indicated that the exam results of the new school were ‘of great importance’ to them. Having a sixth form was another attraction. Factor analysis revealed that seven main components underpinned reasons for moving: career development, attractions of the new school, dissatisfaction with present school, pupil behaviour, the convenience of location, the hours worked and experience of the new school. Of these, the first two were the most important, but there was also a strong strand of dissatisfaction. But the main reasons given for leaving the profession - workload and pupil behaviour – were way down the movers list. Just over one in twenty of the movers had been offered an incentive to stay, but nearly half could have been induced to stay.
Moves in Retrospect: A follow-up of the movers six months on revealed remarkable similarity in their reported motivations before and after changing schools, suggesting that these were being authentically and reliably recorded. The great majority of the teachers thought they had done the right thing in moving, but 14 per cent were unsure or felt they had made a mistake. What distinguished the two groups was mainly the quality of leadership and support they found in the new school. Forty per cent of the movers were already envisaging moves in the foreseeable future for reasons of career advancement or personal motives such as starting a family or buying a home. Addressing the concerns that lead to teachers leaving particular schools such as poor leadership, bad pupil behaviour and workload may help to reduce wastage, but moveage is an inherent part of the profession.
v
Policy Pointers 1. In order that the spotlight can be shone on the mobility of teachers in its own right it is proposed that the term moveage (to resonate with wastage) be introduced to record movements of teachers between schools. It should be defined so that turnover equals moveage plus wastage. Statistics on moveage should be regularly collected and published.
2. In teacher supply it is just as, if not more, important to enable a balance to be struck at the level of the individual school as across the system as a whole. Some schools have faced persistent difficulties in maintaining a full complement of high quality staff. There is a need for policies to address this issue.
3. The importance of school leadership is well understood. But it is a complex concept which should be revisited to see if it is possible to make improvements in the identification of good leaders for schools and their training, particularly with the aim of achieving optimal staff retention.
4. Our surveys show that headteachers, both of primary and secondary schools, seem increasingly prone to take early retirement. The numbers in our study are small, but the samples are representative and the pattern has repeated in each of the three years. A study should be undertaken of the career trajectories of headteachers to understand better this seemingly high rate of attrition.
5. The technical feasibility should be tested of expressing separate turnover, wastage and moveage rates for teachers on different types of contracts. If having one rate is thought desirable this would be better based on full-time permanent teachers than all full-timers since the rates and reasons of the permanent and temporary differ.
6. It is important not to think of turnover and moveage as bad. Indeed, this is one reason why it is important to distinguish moveage from wastage which by definition should be kept to a minimum. Attention should be focused on what constitutes an optimal level for moveage since too little can be as damaging as too much.
7. Through the constructs of turnover and wastage, and now moveage, the focus in school staffing has been on those who leave. It is high time, we suggest, to look at the other side of coin, the teachers who stay. Dare we also offer the term stayage to cover this?
1
1. Introduction 1.1 The Centre for Education and Employment Research, now at the University of
Buckingham, has been re-commissioned by the DfES to continue for a third year its surveys of teacher loss from schools. The first study, funded at a time when the number of teachers leaving schools was rising sharply, was undertaken to determine the situation on the ground in 2002 and tease out the factors underlying teachers’ decisions to leave the profession. The survey was repeated in 2003 with the emphasis shifting to turnover and wastage at the school level. In the present study covering the calendar year 2004 the main survey has been repeated, but the particular focus has become teachers moving between schools for which we have coined the term ‘moveage’. In terms of the two established constructs, this is turnover minus wastage. The present report should be read in conjunction with those for the two previous years (Smithers and Robinson, 2003 and 2004a).
Remit 1.2 The main purposes of the 2004 study are to quantify turnover, wastage and what we
are calling ‘moveage’ during the calendar year and to assess trends, particularly in relation to the two previous years, but also where possible over a longer timescale. The brief specified the main aims as:
• to quantify turnover and wastage of teachers in 2004 and compare the rates of loss with previous years;
• to record the destinations of those leaving;
• to conduct case studies of schools with higher than average or lower than average turnover;
• to quantify the relative importance of the factors influencing teachers’ decisions to move from one maintained school to another.
2002 Study 1.3 The 2002 study of factors affecting teachers’ decisions to leave the profession had
two main purposes: to provide an accurate picture of teacher loss and to get behind the figures to tease out the underlying motivations of teachers leaving the profession. The main findings were that:
• both turnover and wastage were lower than in 2001, following the sharp increases there had been in the previous three years;
• five main factors influenced decisions to leave: workload, wanting a new challenge, the school situation (including pupil behaviour), salary and personal circumstances;
• leavers tended to be either young with a few years’ service or older and approaching retirement, to be female, and to come from the shortage subjects;
• older leavers tended to cite workload, and younger leavers travel, salary and personal circumstances, as the reasons for leaving;
2
• teachers in London and the south and east were more likely to move to other schools and leave the profession than teachers in the north and midlands;
• only about 20 per cent of the leavers from full-time posts thought it ‘likely’ they would return to the classroom full-time compared to over 55 per cent who thought it ‘unlikely’;
• likelihood of return was inversely related to age and length of service, with those leaving to travel or teach abroad the most likely to return and those leaving for other employment, independent schools or retirement the least;
• most of the leavers followed up one or two terms after quitting were sure they had done the right thing, though some 10 per cent had, in fact, accepted new contracts in maintained schools, usually part-time.
2003 Study 1.4 The 2002 study was repeated in 2003, partly as a check on the previous year, but
also to study specifically retention differences between schools. Its main findings were:
• there were fewer resignations in 2003 than 2002, with the drop mainly due to fewer moves between primary schools, perhaps reflecting a decrease in opportunity associated with falling rolls;
• turnover, but not wastage, of teachers from secondary schools was found to correlate with GCSE results (inversely), eligibility for free school meals and special needs, suggesting that there tended to be movement away from schools in the more challenging circumstances;
• turnover tended to be higher in middle schools, perhaps not unconnected with reorganisation to primary/secondary in a number of authorities;
• wastage tended to be lower in schools receiving extra funding through government initiatives, perhaps reflecting enhanced teacher affordability;
• secondary schools given recognition through beacon or leading-edge status tended to have lower turnover and wastage;
• turnover among the under 30s was about 25 per cent, but about half were moves to other schools whereas turnover among the over 50s was about 12 per cent, but most of this was wastage;
• turnover and wastage rates tended to be higher among women than men, greater from schools in London, the East and South East than other parts of the country, and there were indications that loss could be higher from shortage subjects;
• about a quarter of the leavers from primary schools thought it likely that they would return to teach full time, as did about 16 per cent of the secondary leavers;
3
• it was the younger leavers, those with five years’ service or less, female leavers and those leaving schools in London who were most likely to expect to return.
Research and Reports 1.5 This series of surveys was originally commissioned against a background of rapidly
rising resignations from maintained schools. In reviewing the literature at the time it was noted that balancing the supply of, and demand for, teachers was by no means easy. The first two of a series of four reports on the teaching profession from the Information Network on Education in Europe had appeared (Eurydice, 2002a and b) which found that out of 31 countries or regions providing information only four – including Scotland and Northern Ireland – claimed to have achieved a reasonable balance. Of the others, 21 including England reported shortages, and six surpluses.
1.6 As our reviews in the two previous volumes (Smithers and Robinson 2003 and 2004a) have shown, studies of teacher supply have tended to focus on three main aspects – recruitment, retention and affordability. Recently retention has been to the fore both in this country and elsewhere. The National Commission on Teaching and America’s Future (2003) took the view that “The real school staffing problem is teacher retention” and it was moved to call teaching “the revolving door profession”.
House of Commons Education and Skills Committee 1.7 The House of Commons Education and Skills Committee also took teacher retention
to be the key issue and included it in November 2002 in its major Secondary Education Inquiry, but by the time the report was published in September 2004 the scope had been broadened to take in recruitment as well (Education and Skills Committee, Fifth Report of the Session 2003-04, 21 September 2004).
1.8 The Committee had before it the reports from the first two years of this study and a specially prepared paper based on the research (Smithers, 2004). This was among the evidence which led the Committee to conclude that “we did not find evidence of endemic problems with retention and recruitment, but we did discover a number of specific problems which pose very real difficulties for those schools which are affected.” It identified six main concerns.
• “Challenging schools have particular problems with retention and recruitment…but not just the more challenging schools.”
• “There are persistent shortages in some subjects.”
• “Fewer than 50 per cent of those who begin teacher training are teaching after five years. It was notable that the retention rate of those who train through the employment based route is considerably higher than the university or postgraduate courses.”
• “The workload agreement is designed to take certain administrative tasks away from teachers and provide them with more preparation and other non-contact time. The successful implementation of the agreement could aid significantly the retention of teachers in the profession, but there are substantial problems.”
4
• “Poor standards of pupil behaviour – general indiscipline, violent behaviour and verbal abuse – is the reason given by many teachers for leaving or contemplating leaving the teaching profession.”
• “50 per cent of the teachers are over 45. That could spell problems for schools over the next ten to fifteen years.”
1.9 Regarding the retention of teachers in challenging schools it recommended, following the work of Centre X in Los Angeles (Quartz, Lyons and Thomas cited in Education and Skills Committee, 2004), that teachers keen to work in such schools should be sought out and provided with specifically tailored training.
Europe 1.10 Besides the Education and Skills Committee’s report there have been several other
significant publications since the literature was reviewed in Smithers and Robinson (2003 and 2004a). The fourth and final report in the Information Network on Education in Europe series on the teaching profession in lower secondary education has appeared (Eurydice, 2004). The first three reports reviewed in our two previous volumes focused on the themes of initial teacher training and the transition to working life; teacher supply and demand; and working pay and conditions. The final report adopts a broader perspective and pinpoints areas for further consideration by member governments.
1.11 At the outset, the report is careful to recognise that each country has its own way of managing the profession which impacts on the professional status of teachers. Very broadly teachers are either employed as public servants, with centralised recruitment, or on contracts governed by general employment legislation and where recruitment is open and conducted at local level. Six areas are considered in terms of policy development.
• The first is how to improve teachers’ self-image. Evidence shows that the profession is more highly regarded than teachers think.
• Secondly, it points to the success of on-the-job training schemes in attracting new recruits. But it cautions that these sorts of initiatives have implications for the workload of teachers who assume the role of mentors and means financing the extra work that schools have to take on board.
• The third area is professional development. Eurydice (2004) calls for more constructively co-ordinated activity on the part of institutions for initial and in-service training so that prospective and qualified teachers can learn from each other.
• Part and parcel of ensuring that teachers remain in the profession is good working conditions. Working time, the variety of tasks performed by the teacher and salary prospects are seen as particularly important. In looking at salary issues as the fourth area, differences emerge between countries in the extent to which salary is based on length of service together with arrangements for adjusting salaries according to additional activity, attracting teachers to schools considered to be more difficult and
5
rewarding the experience and work of teachers. Getting the balance right is a key issue.
• Teacher mobility is a factor in managing the balance between supply and demand. Facilitating this mobility - the fifth area covered by the report - depends very much on the scope for employment benefits that have been already acquired.
• The sixth and final issue focuses on motivating teachers until they retire. Given that many European countries have an ageing teaching profession, how to ensure that experienced teachers remain motivated for as long as possible, particularly with restrictions on early retirement in some countries, is a major concern. One option is to modify the employment conditions of teachers as they approach retirement, for example by reducing teaching load with no loss of earnings and substituting other activities such as the supervision of inexperienced colleagues.
1.12 The OECD also has a project on Attracting, Developing and Retaining Effective Teachers. This has produced further country background reports (that for the UK by Ross and Hutchings, 2003, was reviewed in the second report in this series, Smithers and Robinson, 2004a). A conference was also held in Amsterdam in November 2004 on the theme of Teachers Matter, to coincide with the release of findings from the two-year study but the published report is not yet available.
United States 1.13 The National Center for Education Statistics in the United States, the primary federal
body for collecting, analyzing and reporting data related to education in 2004 independently published a report on teacher retention in the USA whose methods and findings are closely in tune with our own (Luekens, Lyter and Fox, 2004). It reports a follow-up survey of a sample of 8,400 teachers who were originally selected for the teacher component in the Schools and Staffing Survey (SASS). The 2000-01 Teacher Follow-Up Survey (TFS) data in this report tied responses from the 2000-01 school year to characteristics of the teachers and the schools who had participated in SASS during the 1999-2000 school year.
1.14 As in the present report, the sample of teachers was split into three groups: ‘leavers’, ‘movers’ and ‘stayers’; and, similarly, the questionnaire focused on three questions: who is most likely to move or leave, why do teachers move or leave and where do they go? Among the findings were that there were proportionately more leavers than in previous follow-up surveys and that the movers are more likely to be the younger teachers with less than ten years experience. The main motivations for moving to a new school were a mixture of positive and negative reasons, particularly the attractions of the new post for career development and dissatisfaction with the management of the present school and workplace conditions. Dissatisfaction with salary and pupil behaviour were also cited as problems.
1.15 Men were more likely to leave for a better salary in another career than women, who placed leaving for family reasons and maternity as more important in their decision to go. Those retiring indicated that eligibility for full pension rights was a very or extremely important influencing factor. Other than retirement, leavers were particularly likely to find employment in the local, state or federal government.
6
There were differences between teachers in the public and private schools in the decision to stay, move or leave. But the differences were largely of scale rather than substance.
1.16 Another important American report focusing on teacher retention to be published during the year came from the Alliance for Excellent Education (2004). Again its findings and conclusions chime in very well with our own. It takes as its premise that the most important factor in student performance is the quality of the teaching force. Its focus of concern is the increasing teacher attrition rate, which is higher by 50 per cent in poorer schools, and higher among new teachers who are also more likely to be given lower ability groups to teach. Fourteen per cent of new teachers leave after one year, 33 per cent within three years and 50 per cent within five years. Losing half of all new teachers once every five years is costly in terms of replacement, student achievement and the quality of the teaching force.
1.17 The report maintains that the most effective strategy to stem the rapidly increasing attrition is a comprehensive programme of induction especially in the first two years. This intervention, it claims, reduces attrition rates by half, improves teaching quality and student performance. The programme should include high quality mentoring, common planning time, on-going professional development, standards-based teacher evaluation and an external network of teachers. Allied to this comprehensive programme is the need for strong school leadership, high quality providers of induction, adequate and stable funding and incentives to participate. With a strong induction programme good teachers stay, weaker teachers are weeded out and teaching quality is improved.
England 1.18 Two reports have been published in England during 2004 which have a bearing on
the present research. Dolton (2004) in the National Institute Economic Review published an economic analysis on the rate of financial return from being a teacher. It compares the earnings of qualified teachers who chose to teach with those who are not teaching using data from the Labour Force Survey, the New Earnings Survey and DfES data on life cycle teacher earnings to construct lifetime teacher age earnings profiles. The analyses show that the rate of return on forgone earnings for teachers has been declining over the last twenty-five years for both men and women, although teaching is relatively well paid for women. The comparisons of measurable monetary returns show that teaching is less attractive than other graduate occupations so deterring many from teaching as a first choice occupation. The article concludes that particular recruitment strategies focusing on the intrinsic benefits of teaching may be required to attract new teachers from other professional occupations.
1.19 Howson (2004) in research for the National College for School Leadership looked at the relationship, if any, between how long a headteacher stayed in post in a particular school and the performance of the school indicated by selected PANDA (Ofsted’s Performance and Assessment report) grades. The findings showed that across both phases the better the grade the longer the length of service (six years or more) of the headteacher and that headteachers in schools with a low grade were more likely to leave early (in three years or less). As a correlation, it is not clear whether the causal direction was that headteachers stayed longer in the more comfortable schools or
7
whether having a longer serving headteacher contributed to raising performance. It was found that, on average, headteachers stay in post for ten years before leaving. The most common destination was retirement. Annually, between one quarter and one fifth of headteachers move to a different school.
The Present Project 1.20 The present project was commissioned as a further check on the extent of teacher
loss, but also with a shift in focus from those exiting the maintained sector to those moving from one school to another.
Methods 1.21 Essentially the same approach was adopted in 2004 as in the two previous years.
Schools who had participated previously were sent a questionnaire close to the three teacher resignation dates in February, May and October. The school questionnaire was the same as in 2002 except the request for background information was simplified since this was already on file. For each teacher resigning, the school was asked to provide (without names) details of the post relinquished, characteristics of the leaver, and destination.
1.22 A questionnaire specially designed for this study was sent, via the schools, to teachers who were moving to other maintained schools. It asked for details of the new post and the one being relinquished, and the reasons for moving. It is described in full in Appendix A. We also visited and talked with the headteachers of eight matched pairs of schools, four primary and four secondary, with contrasting turnover. As last year, the DfES made available to us, in confidence, school-level information including percentages of pupils eligible for free school meals and proportions with special needs, and we obtained from the DfES website Key Stage 2 and GCSE results.
Analysis 1.23 Turnover and wastage rates come out differently according to how they are defined
and who is being compared. In Smithers and Robinson (2003) we devoted a chapter (Chapter 5, page 38 et seq) to examining in detail the very different values obtained by the DfES and the Employers’ Organisation for Local Government (now known as the National Employers’ Organisation for School Teachers), and we calculated turnover and wastage in a number of different ways following the different definitions. In this report, for simplicity and comparability, we stay where possible with DfES definitions. This means that, in the main, we concentrate on teachers leaving full-time posts (both permanent and fixed term). Turnover is defined as teachers leaving full-time posts whatever the destination. Wastage is loss of full-time teachers to other than full-time posts in maintained schools.
1.24 Our surveys yield the numbers of teachers leaving representative samples of schools. The calculation of turnover and wastage also depends on knowing how many full-time teachers there were in those schools. These have been provided to us by the DfES, so in most cases we have been able to employ a direct denominator. In the calculations for regions, for example, we sum (i) teacher loss from our sample schools in the region and (ii) full-time teachers in those schools, and divide one by the other. We do not, however, have in the DfES direct school-level data, the
8
breakdown of full-time teachers by gender, ethnicity or subject and here we have to rely on national figures where available. We have also calculated wastage and turnover at the school-level. As we illustrate in Appendix A (Table A.10), averaging individual school turnover and wastage rates leads to somewhat higher estimates of loss nationally or regionally than summing full-time leavers and full-time teachers across schools before dividing.
1.25 As our analysis progressed we became increasingly aware that the difference between turnover and wastage was inadequate to address movement between schools and we have introduced the term ‘moveage’ to enable us to focus upon it directly. ‘Moveage’ expresses the movement of full-time teachers to full-time posts in other maintained schools and equals turnover minus wastage.
The Report 1.26 We begin our account of the findings in Chapter 2 by comparing teacher loss in 2004
with that in 2003, 2002 and earlier years. In Chapter 3, we look in detail at the destinations of the leavers, again trying to discern any indications of trends over time. Then in Chapter 4 using the summarizing constructs of turnover, wastage and moveage we explore variations with region, school and gender, and in the absence of good national figures analyse as far as we can differences with ethnic background and main teaching subject.
1.27 In Chapter 5, we attempt to get behind the broad numerical patterns and look in detail at how turnover and wastage arise in individual schools. We compare eight pairs of schools, four primary and four secondary, one of which has high turnover and the other low. The schools in a pair have been matched as closely as possible for location, size and pupil eligibility for free school meals.
1.28 Chapters 6 and 7 break new ground. Chapter 6 reports the first ever study of why teachers move between schools, and Chapter 7 on how the sample of movers viewed their decisions in retrospect. As such, they form an interesting comparison with the leavers from the profession who were studied in detail in 2002.
1.29 As in previous years, it is possible to identify some policy pointers in the evidence and these are set out in Chapter 8. The appendices give full details of the methods (Appendix A) and compare the samples with the populations of primary and secondary schools on a number of characteristics where the national distributions are known (Appendix B). Pen portraits of the 16 schools in the case studies are given in full in Appendices C and D, the four secondary pairs in Appendix C, and the four primary pairs in Appendix D.
9
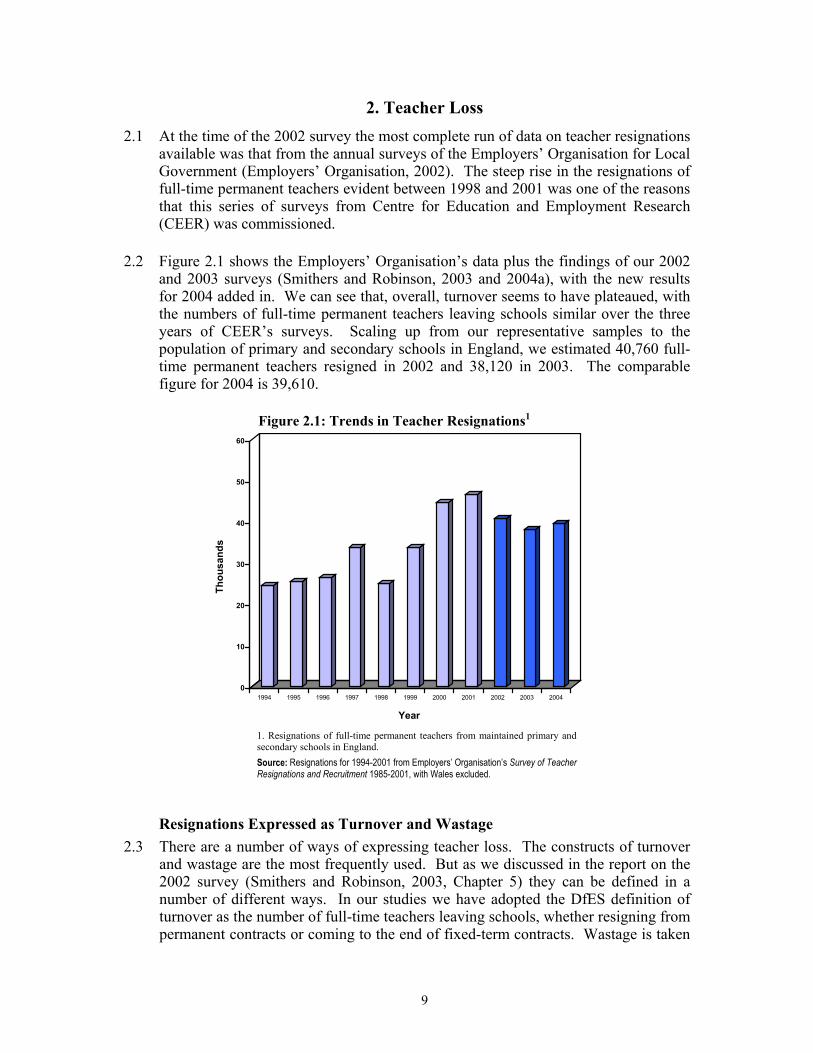
2. Teacher Loss 2.1 At the time of the 2002 survey the most complete run of data on teacher resignations
available was that from the annual surveys of the Employers’ Organisation for Local Government (Employers’ Organisation, 2002). The steep rise in the resignations of full-time permanent teachers evident between 1998 and 2001 was one of the reasons that this series of surveys from Centre for Education and Employment Research (CEER) was commissioned.
2.2 Figure 2.1 shows the Employers’ Organisation’s data plus the findings of our 2002 and 2003 surveys (Smithers and Robinson, 2003 and 2004a), with the new results for 2004 added in. We can see that, overall, turnover seems to have plateaued, with the numbers of full-time permanent teachers leaving schools similar over the three years of CEER’s surveys. Scaling up from our representative samples to the population of primary and secondary schools in England, we estimated 40,760 full-time permanent teachers resigned in 2002 and 38,120 in 2003. The comparable figure for 2004 is 39,610.
Figure 2.1: Trends in Teacher Resignations1
0
10
20
30
40
50
60
Thou
sand
s
1994 1995 1996 1997 1998 1999 2000 2001 2002 2003 2004
Year
1. Resignations of full-time permanent teachers from maintained primary and secondary schools in England. Source: Resignations for 1994-2001 from Employers’ Organisation’s Survey of Teacher Resignations and Recruitment 1985-2001, with Wales excluded.
Resignations Expressed as Turnover and Wastage 2.3 There are a number of ways of expressing teacher loss. The constructs of turnover
and wastage are the most frequently used. But as we discussed in the report on the 2002 survey (Smithers and Robinson, 2003, Chapter 5) they can be defined in a number of different ways. In our studies we have adopted the DfES definition of turnover as the number of full-time teachers leaving schools, whether resigning from permanent contracts or coming to the end of fixed-term contracts. Wastage is taken
10
as the number of full-time teachers leaving but not moving to a full-time post in a maintained school.
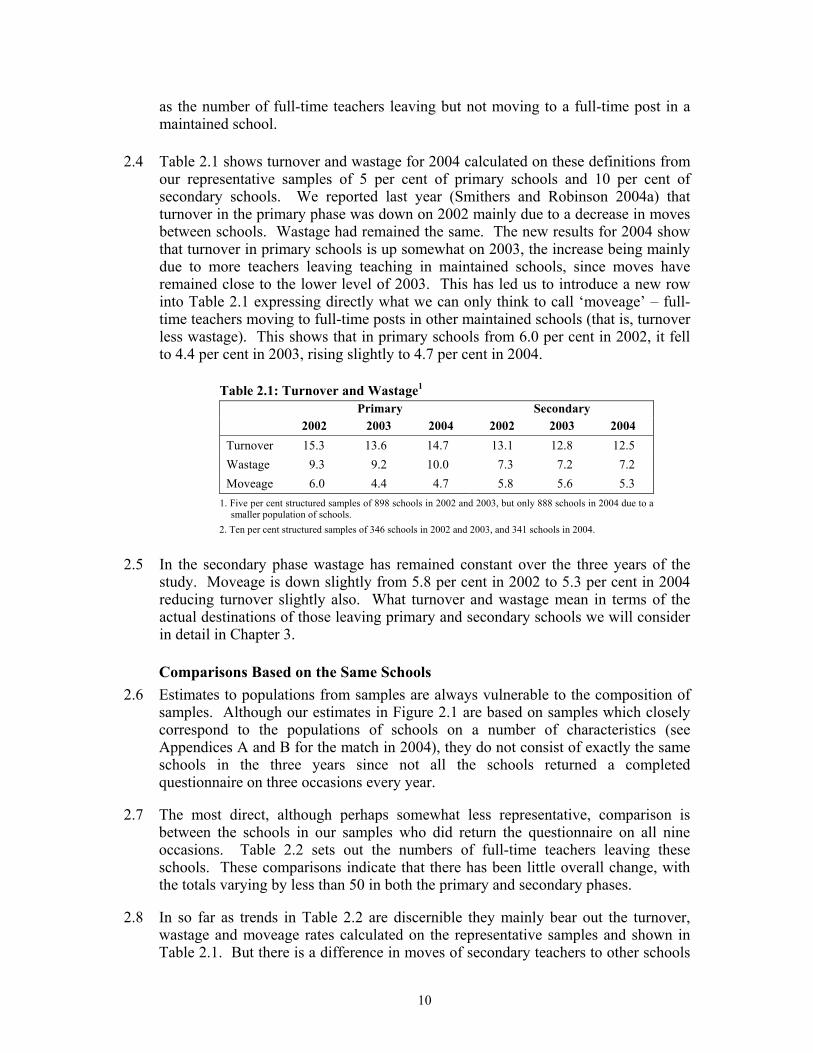
2.4 Table 2.1 shows turnover and wastage for 2004 calculated on these definitions from our representative samples of 5 per cent of primary schools and 10 per cent of secondary schools. We reported last year (Smithers and Robinson 2004a) that turnover in the primary phase was down on 2002 mainly due to a decrease in moves between schools. Wastage had remained the same. The new results for 2004 show that turnover in primary schools is up somewhat on 2003, the increase being mainly due to more teachers leaving teaching in maintained schools, since moves have remained close to the lower level of 2003. This has led us to introduce a new row into Table 2.1 expressing directly what we can only think to call ‘moveage’ – full-time teachers moving to full-time posts in other maintained schools (that is, turnover less wastage). This shows that in primary schools from 6.0 per cent in 2002, it fell to 4.4 per cent in 2003, rising slightly to 4.7 per cent in 2004.
Table 2.1: Turnover and Wastage1 Primary Secondary
2002 2003 2004 2002 2003 2004 Turnover 15.3 13.6 14.7 13.1 12.8 12.5 Wastage 9.3 9.2 10.0 7.3 7.2 7.2 Moveage 6.0 4.4 4.7 5.8 5.6 5.3
1. Five per cent structured samples of 898 schools in 2002 and 2003, but only 888 schools in 2004 due to a smaller population of schools.
2. Ten per cent structured samples of 346 schools in 2002 and 2003, and 341 schools in 2004.
2.5 In the secondary phase wastage has remained constant over the three years of the study. Moveage is down slightly from 5.8 per cent in 2002 to 5.3 per cent in 2004 reducing turnover slightly also. What turnover and wastage mean in terms of the actual destinations of those leaving primary and secondary schools we will consider in detail in Chapter 3.
Comparisons Based on the Same Schools 2.6 Estimates to populations from samples are always vulnerable to the composition of
samples. Although our estimates in Figure 2.1 are based on samples which closely correspond to the populations of schools on a number of characteristics (see Appendices A and B for the match in 2004), they do not consist of exactly the same schools in the three years since not all the schools returned a completed questionnaire on three occasions every year.
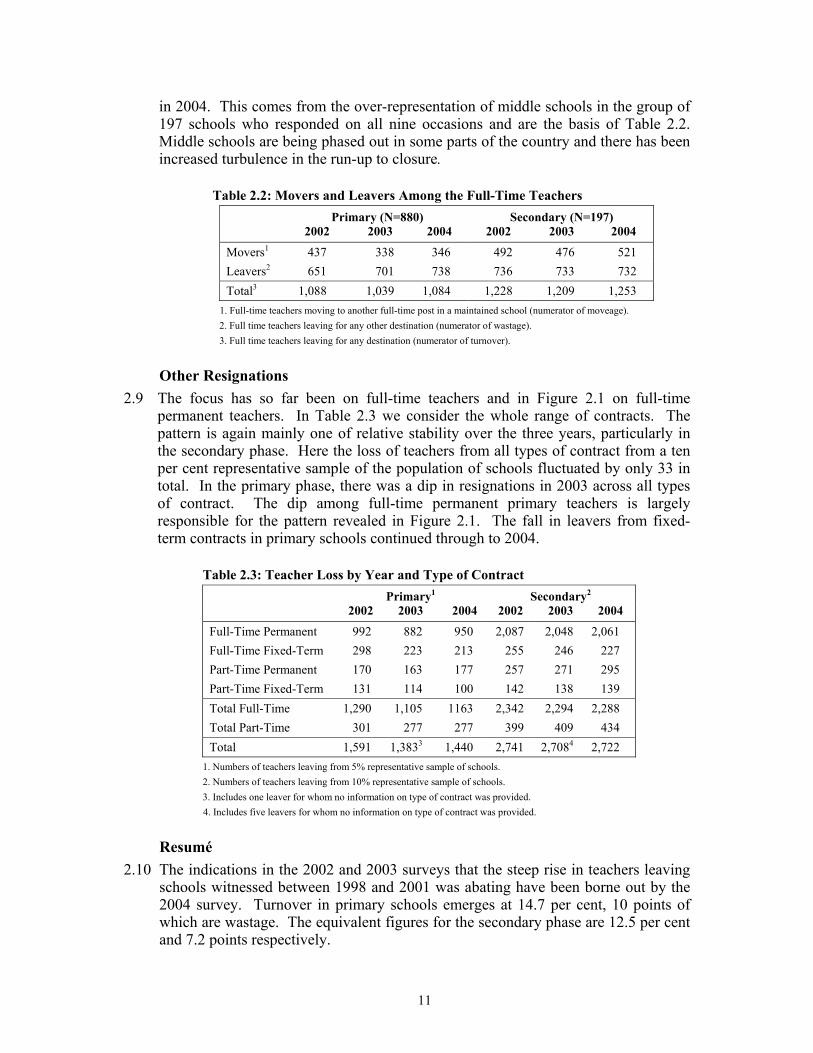
2.7 The most direct, although perhaps somewhat less representative, comparison is between the schools in our samples who did return the questionnaire on all nine occasions. Table 2.2 sets out the numbers of full-time teachers leaving these schools. These comparisons indicate that there has been little overall change, with the totals varying by less than 50 in both the primary and secondary phases.
2.8 In so far as trends in Table 2.2 are discernible they mainly bear out the turnover, wastage and moveage rates calculated on the representative samples and shown in Table 2.1. But there is a difference in moves of secondary teachers to other schools
11
in 2004. This comes from the over-representation of middle schools in the group of 197 schools who responded on all nine occasions and are the basis of Table 2.2. Middle schools are being phased out in some parts of the country and there has been increased turbulence in the run-up to closure.
Table 2.2: Movers and Leavers Among the Full-Time Teachers Primary (N=880) Secondary (N=197) 2002 2003 2004 2002 2003 2004
Movers1 437 338 346 492 476 521 Leavers2 651 701 738 736 733 732 Total3 1,088 1,039 1,084 1,228 1,209 1,253
1. Full-time teachers moving to another full-time post in a maintained school (numerator of moveage). 2. Full time teachers leaving for any other destination (numerator of wastage). 3. Full time teachers leaving for any destination (numerator of turnover).
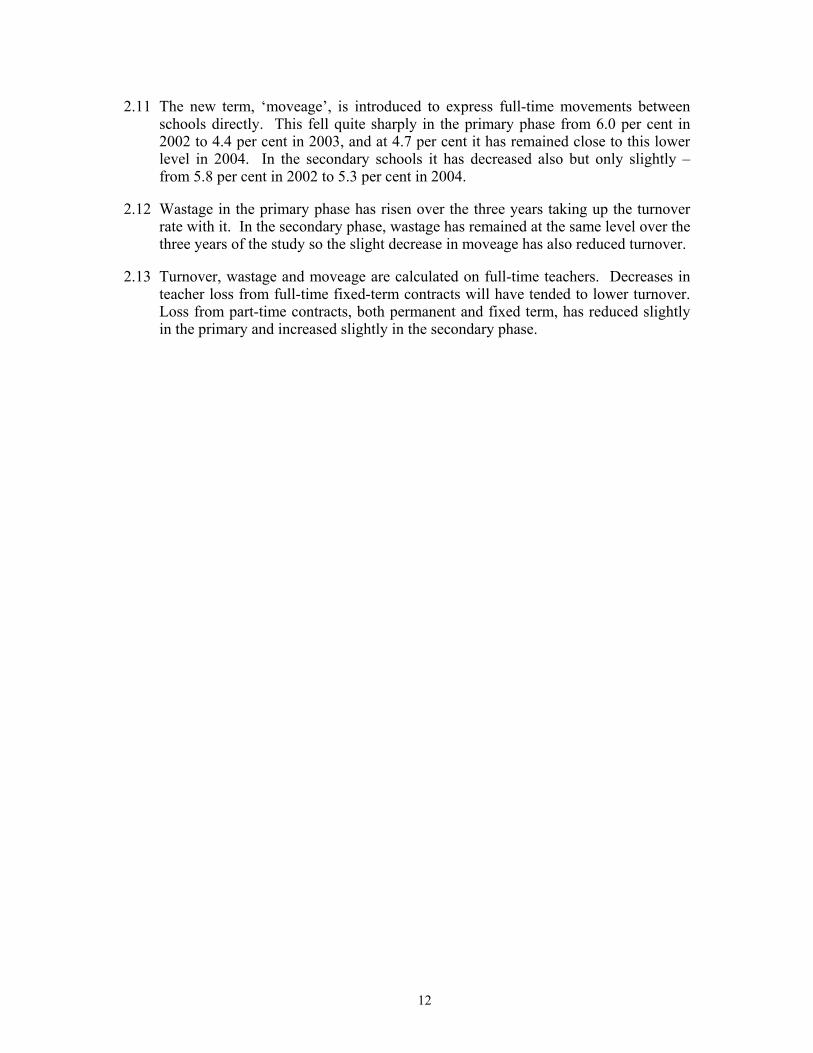
Other Resignations 2.9 The focus has so far been on full-time teachers and in Figure 2.1 on full-time
permanent teachers. In Table 2.3 we consider the whole range of contracts. The pattern is again mainly one of relative stability over the three years, particularly in the secondary phase. Here the loss of teachers from all types of contract from a ten per cent representative sample of the population of schools fluctuated by only 33 in total. In the primary phase, there was a dip in resignations in 2003 across all types of contract. The dip among full-time permanent primary teachers is largely responsible for the pattern revealed in Figure 2.1. The fall in leavers from fixed-term contracts in primary schools continued through to 2004.
Table 2.3: Teacher Loss by Year and Type of Contract Primary1 Secondary2
2002 2003 2004 2002 2003 2004
Full-Time Permanent 992 882 950 2,087 2,048 2,061 Full-Time Fixed-Term 298 223 213 255 246 227 Part-Time Permanent 170 163 177 257 271 295 Part-Time Fixed-Term 131 114 100 142 138 139 Total Full-Time 1,290 1,105 1163 2,342 2,294 2,288 Total Part-Time 301 277 277 399 409 434 Total 1,591 1,3833 1,440 2,741 2,7084 2,722
1. Numbers of teachers leaving from 5% representative sample of schools. 2. Numbers of teachers leaving from 10% representative sample of schools. 3. Includes one leaver for whom no information on type of contract was provided. 4. Includes five leavers for whom no information on type of contract was provided.
Resumé 2.10 The indications in the 2002 and 2003 surveys that the steep rise in teachers leaving
schools witnessed between 1998 and 2001 was abating have been borne out by the 2004 survey. Turnover in primary schools emerges at 14.7 per cent, 10 points of which are wastage. The equivalent figures for the secondary phase are 12.5 per cent and 7.2 points respectively.
12
2.11 The new term, ‘moveage’, is introduced to express full-time movements between schools directly. This fell quite sharply in the primary phase from 6.0 per cent in 2002 to 4.4 per cent in 2003, and at 4.7 per cent it has remained close to this lower level in 2004. In the secondary schools it has decreased also but only slightly – from 5.8 per cent in 2002 to 5.3 per cent in 2004.
2.12 Wastage in the primary phase has risen over the three years taking up the turnover rate with it. In the secondary phase, wastage has remained at the same level over the three years of the study so the slight decrease in moveage has also reduced turnover.
2.13 Turnover, wastage and moveage are calculated on full-time teachers. Decreases in teacher loss from full-time fixed-term contracts will have tended to lower turnover. Loss from part-time contracts, both permanent and fixed term, has reduced slightly in the primary and increased slightly in the secondary phase.
13
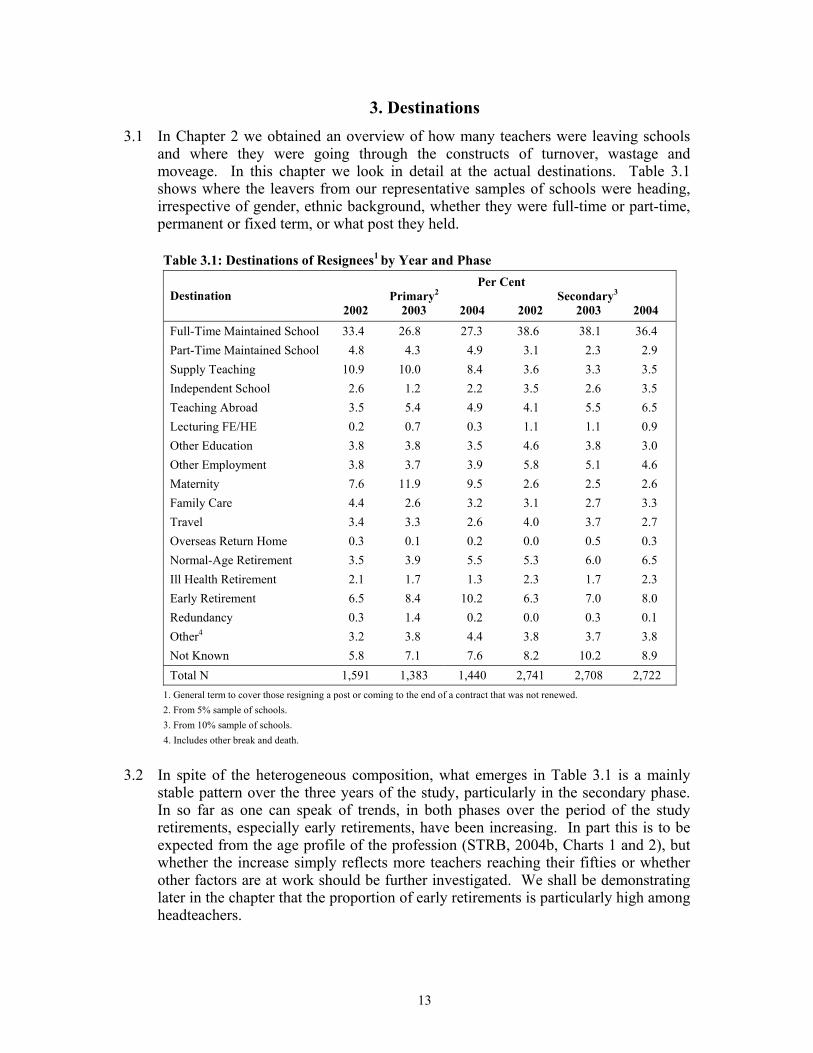
3. Destinations 3.1 In Chapter 2 we obtained an overview of how many teachers were leaving schools
and where they were going through the constructs of turnover, wastage and moveage. In this chapter we look in detail at the actual destinations. Table 3.1 shows where the leavers from our representative samples of schools were heading, irrespective of gender, ethnic background, whether they were full-time or part-time, permanent or fixed term, or what post they held.
Table 3.1: Destinations of Resignees1 by Year and Phase Per Cent
Primary2 Secondary3 Destination 2002 2003 2004 2002 2003 2004
Full-Time Maintained School 33.4 26.8 27.3 38.6 38.1 36.4 Part-Time Maintained School 4.8 4.3 4.9 3.1 2.3 2.9 Supply Teaching 10.9 10.0 8.4 3.6 3.3 3.5 Independent School 2.6 1.2 2.2 3.5 2.6 3.5 Teaching Abroad 3.5 5.4 4.9 4.1 5.5 6.5 Lecturing FE/HE 0.2 0.7 0.3 1.1 1.1 0.9 Other Education 3.8 3.8 3.5 4.6 3.8 3.0 Other Employment 3.8 3.7 3.9 5.8 5.1 4.6 Maternity 7.6 11.9 9.5 2.6 2.5 2.6 Family Care 4.4 2.6 3.2 3.1 2.7 3.3 Travel 3.4 3.3 2.6 4.0 3.7 2.7 Overseas Return Home 0.3 0.1 0.2 0.0 0.5 0.3 Normal-Age Retirement 3.5 3.9 5.5 5.3 6.0 6.5 Ill Health Retirement 2.1 1.7 1.3 2.3 1.7 2.3 Early Retirement 6.5 8.4 10.2 6.3 7.0 8.0 Redundancy 0.3 1.4 0.2 0.0 0.3 0.1 Other4 3.2 3.8 4.4 3.8 3.7 3.8 Not Known 5.8 7.1 7.6 8.2 10.2 8.9 Total N 1,591 1,383 1,440 2,741 2,708 2,722
1. General term to cover those resigning a post or coming to the end of a contract that was not renewed. 2. From 5% sample of schools. 3. From 10% sample of schools. 4. Includes other break and death.
3.2 In spite of the heterogeneous composition, what emerges in Table 3.1 is a mainly stable pattern over the three years of the study, particularly in the secondary phase. In so far as one can speak of trends, in both phases over the period of the study retirements, especially early retirements, have been increasing. In part this is to be expected from the age profile of the profession (STRB, 2004b, Charts 1 and 2), but whether the increase simply reflects more teachers reaching their fifties or whether other factors are at work should be further investigated. We shall be demonstrating later in the chapter that the proportion of early retirements is particularly high among headteachers.
14
3.3 In the report on the 2003 surveys (Smithers and Robinson, 2004a) we noted that fewer primary teachers were moving to other maintained schools than in the previous year. In 2004 moves remained at the lower level. We suggested that the drop could be associated with fewer opportunities to move as pupil numbers (the basis of funding) in that phase fell. Fewer primary leavers seemed to be aiming for supply teaching which may also reflect less opportunity, perhaps because of falling pupil numbers, but also conceivably as a consequence of workload reform measures, with more assistants in schools to provide cover.
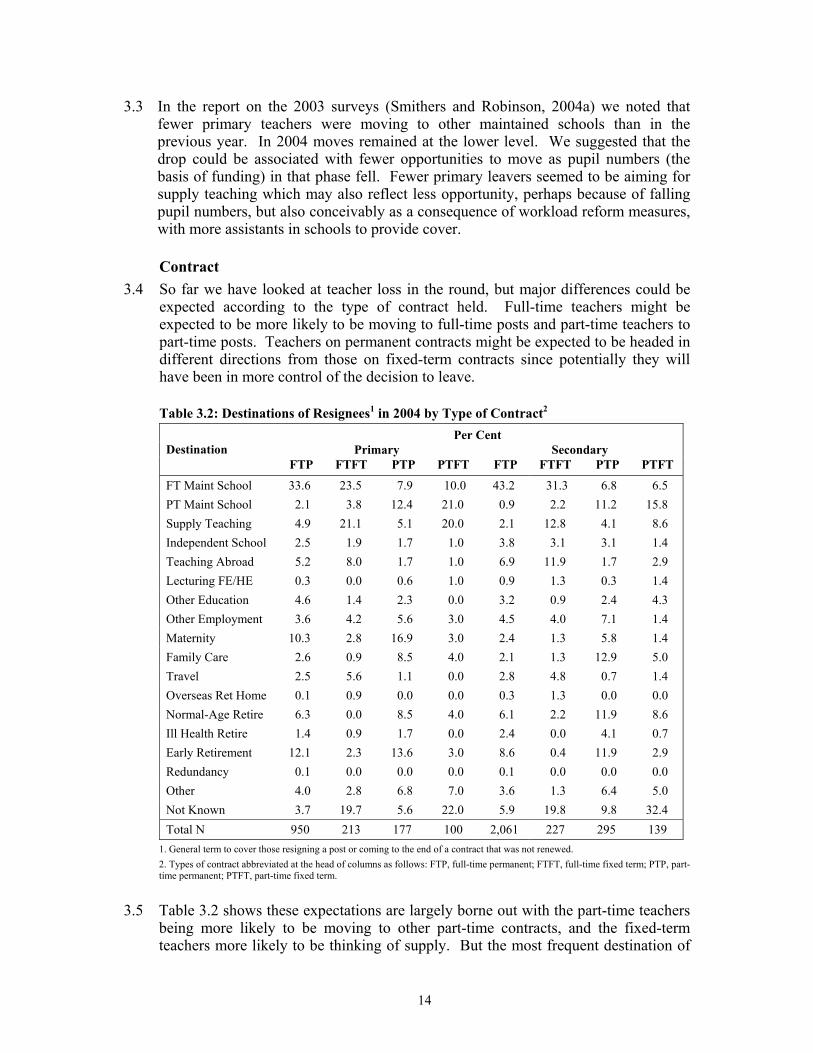
Contract 3.4 So far we have looked at teacher loss in the round, but major differences could be
expected according to the type of contract held. Full-time teachers might be expected to be more likely to be moving to full-time posts and part-time teachers to part-time posts. Teachers on permanent contracts might be expected to be headed in different directions from those on fixed-term contracts since potentially they will have been in more control of the decision to leave.
Table 3.2: Destinations of Resignees1 in 2004 by Type of Contract2 Per Cent
Primary Secondary Destination FTP FTFT PTP PTFT FTP FTFT PTP PTFT
FT Maint School 33.6 23.5 7.9 10.0 43.2 31.3 6.8 6.5 PT Maint School 2.1 3.8 12.4 21.0 0.9 2.2 11.2 15.8 Supply Teaching 4.9 21.1 5.1 20.0 2.1 12.8 4.1 8.6 Independent School 2.5 1.9 1.7 1.0 3.8 3.1 3.1 1.4 Teaching Abroad 5.2 8.0 1.7 1.0 6.9 11.9 1.7 2.9 Lecturing FE/HE 0.3 0.0 0.6 1.0 0.9 1.3 0.3 1.4 Other Education 4.6 1.4 2.3 0.0 3.2 0.9 2.4 4.3 Other Employment 3.6 4.2 5.6 3.0 4.5 4.0 7.1 1.4 Maternity 10.3 2.8 16.9 3.0 2.4 1.3 5.8 1.4 Family Care 2.6 0.9 8.5 4.0 2.1 1.3 12.9 5.0 Travel 2.5 5.6 1.1 0.0 2.8 4.8 0.7 1.4 Overseas Ret Home 0.1 0.9 0.0 0.0 0.3 1.3 0.0 0.0 Normal-Age Retire 6.3 0.0 8.5 4.0 6.1 2.2 11.9 8.6 Ill Health Retire 1.4 0.9 1.7 0.0 2.4 0.0 4.1 0.7 Early Retirement 12.1 2.3 13.6 3.0 8.6 0.4 11.9 2.9 Redundancy 0.1 0.0 0.0 0.0 0.1 0.0 0.0 0.0 Other 4.0 2.8 6.8 7.0 3.6 1.3 6.4 5.0 Not Known 3.7 19.7 5.6 22.0 5.9 19.8 9.8 32.4 Total N 950 213 177 100 2,061 227 295 139
1. General term to cover those resigning a post or coming to the end of a contract that was not renewed. 2. Types of contract abbreviated at the head of columns as follows: FTP, full-time permanent; FTFT, full-time fixed term; PTP, part-time permanent; PTFT, part-time fixed term.
3.5 Table 3.2 shows these expectations are largely borne out with the part-time teachers being more likely to be moving to other part-time contracts, and the fixed-term teachers more likely to be thinking of supply. But the most frequent destination of
15
teachers from full-time fixed-term contracts was a permanent position suggesting that they might already have preferred this type of contract if it had been available to them. The headteachers were less aware of the destinations of the fixed-term teachers.
3.6 Among the full-time permanent resignations, 43 per cent of those in the secondary phase in 2004 were moving full time to other maintained schools compared with only a third of those in the primary phase. Much of the difference is down to maternity in the primary phase, which, as we shall be seeing, is not just a matter of the respective proportions of female teachers, but also the birth rates. Separating out those leaving according to contract held also underlines the part played by retirement, since the concept is mainly associated with holding a permanent post and its extent is somewhat masked when all leavers are taken together as in Table 3.1.
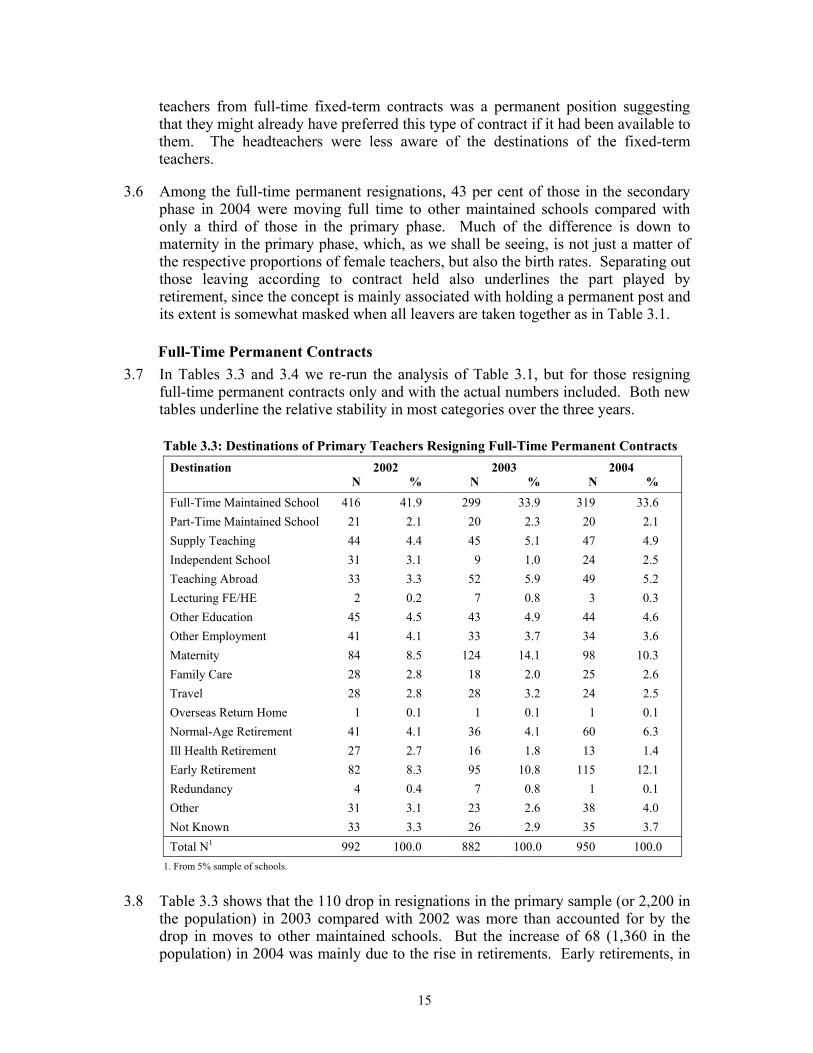
Full-Time Permanent Contracts 3.7 In Tables 3.3 and 3.4 we re-run the analysis of Table 3.1, but for those resigning
full-time permanent contracts only and with the actual numbers included. Both new tables underline the relative stability in most categories over the three years.
Table 3.3: Destinations of Primary Teachers Resigning Full-Time Permanent Contracts 2002 2003 2004 Destination
N % N % N %
Full-Time Maintained School 416 41.9 299 33.9 319 33.6 Part-Time Maintained School 21 2.1 20 2.3 20 2.1 Supply Teaching 44 4.4 45 5.1 47 4.9 Independent School 31 3.1 9 1.0 24 2.5 Teaching Abroad 33 3.3 52 5.9 49 5.2 Lecturing FE/HE 2 0.2 7 0.8 3 0.3 Other Education 45 4.5 43 4.9 44 4.6 Other Employment 41 4.1 33 3.7 34 3.6 Maternity 84 8.5 124 14.1 98 10.3 Family Care 28 2.8 18 2.0 25 2.6 Travel 28 2.8 28 3.2 24 2.5 Overseas Return Home 1 0.1 1 0.1 1 0.1 Normal-Age Retirement 41 4.1 36 4.1 60 6.3 Ill Health Retirement 27 2.7 16 1.8 13 1.4 Early Retirement 82 8.3 95 10.8 115 12.1 Redundancy 4 0.4 7 0.8 1 0.1 Other 31 3.1 23 2.6 38 4.0 Not Known 33 3.3 26 2.9 35 3.7 Total N1 992 100.0 882 100.0 950 100.0
1. From 5% sample of schools.
3.8 Table 3.3 shows that the 110 drop in resignations in the primary sample (or 2,200 in the population) in 2003 compared with 2002 was more than accounted for by the drop in moves to other maintained schools. But the increase of 68 (1,360 in the population) in 2004 was mainly due to the rise in retirements. Early retirements, in
16
fact, increased by 40 per cent in the primary phase from 2002 to 2004, though at an estimated 2,300 for the population in 2004 that is still only about 1.8 per cent of the full-time permanent teachers in primary schools. This rises to 2.9 per cent when normal-age and ill-health retirements are included.
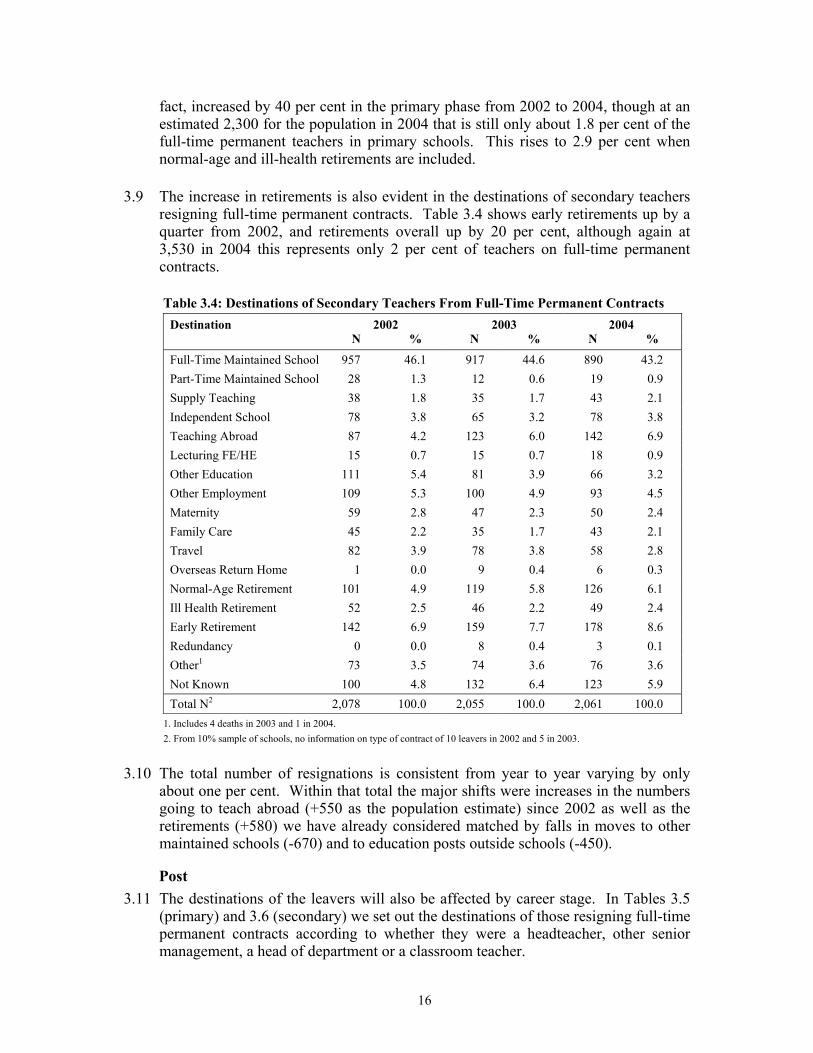
3.9 The increase in retirements is also evident in the destinations of secondary teachers resigning full-time permanent contracts. Table 3.4 shows early retirements up by a quarter from 2002, and retirements overall up by 20 per cent, although again at 3,530 in 2004 this represents only 2 per cent of teachers on full-time permanent contracts.
Table 3.4: Destinations of Secondary Teachers From Full-Time Permanent Contracts 2002 2003 2004 Destination
N % N % N %
Full-Time Maintained School 957 46.1 917 44.6 890 43.2 Part-Time Maintained School 28 1.3 12 0.6 19 0.9 Supply Teaching 38 1.8 35 1.7 43 2.1 Independent School 78 3.8 65 3.2 78 3.8 Teaching Abroad 87 4.2 123 6.0 142 6.9 Lecturing FE/HE 15 0.7 15 0.7 18 0.9 Other Education 111 5.4 81 3.9 66 3.2 Other Employment 109 5.3 100 4.9 93 4.5 Maternity 59 2.8 47 2.3 50 2.4 Family Care 45 2.2 35 1.7 43 2.1 Travel 82 3.9 78 3.8 58 2.8 Overseas Return Home 1 0.0 9 0.4 6 0.3 Normal-Age Retirement 101 4.9 119 5.8 126 6.1 Ill Health Retirement 52 2.5 46 2.2 49 2.4 Early Retirement 142 6.9 159 7.7 178 8.6 Redundancy 0 0.0 8 0.4 3 0.1 Other1 73 3.5 74 3.6 76 3.6 Not Known 100 4.8 132 6.4 123 5.9 Total N2 2,078 100.0 2,055 100.0 2,061 100.0
1. Includes 4 deaths in 2003 and 1 in 2004. 2. From 10% sample of schools, no information on type of contract of 10 leavers in 2002 and 5 in 2003.
3.10 The total number of resignations is consistent from year to year varying by only about one per cent. Within that total the major shifts were increases in the numbers going to teach abroad (+550 as the population estimate) since 2002 as well as the retirements (+580) we have already considered matched by falls in moves to other maintained schools (-670) and to education posts outside schools (-450).
Post 3.11 The destinations of the leavers will also be affected by career stage. In Tables 3.5
(primary) and 3.6 (secondary) we set out the destinations of those resigning full-time permanent contracts according to whether they were a headteacher, other senior management, a head of department or a classroom teacher.
17
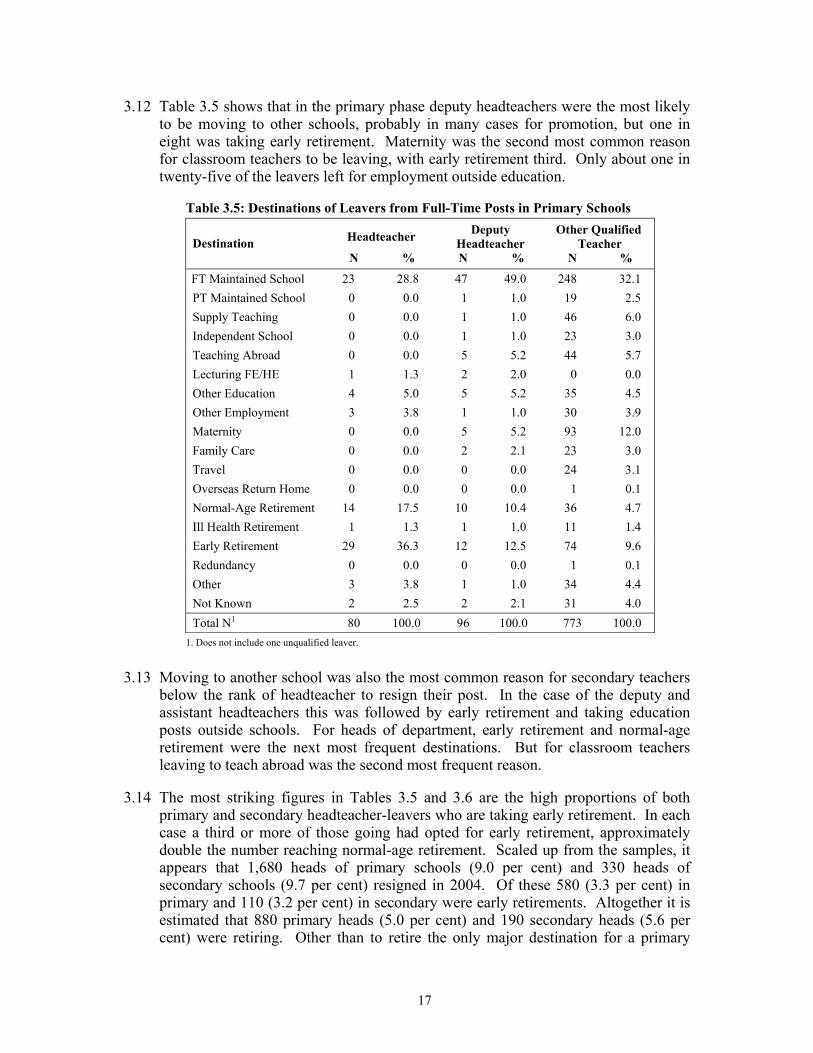
3.12 Table 3.5 shows that in the primary phase deputy headteachers were the most likely to be moving to other schools, probably in many cases for promotion, but one in eight was taking early retirement. Maternity was the second most common reason for classroom teachers to be leaving, with early retirement third. Only about one in twenty-five of the leavers left for employment outside education.
Table 3.5: Destinations of Leavers from Full-Time Posts in Primary Schools
Headteacher Deputy Headteacher
Other Qualified Teacher Destination
N % N % N %
FT Maintained School 23 28.8 47 49.0 248 32.1 PT Maintained School 0 0.0 1 1.0 19 2.5 Supply Teaching 0 0.0 1 1.0 46 6.0 Independent School 0 0.0 1 1.0 23 3.0 Teaching Abroad 0 0.0 5 5.2 44 5.7 Lecturing FE/HE 1 1.3 2 2.0 0 0.0 Other Education 4 5.0 5 5.2 35 4.5 Other Employment 3 3.8 1 1.0 30 3.9 Maternity 0 0.0 5 5.2 93 12.0 Family Care 0 0.0 2 2.1 23 3.0 Travel 0 0.0 0 0.0 24 3.1 Overseas Return Home 0 0.0 0 0.0 1 0.1 Normal-Age Retirement 14 17.5 10 10.4 36 4.7 Ill Health Retirement 1 1.3 1 1.0 11 1.4 Early Retirement 29 36.3 12 12.5 74 9.6 Redundancy 0 0.0 0 0.0 1 0.1 Other 3 3.8 1 1.0 34 4.4 Not Known 2 2.5 2 2.1 31 4.0 Total N1 80 100.0 96 100.0 773 100.0
1. Does not include one unqualified leaver.
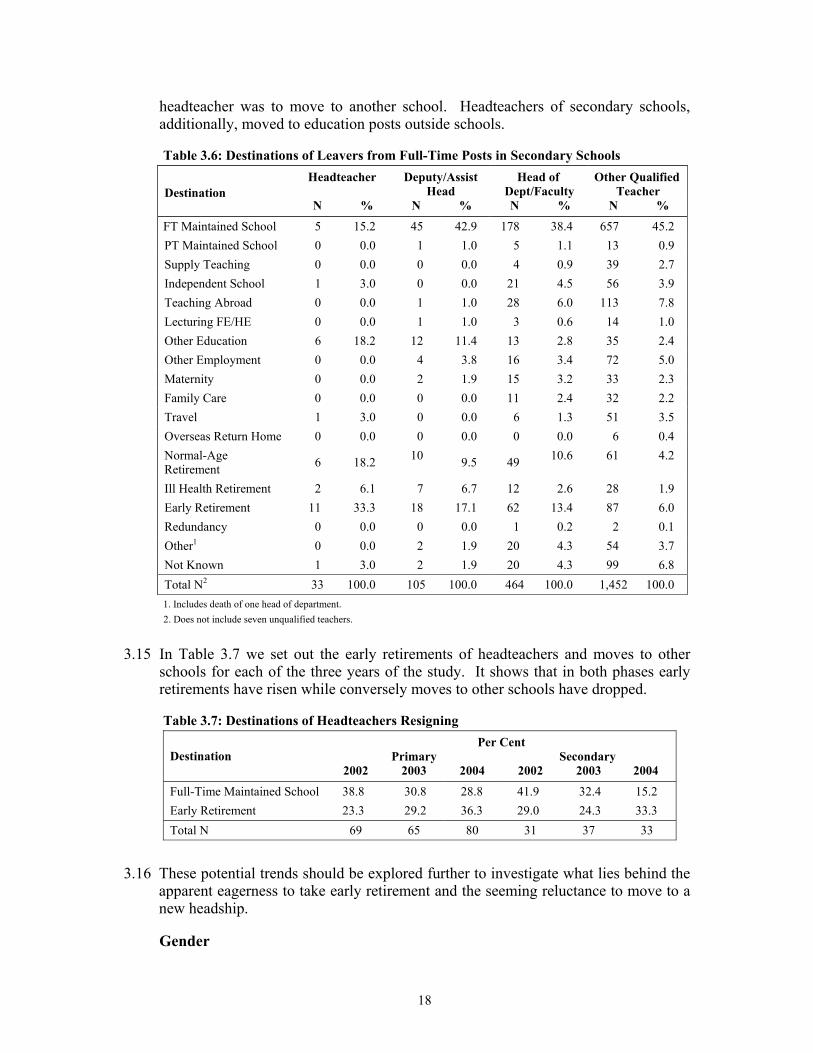
3.13 Moving to another school was also the most common reason for secondary teachers below the rank of headteacher to resign their post. In the case of the deputy and assistant headteachers this was followed by early retirement and taking education posts outside schools. For heads of department, early retirement and normal-age retirement were the next most frequent destinations. But for classroom teachers leaving to teach abroad was the second most frequent reason.
3.14 The most striking figures in Tables 3.5 and 3.6 are the high proportions of both primary and secondary headteacher-leavers who are taking early retirement. In each case a third or more of those going had opted for early retirement, approximately double the number reaching normal-age retirement. Scaled up from the samples, it appears that 1,680 heads of primary schools (9.0 per cent) and 330 heads of secondary schools (9.7 per cent) resigned in 2004. Of these 580 (3.3 per cent) in primary and 110 (3.2 per cent) in secondary were early retirements. Altogether it is estimated that 880 primary heads (5.0 per cent) and 190 secondary heads (5.6 per cent) were retiring. Other than to retire the only major destination for a primary
18
headteacher was to move to another school. Headteachers of secondary schools, additionally, moved to education posts outside schools.
Table 3.6: Destinations of Leavers from Full-Time Posts in Secondary Schools Headteacher Deputy/Assist
Head Head of
Dept/Faculty Other Qualified
Teacher Destination N % N % N % N %
FT Maintained School 5 15.2 45 42.9 178 38.4 657 45.2 PT Maintained School 0 0.0 1 1.0 5 1.1 13 0.9 Supply Teaching 0 0.0 0 0.0 4 0.9 39 2.7 Independent School 1 3.0 0 0.0 21 4.5 56 3.9 Teaching Abroad 0 0.0 1 1.0 28 6.0 113 7.8 Lecturing FE/HE 0 0.0 1 1.0 3 0.6 14 1.0 Other Education 6 18.2 12 11.4 13 2.8 35 2.4 Other Employment 0 0.0 4 3.8 16 3.4 72 5.0 Maternity 0 0.0 2 1.9 15 3.2 33 2.3 Family Care 0 0.0 0 0.0 11 2.4 32 2.2 Travel 1 3.0 0 0.0 6 1.3 51 3.5 Overseas Return Home 0 0.0 0 0.0 0 0.0 6 0.4 Normal-Age Retirement 6 18.2 10 9.5 49 10.6 61 4.2
Ill Health Retirement 2 6.1 7 6.7 12 2.6 28 1.9 Early Retirement 11 33.3 18 17.1 62 13.4 87 6.0 Redundancy 0 0.0 0 0.0 1 0.2 2 0.1 Other1 0 0.0 2 1.9 20 4.3 54 3.7 Not Known 1 3.0 2 1.9 20 4.3 99 6.8 Total N2 33 100.0 105 100.0 464 100.0 1,452 100.0 1. Includes death of one head of department. 2. Does not include seven unqualified teachers.
3.15 In Table 3.7 we set out the early retirements of headteachers and moves to other schools for each of the three years of the study. It shows that in both phases early retirements have risen while conversely moves to other schools have dropped.
Table 3.7: Destinations of Headteachers Resigning Per Cent
Primary Secondary Destination 2002 2003 2004 2002 2003 2004
Full-Time Maintained School 38.8 30.8 28.8 41.9 32.4 15.2 Early Retirement 23.3 29.2 36.3 29.0 24.3 33.3 Total N 69 65 80 31 37 33
3.16 These potential trends should be explored further to investigate what lies behind the apparent eagerness to take early retirement and the seeming reluctance to move to a new headship.
Gender
19
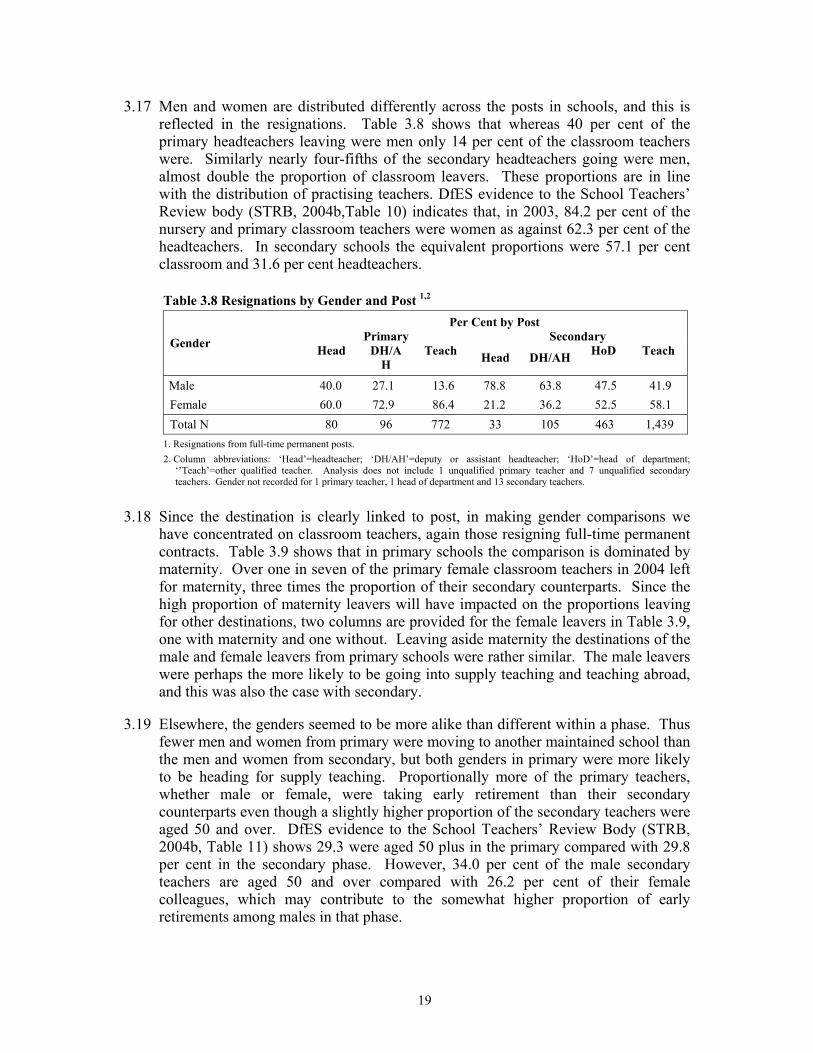
3.17 Men and women are distributed differently across the posts in schools, and this is reflected in the resignations. Table 3.8 shows that whereas 40 per cent of the primary headteachers leaving were men only 14 per cent of the classroom teachers were. Similarly nearly four-fifths of the secondary headteachers going were men, almost double the proportion of classroom leavers. These proportions are in line with the distribution of practising teachers. DfES evidence to the School Teachers’ Review body (STRB, 2004b,Table 10) indicates that, in 2003, 84.2 per cent of the nursery and primary classroom teachers were women as against 62.3 per cent of the headteachers. In secondary schools the equivalent proportions were 57.1 per cent classroom and 31.6 per cent headteachers.
Table 3.8 Resignations by Gender and Post 1,2 Per Cent by Post
Primary Secondary Gender Head DH/AH
Teach Head DH/AH HoD Teach
Male 40.0 27.1 13.6 78.8 63.8 47.5 41.9 Female 60.0 72.9 86.4 21.2 36.2 52.5 58.1 Total N 80 96 772 33 105 463 1,439
1. Resignations from full-time permanent posts. 2. Column abbreviations: ‘Head’=headteacher; ‘DH/AH’=deputy or assistant headteacher; ‘HoD’=head of department;
‘’Teach’=other qualified teacher. Analysis does not include 1 unqualified primary teacher and 7 unqualified secondary teachers. Gender not recorded for 1 primary teacher, 1 head of department and 13 secondary teachers.
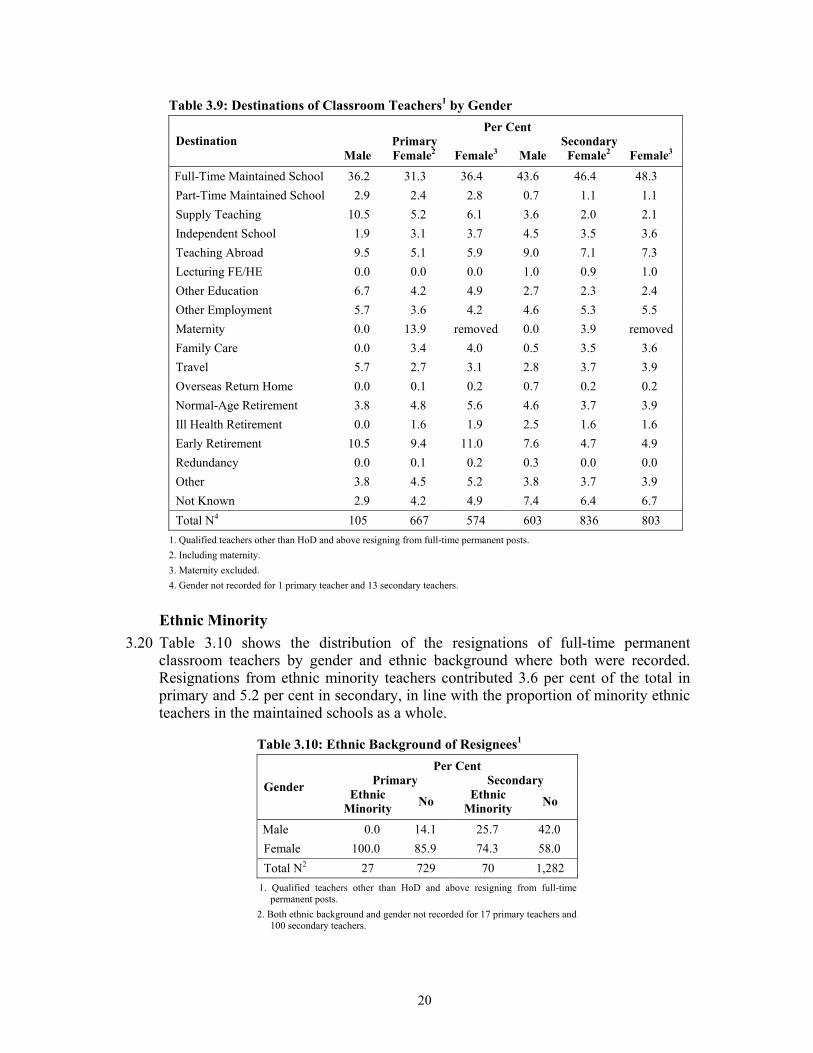
3.18 Since the destination is clearly linked to post, in making gender comparisons we have concentrated on classroom teachers, again those resigning full-time permanent contracts. Table 3.9 shows that in primary schools the comparison is dominated by maternity. Over one in seven of the primary female classroom teachers in 2004 left for maternity, three times the proportion of their secondary counterparts. Since the high proportion of maternity leavers will have impacted on the proportions leaving for other destinations, two columns are provided for the female leavers in Table 3.9, one with maternity and one without. Leaving aside maternity the destinations of the male and female leavers from primary schools were rather similar. The male leavers were perhaps the more likely to be going into supply teaching and teaching abroad, and this was also the case with secondary.
3.19 Elsewhere, the genders seemed to be more alike than different within a phase. Thus fewer men and women from primary were moving to another maintained school than the men and women from secondary, but both genders in primary were more likely to be heading for supply teaching. Proportionally more of the primary teachers, whether male or female, were taking early retirement than their secondary counterparts even though a slightly higher proportion of the secondary teachers were aged 50 and over. DfES evidence to the School Teachers’ Review Body (STRB, 2004b, Table 11) shows 29.3 were aged 50 plus in the primary compared with 29.8 per cent in the secondary phase. However, 34.0 per cent of the male secondary teachers are aged 50 and over compared with 26.2 per cent of their female colleagues, which may contribute to the somewhat higher proportion of early retirements among males in that phase.
20
Table 3.9: Destinations of Classroom Teachers1 by Gender Per Cent
Primary Secondary Destination Male Female2 Female3 Male Female2 Female3
Full-Time Maintained School 36.2 31.3 36.4 43.6 46.4 48.3 Part-Time Maintained School 2.9 2.4 2.8 0.7 1.1 1.1 Supply Teaching 10.5 5.2 6.1 3.6 2.0 2.1 Independent School 1.9 3.1 3.7 4.5 3.5 3.6 Teaching Abroad 9.5 5.1 5.9 9.0 7.1 7.3 Lecturing FE/HE 0.0 0.0 0.0 1.0 0.9 1.0 Other Education 6.7 4.2 4.9 2.7 2.3 2.4 Other Employment 5.7 3.6 4.2 4.6 5.3 5.5 Maternity 0.0 13.9 removed 0.0 3.9 removed Family Care 0.0 3.4 4.0 0.5 3.5 3.6 Travel 5.7 2.7 3.1 2.8 3.7 3.9 Overseas Return Home 0.0 0.1 0.2 0.7 0.2 0.2 Normal-Age Retirement 3.8 4.8 5.6 4.6 3.7 3.9 Ill Health Retirement 0.0 1.6 1.9 2.5 1.6 1.6 Early Retirement 10.5 9.4 11.0 7.6 4.7 4.9 Redundancy 0.0 0.1 0.2 0.3 0.0 0.0 Other 3.8 4.5 5.2 3.8 3.7 3.9 Not Known 2.9 4.2 4.9 7.4 6.4 6.7 Total N4 105 667 574 603 836 803
1. Qualified teachers other than HoD and above resigning from full-time permanent posts. 2. Including maternity. 3. Maternity excluded. 4. Gender not recorded for 1 primary teacher and 13 secondary teachers.
Ethnic Minority 3.20 Table 3.10 shows the distribution of the resignations of full-time permanent
classroom teachers by gender and ethnic background where both were recorded. Resignations from ethnic minority teachers contributed 3.6 per cent of the total in primary and 5.2 per cent in secondary, in line with the proportion of minority ethnic teachers in the maintained schools as a whole.
Table 3.10: Ethnic Background of Resignees1 Per Cent
Primary Secondary Gender Ethnic Minority No Ethnic
Minority No
Male 0.0 14.1 25.7 42.0 Female 100.0 85.9 74.3 58.0 Total N2 27 729 70 1,282
1. Qualified teachers other than HoD and above resigning from full-time permanent posts.
2. Both ethnic background and gender not recorded for 17 primary teachers and 100 secondary teachers.
21
3.21 Teachers from an ethnic minority background comprise only a small part of the teaching force. The School Workforce Statistics (DfES, 2005a) show that of the teachers providing information (17.8 per cent did not) 4.7 per cent were of Black, Asian or other minority ethnic background. More are being trained. The latest figures from the Teacher Training Agency (Smithers and Robinson, 2004b) indicate that 6 and 9 per cent of the primary and secondary trainees respectively are minority ethnic.
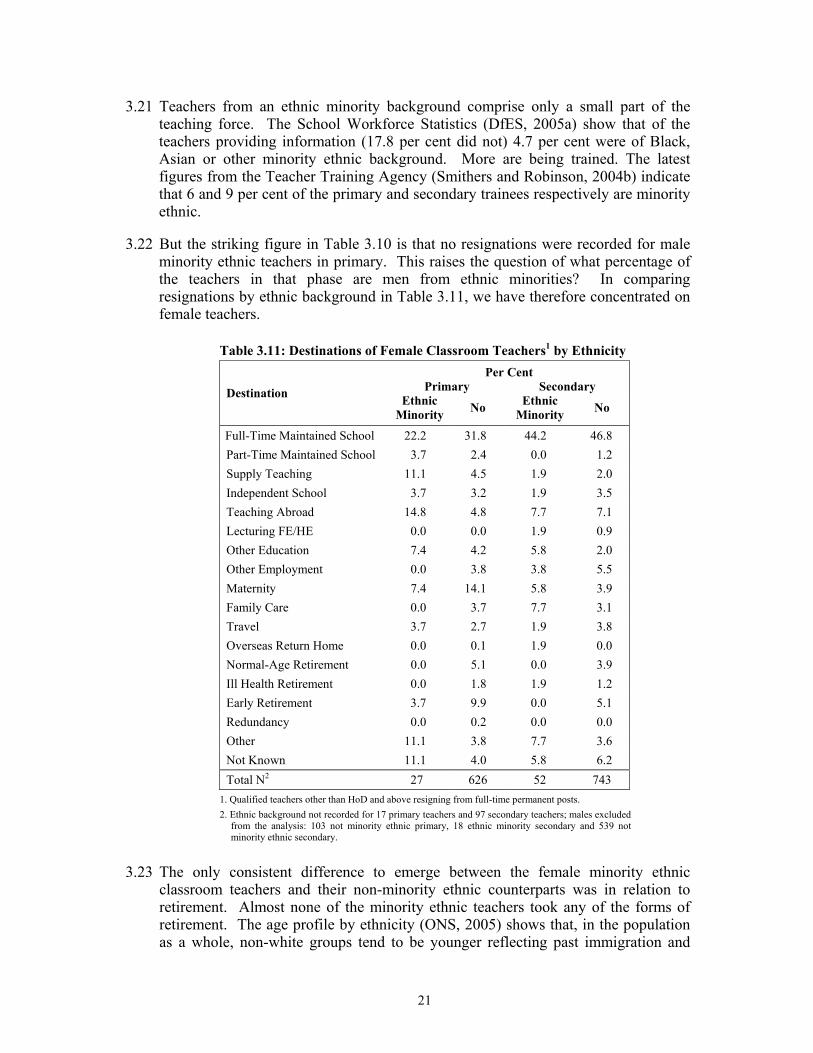
3.22 But the striking figure in Table 3.10 is that no resignations were recorded for male minority ethnic teachers in primary. This raises the question of what percentage of the teachers in that phase are men from ethnic minorities? In comparing resignations by ethnic background in Table 3.11, we have therefore concentrated on female teachers.
Table 3.11: Destinations of Female Classroom Teachers1 by Ethnicity Per Cent
Primary Secondary Destination Ethnic Minority No Ethnic
Minority No
Full-Time Maintained School 22.2 31.8 44.2 46.8 Part-Time Maintained School 3.7 2.4 0.0 1.2 Supply Teaching 11.1 4.5 1.9 2.0 Independent School 3.7 3.2 1.9 3.5 Teaching Abroad 14.8 4.8 7.7 7.1 Lecturing FE/HE 0.0 0.0 1.9 0.9 Other Education 7.4 4.2 5.8 2.0 Other Employment 0.0 3.8 3.8 5.5 Maternity 7.4 14.1 5.8 3.9 Family Care 0.0 3.7 7.7 3.1 Travel 3.7 2.7 1.9 3.8 Overseas Return Home 0.0 0.1 1.9 0.0 Normal-Age Retirement 0.0 5.1 0.0 3.9 Ill Health Retirement 0.0 1.8 1.9 1.2 Early Retirement 3.7 9.9 0.0 5.1 Redundancy 0.0 0.2 0.0 0.0 Other 11.1 3.8 7.7 3.6 Not Known 11.1 4.0 5.8 6.2 Total N2 27 626 52 743
1. Qualified teachers other than HoD and above resigning from full-time permanent posts. 2. Ethnic background not recorded for 17 primary teachers and 97 secondary teachers; males excluded
from the analysis: 103 not minority ethnic primary, 18 ethnic minority secondary and 539 not minority ethnic secondary.
3.23 The only consistent difference to emerge between the female minority ethnic classroom teachers and their non-minority ethnic counterparts was in relation to retirement. Almost none of the minority ethnic teachers took any of the forms of retirement. The age profile by ethnicity (ONS, 2005) shows that, in the population as a whole, non-white groups tend to be younger reflecting past immigration and
22
fertility patterns. Taken together with entry patterns into teaching it is likely that few of the minority ethnic teachers were eligible for early retirement. Leaving aside retirements, nothing about resignation appeared to be associated particularly with ethnicity.
Resumé 3.24 Comparison of the numbers and destinations of teachers leaving schools in our
samples across the three years of the study suggests relative stability from year to year. In so far as a trend is discernible, it is for an increasing number of early retirements. This is particularly the case for headteachers where over a third of those leaving do so on early retirement. The proportion of early retirements is higher in the primary phase than in the secondary, and it has risen by 40 per cent since 2002. Redundancy which came on the scene for primary teachers in 2003 was negligible in 2004, and it is possible that early retirements instead are being used to manage staff numbers in relation to falling rolls.
3.25 Resignations among female classroom teachers in primary schools are dominated by maternity which comes only second to moving to another school as the reason for leaving. When maternity is taken out of the analysis there were few differences between the genders within the primary and secondary phases. The phases themselves though differed with fewer full-time moves to maintained schools and more to part-time and supply in primary. No resignations were recorded for male ethnic minority teachers in the primary phase, probably reflecting the low number of teachers in this category. When female teachers were compared no major differences in destinations were found with ethnic background other than that very few of the minority ethnic teachers took retirement.
23
4. Turnover, Wastage and Moveage
4.1 In this chapter we bring together the destination data as ‘turnover’ (full-time teachers resigning or finishing their contracts), ‘wastage’ (full-time teachers leaving other than for a full-time post in another maintained school) and ‘moveage’ (full-time teachers moving to full-time posts in another maintained school, or turnover minus wastage) in order to make comparisons at the system and school levels. Because we are keeping to the DfES definitions of turnover and wastage, in this chapter the focus becomes once more full-time teachers, both permanent and fixed term, not just the full-time permanent resignations featured in Chapter 3.
4.2 Our representative samples of primary and secondary schools show how many teachers were resigning for which destinations in the years 2002-2004. In order for the resignations to be expressed as turnover, wastage and moveage we also need to know how many full-time teachers there were in total. This is available for region within the datasets, but for gender we rely on national figures (DfES 2004a). There is also some national information on ethnicity and subject. We are, therefore, able to make comparisons for these four groupings. (Age which featured in the report on the 2003 survey relied on the Leavers Survey which was not repeated in 2004.) But we are also able to make comparisons between schools in terms of their pupil characteristics such as educational performance, eligibility for free school meals and special needs since school-level information together with the number of full-time teachers per school was provided to us by the DfES.
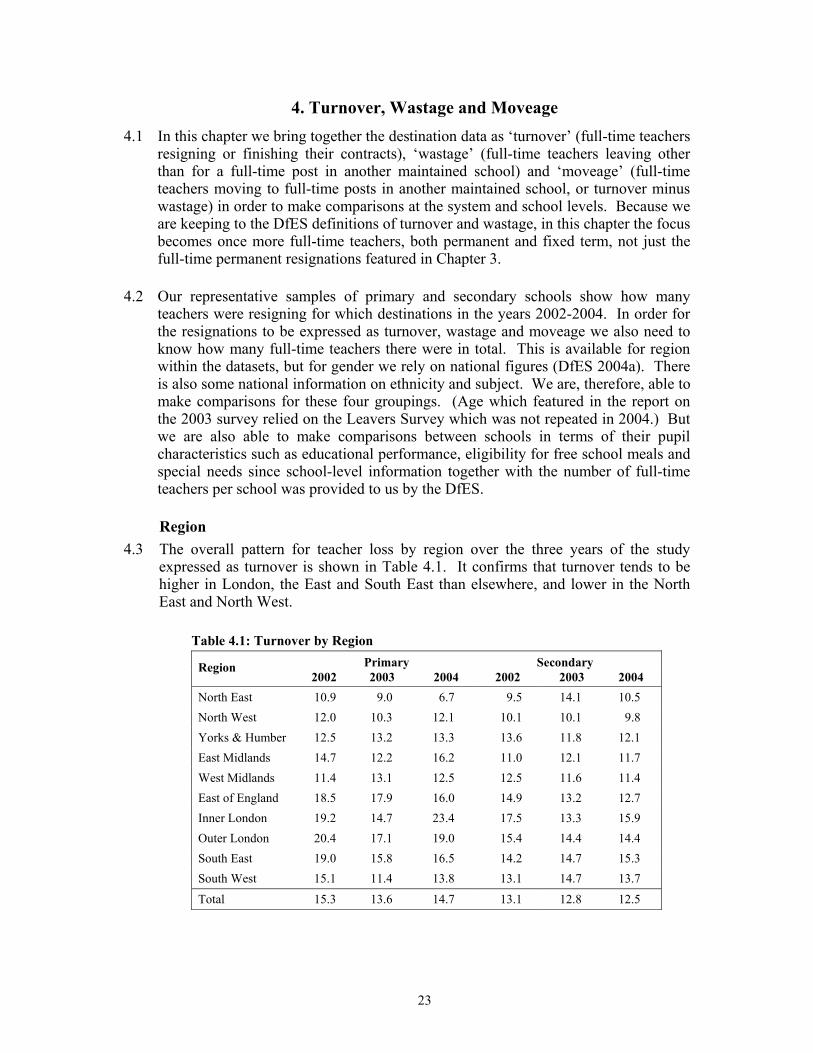
Region 4.3 The overall pattern for teacher loss by region over the three years of the study
expressed as turnover is shown in Table 4.1. It confirms that turnover tends to be higher in London, the East and South East than elsewhere, and lower in the North East and North West.
Table 4.1: Turnover by Region Primary Secondary Region
2002 2003 2004 2002 2003 2004 North East 10.9 9.0 6.7 9.5 14.1 10.5 North West 12.0 10.3 12.1 10.1 10.1 9.8 Yorks & Humber 12.5 13.2 13.3 13.6 11.8 12.1 East Midlands 14.7 12.2 16.2 11.0 12.1 11.7 West Midlands 11.4 13.1 12.5 12.5 11.6 11.4 East of England 18.5 17.9 16.0 14.9 13.2 12.7 Inner London 19.2 14.7 23.4 17.5 13.3 15.9 Outer London 20.4 17.1 19.0 15.4 14.4 14.4 South East 19.0 15.8 16.5 14.2 14.7 15.3 South West 15.1 11.4 13.8 13.1 14.7 13.7
Total 15.3 13.6 14.7 13.1 12.8 12.5
24
4.4 There is a greater range in the primary phase. In 2004 turnover in Inner London (highest) in primary schools was more than three times that in the North East (lowest) whereas for secondary schools it was just half as much again as in the North West (lowest) and North East (second lowest). Overall turnover tends to be higher in the primary than the secondary phase and this also applies to most of the regions, though because of the greater variation in the primary phase it is not always the case. In both 2003 and 2004, there was, for example lower turnover in the primary than the secondary phase in the North East.
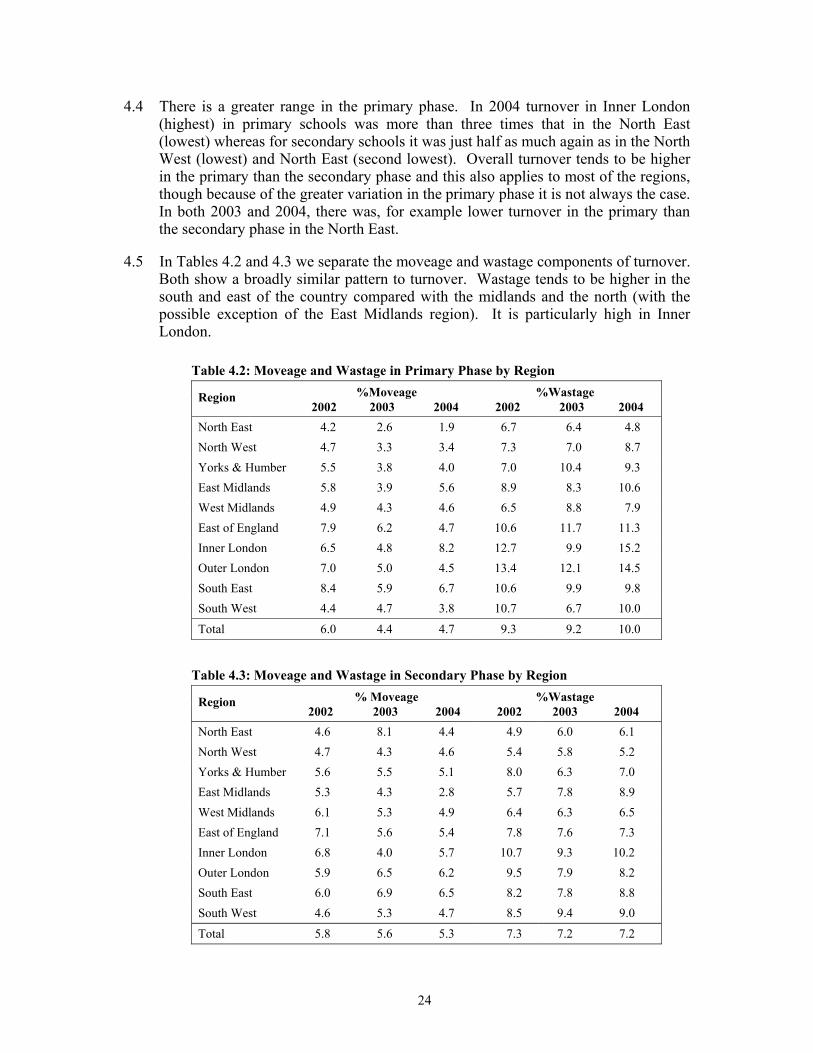
4.5 In Tables 4.2 and 4.3 we separate the moveage and wastage components of turnover. Both show a broadly similar pattern to turnover. Wastage tends to be higher in the south and east of the country compared with the midlands and the north (with the possible exception of the East Midlands region). It is particularly high in Inner London.
Table 4.2: Moveage and Wastage in Primary Phase by Region %Moveage %Wastage Region
2002 2003 2004 2002 2003 2004 North East 4.2 2.6 1.9 6.7 6.4 4.8 North West 4.7 3.3 3.4 7.3 7.0 8.7 Yorks & Humber 5.5 3.8 4.0 7.0 10.4 9.3 East Midlands 5.8 3.9 5.6 8.9 8.3 10.6 West Midlands 4.9 4.3 4.6 6.5 8.8 7.9 East of England 7.9 6.2 4.7 10.6 11.7 11.3 Inner London 6.5 4.8 8.2 12.7 9.9 15.2 Outer London 7.0 5.0 4.5 13.4 12.1 14.5 South East 8.4 5.9 6.7 10.6 9.9 9.8 South West 4.4 4.7 3.8 10.7 6.7 10.0
Total 6.0 4.4 4.7 9.3 9.2 10.0
Table 4.3: Moveage and Wastage in Secondary Phase by Region % Moveage %Wastage Region
2002 2003 2004 2002 2003 2004 North East 4.6 8.1 4.4 4.9 6.0 6.1 North West 4.7 4.3 4.6 5.4 5.8 5.2 Yorks & Humber 5.6 5.5 5.1 8.0 6.3 7.0 East Midlands 5.3 4.3 2.8 5.7 7.8 8.9 West Midlands 6.1 5.3 4.9 6.4 6.3 6.5 East of England 7.1 5.6 5.4 7.8 7.6 7.3 Inner London 6.8 4.0 5.7 10.7 9.3 10.2 Outer London 5.9 6.5 6.2 9.5 7.9 8.2 South East 6.0 6.9 6.5 8.2 7.8 8.8 South West 4.6 5.3 4.7 8.5 9.4 9.0
Total 5.8 5.6 5.3 7.3 7.2 7.2
25
4.6 Moveage takes the same form. In London and the South East teachers are not only more likely to leave the profession, but also to change schools compared with other regions. In the North East and North West both moveage and wastage tend to be below the average. But moveage and wastage do not always correspond. In the South West wastage tends to be about or above average, while moveage tends to be below. We have shown (Smithers and Robinson, 2004a) that the differences in moveage with region are likely to be associated with the age profiles of the teachers (since retirers are likely to be leavers not movers) and the cost of housing (movement away from London and South East to teaching posts in other parts of the country).
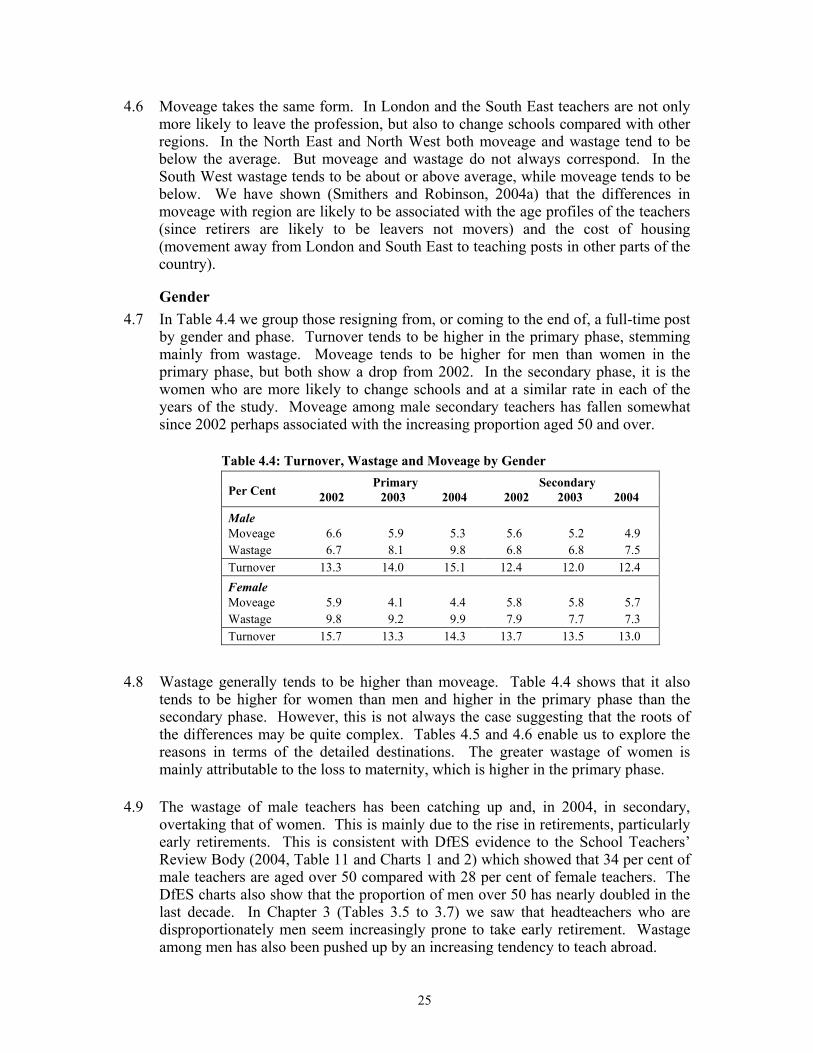
Gender 4.7 In Table 4.4 we group those resigning from, or coming to the end of, a full-time post
by gender and phase. Turnover tends to be higher in the primary phase, stemming mainly from wastage. Moveage tends to be higher for men than women in the primary phase, but both show a drop from 2002. In the secondary phase, it is the women who are more likely to change schools and at a similar rate in each of the years of the study. Moveage among male secondary teachers has fallen somewhat since 2002 perhaps associated with the increasing proportion aged 50 and over.
Table 4.4: Turnover, Wastage and Moveage by Gender Primary Secondary
Per Cent 2002 2003 2004 2002 2003 2004
Male Moveage 6.6 5.9 5.3 5.6 5.2 4.9 Wastage 6.7 8.1 9.8 6.8 6.8 7.5 Turnover 13.3 14.0 15.1 12.4 12.0 12.4 Female Moveage 5.9 4.1 4.4 5.8 5.8 5.7 Wastage 9.8 9.2 9.9 7.9 7.7 7.3 Turnover 15.7 13.3 14.3 13.7 13.5 13.0
4.8 Wastage generally tends to be higher than moveage. Table 4.4 shows that it also tends to be higher for women than men and higher in the primary phase than the secondary phase. However, this is not always the case suggesting that the roots of the differences may be quite complex. Tables 4.5 and 4.6 enable us to explore the reasons in terms of the detailed destinations. The greater wastage of women is mainly attributable to the loss to maternity, which is higher in the primary phase.
4.9 The wastage of male teachers has been catching up and, in 2004, in secondary, overtaking that of women. This is mainly due to the rise in retirements, particularly early retirements. This is consistent with DfES evidence to the School Teachers’ Review Body (2004, Table 11 and Charts 1 and 2) which showed that 34 per cent of male teachers are aged over 50 compared with 28 per cent of female teachers. The DfES charts also show that the proportion of men over 50 has nearly doubled in the last decade. In Chapter 3 (Tables 3.5 to 3.7) we saw that headteachers who are disproportionately men seem increasingly prone to take early retirement. Wastage among men has also been pushed up by an increasing tendency to teach abroad.
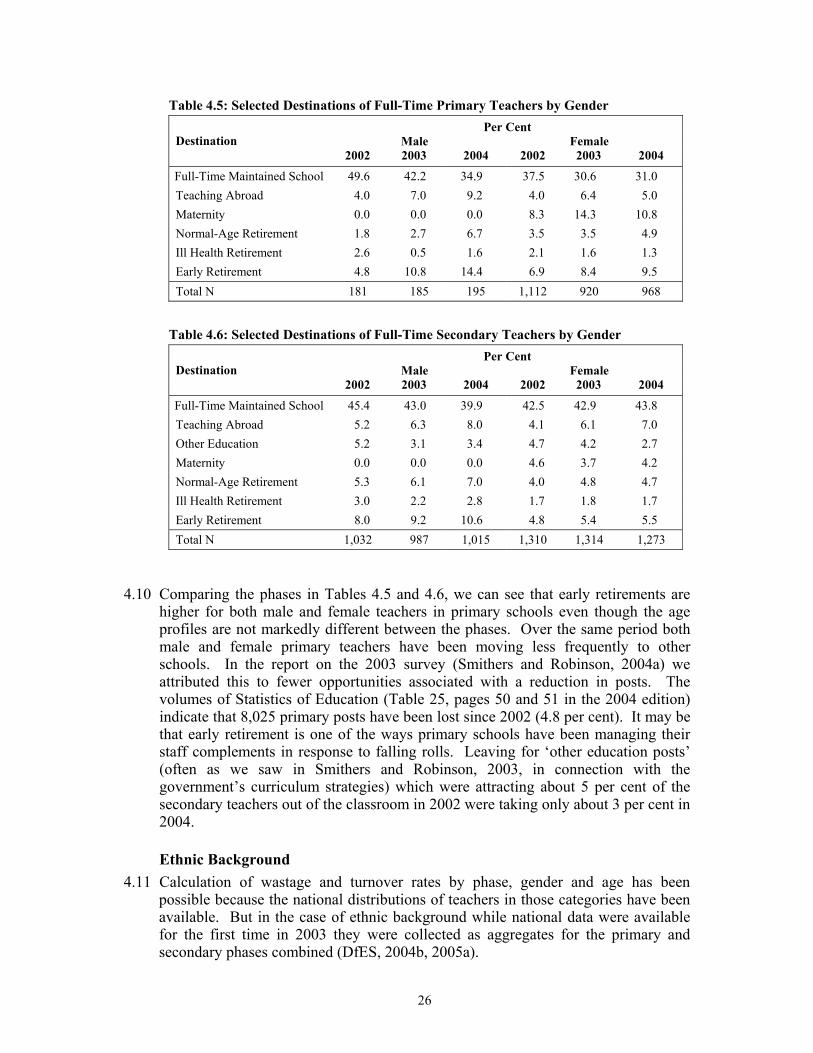
26
Table 4.5: Selected Destinations of Full-Time Primary Teachers by Gender Per Cent
Male Female Destination 2002 2003 2004 2002 2003 2004
Full-Time Maintained School 49.6 42.2 34.9 37.5 30.6 31.0 Teaching Abroad 4.0 7.0 9.2 4.0 6.4 5.0 Maternity 0.0 0.0 0.0 8.3 14.3 10.8 Normal-Age Retirement 1.8 2.7 6.7 3.5 3.5 4.9 Ill Health Retirement 2.6 0.5 1.6 2.1 1.6 1.3 Early Retirement 4.8 10.8 14.4 6.9 8.4 9.5 Total N 181 185 195 1,112 920 968
Table 4.6: Selected Destinations of Full-Time Secondary Teachers by Gender Per Cent
Male Female Destination 2002 2003 2004 2002 2003 2004
Full-Time Maintained School 45.4 43.0 39.9 42.5 42.9 43.8 Teaching Abroad 5.2 6.3 8.0 4.1 6.1 7.0 Other Education 5.2 3.1 3.4 4.7 4.2 2.7 Maternity 0.0 0.0 0.0 4.6 3.7 4.2 Normal-Age Retirement 5.3 6.1 7.0 4.0 4.8 4.7 Ill Health Retirement 3.0 2.2 2.8 1.7 1.8 1.7 Early Retirement 8.0 9.2 10.6 4.8 5.4 5.5 Total N 1,032 987 1,015 1,310 1,314 1,273
4.10 Comparing the phases in Tables 4.5 and 4.6, we can see that early retirements are higher for both male and female teachers in primary schools even though the age profiles are not markedly different between the phases. Over the same period both male and female primary teachers have been moving less frequently to other schools. In the report on the 2003 survey (Smithers and Robinson, 2004a) we attributed this to fewer opportunities associated with a reduction in posts. The volumes of Statistics of Education (Table 25, pages 50 and 51 in the 2004 edition) indicate that 8,025 primary posts have been lost since 2002 (4.8 per cent). It may be that early retirement is one of the ways primary schools have been managing their staff complements in response to falling rolls. Leaving for ‘other education posts’ (often as we saw in Smithers and Robinson, 2003, in connection with the government’s curriculum strategies) which were attracting about 5 per cent of the secondary teachers out of the classroom in 2002 were taking only about 3 per cent in 2004.
Ethnic Background 4.11 Calculation of wastage and turnover rates by phase, gender and age has been
possible because the national distributions of teachers in those categories have been available. But in the case of ethnic background while national data were available for the first time in 2003 they were collected as aggregates for the primary and secondary phases combined (DfES, 2004b, 2005a).
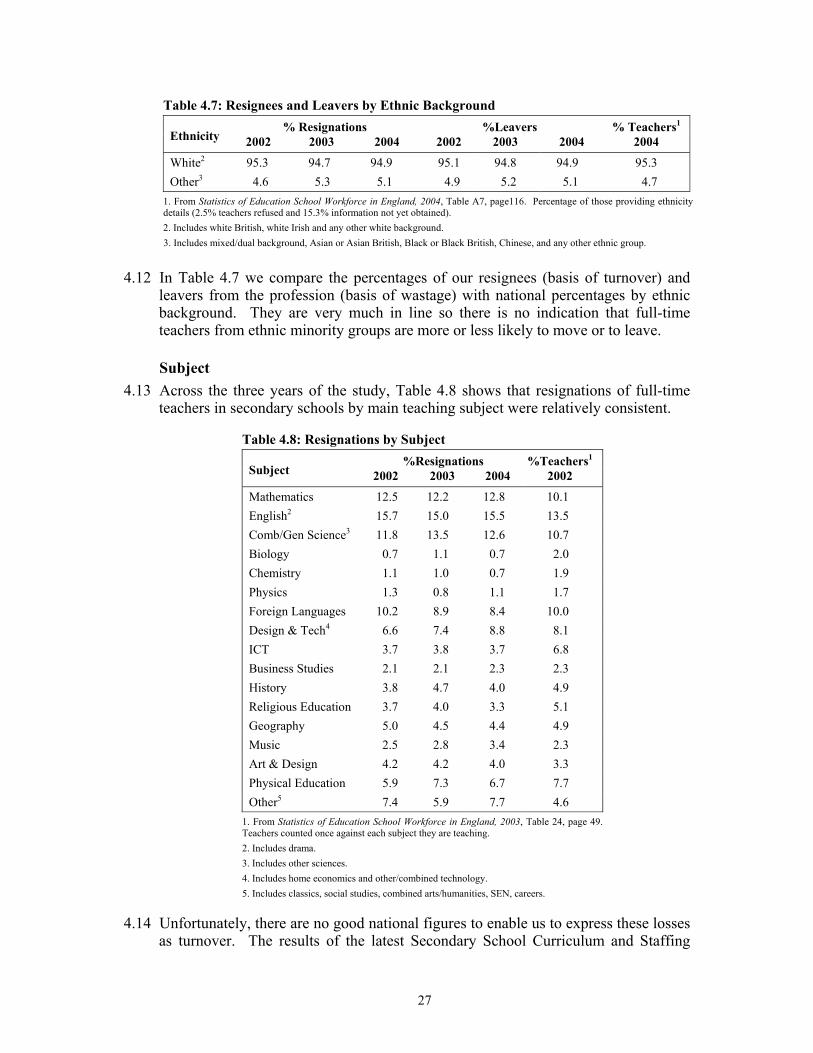
27
Table 4.7: Resignees and Leavers by Ethnic Background % Resignations %Leavers % Teachers1
Ethnicity 2002 2003 2004 2002 2003 2004 2004
White2 95.3 94.7 94.9 95.1 94.8 94.9 95.3 Other3 4.6 5.3 5.1 4.9 5.2 5.1 4.7
1. From Statistics of Education School Workforce in England, 2004, Table A7, page116. Percentage of those providing ethnicity details (2.5% teachers refused and 15.3% information not yet obtained). 2. Includes white British, white Irish and any other white background. 3. Includes mixed/dual background, Asian or Asian British, Black or Black British, Chinese, and any other ethnic group.
4.12 In Table 4.7 we compare the percentages of our resignees (basis of turnover) and leavers from the profession (basis of wastage) with national percentages by ethnic background. They are very much in line so there is no indication that full-time teachers from ethnic minority groups are more or less likely to move or to leave.
Subject 4.13 Across the three years of the study, Table 4.8 shows that resignations of full-time
teachers in secondary schools by main teaching subject were relatively consistent.
Table 4.8: Resignations by Subject %Resignations %Teachers1
Subject 2002 2003 2004 2002
Mathematics 12.5 12.2 12.8 10.1 English2 15.7 15.0 15.5 13.5 Comb/Gen Science3 11.8 13.5 12.6 10.7 Biology 0.7 1.1 0.7 2.0 Chemistry 1.1 1.0 0.7 1.9 Physics 1.3 0.8 1.1 1.7 Foreign Languages 10.2 8.9 8.4 10.0 Design & Tech4 6.6 7.4 8.8 8.1 ICT 3.7 3.8 3.7 6.8 Business Studies 2.1 2.1 2.3 2.3 History 3.8 4.7 4.0 4.9 Religious Education 3.7 4.0 3.3 5.1 Geography 5.0 4.5 4.4 4.9 Music 2.5 2.8 3.4 2.3 Art & Design 4.2 4.2 4.0 3.3 Physical Education 5.9 7.3 6.7 7.7 Other5 7.4 5.9 7.7 4.6
1. From Statistics of Education School Workforce in England, 2003, Table 24, page 49. Teachers counted once against each subject they are teaching. 2. Includes drama. 3. Includes other sciences. 4. Includes home economics and other/combined technology. 5. Includes classics, social studies, combined arts/humanities, SEN, careers.
4.14 Unfortunately, there are no good national figures to enable us to express these losses as turnover. The results of the latest Secondary School Curriculum and Staffing
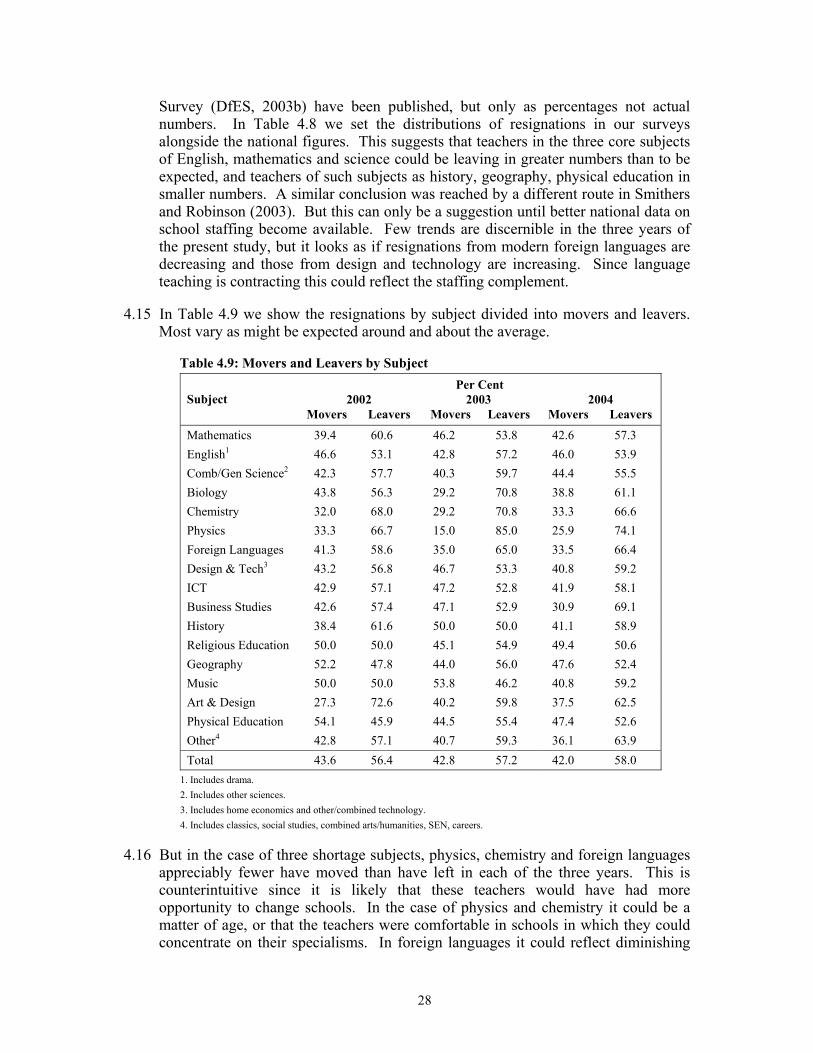
28
Survey (DfES, 2003b) have been published, but only as percentages not actual numbers. In Table 4.8 we set the distributions of resignations in our surveys alongside the national figures. This suggests that teachers in the three core subjects of English, mathematics and science could be leaving in greater numbers than to be expected, and teachers of such subjects as history, geography, physical education in smaller numbers. A similar conclusion was reached by a different route in Smithers and Robinson (2003). But this can only be a suggestion until better national data on school staffing become available. Few trends are discernible in the three years of the present study, but it looks as if resignations from modern foreign languages are decreasing and those from design and technology are increasing. Since language teaching is contracting this could reflect the staffing complement.
4.15 In Table 4.9 we show the resignations by subject divided into movers and leavers. Most vary as might be expected around and about the average.
Table 4.9: Movers and Leavers by Subject Per Cent
2002 2003 2004 Subject Movers Leavers Movers Leavers Movers Leavers
Mathematics 39.4 60.6 46.2 53.8 42.6 57.3 English1 46.6 53.1 42.8 57.2 46.0 53.9 Comb/Gen Science2 42.3 57.7 40.3 59.7 44.4 55.5 Biology 43.8 56.3 29.2 70.8 38.8 61.1 Chemistry 32.0 68.0 29.2 70.8 33.3 66.6 Physics 33.3 66.7 15.0 85.0 25.9 74.1 Foreign Languages 41.3 58.6 35.0 65.0 33.5 66.4 Design & Tech3 43.2 56.8 46.7 53.3 40.8 59.2 ICT 42.9 57.1 47.2 52.8 41.9 58.1 Business Studies 42.6 57.4 47.1 52.9 30.9 69.1 History 38.4 61.6 50.0 50.0 41.1 58.9 Religious Education 50.0 50.0 45.1 54.9 49.4 50.6 Geography 52.2 47.8 44.0 56.0 47.6 52.4 Music 50.0 50.0 53.8 46.2 40.8 59.2 Art & Design 27.3 72.6 40.2 59.8 37.5 62.5 Physical Education 54.1 45.9 44.5 55.4 47.4 52.6 Other4 42.8 57.1 40.7 59.3 36.1 63.9 Total 43.6 56.4 42.8 57.2 42.0 58.0
1. Includes drama. 2. Includes other sciences. 3. Includes home economics and other/combined technology. 4. Includes classics, social studies, combined arts/humanities, SEN, careers.
4.16 But in the case of three shortage subjects, physics, chemistry and foreign languages appreciably fewer have moved than have left in each of the three years. This is counterintuitive since it is likely that these teachers would have had more opportunity to change schools. In the case of physics and chemistry it could be a matter of age, or that the teachers were comfortable in schools in which they could concentrate on their specialisms. In foreign languages it could reflect diminishing

29
requirement since schools have been taking advantage of the greater flexibility at Key Stage 4 to reduce the amount of language teaching in the curriculum.
4.17 Conversely, geography, PE and RE teachers moved more often than the average in each of the three years. Of the core subjects, English and Drama teachers seem to be the more mobile. It is difficult to be sure why there should be these differences without further research. Since relative mobilities will bear on planning decisions this should be undertaken.
Schools 4.18 In the 2003 survey teacher retention was found to vary with the pupil characteristics
of the school. In the secondary phase turnover, but not wastage, was found to be related to academic performance (inversely), eligibility for free school meals and non-statemented special needs. In the primary phase there was no clearly discernible pattern. The turnover and wastage figures for secondary schools were interpreted as showing that teachers in those with the more challenging pupils were more likely to leave to go to others, but not to quit the profession.
Table 4.9: Moves to Other Schools Per Cent Moving to Other Maintained Schools
Exams and Tests1 Free School Meals2 Special Needs3
2003 2004 2003 2004 2003 2004
Secondary4 More Challenged 7.0 6.6 7.8 6.3 7.4 6.2 Typical 5.8 4.9 5.6 5.6 5.5 5.1 Less Challenged 4.3 4.3 4.6 4.6 4.2 4.2
Primary5 More Challenged 4.4 4.9 4.6 6.3 4.8 6.0 Typical 4.5 4.9 4.2 3.6 4.6 4.8 Less Challenged 4.3 4.6 4.7 4.4 4.0 3.4
1. Key Stage 2 results for primary and GCSE results for secondary. 2. Eligibility for free school meals. 3. Non-statemented special needs. 4. Based on the GCSE results of 310 secondary schools; 28 schools in the sample are middle and for 3 the results
were not available. For free schools meal and special needs data were available for the whole sample of 341. 5. Key Stage 2 results for 648 schools. Sample includes 107 infant and 59 first schools. No results available for 74
schools. For free school meals and special needs the whole sample of 888 was used.
4.19 In 2004 we have examined movement between schools directly, through what we have been calling moveage. Table 4.9 shows the results alongside those from 2003 expressed in the same way. The patterns are similar, with the 2004 results confirming those of the previous year that the more challenged secondary schools are more likely to lose teachers to other schools. In addition, there are indications also that the primary schools with higher percentages of pupils eligible for free school meals and/or with non-statemented special needs could be more vulnerable to moveage.
30
Resumé 4.20 Confirming the results from the 2002 and 2003 surveys, turnover and wastage rates
in 2004 were again found to be higher in the primary than the secondary phase, with similar regional variation. But through the introduction of the construct of ‘moveage’ we have also been able to show that not only were turnover and wastage higher in London, the East and South East, but teachers from these regions were more likely to move to other schools. Moveage did not always vary with wastage, however, since in the secondary phase in the South West it tended to be low while wastage was high.
4.21 Turnover tends to be higher in the primary than the secondary phase, as a result of a higher wastage rate. The higher wastage of female teachers in primary schools is mainly attributable to maternity and that of male primary teachers to early retirement. Curiously, retirements for both genders were higher in primary than secondary schools even though the age profiles in the two phases were not very different.
4.22 As in 2002 and 2003 no evidence was found that full-time ethnic minority teachers are more likely to change schools or leave the profession. Differences were found with subject. Resignations of physics, chemistry and modern language teachers tended to be to leave the profession and of geography, PE and RE teachers to move between schools.
4.23 The important finding from 2003 that secondary schools with the more challenged pupils in terms of ability, social background and special needs were more likely to lose teachers to other schools was confirmed. There were also signs in 2004 that primary schools with the highest proportions of children eligible for free school meals and/or with special needs (without statements) are losing teachers to other schools.
31
5. Case Studies of Contrasting Turnover 5.1 National averages for turnover, moveage and wastage as in Chapters 2 and 4 enable
us to see the broad picture for maintained schools as a whole, but tell us little about what is happening in individual schools. To learn more, case studies have been conducted of eight pairs of schools with contrasting turnover. The pairs chosen were identified from a listing of sample schools ranked by aggregate turnover for the three years 2002-04. Schools at the top of the ranking were then matched, as far as possible, with those at the bottom for local authority, size and eligibility for free school meals. Of eight pairs, four were primary and four secondary and for each phase there were two pairs with high eligibility for free school meals and two pairs with low.
5.2 Each of the sixteen case studies is based on an extended interview with the headteacher or in one case the acting headteacher. The interview concentrated on three main topics: teacher resignations and destinations in 2002-2004, teacher recruitment over the same period, and management of the staff profile. Relevant aspects of the school’s organisation and management such as, in secondary schools, the policy on discipline and, in primary, the deployment of teaching assistants were also explored. The interviews were taped and transcribed. Full details of the methods used are given in Appendix A.
Secondary Schools 5.3 We begin with analysis of the eight secondary schools drawing out themes from the
first pair, pen portraits of which appear in Boxes 5.1 and 5.2. We then test out and develop these themes in relation to the other three pairs, the pen portraits of which are given in Appendix C. The case studies of four pairs of primary schools are treated similarly and discussed later in the chapter with the full set of pen portraits appearing in Appendix D.
Exemplar Secondary Pair: North West 5.4 Box 5.1 describes a high turnover school in the North West (referred to as SA) and
Box 5.2 the low turnover school that was paired with it (SB). Both have a high percentage of pupils eligible for free school meals, 41 per cent and 33 per cent respectively, considerably above the national average of 14 per cent, and both are located in inner city areas.
5.5 School SA has a legacy of high turnover, low staff morale, limited aspirations, low achievement and poor discipline. The arrival of a new headteacher four years ago has had an impact. Turnover is still relatively high, but not as high as it was, recruitment difficulties are easing, staff morale has recovered, performance at GCSE has improved dramatically and an effective policy on discipline is being developed. These improvements stem from the implementation of a whole school strategy focusing on teaching and learning:
“When I first came here morale was rock-bottom. Everybody was miserable, just 15 per cent at GCSE. The key was I made people accountable. I sat with every teacher and set a target for every child - a breakdown of every child, every group, every target and every deviation from the target. Our policy is to concentrate on rewards and also on
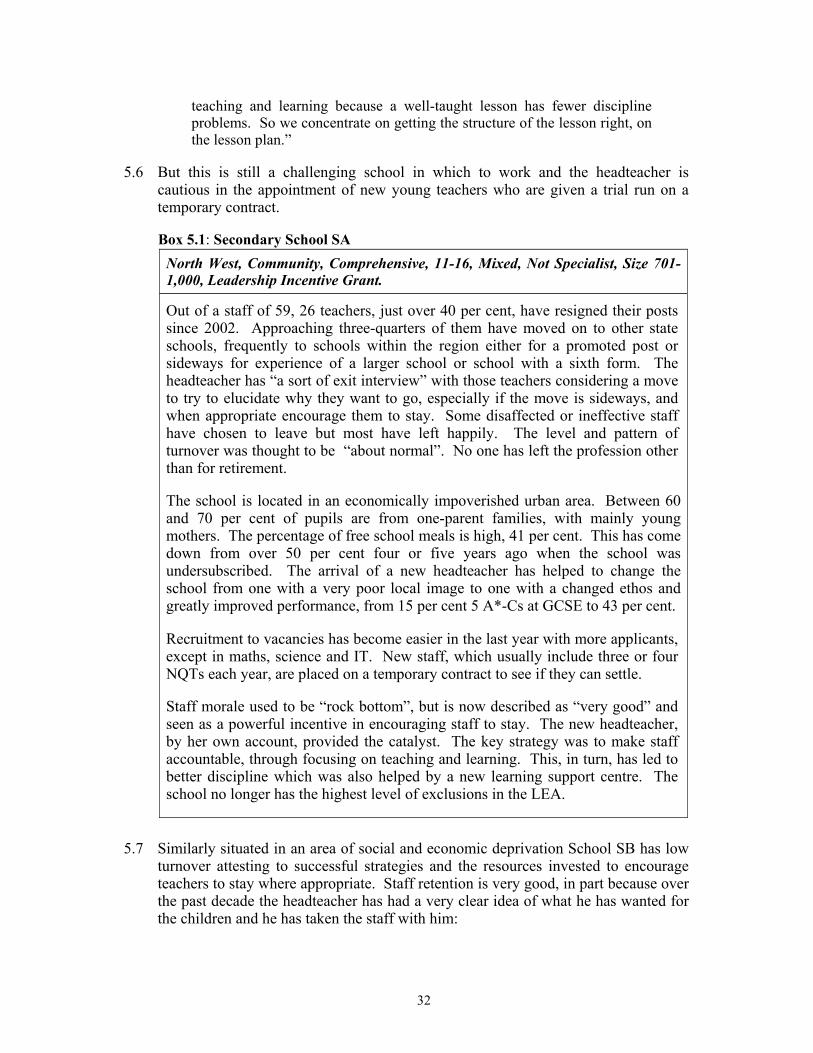
32
teaching and learning because a well-taught lesson has fewer discipline problems. So we concentrate on getting the structure of the lesson right, on the lesson plan.”
5.6 But this is still a challenging school in which to work and the headteacher is cautious in the appointment of new young teachers who are given a trial run on a temporary contract.
Box 5.1: Secondary School SA North West, Community, Comprehensive, 11-16, Mixed, Not Specialist, Size 701-1,000, Leadership Incentive Grant.
Out of a staff of 59, 26 teachers, just over 40 per cent, have resigned their posts since 2002. Approaching three-quarters of them have moved on to other state schools, frequently to schools within the region either for a promoted post or sideways for experience of a larger school or school with a sixth form. The headteacher has “a sort of exit interview” with those teachers considering a move to try to elucidate why they want to go, especially if the move is sideways, and when appropriate encourage them to stay. Some disaffected or ineffective staff have chosen to leave but most have left happily. The level and pattern of turnover was thought to be “about normal”. No one has left the profession other than for retirement.
The school is located in an economically impoverished urban area. Between 60 and 70 per cent of pupils are from one-parent families, with mainly young mothers. The percentage of free school meals is high, 41 per cent. This has come down from over 50 per cent four or five years ago when the school was undersubscribed. The arrival of a new headteacher has helped to change the school from one with a very poor local image to one with a changed ethos and greatly improved performance, from 15 per cent 5 A*-Cs at GCSE to 43 per cent.
Recruitment to vacancies has become easier in the last year with more applicants, except in maths, science and IT. New staff, which usually include three or four NQTs each year, are placed on a temporary contract to see if they can settle.
Staff morale used to be “rock bottom”, but is now described as “very good” and seen as a powerful incentive in encouraging staff to stay. The new headteacher, by her own account, provided the catalyst. The key strategy was to make staff accountable, through focusing on teaching and learning. This, in turn, has led to better discipline which was also helped by a new learning support centre. The school no longer has the highest level of exclusions in the LEA.
5.7 Similarly situated in an area of social and economic deprivation School SB has low turnover attesting to successful strategies and the resources invested to encourage teachers to stay where appropriate. Staff retention is very good, in part because over the past decade the headteacher has had a very clear idea of what he has wanted for the children and he has taken the staff with him:
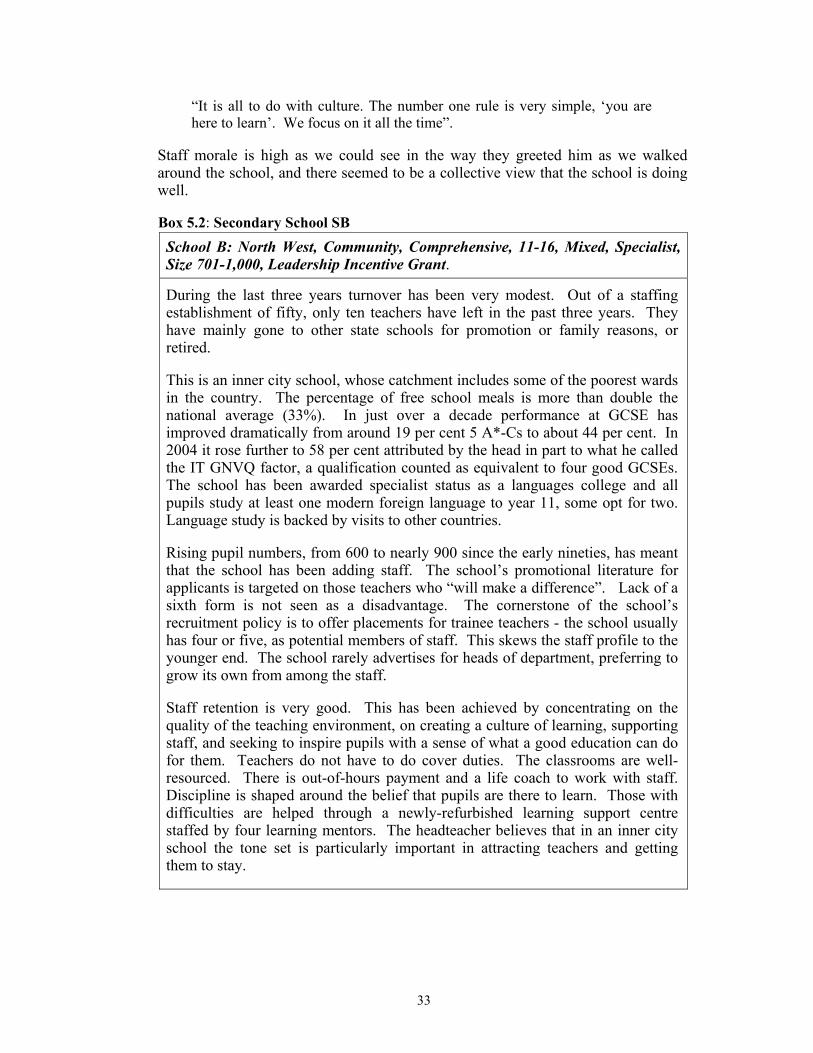
33
“It is all to do with culture. The number one rule is very simple, ‘you are here to learn’. We focus on it all the time”.
Staff morale is high as we could see in the way they greeted him as we walked around the school, and there seemed to be a collective view that the school is doing well.
Box 5.2: Secondary School SB School B: North West, Community, Comprehensive, 11-16, Mixed, Specialist, Size 701-1,000, Leadership Incentive Grant.
During the last three years turnover has been very modest. Out of a staffing establishment of fifty, only ten teachers have left in the past three years. They have mainly gone to other state schools for promotion or family reasons, or retired.
This is an inner city school, whose catchment includes some of the poorest wards in the country. The percentage of free school meals is more than double the national average (33%). In just over a decade performance at GCSE has improved dramatically from around 19 per cent 5 A*-Cs to about 44 per cent. In 2004 it rose further to 58 per cent attributed by the head in part to what he called the IT GNVQ factor, a qualification counted as equivalent to four good GCSEs. The school has been awarded specialist status as a languages college and all pupils study at least one modern foreign language to year 11, some opt for two. Language study is backed by visits to other countries.
Rising pupil numbers, from 600 to nearly 900 since the early nineties, has meant that the school has been adding staff. The school’s promotional literature for applicants is targeted on those teachers who “will make a difference”. Lack of a sixth form is not seen as a disadvantage. The cornerstone of the school’s recruitment policy is to offer placements for trainee teachers - the school usually has four or five, as potential members of staff. This skews the staff profile to the younger end. The school rarely advertises for heads of department, preferring to grow its own from among the staff.
Staff retention is very good. This has been achieved by concentrating on the quality of the teaching environment, on creating a culture of learning, supporting staff, and seeking to inspire pupils with a sense of what a good education can do for them. Teachers do not have to do cover duties. The classrooms are well-resourced. There is out-of-hours payment and a life coach to work with staff. Discipline is shaped around the belief that pupils are there to learn. Those with difficulties are helped through a newly-refurbished learning support centre staffed by four learning mentors. The headteacher believes that in an inner city school the tone set is particularly important in attracting teachers and getting them to stay.
34
5.8 A second theme to emerge from the two exemplar schools is the importance of time and money invested in improving the conditions of service of the teachers, such as secure non-contact time and making sure the classrooms are pleasant to work in:
“The other thing is teachers have never done cover since day one. It is all about giving staff a vision about what it can be and staff who want to make a difference to children’s lives. It sounds trite. So no cover. When you have a free period you are free you don’t want to be stuck in a technology class trying to cope with somebody else’s work sheet. But it is also about the quality of the teaching environment so teachers don’t want to leave.”
5.9 Thirdly, our low turnover exemplar school, School SB, believes that having a clear recruitment policy has helped in the management of turnover. Participation in teacher training yields a reservoir of future applicants and appointments. The appointment of newly-trained teachers skews the age profile to the younger end. Young teachers tend to want to move on after two or three years in post. To counteract this potential instability young staff are ‘groomed’ for promoted posts within the school. The school very rarely has to advertise head of department posts. The school is authentically presented to potential applicants for posts to screen out those who might not be able to cope.
“We hardly ever advertise for heads of department, we home grow them. A bit like M&S before they lost the plot. I don’t read educational literature; I read management books. I read stories about people. The Ofsted inspectors said our teaching is good, our achievement is very good and we were creating a cultural shift in the local community. I had a wry smile at that one.”
5.10 Comparing SA and SB the main themes to emerge in the headteachers’ perceptions of what contributes to optimizing the turnover of teachers in schools were:
• leadership, especially establishing and implementing a clear sense of purpose;
• valuing teachers and ensuring as far as possible that they have good conditions in which to work;
• an appointments strategy.
We explore these themes in more detail in our other three pairs of secondary schools, and also see how far they apply in primary schools. The pen portraits of the secondary schools referred to are given in Appendix C.
Second Secondary Pair: South East 5.11 Schools SA and SB were located in areas of severe deprivation in the North West.
Schools SC and SD are located in relatively affluent areas of the South East. Unlike Schools SA and SB both have low percentages of pupils eligible for free school meals. In School SC turnover is high. This was attributed by the headteacher, in part, to the poor image of the town, and the cost of housing. The school finds it difficult to recruit. It can be Hobson’s choice, appointing young recruits who move away from the area after two or three years. As in School SB, much effort is spent on nurturing staff, such as in the skilful use of responsibility points and
35
opportunities for professional development and young staff are trained up to head of department roles. Likewise participation in teacher training is also a source of recruitment.
“I spend a large part of my time recruiting, marketing and also nurturing staff that we’ve got and being imaginative in putting staff in the right places. I think about the actual skills of the people I have and how I can best use them, so we are developing our young staff.”
5.12 But the strategy seems to be less successful than in School SB although a lot of energy goes into it, and money is spent on, recruitment and marketing. Turnover remains stubbornly high and this is put down by the headteacher to external factors. But, in our view, School SC’s sense of purpose was not as strongly evident as that of School SB. It has, however, recently acquired specialist business and enterprise status which it hopes will strengthen its ethos and bring in extra money.
5.13 At the other end of the county, School SD has had low turnover over the past three years. Unlike School SC it is in an attractive area near the coast. But there are also internal factors. The headteacher provides a strong sense of direction. He takes the view that the school must keep moving forward to provide new challenges and opportunities for staff. It is a large school with a sixth form and leadership roles are devolved to teams who feel they have ownership of what they do. Care is taken to make sure teachers are provided with adequate resources to do the job and they have good working conditions. The school has specialist status which the headteacher believes has encouraged more applicants for vacancies which, in turn, has given the school more control over who is appointed.
“I think oddly enough its very simply making sure that teachers have got the right resources. I think it is also very important that the staff know they are valued. Staff can feel isolated. They may have a difficult child or children to deal with. It is demeaning to call somebody into the classroom so we have a system if somebody is misbehaving to send them to reception, where a member of the senior staff will deal with them. It gives them a sensible interpretation of their working lives.”
Third Secondary Pair: East Midlands 5.14 As in Schools SC and SD in the South East, Schools SE and SF in the East Midlands
have low percentages of pupils eligible for free school meals. In School SE turnover is high, higher than School SA located in a deprived urban area in the North West and approaching the level of School SC at the ‘wrong end’ of the county in our second pair. It is nevertheless a popular, oversubscribed school with an expanding sixth-form. Its intake from a wide rural area is of above average ability.
5.15 The headteacher attributed its high turnover in large part to the youthfulness of the staff. Like Schools SB and SC, it has a strategy to seek to minimise unnecessary turnover. This includes giving teachers the opportunity to bid for research points and to participate in professional development activities within the local cluster group of schools. It has been found though that this in itself may prompt teachers to seek promotion outside the school. As a counterbalance young teachers are promoted internally and given support to enable them in time to move into whole
36
school management roles. Staff thinking of leaving, as in School SA, are offered an exit interview to see if there are problems which can be resolved relatively easily.
5.16 There is also a recruitment strategy which relies, as in some of our other case study schools, on close links with teacher training through, in this case, the local SCITT partnership, the HE-led PGCE and the GTP.
“We have loads of students. It is part of our recruitment and retention strategy. We are a member of the local partnership for SCITT students and we have appointed at least eight in the last few years. Three of our business studies staff came here as SCITT students. Two of them have stayed and have had promotions. We still have two in English and another one in Science.”
5.17 On the face of it School SF, the second member of our pair in the East Midlands, could be expected to have a high turnover. It is a neighbourhood comprehensive serving three large but mixed estates on the edge of a town known for its tough environment and its intake is skewed to the lower end of the ability range through skimming by other schools. But remarkably it has below average turnover.
5.18 The key seems to be making careful appointments (in spite of struggling to recruit) and then working with the staff so they want to stay. The headteacher has pursued a clear strategy of forging sound relationships with the staff and between staff and pupils. Very much as in School SB, resources are targeted with these aims in mind. In School SF as in SB staff do not do cover. With the exception of some new build - a new staff room and a new sixth form centre - money is spent to bring in supply cover at the expense of maintenance and refurbishment of the buildings. There is more non-contact time than in most schools. The staff are supported in their teaching by a very strong pastoral system.
“It is not the buildings which make what I consider to be a good school; it is actually what goes on inside. Some of my classrooms are horrible. But we put the money into supporting staff. My vice-chair of governors is HR director for a large company and I gave him the staff absence figures. He thought I was fiddling them. We have a phenomenal presence rate, not absence rate. In human terms, it is a nice place to work and I do think we invest a lot of time and money in the pastoral system. We spend a lot of money on supply and that keeps morale up”.
5.19 In a difficult recruitment situation applicants are carefully sifted.
“If somebody phones up and ask for details of vacancies I tend to put that back to them and say ‘why don’t you come and have a look round?’ I know what I am looking for and I know what kind of person I can work with. Its not the easiest place to teach in - we have some tough characters here.”
The school has also chosen to fund GTP trainees out of its own resources. Very promising ITT trainees may be ‘captured’ and offered a post regardless of whether an immediate vacancy happened to be available.
37
Fourth Secondary Pair: Inner London 5.20 Our fourth pair of secondary schools is in Inner London. School SG is the
stereotypical inner city school. For the three years 2002-2004 resignations equalled teacher complement, a turnover of 100 per cent in the three-year period. We contrast it with School SH where resignations have fluctuated in recent years. In 2002 turnover peaked at 10 out of 42, as it did nationally, but since then only six teachers have left.
5.21 Both are small girls’ schools though School SH has a sixth-form. But the main difference between them is in their intakes. Over 60 per cent of the pupils in School SG come from one parent families, there is also an above average proportion of looked-after children, eligibility for free school meals is more than three times the national average and there is high family mobility. In contrast, although School SH takes the whole of the ability range through banding more than half its pupils are selected on faith grounds. It has a legacy of high achievement which is attractive to many parents. Eligibility for free school meals is below the national average.
5.22 The headteachers describe their pupils differently and to our eye accurately. For School SH:
“It’s a lovely mix. We have got something like 27 languages. There is a real social mix. Everything from rich middle class people with houses in France to kids who live in ghastly blocks of flats which stink of urine, where the lifts don’t work and there is graffiti all over the walls.”
But the headteacher of School SG with the rapid turnover commented that:
“It’s a very challenging school. I mean there are lots of wonderful students, but we are disadvantaged in terms of admissions and intake. It can mean very, very hard work facing the behavioural challenges. It takes a lot of energy and the children demand a lot of you. What we say to people is that whatever you give to the children they will give it right back to you so you know they recognise good teaching. Some NQTs get found out and there is some burnout which leads to them moving on.”
5.23 School SG finds it difficult to recruit and retain teachers.
“We had a crisis two or three years ago and had a lot of temporary staff because we did not know where else to turn. We actually had a drama teacher taking science at one point. This year I haven’t been able to get a good ICT teacher even with a management allowance.”
5.24 “Hanging on by my fingertips” was how the headteacher described it. As a result it has a polarised age profile. “At the upper end there are teachers who have been in the school for years and are now taking retirement. At the other are young members of staff who just want to get their NQT year and then move on.” As a girls’ school with a mainly female staff there is a high loss through maternity and family care. “You know you just think I’m never going to get out from under all the maternity leave. The local authority’s scheme is so generous I sometimes wonder whether intending mothers seek us out.” Both schools suffer from the London factor of teachers moving out of the capital when they want to settle down.
38
5.25 Both schools have also developed strong induction programmes. The headteacher of the challenged School SG said;
“We have an absolutely brilliant structure here. NQTs get very good departmental support. There is very good mentoring. We have NQT specialists. We have policies that work. We have a series of handbooks like the one on discipline. We actually use them.”
But the reliance on NQTs itself has tended to push up turnover levels. More recently, recruitment has been strengthened by participation in the ‘Teach First’ scheme and the Graduate Teacher Programme.
5.26 The headteacher of School SH has capitalised on its advantages to inculcate a strong code of behaviour, foster high aspirations backed by good organisation.
“There’s no excuse not to teach well here. It’s also the structure because a small school can also be out of control. I’m always on this hobby-horse. To me it is about discipline and organisation. You know the timetable works. Every thing is where it’s supposed to be. New staff come to me and say ‘ I can teach’ and I say ‘yes that’s what we are paying you for’.”
5.27 The headteacher of School SH is of long standing, and at School SG the present headteacher was appointed seven years ago to tackle the challenges. She has since been striving to put her own stamp on it. This has involved both increasing and reducing turnover. In an attempt to lower it she has put in place a strategy of combating internal weaknesses through good organisation with a clear policy focused on teaching and learning. Sometimes this can backfire as when an English teacher described as sparkling by Ofsted quit to become an actress. She told the headmistress:
“It was because of my assemblies when I kept telling everybody they should follow their star and realise their dream. So I rather acerbically retorted that ‘that was meant for the children’.”
5.28 But part of putting her own stamp on it has also meant supporting some teachers in their decisions to go.
“There was a science teacher who said she wanted to go at very short notice which caused all sorts of bother for us in the short-term, but it was just better for everybody in the long-term. There was also a person in their early fifties and it was a huge bonus to the school when that person decided to go. The staff view was that the person had been deliberately unpleasant to get early retirement. I have also had two staff leave through competency procedures.”
5.29 The London comparison has provided further evidence that leadership, staff support and being able to make good appointments are crucial to teacher retention, but it has also brought out the importance of internal factors such as the nature of the pupil intake and external factors such as the generosity of maternity schemes and the drift away from London. We now go on to explore whether the same themes emerge in the comparison of four pairs of primary schools.
39
Primary Schools 5.30 As with secondary schools, pen portraits of our exemplar primary pair, Schools P1
and P2, are presented in boxed format, in Boxes 5.3 and 5.4. The full set of eight primary schools is given in Appendix D.
Exemplar Primary Pair: East 5.31 Our exemplar pair has a low percentage of pupils eligible for free school meals, 6
per cent and 2 per cent respectively, well below the national average of 17 per cent. They are in a large county authority, both in urban settings but in different towns, one on the fringes and the other more centrally located. School P1 has strong competition from others in the town, but School P2 is very popular, especially but not exclusively among Roman Catholic parents. Both headteachers have been in post for 3-4 years, both are in their first headship and both were appointed from outside the school.
5.32 There seem to be two principal reasons why teachers have left School P1 in the three years covered by the study (which has broadly coincided with the arrival of the head). From the outset, the headteacher was determined to raise the school’s performance from adequate to good. In seeking to achieve this goal, she first made some significant changes to create the best possible match between the teachers’ strengths and the needs of the school. These included the introduction of a new, flatter, management structure.
“My predecessor’s style of management was ‘I’m the head and I’m telling you to do it so jump’. I came in and said the only way to do it is to build other people to be leaders, so we have altered the whole structure of our management team as part of the workforce re-modelling agenda. Rather than a senior team and a middle management team we have just one team. It’s all had a huge impact. It means younger staff are involved in additional training and in all the discussions about the school. It’s about distributive leadership and about driving the school forward.”
5.33 Generally this has been welcomed, but it hastened some early retirements and the resignation of one of the two teachers who left the profession.
“Why did this teacher leave? If I am honest it was because of me, our styles were very, very different.”
But, in supporting the staff, she also offered incentives to stay including rearranging duties, fresh challenges and modest financial rewards.
5.34 Secondly, as part of what she wanted to achieve in the school, the head has a strong belief that part of her role is to develop and encourage talent on the part of her staff. This is exemplified by appointing NQTs but being prepared to see them move on to either promotions or different experience after some three or four years. The head is well aware of the difficulties that exist in recruiting teachers from outside the area (mainly as the result of very high housing costs), but has not let this stand in the way of what she regarded as an appropriate appointments policy.
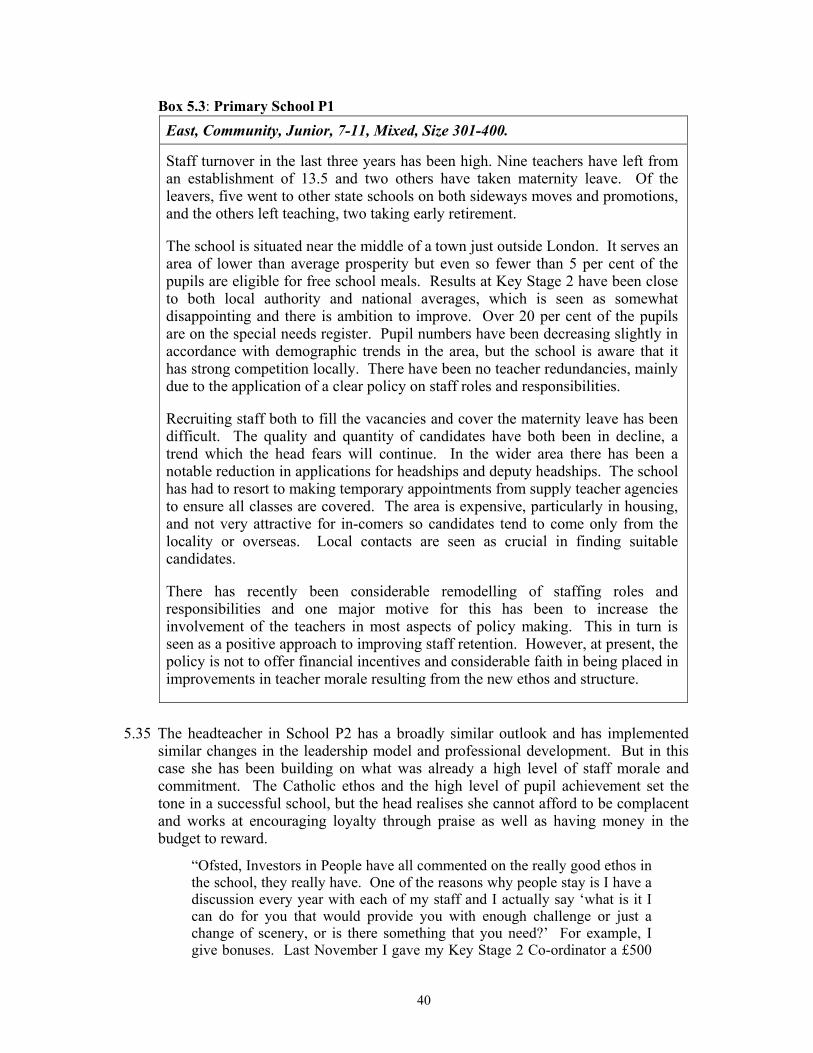
40
Box 5.3: Primary School P1 East, Community, Junior, 7-11, Mixed, Size 301-400.
Staff turnover in the last three years has been high. Nine teachers have left from an establishment of 13.5 and two others have taken maternity leave. Of the leavers, five went to other state schools on both sideways moves and promotions, and the others left teaching, two taking early retirement.
The school is situated near the middle of a town just outside London. It serves an area of lower than average prosperity but even so fewer than 5 per cent of the pupils are eligible for free school meals. Results at Key Stage 2 have been close to both local authority and national averages, which is seen as somewhat disappointing and there is ambition to improve. Over 20 per cent of the pupils are on the special needs register. Pupil numbers have been decreasing slightly in accordance with demographic trends in the area, but the school is aware that it has strong competition locally. There have been no teacher redundancies, mainly due to the application of a clear policy on staff roles and responsibilities.
Recruiting staff both to fill the vacancies and cover the maternity leave has been difficult. The quality and quantity of candidates have both been in decline, a trend which the head fears will continue. In the wider area there has been a notable reduction in applications for headships and deputy headships. The school has had to resort to making temporary appointments from supply teacher agencies to ensure all classes are covered. The area is expensive, particularly in housing, and not very attractive for in-comers so candidates tend to come only from the locality or overseas. Local contacts are seen as crucial in finding suitable candidates.
There has recently been considerable remodelling of staffing roles and responsibilities and one major motive for this has been to increase the involvement of the teachers in most aspects of policy making. This in turn is seen as a positive approach to improving staff retention. However, at present, the policy is not to offer financial incentives and considerable faith in being placed in improvements in teacher morale resulting from the new ethos and structure.
5.35 The headteacher in School P2 has a broadly similar outlook and has implemented similar changes in the leadership model and professional development. But in this case she has been building on what was already a high level of staff morale and commitment. The Catholic ethos and the high level of pupil achievement set the tone in a successful school, but the head realises she cannot afford to be complacent and works at encouraging loyalty through praise as well as having money in the budget to reward.
“Ofsted, Investors in People have all commented on the really good ethos in the school, they really have. One of the reasons why people stay is I have a discussion every year with each of my staff and I actually say ‘what is it I can do for you that would provide you with enough challenge or just a change of scenery, or is there something that you need?’ For example, I give bonuses. Last November I gave my Key Stage 2 Co-ordinator a £500
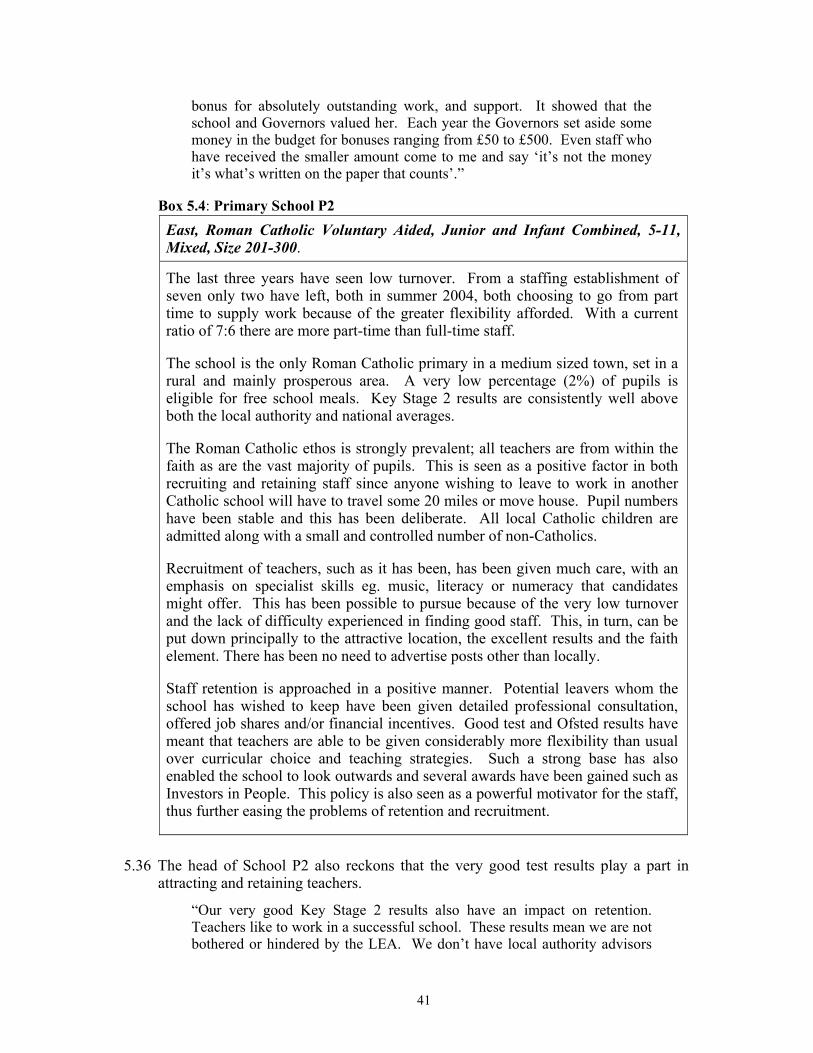
41
bonus for absolutely outstanding work, and support. It showed that the school and Governors valued her. Each year the Governors set aside some money in the budget for bonuses ranging from £50 to £500. Even staff who have received the smaller amount come to me and say ‘it’s not the money it’s what’s written on the paper that counts’.”
Box 5.4: Primary School P2 East, Roman Catholic Voluntary Aided, Junior and Infant Combined, 5-11, Mixed, Size 201-300.
The last three years have seen low turnover. From a staffing establishment of seven only two have left, both in summer 2004, both choosing to go from part time to supply work because of the greater flexibility afforded. With a current ratio of 7:6 there are more part-time than full-time staff.
The school is the only Roman Catholic primary in a medium sized town, set in a rural and mainly prosperous area. A very low percentage (2%) of pupils is eligible for free school meals. Key Stage 2 results are consistently well above both the local authority and national averages.
The Roman Catholic ethos is strongly prevalent; all teachers are from within the faith as are the vast majority of pupils. This is seen as a positive factor in both recruiting and retaining staff since anyone wishing to leave to work in another Catholic school will have to travel some 20 miles or move house. Pupil numbers have been stable and this has been deliberate. All local Catholic children are admitted along with a small and controlled number of non-Catholics.
Recruitment of teachers, such as it has been, has been given much care, with an emphasis on specialist skills eg. music, literacy or numeracy that candidates might offer. This has been possible to pursue because of the very low turnover and the lack of difficulty experienced in finding good staff. This, in turn, can be put down principally to the attractive location, the excellent results and the faith element. There has been no need to advertise posts other than locally.
Staff retention is approached in a positive manner. Potential leavers whom the school has wished to keep have been given detailed professional consultation, offered job shares and/or financial incentives. Good test and Ofsted results have meant that teachers are able to be given considerably more flexibility than usual over curricular choice and teaching strategies. Such a strong base has also enabled the school to look outwards and several awards have been gained such as Investors in People. This policy is also seen as a powerful motivator for the staff, thus further easing the problems of retention and recruitment.
5.36 The head of School P2 also reckons that the very good test results play a part in attracting and retaining teachers.
“Our very good Key Stage 2 results also have an impact on retention. Teachers like to work in a successful school. These results mean we are not bothered or hindered by the LEA. We don’t have local authority advisors
42
and inspectors telling us what to do so we do what we want to do and good teachers like that.”
The ethos of the school is also sustained by looking for a commitment to the Catholic faith when making appointments.
5.37 In both Schools P1 and P2 it is recognised that for the success of the school there is a fine line between encouraging teachers to stay or to go. The evidence in Boxes 5.3 and 5.4 suggests that individual teachers’ approaches to remaining or looking for a post elsewhere, as we saw with secondary schools, are strongly influenced by the same key factors. The first of these is whether the school is able to articulate a clear sense of purpose and direction. Secondly in implementing this vision much depends on how much the staff feel valued and part of a collective enterprise. The case studies suggest that a headteacher can keep together and develop the teaching team through being sensitive to the staff, skilful staff deployment including identifying good leaders, handling weaknesses well, appropriate use of incentives and offering access to professional development. The impact of the headteacher is potentially greater in primary schools which are generally smaller than secondary schools, since it will not be mediated through the levels of middle management.
5.38 Whereas in secondary schools appointing staff is a regular, almost routine aspect of management fewer teachers in the typical primary school usually means a less well-developed appointments strategy. However it is interesting to note that both Schools P1 and P2 have been drawn to making part-time and also fixed-term appointments to provide some useful flexibility.
5.39 In addition to the three main themes - leadership, support for teachers and an appointments strategy - our exemplar primary schools reveal that similar factors to those affecting retention in secondary schools are impacting on primary teacher retention, for example, location and the relative cost of housing. We now explore these further in our three other contrasting pairs of primary schools.
Second Primary Pair: South West 5.40 Schools P3 and P4 (see Appendix D for the pen portraits) share a rural setting in a
large county. Both occupy mainly old and difficult buildings and have very low free school meals entitlements. School P3’s intake is less affluent and the location less attractive than P4’s.
5.41 The headteacher of P3 has been conscious of the high turnover and the demands it has made on her.
“From my point of view in the last three years the school has had a number of staffing problems with staff resigning at the last minute. I don’t usually try to persuade people to stay. I take the view that if somebody actually wants to leave they’ve made up their mind and they are going to go. On the other side of the coin the town is not really attractive to young people it’s just little too far for travelling from the nearby cities.”
5.42 The headteacher of P3 has found both the number and quality of applicants disappointing so she has not always been happy with the appointments she has had to make. She also has had to spend much more time and effort than her counterpart
43
in School P4 inducting new appointees, mentoring NQTs and adjusting personnel and resources to requirements. Day-to-day management of this kind has taken a lot of her time and that of other senior staff in the school.
“The expectations of young teachers are that they are going to need and get a lot of support and you need to put your senior people into that support.”
5.43 In School P4, which serves a one-school village community, the stability has been remarkable. Nobody has even thought about leaving for several years.
“We are a small school on a poor site so we have worked tremendously hard to make ourselves into one unit and because we’ve had to work at it we’ve formed some sort of cohesion which wouldn’t necessarily be there if we hadn’t put that effort in.”
5.44 But the head has consciously adopted a strategy to keep people fresh and broaden their experience.
“I have moved people around for them to gain more experience. I have moved people’s classrooms and they haven’t necessarily agreed with the decision but I felt strongly that I have done it for the right reasons, which has always been that the children are at the top of the agenda. I have taken the staff along with me on this.”
Third Primary Pair: North West 5.45 In contrast to Schools P3 and P4, the school-pair P5 and P6 is sited in not very
affluent parts of a typical northern industrial town. Free meals run at 27 per cent and 21 per cent respectively. Both are Church of England foundations. The high turnover at School P5 includes several maternity leaves but nonetheless replacements, often on fixed term contracts, have had to be found and the remaining staff have had to provide a lot of support in easing in the newcomers.
5.46 It has been difficult to maintain consistency and provide opportunities for staff development.
“I do see part of my role is to develop staff so they can move up the ladder. But it is difficult to offer much in the way of professional development in a one-form entry school with falling rolls and a tight budget.”
5.47 In addition there are particular and potentially expensive problems with the buildings so the budgetary pressures are considerable and thus the resources available to reward staff and encourage good teachers to stay are less than ideal. As much as the head would have liked to have kept the staff together she also came up against the personal circumstances of staff.
“There was little point or relevance in taking steps to persuade him to stay. After about five years here he was absolutely ready to go.”
5.48 At School P6 the contrast is marked; no one has moved for 5-6 years. This stability and the open and frank management style of the head have created a strong team ethic and permitted investment in unusual levels of non-contact time and specialist teaching.
44
“The staff would say we are a very happy team. We rarely make a decision that isn’t shared, so in that sense there is collegiality. We all get on very well. It’s helped that our school has always been full, so financially we are very secure. That means we’ve got a lot of support staff. One of my priorities has been to make sure staff get time away from the children so non-contact time or PPA time as it is now called has been happening in my school for three years. I have also taken on part-timers just to do specialist teaching to take the stress off those teachers who would struggle with some subjects like music, RE and science.
“When my staff go on courses other teachers can’t believe what they get. It’s also about other little things. At Christmas I unofficially give them all a retail therapy day, which means I teach their class for half a day on top of their PPA time. Everybody gets it including the teaching assistants.”
5.49 The downside is that there has been no new blood.
“The staff are well balanced because we are well staffed and they have got clear demarcations as to who is doing what. But nobody has moved for promotion and that’s not healthy.”
There is a sense from these two schools of events becoming self-reinforcing: change fostering further change and stability becoming set.
Fourth Primary Pair: East Midlands 5.50 Located in ex-coalmining towns the pair P7 and P8 share many common features but
School P7 has a very poor intake, both materially and socially. The contrast is shown by free school meals rates of over 40 per cent and 11 per cent respectively. School P7 is a clear, perhaps radical example of a staff who – if they choose to stay - understand, accept and take professional pride in the School’s difficulties and therefore its unusual vision and purpose – and show that through their loyalty to the school. The apparent absence of a formal staff development programme belies the strength of a strong team spirit providing mutual support.
“This is an old building that’s unsuitable for a modern education with children who are mostly difficult. But we survive in an atmosphere of humour and camaraderie. It couldn’t be any other way. It could destroy you absolutely because it’s such a tough job here. Staff say to me ‘I will stay with you as long as I can because I won’t get treated any better anywhere else’, but I do like people to have ambition to move on.”
5.51 Those who have left either found the challenges too formidable, or have gained considerable professional expertise that they have taken elsewhere. The task of the head in relating strengths to needs has been fairly straightforward. He has known very clearly what he has been looking for in making appointments. His appointments strategy is well articulated:
“People here either don’t survive and I edge them out, which is about 50 per cent… or they come here and do a brilliant job and go on to better things, which is the other 50 per cent.”
45
5.52 At School P8 the only movement of staff recently has been for personal reasons. The sense of teamwork is strong, suggesting a well understood, shared and accepted vision. Evidence for this can be seen in the avoidance of redundancies through staff collaboration.
“We all work as a team. It’s hard to explain why it holds together. But I was showing an applicant round yesterday and she said ‘there’s a very pleasant atmosphere in your school. I have noticed it in the way the adults speak to one another’. This is very much a community as well. I know it sounds very cosy, cosy, but it is a very nice school to work in. Colleagues, who have friends in other schools, will often say they wouldn’t like to work there because of the tensions within the staff and problems with the children.”
Although the number of applicants for the vacancies that arose has been disappointing, there were sufficient to enable the posts to be filled to the headteacher’s satisfaction.
Resumé 5.53 Comparing pairs of schools in similar circumstances but with contrasting levels of
turnover has identified a number of common themes. Any differences between primary and secondary were of emphasis and scale rather than substance. The case studies revealed that there were a number of general features in schools with low turnover that were essentially within the schools’ control. Teachers are more likely to stay in schools where there is a clear sense of purpose, where the needs of the staff are recognised and support is provided. Appointing the right teachers in the first place is also very important. If these can be summed up in one word it is leadership.
5.54 Not all schools with high turnover lacked good leadership, but its impact could be outweighed by factors not necessarily within a school’s control such as the attractiveness of its location, the cost of living in the area, local demographics and the personal decisions to leave for career advancement, relationships or life plans. We saw also in Chapter 4, there is a broad relationship between teacher retention and the ability or social background of the pupils. This also came through in our case studies, and was the major difference between the two schools in Inner London. But we also saw in School SE that a popular over-subscribed school with an above average intake with strong leadership could have high turnover. The school itself did not think turnover was unduly high and it had a lot of young staff moving for promotion.
5.55 In some schools recruitment and retention is a major problem, “clinging on by their fingertips” to provide an appropriately qualified teacher for every class. But, in other cases, usually primary schools, lack of turnover can itself be a concern since there is no introduction of new blood and the increasing expense of the staff may make it difficult to balance the budget.
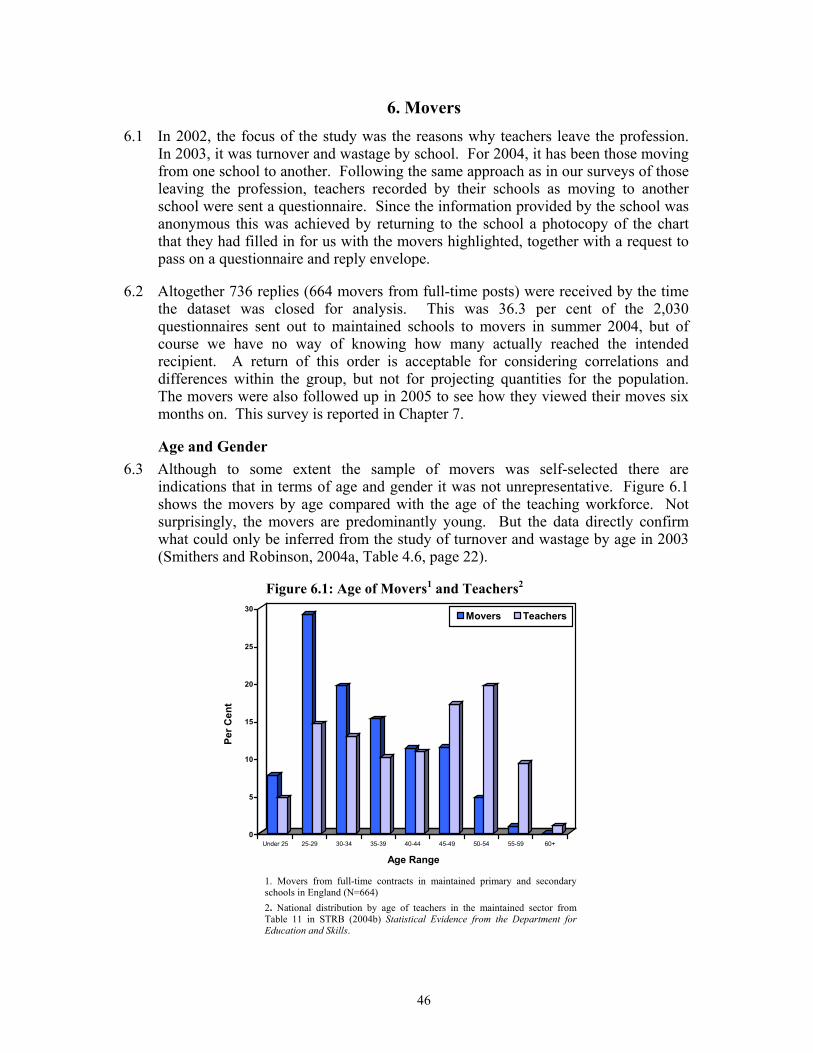
46
6. Movers
6.1 In 2002, the focus of the study was the reasons why teachers leave the profession. In 2003, it was turnover and wastage by school. For 2004, it has been those moving from one school to another. Following the same approach as in our surveys of those leaving the profession, teachers recorded by their schools as moving to another school were sent a questionnaire. Since the information provided by the school was anonymous this was achieved by returning to the school a photocopy of the chart that they had filled in for us with the movers highlighted, together with a request to pass on a questionnaire and reply envelope.
6.2 Altogether 736 replies (664 movers from full-time posts) were received by the time the dataset was closed for analysis. This was 36.3 per cent of the 2,030 questionnaires sent out to maintained schools to movers in summer 2004, but of course we have no way of knowing how many actually reached the intended recipient. A return of this order is acceptable for considering correlations and differences within the group, but not for projecting quantities for the population. The movers were also followed up in 2005 to see how they viewed their moves six months on. This survey is reported in Chapter 7.
Age and Gender 6.3 Although to some extent the sample of movers was self-selected there are
indications that in terms of age and gender it was not unrepresentative. Figure 6.1 shows the movers by age compared with the age of the teaching workforce. Not surprisingly, the movers are predominantly young. But the data directly confirm what could only be inferred from the study of turnover and wastage by age in 2003 (Smithers and Robinson, 2004a, Table 4.6, page 22).
Figure 6.1: Age of Movers1 and Teachers2
0
5
10
15
20
25
30
Per C
ent
Under 25 25-29 30-34 35-39 40-44 45-49 50-54 55-59 60+
Age Range
Movers Teachers
1. Movers from full-time contracts in maintained primary and secondary schools in England (N=664) 2. National distribution by age of teachers in the maintained sector from Table 11 in STRB (2004b) Statistical Evidence from the Department for Education and Skills.
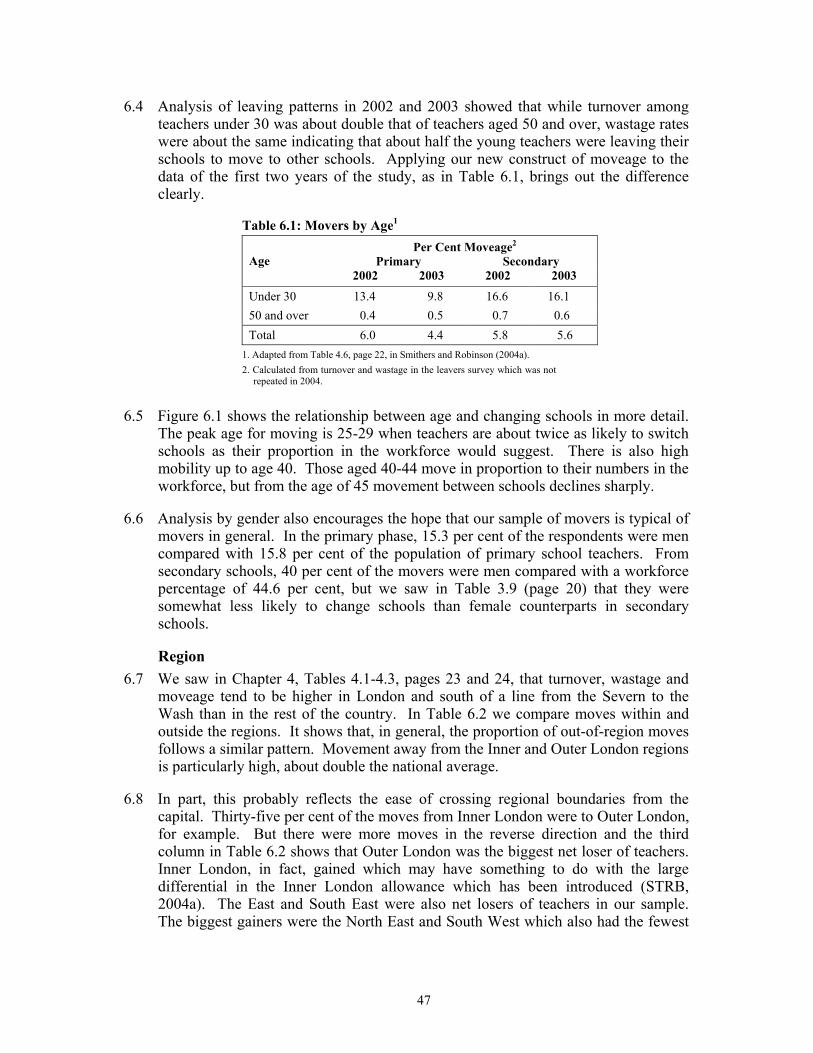
47
6.4 Analysis of leaving patterns in 2002 and 2003 showed that while turnover among teachers under 30 was about double that of teachers aged 50 and over, wastage rates were about the same indicating that about half the young teachers were leaving their schools to move to other schools. Applying our new construct of moveage to the data of the first two years of the study, as in Table 6.1, brings out the difference clearly.
Table 6.1: Movers by Age1 Per Cent Moveage2
Primary Secondary Age 2002 2003 2002 2003
Under 30 13.4 9.8 16.6 16.1 50 and over 0.4 0.5 0.7 0.6 Total 6.0 4.4 5.8 5.6
1. Adapted from Table 4.6, page 22, in Smithers and Robinson (2004a). 2. Calculated from turnover and wastage in the leavers survey which was not
repeated in 2004.
6.5 Figure 6.1 shows the relationship between age and changing schools in more detail. The peak age for moving is 25-29 when teachers are about twice as likely to switch schools as their proportion in the workforce would suggest. There is also high mobility up to age 40. Those aged 40-44 move in proportion to their numbers in the workforce, but from the age of 45 movement between schools declines sharply.
6.6 Analysis by gender also encourages the hope that our sample of movers is typical of movers in general. In the primary phase, 15.3 per cent of the respondents were men compared with 15.8 per cent of the population of primary school teachers. From secondary schools, 40 per cent of the movers were men compared with a workforce percentage of 44.6 per cent, but we saw in Table 3.9 (page 20) that they were somewhat less likely to change schools than female counterparts in secondary schools.
Region 6.7 We saw in Chapter 4, Tables 4.1-4.3, pages 23 and 24, that turnover, wastage and
moveage tend to be higher in London and south of a line from the Severn to the Wash than in the rest of the country. In Table 6.2 we compare moves within and outside the regions. It shows that, in general, the proportion of out-of-region moves follows a similar pattern. Movement away from the Inner and Outer London regions is particularly high, about double the national average.
6.8 In part, this probably reflects the ease of crossing regional boundaries from the capital. Thirty-five per cent of the moves from Inner London were to Outer London, for example. But there were more moves in the reverse direction and the third column in Table 6.2 shows that Outer London was the biggest net loser of teachers. Inner London, in fact, gained which may have something to do with the large differential in the Inner London allowance which has been introduced (STRB, 2004a). The East and South East were also net losers of teachers in our sample. The biggest gainers were the North East and South West which also had the fewest
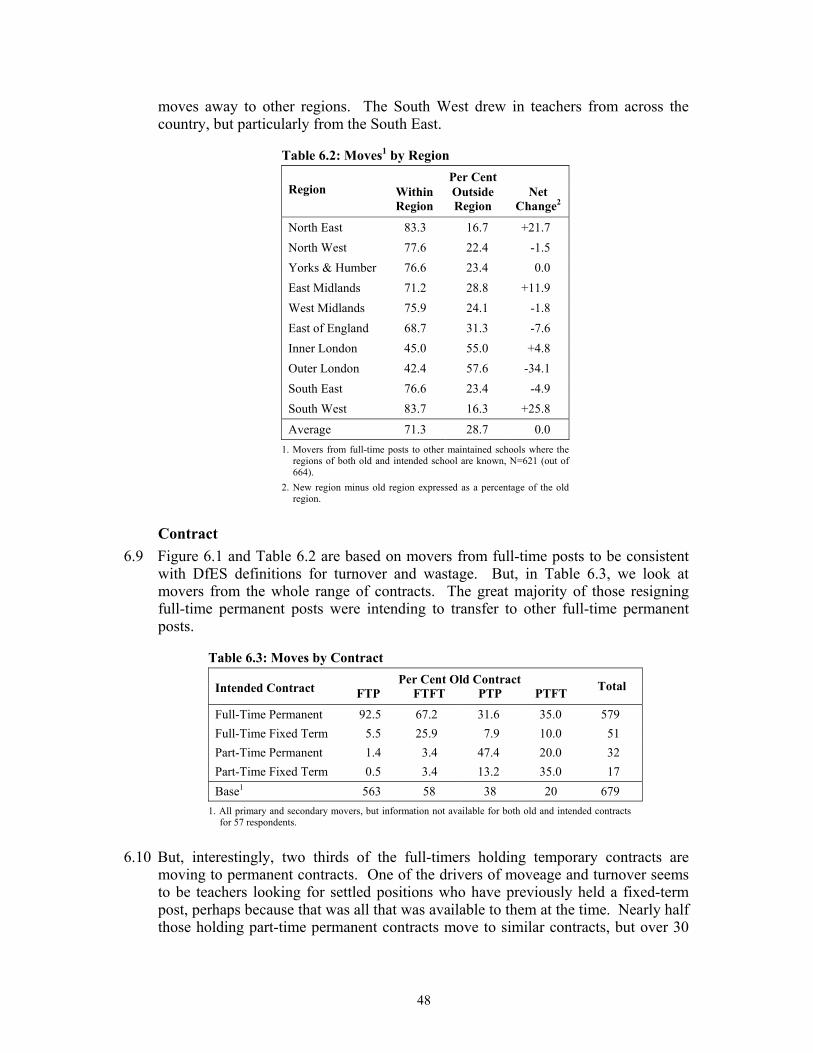
48
moves away to other regions. The South West drew in teachers from across the country, but particularly from the South East.
Table 6.2: Moves1 by Region Per Cent
Region Within Region
Outside Region
Net Change2
North East 83.3 16.7 +21.7 North West 77.6 22.4 -1.5 Yorks & Humber 76.6 23.4 0.0 East Midlands 71.2 28.8 +11.9 West Midlands 75.9 24.1 -1.8 East of England 68.7 31.3 -7.6 Inner London 45.0 55.0 +4.8 Outer London 42.4 57.6 -34.1 South East 76.6 23.4 -4.9 South West 83.7 16.3 +25.8
Average 71.3 28.7 0.0 1. Movers from full-time posts to other maintained schools where the
regions of both old and intended school are known, N=621 (out of 664).
2. New region minus old region expressed as a percentage of the old region.
Contract 6.9 Figure 6.1 and Table 6.2 are based on movers from full-time posts to be consistent
with DfES definitions for turnover and wastage. But, in Table 6.3, we look at movers from the whole range of contracts. The great majority of those resigning full-time permanent posts were intending to transfer to other full-time permanent posts.
Table 6.3: Moves by Contract Per Cent Old Contract
Intended Contract FTP FTFT PTP PTFT Total
Full-Time Permanent 92.5 67.2 31.6 35.0 579 Full-Time Fixed Term 5.5 25.9 7.9 10.0 51 Part-Time Permanent 1.4 3.4 47.4 20.0 32 Part-Time Fixed Term 0.5 3.4 13.2 35.0 17 Base1 563 58 38 20 679
1. All primary and secondary movers, but information not available for both old and intended contracts for 57 respondents.
6.10 But, interestingly, two thirds of the full-timers holding temporary contracts are moving to permanent contracts. One of the drivers of moveage and turnover seems to be teachers looking for settled positions who have previously held a fixed-term post, perhaps because that was all that was available to them at the time. Nearly half those holding part-time permanent contracts move to similar contracts, but over 30
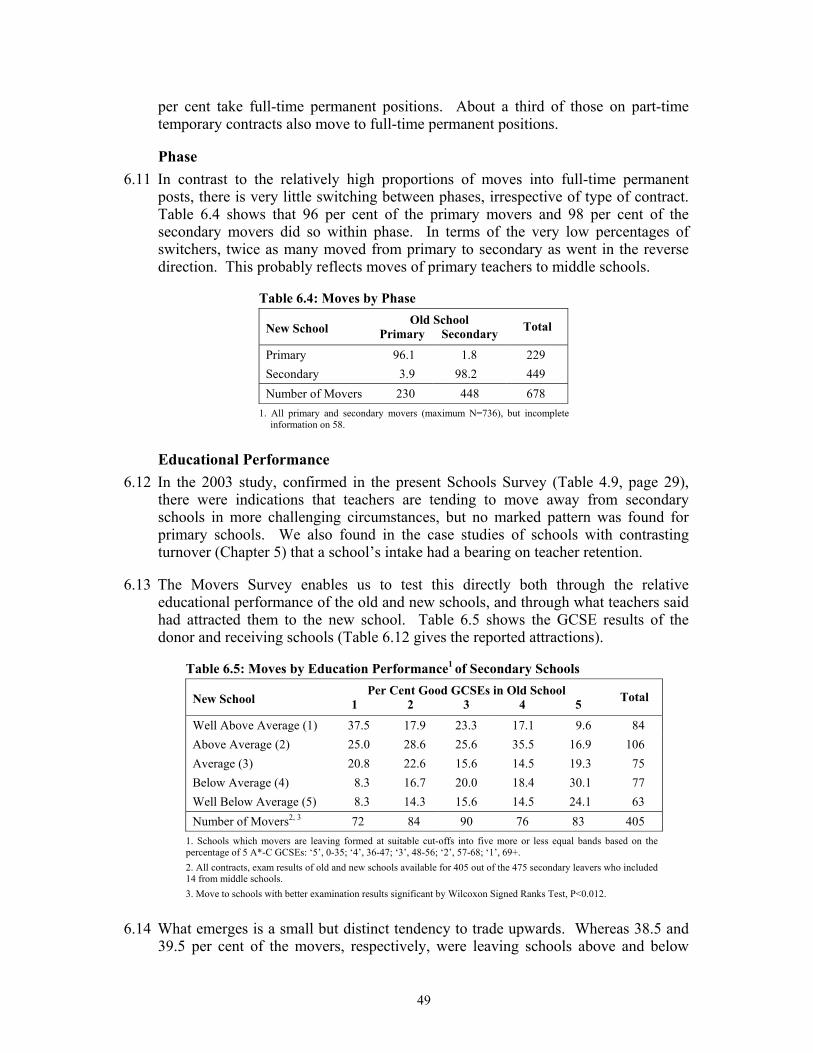
49
per cent take full-time permanent positions. About a third of those on part-time temporary contracts also move to full-time permanent positions.
Phase 6.11 In contrast to the relatively high proportions of moves into full-time permanent
posts, there is very little switching between phases, irrespective of type of contract. Table 6.4 shows that 96 per cent of the primary movers and 98 per cent of the secondary movers did so within phase. In terms of the very low percentages of switchers, twice as many moved from primary to secondary as went in the reverse direction. This probably reflects moves of primary teachers to middle schools.
Table 6.4: Moves by Phase Old School
New School Primary Secondary Total
Primary 96.1 1.8 229 Secondary 3.9 98.2 449 Number of Movers 230 448 678
1. All primary and secondary movers (maximum N=736), but incomplete information on 58.
Educational Performance 6.12 In the 2003 study, confirmed in the present Schools Survey (Table 4.9, page 29),
there were indications that teachers are tending to move away from secondary schools in more challenging circumstances, but no marked pattern was found for primary schools. We also found in the case studies of schools with contrasting turnover (Chapter 5) that a school’s intake had a bearing on teacher retention.
6.13 The Movers Survey enables us to test this directly both through the relative educational performance of the old and new schools, and through what teachers said had attracted them to the new school. Table 6.5 shows the GCSE results of the donor and receiving schools (Table 6.12 gives the reported attractions).
Table 6.5: Moves by Education Performance1 of Secondary Schools Per Cent Good GCSEs in Old School
New School 1 2 3 4 5 Total
Well Above Average (1) 37.5 17.9 23.3 17.1 9.6 84 Above Average (2) 25.0 28.6 25.6 35.5 16.9 106 Average (3) 20.8 22.6 15.6 14.5 19.3 75 Below Average (4) 8.3 16.7 20.0 18.4 30.1 77 Well Below Average (5) 8.3 14.3 15.6 14.5 24.1 63 Number of Movers2, 3 72 84 90 76 83 405
1. Schools which movers are leaving formed at suitable cut-offs into five more or less equal bands based on the percentage of 5 A*-C GCSEs: ‘5’, 0-35; ‘4’, 36-47; ‘3’, 48-56; ‘2’, 57-68; ‘1’, 69+. 2. All contracts, exam results of old and new schools available for 405 out of the 475 secondary leavers who included 14 from middle schools. 3. Move to schools with better examination results significant by Wilcoxon Signed Ranks Test, P<0.012.
6.14 What emerges is a small but distinct tendency to trade upwards. Whereas 38.5 and 39.5 per cent of the movers, respectively, were leaving schools above and below
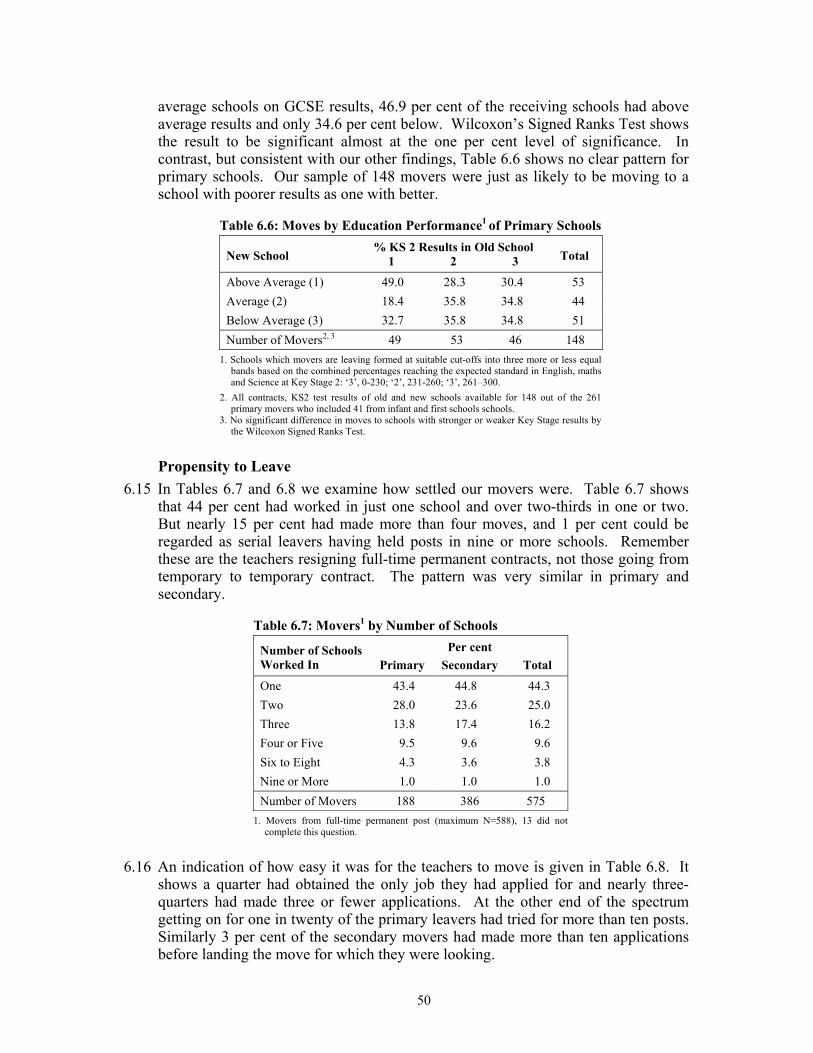
50
average schools on GCSE results, 46.9 per cent of the receiving schools had above average results and only 34.6 per cent below. Wilcoxon’s Signed Ranks Test shows the result to be significant almost at the one per cent level of significance. In contrast, but consistent with our other findings, Table 6.6 shows no clear pattern for primary schools. Our sample of 148 movers were just as likely to be moving to a school with poorer results as one with better.
Table 6.6: Moves by Education Performance1 of Primary Schools % KS 2 Results in Old School
New School 1 2 3 Total
Above Average (1) 49.0 28.3 30.4 53 Average (2) 18.4 35.8 34.8 44 Below Average (3) 32.7 35.8 34.8 51 Number of Movers2, 3 49 53 46 148
1. Schools which movers are leaving formed at suitable cut-offs into three more or less equal bands based on the combined percentages reaching the expected standard in English, maths and Science at Key Stage 2: ‘3’, 0-230; ‘2’, 231-260; ‘3’, 261–300.
2. All contracts, KS2 test results of old and new schools available for 148 out of the 261 primary movers who included 41 from infant and first schools schools.
3. No significant difference in moves to schools with stronger or weaker Key Stage results by the Wilcoxon Signed Ranks Test.
Propensity to Leave 6.15 In Tables 6.7 and 6.8 we examine how settled our movers were. Table 6.7 shows
that 44 per cent had worked in just one school and over two-thirds in one or two. But nearly 15 per cent had made more than four moves, and 1 per cent could be regarded as serial leavers having held posts in nine or more schools. Remember these are the teachers resigning full-time permanent contracts, not those going from temporary to temporary contract. The pattern was very similar in primary and secondary.
Table 6.7: Movers1 by Number of Schools Per cent Number of Schools
Worked In Primary Secondary Total
One 43.4 44.8 44.3 Two 28.0 23.6 25.0 Three 13.8 17.4 16.2 Four or Five 9.5 9.6 9.6 Six to Eight 4.3 3.6 3.8 Nine or More 1.0 1.0 1.0 Number of Movers 188 386 575
1. Movers from full-time permanent post (maximum N=588), 13 did not complete this question.
6.16 An indication of how easy it was for the teachers to move is given in Table 6.8. It shows a quarter had obtained the only job they had applied for and nearly three-quarters had made three or fewer applications. At the other end of the spectrum getting on for one in twenty of the primary leavers had tried for more than ten posts. Similarly 3 per cent of the secondary movers had made more than ten applications before landing the move for which they were looking.
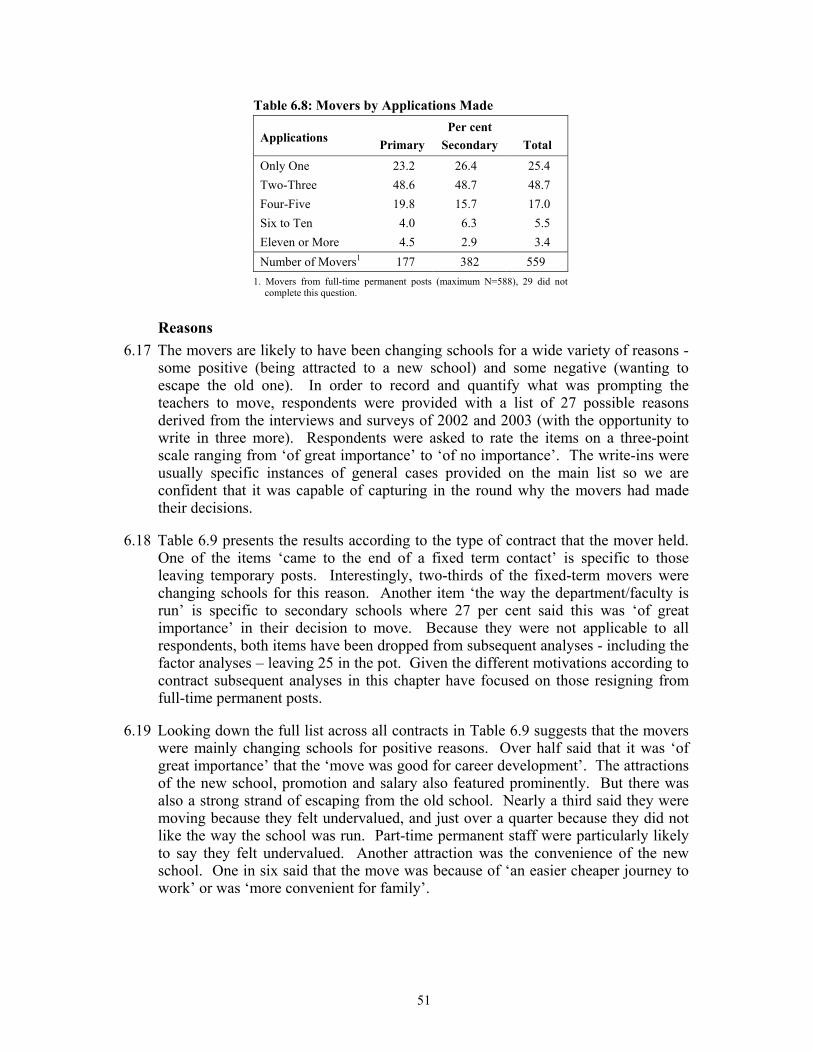
51
Table 6.8: Movers by Applications Made Per cent
Applications Primary Secondary Total
Only One 23.2 26.4 25.4 Two-Three 48.6 48.7 48.7 Four-Five 19.8 15.7 17.0 Six to Ten 4.0 6.3 5.5 Eleven or More 4.5 2.9 3.4 Number of Movers1 177 382 559
1. Movers from full-time permanent posts (maximum N=588), 29 did not complete this question.
Reasons 6.17 The movers are likely to have been changing schools for a wide variety of reasons -
some positive (being attracted to a new school) and some negative (wanting to escape the old one). In order to record and quantify what was prompting the teachers to move, respondents were provided with a list of 27 possible reasons derived from the interviews and surveys of 2002 and 2003 (with the opportunity to write in three more). Respondents were asked to rate the items on a three-point scale ranging from ‘of great importance’ to ‘of no importance’. The write-ins were usually specific instances of general cases provided on the main list so we are confident that it was capable of capturing in the round why the movers had made their decisions.
6.18 Table 6.9 presents the results according to the type of contract that the mover held. One of the items ‘came to the end of a fixed term contact’ is specific to those leaving temporary posts. Interestingly, two-thirds of the fixed-term movers were changing schools for this reason. Another item ‘the way the department/faculty is run’ is specific to secondary schools where 27 per cent said this was ‘of great importance’ in their decision to move. Because they were not applicable to all respondents, both items have been dropped from subsequent analyses - including the factor analyses – leaving 25 in the pot. Given the different motivations according to contract subsequent analyses in this chapter have focused on those resigning from full-time permanent posts.
6.19 Looking down the full list across all contracts in Table 6.9 suggests that the movers were mainly changing schools for positive reasons. Over half said that it was ‘of great importance’ that the ‘move was good for career development’. The attractions of the new school, promotion and salary also featured prominently. But there was also a strong strand of escaping from the old school. Nearly a third said they were moving because they felt undervalued, and just over a quarter because they did not like the way the school was run. Part-time permanent staff were particularly likely to say they felt undervalued. Another attraction was the convenience of the new school. One in six said that the move was because of ‘an easier cheaper journey to work’ or was ‘more convenient for family’.
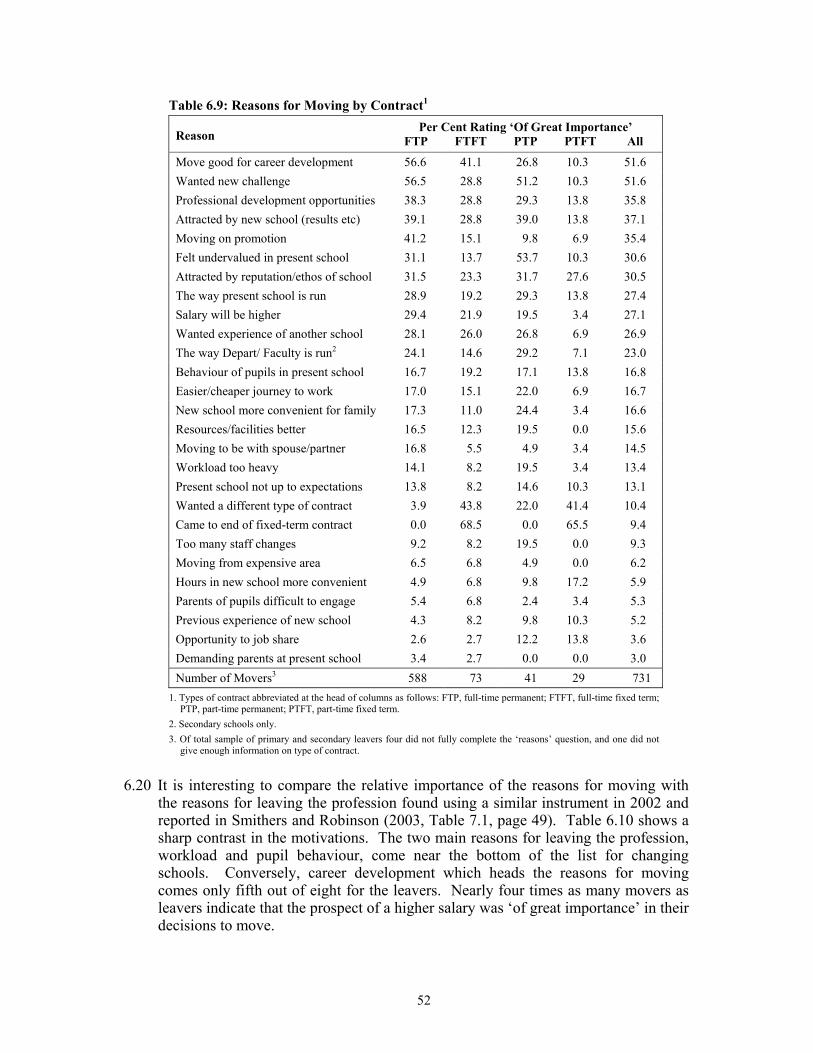
52
Table 6.9: Reasons for Moving by Contract1 Per Cent Rating ‘Of Great Importance’
Reason FTP FTFT PTP PTFT All
Move good for career development 56.6 41.1 26.8 10.3 51.6 Wanted new challenge 56.5 28.8 51.2 10.3 51.6 Professional development opportunities 38.3 28.8 29.3 13.8 35.8 Attracted by new school (results etc) 39.1 28.8 39.0 13.8 37.1 Moving on promotion 41.2 15.1 9.8 6.9 35.4 Felt undervalued in present school 31.1 13.7 53.7 10.3 30.6 Attracted by reputation/ethos of school 31.5 23.3 31.7 27.6 30.5 The way present school is run 28.9 19.2 29.3 13.8 27.4 Salary will be higher 29.4 21.9 19.5 3.4 27.1 Wanted experience of another school 28.1 26.0 26.8 6.9 26.9 The way Depart/ Faculty is run2 24.1 14.6 29.2 7.1 23.0 Behaviour of pupils in present school 16.7 19.2 17.1 13.8 16.8 Easier/cheaper journey to work 17.0 15.1 22.0 6.9 16.7 New school more convenient for family 17.3 11.0 24.4 3.4 16.6 Resources/facilities better 16.5 12.3 19.5 0.0 15.6 Moving to be with spouse/partner 16.8 5.5 4.9 3.4 14.5 Workload too heavy 14.1 8.2 19.5 3.4 13.4 Present school not up to expectations 13.8 8.2 14.6 10.3 13.1 Wanted a different type of contract 3.9 43.8 22.0 41.4 10.4 Came to end of fixed-term contract 0.0 68.5 0.0 65.5 9.4 Too many staff changes 9.2 8.2 19.5 0.0 9.3 Moving from expensive area 6.5 6.8 4.9 0.0 6.2 Hours in new school more convenient 4.9 6.8 9.8 17.2 5.9 Parents of pupils difficult to engage 5.4 6.8 2.4 3.4 5.3 Previous experience of new school 4.3 8.2 9.8 10.3 5.2 Opportunity to job share 2.6 2.7 12.2 13.8 3.6 Demanding parents at present school 3.4 2.7 0.0 0.0 3.0 Number of Movers3 588 73 41 29 731
1. Types of contract abbreviated at the head of columns as follows: FTP, full-time permanent; FTFT, full-time fixed term; PTP, part-time permanent; PTFT, part-time fixed term.
2. Secondary schools only. 3. Of total sample of primary and secondary leavers four did not fully complete the ‘reasons’ question, and one did not
give enough information on type of contract.
6.20 It is interesting to compare the relative importance of the reasons for moving with the reasons for leaving the profession found using a similar instrument in 2002 and reported in Smithers and Robinson (2003, Table 7.1, page 49). Table 6.10 shows a sharp contrast in the motivations. The two main reasons for leaving the profession, workload and pupil behaviour, come near the bottom of the list for changing schools. Conversely, career development which heads the reasons for moving comes only fifth out of eight for the leavers. Nearly four times as many movers as leavers indicate that the prospect of a higher salary was ‘of great importance’ in their decisions to move.
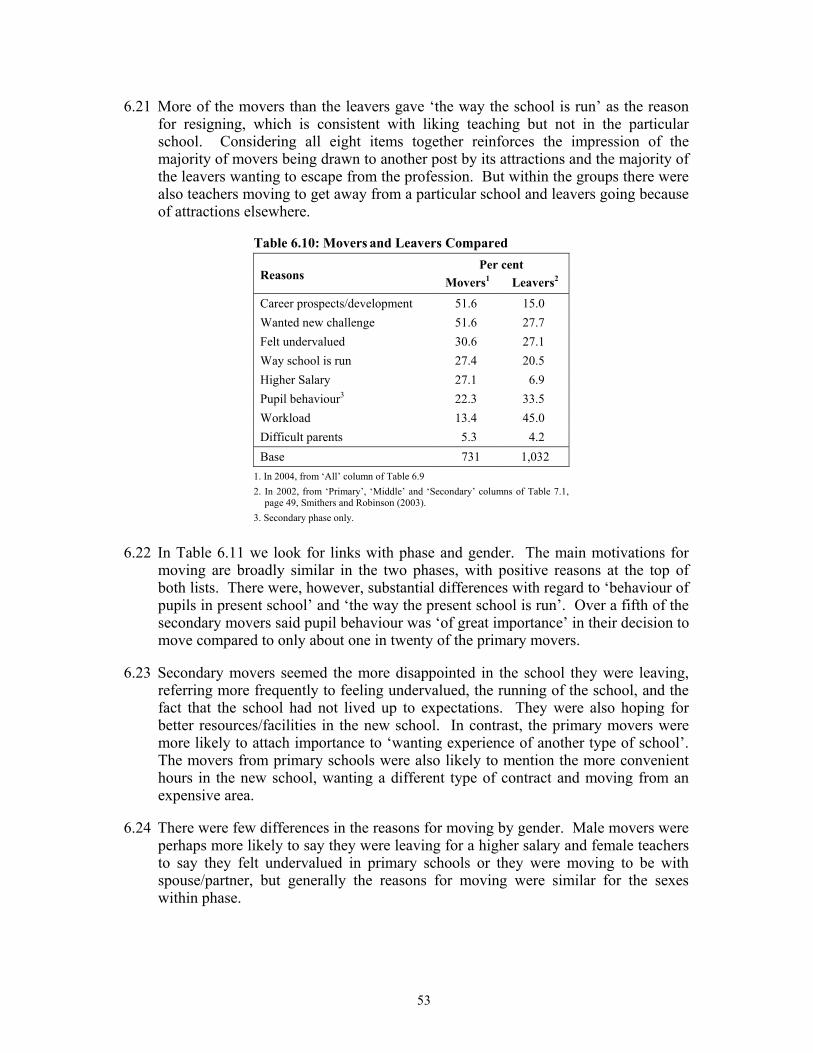
53
6.21 More of the movers than the leavers gave ‘the way the school is run’ as the reason for resigning, which is consistent with liking teaching but not in the particular school. Considering all eight items together reinforces the impression of the majority of movers being drawn to another post by its attractions and the majority of the leavers wanting to escape from the profession. But within the groups there were also teachers moving to get away from a particular school and leavers going because of attractions elsewhere.
Table 6.10: Movers and Leavers Compared Per cent
Reasons Movers1 Leavers2
Career prospects/development 51.6 15.0 Wanted new challenge 51.6 27.7 Felt undervalued 30.6 27.1 Way school is run 27.4 20.5 Higher Salary 27.1 6.9 Pupil behaviour3 22.3 33.5 Workload 13.4 45.0 Difficult parents 5.3 4.2 Base 731 1,032
1. In 2004, from ‘All’ column of Table 6.9 2. In 2002, from ‘Primary’, ‘Middle’ and ‘Secondary’ columns of Table 7.1,
page 49, Smithers and Robinson (2003). 3. Secondary phase only.
6.22 In Table 6.11 we look for links with phase and gender. The main motivations for moving are broadly similar in the two phases, with positive reasons at the top of both lists. There were, however, substantial differences with regard to ‘behaviour of pupils in present school’ and ‘the way the present school is run’. Over a fifth of the secondary movers said pupil behaviour was ‘of great importance’ in their decision to move compared to only about one in twenty of the primary movers.
6.23 Secondary movers seemed the more disappointed in the school they were leaving, referring more frequently to feeling undervalued, the running of the school, and the fact that the school had not lived up to expectations. They were also hoping for better resources/facilities in the new school. In contrast, the primary movers were more likely to attach importance to ‘wanting experience of another type of school’. The movers from primary schools were also likely to mention the more convenient hours in the new school, wanting a different type of contract and moving from an expensive area.
6.24 There were few differences in the reasons for moving by gender. Male movers were perhaps more likely to say they were leaving for a higher salary and female teachers to say they felt undervalued in primary schools or they were moving to be with spouse/partner, but generally the reasons for moving were similar for the sexes within phase.
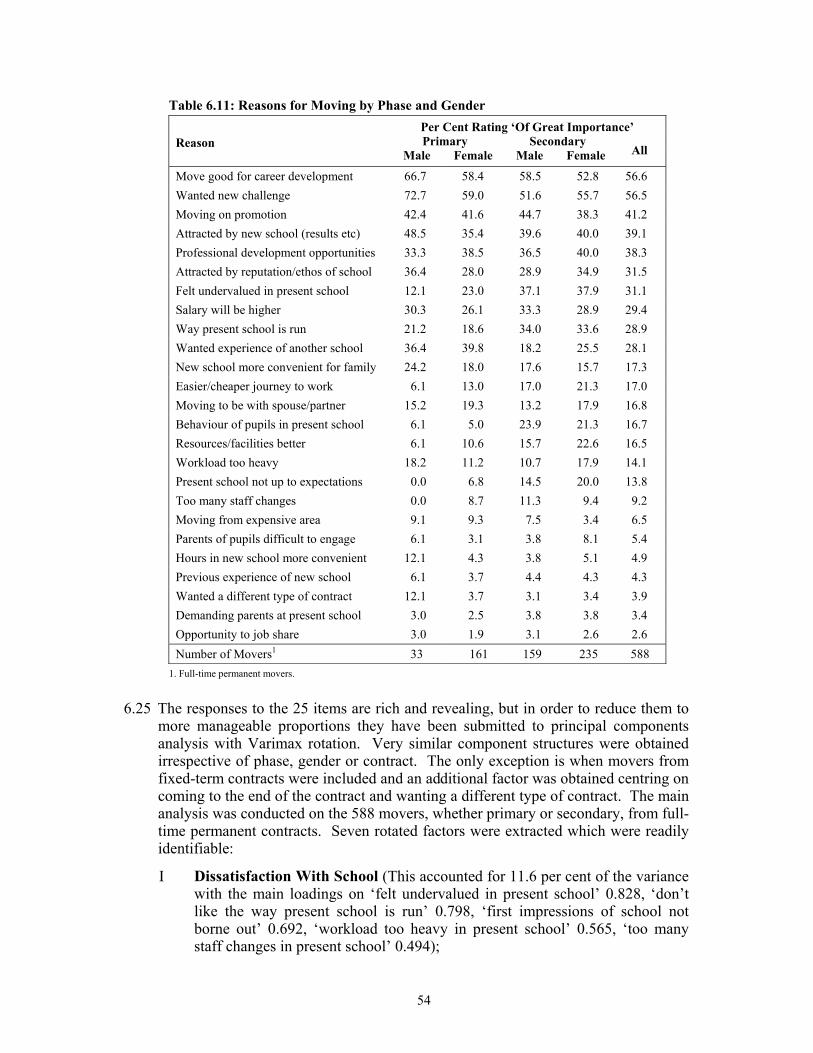
54
Table 6.11: Reasons for Moving by Phase and Gender Per Cent Rating ‘Of Great Importance’ Primary Secondary Reason
Male Female Male Female All
Move good for career development 66.7 58.4 58.5 52.8 56.6 Wanted new challenge 72.7 59.0 51.6 55.7 56.5 Moving on promotion 42.4 41.6 44.7 38.3 41.2 Attracted by new school (results etc) 48.5 35.4 39.6 40.0 39.1 Professional development opportunities 33.3 38.5 36.5 40.0 38.3 Attracted by reputation/ethos of school 36.4 28.0 28.9 34.9 31.5 Felt undervalued in present school 12.1 23.0 37.1 37.9 31.1 Salary will be higher 30.3 26.1 33.3 28.9 29.4 Way present school is run 21.2 18.6 34.0 33.6 28.9 Wanted experience of another school 36.4 39.8 18.2 25.5 28.1 New school more convenient for family 24.2 18.0 17.6 15.7 17.3 Easier/cheaper journey to work 6.1 13.0 17.0 21.3 17.0 Moving to be with spouse/partner 15.2 19.3 13.2 17.9 16.8 Behaviour of pupils in present school 6.1 5.0 23.9 21.3 16.7 Resources/facilities better 6.1 10.6 15.7 22.6 16.5 Workload too heavy 18.2 11.2 10.7 17.9 14.1 Present school not up to expectations 0.0 6.8 14.5 20.0 13.8 Too many staff changes 0.0 8.7 11.3 9.4 9.2 Moving from expensive area 9.1 9.3 7.5 3.4 6.5 Parents of pupils difficult to engage 6.1 3.1 3.8 8.1 5.4 Hours in new school more convenient 12.1 4.3 3.8 5.1 4.9 Previous experience of new school 6.1 3.7 4.4 4.3 4.3 Wanted a different type of contract 12.1 3.7 3.1 3.4 3.9 Demanding parents at present school 3.0 2.5 3.8 3.8 3.4 Opportunity to job share 3.0 1.9 3.1 2.6 2.6 Number of Movers1 33 161 159 235 588
1. Full-time permanent movers.
6.25 The responses to the 25 items are rich and revealing, but in order to reduce them to more manageable proportions they have been submitted to principal components analysis with Varimax rotation. Very similar component structures were obtained irrespective of phase, gender or contract. The only exception is when movers from fixed-term contracts were included and an additional factor was obtained centring on coming to the end of the contract and wanting a different type of contract. The main analysis was conducted on the 588 movers, whether primary or secondary, from full-time permanent contracts. Seven rotated factors were extracted which were readily identifiable:
I Dissatisfaction With School (This accounted for 11.6 per cent of the variance with the main loadings on ‘felt undervalued in present school’ 0.828, ‘don’t like the way present school is run’ 0.798, ‘first impressions of school not borne out’ 0.692, ‘workload too heavy in present school’ 0.565, ‘too many staff changes in present school’ 0.494);
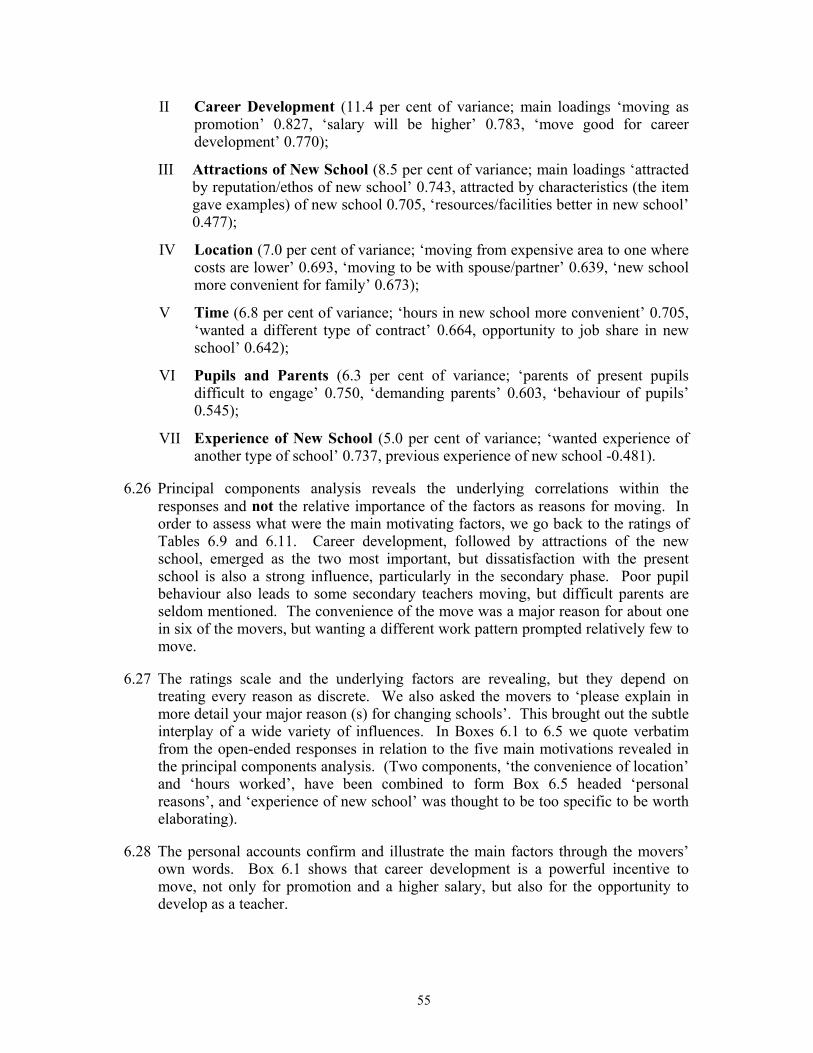
55
II Career Development (11.4 per cent of variance; main loadings ‘moving as promotion’ 0.827, ‘salary will be higher’ 0.783, ‘move good for career development’ 0.770);
III Attractions of New School (8.5 per cent of variance; main loadings ‘attracted by reputation/ethos of new school’ 0.743, attracted by characteristics (the item gave examples) of new school 0.705, ‘resources/facilities better in new school’ 0.477);
IV Location (7.0 per cent of variance; ‘moving from expensive area to one where costs are lower’ 0.693, ‘moving to be with spouse/partner’ 0.639, ‘new school more convenient for family’ 0.673);
V Time (6.8 per cent of variance; ‘hours in new school more convenient’ 0.705, ‘wanted a different type of contract’ 0.664, opportunity to job share in new school’ 0.642);
VI Pupils and Parents (6.3 per cent of variance; ‘parents of present pupils difficult to engage’ 0.750, ‘demanding parents’ 0.603, ‘behaviour of pupils’ 0.545);
VII Experience of New School (5.0 per cent of variance; ‘wanted experience of another type of school’ 0.737, previous experience of new school -0.481).
6.26 Principal components analysis reveals the underlying correlations within the responses and not the relative importance of the factors as reasons for moving. In order to assess what were the main motivating factors, we go back to the ratings of Tables 6.9 and 6.11. Career development, followed by attractions of the new school, emerged as the two most important, but dissatisfaction with the present school is also a strong influence, particularly in the secondary phase. Poor pupil behaviour also leads to some secondary teachers moving, but difficult parents are seldom mentioned. The convenience of the move was a major reason for about one in six of the movers, but wanting a different work pattern prompted relatively few to move.
6.27 The ratings scale and the underlying factors are revealing, but they depend on treating every reason as discrete. We also asked the movers to ‘please explain in more detail your major reason (s) for changing schools’. This brought out the subtle interplay of a wide variety of influences. In Boxes 6.1 to 6.5 we quote verbatim from the open-ended responses in relation to the five main motivations revealed in the principal components analysis. (Two components, ‘the convenience of location’ and ‘hours worked’, have been combined to form Box 6.5 headed ‘personal reasons’, and ‘experience of new school’ was thought to be too specific to be worth elaborating).
6.28 The personal accounts confirm and illustrate the main factors through the movers’ own words. Box 6.1 shows that career development is a powerful incentive to move, not only for promotion and a higher salary, but also for the opportunity to develop as a teacher.
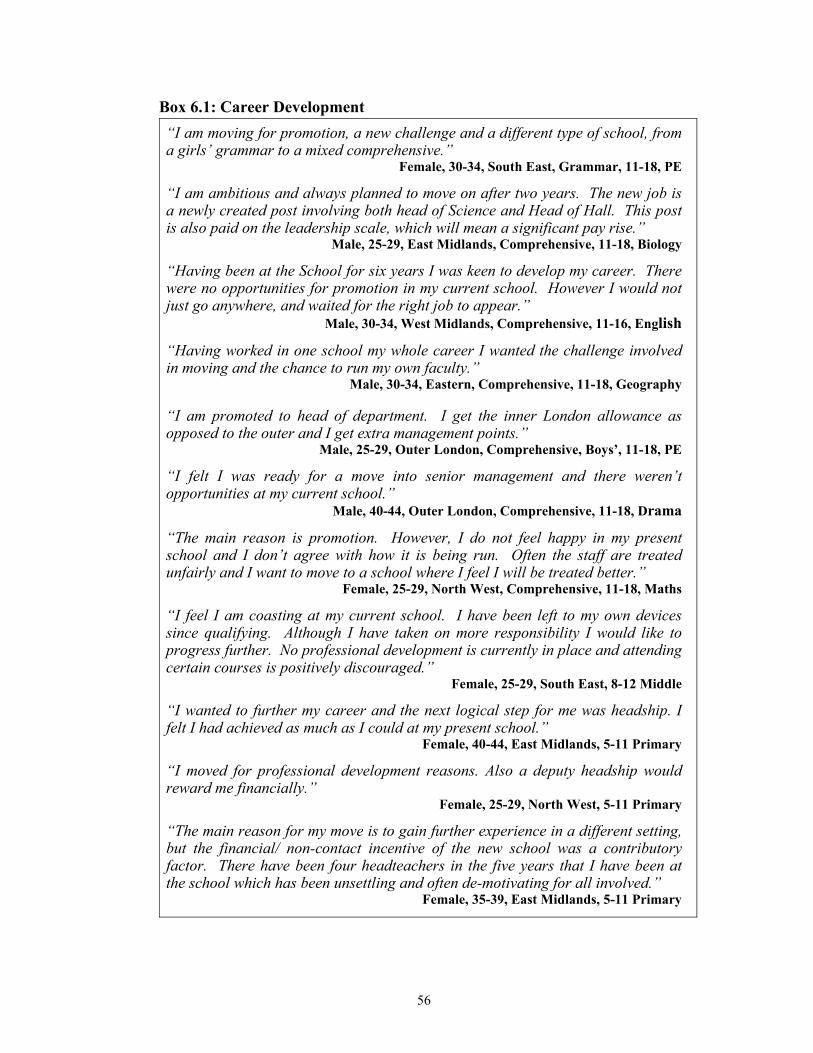
56
Box 6.1: Career Development “I am moving for promotion, a new challenge and a different type of school, from a girls’ grammar to a mixed comprehensive.”
Female, 30-34, South East, Grammar, 11-18, PE
“I am ambitious and always planned to move on after two years. The new job is a newly created post involving both head of Science and Head of Hall. This post is also paid on the leadership scale, which will mean a significant pay rise.”
Male, 25-29, East Midlands, Comprehensive, 11-18, Biology
“Having been at the School for six years I was keen to develop my career. There were no opportunities for promotion in my current school. However I would not just go anywhere, and waited for the right job to appear.”
Male, 30-34, West Midlands, Comprehensive, 11-16, English
“Having worked in one school my whole career I wanted the challenge involved in moving and the chance to run my own faculty.”
Male, 30-34, Eastern, Comprehensive, 11-18, Geography
“I am promoted to head of department. I get the inner London allowance as opposed to the outer and I get extra management points.”
Male, 25-29, Outer London, Comprehensive, Boys’, 11-18, PE
“I felt I was ready for a move into senior management and there weren’t opportunities at my current school.”
Male, 40-44, Outer London, Comprehensive, 11-18, Drama
“The main reason is promotion. However, I do not feel happy in my present school and I don’t agree with how it is being run. Often the staff are treated unfairly and I want to move to a school where I feel I will be treated better.”
Female, 25-29, North West, Comprehensive, 11-18, Maths
“I feel I am coasting at my current school. I have been left to my own devices since qualifying. Although I have taken on more responsibility I would like to progress further. No professional development is currently in place and attending certain courses is positively discouraged.”
Female, 25-29, South East, 8-12 Middle
“I wanted to further my career and the next logical step for me was headship. I felt I had achieved as much as I could at my present school.”
Female, 40-44, East Midlands, 5-11 Primary
“I moved for professional development reasons. Also a deputy headship would reward me financially.”
Female, 25-29, North West, 5-11 Primary
“The main reason for my move is to gain further experience in a different setting, but the financial/ non-contact incentive of the new school was a contributory factor. There have been four headteachers in the five years that I have been at the school which has been unsettling and often de-motivating for all involved.”
Female, 35-39, East Midlands, 5-11 Primary
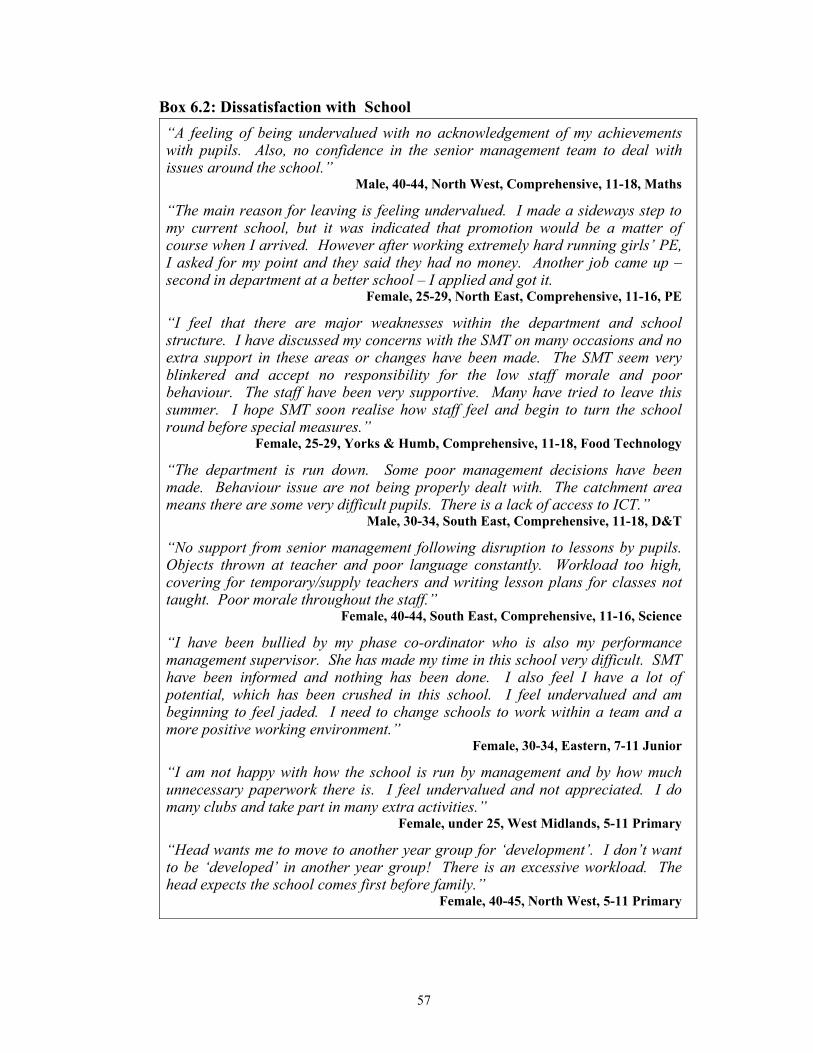
57
Box 6.2: Dissatisfaction with School “A feeling of being undervalued with no acknowledgement of my achievements with pupils. Also, no confidence in the senior management team to deal with issues around the school.”
Male, 40-44, North West, Comprehensive, 11-18, Maths
“The main reason for leaving is feeling undervalued. I made a sideways step to my current school, but it was indicated that promotion would be a matter of course when I arrived. However after working extremely hard running girls’ PE, I asked for my point and they said they had no money. Another job came up – second in department at a better school – I applied and got it.
Female, 25-29, North East, Comprehensive, 11-16, PE
“I feel that there are major weaknesses within the department and school structure. I have discussed my concerns with the SMT on many occasions and no extra support in these areas or changes have been made. The SMT seem very blinkered and accept no responsibility for the low staff morale and poor behaviour. The staff have been very supportive. Many have tried to leave this summer. I hope SMT soon realise how staff feel and begin to turn the school round before special measures.”
Female, 25-29, Yorks & Humb, Comprehensive, 11-18, Food Technology
“The department is run down. Some poor management decisions have been made. Behaviour issue are not being properly dealt with. The catchment area means there are some very difficult pupils. There is a lack of access to ICT.”
Male, 30-34, South East, Comprehensive, 11-18, D&T
“No support from senior management following disruption to lessons by pupils. Objects thrown at teacher and poor language constantly. Workload too high, covering for temporary/supply teachers and writing lesson plans for classes not taught. Poor morale throughout the staff.”
Female, 40-44, South East, Comprehensive, 11-16, Science
“I have been bullied by my phase co-ordinator who is also my performance management supervisor. She has made my time in this school very difficult. SMT have been informed and nothing has been done. I also feel I have a lot of potential, which has been crushed in this school. I feel undervalued and am beginning to feel jaded. I need to change schools to work within a team and a more positive working environment.”
Female, 30-34, Eastern, 7-11 Junior
“I am not happy with how the school is run by management and by how much unnecessary paperwork there is. I feel undervalued and not appreciated. I do many clubs and take part in many extra activities.”
Female, under 25, West Midlands, 5-11 Primary
“Head wants me to move to another year group for ‘development’. I don’t want to be ‘developed’ in another year group! There is an excessive workload. The head expects the school comes first before family.”
Female, 40-45, North West, 5-11 Primary
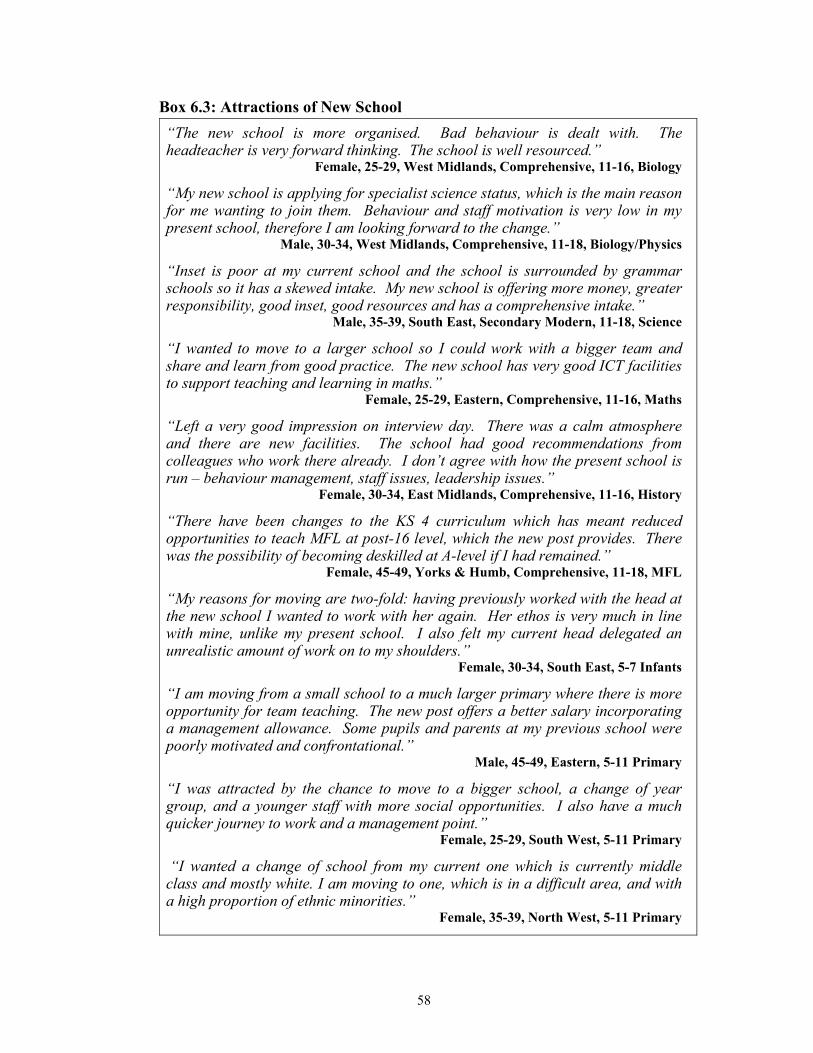
58
Box 6.3: Attractions of New School “The new school is more organised. Bad behaviour is dealt with. The headteacher is very forward thinking. The school is well resourced.”
Female, 25-29, West Midlands, Comprehensive, 11-16, Biology
“My new school is applying for specialist science status, which is the main reason for me wanting to join them. Behaviour and staff motivation is very low in my present school, therefore I am looking forward to the change.”
Male, 30-34, West Midlands, Comprehensive, 11-18, Biology/Physics
“Inset is poor at my current school and the school is surrounded by grammar schools so it has a skewed intake. My new school is offering more money, greater responsibility, good inset, good resources and has a comprehensive intake.”
Male, 35-39, South East, Secondary Modern, 11-18, Science
“I wanted to move to a larger school so I could work with a bigger team and share and learn from good practice. The new school has very good ICT facilities to support teaching and learning in maths.”
Female, 25-29, Eastern, Comprehensive, 11-16, Maths
“Left a very good impression on interview day. There was a calm atmosphere and there are new facilities. The school had good recommendations from colleagues who work there already. I don’t agree with how the present school is run – behaviour management, staff issues, leadership issues.”
Female, 30-34, East Midlands, Comprehensive, 11-16, History
“There have been changes to the KS 4 curriculum which has meant reduced opportunities to teach MFL at post-16 level, which the new post provides. There was the possibility of becoming deskilled at A-level if I had remained.”
Female, 45-49, Yorks & Humb, Comprehensive, 11-18, MFL
“My reasons for moving are two-fold: having previously worked with the head at the new school I wanted to work with her again. Her ethos is very much in line with mine, unlike my present school. I also felt my current head delegated an unrealistic amount of work on to my shoulders.”
Female, 30-34, South East, 5-7 Infants
“I am moving from a small school to a much larger primary where there is more opportunity for team teaching. The new post offers a better salary incorporating a management allowance. Some pupils and parents at my previous school were poorly motivated and confrontational.”
Male, 45-49, Eastern, 5-11 Primary
“I was attracted by the chance to move to a bigger school, a change of year group, and a younger staff with more social opportunities. I also have a much quicker journey to work and a management point.”
Female, 25-29, South West, 5-11 Primary
“I wanted a change of school from my current one which is currently middle class and mostly white. I am moving to one, which is in a difficult area, and with a high proportion of ethnic minorities.”
Female, 35-39, North West, 5-11 Primary
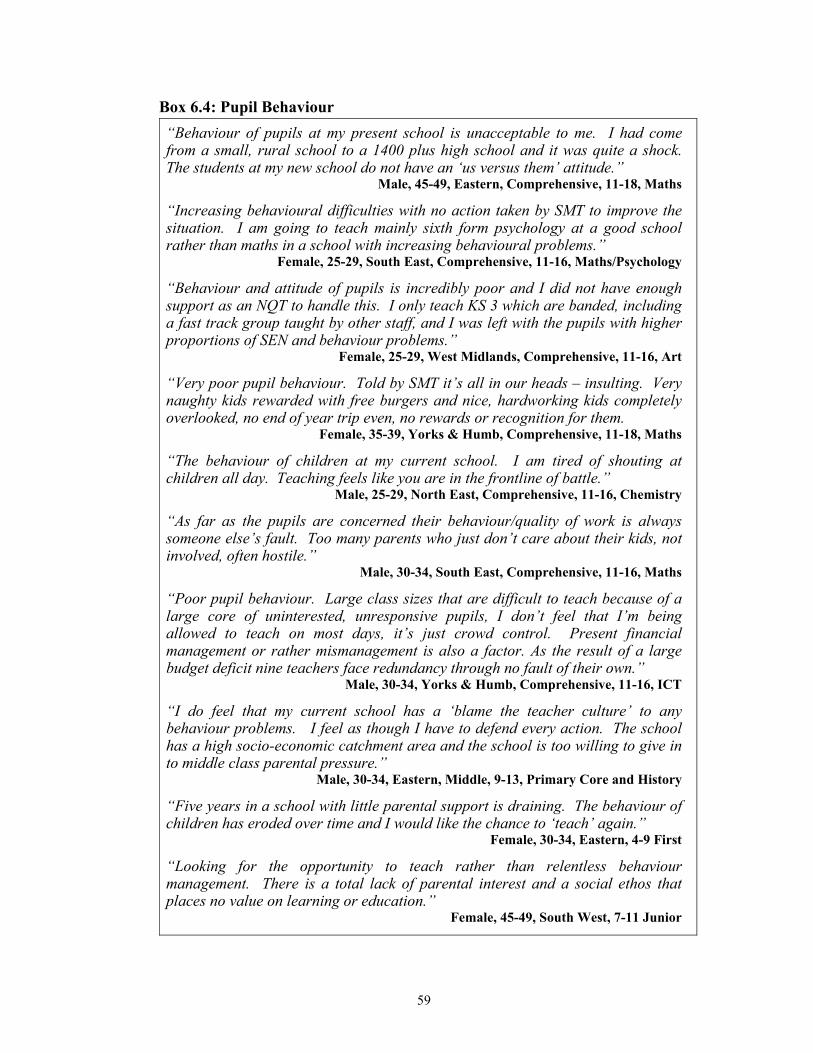
59
Box 6.4: Pupil Behaviour “Behaviour of pupils at my present school is unacceptable to me. I had come from a small, rural school to a 1400 plus high school and it was quite a shock. The students at my new school do not have an ‘us versus them’ attitude.”
Male, 45-49, Eastern, Comprehensive, 11-18, Maths
“Increasing behavioural difficulties with no action taken by SMT to improve the situation. I am going to teach mainly sixth form psychology at a good school rather than maths in a school with increasing behavioural problems.”
Female, 25-29, South East, Comprehensive, 11-16, Maths/Psychology
“Behaviour and attitude of pupils is incredibly poor and I did not have enough support as an NQT to handle this. I only teach KS 3 which are banded, including a fast track group taught by other staff, and I was left with the pupils with higher proportions of SEN and behaviour problems.”
Female, 25-29, West Midlands, Comprehensive, 11-16, Art
“Very poor pupil behaviour. Told by SMT it’s all in our heads – insulting. Very naughty kids rewarded with free burgers and nice, hardworking kids completely overlooked, no end of year trip even, no rewards or recognition for them.
Female, 35-39, Yorks & Humb, Comprehensive, 11-18, Maths
“The behaviour of children at my current school. I am tired of shouting at children all day. Teaching feels like you are in the frontline of battle.”
Male, 25-29, North East, Comprehensive, 11-16, Chemistry
“As far as the pupils are concerned their behaviour/quality of work is always someone else’s fault. Too many parents who just don’t care about their kids, not involved, often hostile.”
Male, 30-34, South East, Comprehensive, 11-16, Maths
“Poor pupil behaviour. Large class sizes that are difficult to teach because of a large core of uninterested, unresponsive pupils, I don’t feel that I’m being allowed to teach on most days, it’s just crowd control. Present financial management or rather mismanagement is also a factor. As the result of a large budget deficit nine teachers face redundancy through no fault of their own.”
Male, 30-34, Yorks & Humb, Comprehensive, 11-16, ICT
“I do feel that my current school has a ‘blame the teacher culture’ to any behaviour problems. I feel as though I have to defend every action. The school has a high socio-economic catchment area and the school is too willing to give in to middle class parental pressure.”
Male, 30-34, Eastern, Middle, 9-13, Primary Core and History
“Five years in a school with little parental support is draining. The behaviour of children has eroded over time and I would like the chance to ‘teach’ again.”
Female, 30-34, Eastern, 4-9 First
“Looking for the opportunity to teach rather than relentless behaviour management. There is a total lack of parental interest and a social ethos that places no value on learning or education.”
Female, 45-49, South West, 7-11 Junior
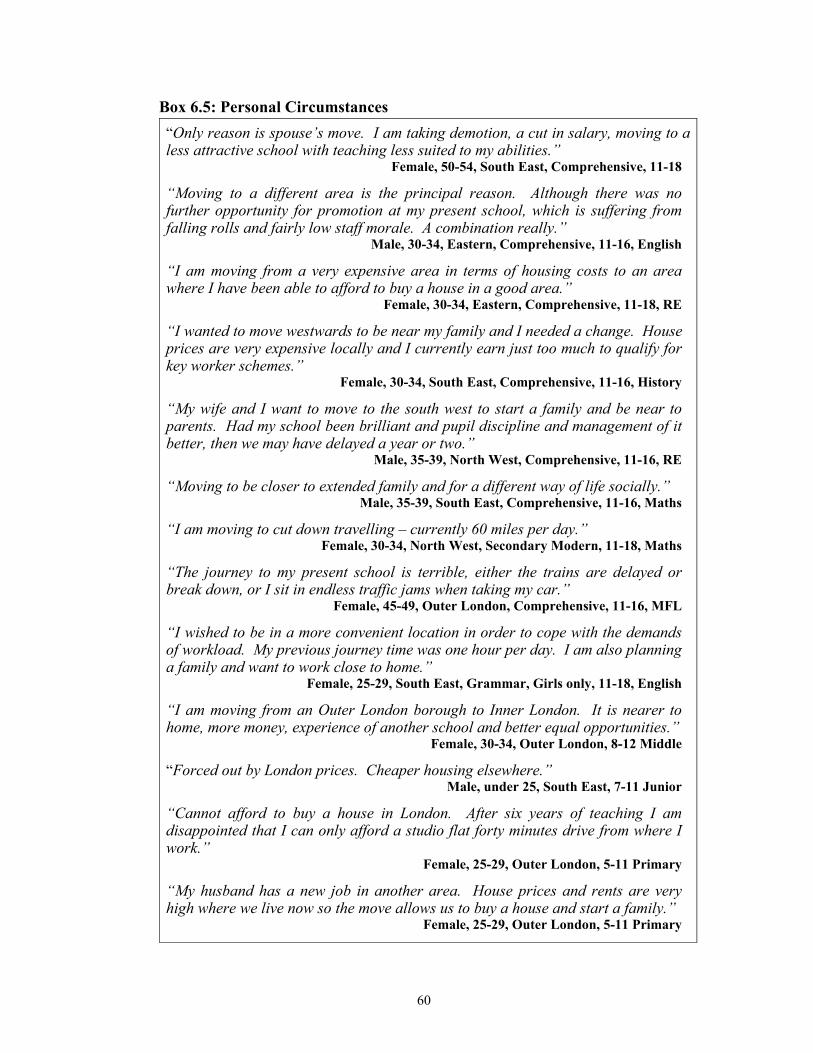
60
Box 6.5: Personal Circumstances “Only reason is spouse’s move. I am taking demotion, a cut in salary, moving to a less attractive school with teaching less suited to my abilities.”
Female, 50-54, South East, Comprehensive, 11-18
“Moving to a different area is the principal reason. Although there was no further opportunity for promotion at my present school, which is suffering from falling rolls and fairly low staff morale. A combination really.”
Male, 30-34, Eastern, Comprehensive, 11-16, English
“I am moving from a very expensive area in terms of housing costs to an area where I have been able to afford to buy a house in a good area.”
Female, 30-34, Eastern, Comprehensive, 11-18, RE
“I wanted to move westwards to be near my family and I needed a change. House prices are very expensive locally and I currently earn just too much to qualify for key worker schemes.”
Female, 30-34, South East, Comprehensive, 11-16, History
“My wife and I want to move to the south west to start a family and be near to parents. Had my school been brilliant and pupil discipline and management of it better, then we may have delayed a year or two.”
Male, 35-39, North West, Comprehensive, 11-16, RE
“Moving to be closer to extended family and for a different way of life socially.” Male, 35-39, South East, Comprehensive, 11-16, Maths
“I am moving to cut down travelling – currently 60 miles per day.” Female, 30-34, North West, Secondary Modern, 11-18, Maths
“The journey to my present school is terrible, either the trains are delayed or break down, or I sit in endless traffic jams when taking my car.”
Female, 45-49, Outer London, Comprehensive, 11-16, MFL
“I wished to be in a more convenient location in order to cope with the demands of workload. My previous journey time was one hour per day. I am also planning a family and want to work close to home.”
Female, 25-29, South East, Grammar, Girls only, 11-18, English
“I am moving from an Outer London borough to Inner London. It is nearer to home, more money, experience of another school and better equal opportunities.”
Female, 30-34, Outer London, 8-12 Middle
“Forced out by London prices. Cheaper housing elsewhere.” Male, under 25, South East, 7-11 Junior
“Cannot afford to buy a house in London. After six years of teaching I am disappointed that I can only afford a studio flat forty minutes drive from where I work.”
Female, 25-29, Outer London, 5-11 Primary
“My husband has a new job in another area. House prices and rents are very high where we live now so the move allows us to buy a house and start a family.”
Female, 25-29, Outer London, 5-11 Primary
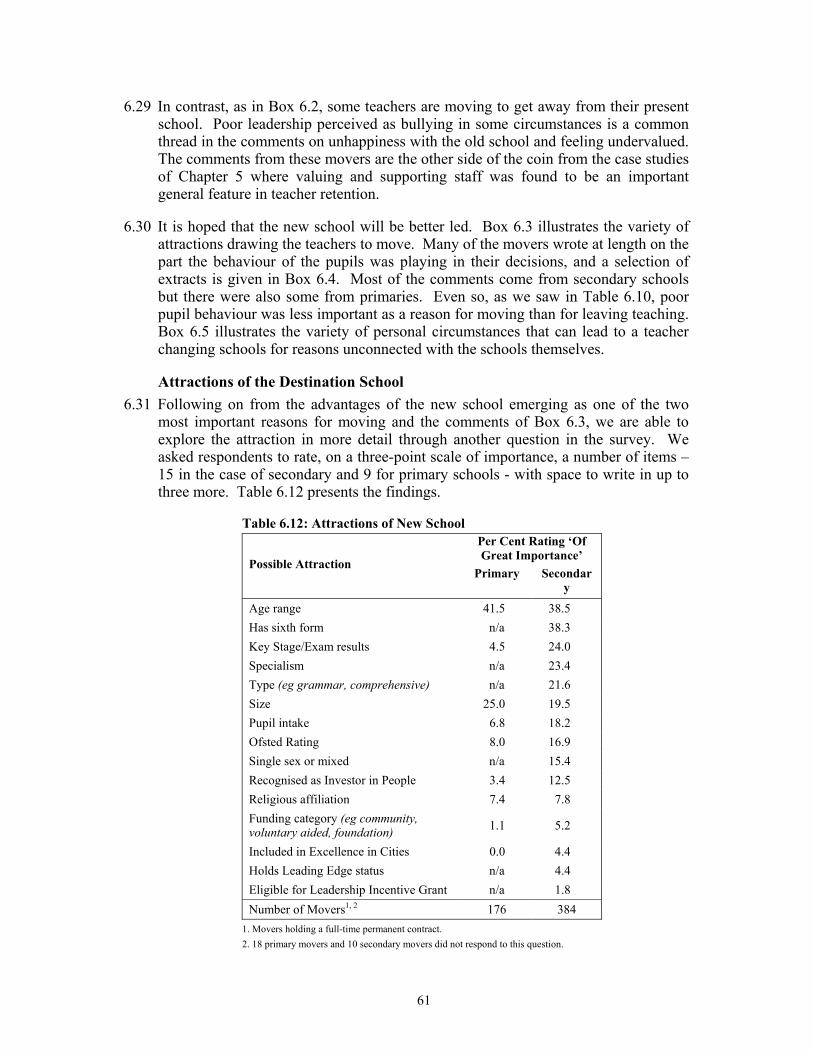
61
6.29 In contrast, as in Box 6.2, some teachers are moving to get away from their present school. Poor leadership perceived as bullying in some circumstances is a common thread in the comments on unhappiness with the old school and feeling undervalued. The comments from these movers are the other side of the coin from the case studies of Chapter 5 where valuing and supporting staff was found to be an important general feature in teacher retention.
6.30 It is hoped that the new school will be better led. Box 6.3 illustrates the variety of attractions drawing the teachers to move. Many of the movers wrote at length on the part the behaviour of the pupils was playing in their decisions, and a selection of extracts is given in Box 6.4. Most of the comments come from secondary schools but there were also some from primaries. Even so, as we saw in Table 6.10, poor pupil behaviour was less important as a reason for moving than for leaving teaching. Box 6.5 illustrates the variety of personal circumstances that can lead to a teacher changing schools for reasons unconnected with the schools themselves.
Attractions of the Destination School 6.31 Following on from the advantages of the new school emerging as one of the two
most important reasons for moving and the comments of Box 6.3, we are able to explore the attraction in more detail through another question in the survey. We asked respondents to rate, on a three-point scale of importance, a number of items – 15 in the case of secondary and 9 for primary schools - with space to write in up to three more. Table 6.12 presents the findings.
Table 6.12: Attractions of New School Per Cent Rating ‘Of Great Importance’
Possible Attraction Primary Secondar
y
Age range 41.5 38.5 Has sixth form n/a 38.3 Key Stage/Exam results 4.5 24.0 Specialism n/a 23.4 Type (eg grammar, comprehensive) n/a 21.6 Size 25.0 19.5 Pupil intake 6.8 18.2 Ofsted Rating 8.0 16.9 Single sex or mixed n/a 15.4 Recognised as Investor in People 3.4 12.5 Religious affiliation 7.4 7.8 Funding category (eg community, voluntary aided, foundation) 1.1 5.2
Included in Excellence in Cities 0.0 4.4 Holds Leading Edge status n/a 4.4 Eligible for Leadership Incentive Grant n/a 1.8 Number of Movers1, 2 176 384
1. Movers holding a full-time permanent contract. 2. 18 primary movers and 10 secondary movers did not respond to this question.
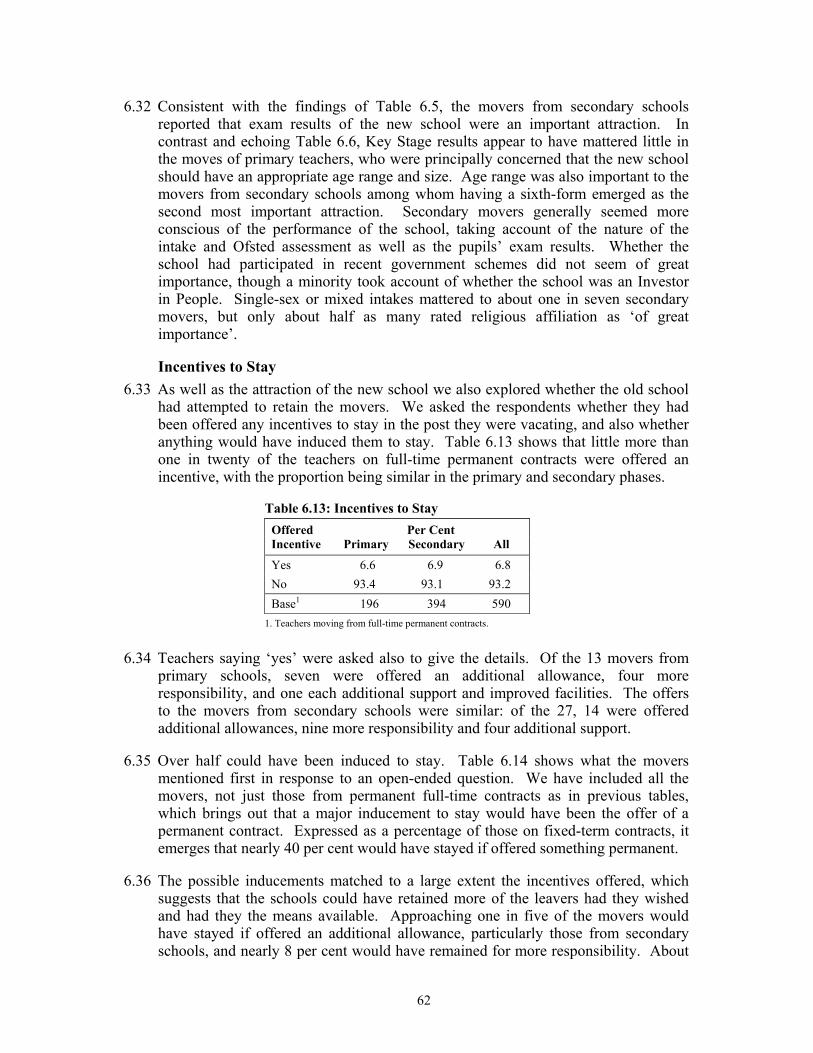
62
6.32 Consistent with the findings of Table 6.5, the movers from secondary schools reported that exam results of the new school were an important attraction. In contrast and echoing Table 6.6, Key Stage results appear to have mattered little in the moves of primary teachers, who were principally concerned that the new school should have an appropriate age range and size. Age range was also important to the movers from secondary schools among whom having a sixth-form emerged as the second most important attraction. Secondary movers generally seemed more conscious of the performance of the school, taking account of the nature of the intake and Ofsted assessment as well as the pupils’ exam results. Whether the school had participated in recent government schemes did not seem of great importance, though a minority took account of whether the school was an Investor in People. Single-sex or mixed intakes mattered to about one in seven secondary movers, but only about half as many rated religious affiliation as ‘of great importance’.
Incentives to Stay 6.33 As well as the attraction of the new school we also explored whether the old school
had attempted to retain the movers. We asked the respondents whether they had been offered any incentives to stay in the post they were vacating, and also whether anything would have induced them to stay. Table 6.13 shows that little more than one in twenty of the teachers on full-time permanent contracts were offered an incentive, with the proportion being similar in the primary and secondary phases.
Table 6.13: Incentives to Stay Per Cent Offered
Incentive Primary Secondary All
Yes 6.6 6.9 6.8 No 93.4 93.1 93.2 Base1 196 394 590
1. Teachers moving from full-time permanent contracts.
6.34 Teachers saying ‘yes’ were asked also to give the details. Of the 13 movers from primary schools, seven were offered an additional allowance, four more responsibility, and one each additional support and improved facilities. The offers to the movers from secondary schools were similar: of the 27, 14 were offered additional allowances, nine more responsibility and four additional support.
6.35 Over half could have been induced to stay. Table 6.14 shows what the movers mentioned first in response to an open-ended question. We have included all the movers, not just those from permanent full-time contracts as in previous tables, which brings out that a major inducement to stay would have been the offer of a permanent contract. Expressed as a percentage of those on fixed-term contracts, it emerges that nearly 40 per cent would have stayed if offered something permanent.
6.36 The possible inducements matched to a large extent the incentives offered, which suggests that the schools could have retained more of the leavers had they wished and had they the means available. Approaching one in five of the movers would have stayed if offered an additional allowance, particularly those from secondary schools, and nearly 8 per cent would have remained for more responsibility. About
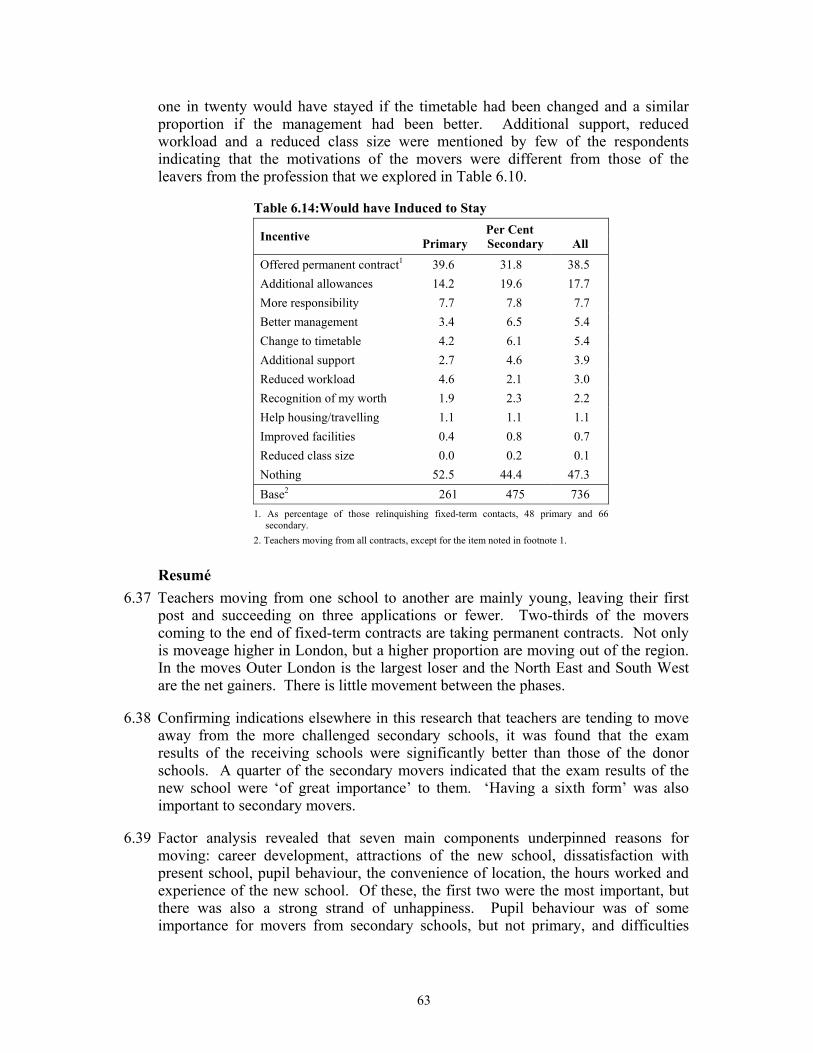
63
one in twenty would have stayed if the timetable had been changed and a similar proportion if the management had been better. Additional support, reduced workload and a reduced class size were mentioned by few of the respondents indicating that the motivations of the movers were different from those of the leavers from the profession that we explored in Table 6.10.
Table 6.14:Would have Induced to Stay Per Cent Incentive Primary Secondary All
Offered permanent contract1 39.6 31.8 38.5 Additional allowances 14.2 19.6 17.7 More responsibility 7.7 7.8 7.7 Better management 3.4 6.5 5.4 Change to timetable 4.2 6.1 5.4 Additional support 2.7 4.6 3.9 Reduced workload 4.6 2.1 3.0 Recognition of my worth 1.9 2.3 2.2 Help housing/travelling 1.1 1.1 1.1 Improved facilities 0.4 0.8 0.7 Reduced class size 0.0 0.2 0.1 Nothing 52.5 44.4 47.3 Base2 261 475 736
1. As percentage of those relinquishing fixed-term contacts, 48 primary and 66 secondary.
2. Teachers moving from all contracts, except for the item noted in footnote 1.
Resumé 6.37 Teachers moving from one school to another are mainly young, leaving their first
post and succeeding on three applications or fewer. Two-thirds of the movers coming to the end of fixed-term contracts are taking permanent contracts. Not only is moveage higher in London, but a higher proportion are moving out of the region. In the moves Outer London is the largest loser and the North East and South West are the net gainers. There is little movement between the phases.
6.38 Confirming indications elsewhere in this research that teachers are tending to move away from the more challenged secondary schools, it was found that the exam results of the receiving schools were significantly better than those of the donor schools. A quarter of the secondary movers indicated that the exam results of the new school were ‘of great importance’ to them. ‘Having a sixth form’ was also important to secondary movers.
6.39 Factor analysis revealed that seven main components underpinned reasons for moving: career development, attractions of the new school, dissatisfaction with present school, pupil behaviour, the convenience of location, the hours worked and experience of the new school. Of these, the first two were the most important, but there was also a strong strand of unhappiness. Pupil behaviour was of some importance for movers from secondary schools, but not primary, and difficulties
64
with parents did not loom large for either. The location and hours available weighed heavily with particular teachers, but these factors were less important generally.
6.40 In contrast to the leavers studied in 2002, the movers were changing schools mainly for positive reasons, such as career prospects and a higher salary. The main reasons for quitting the profession - workload and pupil behaviour – were way down the movers’ list. Dissatisfaction with the way the school is run played a greater part in teachers moving to another school than in leaving the profession.
6.41 Just over one in twenty of the movers had been offered an incentive to stay, but nearly half could have been induced to stay. Nearly 40 per cent of those on fixed-term contracts would have stayed if they had been offered a permanent post. The main incentives offered were additional allowances and more responsibility, and these were also seen as attractive inducements suggesting that more would have liked to have received an offer than did so.
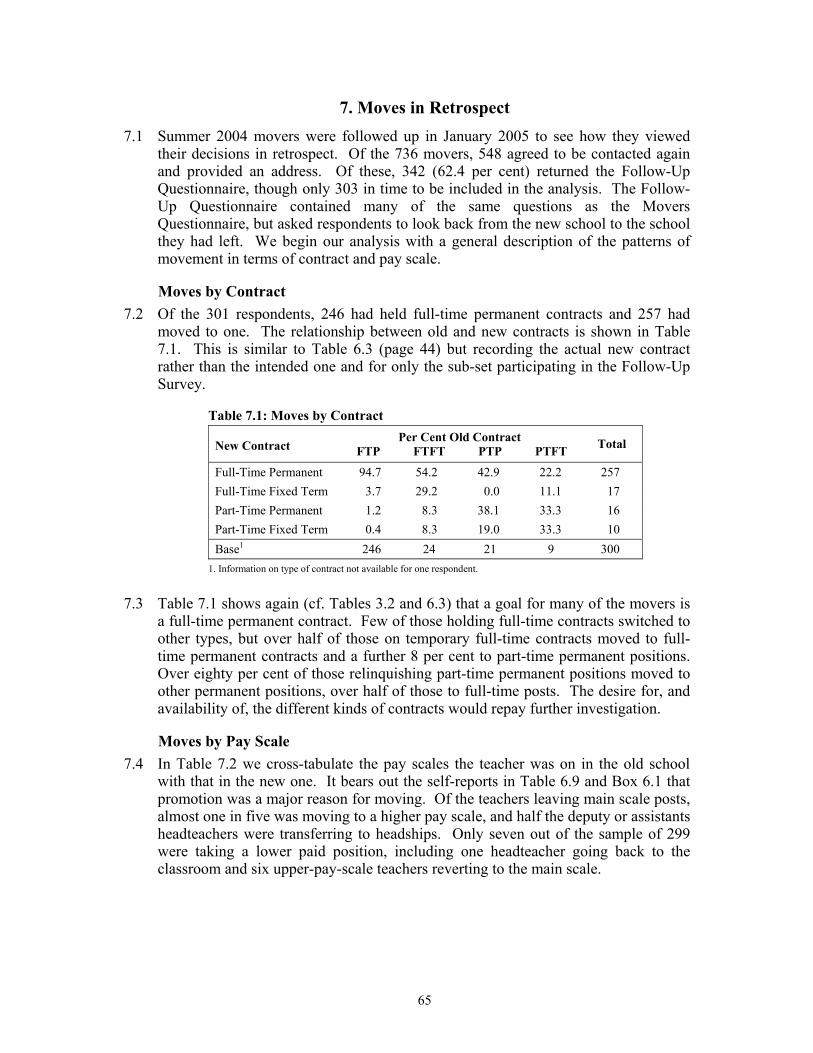
65
7. Moves in Retrospect 7.1 Summer 2004 movers were followed up in January 2005 to see how they viewed
their decisions in retrospect. Of the 736 movers, 548 agreed to be contacted again and provided an address. Of these, 342 (62.4 per cent) returned the Follow-Up Questionnaire, though only 303 in time to be included in the analysis. The Follow-Up Questionnaire contained many of the same questions as the Movers Questionnaire, but asked respondents to look back from the new school to the school they had left. We begin our analysis with a general description of the patterns of movement in terms of contract and pay scale.
Moves by Contract 7.2 Of the 301 respondents, 246 had held full-time permanent contracts and 257 had
moved to one. The relationship between old and new contracts is shown in Table 7.1. This is similar to Table 6.3 (page 44) but recording the actual new contract rather than the intended one and for only the sub-set participating in the Follow-Up Survey.
Table 7.1: Moves by Contract Per Cent Old Contract
New Contract FTP FTFT PTP PTFT Total
Full-Time Permanent 94.7 54.2 42.9 22.2 257 Full-Time Fixed Term 3.7 29.2 0.0 11.1 17 Part-Time Permanent 1.2 8.3 38.1 33.3 16 Part-Time Fixed Term 0.4 8.3 19.0 33.3 10 Base1 246 24 21 9 300
1. Information on type of contract not available for one respondent.
7.3 Table 7.1 shows again (cf. Tables 3.2 and 6.3) that a goal for many of the movers is a full-time permanent contract. Few of those holding full-time contracts switched to other types, but over half of those on temporary full-time contracts moved to full-time permanent contracts and a further 8 per cent to part-time permanent positions. Over eighty per cent of those relinquishing part-time permanent positions moved to other permanent positions, over half of those to full-time posts. The desire for, and availability of, the different kinds of contracts would repay further investigation.
Moves by Pay Scale 7.4 In Table 7.2 we cross-tabulate the pay scales the teacher was on in the old school
with that in the new one. It bears out the self-reports in Table 6.9 and Box 6.1 that promotion was a major reason for moving. Of the teachers leaving main scale posts, almost one in five was moving to a higher pay scale, and half the deputy or assistants headteachers were transferring to headships. Only seven out of the sample of 299 were taking a lower paid position, including one headteacher going back to the classroom and six upper-pay-scale teachers reverting to the main scale.
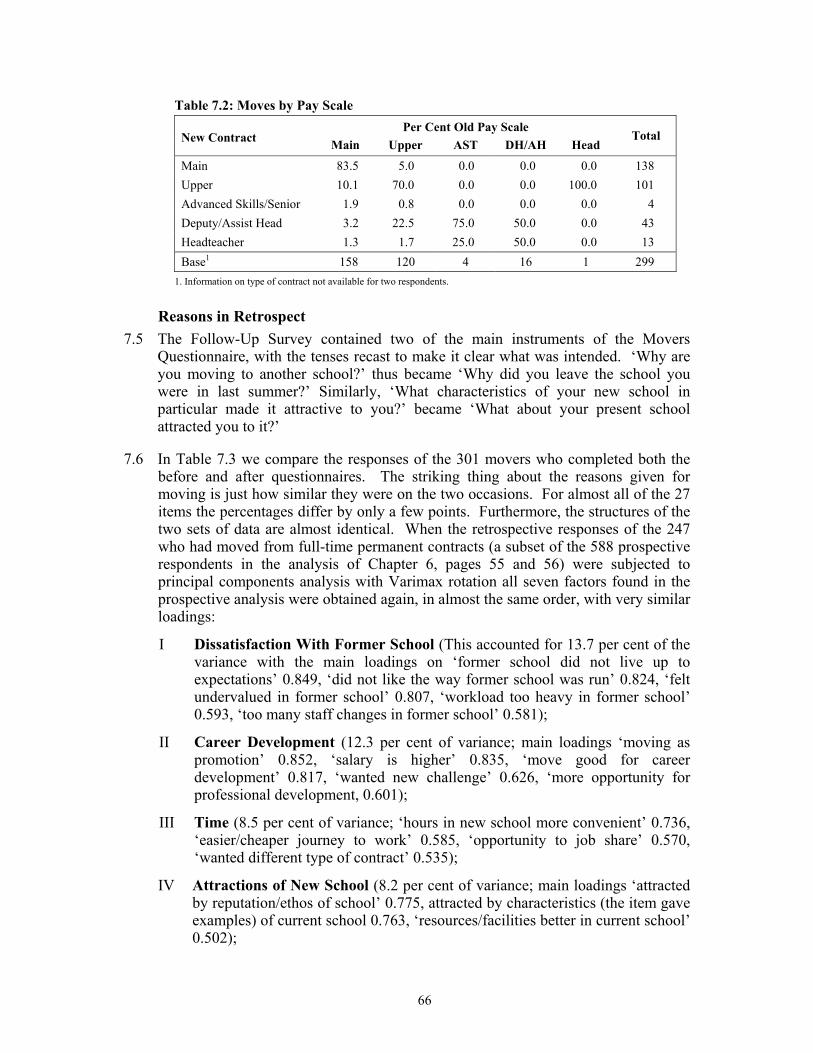
66
Table 7.2: Moves by Pay Scale Per Cent Old Pay Scale
New Contract Main Upper AST DH/AH Head Total
Main 83.5 5.0 0.0 0.0 0.0 138 Upper 10.1 70.0 0.0 0.0 100.0 101 Advanced Skills/Senior 1.9 0.8 0.0 0.0 0.0 4 Deputy/Assist Head 3.2 22.5 75.0 50.0 0.0 43 Headteacher 1.3 1.7 25.0 50.0 0.0 13 Base1 158 120 4 16 1 299
1. Information on type of contract not available for two respondents.
Reasons in Retrospect 7.5 The Follow-Up Survey contained two of the main instruments of the Movers
Questionnaire, with the tenses recast to make it clear what was intended. ‘Why are you moving to another school?’ thus became ‘Why did you leave the school you were in last summer?’ Similarly, ‘What characteristics of your new school in particular made it attractive to you?’ became ‘What about your present school attracted you to it?’
7.6 In Table 7.3 we compare the responses of the 301 movers who completed both the before and after questionnaires. The striking thing about the reasons given for moving is just how similar they were on the two occasions. For almost all of the 27 items the percentages differ by only a few points. Furthermore, the structures of the two sets of data are almost identical. When the retrospective responses of the 247 who had moved from full-time permanent contracts (a subset of the 588 prospective respondents in the analysis of Chapter 6, pages 55 and 56) were subjected to principal components analysis with Varimax rotation all seven factors found in the prospective analysis were obtained again, in almost the same order, with very similar loadings:
I Dissatisfaction With Former School (This accounted for 13.7 per cent of the variance with the main loadings on ‘former school did not live up to expectations’ 0.849, ‘did not like the way former school was run’ 0.824, ‘felt undervalued in former school’ 0.807, ‘workload too heavy in former school’ 0.593, ‘too many staff changes in former school’ 0.581);
II Career Development (12.3 per cent of variance; main loadings ‘moving as promotion’ 0.852, ‘salary is higher’ 0.835, ‘move good for career development’ 0.817, ‘wanted new challenge’ 0.626, ‘more opportunity for professional development, 0.601);
III Time (8.5 per cent of variance; ‘hours in new school more convenient’ 0.736, ‘easier/cheaper journey to work’ 0.585, ‘opportunity to job share’ 0.570, ‘wanted different type of contract’ 0.535);
IV Attractions of New School (8.2 per cent of variance; main loadings ‘attracted by reputation/ethos of school’ 0.775, attracted by characteristics (the item gave examples) of current school 0.763, ‘resources/facilities better in current school’ 0.502);
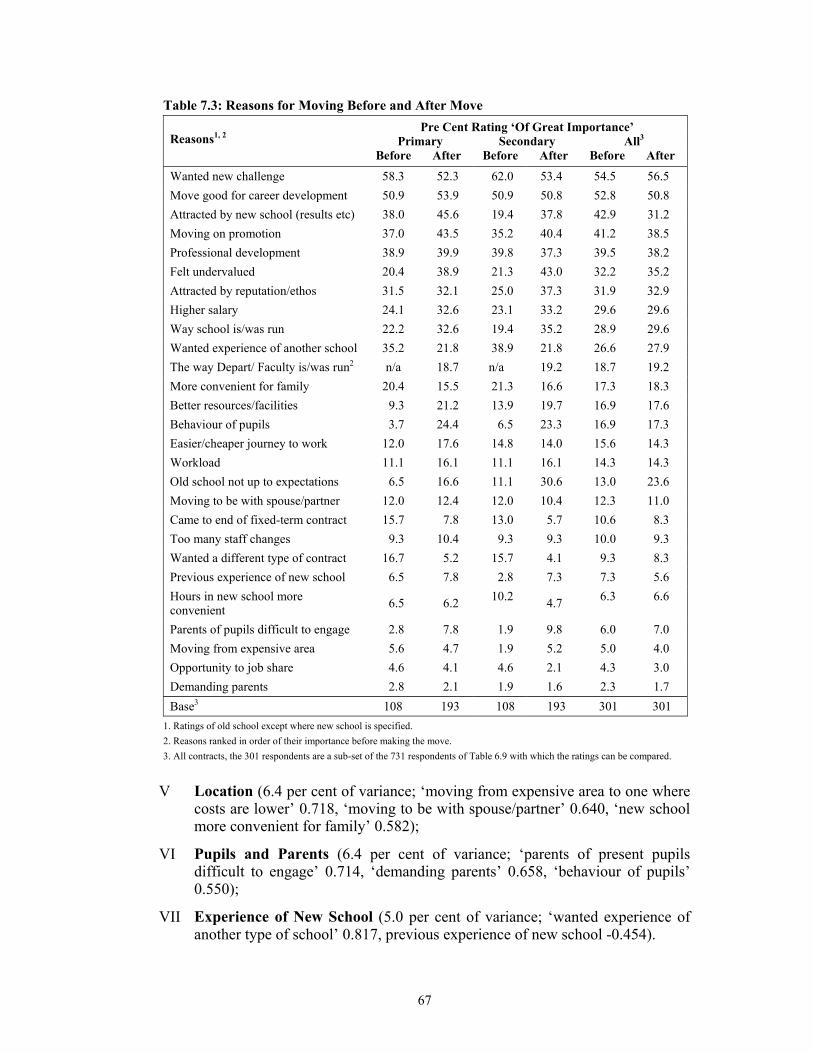
67
Table 7.3: Reasons for Moving Before and After Move Pre Cent Rating ‘Of Great Importance’
Primary Secondary All3 Reasons1, 2 Before After Before After Before After
Wanted new challenge 58.3 52.3 62.0 53.4 54.5 56.5 Move good for career development 50.9 53.9 50.9 50.8 52.8 50.8 Attracted by new school (results etc) 38.0 45.6 19.4 37.8 42.9 31.2 Moving on promotion 37.0 43.5 35.2 40.4 41.2 38.5 Professional development 38.9 39.9 39.8 37.3 39.5 38.2 Felt undervalued 20.4 38.9 21.3 43.0 32.2 35.2 Attracted by reputation/ethos 31.5 32.1 25.0 37.3 31.9 32.9 Higher salary 24.1 32.6 23.1 33.2 29.6 29.6 Way school is/was run 22.2 32.6 19.4 35.2 28.9 29.6 Wanted experience of another school 35.2 21.8 38.9 21.8 26.6 27.9 The way Depart/ Faculty is/was run2 n/a 18.7 n/a 19.2 18.7 19.2 More convenient for family 20.4 15.5 21.3 16.6 17.3 18.3 Better resources/facilities 9.3 21.2 13.9 19.7 16.9 17.6 Behaviour of pupils 3.7 24.4 6.5 23.3 16.9 17.3 Easier/cheaper journey to work 12.0 17.6 14.8 14.0 15.6 14.3 Workload 11.1 16.1 11.1 16.1 14.3 14.3 Old school not up to expectations 6.5 16.6 11.1 30.6 13.0 23.6 Moving to be with spouse/partner 12.0 12.4 12.0 10.4 12.3 11.0 Came to end of fixed-term contract 15.7 7.8 13.0 5.7 10.6 8.3 Too many staff changes 9.3 10.4 9.3 9.3 10.0 9.3 Wanted a different type of contract 16.7 5.2 15.7 4.1 9.3 8.3 Previous experience of new school 6.5 7.8 2.8 7.3 7.3 5.6 Hours in new school more convenient 6.5 6.2 10.2 4.7 6.3 6.6
Parents of pupils difficult to engage 2.8 7.8 1.9 9.8 6.0 7.0 Moving from expensive area 5.6 4.7 1.9 5.2 5.0 4.0 Opportunity to job share 4.6 4.1 4.6 2.1 4.3 3.0 Demanding parents 2.8 2.1 1.9 1.6 2.3 1.7 Base3 108 193 108 193 301 301
1. Ratings of old school except where new school is specified. 2. Reasons ranked in order of their importance before making the move. 3. All contracts, the 301 respondents are a sub-set of the 731 respondents of Table 6.9 with which the ratings can be compared.
V Location (6.4 per cent of variance; ‘moving from expensive area to one where costs are lower’ 0.718, ‘moving to be with spouse/partner’ 0.640, ‘new school more convenient for family’ 0.582);
VI Pupils and Parents (6.4 per cent of variance; ‘parents of present pupils difficult to engage’ 0.714, ‘demanding parents’ 0.658, ‘behaviour of pupils’ 0.550);
VII Experience of New School (5.0 per cent of variance; ‘wanted experience of another type of school’ 0.817, previous experience of new school -0.454).

68
The only slight redistribution in the loadings was between the factors centred on the convenience of the new school in terms of time and location which we have previously combined in Box 6.5. The stability in both the pattern of replies and the pre- and post-factor structure encourages us to believe that our measure is genuinely tapping into the motivations of the movers.
7.7 The only two items of Table 7.3 where there was some change are ‘attracted by the characteristics (for example, size, age range, religious affiliation, test/exam results) of the school’ and ‘former school did not live up to expectations’, with a drop of about ten points in the former and a rise of about ten point in the latter. Both changes are understandable in the light of the movers once having experienced their new schools being in a better position to appraise the respective advantages. The new school will have been viewed more realistically and the old school will, in many cases, have been contrasted with something seen as preferable. We can explore this further looking at the before and after responses on the ‘attractions’ measure.
Attractions in Retrospect 7.8 Table 7.4 reports the attractions of the new school both as perceived in prospect and
after having been there for six months. Again there is on most items very good agreement between the before and after ratings within the phases and overall.
Table 7.4: Attractions of New School Before and After Move Pre Cent Rating ‘Of Great Importance’
Primary Secondary All Attraction Before After Before After Before After
Age range 44.2 53.8 40.4 47.3 41.8 49.7 Has sixth form n/a n/a 41.5 38.8 41.5 38.8 Specialism n/a n/a 23.4 23.9 23.4 23.9 Type (eg grammar, comprehensive) n/a n/a 22.3 16.5 22.3 16.5 Key Stage/Exam results 4.8 5.8 28.2 23.4 19.9 17.1 Size 21.2 10.6 18.6 11.7 19.5 11.3 Pupil intake 9.6 11.5 21.8 17.0 17.5 15.1 Single sex or mixed n/a n/a 14.9 17.6 14.9 17.6 Ofsted Rating 4.8 6.7 18.1 18.6 13.4 14.4 Investor in People 5.8 5.8 12.8 8.5 10.3 7.5 Religious affiliation 8.7 4.8 8.0 6.4 8.2 5.8 Holds Leading Edge status n/a n/a 4.8 2.7 4.8 2.7 Funding category (eg community, voluntary aided, foundation) 0.0 1.0 3.7 1.1 2.4 1.0
Included in Excellence in Cities 0.0 1.9 3.7 2.1 2.4 2.1 Eligible for Leadership Incentive Grant n/a n/a 1.6 2.7 1.6 2.7 Base1 104 104 188 188 292 292
1. All contracts, of the 301 potential respondents 4 primary movers and 5 secondary did not rate all the items before and after moving school.
Assessment of the Move 7.9 In so far as there appear to be changes, the age range in the school becomes more
important both in primary and secondary, but the size seems to matter less in both.
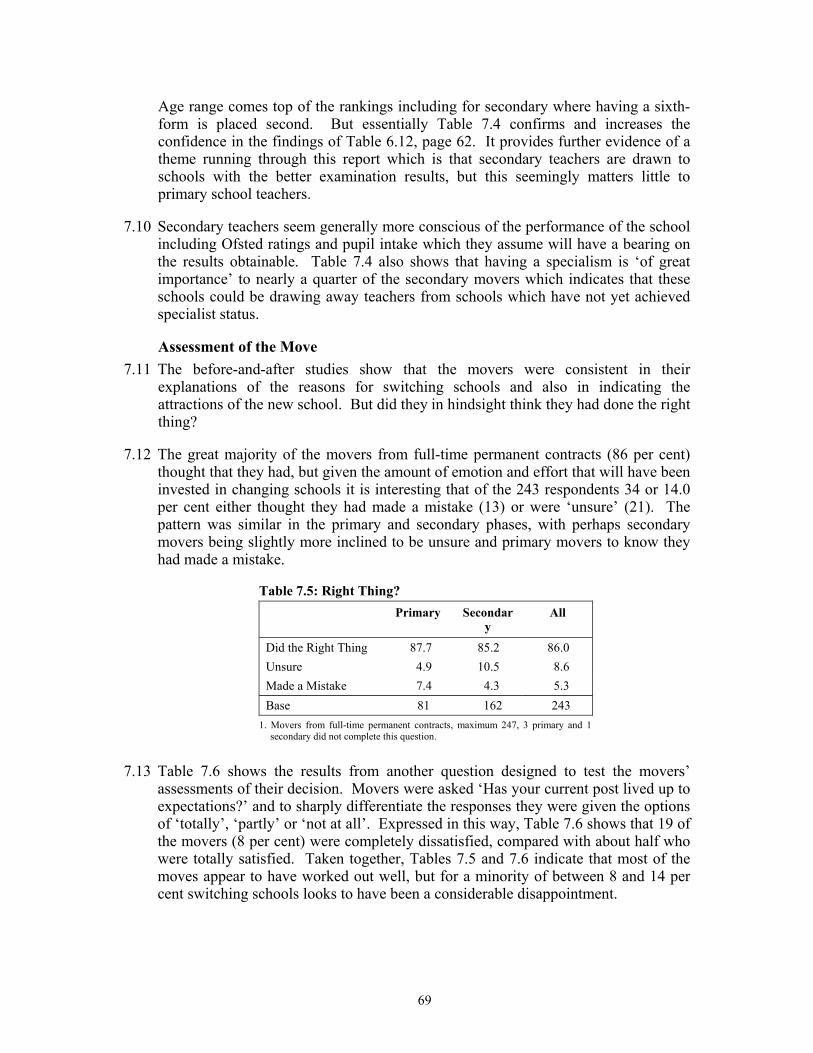
69
Age range comes top of the rankings including for secondary where having a sixth-form is placed second. But essentially Table 7.4 confirms and increases the confidence in the findings of Table 6.12, page 62. It provides further evidence of a theme running through this report which is that secondary teachers are drawn to schools with the better examination results, but this seemingly matters little to primary school teachers.
7.10 Secondary teachers seem generally more conscious of the performance of the school including Ofsted ratings and pupil intake which they assume will have a bearing on the results obtainable. Table 7.4 also shows that having a specialism is ‘of great importance’ to nearly a quarter of the secondary movers which indicates that these schools could be drawing away teachers from schools which have not yet achieved specialist status.
Assessment of the Move 7.11 The before-and-after studies show that the movers were consistent in their
explanations of the reasons for switching schools and also in indicating the attractions of the new school. But did they in hindsight think they had done the right thing?
7.12 The great majority of the movers from full-time permanent contracts (86 per cent) thought that they had, but given the amount of emotion and effort that will have been invested in changing schools it is interesting that of the 243 respondents 34 or 14.0 per cent either thought they had made a mistake (13) or were ‘unsure’ (21). The pattern was similar in the primary and secondary phases, with perhaps secondary movers being slightly more inclined to be unsure and primary movers to know they had made a mistake.
Table 7.5: Right Thing? Primary Secondar
y All
Did the Right Thing 87.7 85.2 86.0 Unsure 4.9 10.5 8.6 Made a Mistake 7.4 4.3 5.3 Base 81 162 243
1. Movers from full-time permanent contracts, maximum 247, 3 primary and 1 secondary did not complete this question.
7.13 Table 7.6 shows the results from another question designed to test the movers’ assessments of their decision. Movers were asked ‘Has your current post lived up to expectations?’ and to sharply differentiate the responses they were given the options of ‘totally’, ‘partly’ or ‘not at all’. Expressed in this way, Table 7.6 shows that 19 of the movers (8 per cent) were completely dissatisfied, compared with about half who were totally satisfied. Taken together, Tables 7.5 and 7.6 indicate that most of the moves appear to have worked out well, but for a minority of between 8 and 14 per cent switching schools looks to have been a considerable disappointment.
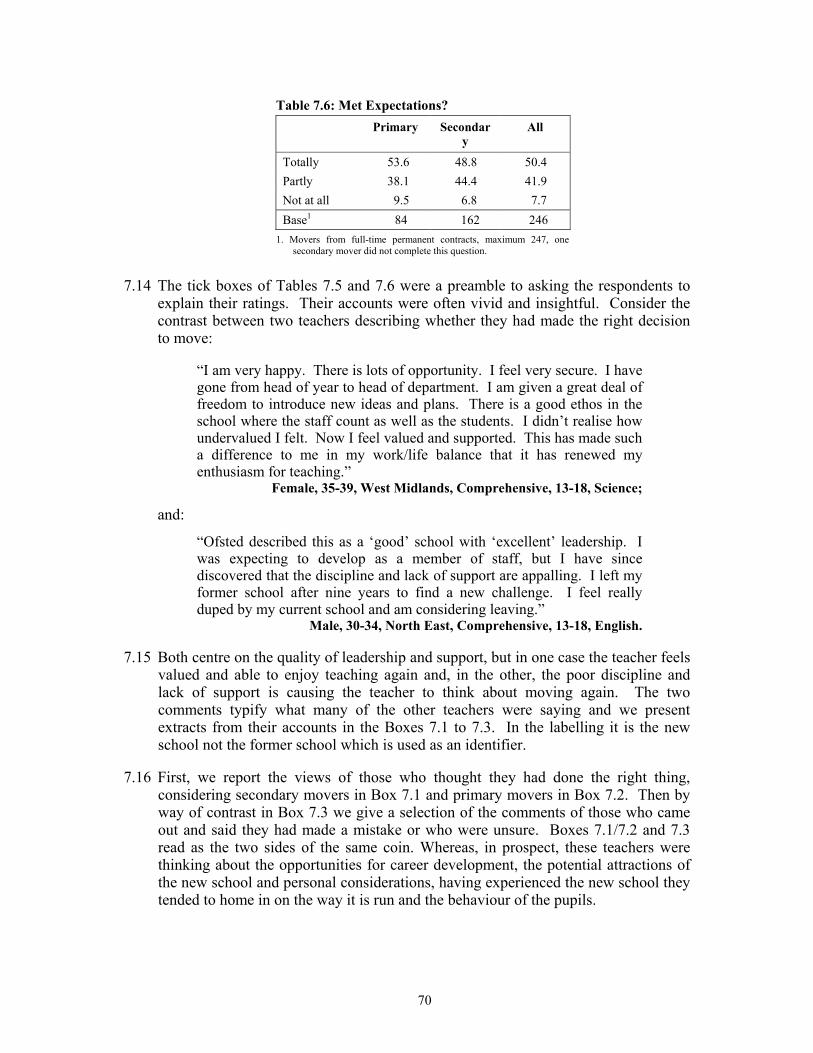
70
Table 7.6: Met Expectations? Primary Secondar
y All
Totally 53.6 48.8 50.4 Partly 38.1 44.4 41.9 Not at all 9.5 6.8 7.7 Base1 84 162 246
1. Movers from full-time permanent contracts, maximum 247, one secondary mover did not complete this question.
7.14 The tick boxes of Tables 7.5 and 7.6 were a preamble to asking the respondents to explain their ratings. Their accounts were often vivid and insightful. Consider the contrast between two teachers describing whether they had made the right decision to move:
“I am very happy. There is lots of opportunity. I feel very secure. I have gone from head of year to head of department. I am given a great deal of freedom to introduce new ideas and plans. There is a good ethos in the school where the staff count as well as the students. I didn’t realise how undervalued I felt. Now I feel valued and supported. This has made such a difference to me in my work/life balance that it has renewed my enthusiasm for teaching.”
Female, 35-39, West Midlands, Comprehensive, 13-18, Science;
and:
“Ofsted described this as a ‘good’ school with ‘excellent’ leadership. I was expecting to develop as a member of staff, but I have since discovered that the discipline and lack of support are appalling. I left my former school after nine years to find a new challenge. I feel really duped by my current school and am considering leaving.”
Male, 30-34, North East, Comprehensive, 13-18, English.
7.15 Both centre on the quality of leadership and support, but in one case the teacher feels valued and able to enjoy teaching again and, in the other, the poor discipline and lack of support is causing the teacher to think about moving again. The two comments typify what many of the other teachers were saying and we present extracts from their accounts in the Boxes 7.1 to 7.3. In the labelling it is the new school not the former school which is used as an identifier.
7.16 First, we report the views of those who thought they had done the right thing, considering secondary movers in Box 7.1 and primary movers in Box 7.2. Then by way of contrast in Box 7.3 we give a selection of the comments of those who came out and said they had made a mistake or who were unsure. Boxes 7.1/7.2 and 7.3 read as the two sides of the same coin. Whereas, in prospect, these teachers were thinking about the opportunities for career development, the potential attractions of the new school and personal considerations, having experienced the new school they tended to home in on the way it is run and the behaviour of the pupils.
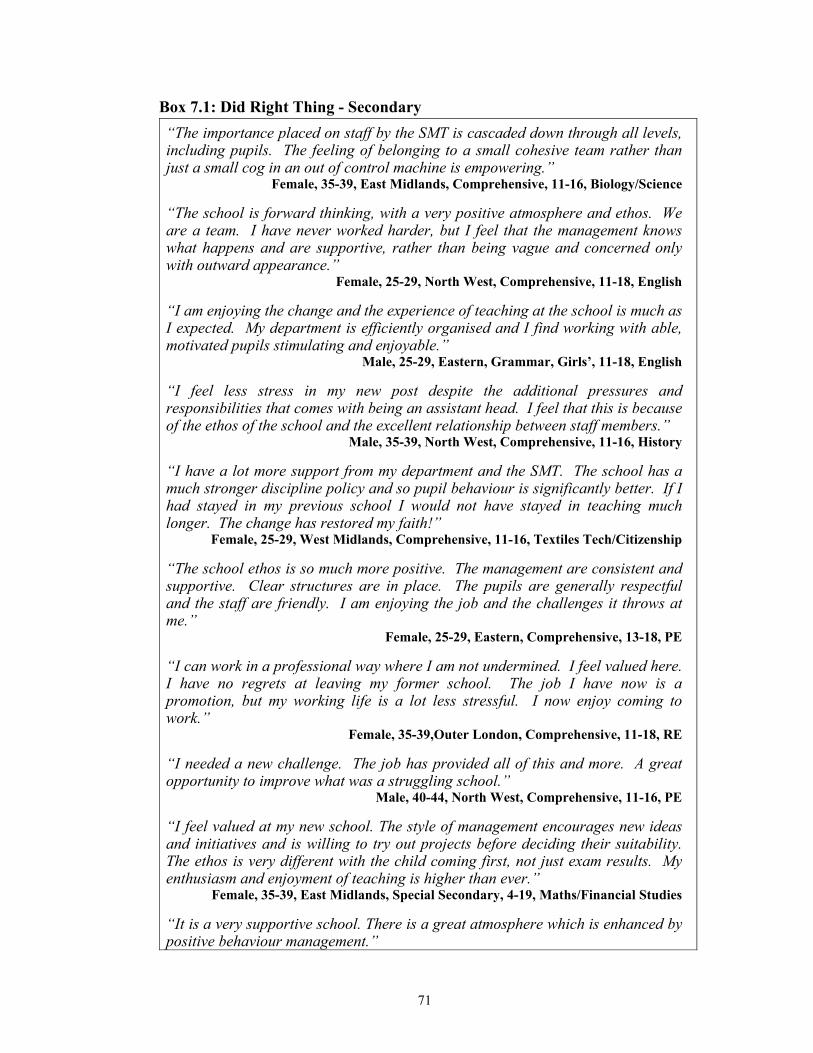
71
Box 7.1: Did Right Thing - Secondary “The importance placed on staff by the SMT is cascaded down through all levels, including pupils. The feeling of belonging to a small cohesive team rather than just a small cog in an out of control machine is empowering.”
Female, 35-39, East Midlands, Comprehensive, 11-16, Biology/Science
“The school is forward thinking, with a very positive atmosphere and ethos. We are a team. I have never worked harder, but I feel that the management knows what happens and are supportive, rather than being vague and concerned only with outward appearance.”
Female, 25-29, North West, Comprehensive, 11-18, English
“I am enjoying the change and the experience of teaching at the school is much as I expected. My department is efficiently organised and I find working with able, motivated pupils stimulating and enjoyable.”
Male, 25-29, Eastern, Grammar, Girls’, 11-18, English
“I feel less stress in my new post despite the additional pressures and responsibilities that comes with being an assistant head. I feel that this is because of the ethos of the school and the excellent relationship between staff members.”
Male, 35-39, North West, Comprehensive, 11-16, History
“I have a lot more support from my department and the SMT. The school has a much stronger discipline policy and so pupil behaviour is significantly better. If I had stayed in my previous school I would not have stayed in teaching much longer. The change has restored my faith!”
Female, 25-29, West Midlands, Comprehensive, 11-16, Textiles Tech/Citizenship
“The school ethos is so much more positive. The management are consistent and supportive. Clear structures are in place. The pupils are generally respectful and the staff are friendly. I am enjoying the job and the challenges it throws at me.”
Female, 25-29, Eastern, Comprehensive, 13-18, PE
“I can work in a professional way where I am not undermined. I feel valued here. I have no regrets at leaving my former school. The job I have now is a promotion, but my working life is a lot less stressful. I now enjoy coming to work.”
Female, 35-39,Outer London, Comprehensive, 11-18, RE
“I needed a new challenge. The job has provided all of this and more. A great opportunity to improve what was a struggling school.”
Male, 40-44, North West, Comprehensive, 11-16, PE
“I feel valued at my new school. The style of management encourages new ideas and initiatives and is willing to try out projects before deciding their suitability. The ethos is very different with the child coming first, not just exam results. My enthusiasm and enjoyment of teaching is higher than ever.”
Female, 35-39, East Midlands, Special Secondary, 4-19, Maths/Financial Studies
“It is a very supportive school. There is a great atmosphere which is enhanced by positive behaviour management.”

72
Female, 45-49, Outer London, Comprehensive, PSHE
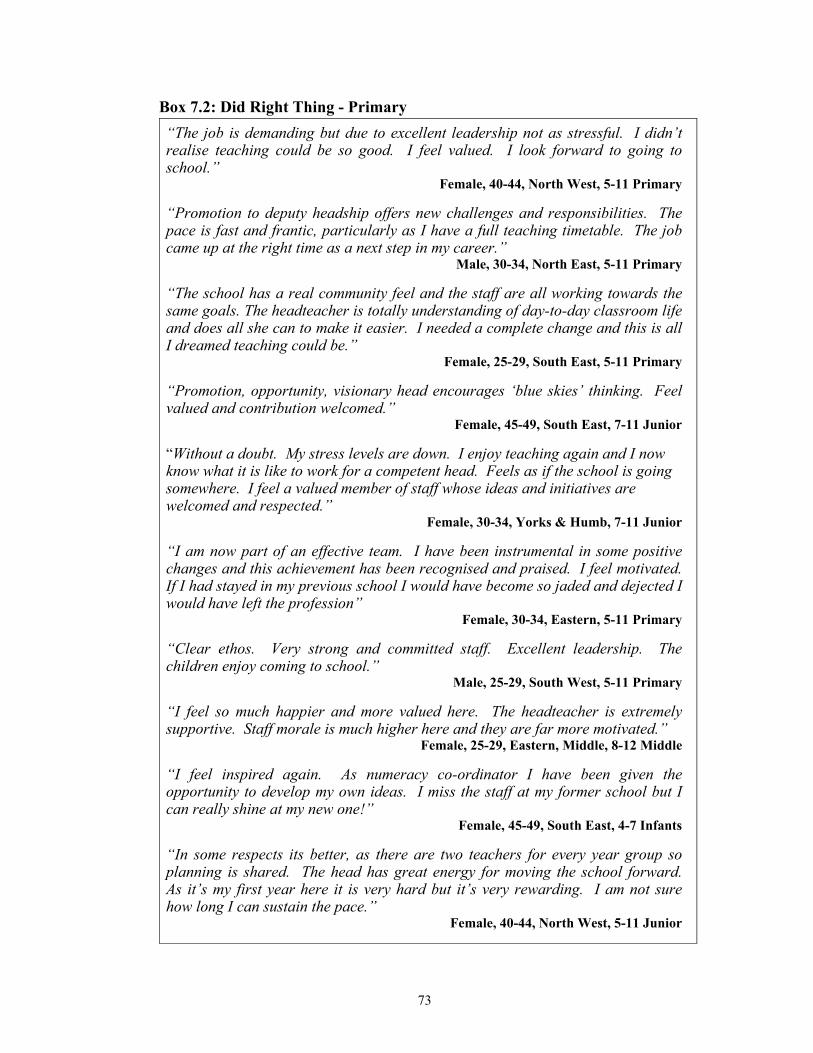
73
Box 7.2: Did Right Thing - Primary “The job is demanding but due to excellent leadership not as stressful. I didn’t realise teaching could be so good. I feel valued. I look forward to going to school.”
Female, 40-44, North West, 5-11 Primary
“Promotion to deputy headship offers new challenges and responsibilities. The pace is fast and frantic, particularly as I have a full teaching timetable. The job came up at the right time as a next step in my career.”
Male, 30-34, North East, 5-11 Primary
“The school has a real community feel and the staff are all working towards the same goals. The headteacher is totally understanding of day-to-day classroom life and does all she can to make it easier. I needed a complete change and this is all I dreamed teaching could be.”
Female, 25-29, South East, 5-11 Primary
“Promotion, opportunity, visionary head encourages ‘blue skies’ thinking. Feel valued and contribution welcomed.”
Female, 45-49, South East, 7-11 Junior
“Without a doubt. My stress levels are down. I enjoy teaching again and I now know what it is like to work for a competent head. Feels as if the school is going somewhere. I feel a valued member of staff whose ideas and initiatives are welcomed and respected.”
Female, 30-34, Yorks & Humb, 7-11 Junior
“I am now part of an effective team. I have been instrumental in some positive changes and this achievement has been recognised and praised. I feel motivated. If I had stayed in my previous school I would have become so jaded and dejected I would have left the profession”
Female, 30-34, Eastern, 5-11 Primary
“Clear ethos. Very strong and committed staff. Excellent leadership. The children enjoy coming to school.”
Male, 25-29, South West, 5-11 Primary
“I feel so much happier and more valued here. The headteacher is extremely supportive. Staff morale is much higher here and they are far more motivated.”
Female, 25-29, Eastern, Middle, 8-12 Middle
“I feel inspired again. As numeracy co-ordinator I have been given the opportunity to develop my own ideas. I miss the staff at my former school but I can really shine at my new one!”
Female, 45-49, South East, 4-7 Infants
“In some respects its better, as there are two teachers for every year group so planning is shared. The head has great energy for moving the school forward. As it’s my first year here it is very hard but it’s very rewarding. I am not sure how long I can sustain the pace.”
Female, 40-44, North West, 5-11 Junior
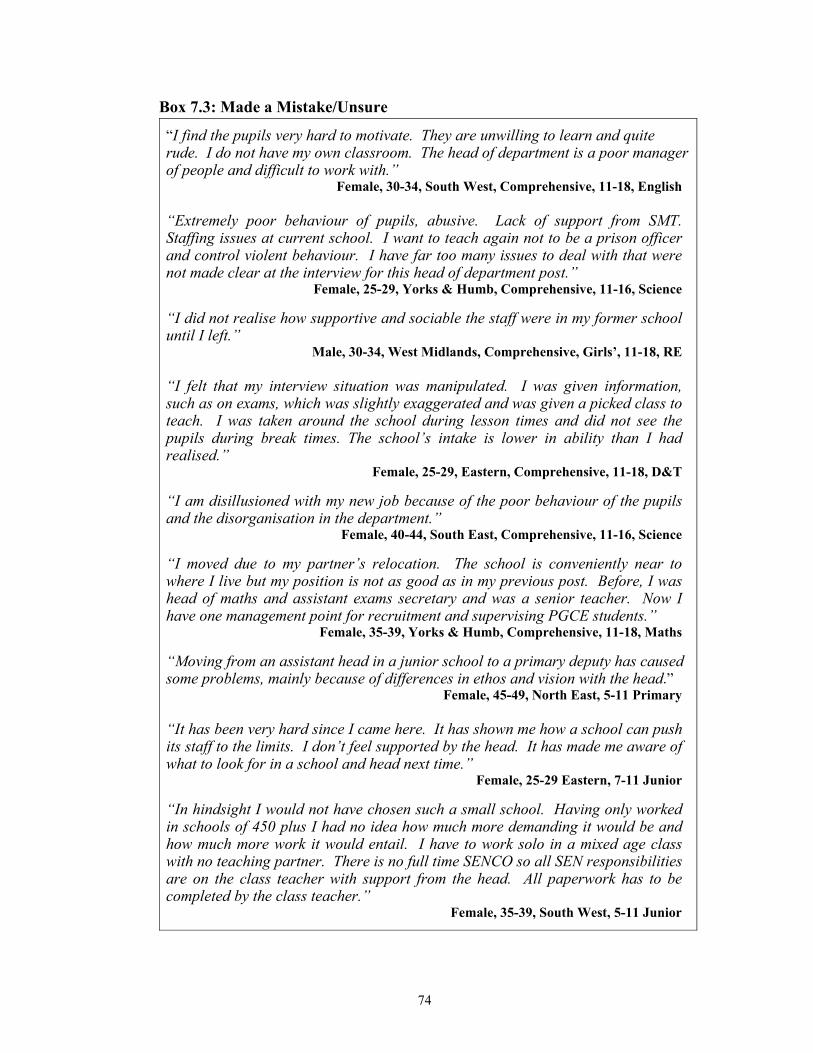
74
Box 7.3: Made a Mistake/Unsure
“I find the pupils very hard to motivate. They are unwilling to learn and quite rude. I do not have my own classroom. The head of department is a poor manager of people and difficult to work with.”
Female, 30-34, South West, Comprehensive, 11-18, English
“Extremely poor behaviour of pupils, abusive. Lack of support from SMT. Staffing issues at current school. I want to teach again not to be a prison officer and control violent behaviour. I have far too many issues to deal with that were not made clear at the interview for this head of department post.”
Female, 25-29, Yorks & Humb, Comprehensive, 11-16, Science
“I did not realise how supportive and sociable the staff were in my former school until I left.”
Male, 30-34, West Midlands, Comprehensive, Girls’, 11-18, RE
“I felt that my interview situation was manipulated. I was given information, such as on exams, which was slightly exaggerated and was given a picked class to teach. I was taken around the school during lesson times and did not see the pupils during break times. The school’s intake is lower in ability than I had realised.”
Female, 25-29, Eastern, Comprehensive, 11-18, D&T
“I am disillusioned with my new job because of the poor behaviour of the pupils and the disorganisation in the department.”
Female, 40-44, South East, Comprehensive, 11-16, Science
“I moved due to my partner’s relocation. The school is conveniently near to where I live but my position is not as good as in my previous post. Before, I was head of maths and assistant exams secretary and was a senior teacher. Now I have one management point for recruitment and supervising PGCE students.”
Female, 35-39, Yorks & Humb, Comprehensive, 11-18, Maths
“Moving from an assistant head in a junior school to a primary deputy has caused some problems, mainly because of differences in ethos and vision with the head.”
Female, 45-49, North East, 5-11 Primary
“It has been very hard since I came here. It has shown me how a school can push its staff to the limits. I don’t feel supported by the head. It has made me aware of what to look for in a school and head next time.”
Female, 25-29 Eastern, 7-11 Junior
“In hindsight I would not have chosen such a small school. Having only worked in schools of 450 plus I had no idea how much more demanding it would be and how much more work it would entail. I have to work solo in a mixed age class with no teaching partner. There is no full time SENCO so all SEN responsibilities are on the class teacher with support from the head. All paperwork has to be completed by the class teacher.”
Female, 35-39, South West, 5-11 Junior
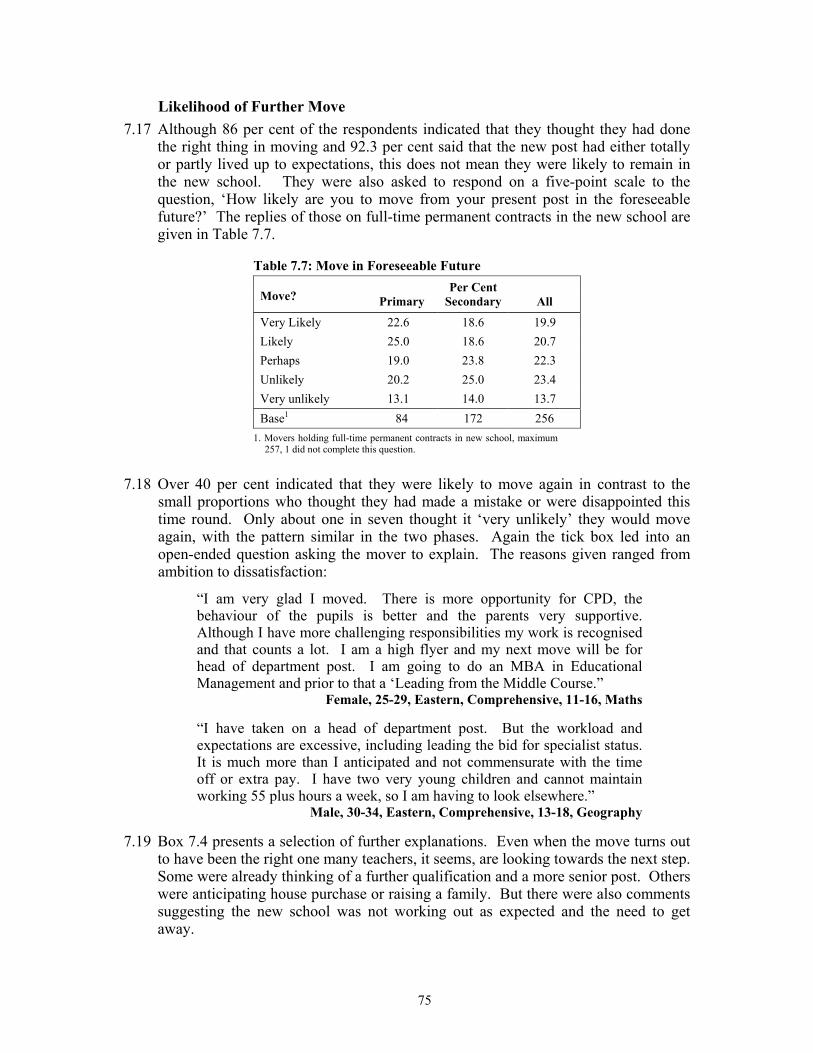
75
Likelihood of Further Move 7.17 Although 86 per cent of the respondents indicated that they thought they had done
the right thing in moving and 92.3 per cent said that the new post had either totally or partly lived up to expectations, this does not mean they were likely to remain in the new school. They were also asked to respond on a five-point scale to the question, ‘How likely are you to move from your present post in the foreseeable future?’ The replies of those on full-time permanent contracts in the new school are given in Table 7.7.
Table 7.7: Move in Foreseeable Future Per Cent
Move? Primary Secondary All
Very Likely 22.6 18.6 19.9 Likely 25.0 18.6 20.7 Perhaps 19.0 23.8 22.3 Unlikely 20.2 25.0 23.4 Very unlikely 13.1 14.0 13.7 Base1 84 172 256
1. Movers holding full-time permanent contracts in new school, maximum 257, 1 did not complete this question.
7.18 Over 40 per cent indicated that they were likely to move again in contrast to the small proportions who thought they had made a mistake or were disappointed this time round. Only about one in seven thought it ‘very unlikely’ they would move again, with the pattern similar in the two phases. Again the tick box led into an open-ended question asking the mover to explain. The reasons given ranged from ambition to dissatisfaction:
“I am very glad I moved. There is more opportunity for CPD, the behaviour of the pupils is better and the parents very supportive. Although I have more challenging responsibilities my work is recognised and that counts a lot. I am a high flyer and my next move will be for head of department post. I am going to do an MBA in Educational Management and prior to that a ‘Leading from the Middle Course.”
Female, 25-29, Eastern, Comprehensive, 11-16, Maths
“I have taken on a head of department post. But the workload and expectations are excessive, including leading the bid for specialist status. It is much more than I anticipated and not commensurate with the time off or extra pay. I have two very young children and cannot maintain working 55 plus hours a week, so I am having to look elsewhere.”
Male, 30-34, Eastern, Comprehensive, 13-18, Geography
7.19 Box 7.4 presents a selection of further explanations. Even when the move turns out to have been the right one many teachers, it seems, are looking towards the next step. Some were already thinking of a further qualification and a more senior post. Others were anticipating house purchase or raising a family. But there were also comments suggesting the new school was not working out as expected and the need to get away.
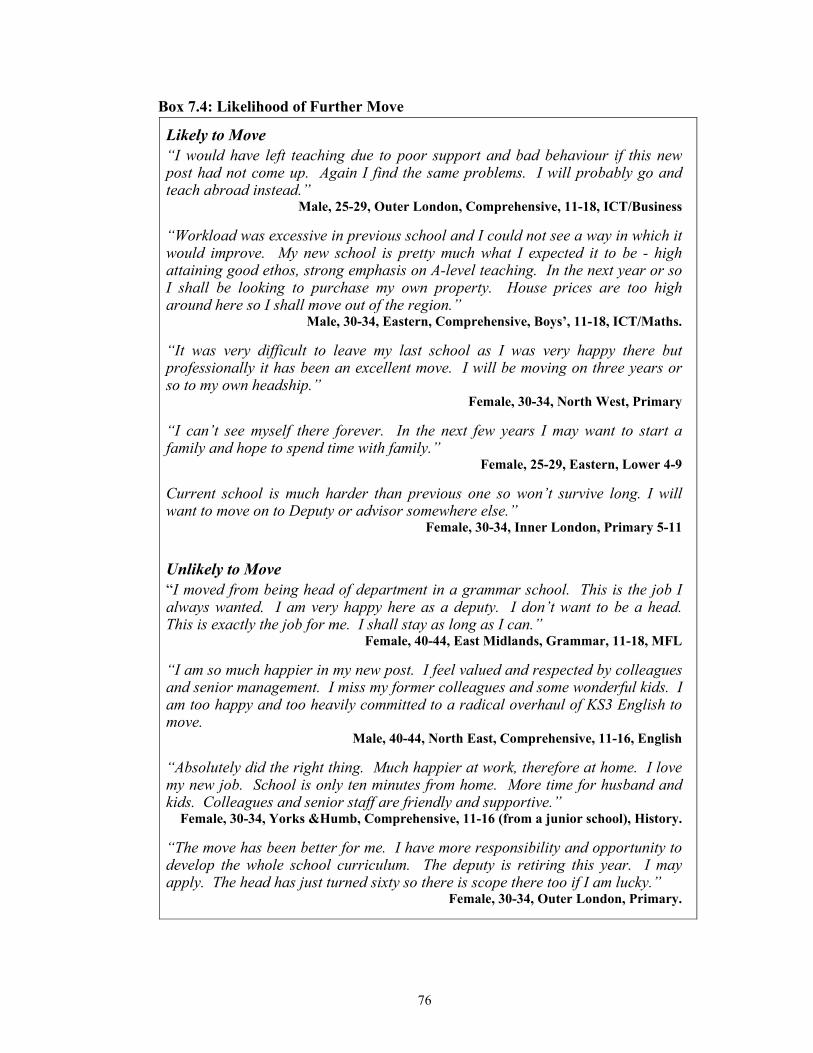
76
Box 7.4: Likelihood of Further Move
Likely to Move “I would have left teaching due to poor support and bad behaviour if this new post had not come up. Again I find the same problems. I will probably go and teach abroad instead.”
Male, 25-29, Outer London, Comprehensive, 11-18, ICT/Business
“Workload was excessive in previous school and I could not see a way in which it would improve. My new school is pretty much what I expected it to be - high attaining good ethos, strong emphasis on A-level teaching. In the next year or so I shall be looking to purchase my own property. House prices are too high around here so I shall move out of the region.”
Male, 30-34, Eastern, Comprehensive, Boys’, 11-18, ICT/Maths.
“It was very difficult to leave my last school as I was very happy there but professionally it has been an excellent move. I will be moving on three years or so to my own headship.”
Female, 30-34, North West, Primary
“I can’t see myself there forever. In the next few years I may want to start a family and hope to spend time with family.”
Female, 25-29, Eastern, Lower 4-9
Current school is much harder than previous one so won’t survive long. I will want to move on to Deputy or advisor somewhere else.”
Female, 30-34, Inner London, Primary 5-11
Unlikely to Move “I moved from being head of department in a grammar school. This is the job I always wanted. I am very happy here as a deputy. I don’t want to be a head. This is exactly the job for me. I shall stay as long as I can.”
Female, 40-44, East Midlands, Grammar, 11-18, MFL
“I am so much happier in my new post. I feel valued and respected by colleagues and senior management. I miss my former colleagues and some wonderful kids. I am too happy and too heavily committed to a radical overhaul of KS3 English to move.
Male, 40-44, North East, Comprehensive, 11-16, English
“Absolutely did the right thing. Much happier at work, therefore at home. I love my new job. School is only ten minutes from home. More time for husband and kids. Colleagues and senior staff are friendly and supportive.”
Female, 30-34, Yorks &Humb, Comprehensive, 11-16 (from a junior school), History.
“The move has been better for me. I have more responsibility and opportunity to develop the whole school curriculum. The deputy is retiring this year. I may apply. The head has just turned sixty so there is scope there too if I am lucky.”
Female, 30-34, Outer London, Primary.
77
7.20 Occasionally there is a comment like the first one in Box 7.4 which suggests that the teacher is unlikely to be happy in any school. In contrast, some teachers are so pleased with what they have found that they do not envisage a further move – “too happy and too heavily committed …to move”, as one teacher put it. Another is looking at what is happening above her and sizing up the likely chances of internal promotion. Those unlikely to look elsewhere again tend to be in the older age bands.
7.21 Teaching is a mobile profession with many opportunities. Raising the quality of school leadership, improving pupil discipline and addressing other concerns that cause teachers to want to get away from particular schools could well reduce wastage. But moveage is inherent in the profession.
Resumé 7.22 Comparing movers before and six months after switching schools reveals the reasons
given for moving, and also the attractions listed for the new school, to be very similar in prospect and retrospect which suggests that we can have confidence in the responses genuinely reflecting motivations. Two strong pulls toward the new posts were promotion and the offer of a full-time permanent contract.
7.23 The great majority of the teachers thought they had done the right thing in moving, but 14 per cent were unsure or felt they had made a mistake. What distinguished the two groups was mainly the quality of leadership and support they found in the new school. If it was good they felt valued and reinvigorated, but in some cases they feared they had been duped as regards leadership and pupil discipline.
7.24 Forty per cent of the movers were already envisaging the next move for career advancement or personal reasons such starting a family or buying a home. Addressing the concerns that lead to teachers leaving particular schools such as poor leadership, bad pupil behaviour and workload may help to minimize wastage, but turnover is an inherent part of the profession.
78
8. Policy Pointers 8.1 Our brief, as in previous years, has been to investigate, describe and analyze.
Nevertheless, it has been found useful for us to offer pointers as to the possible policy implications. In our first report (Smithers and Robinson, 2003) we identified seventeen pointers ranging from workload and pupil behaviour as major influences on teachers’ decisions to leave the profession through to suggesting which groups could most profitably be targeted to encourage to return.
8.2 In our second report which concentrated on loss at the school level (Smithers and Robinson, 2004a) we proposed a further seven pointers, some of which are developments of the original seventeen. In particular, in view of the greater turnover in the more challenged secondary schools, we suggested further consideration be given as to how to attract and retain good teachers in those schools. We also set out a number of differences between the primary and secondary phases and offered the thought that rather than lumping all schools and teachers together in policy making, on occasions the two phases should explicitly be treated separately.
8.3 The seventeen pointers offered so far bear re-reading. Some have already been fed into and taken into account in policy-making, others have so far lain fallow. Having already identified a large number of implications, we have fewer to make this time. But they are nevertheless important.
8.4 Teacher retention has so far in this country been analysed through the constructs of wastage and turnover. Doing so has put the spotlight on the extent to which teachers leave the profession and the overall loss from schools. The movement of teachers from one school to another – why they are switching, from where they are coming and to where they are going, and how this varies with gender, location, by school, and in other ways – has received much less attention. Where it has been considered it has been as the difference between turnover and wastage. Teachers moving away from schools to other schools impact just as much on those schools losing staff as wastage. Teachers moving around the system in their own way raise as many policy issues as those leaving the profession. In this report we have demonstrated the advantages of focusing on the movers directly. In order to enable us to do so we have introduced the term ‘moveage’ to operate in parallel with wastage.
Pointer 1: In order that the spotlight can be shone on the mobility of teachers in its own right it is proposed that the term moveage (to resonate with wastage) be introduced to record movements of teachers between schools. It should be defined so that turnover equals moveage plus wastage. Statistics on moveage should be regularly collected and published.
8.5 Our research has shown that the steep rise in teacher resignation from schools from 1998 to 2001 has not continued though to 2004. In the three years of our surveys turnover has not changed by very much, but in the primary phase this was due to increasing wastage being balanced by falling moveage. At the present time, therefore, as the House of Commons Education and Skills Committee (2004) has pointed out the problems are specific rather than endemic. There are very real difficulties for some schools and some subjects.
79
8.6 In our report on the 2003 survey we inferred from the differences in turnover and wastage rates that teachers tended to move away from the more challenged schools to those with better examination performance and fewer disadvantaged children. In this report through the construct of moveage we have been able to demonstrate it directly. We have also seen through a survey of movers that teachers moving between secondary schools tend to ‘trade up’ in terms of examination results. In rating the attractions of a school and in their personal accounts movers from secondary schools (but not primary) attached importance to examination results, Ofsted rating and pupil intake. Research by Alliance for Excellent Education (2004) in the United States has made similar findings. The House of Commons Education and Skills Committee (2004) put the particular problems of challenging schools first among the specific issues to be addressed in teacher supply. In 2003 we offered as a policy pointer that further consideration should be given as to how to attract and retain good teachers in schools which face persistent difficulties in maintaining their staff complement, and in view of the additional evidence obtained this year we reiterate and underline the policy requirement.
Pointer 2: In teacher supply it is just as, if not more, important to enable a balance to be struck at the level of the individual school as across the system as a whole. Some schools have faced persistent difficulties in maintaining a full complement of high quality staff. There is a need for policies to address this issue.
8.7 Our comparisons of matched pairs of schools with contrasting turnover showed that the differences resided in the interplay of many factors, some within a school’s control and some outside it. Nevertheless, it was possible to discern some patterns. Three main themes emerged among the within-school factors: (1) the importance of the headteacher in setting the tone of the school, communicating sense of a direction and being accepted as good leader; (2) the valuing and support of the staff so they can enjoy their work and be recognised for it; and (3) having a good recruitment strategy so that teachers are appointed who are appropriate to, and comfortable with, the school’s needs. Although having a good appointments strategy is necessary it may not be sufficient if suitable people do not come forward or cannot be found. Although many of our movers were changing schools for positive reasons, such as promotion, attractiveness or convenience, there was also a strong strand of wanting to escape the dissatisfactions of the present school, chief among which were not liking the way the school is run and not feeling valued.
Pointer 3: The importance of school leadership is well understood. But it is a complex concept which should be revisited to see if it is possible to make improvements in the identification of good leaders for schools and their training, particularly with the aim of achieving optimal staff retention.
Not all the schools with high turnover in our case studies had poor leadership. Rather the reverse, the headteachers were proud of what they were doing and welcomed us. It was just that external factors such as the location and deprivation were impacting on them more strongly. This underlines the importance of Pointer 2.
8.8 Analysis of turnover by post this year, together with a reanalysis of the data for 2002 and 2003 showed a high rate of early retirement among headteachers with a decreasing proportion moving on to other schools. Howson’s (2004) study found
80
that, on average, headteachers stayed in post for ten years. That may be long enough, but how does headship fit into their career paths and life plans?
Pointer 4: Our surveys show that headteachers, both of primary and secondary schools, seem increasingly prone to take early retirement. The numbers in our study are small, but the samples are representative and the pattern has repeated in each of the three years. A study should be undertaken of the career trajectories of headteachers to understand better this seemingly high rate of attrition.
8.9 Turnover and wastage - and by extension moveage - have been measured in terms of full-time teachers, both permanent and fixed-term. Our studies have shown that the motivations of the two groups are different; those with permanent contracts are more in control of the decisions to leave, for example. A major reason for those on temporary contracts to change schools is the pursuit of a permanent contract. It would be better if their rates of turnover, moveage and wastage could be expressed separately. The same goes for part-time staff, both permanent and temporary.
Pointer 5: The technical feasibility should be tested of expressing separate turnover, wastage and moveage rates for teachers on different types of contracts. If having one rate is thought desirable this would be better based on full-time permanent teachers than all full-timers since the rates and reasons of the permanent and temporary differ.
8.10 Most of the teachers who moved thought it a good decision in retrospect. However, forty per cent of them looked to further moves in the foreseeable future, particularly the young teachers. This was often because they were ambitious and hoping for promotions, but also for personal reasons such as buying a house or taking time out to raise a family. About 14 per cent of the movers thought they had made a bad decision or were unsure, and were already thinking seriously about moving on again. A few, about 1 per cent, seemed serial movers unlikely to be satisfied in any school.
8.11 Our 2002 study of teachers leaving the profession showed that some had very real concerns about workload, discipline and school management. The present survey of movers has revealed that some are prompted to change schools because they did not like the way the one they were in was run and/or they felt undervalued. Addressing these concerns is likely to reduce wastage and cut down on unnecessary moveage. But it is also clear that teaching is a highly mobile profession both up career ladders and around the country.
Pointer 6: It is important not to think of turnover and moveage as bad. Indeed, this is one reason why it is important to distinguish moveage from wastage which by definition should be kept to a minimum. Attention should be focused on what constitutes an optimal level for moveage since too little can be as damaging as too much.
8.12 Picking up the point about some of the schools in a case studies being concerned about the lack of fresh blood in their staffing, even with the new construct of moveage the focus is still on the teachers, the one in eight or so, who leave schools each year. Perhaps the time has come to re-focus on the teachers who stay. How do they compare with the movers and the leavers? Is it that they enjoy working in a
81
particular school so much, is it because of its convenience to their lives or are they disproportionately the unadventurous and unambitious who feel safe in staying put? We know of no evidence in this country though the National Center for Education Statistics in the United States in its recent study split teachers into the three groups of movers, leavers and stayers.
Pointer 7: Through the constructs of turnover and wastage, and now moveage, the focus in school staffing has been on those who leave. It is high time, we suggest, to look at the other side of coin, the teachers who stay. Dare we also offer the term stayage to cover this?
8.13 Our analysis of moveage has shown that whatever improvements are made in terms of workload, pupil behaviour, school leadership, resources and facilities, and other concerns of the profession, teaching is likely to remain – and this is one of its attractions – a highly mobile profession. Moveage is inherent in the profession. It is wastage which is to be minimized.
82
References Alliance for Excellent Education (2004). Tapping the Potential: Retaining and
Developing High-Quality New Teachers. Washington, DC: AEE.
DfES (2002) Statistics of Education. Schools in England 2002 Edition. London: The Stationery Office
DfES (2003a) Statistics of Education. Schools in England 2004 Edition. London: The Stationery Office
DfES (2003b) Secondary Schools Curriculum and Staffing Survey, November 2002 (Provisional). Statistical First Release 25/2003. London: DfES.
DfES (2004a) Statistics of Education. Schools in England 2004 Edition. London: The Stationery Office.
DfES (2004b) Statistics of Education: School Workforce in England 2003 Edition, London: DfES.
DfES (2005a) Statistics of Education: School Workforce in England 2004 Edition, London: DfES.
DfES (2005b). www.standards.dfes.gov.uk
Dolton, P. (2004). ‘The rate of return to teaching: how does it compare with other graduate jobs?’ National Institute Economic Review, 190.
Employers’ Organisation for Local Government (2002). Survey of Teacher Resignations and Recruitment 1885/6 –2001. London: Employers’ Organisation for Local Government.
Employers’ Organisation for Local Government (2004). Survey of Teacher Resignations and Recruitment 1885/6 –2002. London: Employers’ Organisation for Local Government.
Eurydice (2002a). The Teaching Profession in Europe: Profile, Trends and Concerns. Report I. Initial Training and Transition to Working Life of Teachers in General Lower Secondary Education. Brussels: Eurydice European Unit.
Eurydice (2002b). The Teaching Profession in Europe: Profile, Trends and Concerns. Report II. Teacher Supply and Demand at General Lower Secondary Level. Brussels: Eurydice European Unit.
Eurydice (2003). The Teaching Profession in Europe: Profile, Trends and Concerns. Report III. Working Conditions and Pay in General Lower Secondary Education. Brussels: Eurydice European Unit.
Eurydice (2004). The Teaching Profession in Europe: Profile, Trends and Concerns. Report III. Keeping Teaching Attractive for the 21st century. Brussels: Eurydice European Unit.
House of Commons Education and Skills Committee (2004). Secondary Education: Teacher Retention and Recruitment. Fifth Report of Session 2003-04. Volumes I and II. HC 1057-1 and HC 1057-11. London: The Stationery Office.
83
Howson, J (2004). The Relationship between Headteachers’ Length of Service in Primary and Secondary Schools and Selected PANDA grades. National College for School Leadership.
Luekens, M. T., Lyter, D.M. and Fox, E.E. (2004). Teacher Attrition and Mobility: Results from the Teacher Follow-up Survey, 2000-01. NCES 2004-301, US Department of Education, National Center for Education Statistics. Washington, DC: US Government Printing Office.
National Commission on Teaching and America’s Future. (2003). No Dream Denied. A Pledge to America’s Children. Washington, DC: NCTAF.
OECD (forthcoming). Teachers Matter: Attracting, Developing and Retaining Effective Teachers. Directorate for Education, Employment, Labour and Social Affairs, Education and Training Division. Paris: OECD.
Office of National Statistics (2005). Age Profile by Ethnicity. www.statistics.gov.uk/cci/nugget.asp?id=456.
Quartz, K.H., Lyons, K.B. and Thomas, A. ‘Retaining teachers in high poverty schools: a policy framework’. In International Handbook on Educational Policy (Ed Bascia, N., Datnow, A. and Leithwood, K.) cited in House of Commons Education and Skills Committee (2004). Secondary Education: Teacher Retention and Recruitment. Fifth Report of Session 2003-04. Volumes I, HC 1057-1, page 27, footnote 93, London: The Stationery Office.
Robinson, P. and Smithers, A. (1991). Teacher Turnover. Report to the Leverhulme Trust. Manchester: School of Education.
Ross, A. and Hutchings, M. (2003). Attracting, Developing and Retaining Effective Teachers in the United Kingdom of Great Britain and Northern Ireland. OECD Country Background Report. London: Institute for Policy Studies in Education, London Metropolitan University.
School Teachers’ Review Body (2004a). Thirteen Report – Part 2. Cm 6164. London: The Stationery Office.
School Teachers’ Review Body (2004b). Statistical Evidence from the Department for Education and Skills, October 2004 www.teachernet.gov.uk/management/payand performance/pay/.
Smithers, A. in House of Commons Education and Skills Committee (2004). Secondary Education: Teacher Retention and Recruitment. Fifth Report of Session 2003-04. Volumes II, HC 1057-11, Ev 230-237. London: The Stationery Office.
Smithers, A. and Robinson, P. (2003). Factors Affecting Teachers’ Decisions to Leave the Profession. Research Report 430. London: DfES.
Smithers, A. and Robinson, P. (2004a). Teacher Turnover, Wastage and Destinations. Research Report 553. London: DfES.
Smithers, A. and Robinson, P. (2004b). Teacher Training Profiles 2004. Buckingham: CEER, www.buckingham.ac.uk/education/research/ceer/publications/
84
Appendix A: Methods
A.1 The 2004 survey of teacher retention is a continuation of the study begun in 2002 (Smithers and Robinson, 2003 and 2004), with schools who had agreed to participate then being asked to provide information for a third year. There were three main parts to the 2004 research:
• Schools Survey – schools were sent a questionnaire close to the end of each term asking them to provide details (anonymously) of the teachers leaving them at the end of that term.
• Surveys of Movers – teachers leaving a maintained school in summer 2004 to take a post in another were sent a questionnaire via the school they were leaving to discover their reasons, and they were followed up in January 2005 to see how they viewed their decisions in retrospect.
• Case Studies – eight pairs of schools, four primary and four secondary, one in each case with high turnover and the other with low turnover were compared to try to understand the reasons for the difference.
Schools Survey Sampling
A.2 Headteachers, who had agreed to participate in 2002, were contacted by letter thanking them for their help and asking if they would be willing to continue for another year. It was explained that the same schedule as in 2002 and 2003 would be followed with a brief questionnaire coming to them again around the time of the three resignation dates of 28 February, 31 May and 31 October 2004.
A.3 Of the initial samples 33 primary schools and 10 secondary schools had closed. Table A1 shows that, term by term, the response rates in 2004 held up very well.
Table A.1: School Response Rates, 2004 Primary Secondary Total Participating
Schools N % N % N %
Agreed1 2,130 100.0 782 100.0 2,912 100.0 Spring Survey 1,615 75.8 520 66.5 2,135 73.3 Summer Survey 1,770 83.1 570 72.9 2,340 80.4 Autumn Survey 1,562 73.3 536 68.5 2,098 72.0
All Three Surveys 1,187 55.7 367 46.9 1554 53.4 1. 33 primary schools and 10 secondary schools who initially agreed to take part in 2002 were extant in 2004
School Questionnaire A.4 The school questionnaire asked the schools to list those teachers leaving the school
during, or at the end of, the term. It was a folded four-sided sheet with a chart spread across the middle two pages on which the school was asked to list (without giving names) those teachers leaving that term. For each leaver the school was asked to indicate post, whether full-time or part-time, whether permanent or fixed-
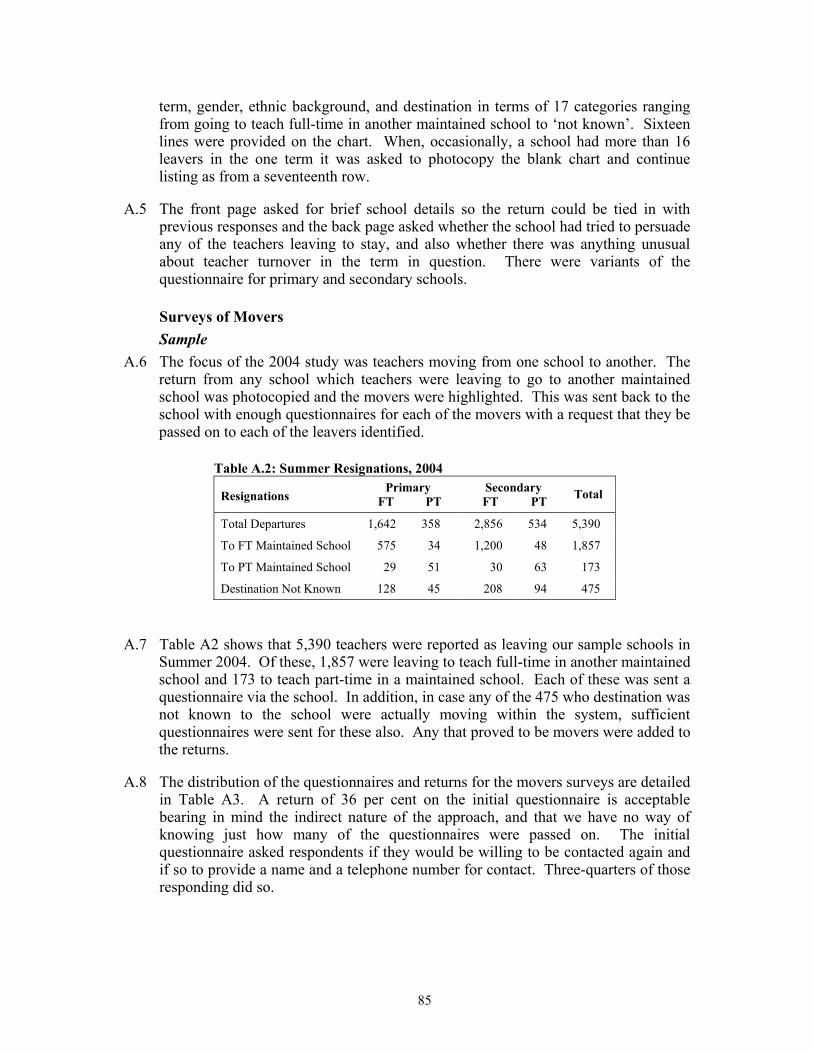
85
term, gender, ethnic background, and destination in terms of 17 categories ranging from going to teach full-time in another maintained school to ‘not known’. Sixteen lines were provided on the chart. When, occasionally, a school had more than 16 leavers in the one term it was asked to photocopy the blank chart and continue listing as from a seventeenth row.
A.5 The front page asked for brief school details so the return could be tied in with previous responses and the back page asked whether the school had tried to persuade any of the teachers leaving to stay, and also whether there was anything unusual about teacher turnover in the term in question. There were variants of the questionnaire for primary and secondary schools.
Surveys of Movers Sample
A.6 The focus of the 2004 study was teachers moving from one school to another. The return from any school which teachers were leaving to go to another maintained school was photocopied and the movers were highlighted. This was sent back to the school with enough questionnaires for each of the movers with a request that they be passed on to each of the leavers identified.
Table A.2: Summer Resignations, 2004 Primary Secondary
Resignations FT PT FT PT Total
Total Departures 1,642 358 2,856 534 5,390
To FT Maintained School 575 34 1,200 48 1,857
To PT Maintained School 29 51 30 63 173
Destination Not Known 128 45 208 94 475
A.7 Table A2 shows that 5,390 teachers were reported as leaving our sample schools in Summer 2004. Of these, 1,857 were leaving to teach full-time in another maintained school and 173 to teach part-time in a maintained school. Each of these was sent a questionnaire via the school. In addition, in case any of the 475 who destination was not known to the school were actually moving within the system, sufficient questionnaires were sent for these also. Any that proved to be movers were added to the returns.
A.8 The distribution of the questionnaires and returns for the movers surveys are detailed in Table A3. A return of 36 per cent on the initial questionnaire is acceptable bearing in mind the indirect nature of the approach, and that we have no way of knowing just how many of the questionnaires were passed on. The initial questionnaire asked respondents if they would be willing to be contacted again and if so to provide a name and a telephone number for contact. Three-quarters of those responding did so.

86
Table A.3: Movers Sample and Returns, 2004 Primary Secondary Total Distribution and
Returns FT PT FT PT N %
Questionnaires Sent 604 85 1,230 111 2030 100.0
Returns 229 32 435 39 736 36.31
Agreed to Follow Up 166 20 333 29 548 74.52
Follow Up Returns 96 12 175 18 342 62.43 1. Per cent of questionnaires sent. 2. Per cent of returns. 3. Per cent of those providing a contact address.
A.9 In order to see how the movers viewed their decisions in retrospect a follow-up questionnaire was sent out in January 2005. Table A3 shows that 342 (62.4 per cent) responded, of which 303 replies had been received by the time the dataset was closed for analysis.
Movers Questionnaire A.10 The mover questionnaire was specially designed for the study with variants for
primary and secondary teachers. The secondary version covered the following topics:
• Identifiers – name of present school and name of new school;
• Background – gender, age, nationality, ethnic origin, years teaching, number of schools worked in, teaching qualification;
• Present Post – when appointed, contract, pay scale, allowances, post, main teaching subject, other teaching subject;
• The Move – when first thought of, when new post obtained, incentives to stay, applications made;
• Reasons for Moving – 27 possible reasons to be rated on three-point scale of importance, plus space for three more reasons to be written in; open-ended question asking for details;
• New Post – contract, pay scale, allowances, responsibilities;
• Attractions of New School – 15 items to be rated on three point scale, plus space to write in 3 further attractions; opened ended question on attractions;
• Request for Contact Details – if willing to be followed up.
Follow-Up Questionnaire A.11 The follow-up questionnaire was based on the initial mover questionnaire so as to be
able to measure change, but with as little repetition of background information as possible. The version for secondary school teachers consisted of:
• Identifiers – name, name of school left in summer;
87
• Present Post – name of school, when took up post, what doing in any intervening time, main teaching subject, other teaching subjects, pay scale, allowances, post, responsibilities compared with previous post;
• Attractions - 15 items to be rated on three point scale, plus space to write in 3 further attractions; new school lived up to expectations?
• Reasons for Leaving Post in Summer 2004 - 27 possible reasons to be rated on three-point scale of importance, plus space for three more reasons to be written in; did right thing?
• Likelihood of Moving in Foreseeable Future – five point scale; open-ended question;
• Space for Further Comment.
Case Studies Sample
A.12 The case studies comprised eight matched pairs of schools, four primary and four secondary, one high on turnover and one low. The schools to be visited were drawn by ranking the schools on their turnover in the three years of the study. Expressed over the three years the turnover of individual primary schools ranged from 100 to zero per cent, and that of secondary schools from 97 to 10 per cent. Two people working together searched down and up the list simultaneously until a pair was found from the same local authority who were similar on the number of pupils on roll and the percentage eligible for free schools meals.
A.13 At the time the samples were drawn - in mid November 2004 - 677 primary schools and 159 secondary schools had returned the School Leaver Survey on all nine occasions (this is below the eventual respective totals of 880 and 197 because the autumn 2004 returns were still being received when it became operationally necessary to begin contacting the selected schools). In each case ten possible pairs of schools were arrived at, as far as possible spread across the regions, but in the case of the North East there were so few high turnover schools that it was not possible to achieve a pair.
A.14 Half the schools in each pool of ten were flagged and the (rather lengthy) process undertaken of contacting the headteachers by telephone. All of the headteachers approached agreed to see us. That not a single one refused we think is an indication of the importance the headteachers attach to recruitment and retention issues. In order to preserve the schools’ confidentiality we do not propose to identify the local authorities from which the pairs came, but can say that the four primary pairs were in the following regions: East, South West, North West, and East Midlands. The four secondary pairs were in Inner London, East Midlands, South East and North West.
Methods A.15 The core of each case study was an interview in school with the headteacher
reviewing teacher turnover since 2002. Observations were made on the school and
88
its locality, including the state of repair, any litter or graffiti, how the pupils conducted themselves, and staff mien.
A.16 The interviews had to be fitted into the headteachers’ busy schedules and were held during December 2004 and January 2005 (with one delayed, at the headteacher’s request, until February). The case studies were carried out by the authors together with the help of a former secondary deputy headteacher, an experienced researcher who has worked on the project over the three years. The interviews (with the permission of the interviewee) were taped and then transcribed by an experienced team of three to provide a written record of the interview. The headteachers were very generous with their time and gladly gave more than the initial one hour requested.
A.17 The method of interviewing the headteachers was trialled in three secondary schools selected from the ranking of schools by aggregate turnover. The schools had respectively 97.1 per cent, 34.5 per cent and 17.7 per cent turnover over the three years of the study. It was felt that a tightly structured set of questions to a headteacher would not work, so a conversation was unfolded centred on the details of the teachers who had left the school in the last three years. The interviewers had with them a listing of the actual resignations in the school obtained from CEER’s school database, on a term-by-term basis for each year of the survey. For each resignation there were details of type of post, main teaching subject, whether full or part-time, permanent or fixed-term, gender, ethnicity and destination.
A.18 The interview was based on a framework common to all of the case study schools, but the nature of the questions were tailored to the specific circumstances of the individual school. A separate schedule was prepared for each school. The interview covered the following areas:
• Resignations in 2002-2004 – factors influencing the teachers’ decisions to resign, internal to the school and generally;
• Destinations - details; any pattern?
• Factors influencing Retention – within school, local, regional, national;
• Staffing Complement – details; management of the staff profile;
• Applications and Appointments – how easy to find staff of the desired quality; any trend over the last three years;
• Prospects – what does the headteacher see the future as holding with regard to retention and recruitment.
A.19 A tour of the school was also requested. This was often led by the headteachers themselves or by a pair of pupils specially designated, and in some instances specially trained, for the role of showing visitors around the school. Copies of relevant documentation including the school’s prospectus were picked up on the visits.
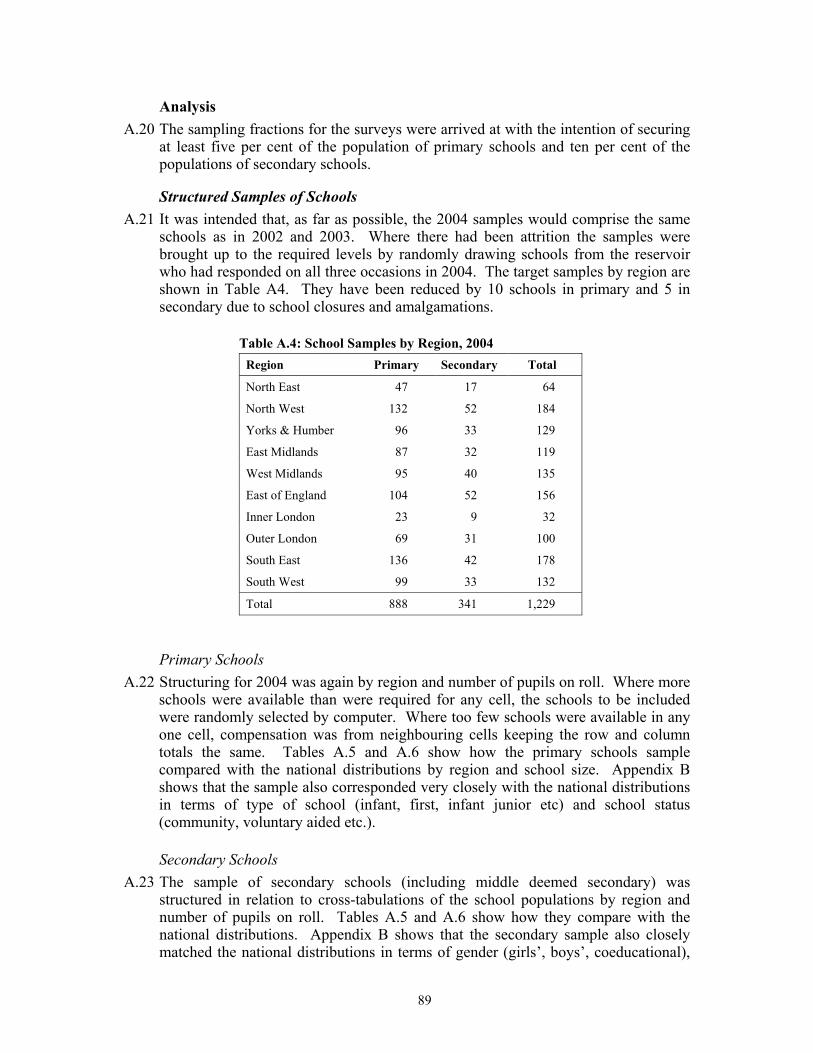
89
Analysis A.20 The sampling fractions for the surveys were arrived at with the intention of securing
at least five per cent of the population of primary schools and ten per cent of the populations of secondary schools.
Structured Samples of Schools A.21 It was intended that, as far as possible, the 2004 samples would comprise the same
schools as in 2002 and 2003. Where there had been attrition the samples were brought up to the required levels by randomly drawing schools from the reservoir who had responded on all three occasions in 2004. The target samples by region are shown in Table A4. They have been reduced by 10 schools in primary and 5 in secondary due to school closures and amalgamations.
Table A.4: School Samples by Region, 2004 Region Primary Secondary Total
North East 47 17 64
North West 132 52 184
Yorks & Humber 96 33 129
East Midlands 87 32 119
West Midlands 95 40 135
East of England 104 52 156
Inner London 23 9 32
Outer London 69 31 100
South East 136 42 178
South West 99 33 132
Total 888 341 1,229
Primary Schools A.22 Structuring for 2004 was again by region and number of pupils on roll. Where more
schools were available than were required for any cell, the schools to be included were randomly selected by computer. Where too few schools were available in any one cell, compensation was from neighbouring cells keeping the row and column totals the same. Tables A.5 and A.6 show how the primary schools sample compared with the national distributions by region and school size. Appendix B shows that the sample also corresponded very closely with the national distributions in terms of type of school (infant, first, infant junior etc) and school status (community, voluntary aided etc.).
Secondary Schools A.23 The sample of secondary schools (including middle deemed secondary) was
structured in relation to cross-tabulations of the school populations by region and number of pupils on roll. Tables A.5 and A.6 show how they compare with the national distributions. Appendix B shows that the secondary sample also closely matched the national distributions in terms of gender (girls’, boys’, coeducational),
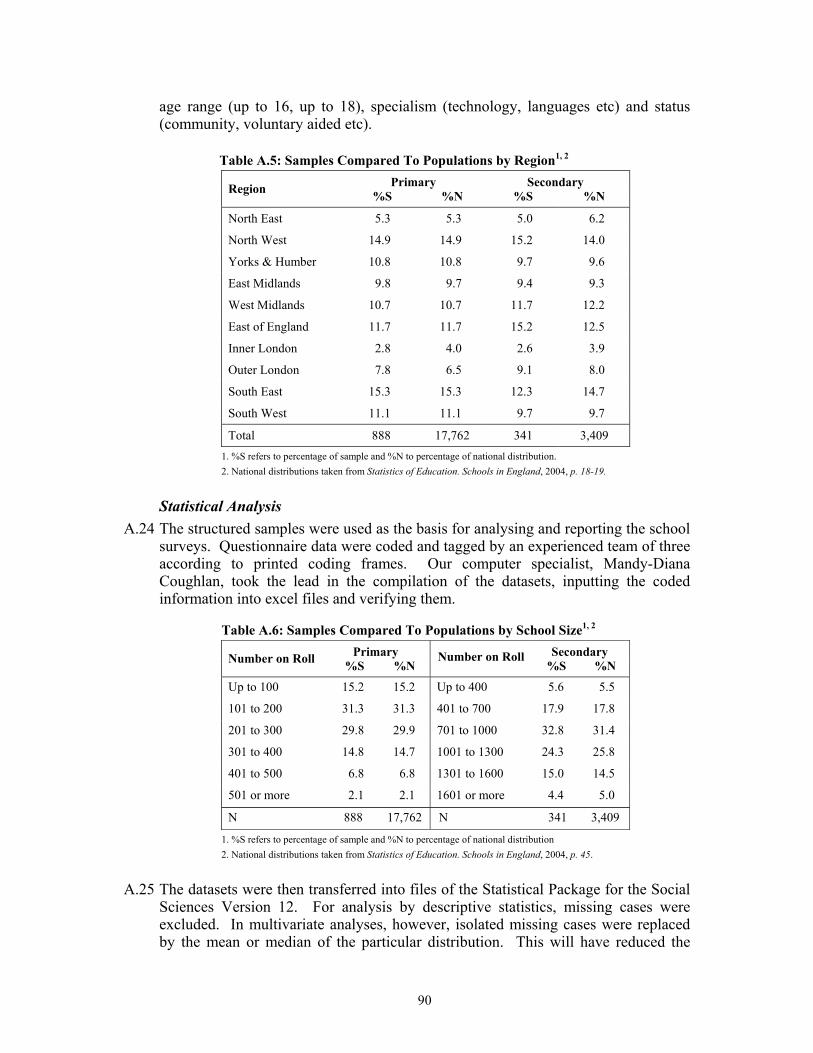
90
age range (up to 16, up to 18), specialism (technology, languages etc) and status (community, voluntary aided etc).
Table A.5: Samples Compared To Populations by Region1, 2 Primary Secondary Region %S %N %S %N
North East 5.3 5.3 5.0 6.2
North West 14.9 14.9 15.2 14.0
Yorks & Humber 10.8 10.8 9.7 9.6
East Midlands 9.8 9.7 9.4 9.3
West Midlands 10.7 10.7 11.7 12.2
East of England 11.7 11.7 15.2 12.5
Inner London 2.8 4.0 2.6 3.9
Outer London 7.8 6.5 9.1 8.0
South East 15.3 15.3 12.3 14.7
South West 11.1 11.1 9.7 9.7
Total 888 17,762 341 3,409 1. %S refers to percentage of sample and %N to percentage of national distribution. 2. National distributions taken from Statistics of Education. Schools in England, 2004, p. 18-19.
Statistical Analysis A.24 The structured samples were used as the basis for analysing and reporting the school
surveys. Questionnaire data were coded and tagged by an experienced team of three according to printed coding frames. Our computer specialist, Mandy-Diana Coughlan, took the lead in the compilation of the datasets, inputting the coded information into excel files and verifying them.
Table A.6: Samples Compared To Populations by School Size1, 2 Primary Secondary Number on Roll %S %N
Number on Roll %S %N
Up to 100 15.2 15.2 Up to 400 5.6 5.5
101 to 200 31.3 31.3 401 to 700 17.9 17.8
201 to 300 29.8 29.9 701 to 1000 32.8 31.4
301 to 400 14.8 14.7 1001 to 1300 24.3 25.8
401 to 500 6.8 6.8 1301 to 1600 15.0 14.5
501 or more 2.1 2.1 1601 or more 4.4 5.0
N 888 17,762 N 341 3,409
1. %S refers to percentage of sample and %N to percentage of national distribution 2. National distributions taken from Statistics of Education. Schools in England, 2004, p. 45.
A.25 The datasets were then transferred into files of the Statistical Package for the Social Sciences Version 12. For analysis by descriptive statistics, missing cases were excluded. In multivariate analyses, however, isolated missing cases were replaced by the mean or median of the particular distribution. This will have reduced the
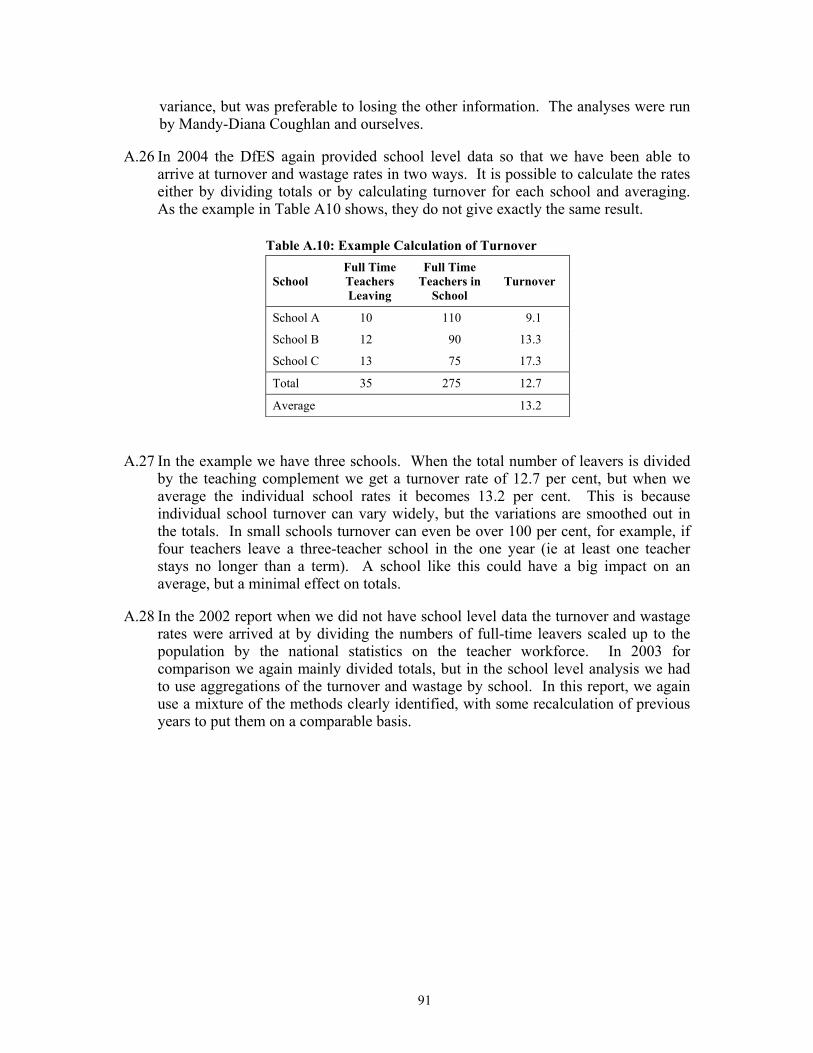
91
variance, but was preferable to losing the other information. The analyses were run by Mandy-Diana Coughlan and ourselves.
A.26 In 2004 the DfES again provided school level data so that we have been able to arrive at turnover and wastage rates in two ways. It is possible to calculate the rates either by dividing totals or by calculating turnover for each school and averaging. As the example in Table A10 shows, they do not give exactly the same result.
Table A.10: Example Calculation of Turnover
School Full Time Teachers Leaving
Full Time Teachers in
School Turnover
School A 10 110 9.1
School B 12 90 13.3
School C 13 75 17.3
Total 35 275 12.7
Average 13.2
A.27 In the example we have three schools. When the total number of leavers is divided by the teaching complement we get a turnover rate of 12.7 per cent, but when we average the individual school rates it becomes 13.2 per cent. This is because individual school turnover can vary widely, but the variations are smoothed out in the totals. In small schools turnover can even be over 100 per cent, for example, if four teachers leave a three-teacher school in the one year (ie at least one teacher stays no longer than a term). A school like this could have a big impact on an average, but a minimal effect on totals.
A.28 In the 2002 report when we did not have school level data the turnover and wastage rates were arrived at by dividing the numbers of full-time leavers scaled up to the population by the national statistics on the teacher workforce. In 2003 for comparison we again mainly divided totals, but in the school level analysis we had to use aggregations of the turnover and wastage by school. In this report, we again use a mixture of the methods clearly identified, with some recalculation of previous years to put them on a comparable basis.
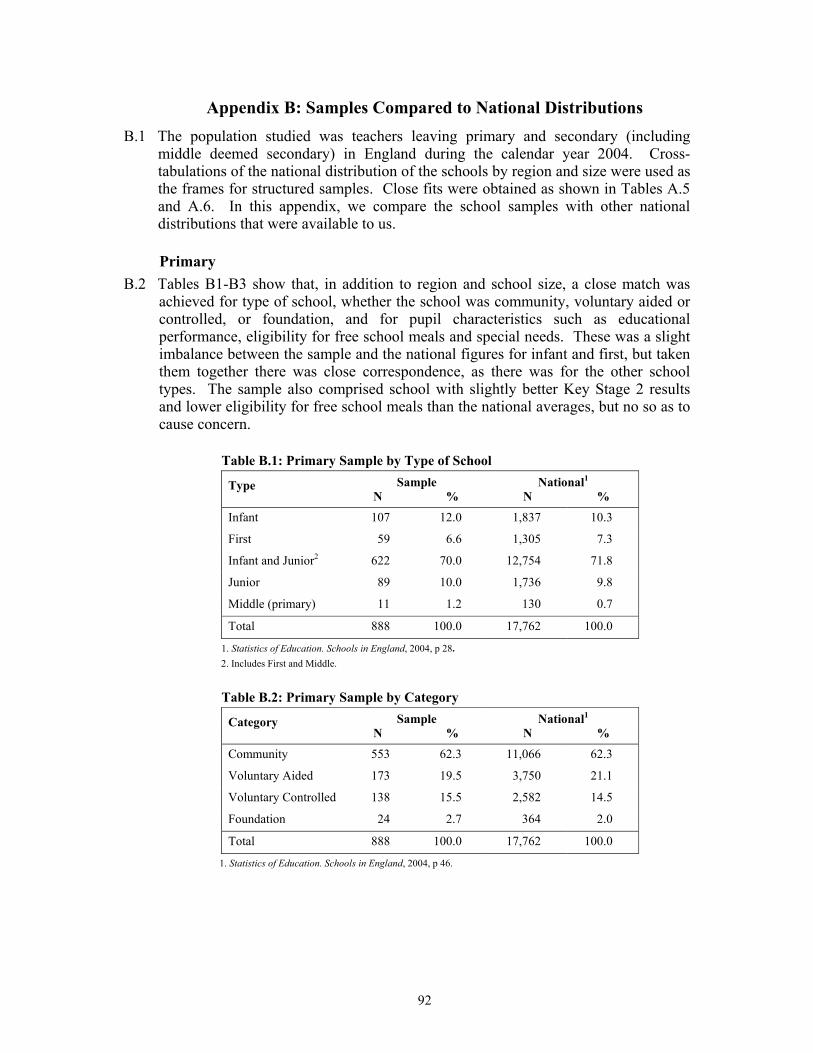
92
Appendix B: Samples Compared to National Distributions
B.1 The population studied was teachers leaving primary and secondary (including middle deemed secondary) in England during the calendar year 2004. Cross-tabulations of the national distribution of the schools by region and size were used as the frames for structured samples. Close fits were obtained as shown in Tables A.5 and A.6. In this appendix, we compare the school samples with other national distributions that were available to us.
Primary B.2 Tables B1-B3 show that, in addition to region and school size, a close match was
achieved for type of school, whether the school was community, voluntary aided or controlled, or foundation, and for pupil characteristics such as educational performance, eligibility for free school meals and special needs. These was a slight imbalance between the sample and the national figures for infant and first, but taken them together there was close correspondence, as there was for the other school types. The sample also comprised school with slightly better Key Stage 2 results and lower eligibility for free school meals than the national averages, but no so as to cause concern.
Table B.1: Primary Sample by Type of School Sample National1 Type
N % N %
Infant 107 12.0 1,837 10.3
First 59 6.6 1,305 7.3
Infant and Junior2 622 70.0 12,754 71.8
Junior 89 10.0 1,736 9.8
Middle (primary) 11 1.2 130 0.7
Total 888 100.0 17,762 100.0
1. Statistics of Education. Schools in England, 2004, p 28. 2. Includes First and Middle.
Table B.2: Primary Sample by Category Sample National1 Category
N % N %
Community 553 62.3 11,066 62.3
Voluntary Aided 173 19.5 3,750 21.1
Voluntary Controlled 138 15.5 2,582 14.5
Foundation 24 2.7 364 2.0
Total 888 100.0 17,762 100.0
1. Statistics of Education. Schools in England, 2004, p 46.
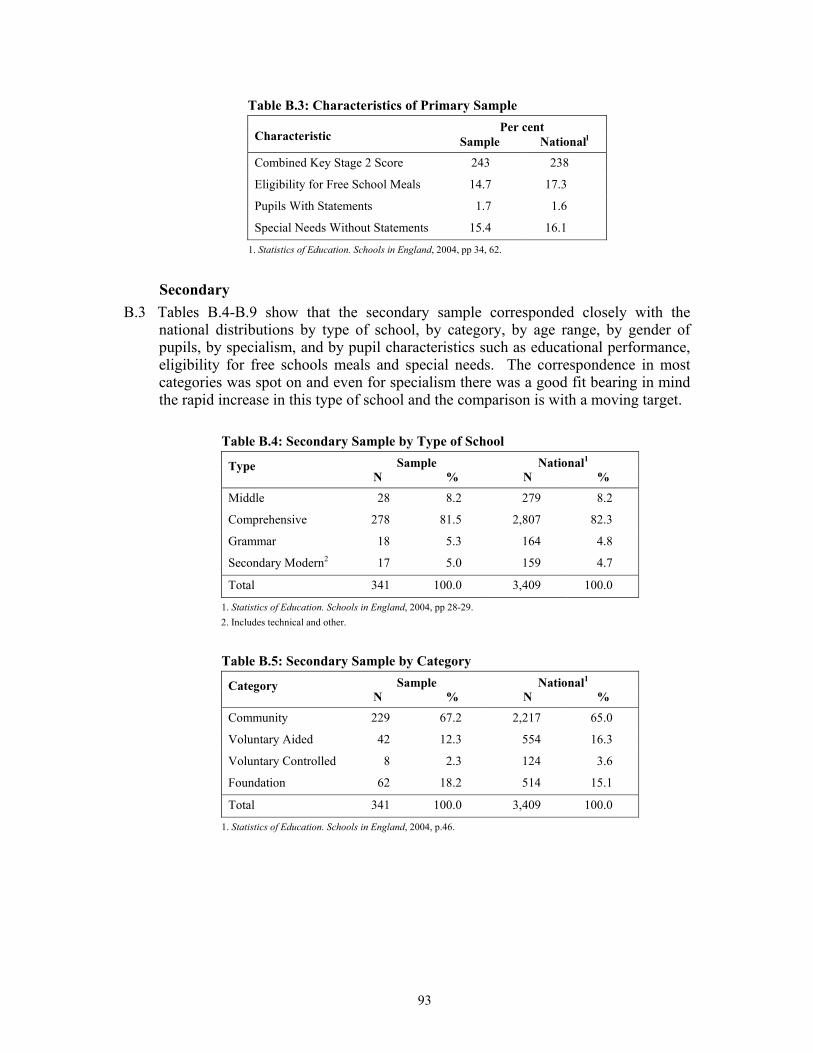
93
Table B.3: Characteristics of Primary Sample Per cent
Characteristic Sample Nationall
Combined Key Stage 2 Score 243 238
Eligibility for Free School Meals 14.7 17.3
Pupils With Statements 1.7 1.6
Special Needs Without Statements 15.4 16.1
1. Statistics of Education. Schools in England, 2004, pp 34, 62.
Secondary B.3 Tables B.4-B.9 show that the secondary sample corresponded closely with the
national distributions by type of school, by category, by age range, by gender of pupils, by specialism, and by pupil characteristics such as educational performance, eligibility for free schools meals and special needs. The correspondence in most categories was spot on and even for specialism there was a good fit bearing in mind the rapid increase in this type of school and the comparison is with a moving target.
Table B.4: Secondary Sample by Type of School Sample National1 Type
N % N %
Middle 28 8.2 279 8.2
Comprehensive 278 81.5 2,807 82.3
Grammar 18 5.3 164 4.8
Secondary Modern2 17 5.0 159 4.7
Total 341 100.0 3,409 100.0
1. Statistics of Education. Schools in England, 2004, pp 28-29. 2. Includes technical and other.
Table B.5: Secondary Sample by Category Sample National1 Category
N % N %
Community 229 67.2 2,217 65.0
Voluntary Aided 42 12.3 554 16.3
Voluntary Controlled 8 2.3 124 3.6
Foundation 62 18.2 514 15.1
Total 341 100.0 3,409 100.0
1. Statistics of Education. Schools in England, 2004, p.46.
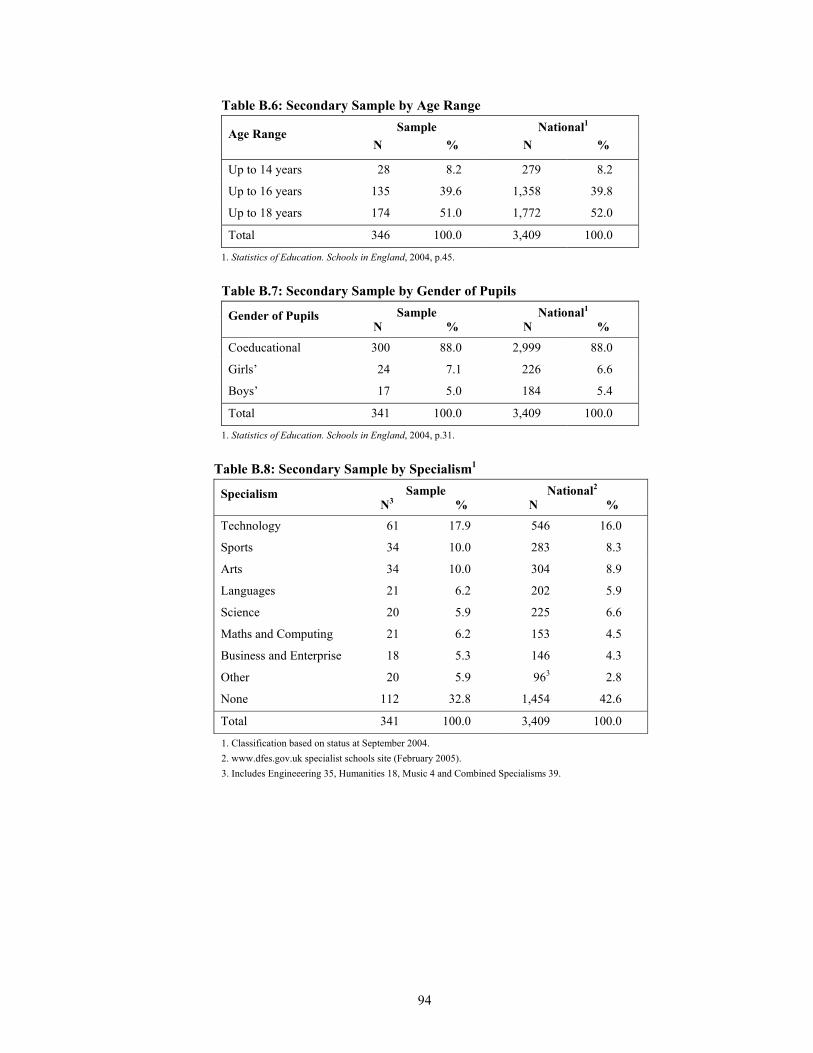
94
Table B.6: Secondary Sample by Age Range Sample National1 Age Range
N % N %
Up to 14 years 28 8.2 279 8.2
Up to 16 years 135 39.6 1,358 39.8
Up to 18 years 174 51.0 1,772 52.0
Total 346 100.0 3,409 100.0
1. Statistics of Education. Schools in England, 2004, p.45.
Table B.7: Secondary Sample by Gender of Pupils Sample National1 Gender of Pupils
N % N %
Coeducational 300 88.0 2,999 88.0
Girls’ 24 7.1 226 6.6
Boys’ 17 5.0 184 5.4
Total 341 100.0 3,409 100.0
1. Statistics of Education. Schools in England, 2004, p.31.
Table B.8: Secondary Sample by Specialism1 Sample National2 Specialism
N3 % N %
Technology 61 17.9 546 16.0
Sports 34 10.0 283 8.3
Arts 34 10.0 304 8.9
Languages 21 6.2 202 5.9
Science 20 5.9 225 6.6
Maths and Computing 21 6.2 153 4.5
Business and Enterprise 18 5.3 146 4.3
Other 20 5.9 963 2.8
None 112 32.8 1,454 42.6
Total 341 100.0 3,409 100.0
1. Classification based on status at September 2004. 2. www.dfes.gov.uk specialist schools site (February 2005). 3. Includes Engineeering 35, Humanities 18, Music 4 and Combined Specialisms 39.
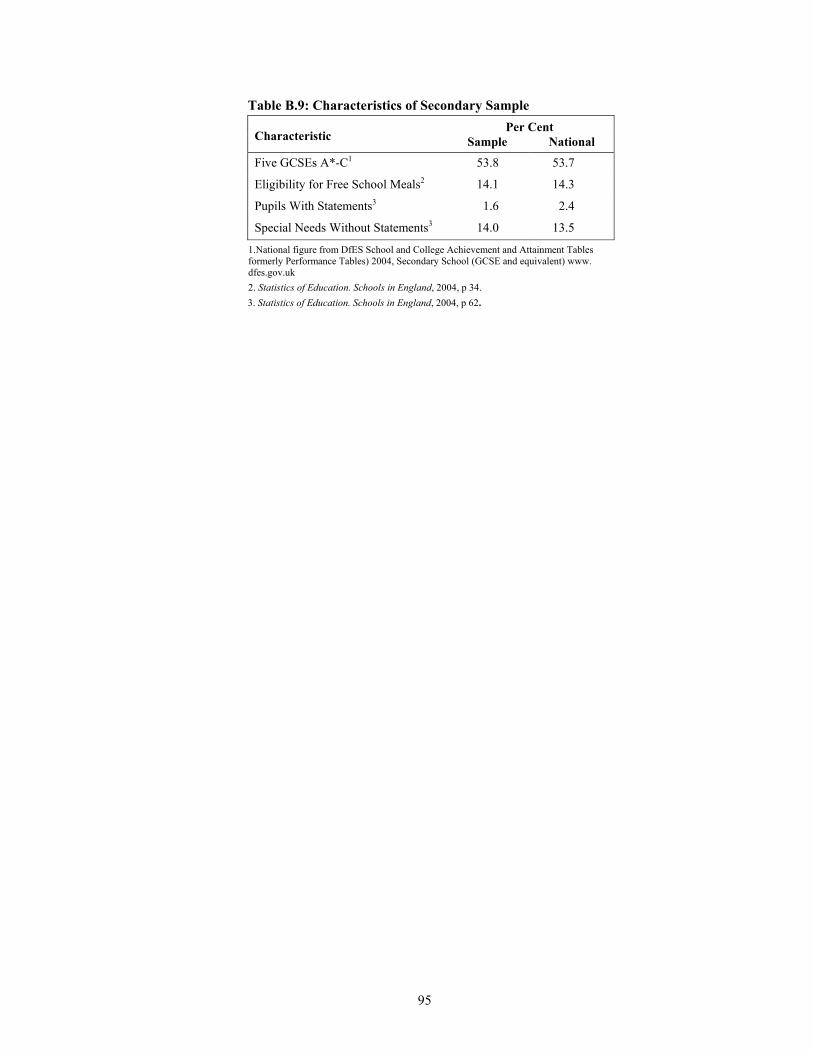
95
Table B.9: Characteristics of Secondary Sample Per Cent
Characteristic Sample National
Five GCSEs A*-C1 53.8 53.7
Eligibility for Free School Meals2 14.1 14.3
Pupils With Statements3 1.6 2.4
Special Needs Without Statements3 14.0 13.5
1.National figure from DfES School and College Achievement and Attainment Tables formerly Performance Tables) 2004, Secondary School (GCSE and equivalent) www. dfes.gov.uk 2. Statistics of Education. Schools in England, 2004, p 34. 3. Statistics of Education. Schools in England, 2004, p 62.
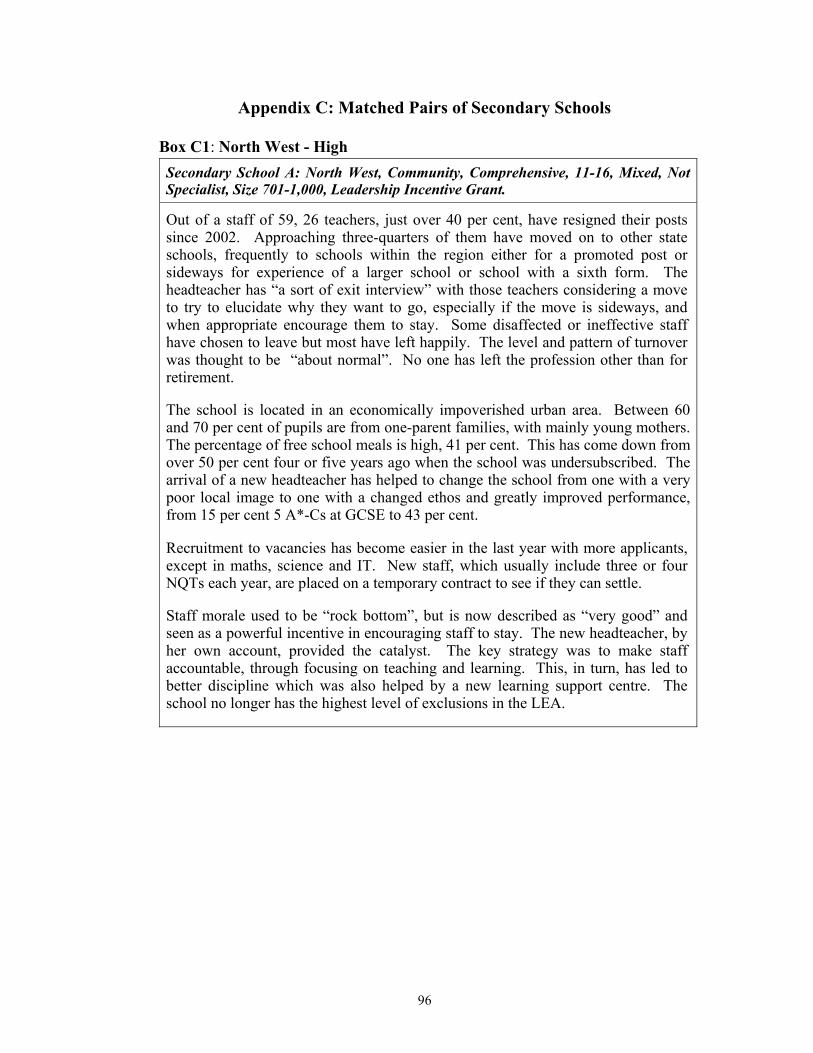
96
Appendix C: Matched Pairs of Secondary Schools
Box C1: North West - High Secondary School A: North West, Community, Comprehensive, 11-16, Mixed, Not Specialist, Size 701-1,000, Leadership Incentive Grant.
Out of a staff of 59, 26 teachers, just over 40 per cent, have resigned their posts since 2002. Approaching three-quarters of them have moved on to other state schools, frequently to schools within the region either for a promoted post or sideways for experience of a larger school or school with a sixth form. The headteacher has “a sort of exit interview” with those teachers considering a move to try to elucidate why they want to go, especially if the move is sideways, and when appropriate encourage them to stay. Some disaffected or ineffective staff have chosen to leave but most have left happily. The level and pattern of turnover was thought to be “about normal”. No one has left the profession other than for retirement.
The school is located in an economically impoverished urban area. Between 60 and 70 per cent of pupils are from one-parent families, with mainly young mothers. The percentage of free school meals is high, 41 per cent. This has come down from over 50 per cent four or five years ago when the school was undersubscribed. The arrival of a new headteacher has helped to change the school from one with a very poor local image to one with a changed ethos and greatly improved performance, from 15 per cent 5 A*-Cs at GCSE to 43 per cent.
Recruitment to vacancies has become easier in the last year with more applicants, except in maths, science and IT. New staff, which usually include three or four NQTs each year, are placed on a temporary contract to see if they can settle.
Staff morale used to be “rock bottom”, but is now described as “very good” and seen as a powerful incentive in encouraging staff to stay. The new headteacher, by her own account, provided the catalyst. The key strategy was to make staff accountable, through focusing on teaching and learning. This, in turn, has led to better discipline which was also helped by a new learning support centre. The school no longer has the highest level of exclusions in the LEA.
97
Box C2: North West - Low Secondary School B: North West, Community, Comprehensive, 11-16, Mixed, Specialist, Size 701-1,000, Leadership Incentive Grant.
During the last three years turnover has been very modest. Out of a staffing establishment of fifty, only ten teachers have left in the past three years. They have mainly gone to other state schools for promotion or family reasons, or retired.
This is an inner city school, whose catchment includes some of the poorest wards in the country. The percentage of free school meals is more than double the national average (33%). In just over a decade performance at GCSE has improved dramatically from around 19 per cent 5 A*-Cs to about 44 per cent. In 2004 it rose further to 58 per cent attributed by the head in part to what he called the IT GNVQ factor, a qualification counted as equivalent to four good GCSEs. The school has been awarded specialist status as a languages college and all pupils study at least one modern foreign language to year 11, some opt for two. Language study is backed by visits to other countries.
Rising pupil numbers, from 600 to nearly 900 since the early nineties, has meant that the school has been adding staff. The school’s promotional literature for applicants is targeted on those teachers who “will make a difference”. Lack of a sixth form is not seen as a disadvantage. The cornerstone of the school’s recruitment policy is to offer placements for trainee teachers - the school usually has four or five, as potential members of staff. This skews the staff profile to the younger end. The school rarely advertises for heads of department, preferring to grow its own from among the staff.
Staff retention is very good. This has been achieved by concentrating on the quality of the teaching environment, on creating a culture of learning, supporting staff, and seeking to inspire pupils with a sense of what a good education can do for them. Teachers do not have to do cover duties. The classrooms are well-resourced. There is out-of-hours payment and a life coach to work with staff. Discipline is shaped around the belief that pupils are there to learn. Those with difficulties are helped through a newly-refurbished learning support centre staffed by four learning mentors. The headteacher believes that in an inner city school the tone set is particularly important in attracting teachers and getting them to stay.
98
Box C3: South East - High Secondary School C: South East Region, Community, Comprehensive, 11-16, Mixed, Specialist, Size 1,001-1,300.
Turnover in this school is high. During the last three years there have been 45 resignations from an establishment of 69 teachers. Movement was particularly high in 2002 when 17 teachers left and also in 2004 when there were 16 resignations. Just over half were leaving to go to other schools, either for promotion or as a sideways move. Other moves cover the range of destinations. Of these a substantial group went to ‘other employment’. This included training for the priesthood, counselling, and running a business.
The school is on the fringe of a commuter town south of London serving a mixed catchment area. Overall the percentage of free school meals (5%) is well below the national average. But there are pockets of unemployment, deprivation and high mobility together with areas of affluence.
High turnover together with recruitment difficulties can be attributed in large part to the town’s poor image within the county, yet the price of housing is still a deterrent and young recruits move out of the area after two or three years in post. Frequent movement associated with a partner’s job also contributes to rapid turnover. The school cannot attract national fields of applicants or teachers from the London allowance area. The staff who tend to stay are usually those with friends and family connections in the area. The core subjects are particularly difficult to staff. The science department has not been fully staffed since 2002 and exam results have suffered, GCSE results falling from the county average to below.
Other schools in the locality are similarly affected by the difficulties of attracting and retaining staff. Much time is spent in recruiting, marketing and nurturing. This involves the skilful use of responsibility points and opportunities for professional development. Imaginative ways of using staff are devised to fill gaps in staffing. Young staff are trained up to head of department roles but in doing so some are lost to promotion elsewhere. Specialist status, participation in teacher training, including the overseas programme also contribute to recruitment.
99
Box C4: South East - Low Secondary School D: South East Region, Foundation, Comprehensive, 11-18, Mixed, Specialist, Size 1,301-1,600.
In this large school with 106 staff, fewer than 25% (23) have left during the last three years. Typically about half of them have moved to other teaching posts either for promotion or because of personal circumstances. The other main destinations are to travel (4), retirement (3), family care and maternity (3).
The school is attractively located within reach of the coast and surrounded by a rural environment. The cost of housing in the area is high and most of the staff, especially the younger teachers, live distant from the town. Generally affluent with high employment, the percentage of pupils eligible for free school meals is very low, at about 3 per cent.
The attractions of the area, the designation of specialist status and the reputation of the school locally have helped recruitment. Two recent posts in modern languages attracted over seventy applicants between them. Fixed-term contracts are rarely used except for maternity cover and appointments are guided by quality not cheapness.
The school attracts applicants and is able to retain good staff. Performance at GCSE is well above the county and national averages, but a package of contributory factors are involved.
Since it is a large school the headteacher takes the view that it is important to have teams that feel they have some control over what they do, with devolved leadership roles. Teachers are provided with adequate resources to do the job and there is a supportive school discipline policy incorporating a specialised programme of study for some very difficult year 10 and 11 pupils.
Likewise there is a sensible interpretation of working conditions. Recognition is given for work done and new challenges are offered to long serving staff. There is promotion from within for very good candidates in partnership with a policy of succession planning as the Senior Management Team approaches retirement age. Crucially it is believed the school must keep moving forward to create new opportunities for staff and pupils and for them to be proud of their school.
100
Box C5: East Midlands - High Secondary School E: East Midlands Region, Community, Comprehensive, 11-18, Mixed, Specialist, Size 1,301-1,600.
Staff turnover is high. Since 2002, 49 out of a total teaching staff of 83 have vacated their posts. Over half the teachers (27) resigning went to other schools. Moves to promoted posts, especially within the local area where housing is still reasonably affordable, are a major element in turnover.
This is a popular, over-subscribed school with an expanding sixth form which has an extensive and rural catchment. Most of the pupils are bussed in. The school takes the full ability range, but its intake is skewed towards the above average in ability, is articulate and in some cases challenging. The area is prosperous. Less than 3 per cent of pupils are eligible for free school meals. The socio-economic base is split between professional parents, who work in the surrounding large towns or commute to London, and those local to the area or who tend to be less educated and more likely to be unemployed.
Recruitment difficulties are ameliorated by the school’s involvement with teacher training through the local SCITT partnership, the HE-led PGCE and the GTP, which together provide a reservoir of potential applicants. Full-time posts are advertised nationally and on the school’s website. Appointments are normally made without the need to re-advertise. Part-time vacancies, which appear in the local press only, are costly and more troublesome to fill.
With a predominantly young staff there are policies in place to improve retention. Teachers of three to four years experience, those maybe looking to move up, are able to bid for research points. The school is part of a cluster group, which runs an in-house Masters degree for staff looking to enhance their professional development. The Network Learning Community, part of the cluster group structure, provides on-line support for both teachers and pupils. Young heads of department are given support to move into whole school management roles through liaison with NCSL. Staff wanting to move on are offered an exit interview before making the decision to go.
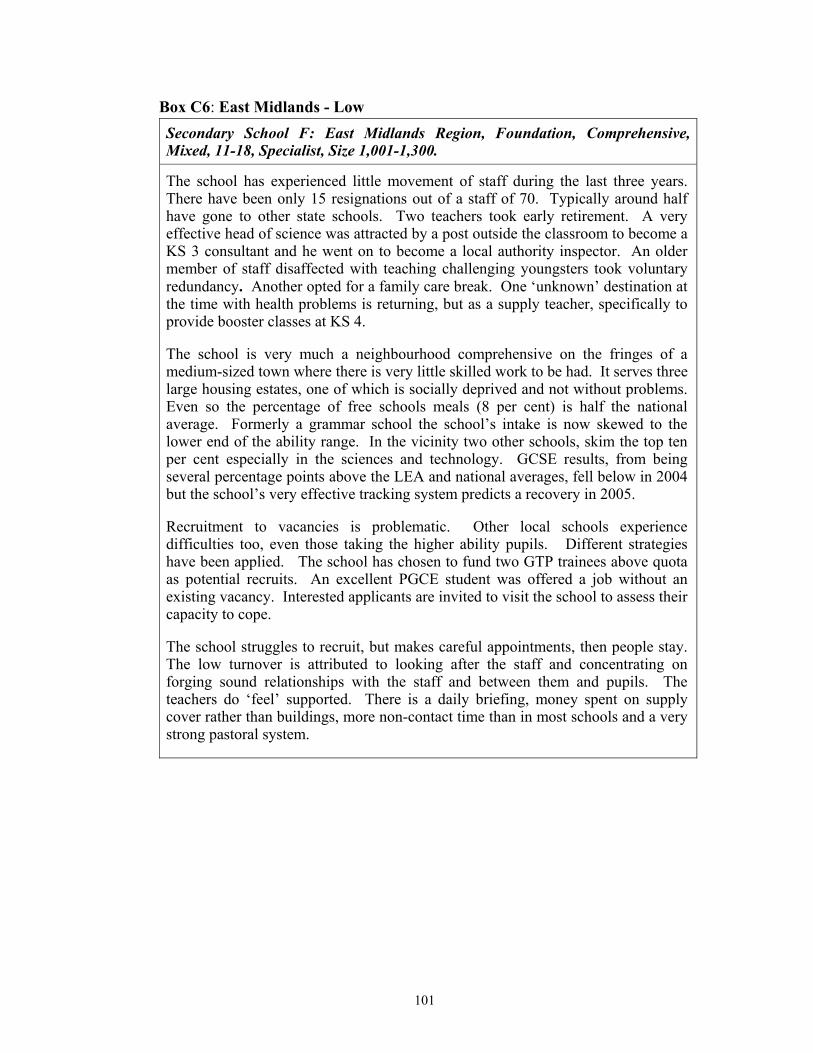
101
Box C6: East Midlands - Low Secondary School F: East Midlands Region, Foundation, Comprehensive, Mixed, 11-18, Specialist, Size 1,001-1,300.
The school has experienced little movement of staff during the last three years. There have been only 15 resignations out of a staff of 70. Typically around half have gone to other state schools. Two teachers took early retirement. A very effective head of science was attracted by a post outside the classroom to become a KS 3 consultant and he went on to become a local authority inspector. An older member of staff disaffected with teaching challenging youngsters took voluntary redundancy. Another opted for a family care break. One ‘unknown’ destination at the time with health problems is returning, but as a supply teacher, specifically to provide booster classes at KS 4.
The school is very much a neighbourhood comprehensive on the fringes of a medium-sized town where there is very little skilled work to be had. It serves three large housing estates, one of which is socially deprived and not without problems. Even so the percentage of free schools meals (8 per cent) is half the national average. Formerly a grammar school the school’s intake is now skewed to the lower end of the ability range. In the vicinity two other schools, skim the top ten per cent especially in the sciences and technology. GCSE results, from being several percentage points above the LEA and national averages, fell below in 2004 but the school’s very effective tracking system predicts a recovery in 2005.
Recruitment to vacancies is problematic. Other local schools experience difficulties too, even those taking the higher ability pupils. Different strategies have been applied. The school has chosen to fund two GTP trainees above quota as potential recruits. An excellent PGCE student was offered a job without an existing vacancy. Interested applicants are invited to visit the school to assess their capacity to cope.
The school struggles to recruit, but makes careful appointments, then people stay. The low turnover is attributed to looking after the staff and concentrating on forging sound relationships with the staff and between them and pupils. The teachers do ‘feel’ supported. There is a daily briefing, money spent on supply cover rather than buildings, more non-contact time than in most schools and a very strong pastoral system.
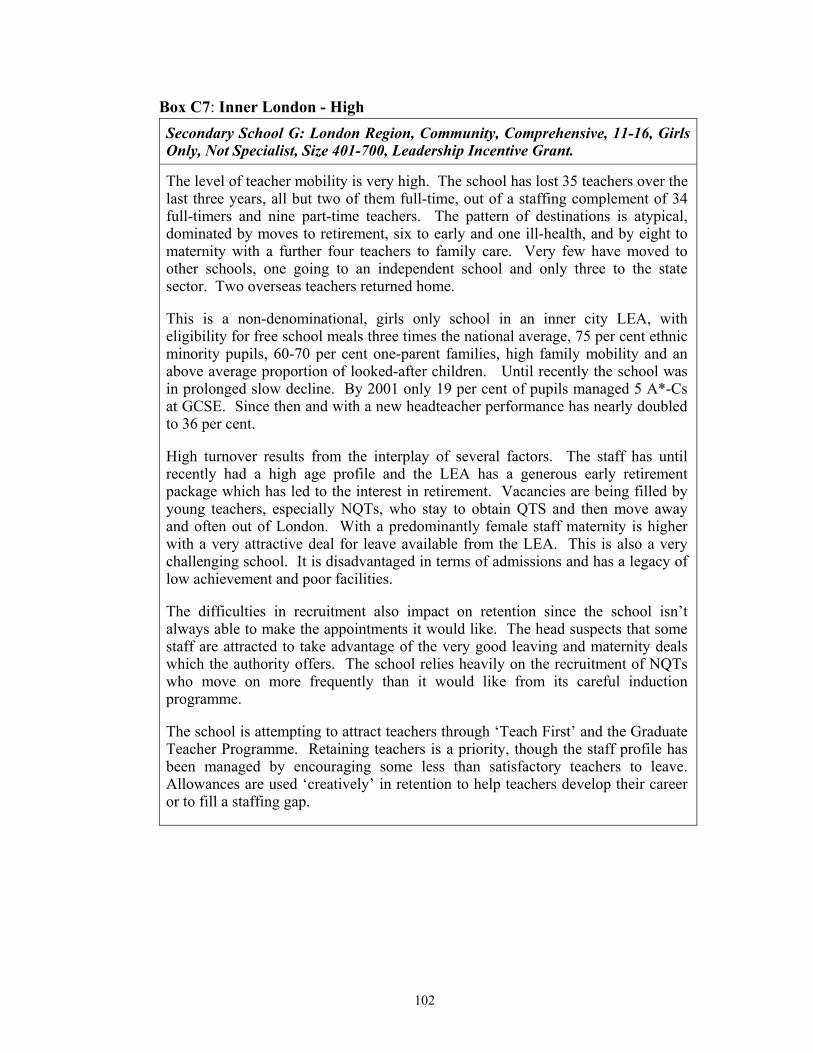
102
Box C7: Inner London - High Secondary School G: London Region, Community, Comprehensive, 11-16, Girls Only, Not Specialist, Size 401-700, Leadership Incentive Grant.
The level of teacher mobility is very high. The school has lost 35 teachers over the last three years, all but two of them full-time, out of a staffing complement of 34 full-timers and nine part-time teachers. The pattern of destinations is atypical, dominated by moves to retirement, six to early and one ill-health, and by eight to maternity with a further four teachers to family care. Very few have moved to other schools, one going to an independent school and only three to the state sector. Two overseas teachers returned home.
This is a non-denominational, girls only school in an inner city LEA, with eligibility for free school meals three times the national average, 75 per cent ethnic minority pupils, 60-70 per cent one-parent families, high family mobility and an above average proportion of looked-after children. Until recently the school was in prolonged slow decline. By 2001 only 19 per cent of pupils managed 5 A*-Cs at GCSE. Since then and with a new headteacher performance has nearly doubled to 36 per cent.
High turnover results from the interplay of several factors. The staff has until recently had a high age profile and the LEA has a generous early retirement package which has led to the interest in retirement. Vacancies are being filled by young teachers, especially NQTs, who stay to obtain QTS and then move away and often out of London. With a predominantly female staff maternity is higher with a very attractive deal for leave available from the LEA. This is also a very challenging school. It is disadvantaged in terms of admissions and has a legacy of low achievement and poor facilities.
The difficulties in recruitment also impact on retention since the school isn’t always able to make the appointments it would like. The head suspects that some staff are attracted to take advantage of the very good leaving and maternity deals which the authority offers. The school relies heavily on the recruitment of NQTs who move on more frequently than it would like from its careful induction programme.
The school is attempting to attract teachers through ‘Teach First’ and the Graduate Teacher Programme. Retaining teachers is a priority, though the staff profile has been managed by encouraging some less than satisfactory teachers to leave. Allowances are used ‘creatively’ in retention to help teachers develop their career or to fill a staffing gap.
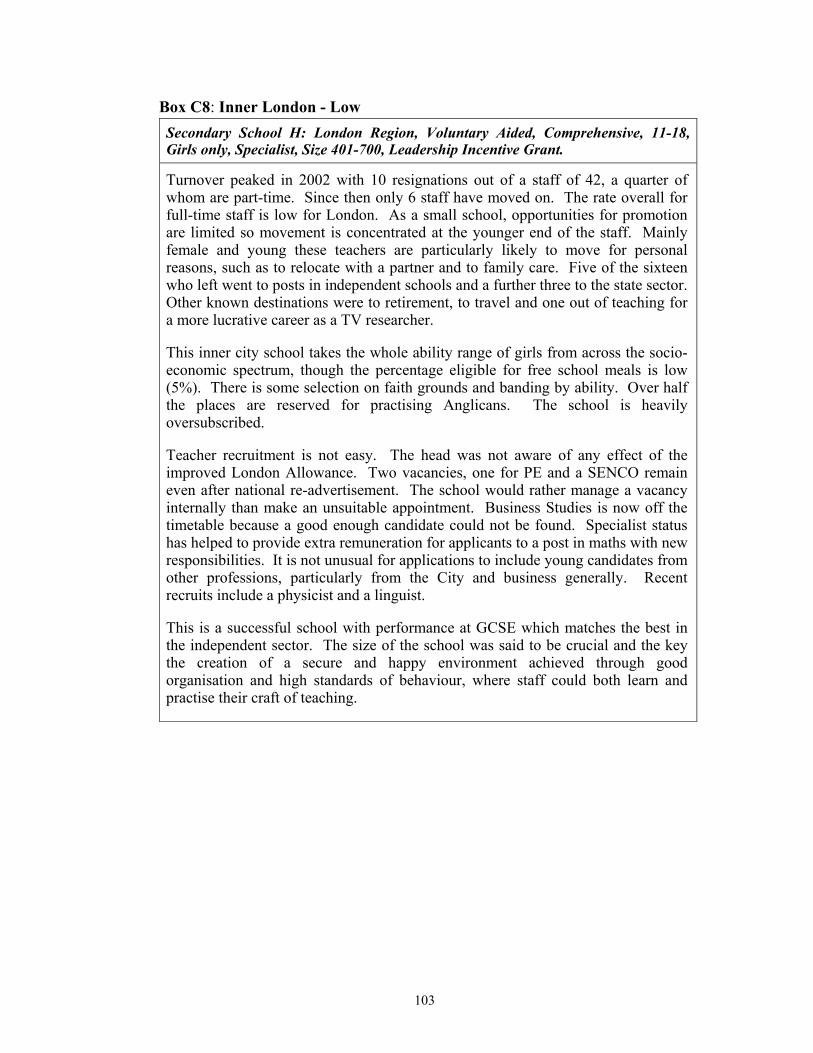
103
Box C8: Inner London - Low Secondary School H: London Region, Voluntary Aided, Comprehensive, 11-18, Girls only, Specialist, Size 401-700, Leadership Incentive Grant.
Turnover peaked in 2002 with 10 resignations out of a staff of 42, a quarter of whom are part-time. Since then only 6 staff have moved on. The rate overall for full-time staff is low for London. As a small school, opportunities for promotion are limited so movement is concentrated at the younger end of the staff. Mainly female and young these teachers are particularly likely to move for personal reasons, such as to relocate with a partner and to family care. Five of the sixteen who left went to posts in independent schools and a further three to the state sector. Other known destinations were to retirement, to travel and one out of teaching for a more lucrative career as a TV researcher.
This inner city school takes the whole ability range of girls from across the socio-economic spectrum, though the percentage eligible for free school meals is low (5%). There is some selection on faith grounds and banding by ability. Over half the places are reserved for practising Anglicans. The school is heavily oversubscribed.
Teacher recruitment is not easy. The head was not aware of any effect of the improved London Allowance. Two vacancies, one for PE and a SENCO remain even after national re-advertisement. The school would rather manage a vacancy internally than make an unsuitable appointment. Business Studies is now off the timetable because a good enough candidate could not be found. Specialist status has helped to provide extra remuneration for applicants to a post in maths with new responsibilities. It is not unusual for applications to include young candidates from other professions, particularly from the City and business generally. Recent recruits include a physicist and a linguist.
This is a successful school with performance at GCSE which matches the best in the independent sector. The size of the school was said to be crucial and the key the creation of a secure and happy environment achieved through good organisation and high standards of behaviour, where staff could both learn and practise their craft of teaching.
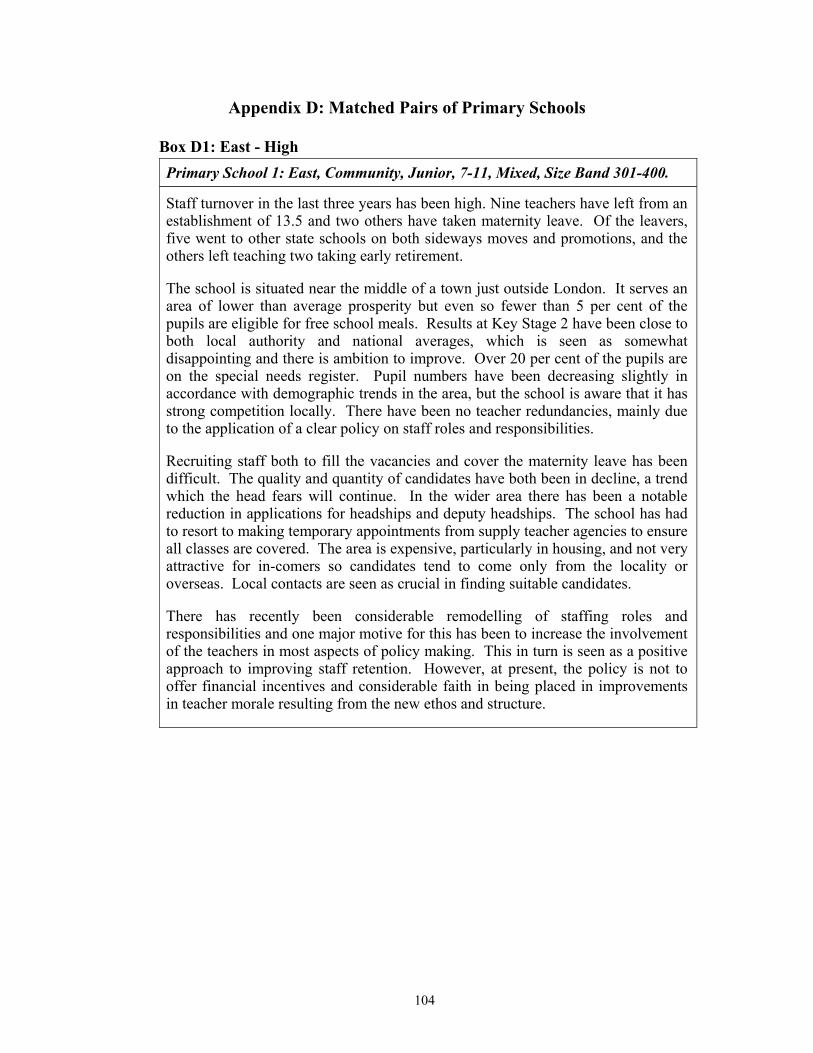
104
Appendix D: Matched Pairs of Primary Schools
Box D1: East - High Primary School 1: East, Community, Junior, 7-11, Mixed, Size Band 301-400.
Staff turnover in the last three years has been high. Nine teachers have left from an establishment of 13.5 and two others have taken maternity leave. Of the leavers, five went to other state schools on both sideways moves and promotions, and the others left teaching two taking early retirement.
The school is situated near the middle of a town just outside London. It serves an area of lower than average prosperity but even so fewer than 5 per cent of the pupils are eligible for free school meals. Results at Key Stage 2 have been close to both local authority and national averages, which is seen as somewhat disappointing and there is ambition to improve. Over 20 per cent of the pupils are on the special needs register. Pupil numbers have been decreasing slightly in accordance with demographic trends in the area, but the school is aware that it has strong competition locally. There have been no teacher redundancies, mainly due to the application of a clear policy on staff roles and responsibilities.
Recruiting staff both to fill the vacancies and cover the maternity leave has been difficult. The quality and quantity of candidates have both been in decline, a trend which the head fears will continue. In the wider area there has been a notable reduction in applications for headships and deputy headships. The school has had to resort to making temporary appointments from supply teacher agencies to ensure all classes are covered. The area is expensive, particularly in housing, and not very attractive for in-comers so candidates tend to come only from the locality or overseas. Local contacts are seen as crucial in finding suitable candidates.
There has recently been considerable remodelling of staffing roles and responsibilities and one major motive for this has been to increase the involvement of the teachers in most aspects of policy making. This in turn is seen as a positive approach to improving staff retention. However, at present, the policy is not to offer financial incentives and considerable faith in being placed in improvements in teacher morale resulting from the new ethos and structure.
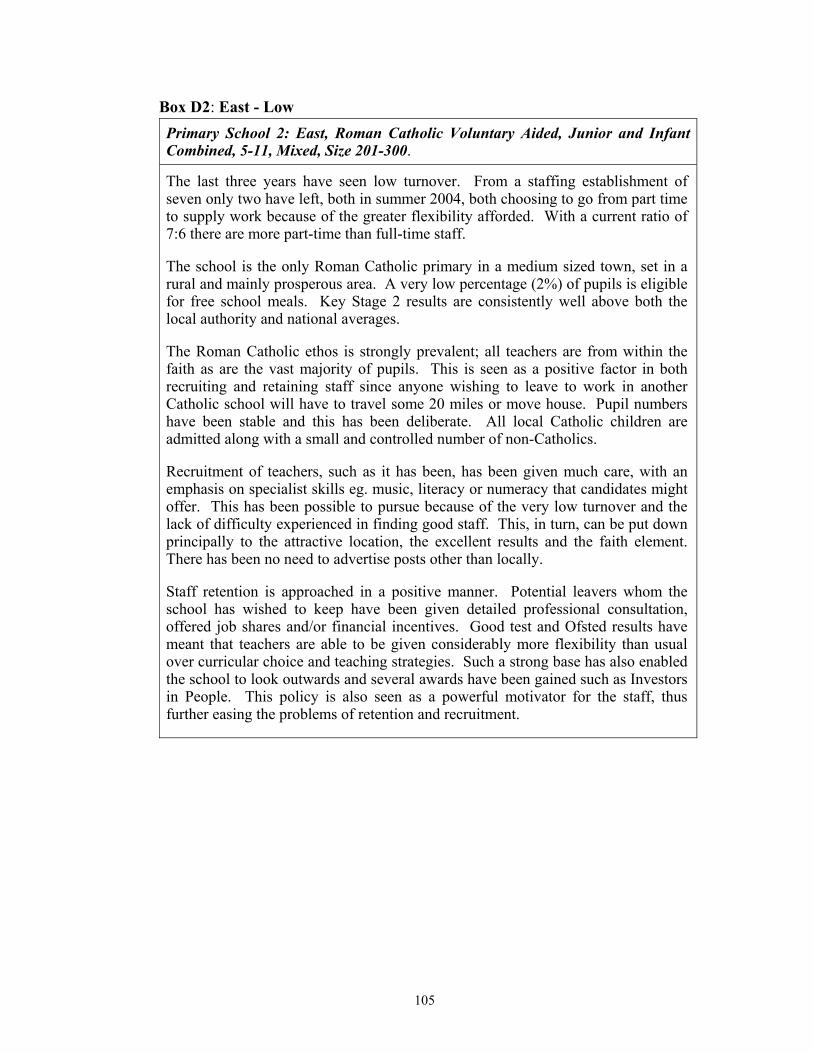
105
Box D2: East - Low Primary School 2: East, Roman Catholic Voluntary Aided, Junior and Infant Combined, 5-11, Mixed, Size 201-300.
The last three years have seen low turnover. From a staffing establishment of seven only two have left, both in summer 2004, both choosing to go from part time to supply work because of the greater flexibility afforded. With a current ratio of 7:6 there are more part-time than full-time staff.
The school is the only Roman Catholic primary in a medium sized town, set in a rural and mainly prosperous area. A very low percentage (2%) of pupils is eligible for free school meals. Key Stage 2 results are consistently well above both the local authority and national averages.
The Roman Catholic ethos is strongly prevalent; all teachers are from within the faith as are the vast majority of pupils. This is seen as a positive factor in both recruiting and retaining staff since anyone wishing to leave to work in another Catholic school will have to travel some 20 miles or move house. Pupil numbers have been stable and this has been deliberate. All local Catholic children are admitted along with a small and controlled number of non-Catholics.
Recruitment of teachers, such as it has been, has been given much care, with an emphasis on specialist skills eg. music, literacy or numeracy that candidates might offer. This has been possible to pursue because of the very low turnover and the lack of difficulty experienced in finding good staff. This, in turn, can be put down principally to the attractive location, the excellent results and the faith element. There has been no need to advertise posts other than locally.
Staff retention is approached in a positive manner. Potential leavers whom the school has wished to keep have been given detailed professional consultation, offered job shares and/or financial incentives. Good test and Ofsted results have meant that teachers are able to be given considerably more flexibility than usual over curricular choice and teaching strategies. Such a strong base has also enabled the school to look outwards and several awards have been gained such as Investors in People. This policy is also seen as a powerful motivator for the staff, thus further easing the problems of retention and recruitment.
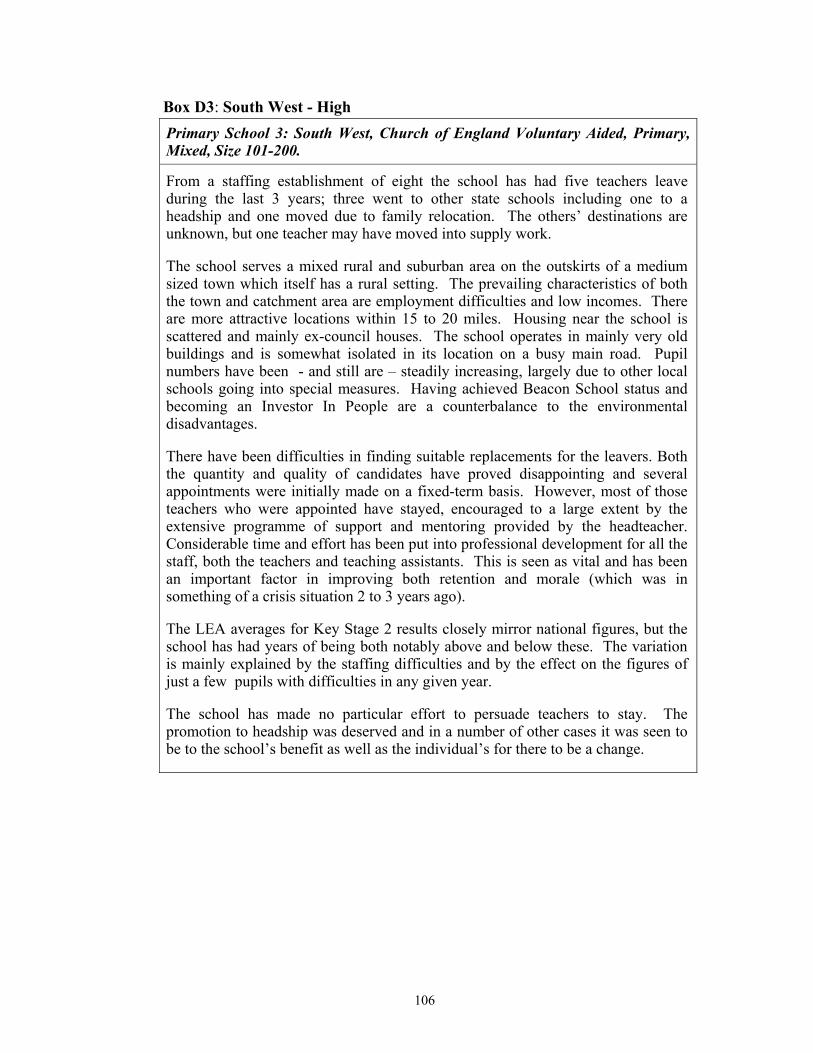
106
Box D3: South West - High Primary School 3: South West, Church of England Voluntary Aided, Primary, Mixed, Size 101-200.
From a staffing establishment of eight the school has had five teachers leave during the last 3 years; three went to other state schools including one to a headship and one moved due to family relocation. The others’ destinations are unknown, but one teacher may have moved into supply work.
The school serves a mixed rural and suburban area on the outskirts of a medium sized town which itself has a rural setting. The prevailing characteristics of both the town and catchment area are employment difficulties and low incomes. There are more attractive locations within 15 to 20 miles. Housing near the school is scattered and mainly ex-council houses. The school operates in mainly very old buildings and is somewhat isolated in its location on a busy main road. Pupil numbers have been - and still are – steadily increasing, largely due to other local schools going into special measures. Having achieved Beacon School status and becoming an Investor In People are a counterbalance to the environmental disadvantages.
There have been difficulties in finding suitable replacements for the leavers. Both the quantity and quality of candidates have proved disappointing and several appointments were initially made on a fixed-term basis. However, most of those teachers who were appointed have stayed, encouraged to a large extent by the extensive programme of support and mentoring provided by the headteacher. Considerable time and effort has been put into professional development for all the staff, both the teachers and teaching assistants. This is seen as vital and has been an important factor in improving both retention and morale (which was in something of a crisis situation 2 to 3 years ago).
The LEA averages for Key Stage 2 results closely mirror national figures, but the school has had years of being both notably above and below these. The variation is mainly explained by the staffing difficulties and by the effect on the figures of just a few pupils with difficulties in any given year.
The school has made no particular effort to persuade teachers to stay. The promotion to headship was deserved and in a number of other cases it was seen to be to the school’s benefit as well as the individual’s for there to be a change.
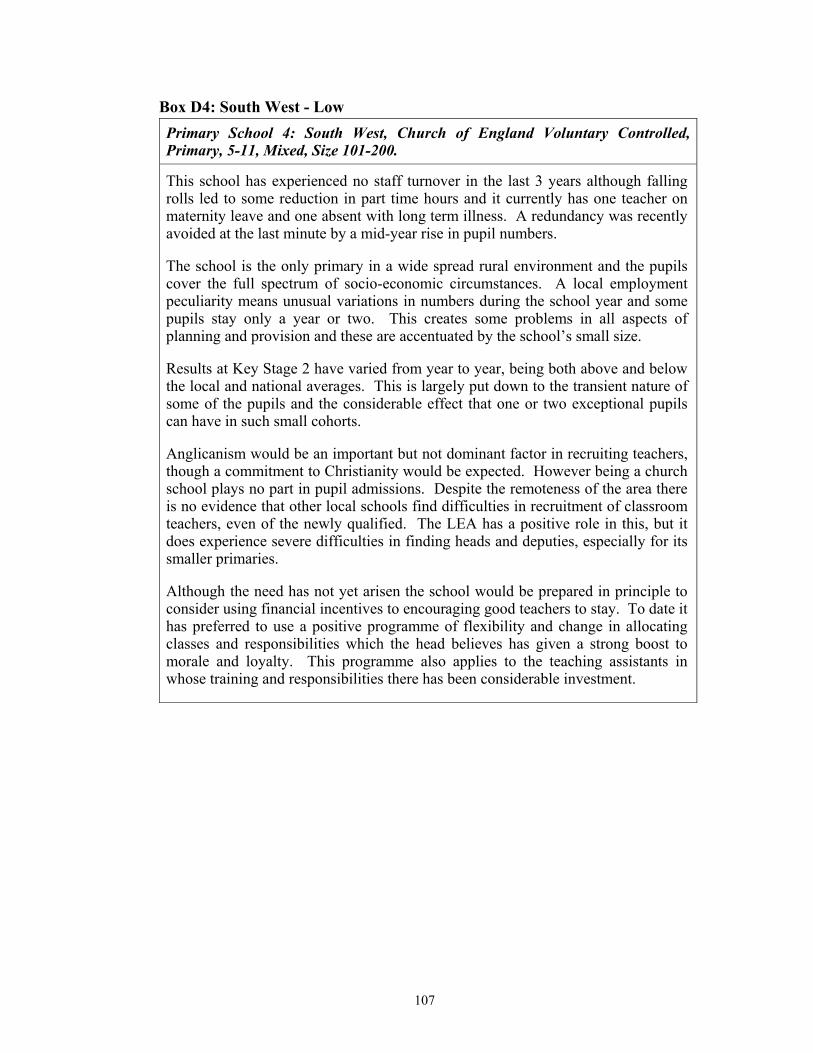
107
Box D4: South West - Low Primary School 4: South West, Church of England Voluntary Controlled, Primary, 5-11, Mixed, Size 101-200.
This school has experienced no staff turnover in the last 3 years although falling rolls led to some reduction in part time hours and it currently has one teacher on maternity leave and one absent with long term illness. A redundancy was recently avoided at the last minute by a mid-year rise in pupil numbers.
The school is the only primary in a wide spread rural environment and the pupils cover the full spectrum of socio-economic circumstances. A local employment peculiarity means unusual variations in numbers during the school year and some pupils stay only a year or two. This creates some problems in all aspects of planning and provision and these are accentuated by the school’s small size.
Results at Key Stage 2 have varied from year to year, being both above and below the local and national averages. This is largely put down to the transient nature of some of the pupils and the considerable effect that one or two exceptional pupils can have in such small cohorts.
Anglicanism would be an important but not dominant factor in recruiting teachers, though a commitment to Christianity would be expected. However being a church school plays no part in pupil admissions. Despite the remoteness of the area there is no evidence that other local schools find difficulties in recruitment of classroom teachers, even of the newly qualified. The LEA has a positive role in this, but it does experience severe difficulties in finding heads and deputies, especially for its smaller primaries.
Although the need has not yet arisen the school would be prepared in principle to consider using financial incentives to encouraging good teachers to stay. To date it has preferred to use a positive programme of flexibility and change in allocating classes and responsibilities which the head believes has given a strong boost to morale and loyalty. This programme also applies to the teaching assistants in whose training and responsibilities there has been considerable investment.
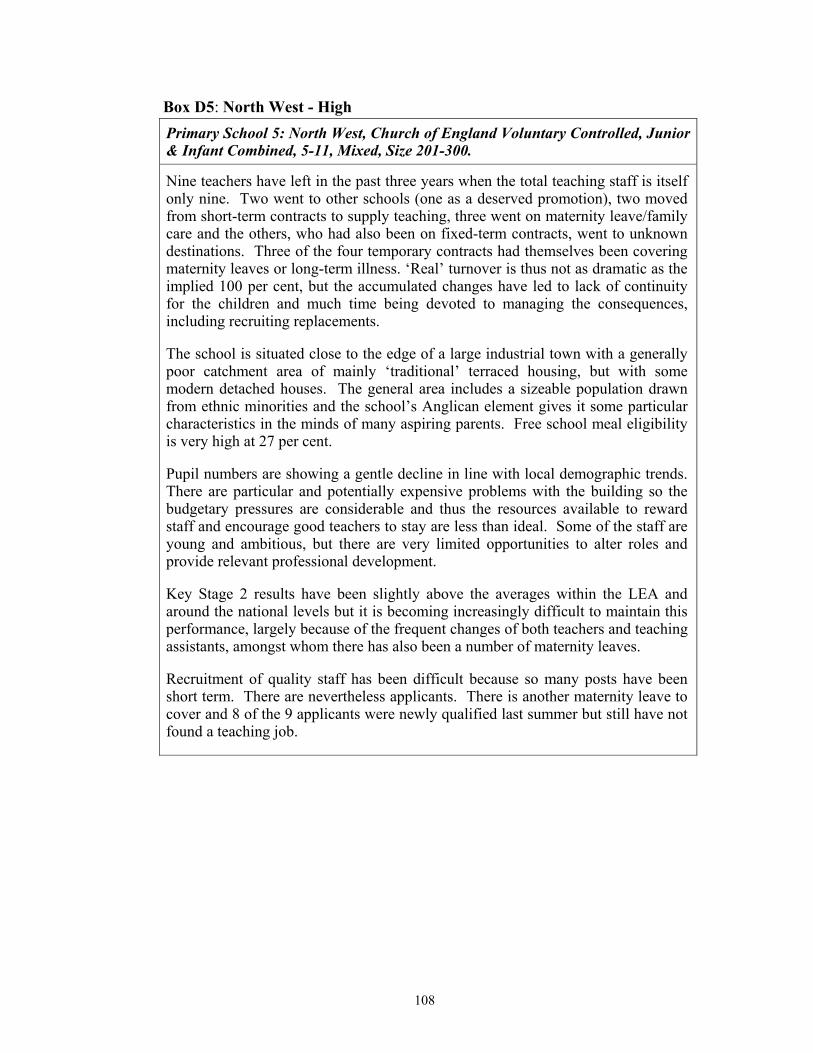
108
Box D5: North West - High Primary School 5: North West, Church of England Voluntary Controlled, Junior & Infant Combined, 5-11, Mixed, Size 201-300.
Nine teachers have left in the past three years when the total teaching staff is itself only nine. Two went to other schools (one as a deserved promotion), two moved from short-term contracts to supply teaching, three went on maternity leave/family care and the others, who had also been on fixed-term contracts, went to unknown destinations. Three of the four temporary contracts had themselves been covering maternity leaves or long-term illness. ‘Real’ turnover is thus not as dramatic as the implied 100 per cent, but the accumulated changes have led to lack of continuity for the children and much time being devoted to managing the consequences, including recruiting replacements.
The school is situated close to the edge of a large industrial town with a generally poor catchment area of mainly ‘traditional’ terraced housing, but with some modern detached houses. The general area includes a sizeable population drawn from ethnic minorities and the school’s Anglican element gives it some particular characteristics in the minds of many aspiring parents. Free school meal eligibility is very high at 27 per cent.
Pupil numbers are showing a gentle decline in line with local demographic trends. There are particular and potentially expensive problems with the building so the budgetary pressures are considerable and thus the resources available to reward staff and encourage good teachers to stay are less than ideal. Some of the staff are young and ambitious, but there are very limited opportunities to alter roles and provide relevant professional development.
Key Stage 2 results have been slightly above the averages within the LEA and around the national levels but it is becoming increasingly difficult to maintain this performance, largely because of the frequent changes of both teachers and teaching assistants, amongst whom there has also been a number of maternity leaves.
Recruitment of quality staff has been difficult because so many posts have been short term. There are nevertheless applicants. There is another maternity leave to cover and 8 of the 9 applicants were newly qualified last summer but still have not found a teaching job.
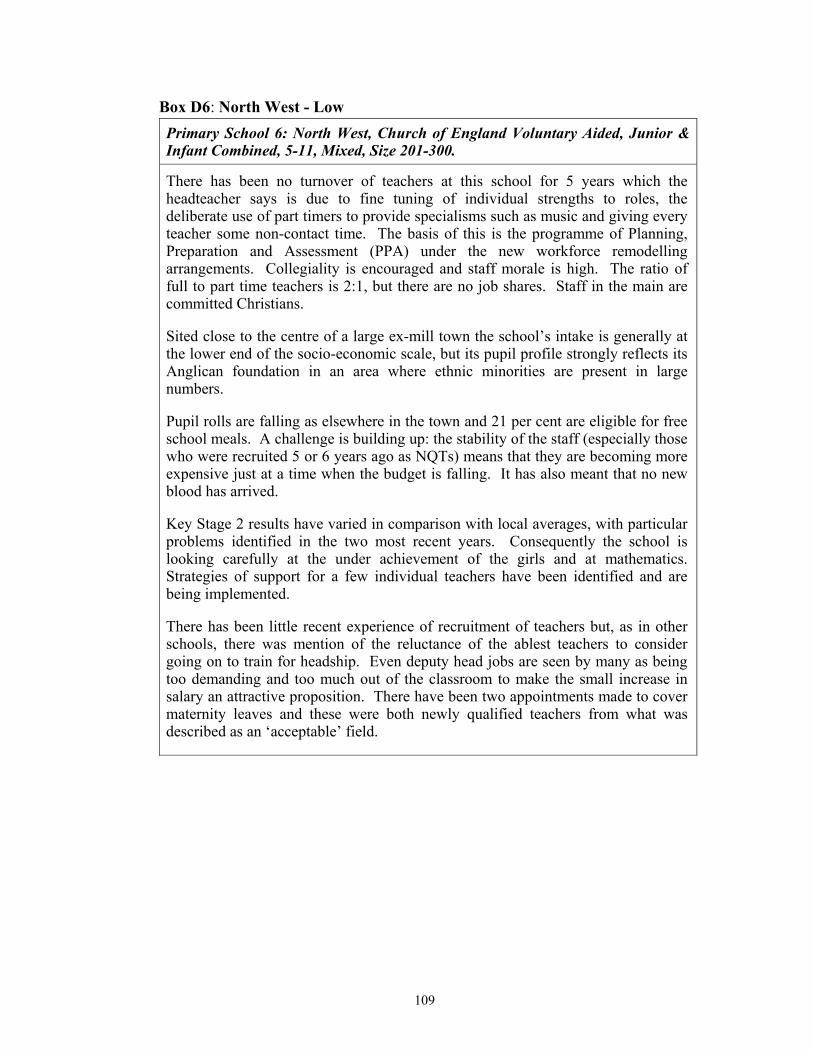
109
Box D6: North West - Low Primary School 6: North West, Church of England Voluntary Aided, Junior & Infant Combined, 5-11, Mixed, Size 201-300.
There has been no turnover of teachers at this school for 5 years which the headteacher says is due to fine tuning of individual strengths to roles, the deliberate use of part timers to provide specialisms such as music and giving every teacher some non-contact time. The basis of this is the programme of Planning, Preparation and Assessment (PPA) under the new workforce remodelling arrangements. Collegiality is encouraged and staff morale is high. The ratio of full to part time teachers is 2:1, but there are no job shares. Staff in the main are committed Christians.
Sited close to the centre of a large ex-mill town the school’s intake is generally at the lower end of the socio-economic scale, but its pupil profile strongly reflects its Anglican foundation in an area where ethnic minorities are present in large numbers.
Pupil rolls are falling as elsewhere in the town and 21 per cent are eligible for free school meals. A challenge is building up: the stability of the staff (especially those who were recruited 5 or 6 years ago as NQTs) means that they are becoming more expensive just at a time when the budget is falling. It has also meant that no new blood has arrived.
Key Stage 2 results have varied in comparison with local averages, with particular problems identified in the two most recent years. Consequently the school is looking carefully at the under achievement of the girls and at mathematics. Strategies of support for a few individual teachers have been identified and are being implemented.
There has been little recent experience of recruitment of teachers but, as in other schools, there was mention of the reluctance of the ablest teachers to consider going on to train for headship. Even deputy head jobs are seen by many as being too demanding and too much out of the classroom to make the small increase in salary an attractive proposition. There have been two appointments made to cover maternity leaves and these were both newly qualified teachers from what was described as an ‘acceptable’ field.
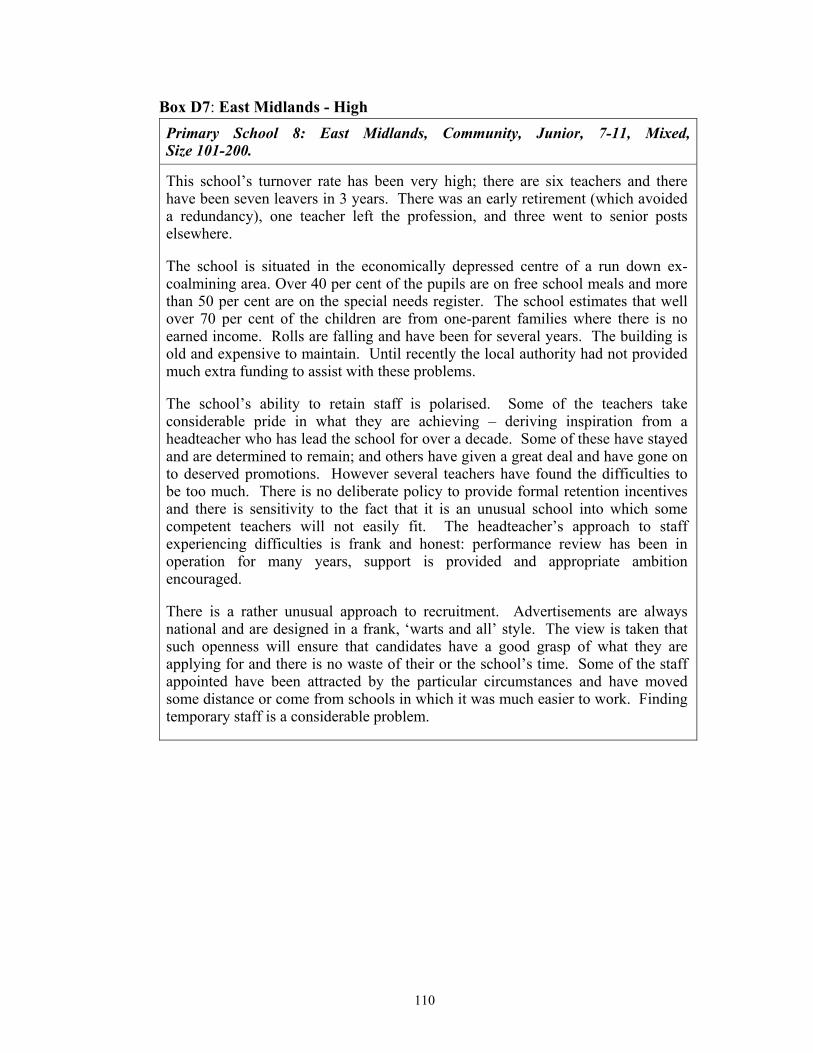
110
Box D7: East Midlands - High Primary School 8: East Midlands, Community, Junior, 7-11, Mixed, Size 101-200.
This school’s turnover rate has been very high; there are six teachers and there have been seven leavers in 3 years. There was an early retirement (which avoided a redundancy), one teacher left the profession, and three went to senior posts elsewhere.
The school is situated in the economically depressed centre of a run down ex-coalmining area. Over 40 per cent of the pupils are on free school meals and more than 50 per cent are on the special needs register. The school estimates that well over 70 per cent of the children are from one-parent families where there is no earned income. Rolls are falling and have been for several years. The building is old and expensive to maintain. Until recently the local authority had not provided much extra funding to assist with these problems.
The school’s ability to retain staff is polarised. Some of the teachers take considerable pride in what they are achieving – deriving inspiration from a headteacher who has lead the school for over a decade. Some of these have stayed and are determined to remain; and others have given a great deal and have gone on to deserved promotions. However several teachers have found the difficulties to be too much. There is no deliberate policy to provide formal retention incentives and there is sensitivity to the fact that it is an unusual school into which some competent teachers will not easily fit. The headteacher’s approach to staff experiencing difficulties is frank and honest: performance review has been in operation for many years, support is provided and appropriate ambition encouraged.
There is a rather unusual approach to recruitment. Advertisements are always national and are designed in a frank, ‘warts and all’ style. The view is taken that such openness will ensure that candidates have a good grasp of what they are applying for and there is no waste of their or the school’s time. Some of the staff appointed have been attracted by the particular circumstances and have moved some distance or come from schools in which it was much easier to work. Finding temporary staff is a considerable problem.
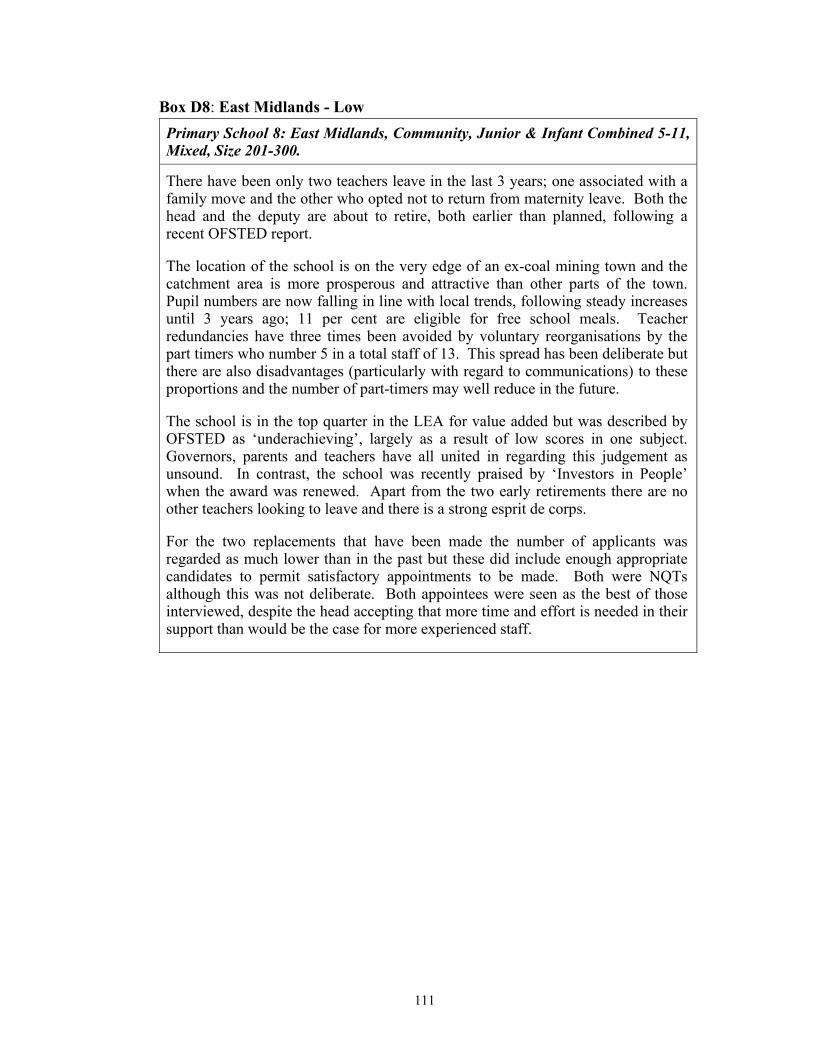
111
Box D8: East Midlands - Low Primary School 8: East Midlands, Community, Junior & Infant Combined 5-11, Mixed, Size 201-300.
There have been only two teachers leave in the last 3 years; one associated with a family move and the other who opted not to return from maternity leave. Both the head and the deputy are about to retire, both earlier than planned, following a recent OFSTED report.
The location of the school is on the very edge of an ex-coal mining town and the catchment area is more prosperous and attractive than other parts of the town. Pupil numbers are now falling in line with local trends, following steady increases until 3 years ago; 11 per cent are eligible for free school meals. Teacher redundancies have three times been avoided by voluntary reorganisations by the part timers who number 5 in a total staff of 13. This spread has been deliberate but there are also disadvantages (particularly with regard to communications) to these proportions and the number of part-timers may well reduce in the future.
The school is in the top quarter in the LEA for value added but was described by OFSTED as ‘underachieving’, largely as a result of low scores in one subject. Governors, parents and teachers have all united in regarding this judgement as unsound. In contrast, the school was recently praised by ‘Investors in People’ when the award was renewed. Apart from the two early retirements there are no other teachers looking to leave and there is a strong esprit de corps.
For the two replacements that have been made the number of applicants was regarded as much lower than in the past but these did include enough appropriate candidates to permit satisfactory appointments to be made. Both were NQTs although this was not deliberate. Both appointees were seen as the best of those interviewed, despite the head accepting that more time and effort is needed in their support than would be the case for more experienced staff.

Copies of this publication can be obtained from:
DfES PublicationsP.O. Box 5050Sherwood ParkAnnesleyNottinghamNG15 0DJ
Tel: 0845 60 222 60Fax: 0845 60 333 60Minicom: 0845 60 555 60Oneline: www.dfespublications.gov.uk
© Crown Copyright 2005
Produced by the Department for Education and Skills
ISBN 1 84478 483 5Ref No: RR640www.dfes.go.uk/research