teacher manual master eia
DESCRIPTION
goodTRANSCRIPT
\
Teachers Mannual
ENVIRONMENTAL IMPACT ASSESSMENT
For
Science, Art, Management and Other Post Graduate Courses
For Department of Technical Education Govt. of Uttarakhand
ALTERNATE HYDRO ENERGY CENTRE INDIAN INSTITUTE OF TECHNOLOGYR, ROORKEE
July 2007
LIST OF CONTENTS
Chapters Title Page No. Lecture No.About the Course 1
CHAPTER-1 3
1.0 Introduction to Environment 3 1
1.1 Atmosphere 4 2
1.2 Hydrosphere 12 3, 4
1.3 Lithosphere 17 5
1.4 Biosphere 20 5
CHAPTER-2 22
2.0 Resource Management and Sustainable Development
22 6, 7
CHAPTER- 3 28
3.0 Environment Pollution and Quality 28 8
3.1 Atmospheric Pollution 28 9
3.2 Water Pollution and Water Quality 33 10, 11
3.3 Land Pollution 44 12, 13
3.4 Pollution Cycle 47 13
CHAPTER-4 50
4.0 Environmental Protection Acts, Rules, Regulations and Standards
50 16
4.2 The Water (Prevention and Control of Pollution) Act, 1974
51 15
4.3 Air (Prevention and Control of Pollution) Act, 1981 (Act No. 14 of 1981)
66 16, 17
4.4 Environmental Protection Act 79 18, 19
4.5 EIA Notification (Guidelines) 88 20, 21
CHAPTER-5 Environment Impact Assessment 100 22
5.2 Environment Impacts 104 23, 24
5.3 Identify Activities 114 25
5.4 Impact Prediction 117 25
5.7 Methodologies 120
5.8 Reviewing of EIA and EMP Reports 122 26, 27
CHAPTER–6 Assessment of Socio Economic Impacts 128 28, 20
CHAPTER–7 Procedure of EIA Clearance 133 30
CHAPTER–8 Environment Management 137
8.1 Natural Resources Conservation 137 31
8.2 Conservation of Energy 141 32
8.3 Pollution prevention 145 33
8.4 Disposal of Treated effluents 147 34, 35
8.5 Solid Waste Disposal 151 36, 37
8.6 Environmental Audit 153 38
8.7 Concept of green cities 163 39
CHAPTER–9 Post Project Monitoring Case History 40, 41, 42
PREFACE
Lecture notes for the proposed Engineering Degree Level Course entitled “Environmental
Impact Assessment” for all branches is in accordance with the approved syllabus. These have
been prepared by Prof RP Mathur, Former Professor (Environment Engg), Deptt. of Civil
(1963-1995). Modern trends in design are brought out. Copies of some relevant published/
unpublished papers on various aspects of design are included. It may be noted that published
design papers are relevant to the design practice at the time of publication/ design and must
be used/ modified with relevant to current practice as per references given in the text. The
material in these notes is also part of a book entitled ‘Hydro-electric Engineering Practice in
India’ being complied by author.
(ARUN KUMAR) HEAD, AHEC, IIT, ROORKEE
FOR MASTERS’ DEGREE LEVEL COURSES All Master Level Courses except Management and Commerce
1. Course Title: Environmental Impact Assessment
2.* Contact Hours: L:48 T:0 P:0 3.* Examination Duration (Hrs.): Theory: Practical: 4.* Relative Weightage : CWS PRS MTE ETE PRE 5.* Credit: 6.* Semester: Autumn Spring Both 7. Pre-requisite: NIL 8. Details of Course:
Sl. No. Particulars
Contact Hours
1. Introduction To Environment: Definition, scope, components, structure and composition. Environmental quality, monitoring and base line data.
5
2. Sustainable Development: Present and future development needs; exploitation of natural resources, environmental harmony, economic efficiency and social justice. Symbiotic relationship. Concept of carrying capacity.
4
3. Environmental pollution due to increasing growth rate, population and human interaction. Water, land and air pollution.
6
4. Environmental Protection acts, Rules and Standards, EIA guidelines. 6 5. Environmental Impact Assessment: Definition and scope, preliminary
screening requiring EIA of projects. Impact identification, Assessment of Impact; Impact Evaluation. Types of EIA, rapid and comprehensive.
5
6. Methods of environment impact assessment; ad-hoc method, maps and overlays, check lists, matrix, cause condition impacts.
4
7. Procedure For EIA Clearance: EIA review and screening; state level screening, clearance from DOE and MOEF.
2
8. Environmental Management: Preventive policy of environment, waste minimisation, conservation of water and energy, use of renewable, sources, pollution audit, pollution control strategy, disposal of treated effluents, solid waste disposal concept of green cities, green belt development – Case history.
8
9. Post Project Monitoring 2
Suggested Readings: 1. Jain, R.K., Urban, L.V. and Stacey, G.S., Environment Impact Analysis, Von
Nostrand Reinhold Company. 2. Lawrence, David P., Environmental Impact Assessment (Practical Solutions to
Recurrent Problems), Wiley International, New Jersey. * These are to be decided by the respective University/Board 3. MoEF, GoI, Environment Impact Assessment, Impact Assessment Division, January
2001 (Manual). 4. Water (Prevention and Control of Pollution) Act 1974. Air (Prevention and Control of
Pollution) Act 1981. 5. Trivedi, P.R., Natural Resources Conservation, APH Publishing Corporation, New
Delhi. 6. Westman, Walter E., “Ecology, Impact Assessment and Environment Planning” John
Wiley and Sons, Canada, 1985.
1
ABOUT THE COURSE
Environmental Impact Assessment
Environmental Impact Assessment (EIA) is a planning tool generally accepted as
an integral component of decision making in Sustainable Development. The course is
aimed at providing comprehensive information, on Environment (physical and
biological), its degradation due to developmental activities, methods of determining
consequences or impacts and possible methods of mitigation, to a group of post graduate,
students in Arts, Science and Management. The students who have undergone studies
both in theory and practice in respective disciplines and are knowledgeable in specific
subjects may not be fully aware on the consequences of developmental projects being
planned and executed in the vicinity. They are also anxious to know the world of
futurology, so that they are able to visualize the dreams of next generation.
The rapid growth of population, improvements in standards of living and
concomitant growth of infrastructure have altered the environment, sometimes beyond its
power of resilience. These changes have resulted in ecological crisis and have become a
matter of grave concern to managers and decision makers throughout the world. The
issues both at national and global levels are focussing concern of nodal agencies
(Regulatory Departments, Ministries and Boards) to support sustainable development and
curb and restrain such acts which tend to produce adverse impacts on living conditions of
human, animals, plants and geographical environment.
In India, Ministry of Environment and Forests (MOEF) has been recognized by
Govt. of India as the nodal agency to regulate through its functionaries the provision of
water Act, 1974, Air Act, 1981 and Environmental Protection Act of 1986 and provide
guidelines for its implementation.
As per the procedures outlined, EIA is required to provide a comprehensive
account of the state of existing environment, the stresses produced by diverse activities
and the impacts these will have on various components of environment. The proponents
of the development projects also need to suggest and provide the measures to mitigate the
adverse effects.
2
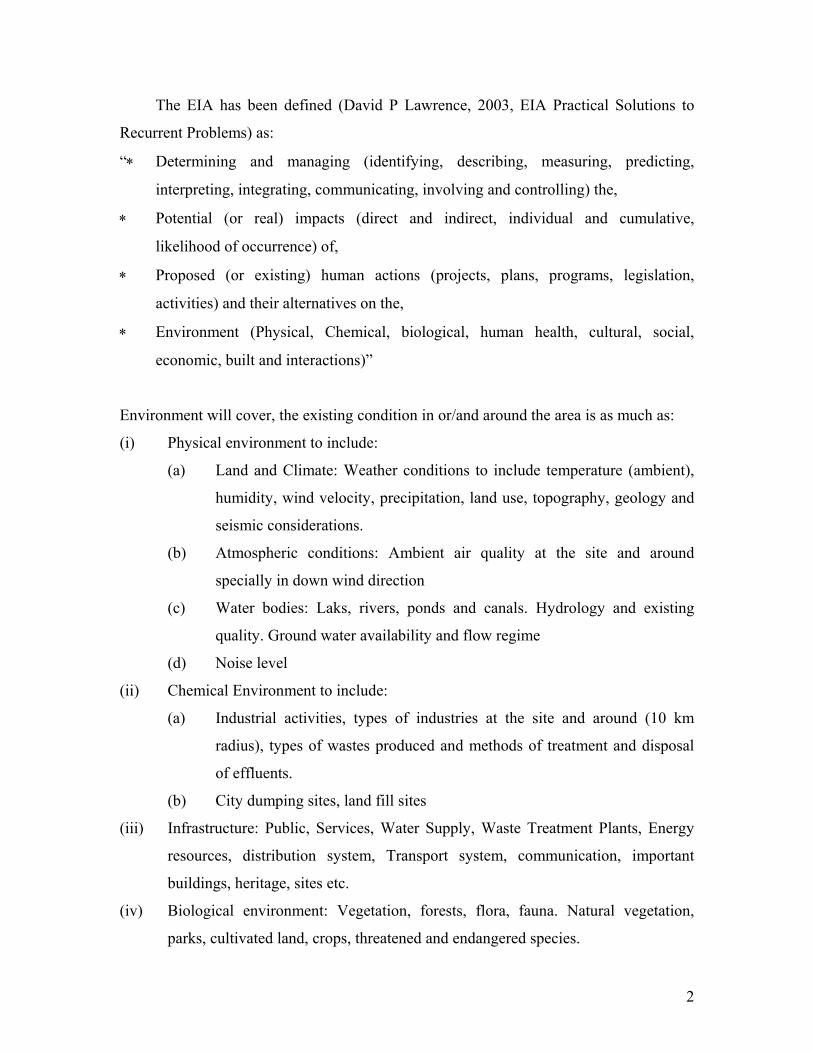
The EIA has been defined (David P Lawrence, 2003, EIA Practical Solutions to
Recurrent Problems) as:
“∗ Determining and managing (identifying, describing, measuring, predicting,
interpreting, integrating, communicating, involving and controlling) the,
∗ Potential (or real) impacts (direct and indirect, individual and cumulative,
likelihood of occurrence) of,
∗ Proposed (or existing) human actions (projects, plans, programs, legislation,
activities) and their alternatives on the,
∗ Environment (Physical, Chemical, biological, human health, cultural, social,
economic, built and interactions)”
Environment will cover, the existing condition in or/and around the area is as much as:
(i) Physical environment to include:
(a) Land and Climate: Weather conditions to include temperature (ambient),
humidity, wind velocity, precipitation, land use, topography, geology and
seismic considerations.
(b) Atmospheric conditions: Ambient air quality at the site and around
specially in down wind direction
(c) Water bodies: Laks, rivers, ponds and canals. Hydrology and existing
quality. Ground water availability and flow regime
(d) Noise level
(ii) Chemical Environment to include:
(a) Industrial activities, types of industries at the site and around (10 km
radius), types of wastes produced and methods of treatment and disposal
of effluents.
(b) City dumping sites, land fill sites
(iii) Infrastructure: Public, Services, Water Supply, Waste Treatment Plants, Energy
resources, distribution system, Transport system, communication, important
buildings, heritage, sites etc.
(iv) Biological environment: Vegetation, forests, flora, fauna. Natural vegetation,
parks, cultivated land, crops, threatened and endangered species.
3
CHAPTER - 1
1.0 Introduction to Environment Environment is a comprehensive term meaning surroundings. It includes the
gaseous envelope surrounding earth, the Atmosphere, the mass of water above and
below the earth, the Hydrosphere, the land masses that support life, the Lithosphere,
and the whole plethora of microbes, plants, and animals, collectively referred as,
Biosphere. The living world has been sustained for over 200million years by other
components. According to Mason and Langenhim “Environment is the sum of all
substances and forces external to an organism which determines its existence and regulate
its processes”. Earth is a unique planet of Solar System which has free water, oxygen and
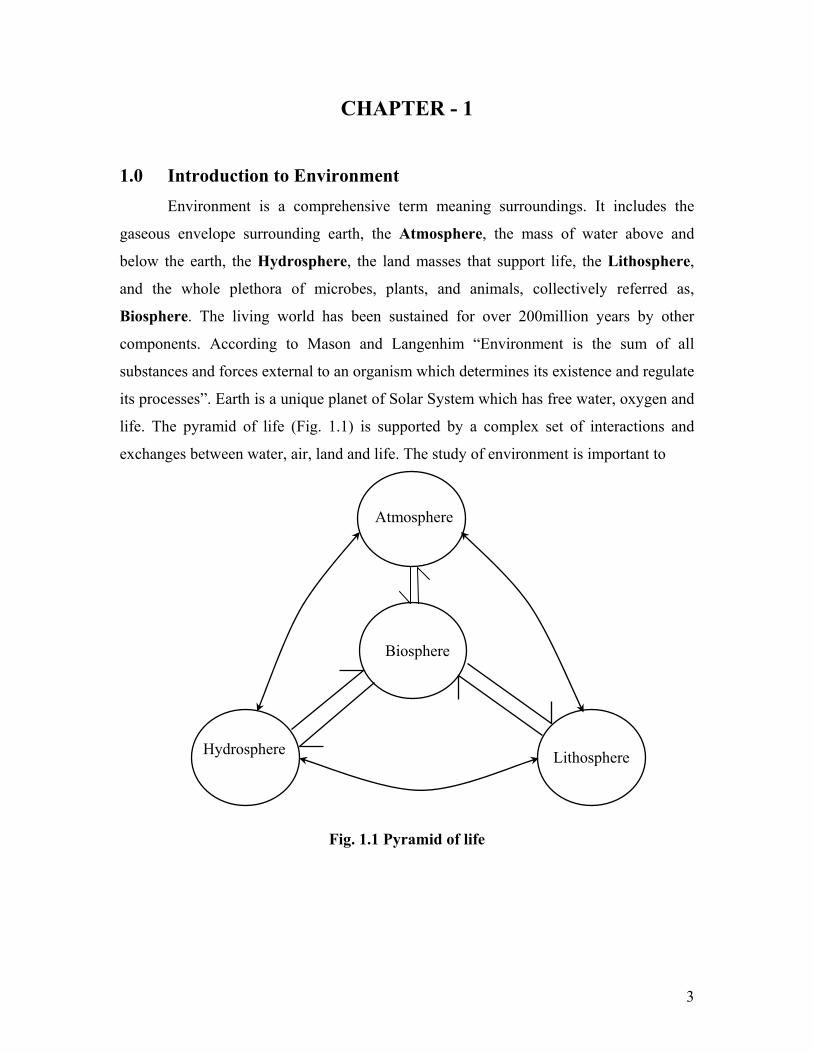
life. The pyramid of life (Fig. 1.1) is supported by a complex set of interactions and
exchanges between water, air, land and life. The study of environment is important to
Fig. 1.1 Pyramid of life
Hydrosphere
Atmosphere
Lithosphere
Biosphere
4
Scientists, Engineers, Technologists, Managers and Conservationist in affording
solutions of interactions of human activity.
Man is often said to be his own enemy. This is perhaps true in the consequence of
what seems to be very legitimate human activities to provide food, shelter, amenities and
transport. While products of industry and agriculture make human existence more
bearable and pleasant, they give rise to waste effluents and emissions. Some of the
interactions of human existence relate to:
- utilization of a resource without impairing its use,
- disposal of wastes without creating problems,
- degradation of forest wealth and
- exploitation of biota
The study of environment in totality is an arduous task. The age of earth is nearly
6000 × 106 years and the story of life is only 2 × 10⁶ years which shows that for a very
long time no life existed on earth. Some of the concepts of origin of earth and life are
legendry and beyond the scope of present course.
1.1 Atmosphere The atmosphere constitutes a gaseous envelope that surrounds the earth and held
in place by the forces of gravity. It is essential to life in terms of supplying oxygen for
breathing and circulating carbon-di-oxide. The composition of atmosphere is generally
uniform upto an altitude of 80 km. This portion of atmosphere is called Homosphere and
is made up of 78.084% Nitrogen and 20.946% oxygen (by volume). The rest is made up
of Hydrogen (0.5 ppm) and inert gases viz. (expressed as parts per million (by volume)
and not%):
Argon (Ar) 9340 ppm, inert Neon (Ne) 182 ppm, inert Helium (He) 53 ppm, inert Krypton (Kr) 1.2 ppm, inert Xenon (Xe) 1.0 ppm, inert Radon (Rn) Traces (Radio active) Carbon dioxide (CO2) 340 ppm, essential for life Ozone (O3) Traces Toxic
Other materials which are highly variable are, Sulfur-di-oxide (SO2) Carbon-
mono-oxide (CO), Methane (CH4), Nitrous oxide (N2O). The concentration of water
5
vapor is highly variable near the earth’s surface. The atmosphere will also have
particulate matter (dust) in varying amounts. Other emissions may also add, hydro
carbons (HC), oxides of Nitrogen (NO + NO2), Chloro flouro carbons, spores and pollens
(from molds and plants).
The layer beyond homosphere extends upto 10,000 km (80 km – 10,000 km) is
called Heterosphere. The composition of this layer is different at different levels.
Molecular Nitrogen layer (N2) 80 km – 200 km Atomic Oxygen layer (O) 200 km – 1100 km Helium layer (He) 1100 km – 3500 km Hydrogen layer (H2) 3500 km – 10,000 km
The limit of each layer is arbitrary. Beyond 10,000 km the space is interplanetary
space, which has Hydrogen in approximately the same concentration as in Hydrogen
layer.
The atmospheric pressure decreases with altitude almost exponentially. This
determines the characteristics of upper atmosphere. The pressure at sea level is one
atmosphere. At high altitudes the pressure is low as gases expand and normal reactive
species persists for long periods of time.
1.1.1 Thermal Structure of Atmosphere
The thermal structure of atmosphere is distinct and well defined. It consists of
three layers in Homosphere and one in Heterosphere.
The atmosphere is stratified on the basis of temperature and densities. The lowest
layer of atmosphere is Troposphere. It extends from 10-16 km (10 km at poles and 16
km at equator) and is characterized by a gradual reduction in temperature, termed as
lapse rate. The cooling is because a parcel of air looses heat when it rises due to
reduction in pressure. A dry parcel of air (if neither gains nor looses temperature from
surroundings) cools at the rate of 0.96°C/100 m and is known as Dry Adiabatic Lapse
Rate or DALR. Such conditions of atmosphere are rare. Troposphere has highly variable
water vapor. It contains most of water and clouds. Therefore the cooling could be higher
or lower than DALR. The troposphere ends at tropopause. The temperature of
6
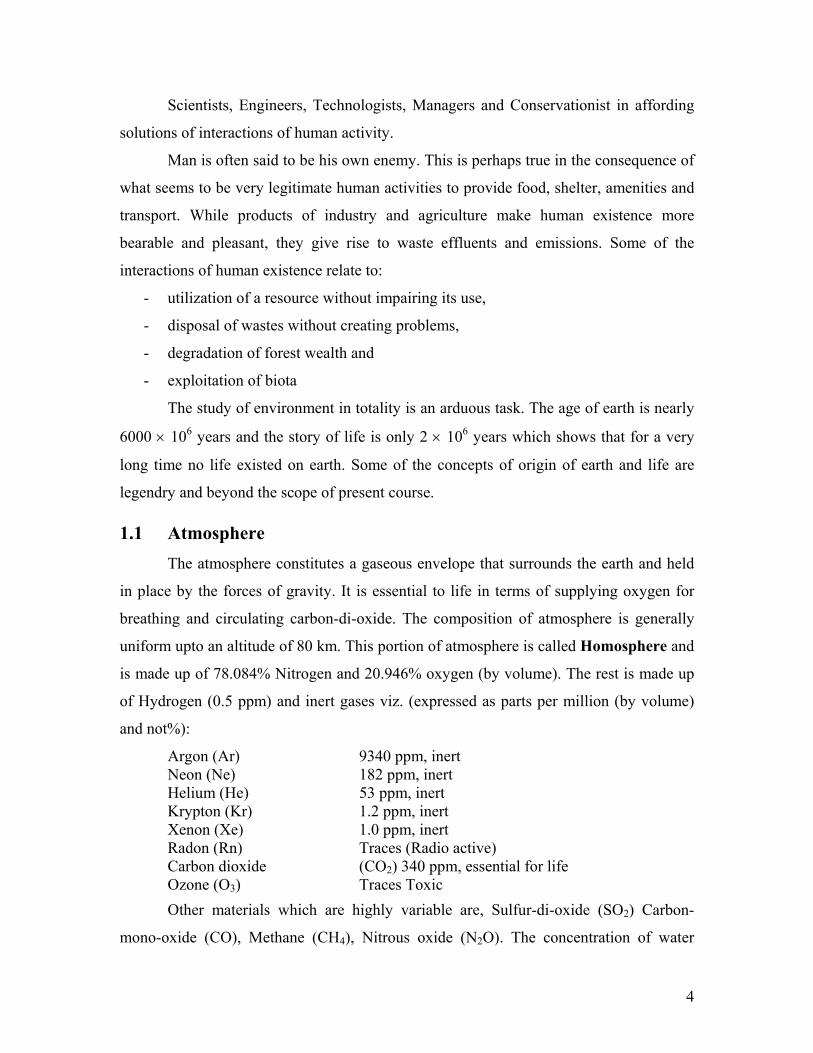
tropopause at poles and equator are different, and is much smaller at poles, due to
equatorial bulge.
Fig. 1.2 Structure of Atmosphere (Not to scale)
Temperature of atmosphere at pole if is 0°C than at tropopause it will be - 96°C, where as
if the temperature of atmosphere at equator is 40°C the temperature at tropopause will be
- 113°C.
The intense cold conditions at tropopause serves as a barrier that causes water
vapor to condense to ice and the so the water vapor does not reach the next layer.
At tropopause (10 – 16 km), there is a gradual change of temperature reduction.
The temperatures beyond rise to as high as ground temperatures. This layer is known as
Stratosphere. The rise in temperature is due to the presence of Ozone, which absorbs
UV radiations. At an altitude of ≈ 50 km and more, ions are more active and the region is
also called ionosphere. Ultraviolet radiations are responsible for this phenomenon.
The stratosphere gradually through Stratapause changes over to Mesosphere. It
extends upto 80-85 km and is very windy and turbulent. The mesosphere is characterized
by decrease in temperature. The absence of high levels of radiation absorbing species in
mesosphere results in decrease in temperature to about - 83° to - 92°C. The upper regions
7
of Mesosphere defines a region called Exosphere from which molecules and ions do not
escape. This is the last layer of Homosphere. Mesosphere is followed by a region with
rarified gases which absorb high energy radiations (≈ 100 nm) and reach temperatures as
high as 1100°C - 1650°C. This is known as Thermosphere. Troposphere, Stratosphere
and Mesosphere lie in Homosphere and Thermosphere in Heterosphere. The structure of
atmosphere is depicted in Fig. 1.2.
1.1.2 Air Pressure
The air pressure exerted by atmosphere on objects at the surface of earth is equal
to the weight of overlying air. At sea level, it is 10.3 metric tons /m2 and is defined as 1
atmosphere. It is measured as 1013.25 millibar or 1000 mb. Since air pressure acts in all
directions it is not noticed as a force. The density of air increase with increase in pressure.
(If the temperature of dry air is kept constant, the density of air varies in direct proportion
to pressure). The density of air at an altitude of 12 km where most of, subsonic jets fly is
about 1/4th the density at sea level.
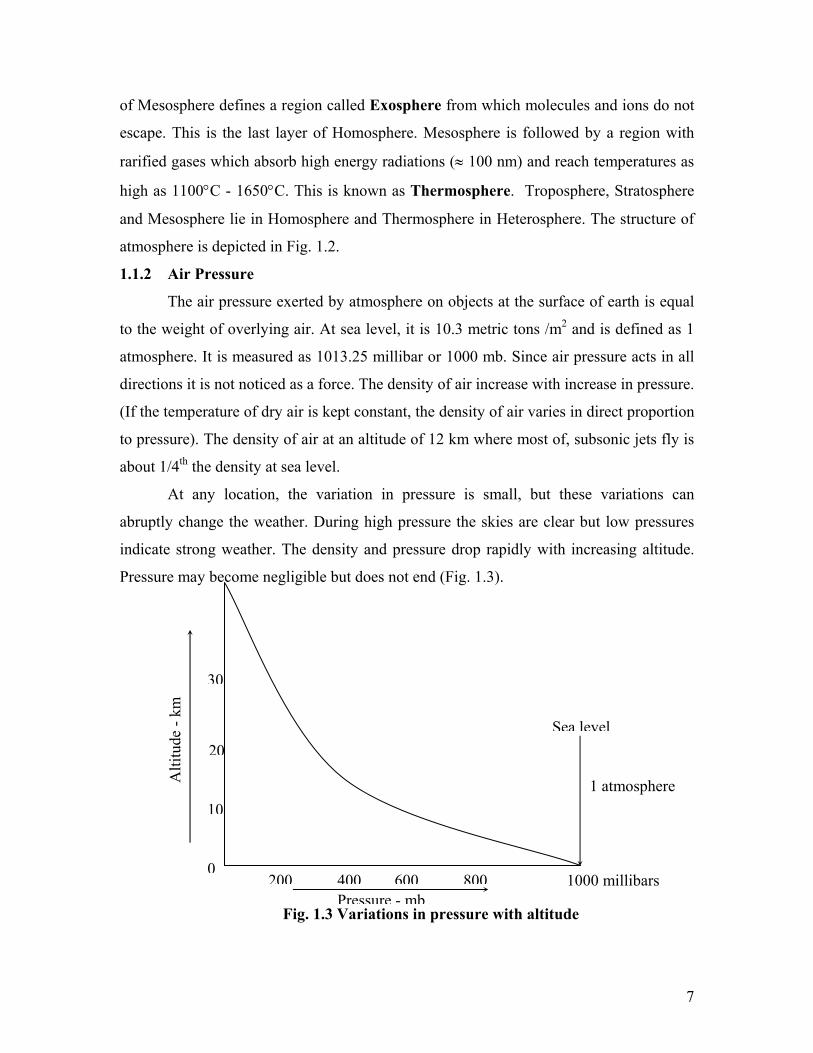
At any location, the variation in pressure is small, but these variations can
abruptly change the weather. During high pressure the skies are clear but low pressures
indicate strong weather. The density and pressure drop rapidly with increasing altitude.
Pressure may become negligible but does not end (Fig. 1.3).
Fig. 1.3 Variations in pressure with altitude
Sea level
1 atmosphere
1000 millibars
Alti
tude
- km
30
20
10
0200 400 600 800
Pressure - mb
8
1.1.3 Dynamism of Atmosphere (Energy)
Dynamism of atmosphere is maintained by a ceaseless flow of energy. The sun is
the source of all energy and it drives the atmosphere. The energy in the form of
electromagnetic radiations reaching the top of earth’s atmosphere is distributed over a
wide range of wave lengths.
Type of Radiation Wavelength Fate of Radiations Infra red (50%) 0.71 – 100 µ Absorbed by CO2 and H2O mostly below
10 km
Visible (41%) 0.40 – 0.71 µ Transmitted to earth undiminished
Ultraviolet (9%) 0.10 – 0.40 µ < 0.12 µ All absorbed by O2 and N2 above 100 km 0.12 – 0.18 µ All absorbed by O2 above 50 km 0.18 – 0.30 µ All absorbed by O3 between 25 – 50 km 0.30 – 0.34 µ Part absorbed by O3 0.34 – 0.40 µ Transmitted to earth undiminished
The total energy emanating from Sun is 4 × 1027 cal/min. A significant amount of
energy is prevented from reaching the earth’s surface by gaseous constituents. The
energy in the radiation is absorbed by gas molecule, warms the atmospheric layer. As
given above uv-solar radiations (wave length < 0.3 µ) are completely absorbed high in
the atmosphere (50 km) and infrared are substantially depleted through absorption by
CO2 and water vapor at low altitudes (< 10.0 km). The visible solar radiations are able to
pass through atmospheric gases. The atmospheric O3 is able to absorb uv radiations in the
wave length of 0.18 – 0.30 µ in stratosphere.
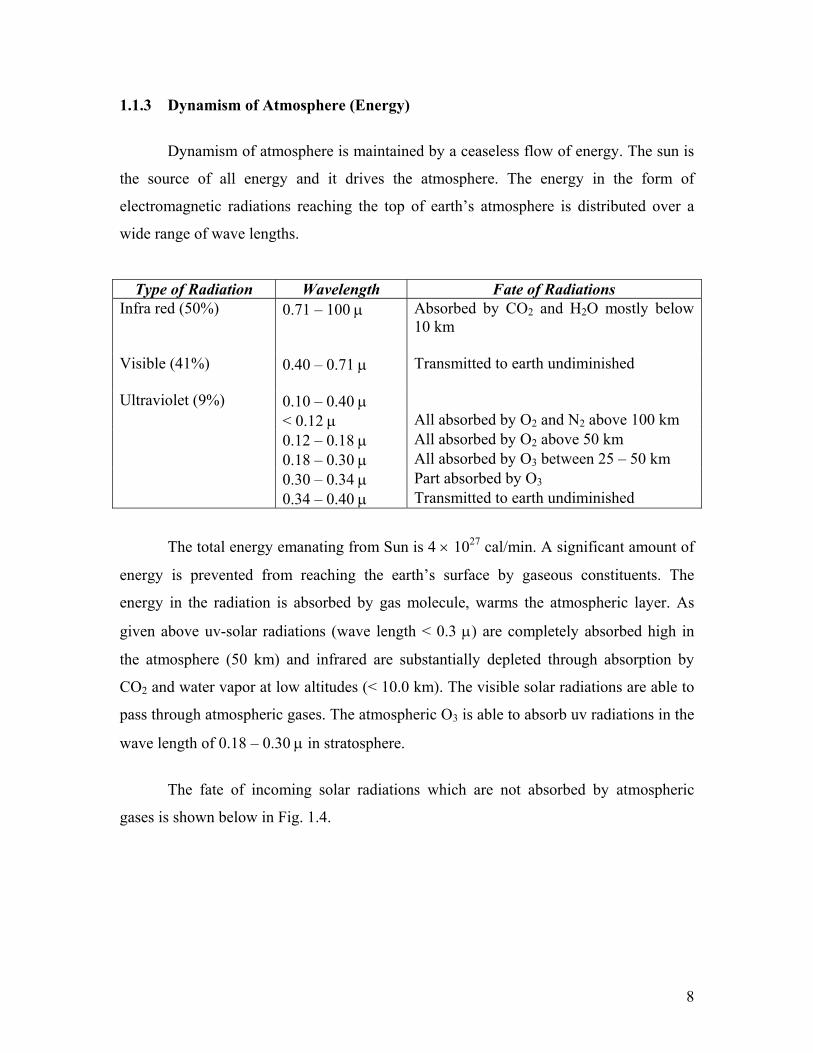
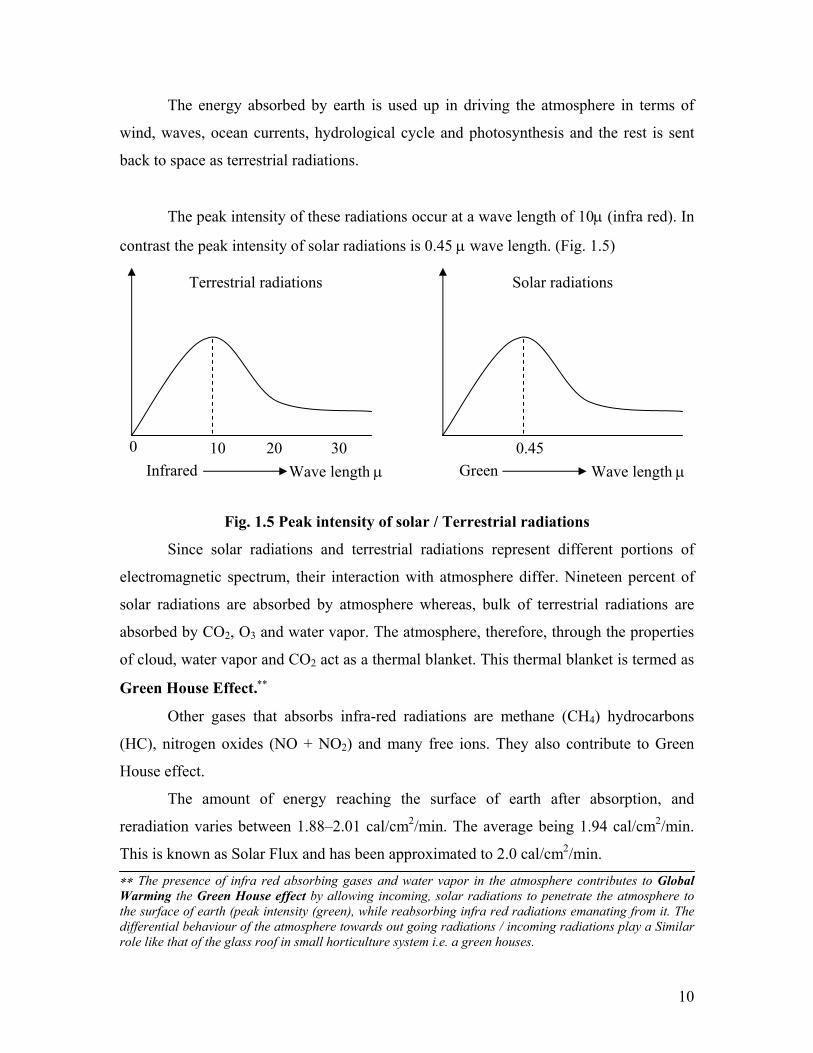
The fate of incoming solar radiations which are not absorbed by atmospheric
gases is shown below in Fig. 1.4.
9
Fig. 1.4 Fate of Incoming Solar Radiations
Scattering and absorption is done by aerosols (aerosols are particles dispersed in
gas) as well as gases. This depends on the size, composition, altitude and humidity.
The reflectivity of a surface is called Albedo. The albedo is equal to reflected
energy divided by incoming radiation. The earth’s albedo not only depends on
characteristics of the surface but also the angle of incidence (of solar radiations). The
albedo of various surfaces are:
Surface Albedo
Snow 0.5 – 0.9
Water 0.03 – 0.8
Sand 0.2 – 0.3
Grass 0.2 – 0.25
Soil 0.15 – 0.25
Forest 0.05 – 0.25
Gas molecules and dust absorb 20%
Clouds absorb 5%
Direct beam to earth surface 24%
Scatter to space 6%
Scatter to surface 15%
Reflected from surface 3%
Scatter to surface 11%
Incident solar energy 100%
Scatter to space 19%
10
The energy absorbed by earth is used up in driving the atmosphere in terms of
wind, waves, ocean currents, hydrological cycle and photosynthesis and the rest is sent
back to space as terrestrial radiations.
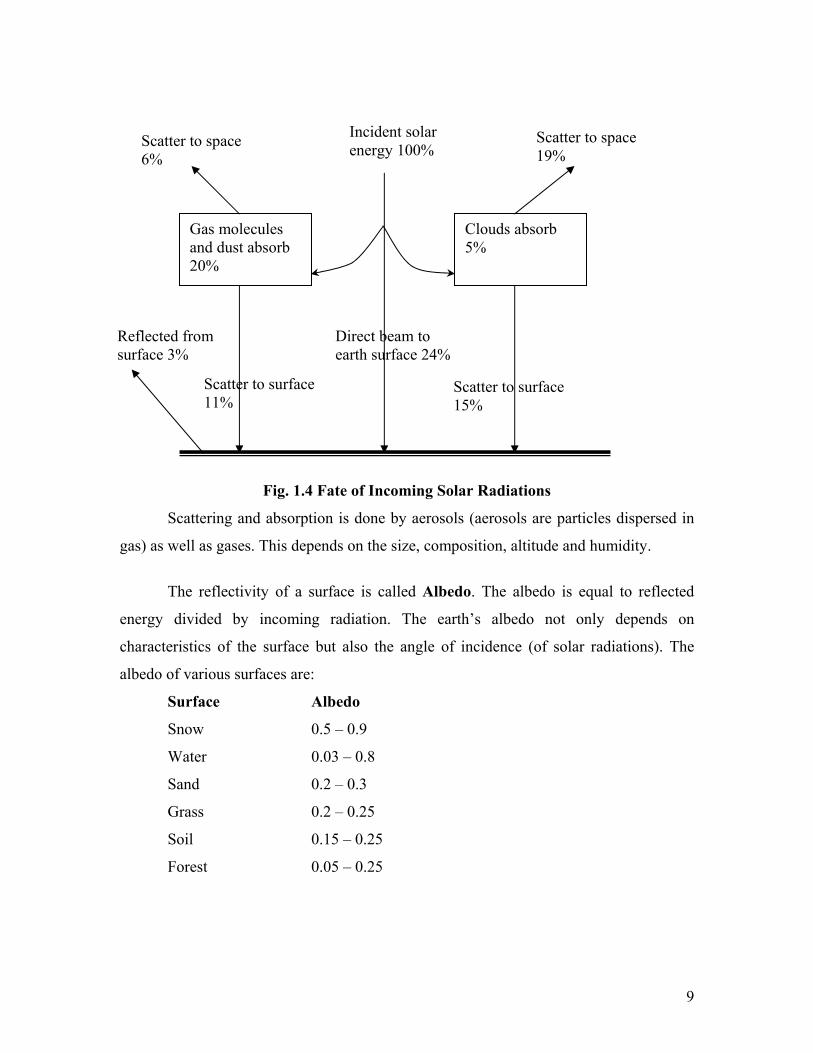
The peak intensity of these radiations occur at a wave length of 10µ (infra red). In
contrast the peak intensity of solar radiations is 0.45 µ wave length. (Fig. 1.5)
Fig. 1.5 Peak intensity of solar / Terrestrial radiations
Since solar radiations and terrestrial radiations represent different portions of
electromagnetic spectrum, their interaction with atmosphere differ. Nineteen percent of
solar radiations are absorbed by atmosphere whereas, bulk of terrestrial radiations are
absorbed by CO2, O3 and water vapor. The atmosphere, therefore, through the properties
of cloud, water vapor and CO2 act as a thermal blanket. This thermal blanket is termed as
Green House Effect.∗∗
Other gases that absorbs infra-red radiations are methane (CH4) hydrocarbons
(HC), nitrogen oxides (NO + NO2) and many free ions. They also contribute to Green
House effect.
The amount of energy reaching the surface of earth after absorption, and
reradiation varies between 1.88–2.01 cal/cm2/min. The average being 1.94 cal/cm2/min.
This is known as Solar Flux and has been approximated to 2.0 cal/cm2/min. ∗∗ The presence of infra red absorbing gases and water vapor in the atmosphere contributes to Global Warming the Green House effect by allowing incoming, solar radiations to penetrate the atmosphere to the surface of earth (peak intensity (green), while reabsorbing infra red radiations emanating from it. The differential behaviour of the atmosphere towards out going radiations / incoming radiations play a Similar role like that of the glass roof in small horticulture system i.e. a green houses.
Solar radiations Terrestrial radiations
Green Wave length µ Infrared Wave length µ 0 10 20 30 0.45
11
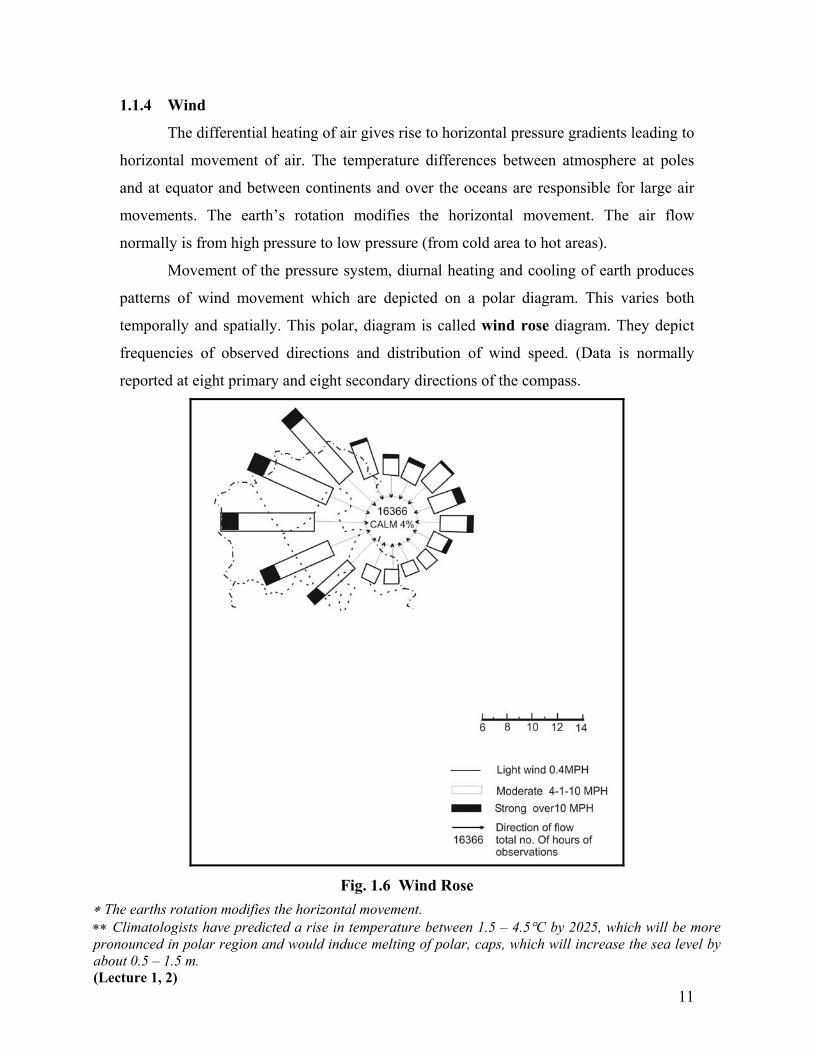
1.1.4 Wind
The differential heating of air gives rise to horizontal pressure gradients leading to
horizontal movement of air. The temperature differences between atmosphere at poles
and at equator and between continents and over the oceans are responsible for large air
movements. The earth’s rotation modifies the horizontal movement. The air flow
normally is from high pressure to low pressure (from cold area to hot areas).
Movement of the pressure system, diurnal heating and cooling of earth produces
patterns of wind movement which are depicted on a polar diagram. This varies both
temporally and spatially. This polar, diagram is called wind rose diagram. They depict
frequencies of observed directions and distribution of wind speed. (Data is normally
reported at eight primary and eight secondary directions of the compass.
Fig. 1.6 Wind Rose
∗ The earths rotation modifies the horizontal movement. ∗∗ Climatologists have predicted a rise in temperature between 1.5 – 4.5°C by 2025, which will be more pronounced in polar region and would induce melting of polar, caps, which will increase the sea level by about 0.5 – 1.5 m. (Lecture 1, 2)
12
1.2 Hydrosphere
The sum total of water bodies is termed Hydrosphere. Water is an essential
element for all living beings. The amount of water in living individuals vary between 70
– 80% by weight. Nature has maintained the some ratio globally also. 71% of globe is
covered by oceans which constitutes nearly 97.2% of total water. Two percent water is
locked in the icy sheets of Arctic and Antarctic regions. The remaining ≈ 1.0% water
represent the inland waters. On a global scale, total abundance of water is not a problem;
the problem is availability at the right place, at the right time and in the right form. Water
is a heterogeneous resource that can be found in either a liquid, solid or a gaseous form at
number of locations on/or below the surface of earth. Depending on specific location of
water, the residence time may vary from a few days to thousand of years. Further, more
than 99% of earths water is unavailable for beneficial human use (because of salinity in
sea water or location, icy sheets). The water budget is depicted below:
Location Surface area km2
Water volume km3
% of total water
Estimated residence time
Oceans 361 × 106 1230 × 106 km3 97.2 Thousands of years
Atmosphere 510 × 106 12700 0.001 9 days
Rivers and streams
- 1200 0.001 2 weeks
Ground Water upto the depth of 0.8 km
130 × 106 4 × 10⁶ 0.31 Hundreds of years
Lakes (Fresh Water)
855 × 103 123,000 0.009 Tens of years
Icy caps 282 × 105 286 × 105 2.15 Upto 10,000 years
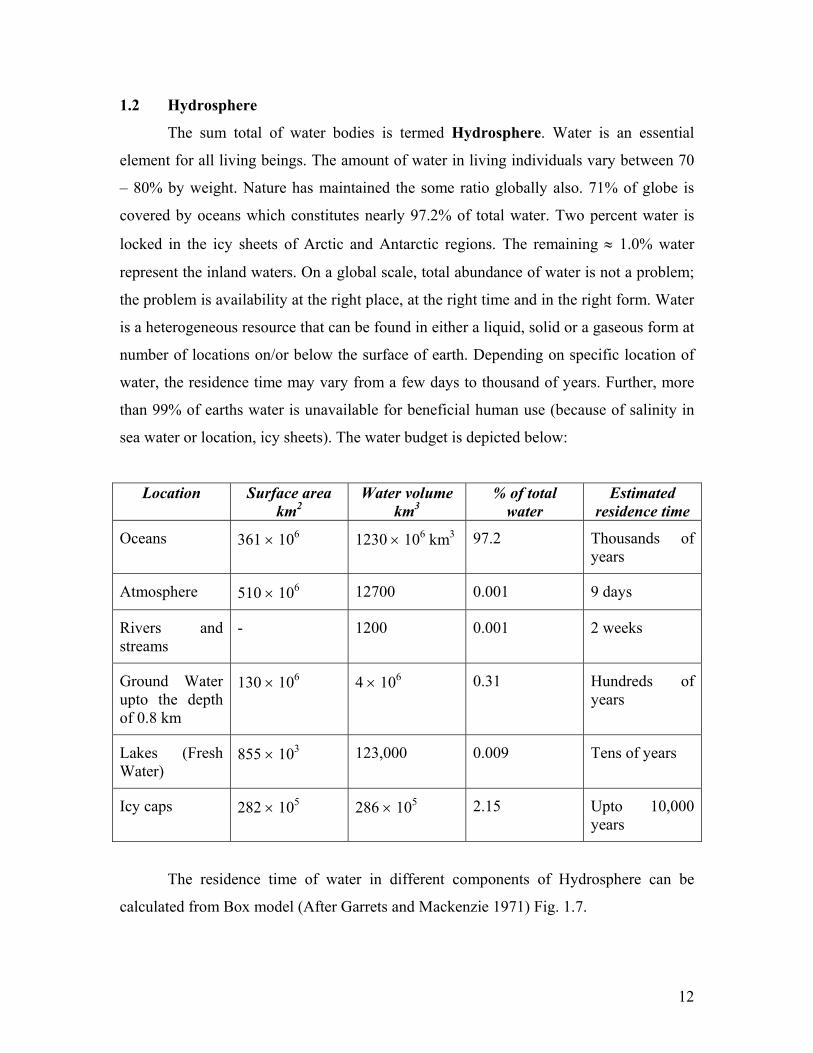
The residence time of water in different components of Hydrosphere can be
calculated from Box model (After Garrets and Mackenzie 1971) Fig. 1.7.
13
Fig. 1.7 Box model
Residence time = reservoirtheointFlux
servoirReinwaterofAmount
Residence time in oceans = gm10)5.336.0(
gm101370020
20
×+× = 3550 years
Residence time in Lakes and Reservoirs = 120
20
yr)gm1099.0(gm103.0
−×× = 110 days
1.2.1 Oceans
The oceans contain 1230 × 106 km3 of water near the surface of earth upto
varying depths ( 1.6 – 2.4 km ). It contains, saline water of nearly uniform composition.
The approximate concentration of salt is 34.45 gm/1000 gm.
Sodium chloride (NaCl) 23 gm/1000 gm
Magnesium chloride (MgCl2) 5 gm/1000 gm
Sodium sulfate (Na2SO4) 4 gm/1000 gm
Calcium chloride (CaCl2) 1 gm/1000 gm
Potassium chloride (KCl 0.7 gm/1000 gm
The Sea Water contains many other elements. Its composition has remained
unchanged for thousands of years.
Atmosphere 0.13 x 10²⁰ gm
Oceans 13,700 x 1020 gm
Lakes and Rivers 0.3 x 10²⁰ gm
Rivers and ground water run off 0.36 x 10²⁰ gmy-1
Evaporation 0.63 x 10²⁰ gmyr-1
Precipitation 0.99 x 10²⁰ gmyr-1
Prec
ipita
tion
3.
5 x
1020
gm
yr-1
Evap
orat
ion
3.
8 x
1020
gm
yr-1
14
1.2.2 Glaciers and icy sheets
Glaciers are icy sheets formed on land when accumulated snow is compressed and
hardened into ice by the weight of overlying layers. Sea ice is formed from sea water
attached to the land and floats on the sea surface. The glaciers occur at high mountain
ranges and may be km’s long and few hundred meters thick.
Bulk of the world’s ice is tied up in sheets that cover, Green land, and Antartica
land masses. Formation is possible by intense cold climate. The icy sheets of Green land
cover an area of 1.74 × 10⁶ km2 at an average thickness of 1600 m. The Antartic sheets
cover 13.0 × 10⁶ km2 with the thickness of 2300 m. The icy sheets like glaciers are in
motion carrying to oceans the ice formed about 10 m/year.
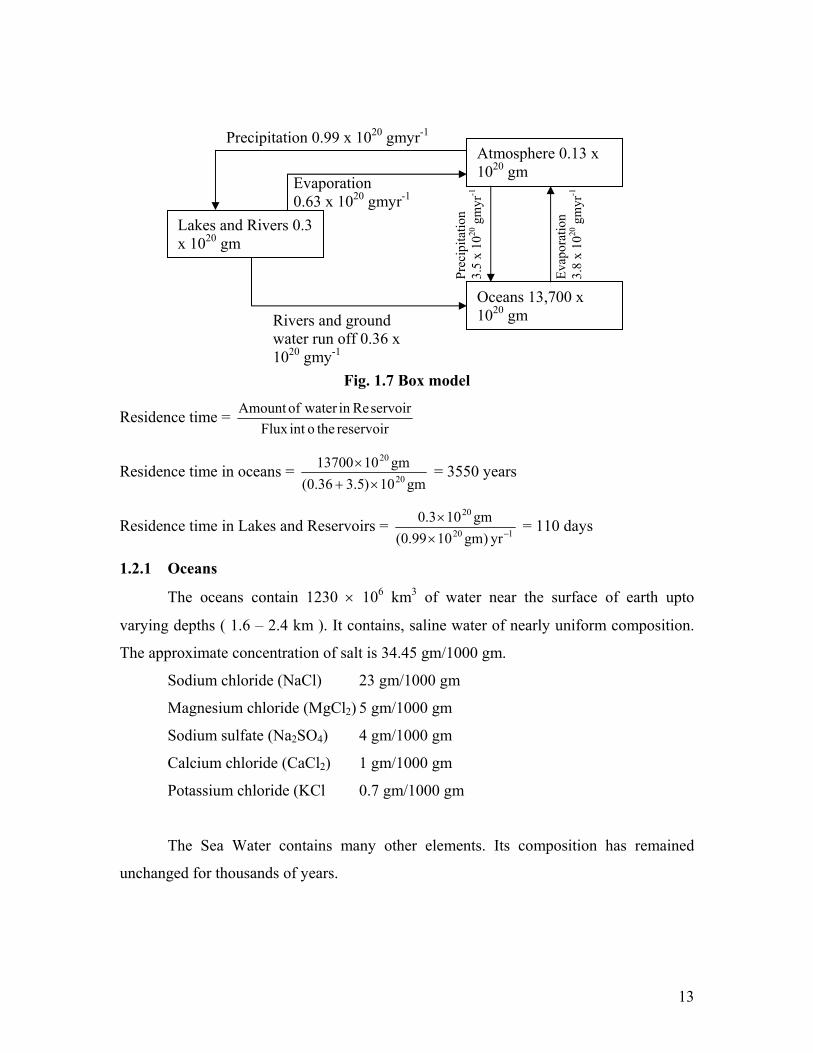
1.2.3 Hydrologic Cycle
Nearly 99% water of the globe is present in oceans or locked in icy sheets of artic
and Antarctic regions. The remaining 1% resides in atmosphere, in river and lakes, in soil
and subsurface layers. This fraction approximately 1000 km3/yr is involved in cycling
and maintaining flows in surface waters. This water determines the physical environment
and terrestrial plant and animal life. The process that maintains the flow of water through
the terrestrial and atmospheric components of hydrosphere is termed Hydrological Cycle
(Fig. 1.8).
Fig. 1.8 Hydrologic Cycle
62 108
46
precipitation From sea to land
Evapo transpiration 46
Run off
456
410
Condensation & precipitation
Evaporation
15
The Hydrological Cycle includes:
Evaporation of water from oceans, other water bodies and soil,
Evapotranspiration of water from plants,
Horizontal transport of atmospheric water from one place to another, either as vapor or as
liquid droplets,
Precipitation in which atmospheric water condenses and fall on oceans, land as rain, sleet,
hail or snow,
Runoff in which water that has fallen on continents as precipitation finds its way flowing
on land and under the surface back to oceans,
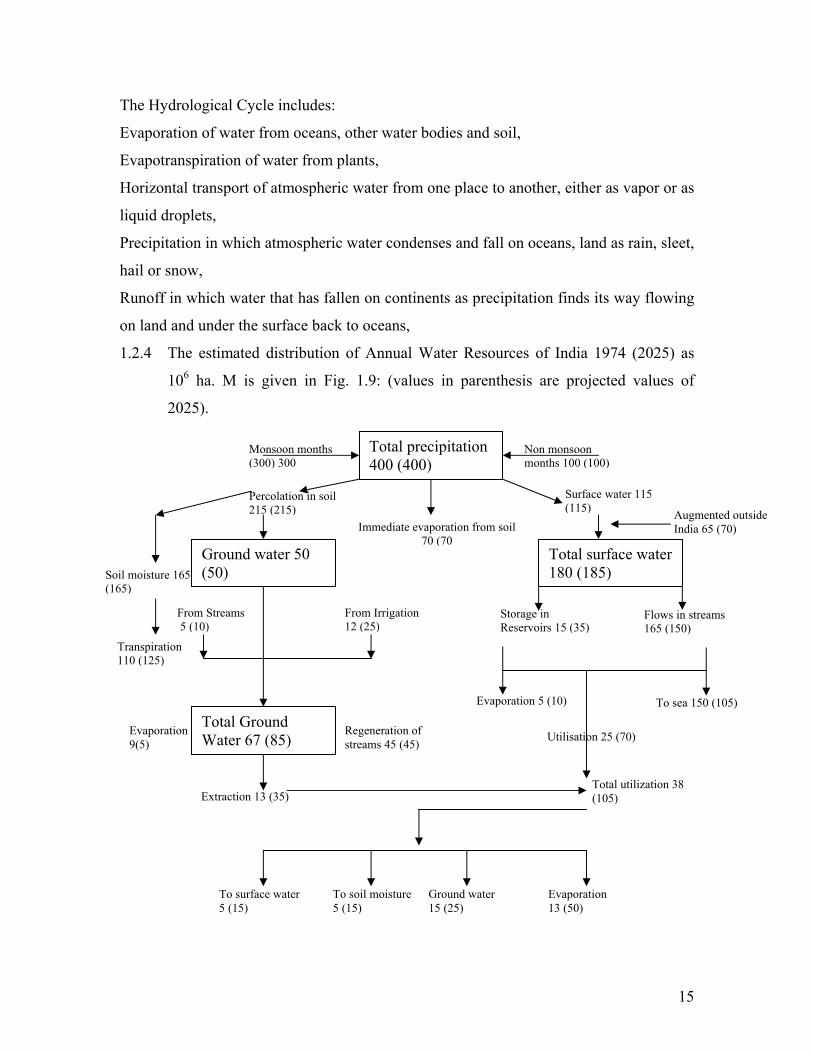
1.2.4 The estimated distribution of Annual Water Resources of India 1974 (2025) as
106 ha. M is given in Fig. 1.9: (values in parenthesis are projected values of
2025).
Total precipitation 400 (400)
Ground water 50 (50)
Total surface water 180 (185)
Total Ground Water 67 (85)
Monsoon months (300) 300
Non monsoon months 100 (100)
Percolation in soil 215 (215)
Surface water 115 (115)
Soil moisture 165 (165)
Augmented outside India 65 (70) Immediate evaporation from soil
70 (70
Transpiration 110 (125)
From Streams 5 (10)
From Irrigation 12 (25)
Storage in Reservoirs 15 (35)
Flows in streams 165 (150)
Evaporation 5 (10) To sea 150 (105)
Utilisation 25 (70)
Total utilization 38 (105)
Evaporation 9(5)
Regeneration of streams 45 (45)
Extraction 13 (35)
To surface water 5 (15)
To soil moisture 5 (15)
Ground water 15 (25)
Evaporation 13 (50)
16
Fig. 1.9 Estimated Distribution of Water Resources (Annual) (India)
1.2.5 Water Quality
The water quality in nature is highly variable and depends on its source∗. Water is
an excellent solvent. It picks up impurities during flow. Other impurities are thrust upon
it during its manifold use (to be discussed later) and misuse. The inland waters have
varying amounts of salts present. The relative abundance of ions (by weight) make them
hard or soft.
Soft Na++ k+ Ca++ Mg++ Cl − SO −4 CO −
3
100 - 62.5 3.3 119 43.8 75.0
Hard 100 76 310 66.8 195 119 567
More precisely water quality is related to its use. The uses may be in stream or off
stream.
In Stream : Navigation, hydroelectric power generation, recreation, taking away of
waste waters and preservation of wild life and fish
Off Stream: Drinking and other domestic uses, washing, industry, agriculture and other
consumptive uses
There are well designed criteria of water quality for different uses. These criteria
are based on physical, chemical and bacteriological parameters
1. Physical parameters : Temperature; Conductance; Total, suspended, dissolved,
volatile and fixed residues.
2. Chemical parameters: pH; acidity; alkalinity; hardness; chlorides; sulfates;
�luorides; phosphates; dissolved gases, oxygen and CO2; organic material, BOD,
COD; Nitrogen, saline, Kjeldahl, nitrates and metals.
3. Badriological parameters: Total bacterial count, MPN Coliform, MPN faecal
Coliform, MPN Streptococcus.
∗ Fresh water: Water with Salt concentration of less than 0.01%
17
Salt water: Water with salt concentration around 3.0%
Brackish water: Water in estuaries, a mixture of fresh and seawater where rivers enter
sea.
Designated Best uses (DBU) of water
A. Drinking water source without conventional treatment but use after disinfection.
B. Out-door organized bathing
C. Drinking water source with conventional treatment
D. Propagation of wild life, fish
E. Irrigation, industrial cooling and controlled waste disposal
The Criteria for each category have been defined and will be discussed later.
(Lectures 3) 1.3 Lithosphere
The outermost layer of Earth’s surface is called crust. It ranges in thickness from
about 6 km beneath the oceans to as much as 75 km below the mountain ranges. This
layer floats over a dense material “mantle” beneath. The combination of crust and hard
upper layer of mantle is called Lithosphere. In general, land systems which supports
biota and human life is referred as Lithosphere. They comprise an ecosystem which is
subjected to maximum onslaught by anthropogenic activities.
Lithosphere is composed of four subsystems viz.
• minerals
• sedimentary strata
• clays and
• soils
Each system differs from others in physical and chemical properties. They
respond differently to pollution.
1.3.1 Minerals:
Minerals are commonly occurring inorganic solids with well defined crystalline
structures. The crust consists of rocks (Rocks are conglomerate of one or more minerals).
Most land systems consist of Silica, Oxygen (75% w/w), Aluminium (8%), Iron (5%)
18
Calcium (4%), Sodium (3%), Potassium (3%) and Magnesium (2%) Together they
constitute 99% of earths crust.
1.3.2 Sedimentary Strata:
The sediments consist of mixture of clays, silt, sand, minerals and organic matter.
Land, sediments of lakes and rivers are made up of sedimentary rocks. The characteristics
of the strata depends on its origin and transport. The matter is predominantly carried by
water and some time by wind. The sediments at the bottom of a water body is determined
by physical, physico-chemical and biological processes. Many minerals, organic matter,
recalcitrant compounds exist in sediments. Rivers carry sedimentary material through
erosion and transport through flows and transfers them to the bottom. These deposits are
called “alluvium”.
The sediments are important repositories for trace metals. They may exist in
mobile (ionic) form or in the form of complexes or chelates of insoluble hydroxides.
1.3.3 Clays:
Clays are silicate materials containing Aluminium and are defined by size and
other inorganic constituents. In water they are distributed as colloidal material. They are
largely hydrated aluminium and silicon oxides. The most common clay minerals are
“illite”, “chlorite” and “kaolinite”
[Al Mg Na (OH)2 Si4O10], [Al3 k SiO3. (OH)4], [Al2. Si2O5 (OH)4]
montomorillonite illite kaolinite
Clays are made up of very fine grains having layered structure of sheets of SiO2
alternating with sheets of Al2O3. Two or three sheets make up a unit layer. Some clays
may absorb water and cause swelling of clays. Clays bind cations, such as Ca, Mg, Al,
which protect them from leaching.
1.3.4 Soil
Soil constitutes the most important component of land system. It grades into the
parent bed material. The soil is a finely divided rock derived material containing organic
matter, capable of supporting vegetation. Each soil has a unique morphology resulting
from interaction of climate, living plants, animals and parent rock material. The organic
19
content consists of biomass in various stages of decay, varying population of bacteria /
fungi. The pores in the soil are filled with oxygen, CO2 whose concentration vary
between 15 – 35% and 0.1 – 3% v/v respectively.
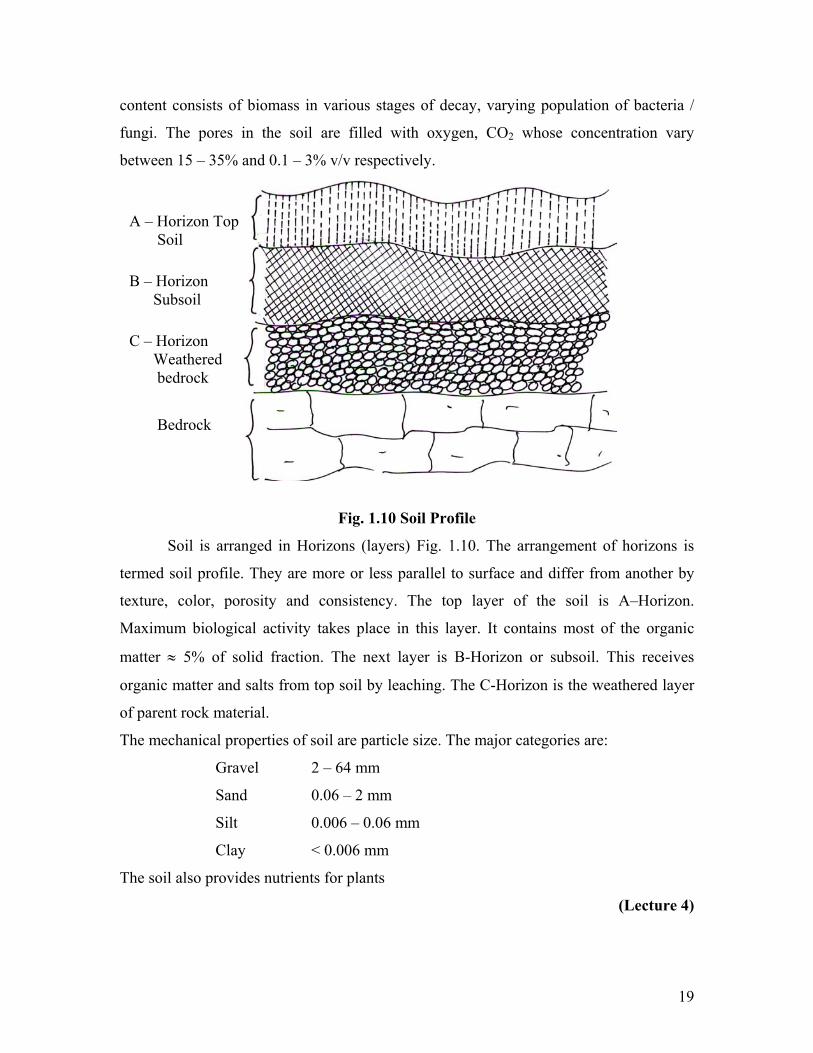
Fig. 1.10 Soil Profile
Soil is arranged in Horizons (layers) Fig. 1.10. The arrangement of horizons is
termed soil profile. They are more or less parallel to surface and differ from another by
texture, color, porosity and consistency. The top layer of the soil is A–Horizon.
Maximum biological activity takes place in this layer. It contains most of the organic
matter ≈ 5% of solid fraction. The next layer is B-Horizon or subsoil. This receives
organic matter and salts from top soil by leaching. The C-Horizon is the weathered layer
of parent rock material.
The mechanical properties of soil are particle size. The major categories are:
Gravel 2 – 64 mm
Sand 0.06 – 2 mm
Silt 0.006 – 0.06 mm
Clay < 0.006 mm
The soil also provides nutrients for plants
(Lecture 4)
A – Horizon Top Soil
B – Horizon Subsoil
C – Horizon Weathered bedrock
Bedrock
20
1.4 Biosphere
Biosphere comprises a very large component of environment and includes a vast
array of living beings. The biological spectrum is:
Cell → Tissue → Organ → Organ system → Organism → Population → Community
The living organization exist at cellular level (algale, bacteria, fungi and protozoa)
or at multi cellular level (all other animals and plants). Entities which exist at sub cellular
(molecular) level are phages, plant and animal viruses.
Every living being has its defined metabolic needs for maintenance, growth and
perpetuation. They exist where these needs are fulfilled. The existence in a particular set
of conditions bring about constant interaction with non-biotic components and among
themselves. Plants produce organic matter from mineral matter utilizing, solar energy,
stored as food on which animals, survive. For them the need of energy is also fulfilled by
food (Chemically bound energy).
The plants on death and decay and animals also on death and decay and waste
products, produce organic matter. This matter is the basic need of decomposers. They
thrive and convert organic matter to minerals. Minerals are picked up by plants for their
sustenance. Thus a cycle is established between producers (plants) consumers (animals)
and decomposers (bacteria and fungi) and between biotic and a biotic components.
This is the basic principle of Ecology.
Producers, consumers and decomposers live together, and constitute a well
established community in a defined Habitat. Human indulgence has produced stresses by
their legitimate as well as illegitimate activities of life. The environment which is least
stressed support a good diversity. The diversity reduces as stresses increase. A good
biological population or good biodiversity is indicative of good pristine environment. A
low biodiversity is indicative of a stressed environment in extreme cases, the stresses/
often become so large that the population of a sensitive species of (plant or animal) gets
reduced in a region or even disappear. These species are termed Threatened or
Endangered species. In India alone 583 plant species and 158 animal species are
identified as threatened (CSO, GOI, 1999).
(Lecture 4)
21
Suggested Reading
1. Ecology, Impact Assessment and Environment Planning, Walter E. Westman,
John Wiley, Sons, Canada, 1985.
2. Ecology and the Quality of Our Environment, Charles H. Southwick, D. Van No
strand Co New York.
3. Fundamental of Ecology by Eugene P. Odum., W.B. Sounders Co. Ltd.
4. Hand book of Environmental Pollution (3 volumes) by Bela G. Liptak.
5. Air Pollution by Arthur C. stern (2 volumes).
6. Introduction to Environmental Engineering, M.L. Davis, David A. Cornwell,
WCB Mc Graw Hill (1998).
22
CHAPTER - 2
2.0 Sustainable Development
The increasing impact of anthropogenic activities on physical and biological
environment specially in reference to ecological changes are a matter of great concern to
environmentalists. The concept that man lives in close relationship with biotic and biotic
components of nature - symbiotic living, has been established, since man become aware
of his surroundings. The progress made in science and technology-biotechnology, genetic
engineering, communication engineering, and industry has brought additional pressure on
the fragile ecosystem stability. The increase in population in the last three decades has
multiplied the impacts. The world’s population was 2.0 billion in 1927 and has become
triple, 6.0 billion in 2000 and is expected to reach 11 billion by 2050.
It is known that population growth and economic development are affecting the
environment. There is a close relationship between Population growth and environmental
damage (Erlich Equation)
I = P × A × T where I = Impact on environment
P = Population
A = Affluence (Consumption)
T = Technology Coefficient
India’s population has crossed one billion mark. More people mean more pressure
on resources, more consumption of energy, more production of wastes and more effect on
environment.
Sustainable Development is a concept that underscores that rate of consumption
or use of natural resources should approximate the rate at which these resources can be
substituted or replaced. It further requires that a nation is able to satisfy its requirements
social, economic and others without jeopardizing the interests of future generations.
Realization must come to us that nature is fragile and is finite. (It is believed that we have
reached a Critical Threshold beyond which ecological decline would lead to disaster).
This was the religious wish of “Earth Summit” held at RIO in 1992, where it was
discussed in great detail. The theory was finally accepted that earth has limited capacity
to carry population growth, urbanization and its pressure, technical innovation
23
industrialization and thus adverse effect of pollution on the Air, Water and Land. The
world commission gave the most acceptable definition of Sustainable Development (U N
Sponsored Commission), as “Development that meets the needs of the present
without compromising the ability of future generations to meet their own needs”.
2.1 Fundamentals Concerning Environment and Sustainable Development Population and Implications
The pressure of population tended to increase rapidly over the last 250-300 years
with world’s population doubling almost every 25-30 years, the pressure on natural
resources became greater, in order to meet the ever increasing requirement of food,
shelter, transport, industry, through out the world. Every increase in human population
calls for greater availability of goods and services through the process of resource
development and utilization. Thus rapidly increasing human population compelled and
inspired man to develop new resource and evolve new and quicker techniques for their
utilization and even exploitation.
Sustainable Development is about integrational equity. But if future equity is of
great concern, it is not legitimate to ignore the equity occurring in the present population
in different parts of the globe. Sustainability should, therefore reflect equity,
environmental concerns and social responsibilities vis-à-vis population regardless of time
or location.
Limits to Growth
The management of environment is not possible unless there is a change in
perception and attitude, consumption patterns, manufacturing and marketing practices
and gel into a technological world that is less intensive in terms of materials and energy.
Improvements in efficiency alone will not be enough. “Earth’s Carrying Capacity”
concept must be adopted.
Global warming can only be combated if the world can make a rapid transition to
a non carbon energy economy. The world needs an international mechanism that not only
provides incentives to all nations to live within their entitled amounts but also helps to
promote a rapid transition to a non carbon energy economy. “An ecology of means has to
24
be accompanied by an ecology of ends”. The efficiency revolution will remain counter
productive if it is not accompanied by a sufficiency revolution.
The world faces an enormous challenge in the coming years. But the world’s civil
society and changing social system will have the capacity to turn around to convince all
the stake holders that nature has its own rules and it will take a revenge if its capacity is
stretched too much.
2.2 Economy
Rate of Gross National Product (GNP) is considered to be an indicator of
economy. Increase in GNP indicate that economic health of the country is good. Such
increase in GNP is based on high rate of consumption of natural resources, which
ultimately results in environmental degradation.
India since early 1990 opted for free market economy. Major economic
advantages are expected to follow this transition. However, economists would have to
take into account the idea of ecological disadvantage inherent in such an economic shift.
The production cost must internalize the eco-costs.
High economic growth means high rate of extraction, transformation, and
utilization of non renewable resources. One must realize that though higher rate of GNP
is important, equally important is the rate of regeneration of natural resources.
Conservation of natural resources is discussed later in chapter 8.
The concept of sustainable development was advocated by Brundtland
Commission, 1987. It states that economic growth has to be environmentally sustainable.
There is no economic growth without ecological costs.
2.3 Poverty
Poverty is a complex problem and is a major challenge all over the globe.
Solution to poverty are country specific and must be tackled along with development and
environmental issues. While managing environment and resources, due consideration has
to be given to the fact that below poverty line (bpl) people directly depend on natural
resources for their livelihood. Therefore, an effective strategy for tackling the problems
of environment, development and poverty is to begin with economic conditions of the
25
people, their resources and productivity. Thus sustainable development must take into
consideration the eradication of poverty also.
2.4 Human Settlement Issues
The conditions of human settlements in developing countries is deteriorating
mainly due to low investments in housing and social welfare. The environmental
implications are poor living in slums and colonies / clusters of economically poor / below
poverty line, are that unsanitary conditions prevail, lack living conditions and direct
dependence on natural resources like forests. Sustainable development would involve:
• Providing shelter to all
• Investing in infra structure for providing water and managing sewage and solid
wastes
• Promoting sustainable energy and transport system
• Promoting sustainable land use management
2.5 Land Resources
Planning and management of land resources constitute another area of concern for
environment. Land use not only include physical entity but also soil, minerals and biota.
These components provide services essential for life.
2.6 Forests
Nature has provided bountiful resource as forests. Forests not only provide wealth
of flora and fauna but also is a sink of CO2 and source of Oxygen. UN mandate is that at
least 33% forest cover must be maintained by member countries. Since forests provide
timber a necessity for wood products, forests once felled by unscrupulous persons aided
and abetted by Govt. means loss of an important resource. Deforestation has brought in
global warming and weather shift. A separate management of forest by Forest Acts is
prevalent in many countries and is one of the most important element of sustainable
development.
2.7 Mountains
It is estimated that 10% of World’s population is dependent directly on mountain
resources. This mountain (Hill) ecosystem is undergoing fast deterioration and is
26
effecting the resources of valleys and plains. Erosion of mountain slopes for various
purposes has brought in untold misery by landslides and flow of sediment / nutrients in
run off. This resource maintenance also constitutes an important element of sustainable
development.
2.8 Agriculture
The phenomenal growth of population, which requires food to sustain, has
brought in immense pressure on agriculture. This has been met by using better farming
technology, good seed and use of chemical fertilizers and pesticides. Agricultural out put
of the land masses under cultivation has increased. Since population is gradually
increasing the food requirements are also on the increase. This requires bringing more
land under cultivation. The need of irrigation will also increase simultaneously. All these
aspects would bring more pressure on environment (residues of chemicals and
pesticides). An increased interaction between agriculture and land use ecosystem is
required specially when modern technologies are used. This is a challenge for Sustainable
Development.
2.9 Biodiversity
Diversity of living species in any natural habitat, biodiversity, is an indicator of
presence or absence of natural / anthropogenic stresses on the ecosystem. Higher the,
variety lesser are the, stresses. Presence, absence or richness determines the state of
biological wealth. Decline in biodiversity due to human activities is a threat to our
environment. High biodiversity is needed to maintain the natural order.
2.10 Protection of Oceans
Ocean’s which account for 97.2% of the globe is an important resource as well as
an important sink. The wealth that is possessed by oceans is far greater than that
maintained on land. Nature also has kept the ratio of 30:70 (land vs oceans) to maintain
an order. Coastal areas contain diverse and productive habitats of human settlement.
Many of the World’s poor are crowded in coastal areas. These areas are in constant threat
of erosion. The marine environment is being constantly polluted by sewage, plastic,
metals and more recently radioactive materials.
27
2.11 Industry and Business
Business and industry are directly related to environment. Industries use many of
the non renewable resources and the production processes leads to discharge of unutilized
resources as waste emissions and effluents. Most of these discharges are strong enough to
warrant treatment. Though it is mandatory under Water Act 1974, to treat the liquid
wastes before discharge on land or a water body and Under Air Act 1981 to treat the air
emissions but the records show that most of them do not meet the mandatory provisions.
Thus there is a direct impact on environment. Some promising and environmentally
conscious industries have adopted measures like waste minimization / effluent treatment
technologies and conservation measures, yet more is needed.
It is time now that business and industry is driven by the requirements of
sustainable development. The Earth Summit did suggest programmes that would promote
environment protection and resource conservation for business.
Like economic deficit, we are creating a deficit of renewable resources on account
of production and other direct and indirect developments, this is termed as “ecological
deficit”. To reduce the ecological deficit, projects, programmes and regulatory
mechanisms are necessary both at Govt. level as well as at corporate level. The
implementation of the policies should be without bias and prejudice.
Think Global and Act Local.
(Lectures 5, 6)
Suggested Reading
1. Ecology, Impact Assessment and Environmental Planning, Walter E. Westman, John Wiley & Sons.
2. Sustainable Development of Water Resources – A Revisit, Thatte C.D.
Proceedings Symp. Hydrological Perspective for Sustainable Development Vol. 1 (HYDESD), Deptt. Of Hydrology, IIT Roorkee Allied Publishers, New Delhi – 2005.
3. Environmental Impact Assessment, Barthwal, R.R., New Age International, New
Delhi – 2002.
28
CHAPTER – 3
3.0 Environment Pollution and Quality
Environmental Quality its degradation and management are closely related. It is a
balance between human systems and nature. As long as the balance is maintained, the
quality of envronment remains conducive to the health and well being. Imbalances
produce disorders and even calamities. An environmentalists role in maintaining order
can not be over emphasized. It is true that high quality environment means differently to
different people. It varies from habitat of a natural order, agrarian and pastoral scene to a
beautiful city rich in culture and works of man. But all gree that trash, dirt disease noise,
strife, poverty and pollution reduce the quality of environment.
Environment of the highest quality is one, which is conducive to good health and
well being, where human needs are fulfilled, where there is solitude as well as sociality,
where needs of food and shelter, education and recreation are fulfilled, where there is
aesthetic stimulus and where all biological variable are intact and healthy.
Abuse of environment today is our main concern. It may be pollution of water, air
and land or over exploitation of natural resources. According to Oodum (1971) “Pollution
is an undsirable change in the physical, chemical or biological characteristics of
environment that may or will harmfully effect human life or that of desirable species or
industrial processes, living conditions and cultural assets or that may or will waste or
deteriorate raw material resources”.
3.1 Atmospheric Pollution
A polluted atmosphere is generally considered as unnatural atmosphere. It is an
over burden on the air without changing its natural properties. It may be due to addition
of pollutants from nature or due to the activities of man in terms of population growth,
expansion in industry and technology and social change like urbanization and rising
standards of living. Atmosphere, is a very suitable mixture of Oxygen and Nitrogen. In
addition, there are some other gases and aerosols, vapor varying in content and
concentration. Polluted atmosphere may have gases, dusts, aerosols, spores, pollens as
overburden. Some of these material are physiologically inert but others may produce
29
reactions which range from mild inconvenience to severe toxicity. When we breathe in
they reach our respiratory system. Our sense of smell does not respond to all harmful
pollutants. Some of them are perceived (H2S, HCN) in low concentrations but do not
induce defence reactions. The effects appear much later. The basic objectives of air
pollution monitoring are:
i) Investigations of the atmosphere in residential areas in the interest of large
population.
ii) Investigations in the industries and workshops subjected to hazards of waste
gases.
iii) Investigation in the neighbour hood of industries
iv) Investigations of emissions belching out of stack / ventilators from factories /
industries
Five substances, known as Primary pollutants account for more than 90% of air
pollution. They are:
i) Oxides of Carbon, CO
ii) Oxides of Nitrogen, NO, NO2
iii) Oxides of Sulfur, SO2, SO3
iv) Hydro Carbon, HC
v) Particulate matter, SPM dust
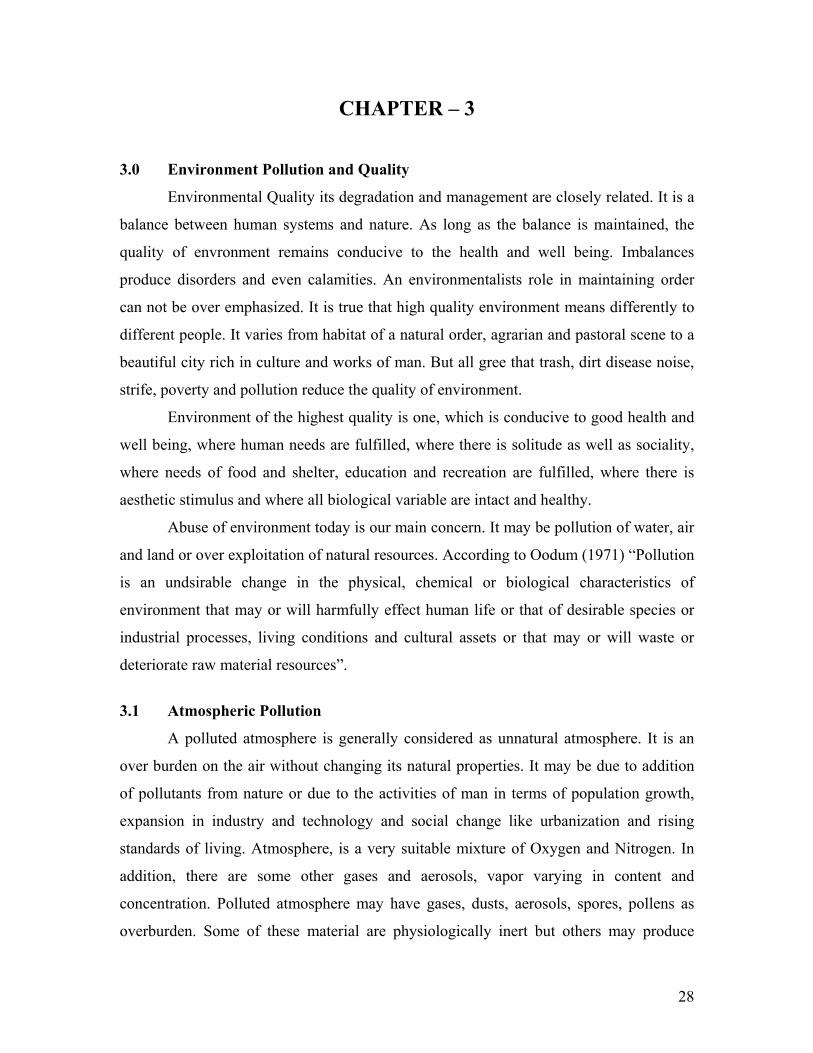
3.1.1. Origin of pollution
The air pollutants are constantly being added to atmosphere are generated by
human activities. Any activity considered as system, is capable of producing a desired
product. No system can be called a perfect system (inputs = output). A real system is
imperfect as it produces one or more unwanted bye products
System Output Input
Perfect System
System Output Input
Unwanted bye products
Imperfect system
30
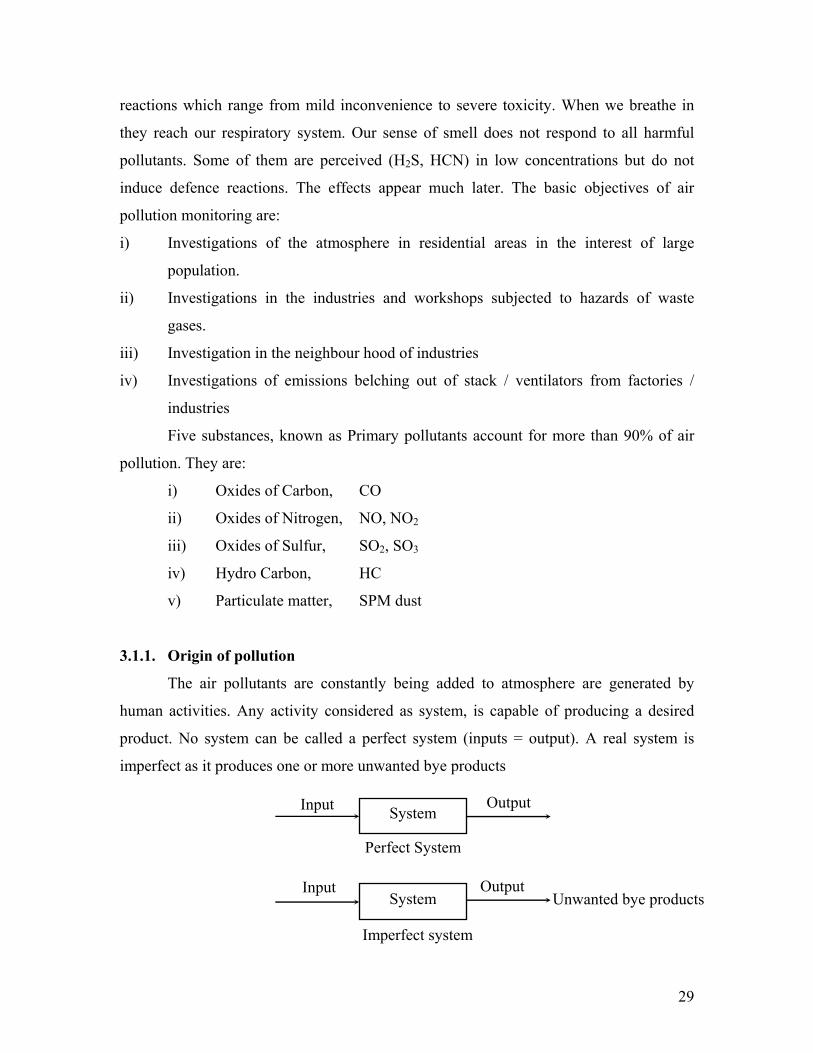
Some typical examples of imperfect systems are as under:
Input System Desired activity Unwanted bye products
Petrol, air Automobiles Transportation Exhaust gases
CO, NO, NO2, HC dust
Coal, air Fire Power generation Smoke CO, CO2, NO, NO2, HC, SO2, dust (unburnt Carbon)
The five important activities generate pollution as
Activities Over all CO Nox Sox HC Dust Transportation 42% 64.0% 48.0% 5.0% 51.0 4.2
Fuel Combustion (stationary sources)
21% 2.0% 40.0% 72.7% 2.5 26.0
Industrial process 14% 10.0% 1.0 22.0% 14.0 31.0
Solid waste disposal 5.2% 8.0% 3.0% 5.0% 9.0% 3.8
Miscellaneous 17.4% 16.0% 8.0 4.0% 23.5 35.0
Perusal of the data reveals that transportation is the major culprit and Carbon
mono oxide is the most severe pollutant.
3.1.2. Carbon mono oxide is produced chiefly through incomplete combustion.
Some carbon mono oxide is also produced (natural sources) by geophysical
processes and biological processes like volcanic eruptions, natural gas emissions,
electrical discharges, marsh gas and seed germination.
3.1.3 Oxides of Nitrogen:
Oxides of Nitrogen are produced due to combustion but a larger quantity is
generated by natural processes. Of the man made activities producing oxides of Nitrogen
(NO and NO2) are the combustion both from transportation as well as from stationary
31
sources. Oxides of Nitrogen also play a significant role in photochemical smog and ozone
formation.
3.1.4 Oxides of Sulfur:
Oxides of sulfur include SO2 and SO3. They are chiefly produced by combustion
of fossil fuel in stationary sources. Thermal power plants contribute a large share.
Transportation and Industrial processes also generate them. They are corrosive in nature.
3.1.5. Hydrocarbons
An organic compound containing only Hydrogen and Carbon and are gaseous at
room temperature are designated as Hydrocarbons. In unpolluted areas, methane (CH4, a
natural decay gas) is most abundant. Other hydrocarbons normally noticeable are
petroleum products and gasoline viz. Olefin, acetylene, benzene, ethylene and toluene.
They are highly reactive and cause smog formation.
3.1.6 Particulate Matter
Include any dispersed matter smaller than 500 µg but larger than 0.002 µ. They
are classified according to size and biological properties.
Settleable > 10 µ
Suspended < 10 µ
The particles of the size between 100 µ - 0.001 µ are of
interest in pollution
Biological Spores, pollen and bacteria
The particles less than 10.0 µ are referred as Respiratory suspended particulate
Matter (RSPM). Particles < 1.0 µ are retained) in the lungs.
3.1.7 Effect of Air Pollutants on man material and Vegetation
All pollutants released in the atmosphere do not produce adverse effects, though
some of them are intensely toxic. Other’s cause mild in convenience Some common
pollutants causing physiological effects are listed below:
32
A. Biological Pollutant Effect
i) Aeroallergens (Pollen, danders,
spores, mold, yeast, hair, feathers,
vegetative fibers, grain dust cosmetics,
paint and glues
Bronchial asthma, hay fever, body rash
and even eczyma
ii) Biological aerosols, bacteria, fungus,
virus
Pulmonary tuberculosis, anthrax.
Throat infections, whooping cough,
Diphtheria, common cold, Influenza
B. Non biological
i) Ammonia (from Chemical industries
refineries, Coke Ovens)
Corrosive to mucous lining, damage to
eyes
ii) Asbestos (air conditioning insulation) Pulmonary fibrosis
iii) Chlorine (manufacture, and use in
water treatment)
Irritative to eyes / nose/ throat
iv) Carbon-mono-oxide←(Combustion,
stationary, sources)
Asphyxiation
v) Sulfur-di-oxide Irritation and Cardiac ailments
vi) Oxides of Nitrogen (Combustion) Asphyxiation, pulmonary edema
vii) Hydro-carbons (combustion,
petrochemical establishments)
Anasthesing effect
Vomiting, vertigo
3.1.8 Guidelines of Sampling and Monitoring
The guidelines for selection of ambient air monitoring stations are given in IS-
5182 part IV.
The guidelines state that “when objective of air sampling is to identify the
contribution from specific sources of pollution, the sampling locations should be located
in upwind and downwind of such sources”. The location of air quality monitoring stations
should satisfy the following conditions.
1. The site should be representative of the area selected.
2. The station should be set up and operated so as to yield data that can be compared
with those from stations within the network, and
33
3. Certain physical requirements should be satisfied at the site
(Lectures 7, 8)
3.2 Water Pollution and Water Quality
The water, pollution may be caused by the addition of physical and chemical
impurities, through addition of wastes from houses, industries or by surface runoff from
agriculture and forests. It is essentially an ecological phenomenon involving interaction
of organisms and the inanimate environment.
The direct measure of pollution, however, is the effect the polluting substances
have on flora and fauna of the water body although physico chemical and biochemical
tests may be necessary to explain these effects.
The sources of pollution may be classified into (a) Point sources and (b) non
point sources
3.2.1. Point Sources:
Point sources are discrete and confined. They emanate either from houses, offices,
other commercial buildings or from industries.
a) Sewage or Domestic Waste: Waste water emanating from house hold activities
including toilets, bathrooms and kitchen, offices, commercial centers is termed as
sewage. This has mostly biodegradeable impurities. Some nonbiological
chemicals viz. detergents, phenols may also be present. Some of the important
properties are:
i) Chemical Properties :
Color – Natural decay of organic materials
Odor – Decomposing waste waters
Solids – Residues of domestic products, salts, soil erosion
ii) Chemical properties (Residues of material used)
Organic – Carbohydrates, Proteins, Hydrocarbons
iii) Primary pollutions:
Organic and inorganic compounds selected on the basis of their suspected
carcinogencity, tetragenicity or high toxicity
Surfactants : Soaps and detergents
Volatile organic compounds.
34
iv) Inorganic:
Alkalinity
Chloridies
Heavy metals (trace quantities)
Nitrogen
pH
Phosphates
Sulfates
v) Gases
Hydrogen, Sulfide
Methane
Oxygen
vi) Biological
Animals : Protozoans, Nematodes
Plants : Algae
: Pathogenic bacteria
Indicator bacteria
Virus : Phages and animal virus
Important Pollutants of Concern
i) Solids / Residue : Total Solids, Suspended Solids, Dissolved Solids
ii) Biodegradeable : Biochemical Oxygen Demand, Chemical Oxygen Demand
(B.O.D./C.O.D.)
iii) Pathogens : Salmonella, Shigella and Cholera vibro
iv) Non Pathogens : Indicator bacteria – Coliform / Faecal Coliform
v) Nutrients : Nitrogen saline, Organic, nirite and nitrate; phosphates
vi) Priority pollutants : Known to produce cancer and other disabilities
vii) Refractory organics – Surfactants, Phenols
viii) Heavy metals : Fe, Ca, Mg, Hg, Pb
b) Industrial Wastes: The volume, strengths of industrial wastes entirely depends
on the type of raw material used and the processes involved. Some components of
industrial wastes would be.
35
Inorganic Salts : Chlorides (Salinity), Hardness (Scale forming)
: Acids / alkalies
Organic Compounds : Organic materials used
Suspended
dissolved
Floating Solids : oil and grease
Toxic Chemicals : Pb, F, As, Se, Cr, Cu, Fe, Mg, Zn. Hg
Phenols, pesticides
Microbes : Tanneries, Slaughter house waste and food
industries will have variety of microbes.
Radio active nucleotides : Atomic energy units.
The volume and strength is expressed in terms of kL waste produced, BOD and
suspended solids.
3.2.2 Non Point Sources
Non point sources are diffused and intermittent. They are picked up and carried
by run off. The important sources are:
Dairies, dhobhi ghats, motor garrages, cattle wallowing, carcass disposal, open
defecation, crematorium, river fronts. They have sediment, nutrients and decomposable
Compounds
3.2.3 Areas of Concern in Water Pollution
There have been seven areas of concern over the years which have pre occupied
individuals with water pollution and contamination and ecological manifestations (i)
Oxygen demanding wastes, (ii) Pathogens (iii) Nutrients, (iv) Salts and minerals (v)
heated discharges (vi) Trace metals and (vii) Pesticides and other volatile organic
compounds.
(i) Oxygen demanding wastes
Oxygen demanding wastes are biodegradable and require oxygen from receiving
waters. The demand is exercised by microbial population in stabilizing the organic
matter. Since the amount of oxygen dissolved is limited, it get depleted quickly and
degradation proceeds under anaerobic (non toxic) conditions. The amount of oxygen
36
required to degrade the organic matter is measured as Biochemical oxygen demand and /
or Chemical Oxygen Demand (BOD/COD). A quantitative relationship exists between
the amount of Oxygen required to convert a definite amount of Organic matter to Carbon
dioxide, water and ammonia.
Cn HaObNc + 2Oc43
2b
4an
−−+ → n CO2 +
− c
23
2a H2O + CNH3
For a fully biodegrable waste which is also chemically oxidisable BOD : COD
ratio would be 0.6 : 1.0
ii) Pathogens :
It is long established that domestic waste / sewage carry a plethora of micro
organisms of intestinal origin which maybe bacteria / virus / protozoa or helminthes.
They produce disease by growing and multiplying in the body of host. Some of these
pathogens or Salmonella typhi (Typhoid), Salmonella paratyphi (Paratyphoid),
Salmonella enteritidis (gastro enteritis). Shigella (bacillary dysentery), Cholera vibro
(Cholera), Hepatities, Jaundice Poliomyelitis (virus), Protozoans produce amoebic
dysentery and giardiasis, worms (helminthes) cause significant disorders. The intestinal
discharges of persons suffering, carriers, contain billions of these pathogens.
A group of bacteria which are not pathogenic but are always associated with
pathogens and unsanitary and unhygienic conditions are non pathogens (Coliform, faecal
Coliform, Streptococcus). In routine waster and waste water examination the number of
non pathogens (also known as indicator bacteria) is estimated.
iii) Nutrients
Nutrients are essential plant requirements such as nitrogen and phosphates,
carbon, sulfates, potassium, iron, manganese, boron and cobalt. Some of these chemicals
present in water accelerate the growth of plants (hydrophytes) and algae. Some times they
can lead to blooms. The decay of blooms when, nutrients are exhausted depletes
dissolved oxygen and add color and odor to water body (termed as Eutrophication).
In water pollution control strategy, Nitrogen and Phosphorus are important and
need to be controlled to combat eutrophication and / or after growth. Nitrogen as NO3 in
excess of 40 – 45 mg/l are toxic to infants (methemoglobinemia–blue babies). Such
concentrations are more frequent in ground waters.
37
iv) Salts and Minerals
Water is a very good solvent. It gathers a variety of dissolved salts during flow on
geologic strata. These include cations viz. calcium (Ca++), Sodium (Na+), Magnesium
(Mg++), Potassium (k+) and anions viz chlorides (Cl − ), carbonates (CO-3), bicarbonates
(HCO3− ) and sulfates (SO=
4). The normal method of their measurement is as total
dissolved solids (TDS) or conductance. The fresh water normally have TDS < 1500 mg/l;
brackish waters upto 5000 mg/l and sea water normally in the range of 30,000 – 35000
mg/l. TDS is an important criterion to determine the usefulness of water. In public water
supplies the recommended value is 500 mg/l.
Acid mine drainage is another mineral pollution problem. The major ions as
pollutants in it are Fe++, SO=4, H+.
v) Thermal pollution
Thermal power generation is the main source of pollution due to heat, as it uses
enormous amounts of water for cooling. The heat from fossil fuels and nuclear fuels is
not fully converted into useful power and reaches cooling waters. For each kilowatt –
hour energy produced in an efficient coal fired plant 2/3rd heat is dissipated in cooling
water.
Consequent to the discharge of heated water the ecology is altered.
vi) Trace metals
There are ≈ 80 elements in nature which are classed as metals. (heavy metals have
sp. Gravity > 4 – 5). More often heavy metals are those which are toxic. The list includes:
Aluminium (Al), Arsenic (As), Beryllium (Be), Bismuth (Bi), Cadmium (Cd),
Chromium (Cr), Cobalt (CO), Copper (Cu), Iron (Fe), Lead (Pb), Manganese (Mn),
Mercury (Hg), Nickel (Ni), Selenium (Se) and Zinc (Zn).
The source of these metals in waters is through industrial discharges. They may
undergo change to produce more toxic substances (Hg Salts). Excess of metal in body
through ingestion and accumulation damages, liver and kidneys.
vii) Pesticides and other Volatile Organic Compounds
There are large majority of synthetic compounds which are manufactured to kill
pests. (animals / plants harmful to man and plants) (Insecticides, herbicides, rodenticides
and fungicides).
38
The commonly used pesticides are washed out in waste waters and may be found
in trace quantities in water bodies (organo chlorines, organophosphates, (carbamates)
Other volatile organic compounds include Vinyl Chloride (used in manufacture of
resins) Chloroethylene (Solvent used in heat transfer). Chlorofluorocarbons (air
conditioning), dichloromethane (metal degreaser), Carbon tetra chloride (domestic
degreaser). Some of them are carcinogenic and can damage nervous system.
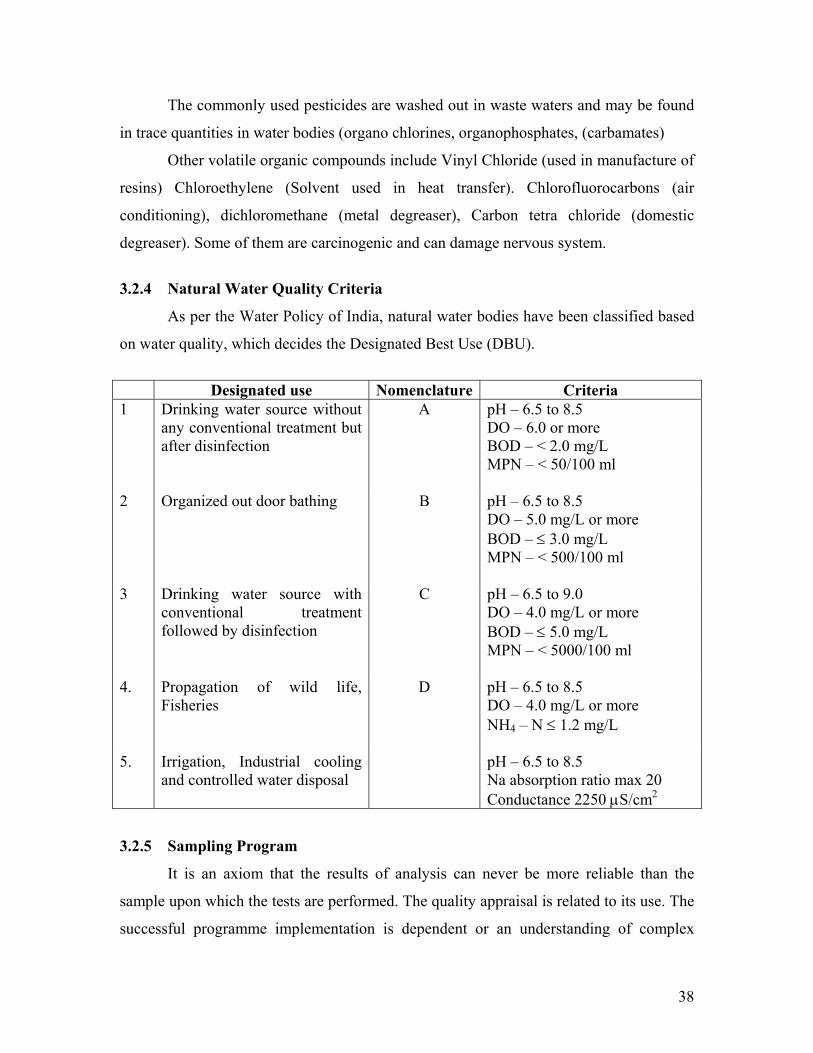
3.2.4 Natural Water Quality Criteria
As per the Water Policy of India, natural water bodies have been classified based
on water quality, which decides the Designated Best Use (DBU).
Designated use Nomenclature Criteria
1 Drinking water source without any conventional treatment but after disinfection
A pH – 6.5 to 8.5 DO – 6.0 or more BOD – < 2.0 mg/L MPN – < 50/100 ml
2 Organized out door bathing B pH – 6.5 to 8.5 DO – 5.0 mg/L or more BOD – ≤ 3.0 mg/L MPN – < 500/100 ml
3 Drinking water source with conventional treatment followed by disinfection
C pH – 6.5 to 9.0 DO – 4.0 mg/L or more BOD – ≤ 5.0 mg/L MPN – < 5000/100 ml
4. Propagation of wild life, Fisheries
D pH – 6.5 to 8.5 DO – 4.0 mg/L or more NH4 – N ≤ 1.2 mg/L
5. Irrigation, Industrial cooling and controlled water disposal
pH – 6.5 to 8.5 Na absorption ratio max 20 Conductance 2250 µS/cm2
3.2.5 Sampling Program
It is an axiom that the results of analysis can never be more reliable than the
sample upon which the tests are performed. The quality appraisal is related to its use. The
successful programme implementation is dependent or an understanding of complex
39
physico chemical and biological phenomenon and assembling this understanding into a
coherent model (Fig. 3.1 & 3.2).
Design of Measurement System
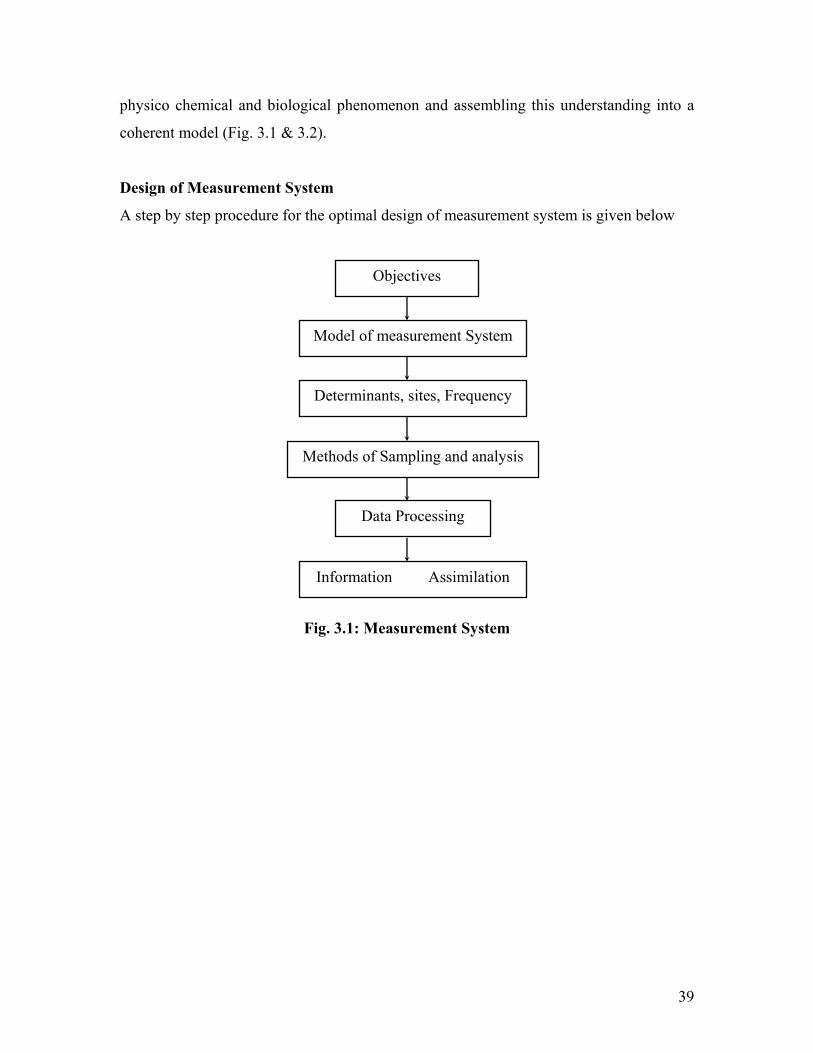
A step by step procedure for the optimal design of measurement system is given below
Fig. 3.1: Measurement System
Objectives
Model of measurement System
Determinants, sites, Frequency
Methods of Sampling and analysis
Data Processing
Information Assimilation
40
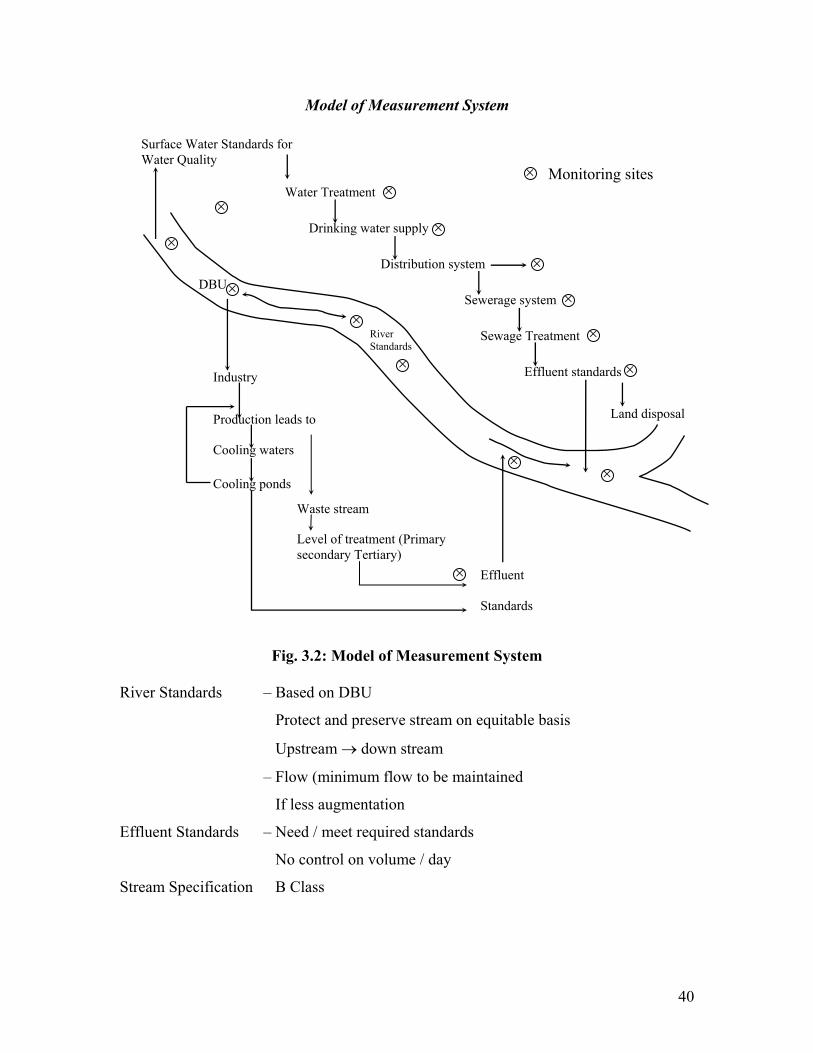
Model of Measurement System
Fig. 3.2: Model of Measurement System River Standards – Based on DBU
Protect and preserve stream on equitable basis
Upstream → down stream
– Flow (minimum flow to be maintained
If less augmentation
Effluent Standards – Need / meet required standards
No control on volume / day
Stream Specification B Class
Water Treatment
Drinking water supply
Distribution system
Sewerage system
Sewage Treatment
Effluent standards
Land disposal
Effluent Standards
Level of treatment (Primary secondary Tertiary)
Waste stream
Production leads to Cooling waters Cooling ponds
Industry
Surface Water Standards for Water Quality
River Standards
DBU
×
×
×
×
×
× ×
×
×
×
×
×
×
×
× Monitoring sites
41
Determinants Site and Frequency
The selection of determinants are solely based on the need to satisfy the
objectives of measurements. Some important determinants are:
a) To determine background of source
Temperature (air and water), flow; hourly variation, precipitation, flow pattern
(storage, equalization, pumping).
b) Physico Chemical determinants
Turbidily (NTU), transparency (Secchi’s disc), color (Ni, Cobalt – Scale), total,
suspended, dissolved, volatile and fixed solids; pH, alkalinity, acidity; dissolved
gases (CO2 and O2)
c) Non Specific Organic Compounds
Biochemical Oxygen Demand (BOD 20oC 5 days or equivalent)
Chemical Oxygen Demand (COD), Total Organic Carbon
d) Major elements:
Sodium (Na+) Potassium (k+), Calcium (Ca++), Magnessium (Mg++), Carbonates
(CO3), Bicarbonates (HCO3), Chlorides (Cl − ), Sulfates (SO4)
e) Nutrients : Total Nitrogen (kjeldahl), free ammonical nitrogen (NH4+) Nitrite –
Nitrogen (NO2), Nitrate Nitrogen (NO3), Total and Dissolved Phosphates (PO4).
f) Specific Pollutants : Copper (Cu), Zinc (Zn), Lead (Pb), Cadmium (Cd), Arsenic
(As), Chromium (Cr), Mercury (Hg), Phenols, Surfactants, pesticides.
g) Biological form : Macrophytes, plankton, Nekton and Benthos
h) Microbiological pollutants: Total plate count (total bacterial, coliform (MPN),
faecal Coliform (MPN), Streptococcus (MPN)
Sites and Frequency of Sampling
The main requirement of water quality determination is to collect a small portion
of water / waste water which can be transported easily and handled in laboratory, while
still representing accurately the parameters. A valid sample must be collected from the
site at such times that analytical results are representative of the quality both spatially and
temporally. The site may be predetermined such that it is approachable at all seasons
commensurate with objectives. Samples be so collected / handled that they do not
42
deteriorate / become contaminated before it reaches the laboratory. The sampling bottles
may be completely filled (except for bacterial examination) to avoid loss of volatile
matter. There are defined procedures (Standard Methods for Examination of Water and
Waste Water 20th edition APHA/AWWA) for sampling for metals and biological,
bacteriological examination. For routine analysis three type of samples are collected
depending on the objectives.
Grab Sample: Grab sample is a small amount of sample collected at one place at a given
time. Where changes in quality are anticipated a number of grab samples collected at
suitable intervals and analyzed. Seasonal variations require collection at different times.
Composite Samples : Composite sample is a combination of number of grab samples
collected at the place over a period of time (one, two or four hourly) proportional to the
flow. (Not advisable for pH, DO, CO2 and H2S). Composite samples are required where
quality varies with time (sewage and industrial waste)
Integrated Sample: Integrated samples are such samples which are collected at a time
from different places (both banks and middle) and mixed in equal volume. Detailed
methods of collection, storage and transportation will not be needed at this stage.
3.2.6 Objectives
The objectives of Water Analysis which constitute an understanding of the
impacts and the effects on status of water body are:
i) To determine the potability of water
ii) To determine the suitability of Designated Best Use (DBU) of water body
iii) To determine the carrying capacity (waste load) of water and capacity of self
cleaning.
iv) To determine the extent of treatment required for off site usage
v) To determine the possible determinable effects of waste effluents, point sources
(domestic / Industrial) and non point sources
vi) To determine the type and quantities of waste discharge in municipal sewers
vii) Assess reasons of toxicity and fish kill
(Lectures 9, 10)
43
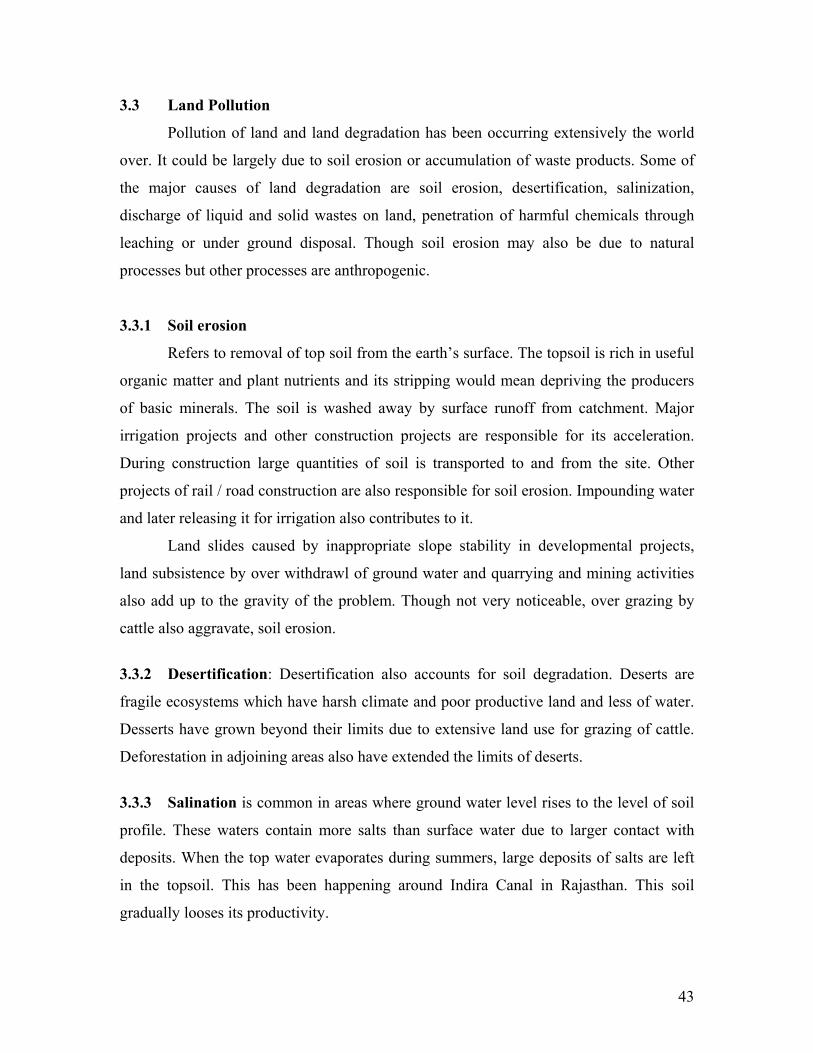
3.3 Land Pollution
Pollution of land and land degradation has been occurring extensively the world
over. It could be largely due to soil erosion or accumulation of waste products. Some of
the major causes of land degradation are soil erosion, desertification, salinization,
discharge of liquid and solid wastes on land, penetration of harmful chemicals through
leaching or under ground disposal. Though soil erosion may also be due to natural
processes but other processes are anthropogenic.
3.3.1 Soil erosion
Refers to removal of top soil from the earth’s surface. The topsoil is rich in useful
organic matter and plant nutrients and its stripping would mean depriving the producers
of basic minerals. The soil is washed away by surface runoff from catchment. Major
irrigation projects and other construction projects are responsible for its acceleration.
During construction large quantities of soil is transported to and from the site. Other
projects of rail / road construction are also responsible for soil erosion. Impounding water
and later releasing it for irrigation also contributes to it.
Land slides caused by inappropriate slope stability in developmental projects,
land subsistence by over withdrawl of ground water and quarrying and mining activities
also add up to the gravity of the problem. Though not very noticeable, over grazing by
cattle also aggravate, soil erosion.
3.3.2 Desertification: Desertification also accounts for soil degradation. Deserts are
fragile ecosystems which have harsh climate and poor productive land and less of water.
Desserts have grown beyond their limits due to extensive land use for grazing of cattle.
Deforestation in adjoining areas also have extended the limits of deserts.
3.3.3 Salination is common in areas where ground water level rises to the level of soil
profile. These waters contain more salts than surface water due to larger contact with
deposits. When the top water evaporates during summers, large deposits of salts are left
in the topsoil. This has been happening around Indira Canal in Rajasthan. This soil
gradually looses its productivity.
44
Another, wide spread process of water disposal both liquid and solid has added to
the problems of land pollution. Sewage irrigation is very common in some states of India,
UP, Haryana, Punjab where partially treated waste waters are spread on land. The
residual organic matter decays on soil and makes them acidic. Constant flow of these
waters make the soil sick.
3.3.4 Solid Wastes: are also being disposed on land almost every where in the country.
Larger the town bigger is the problem. The urban land is under threat from solid wastes
including a sizeable load of non biodegradable plastic.
In addition to domestic wastes industrial solid wastes also pose a grave problem.
The generation is highly variable and the composition depends on the type of industries.
The wastes may be inert biodegradable, toxic and even hazardous. In general the solid
waste generating industries are:
a) Extractive industries - Minning, bulk is inert material and is piled up
- Quarrying, 5% of minning is solid waste material
- Agriculture, produce large amount wastes crop
residues, straw, stubbles, leaves, hulls
b) Process industries - Metallurgical, active material is extracted and the
rests is left as solid wastes
Chemical Processing - Slurries, sludges or solid cakes
Paper - Paper boards, boiler cinder, chip screen dust, lime,
sludges from bleach plants
Plastics - Wastes emanate from trimmings and processing
Textiles - Cotton fibers, cotton seeds, comber wastes, lime,
flax polyesters
Thermal Power Plants - Fly ash,
c) Fabricating Industries
Packaging - Aluminium sheets, steel, glass, plastic card boards,
corrugated paper boards, plastic and paper
laminates
45
Automobile - Shipping and packaging materials, components of
tyres, batteries, generators, carburetors, wheels,
bumpers etc.
Electronics - Though small but produces plastic, broken glass,
wire, backalite sheets
Construction - Residues of building materials, cement, sand,
bricks, lime, gravel.
Food Processing - Moderate quantities of biodegradeable wastes as
seed, peelings and pulp, milk and dairy products,
slaughter house wastes, hides, skin, blood,
cartillage, bones, offals.
d) Hospital Wastes - Most dangerous
At most places, these wastes are piled up outside the municipal limits. On decay
they produce acids and when it rains soluble chemicals leach into soil and create nuisance
conditions. Laechates even reach ground waters.
Sanitary landfills also contribute to pollution of land but substantially smaller than
open dumps.
Medical wastes even transmit pathogens in underground layers.
Quantitative data of land pollution is not available due to the low priority given to
it by scientists and researchers.
3.4 Pollution Cycle
Pollution of air, water and land are not independent manifestations. The levels
have now reached alarming proportions and have started threatening human existence.
The pollution of environment has been complicated by interactions and exchanges. Many
reactions are subtle and their true impact has yet to be determined. Some possible
interactions are depicted here in Fig. 3.3.
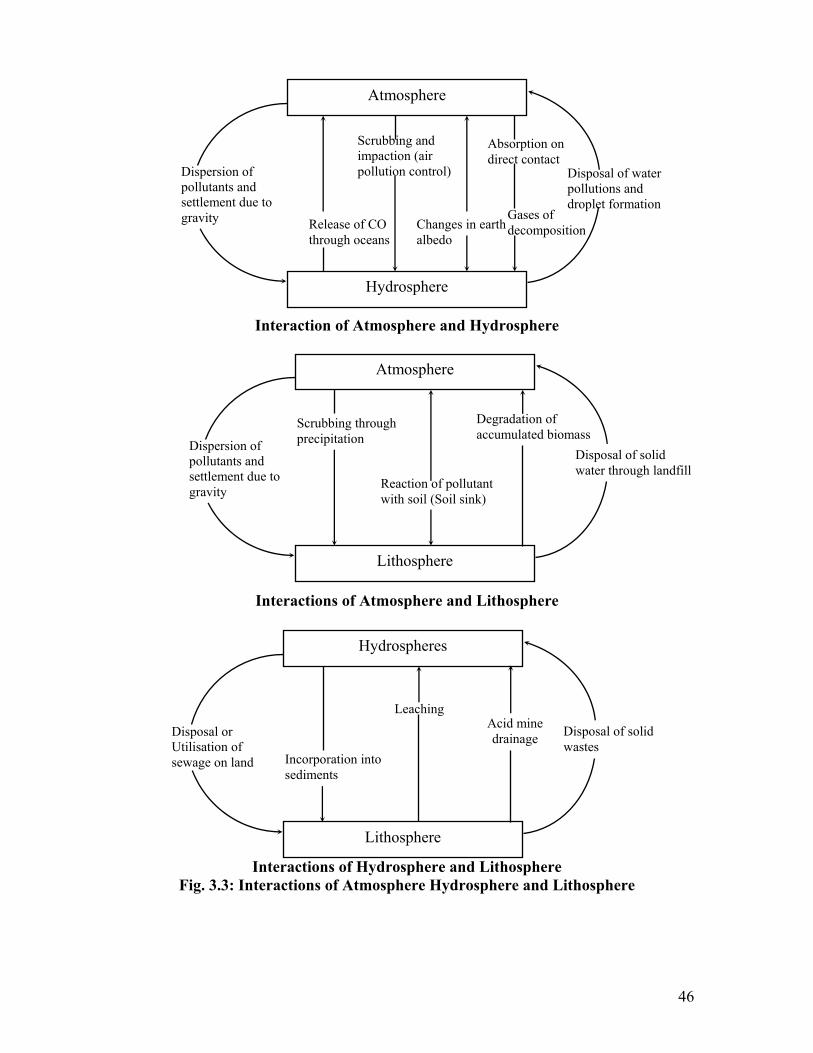
46
Interaction of Atmosphere and Hydrosphere
Interactions of Atmosphere and Lithosphere
Interactions of Hydrosphere and Lithosphere Fig. 3.3: Interactions of Atmosphere Hydrosphere and Lithosphere
Atmosphere
Dispersion of pollutants and settlement due to gravity
Scrubbing and impaction (air pollution control)
Absorption on direct contact
Release of CO through oceans
Changes in earth albedo
Disposal of water pollutions and droplet formation
Hydrosphere
Gases of decomposition
Atmosphere
Dispersion of pollutants and settlement due to gravity
Scrubbing through precipitation
Degradation of accumulated biomass
Reaction of pollutant with soil (Soil sink)
Disposal of solid water through landfill
Lithosphere
Hydrospheres
Disposal or Utilisation of sewage on land Incorporation into
sediments
Acid mine drainage
Leaching
Disposal of solid wastes
Lithosphere
47
Suggested Reading
1. Introduction to Environmental Engineering, M.L. Davis, David a. Cornwell.
WCB Mc Graw Hill (1998).
2. Hand book of Environmental Pollution, (3 volumes) Edited by Bela G. Liptak.
3. Air Pollution control by Faith.
4. Practical Handbook on Public Health Engineering G.S. Bajwa, Deep Publisher,
Shimla (2003).
(Lecture 11, 12)

48
CHAPTER – 4
4.0 Environmental Protection Acts, Rules, Regulations and Standards
4.1 Environment is everybody concern, however, a person’s perception as well as
concern, is subject to change as a result of an effect, or proposed change on
personal environment or neighbourhood environment, or economic circumstance.
There have been global efforts in focusing on problems facing humanity. They
relate to sustainable development, conservation of resources, maintaining
biodiversity, protection of regional, seas, and global problems related to Global
Warming and Ozone depletion.
One f the most important conference of United Nations, held in Stockholm (1972)
focused on Human Environment in which India’s PM Ms. Indira Gandhi delivered the
kenote address. This was followed by UNEP (United Nations Environment Protection),
Agency and Earth’s Summit in 1982. The concern in these global efforts was on:
• Human health and settlements
• Territorial ecosystems
• Environment and development (Sustainable Development),
• Protection of natural resources,
• Prevention of environmental disturbance,
• Promotion of chemical safety,
• Global climatic changes
• Risk to Ozone layer
• Depletion of genetic resources
In India we are also concerned about them but our problems are different in
magnitude. Population growth and poverty pose the most serious challenge. Poverty itself
pollute the environment.
India, is the first country, which has made provisions for the protection and
improvement of environment, in its constitution (through 42nd amendment, in 1972, made
effective from Jan. 03, 1977).
49
Govt. of India has addressed itself to the concerns of environment and have
enacted. “The Water (Prevention and Contract of Pollution) Act, 1974; Air pollution
(Prevention and Control of Pollution) Act, 1981 and the Environment (Protection) Act of
1986, with corresponding Rules and Regulations.
The salient features of these acts have been described later in the chapter, a
summary of provisions made therein are listed under para 4.2 (Table 4.1)
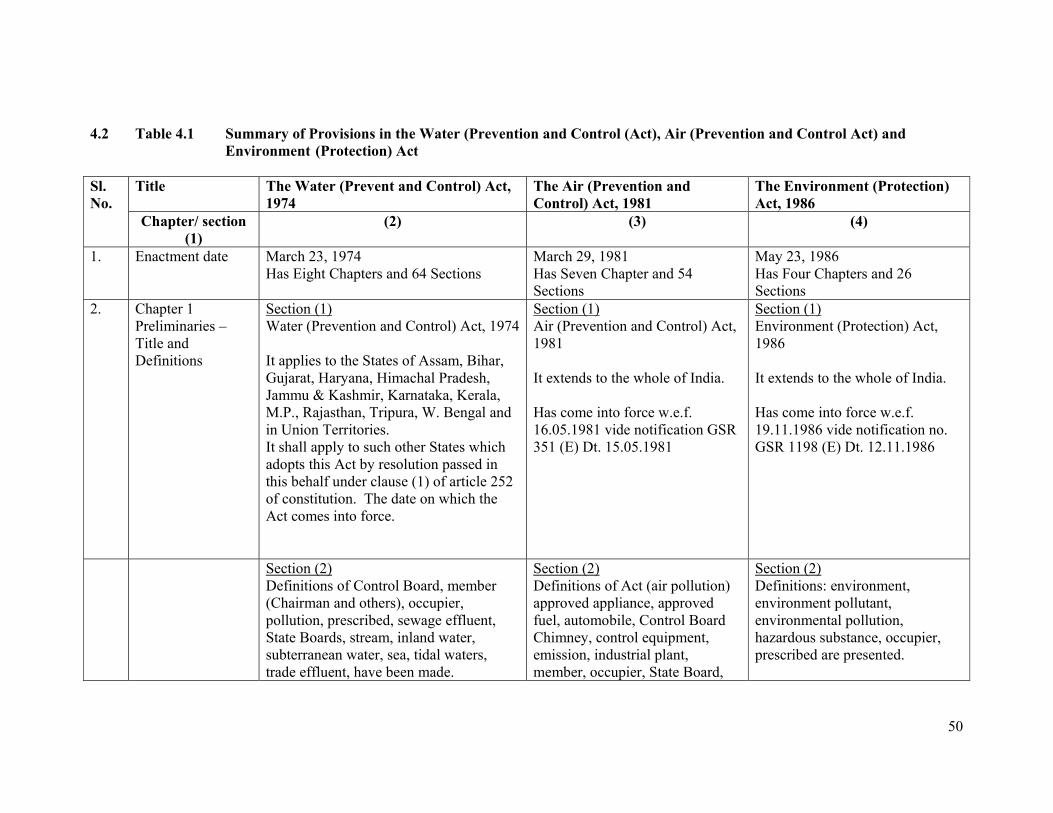
50
4.2 Table 4.1 Summary of Provisions in the Water (Prevention and Control (Act), Air (Prevention and Control Act) and Environment (Protection) Act
Title The Water (Prevent and Control) Act, 1974
The Air (Prevention and Control) Act, 1981
The Environment (Protection) Act, 1986
Sl. No.
Chapter/ section (1)
(2) (3) (4)
1. Enactment date March 23, 1974 Has Eight Chapters and 64 Sections
March 29, 1981 Has Seven Chapter and 54 Sections
May 23, 1986 Has Four Chapters and 26 Sections
2. Chapter 1 Preliminaries – Title and Definitions
Section (1) Water (Prevention and Control) Act, 1974 It applies to the States of Assam, Bihar, Gujarat, Haryana, Himachal Pradesh, Jammu & Kashmir, Karnataka, Kerala, M.P., Rajasthan, Tripura, W. Bengal and in Union Territories. It shall apply to such other States which adopts this Act by resolution passed in this behalf under clause (1) of article 252 of constitution. The date on which the Act comes into force.
Section (1) Air (Prevention and Control) Act, 1981 It extends to the whole of India. Has come into force w.e.f. 16.05.1981 vide notification GSR 351 (E) Dt. 15.05.1981
Section (1) Environment (Protection) Act, 1986 It extends to the whole of India. Has come into force w.e.f. 19.11.1986 vide notification no. GSR 1198 (E) Dt. 12.11.1986
Section (2) Definitions of Control Board, member (Chairman and others), occupier, pollution, prescribed, sewage effluent, State Boards, stream, inland water, subterranean water, sea, tidal waters, trade effluent, have been made.
Section (2) Definitions of Act (air pollution) approved appliance, approved fuel, automobile, Control Board Chimney, control equipment, emission, industrial plant, member, occupier, State Board,
Section (2) Definitions: environment, environment pollutant, environmental pollution, hazardous substance, occupier, prescribed are presented.
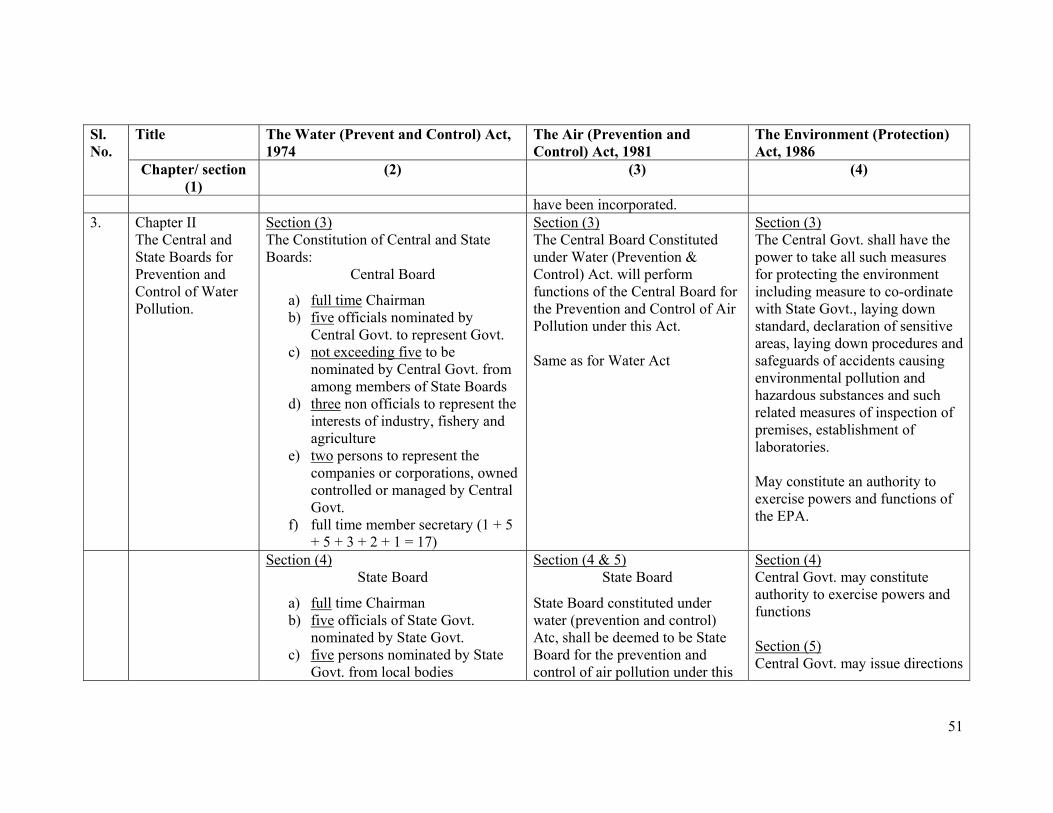
51
Title The Water (Prevent and Control) Act, 1974
The Air (Prevention and Control) Act, 1981
The Environment (Protection) Act, 1986
Sl. No.
Chapter/ section (1)
(2) (3) (4)
have been incorporated. 3. Chapter II
The Central and State Boards for Prevention and Control of Water Pollution.
Section (3) The Constitution of Central and State Boards:
Central Board
a) full time Chairman b) five officials nominated by
Central Govt. to represent Govt. c) not exceeding five to be
nominated by Central Govt. from among members of State Boards
d) three non officials to represent the interests of industry, fishery and agriculture
e) two persons to represent the companies or corporations, owned controlled or managed by Central Govt.
f) full time member secretary (1 + 5 + 5 + 3 + 2 + 1 = 17)
Section (3) The Central Board Constituted under Water (Prevention & Control) Act. will perform functions of the Central Board for the Prevention and Control of Air Pollution under this Act. Same as for Water Act
Section (3) The Central Govt. shall have the power to take all such measures for protecting the environment including measure to co-ordinate with State Govt., laying down standard, declaration of sensitive areas, laying down procedures and safeguards of accidents causing environmental pollution and hazardous substances and such related measures of inspection of premises, establishment of laboratories. May constitute an authority to exercise powers and functions of the EPA.
Section (4) State Board
a) full time Chairman b) five officials of State Govt.
nominated by State Govt. c) five persons nominated by State
Govt. from local bodies
Section (4 & 5) State Board
State Board constituted under water (prevention and control) Atc, shall be deemed to be State Board for the prevention and control of air pollution under this
Section (4) Central Govt. may constitute authority to exercise powers and functions Section (5) Central Govt. may issue directions
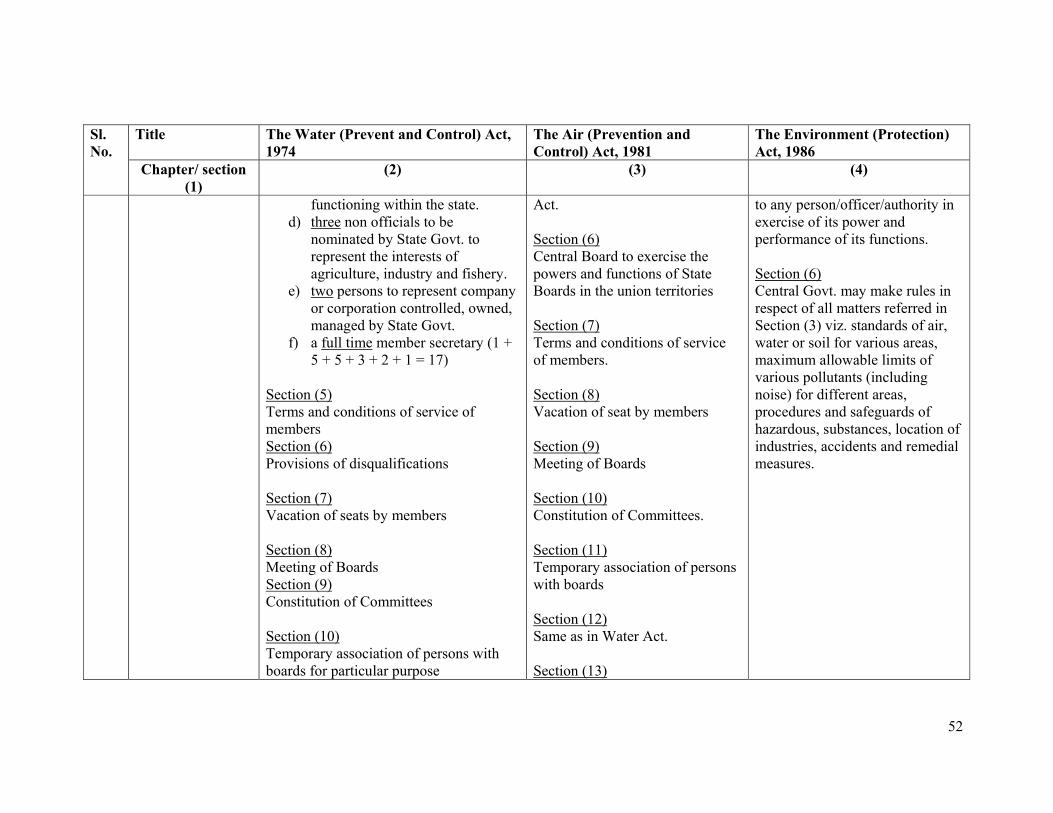
52
Title The Water (Prevent and Control) Act, 1974
The Air (Prevention and Control) Act, 1981
The Environment (Protection) Act, 1986
Sl. No.
Chapter/ section (1)
(2) (3) (4)
functioning within the state. d) three non officials to be
nominated by State Govt. to represent the interests of agriculture, industry and fishery.
e) two persons to represent company or corporation controlled, owned, managed by State Govt.
f) a full time member secretary (1 + 5 + 5 + 3 + 2 + 1 = 17)
Section (5) Terms and conditions of service of members Section (6) Provisions of disqualifications Section (7) Vacation of seats by members Section (8) Meeting of Boards Section (9) Constitution of Committees Section (10) Temporary association of persons with boards for particular purpose
Act. Section (6) Central Board to exercise the powers and functions of State Boards in the union territories Section (7) Terms and conditions of service of members. Section (8) Vacation of seat by members Section (9) Meeting of Boards Section (10) Constitution of Committees. Section (11) Temporary association of persons with boards Section (12) Same as in Water Act. Section (13)
to any person/officer/authority in exercise of its power and performance of its functions. Section (6) Central Govt. may make rules in respect of all matters referred in Section (3) viz. standards of air, water or soil for various areas, maximum allowable limits of various pollutants (including noise) for different areas, procedures and safeguards of hazardous, substances, location of industries, accidents and remedial measures.

53
Title The Water (Prevent and Control) Act, 1974
The Air (Prevention and Control) Act, 1981
The Environment (Protection) Act, 1986
Sl. No.
Chapter/ section (1)
(2) (3) (4)
Section (11) Vacancy in Board Section (12) Member Secretary and officers and other employees of Boards
Similar to Water Act.
4. Chapter III Joint Boards
Powers and Functions of Joint Boards Under Section (13, 14, 15), there are provisions of Joint Boards, with full time Chairman, members from participating States and a full time Member Secretary
Same as Water Act Prevention, control and Abatement of Environmental Pollution. Section (7) No person carrying on any industry, operation, process shall discharge/emit any pollutant in excess of such standards.
5. Chapter IV Powers and Functions of Boards Section (16) Central Board may - advise Central Govt. on any matter concerning prevention and control of water pollution - co-ordinate activities of State Boards - provide technical assistance to State Boards, Carryout/Sponsor research Section (17) State Board may - plan a comprehensive programme for the prevention of water pollution - advise State Govt. on any matter
Chapter III Powers and Functions of Boards Section (16) As in Water Act Section (16) for air pollution prevention and control. Section (17) Same as in Water Act but for air
Section (8) No person shall handle any hazardous substance except in accordance with procedures and safeguards Section (9) In case of accidents or apprehension of accident, the person shall be bound to prevent and mitigate environmental pollution and intimate to authorities of such occurrence. Section (10) Empowered persons by Central
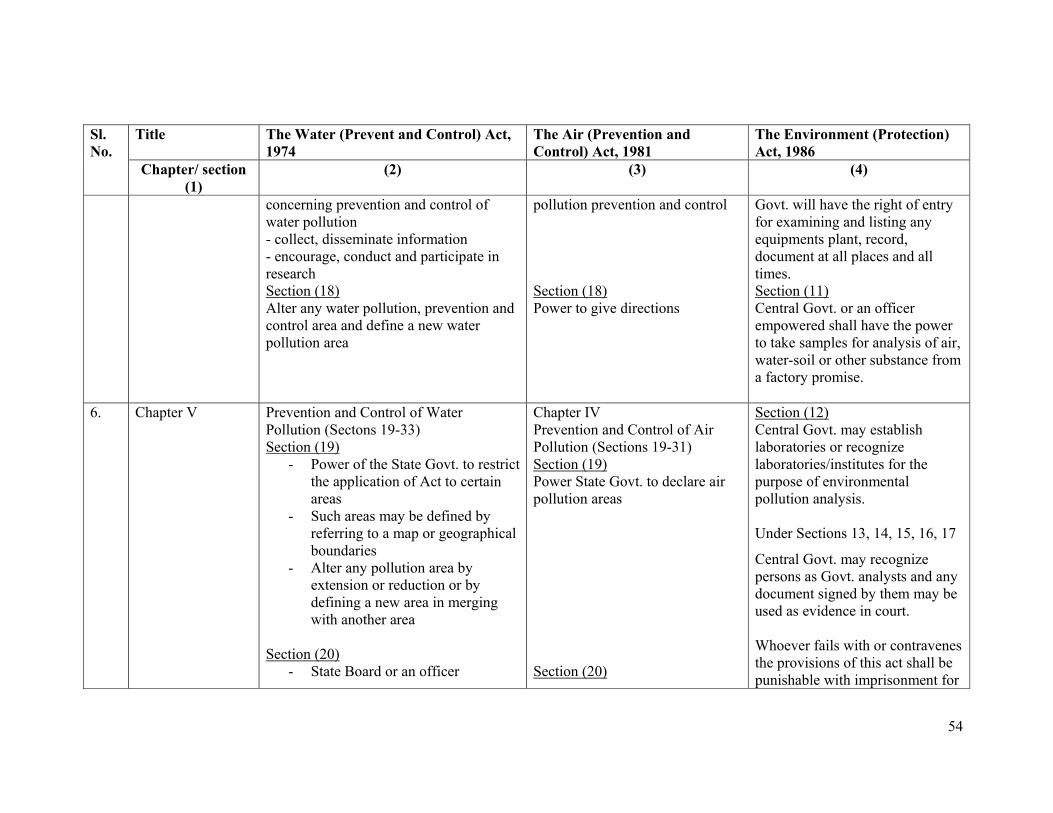
54
Title The Water (Prevent and Control) Act, 1974
The Air (Prevention and Control) Act, 1981
The Environment (Protection) Act, 1986
Sl. No.
Chapter/ section (1)
(2) (3) (4)
concerning prevention and control of water pollution - collect, disseminate information - encourage, conduct and participate in research Section (18) Alter any water pollution, prevention and control area and define a new water pollution area
pollution prevention and control Section (18) Power to give directions
Govt. will have the right of entry for examining and listing any equipments plant, record, document at all places and all times. Section (11) Central Govt. or an officer empowered shall have the power to take samples for analysis of air, water-soil or other substance from a factory promise.
6. Chapter V Prevention and Control of Water Pollution (Sectons 19-33) Section (19)
- Power of the State Govt. to restrict the application of Act to certain areas
- Such areas may be defined by referring to a map or geographical boundaries
- Alter any pollution area by extension or reduction or by defining a new area in merging with another area
Section (20)
- State Board or an officer
Chapter IV Prevention and Control of Air Pollution (Sections 19-31) Section (19) Power State Govt. to declare air pollution areas Section (20)
Section (12) Central Govt. may establish laboratories or recognize laboratories/institutes for the purpose of environmental pollution analysis. Under Sections 13, 14, 15, 16, 17
Central Govt. may recognize persons as Govt. analysts and any document signed by them may be used as evidence in court. Whoever fails with or contravenes the provisions of this act shall be punishable with imprisonment for
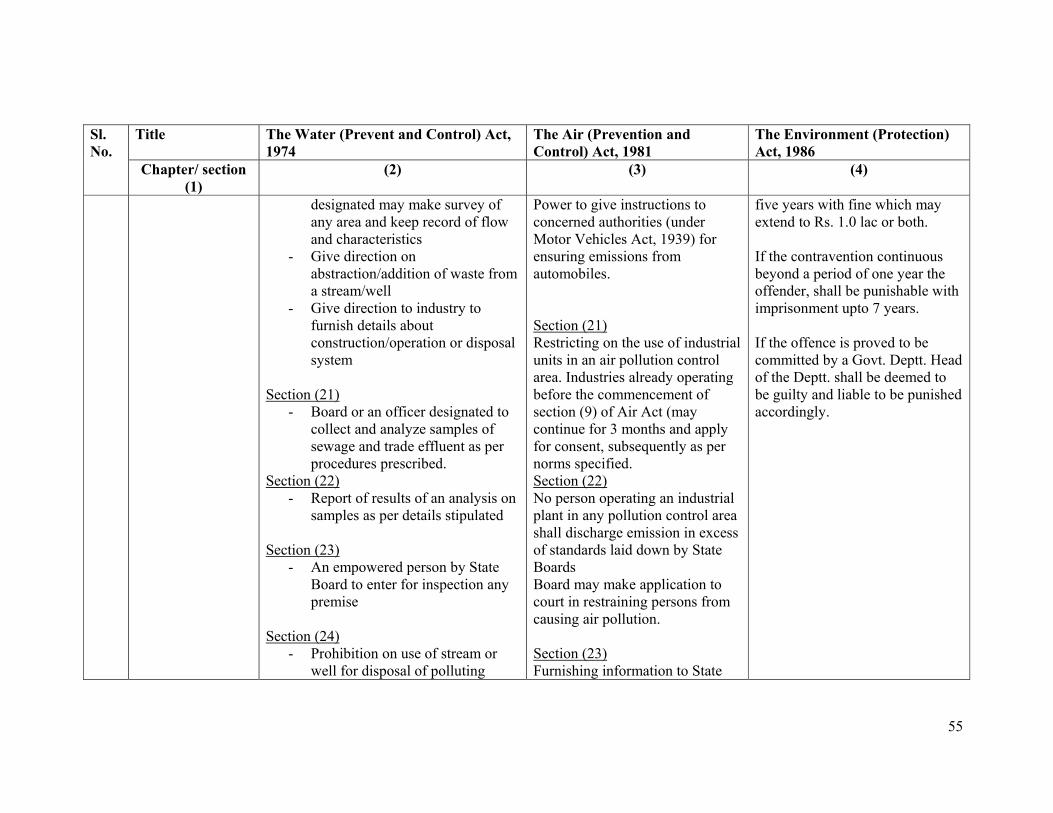
55
Title The Water (Prevent and Control) Act, 1974
The Air (Prevention and Control) Act, 1981
The Environment (Protection) Act, 1986
Sl. No.
Chapter/ section (1)
(2) (3) (4)
designated may make survey of any area and keep record of flow and characteristics
- Give direction on abstraction/addition of waste from a stream/well
- Give direction to industry to furnish details about construction/operation or disposal system
Section (21)
- Board or an officer designated to collect and analyze samples of sewage and trade effluent as per procedures prescribed.
Section (22) - Report of results of an analysis on
samples as per details stipulated Section (23)
- An empowered person by State Board to enter for inspection any premise
Section (24)
- Prohibition on use of stream or well for disposal of polluting
Power to give instructions to concerned authorities (under Motor Vehicles Act, 1939) for ensuring emissions from automobiles. Section (21) Restricting on the use of industrial units in an air pollution control area. Industries already operating before the commencement of section (9) of Air Act (may continue for 3 months and apply for consent, subsequently as per norms specified. Section (22) No person operating an industrial plant in any pollution control area shall discharge emission in excess of standards laid down by State Boards Board may make application to court in restraining persons from causing air pollution. Section (23) Furnishing information to State
five years with fine which may extend to Rs. 1.0 lac or both. If the contravention continuous beyond a period of one year the offender, shall be punishable with imprisonment upto 7 years. If the offence is proved to be committed by a Govt. Deptt. Head of the Deptt. shall be deemed to be guilty and liable to be punished accordingly.
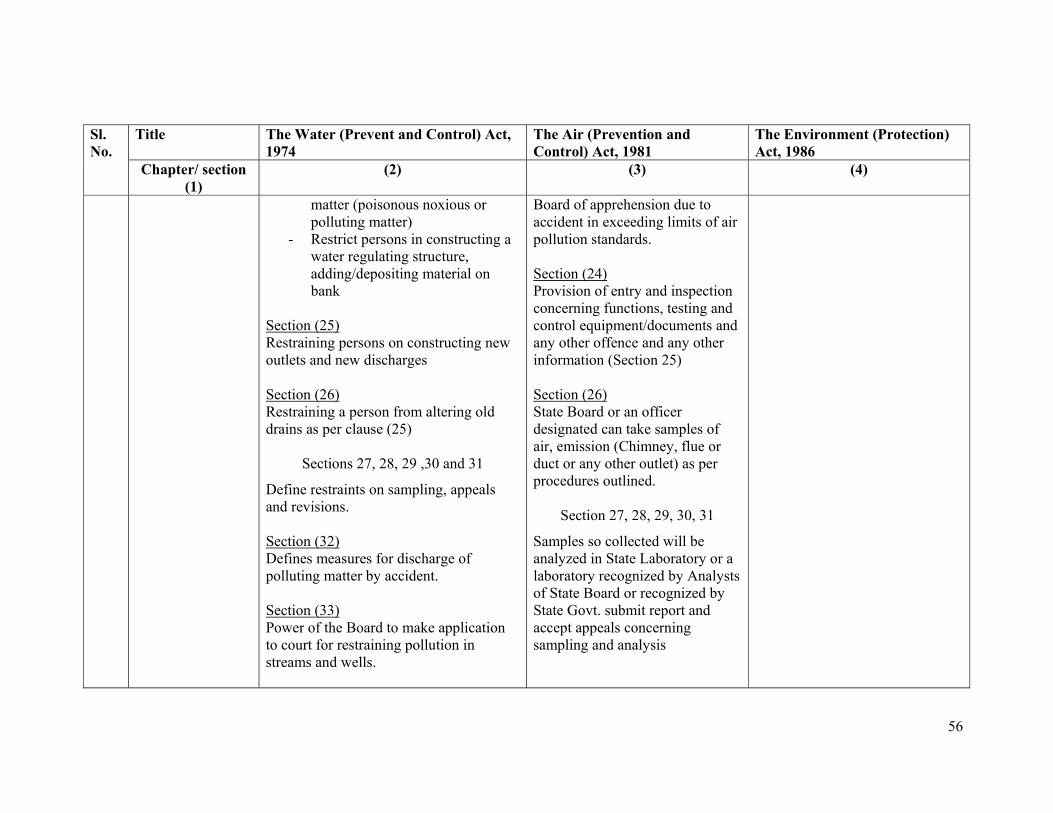
56
Title The Water (Prevent and Control) Act, 1974
The Air (Prevention and Control) Act, 1981
The Environment (Protection) Act, 1986
Sl. No.
Chapter/ section (1)
(2) (3) (4)
matter (poisonous noxious or polluting matter)
- Restrict persons in constructing a water regulating structure, adding/depositing material on bank
Section (25) Restraining persons on constructing new outlets and new discharges Section (26) Restraining a person from altering old drains as per clause (25)
Sections 27, 28, 29 ,30 and 31
Define restraints on sampling, appeals and revisions. Section (32) Defines measures for discharge of polluting matter by accident. Section (33) Power of the Board to make application to court for restraining pollution in streams and wells.
Board of apprehension due to accident in exceeding limits of air pollution standards. Section (24) Provision of entry and inspection concerning functions, testing and control equipment/documents and any other offence and any other information (Section 25) Section (26) State Board or an officer designated can take samples of air, emission (Chimney, flue or duct or any other outlet) as per procedures outlined.
Section 27, 28, 29, 30, 31
Samples so collected will be analyzed in State Laboratory or a laboratory recognized by Analysts of State Board or recognized by State Govt. submit report and accept appeals concerning sampling and analysis
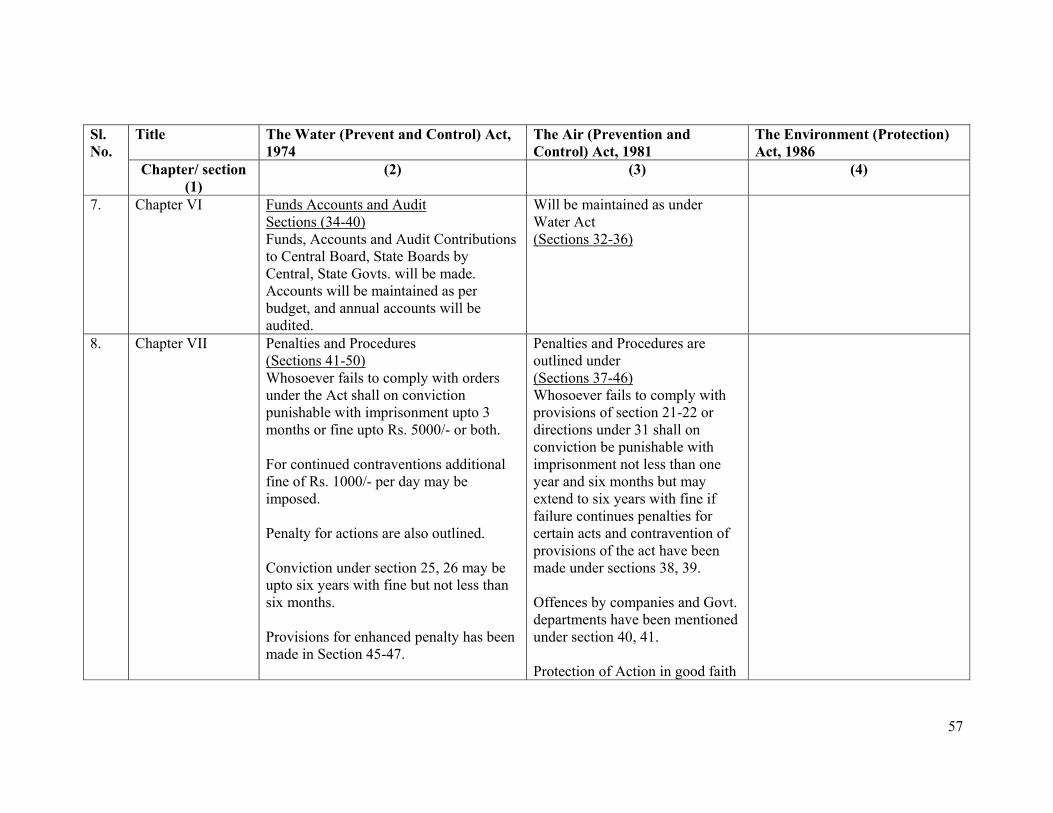
57
Title The Water (Prevent and Control) Act, 1974
The Air (Prevention and Control) Act, 1981
The Environment (Protection) Act, 1986
Sl. No.
Chapter/ section (1)
(2) (3) (4)
7. Chapter VI Funds Accounts and Audit Sections (34-40) Funds, Accounts and Audit Contributions to Central Board, State Boards by Central, State Govts. will be made. Accounts will be maintained as per budget, and annual accounts will be audited.
Will be maintained as under Water Act (Sections 32-36)
8. Chapter VII Penalties and Procedures (Sections 41-50) Whosoever fails to comply with orders under the Act shall on conviction punishable with imprisonment upto 3 months or fine upto Rs. 5000/- or both. For continued contraventions additional fine of Rs. 1000/- per day may be imposed. Penalty for actions are also outlined. Conviction under section 25, 26 may be upto six years with fine but not less than six months. Provisions for enhanced penalty has been made in Section 45-47.
Penalties and Procedures are outlined under (Sections 37-46) Whosoever fails to comply with provisions of section 21-22 or directions under 31 shall on conviction be punishable with imprisonment not less than one year and six months but may extend to six years with fine if failure continues penalties for certain acts and contravention of provisions of the act have been made under sections 38, 39. Offences by companies and Govt. departments have been mentioned under section 40, 41. Protection of Action in good faith
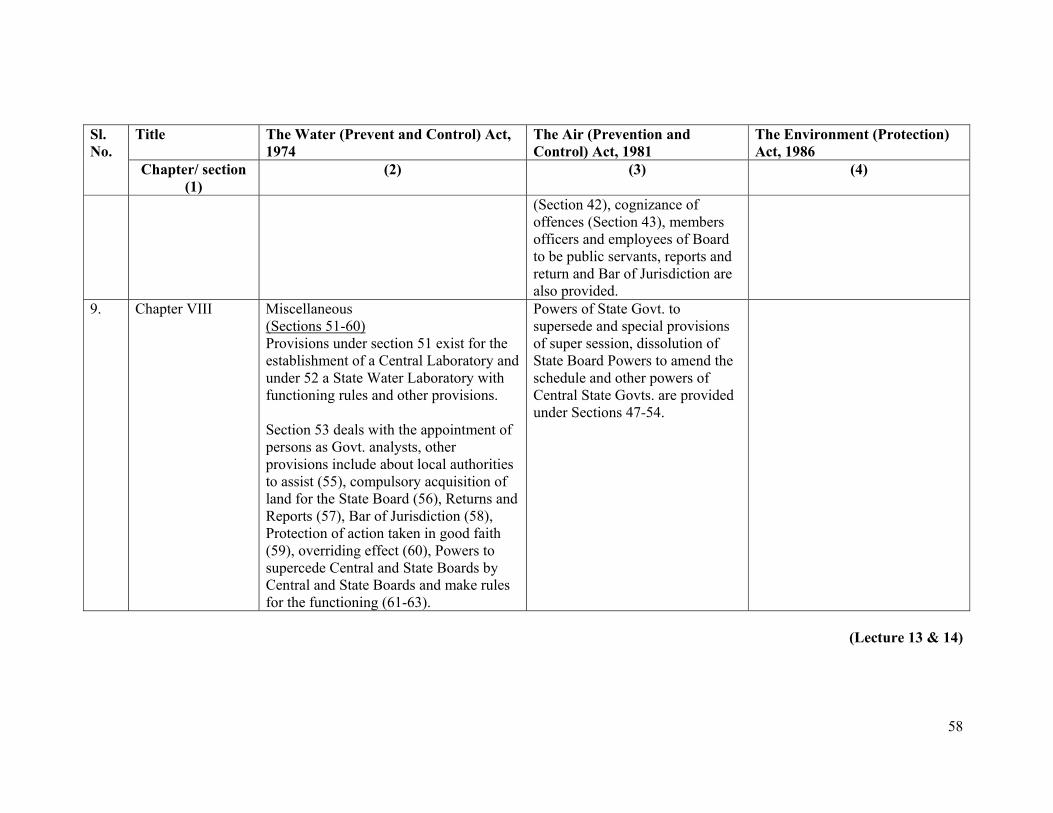
58
Title The Water (Prevent and Control) Act, 1974
The Air (Prevention and Control) Act, 1981
The Environment (Protection) Act, 1986
Sl. No.
Chapter/ section (1)
(2) (3) (4)
(Section 42), cognizance of offences (Section 43), members officers and employees of Board to be public servants, reports and return and Bar of Jurisdiction are also provided.
9. Chapter VIII Miscellaneous (Sections 51-60) Provisions under section 51 exist for the establishment of a Central Laboratory and under 52 a State Water Laboratory with functioning rules and other provisions. Section 53 deals with the appointment of persons as Govt. analysts, other provisions include about local authorities to assist (55), compulsory acquisition of land for the State Board (56), Returns and Reports (57), Bar of Jurisdiction (58), Protection of action taken in good faith (59), overriding effect (60), Powers to supercede Central and State Boards by Central and State Boards and make rules for the functioning (61-63).
Powers of State Govt. to supersede and special provisions of super session, dissolution of State Board Powers to amend the schedule and other powers of Central State Govts. are provided under Sections 47-54.
(Lecture 13 & 14)
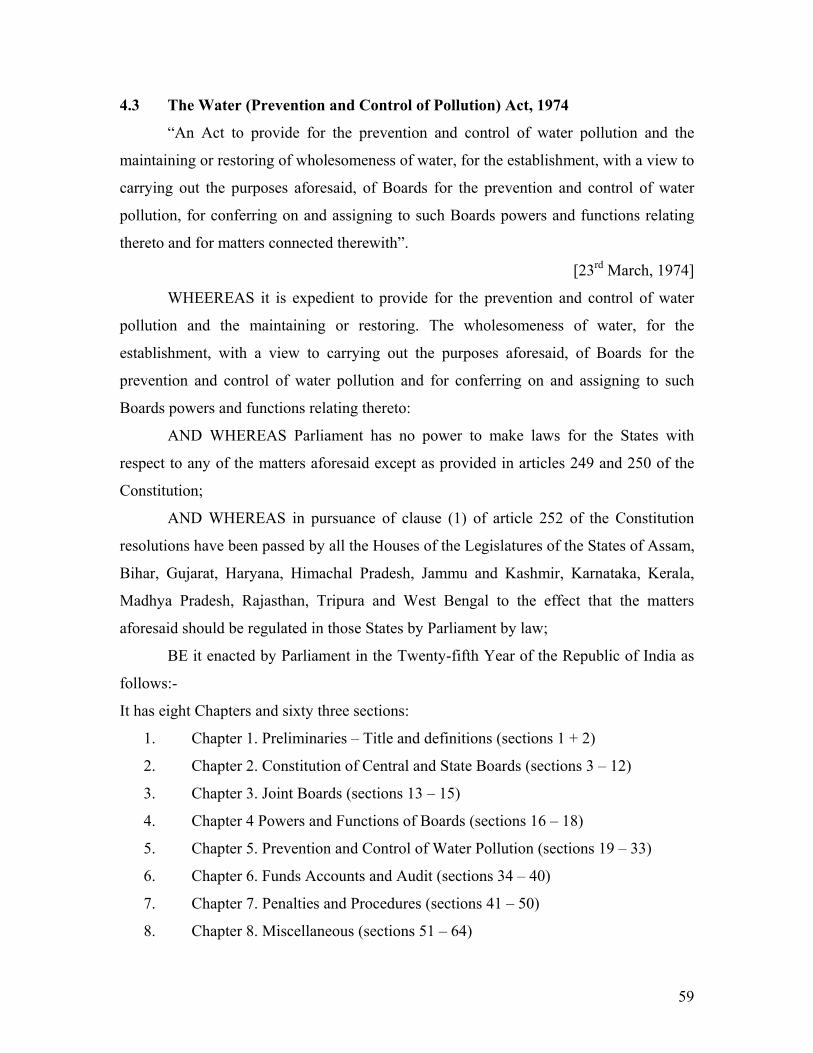
59
4.3 The Water (Prevention and Control of Pollution) Act, 1974
“An Act to provide for the prevention and control of water pollution and the
maintaining or restoring of wholesomeness of water, for the establishment, with a view to
carrying out the purposes aforesaid, of Boards for the prevention and control of water
pollution, for conferring on and assigning to such Boards powers and functions relating
thereto and for matters connected therewith”.
[23rd March, 1974]
WHEEREAS it is expedient to provide for the prevention and control of water
pollution and the maintaining or restoring. The wholesomeness of water, for the
establishment, with a view to carrying out the purposes aforesaid, of Boards for the
prevention and control of water pollution and for conferring on and assigning to such
Boards powers and functions relating thereto:
AND WHEREAS Parliament has no power to make laws for the States with
respect to any of the matters aforesaid except as provided in articles 249 and 250 of the
Constitution;
AND WHEREAS in pursuance of clause (1) of article 252 of the Constitution
resolutions have been passed by all the Houses of the Legislatures of the States of Assam,
Bihar, Gujarat, Haryana, Himachal Pradesh, Jammu and Kashmir, Karnataka, Kerala,
Madhya Pradesh, Rajasthan, Tripura and West Bengal to the effect that the matters
aforesaid should be regulated in those States by Parliament by law;
BE it enacted by Parliament in the Twenty-fifth Year of the Republic of India as
follows:-
It has eight Chapters and sixty three sections:
1. Chapter 1. Preliminaries – Title and definitions (sections 1 + 2)
2. Chapter 2. Constitution of Central and State Boards (sections 3 – 12)
3. Chapter 3. Joint Boards (sections 13 – 15)
4. Chapter 4 Powers and Functions of Boards (sections 16 – 18)
5. Chapter 5. Prevention and Control of Water Pollution (sections 19 – 33)
6. Chapter 6. Funds Accounts and Audit (sections 34 – 40)
7. Chapter 7. Penalties and Procedures (sections 41 – 50)
8. Chapter 8. Miscellaneous (sections 51 – 64)

60
The Salient features of each Chapter are mentioned below:
CHAPTER 1 PRELIMINARY
1. Short title, application, commencement
1. (1) This Act maybe called the Water (Prevention and Control of Pollution) Act,
1974.
2. It applies to the whole of the States of Assam, Bihar, Gujarat, Haryana, Himachal
Pradesh, Jammu and Kashmir, Karnataka, Kerala, Madhya Pradesh, Rajasthan,
Tripura and West Bengal and the Union territories; and it shall apply to such other
States which adopts this Act by resolution passed in that behalf under clause (1)
of article 252 of the Constitution.
3. It shall come into force, at once in the States of Assam, Bihar, Gujarat, Haryana,
Himachal Pradesh, Jammu and Kashmir, Karnataka, Kerala, Madhya Pradesh,
Rajasthan, Tripura and West Bengal and in the Union territories, and in any other
State which adopts this Act under clause (1) of article 252 of the Constitution on
the date of such adoption and any reference in this Act to the commencement of
this Act shall, in relation to any State or Union territory, mean the date on which
this Act comes into force in such State or Union territory.
2. Definitions: (The following terms have been defined)
Board, Central Board, member (Chairman and others) occupier (in relation to
factory, industry), pollution, prescribed, sewage effluent, State Boards, Stream (river,
water course), inland water, subterranean water, sea, tidal waters, trade effluent.
CHAPTER II THE CENTRAL AND STATE BOARDS FOR PREVENTION AND
CONTROL OF WATER POLLUTION
3. Constitution of Central Board
Appointment of Central and State Boards (Within six months of Commencement)
and notification in official Gazette
The Central Board shall consist of the following
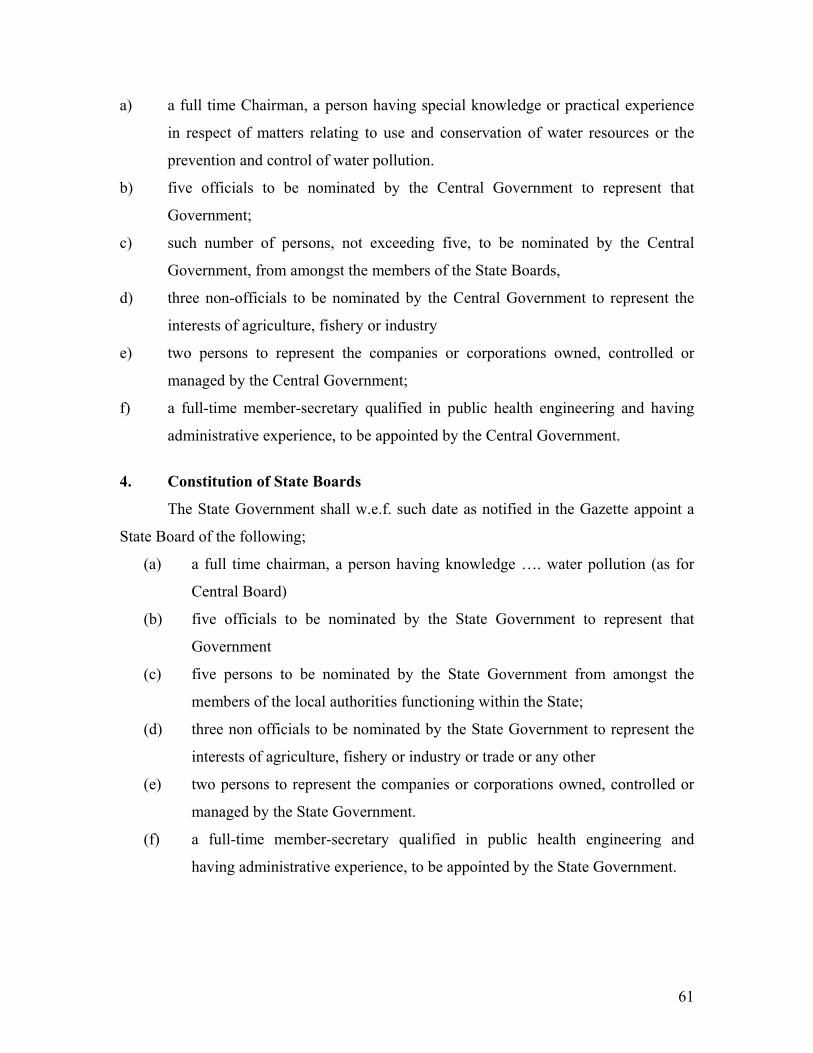
61
a) a full time Chairman, a person having special knowledge or practical experience
in respect of matters relating to use and conservation of water resources or the
prevention and control of water pollution.
b) five officials to be nominated by the Central Government to represent that
Government;
c) such number of persons, not exceeding five, to be nominated by the Central
Government, from amongst the members of the State Boards,
d) three non-officials to be nominated by the Central Government to represent the
interests of agriculture, fishery or industry
e) two persons to represent the companies or corporations owned, controlled or
managed by the Central Government;
f) a full-time member-secretary qualified in public health engineering and having
administrative experience, to be appointed by the Central Government.
4. Constitution of State Boards
The State Government shall w.e.f. such date as notified in the Gazette appoint a
State Board of the following;
(a) a full time chairman, a person having knowledge …. water pollution (as for
Central Board)
(b) five officials to be nominated by the State Government to represent that
Government
(c) five persons to be nominated by the State Government from amongst the
members of the local authorities functioning within the State;
(d) three non officials to be nominated by the State Government to represent the
interests of agriculture, fishery or industry or trade or any other
(e) two persons to represent the companies or corporations owned, controlled or
managed by the State Government.
(f) a full-time member-secretary qualified in public health engineering and
having administrative experience, to be appointed by the State Government.
62
5. Terms and Conditions of Service of Members
If a State Board is not constituted as provided, the Central Board shall exercise
the powers and perform functions of a State Board.
Members of a Board other then Member Secretary shall hold office for term of
three years.
The terms of office of a Board Member shall come to on end as soon as he ceases
to hold the office under Central / State Government by virtue of which he was nominated.
The Central Government / State Government may, if it thinks fit, remove any
number before the expiry of his term of office after giving him a reasonable opportunity
of showing cause against the same.
A member of a Board other than member secretary may at any time resign his
office by writing to Chairman Central / State Government.
6. Stipulates provisions of disqualifications
7. Vacation of seats by members
8. Meeting of Boards
9. Constitution of Committees
10. Temporary association of persons with Boards for particular purpose
11. Vacancy in Board
12. Member Secretary and officers and other employees of Boards
CHAPTER III – JOINT BOARDS
In 13, 14, 15 sections there are provisions for the constitution of Joint Boards, with full
time Chairman, members from participating states, a full time member secretary with full
powers.
CHAPTER IV POWERS AND FUNCTIONS OF BOARDS
16.1 The main function of the Central Board shall be to promote cleanliness of streams
and wells in different areas of the State.
16.2 The Central Board may perform all or any of the following functions, namely:-
(a) advise the Central Government on any matter concerning the prevention and
control of water pollution;
(b) Co-ordinate the activities of the State Boards and resolve disputes among them;
63
(c) Provide technical assistance and guidance to the State Boards, carryout and
sponsor investigations and research relating to problems of water pollution and
prevention, control or abatement of water pollution;
(d) Plan and organize the training of persons engaged or to be engaged in
programmes for the prevention, control or abatement of water pollution.
(e) Organise through mass media a comprehensive programme regarding the
prevention and control of water pollution;
(f) Collect, compile and publish technical and statistical data relating to water
pollution and the measures devised for its effective prevention and control and
prepare manuals, codes or guides relating to treatment and disposal of sewage and
trade effluents and disseminate information connected therewith;
(g) Lay down, modify or annul, in consultation with the State Government concerned,
the standards for a stream or well:
(h) Plan and cause to be executed a nation-wide programme for the prevention,
control of abatement of water pollution;
(i) Perform such other functions as may be prescribed
16.3 The Board may establish or recognize a laboratory or laboratories to enable the
Board to perform its functions under this section efficiently, including the analysis
of samples of water from any stream or well or of samples of any sewage or trade
effluents.
17.1 The functions of a State Board shall be –
(a) to plan a comprehensive programme for the prevention, control or abatement
of pollution of streams and wells in the State and to secure the execution
thereof;
(b) to advise the State Government on any matter concerning the prevention,
control or abatement of water pollution;
(c) to collect and disseminate information relating to water pollution and the
prevention, control or abatement thereof;
(d) to encourage, conduct and participate in investigations and research relating to
problems of water pollution and prevention, control or abatement of water
pollution;
64
(e) to collaborate with the Central Board in organizing the training of persons
engaged or to be engaged in programmes relating to prevention,
(f) to inspect sewage or trade effluents, works and plants for the treatment of
sewage and trade effluents and grant of any consent as required by this Act;
(g) to lay down, modify or annul effluent standards for the sewage and trade
effluents and for the quality of receiving waters resulting from the discharge
of effluents and to classify waters of the state;
(h) to evolve economical and reliable methods of treatment of sewage and trade
effluents;
(i) to evolve methods of utilization of sewage and suitable trade effluents in
agriculture;
(j) to evolve efficient methods of disposal of sewage and trade effluents on land,
as are necessary on account of conditions of scant stream flows that do not
provide for major part of the year the minimum degree of dilution;
(k) to lay down standards of treatment of sewage and trade effluent to be
discharged into any particular stream taking into account the minimum fair
weather dilution available in that stream and the tolerance limits of pollution
permissible in the water of stream, after the discharge of such effluents;
(l) to make or revoke any order –
i) for the prevention, control or abatement of discharges of wastes into
streams or wells.
ii) Requiring any person to construct new systems for the disposal of
sewage and trade effluents
(m) to lay down standards to be complied with persons while causing discharge of
sewage or sullage or both or laydown, modify or annual effluent standards for
sewage and industrial effluents;
(n) to advise the State Govt. with respect to the location of any industry to
carrying on which is likely to pollute a stream or well
(o) Perform such other functions as may be prescribed;
17.2. The Board may establish or recognize a laboratory to enable
the Board to perform its functions
65
18. In the performance of its functions under this Act
(a) alter any water pollution, prevention and control area whether by way of
extension or reduction; or
(b) define a new water pollution, prevention and control area in which may be
merged one or more water pollution, prevention and control areas, or any
part or parts thereof.
CHAPTER V PREVENTION AND CONTROL OF WATER POLLUTION
19. (Power of the State Government to restrict the application of Act to Certain areas)
(1) If the State Government, after consultation with, or on the recommendation, of the
State Board, is of opinion that the provisions of this Act need not apply to the
entire State. It may, by notification in the Official Gazette, restrict the application
of this Act to such area or areas as may be declared therein as water pollution,
prevention and control area or areas and thereupon the provisions of this Act shall
apply only to such area or areas.
(2) Each water pollution, prevention and control area may be declared either by
reference to a map or by reference to the line of any water shed or the boundary of
any district or partly by one method and partly by another.
(3) The State Govt. may, by notification in the Gazette,
(a) alter any water pollution and control area whether by way of extension or
reduction; or
(b) define a new water pollution, prevention and control area in which may be
merged one or more water pollution, prevention and control areas, or any
part or parts there of.
20 Power to Obtain information
(1) The State Board or any officer empowered by it in this behalf, may make surveys
of any area and gauge and keep records of the flow or volume and other
characteristics of any stream or well in such area.
(2) A State Board may give directions requiring any person who in its opinion is
abstracting water from any such stream or well in the area in quantities which are
substantial in relation to the flow or volume of that stream or well or is
66
discharging sewage or trade effluent into any such stream or well, to give such
information as to be abstraction or the discharge at such times and in such form as
may be specified in the directions.
(3) A State Board may, with a view to preventing or controlling pollution of water,
give direction requiring any person in charge of any establishment where any
industry or trade is carried on, to furnish to it information regarding the
construction, installation or operation of such establishment or of any disposal
system or of any extension or addition thereto in such establishment and such,
other particulars as may be prescribed.
21. Power to take Samples of effluents and procedure to be followed
21.(1) A State Board or any officer empowered by it in this behalf shall have power to
take for the purpose of analysis samples of water from any stream or well or
samples of any sewage or trade effluent which is passing from any plant or vessel
or from or over any place into any such stream or well.
(2) The result of any analysis of a sample of any sewage or trade ffluent taken shall
be admissible in evidence in any legal proceeding unless the provisions of sub-
sections (3), (4) and (5) are compiled with.
(3) Subject to the provisions of sub-sections (4) and (5), when a sample of any
sewage or trade effluent is taken for analysis under sub-section (1), the person
taking the sample shall
(a) serve on the person in charge of, or having control over, the plant or vessel
or in occupation of the place or any agent of such occupier, a notice, then
and there in such form as may be prescribed of his intention to have it so
analyzed;
(b) in the presence of the occupier or his agent, divide the sample into two
parts;
(c) cause each part to be placed in a container which shall be marked and
sealed and shall also be signed both by the person taking the sample and
the occupier or his agent:
(d) send one container forthwith -
67
(i) in a case where such sample is taken from any area situated in a
Union territory, to the laboratory established or recognized by the
Central Board; and
(ii) in any other case, to the laboratory established or recognized by the
State Board
(e) on the request of the occupier or his agent, send the second container -
(i) in a case where such sample is taken from any area situated in a
Union territory, to the laboratory established or specified and
(ii) in any other case, to the laboratory established or specified
(4) When a sample of any sewage or trade effluent is taken for analysis and the
person taking the sample serves on the occupier or his agent, a notice then, the
sample so taken shall be placed in a container which shall be marked and sealed
and shall also be signed by the person taking the sample and the same shall be
sent forthwith by such person for analysis to the laboratory referred.
(5) When a sample of any sewage or trade effluent is taken for analysis and the
person taking the sample serves on the occupier or his agent a notice and the
occupier or his agent who is present at the time of taking the sample does not
make a request for dividing the sample into two parts then, the sample so taken
shall be placed in a container which shall be marked and sealed and shall also be
signed by the person taking the sample and the same shall be sent forthwith by
such person for analysis to the laboratory referred to
22. Reports of Results of analysis on samples
(1) Where a sample of any sewage or trade effluent has been sent for analysis to the
laboratory established the concerned Board analyst shall analyse the sample and
submit a report in the prescribed form in triplicate to the Central Board or the
State Board, as the case may be.
(2) On receipt of the report one copy of the report shall be sent by the Central Board
or the State Board, as the case may be, to the occupier another copy shall be
preserved for production before the court in case any legal proceedings are taken
against
68
(3) Where a sample has been sent for analysis to any laboratory mentioned therein,
the Government analyst shall analyse the sample and submit a report in the
prescribed form of the result of the analysis in triplicate to the central board or, as
the case may be, the State Board
(4) If there is any inconsistency or discrepancy between, or variation in the results of
the analysis carried out by the laboratory established or recognized by the Central
Board or the State Board, as the case may be, and that of the laboratory
established or specified as the case may be the report of the latter shall prevail.
23 Power of entry for inspection
(1) Subject to the provisions of this section, any person empowered by a State Board
in this behalf shall have a right at any time to enter, with such assistance as he
considers necessary, any place -
(a) for the purpose of performing any functions of the Board entrusted to him.
(b) for the purpose of determining any such functions are to be performed
(c) for the purpose of examining any plant, record, register, document or any
other material for conducting a research of any place.
24. Prohibition on use of Stream or well for disposal of Polluting matter
24. (1) Subject to the provisions of this section -
(a) no person shall knowingly cause or permit any poisonous, noxious or polluting
matter determined in accordance with such standards as may be laid down by the
State Board to enter (whether directly or indirectly) into any stream or well; or
(b) no person shall knowingly cause or permit to enter into any stream any other
matter which may tend, either directly or in combination with similar matters, to
impede the proper flow of the water of the stream in a manner leading or likely to
lead to a substantial aggravation of pollution due to other causes or of its
consequences.
(2) A person shall not be guilty of an offence by reason only of having done or
caused to be done any thing of following acts
(a) constructing any water regulating structure
(b) adding / depositing material for bank protection
(c) putting any stream sand or gravel or any other natural deposit
69
25. Destruction on New outlets and New discharges.
(1) No person shall, without the previous consent of the State Board, bring into use
any or altered outlet for the discharge of sewage or trade effluent into a stream or
well or begin to make any new discharge of sewage or trade effluent into a stream
or well.
(2) An application for consent of the State Board shall be made in the prescribed form
and shall contain particulars regarding the proposed construction, installation
operation of the industrial or commercial establishment or of any treatment and
disposal system or of any extension or addition thereto and such other particulars
as may be prescribed.
26. Where immediately before the commencement of this Act any person was
discharging any sewage or trade effluent into a stream or well, the provisions of
section 25 shall, apply in relation to such person as they apply in relation to the
person referred to in that section subject to the modification that the application
for consent to be made under sub-section (2) of that section shall be made within
a period of three months of the constitution of the State Board.
27.(1) A State Board shall not grant its consent to the bringing into use of a new or
altered outlet unless the outlet is so constructed as comply with any conditions to
imposed by the Board to enable it to exercise its right to take samples of the
effluent.
Under section 28 (1) to (5) provisions have been made for appeals by aggrieved
persons under section 25, 26 and 27. The appeal will be considered by appellate
authority of three members. Under section 29 Revisions to appeals under sections 25-27
can be made.
Power of State Board to carry out works on new and altered outlet for discharged
are included in Section 30.
Furnishing of information regarding accidental discharge are made out in Section 31.
Emergency Measures for discharge of pollution by accident
32. Where it appears to the State Board that any poisonous, noxious or polluting
matter is present in any stream or well or has entered into that stream or well due
to any accident or other unforeseen act or event, and if the Board is of opinion
70
that it is necessary or expedient to take immediate action, it may for reasons to be
recorded in writing, carry out such operations as it may consider necessary for all
or any o the following purposes, that is to say -
(a) removing that matter from the stream or well and disposing it of in such
manner as the Board considers appropriate:
(b) remedying or mitigating any pollution caused by its presence in the stream
or well;
(c) issuing orders immediately restraining or prohibiting the person concerned
from discharging any poisonous, noxious or polluting matter into the
stream or well, or from making unsanitary use of the stream or well.
33. Power of Board to make application to courts for restraining Water
Pollution in Streams and wells
(1) Where it is apprehended by a Board that the water in any stream or well is likely
to be polluted by reason of the disposal of any mater therein or of any likely
disposal of any matter therein, or otherwise, the Board may make an application
to a court, not inferior to that of a Presidency Magistrate or a Magistrate of the
first class, for restraining the person who is likely to cause such pollution from so
causing.
(2) One receipt of an application under sub-section (1) the court may make such order
as it deems fit.
CHAPTER VI FUNDS, ACCOUNTS AND AUDIT
Provisions of allocation of funds by central and State Governments and expenditure
incurred and procedure of keeping records and audits have been made under sections 34,
35, 36, 37, 38, 39 and 40.
41. CHAPTER VII PENALTIS AND PROCEDURE
(1) Whoever fails to comply with any direction given within such time as may be
specified in the direction or fails to comply with any orders issued shall, on
conviction, be punishable with imprisonment for a term which may extend to
three months or with fine which may extend to five thousand rupees or with both
and in case the failure continues, with an additional fine which may extend to one
71
thousand rupees for every day during which such failure continues after the
conviction for the first such failure.
(2) Whoever fails to comply with any direction issued by a court under sub-section
(2) of section 33 shall, on conviction, be punishable with imprisonment for a term
which may extend to three months or with fine which may extend to five thousand
rupees or with both and in case the failure continues, with an additional fine
which may extend to one thousand rupees for every day during which such failure
continues after the conviction for the first such failure.
42. Penalty for Certain Acts
1) Whoever -
(a) destroys, pulls down, removes, injures or defaces any pillar, post or stake
fixed in the ground or any notice or other matter put up, inscribed or
placed, by or under the authority of the Board, or
(b) obstructs any person acting under the orders or directions of the Board
from exercising his powers and performing his functions under this Act, or
(c) fails to intimate the occurrence of any accident or other unforeseen act or
event under section 31 to the Board and other authorities or agencies as
required by that section, or
(d) in giving any information which he is required to give under this Act,
knowingly or willfully makes a statement which is false in any material
particular, or
(g) for the purpose of obtaining any consent under section 25 or section 26,
knowingly or willfully makes a statement which is false in any material
particular,
43. Whoever contravenes the provisions of section 24, 25 and 26 shall be punishable
with imprisonment for a term which shall not be less than six months but which
may extend to six years and with fine.
44. Whoever contravenes the provisions of section 25 or section 26 shall be
punishable with imprisonment for a term which shall not be less than six months
but which may extend to six years and with fine.
72
Provisions for Enhanced penalty after previous conviction have been made in
section 45. Section 46 and 47 defines the procedure of publication of names of offenders
and of companies where an offence has been committed by a Government Department
the Head of department shall be deemed to be guilty of the offence and shall be liable to
proceeded and punished (48). Section 49 discusses cognizance of offences and section
50 of Members, officers and Servants of the Board to be Public Servants.
CHAPTER VIII MISCELLANEOUS
51.(1) The Central Government may, by notification in the Official Gazette –
(a) establish a Central Water Laboratory; or
(b) specify any laboratory or institute as a Central Water Laboratory, to carry out the
functions entrusted to the Central Water Laboratory under this Act.
(2) The Central Government may, after consultation with the Central Board, make
rules prescribing -
(a) the functions of the Central Water Laboratory;
(b) the procedure for the submission to the said laboratory of samples of water
or of sewage or trade effluent for analysis or tests, the form of the
laboratory’s report there under and the fees payable in respect of such
report;
(c) such other matters as may be necessary or expedient to enable that
laboratory to carry out its functions.
52.(1) The State Government may, by notification in the, Official Gazette-
(a) establish a State Water laboratory; or
(b) specify any laboratory or institute as a State Water Laboratory, to carry out the
functions entrusted to the State Water Laboratory under this Act.
(2) The State Government may, after consultation with the State Board, make rules
prescribing -
(a) the functions of the State Water Laboratory
(b) the procedure for the submission to the said laboratory of samples of water or of
sewage or trade effluent for analysis or tests, the form of the laboratory’s report
thereon and the fees payable in respect of such report;
73
53.(1)The Central Government may, by notification in the Official Gazette, appoint such
persons as it thinks fit and having the prescribed qualifications to be Government
analysis for the purpose of analysis of samples of water or of sewage or trade
effluent sent for analysis to any laboratory established or specified.
(2) The State Government may, by notification in the Official Gazette, appoint such
persons as it thinks fit and having the prescribed qualifications to be Government
analysts for the purpose of analysis of samples of water or of sewage or trade
effluent sent for analysis to any laboratory established or specified under sub-
section (1) of section 52.
(3) Without prejudice to the provisions of sub-section (3) of section 12, the Central
Board or, as the case may be, the State Board may, by notification in the Official
Gazette, and with the approval of the Central Government or the State Government,
as the case may be, appoint such persons as it thinks fit and having the prescribed
qualifications to be Board analysts for the purpose of analysis of samples of water
or of sewage or trade effluent sent for analysis to any laboratory established or
recognized under section 16, or as the case may be, under section 17.
54. Any document purporting to be a report signed by a Government analyst or, as the
case may be, a Board analyst may be used as evidence of the facts stated therein in
any proceeding under this Act.
Other provision include
55. Local authorities to assist
56. Compulsory acquisition of land for the State Board
57. Returns and Reports
58. Bar of Jurisdiction
59. Protection of action taken in good faith
60. Overriding effect
61. Power of Central Government to supercede the Central Board
62. Power of State Government to supercede the State Board
63. Power of Central and State Government to make rules
(Lectures 15 & 16)
1
CHAPTER -1 INTRODUCTION
1.1 Preamble
The basic objective of Environmental Management (EM) is to maintain, the quantity
and sustain the quality of natural resources commensurate with the needs of society.
Sustainable development is a process change in which the exploitation of resources, the
direction of investment, the orientation of technological development and institutional change
are all in harmony and enhance both current and future potential of human needs and
aspirations. Environmental Impact Assessment (EIA) is a statement which integrates them. It
has now become a mandatory tool to assess the impact of proposed activity with reference to
deforestation, land and soil use, urban congestion and pollution, water resources and industrial
process. 1.2 Objectives Of Diversified Agriculture Support Project (DASP) The main objectives of the DASP are:
a) Achieve sustained agricultural development with increased productivity.
b) Provide adequate and safe mobility for the rural population, agricultural
produce and inputs, access to market through "All Weather Roads", service
and information, which in turn will foster Rural Development.
c) Establishment of Agribusiness and service industries within the project area
DASP Uttaranchal has identified roads in Dehradun, Udham Singh Nagar and Nainital
districts for construction/improvement to ease the mobilisation of agricultural produce from
Farm to Market. Before taking up the task it is to be established that due to
upgradation/construction of proposed roads, the environment will not be adversely affected.
The present proposal concerns a 5.0 km road between Kotabagh and Rani Kota in the Tehsil
Ramnagar in Nainital district.
1.3 Work Plan The roads will be improved along the existing alignments, where no additional land is
required to complete the work. The road upgradation includes cross drainage works, namely
culverts, cause ways and small and medium bridges also. Permanent land available is enough
2
and no extra land is required for roads.
The road works would be as per Ministry of Surface Transport/India Road Congress
specifications and would be carried out by State PWD. As per the project design, rural roads
will be constructed only after carrying out a detailed EIA.
The upgradation as indicated by the State PWD staff means provision of 2 layers of
ballast (10 cm each compacted to 7.5 ems) and painting PI & P2. The roads will have 3 m
carriage passage and 1.0 to 1.5 m shoulder on each side. Cross drainage to be provided by a
suitable system every 200 m of road. These provisions will be made wherever required and
would be shown clearly marked on the respective DPR. For construction of these roads
additional land, wherever required, will be made available by Gram Panchayats
For identification of impact during construction of proposed rural roads the network
method has been adopted (Fig. 1.1) which involves analysis of cause/condition -- effect
relationship between an activity and environmental parameters.
The EIA of the proposed road under the DASP has been conducted by the Alternate
Hydro Energy Centre, Indian Institute of Technology, Roorkee. The study includes
environmental review of the proposed road/bridges, documentation of baseline
environmental features, assessment of possible environmental impacts during and after road
construction, development of an environmental screening criteria and design of mitigation
measures of adverse impacts.
It would appear that the proposed road project is necessary to improve the quality of
life of the affected villagers and to improve their economic condition. The improvement of
road will convert it to all weather metalled road reducing travel time and making travel
possible through out the year with increased comfort. To the residents of the affected villages,
the improved roads will ensure year round access to basic amenities such as schools,
hospitals, public offices, institutions and markets. Movement of raw materials, inputs,
finished goods and agricultural and other produce to and from the villages will become easy,
quick and economic. Consequently, the proposed project for improving the roads has the
support of all sections of population.
3
1.4 Sequential Phases of Eia EIA has three sequential phases i) Identification
ii) Prediction and
iii) Assessment
i) Identification involves characterisation of existing physical, economic,
ecological and social environment. It also involves listing of such activities as
may have ill effects on one or more of the components of environment.
ii) Prediction is to forecast the nature and extent of identified environmental
impacts and those of measures proposed to mitigate the adverse environmental
impacts.
iii) Assessment judges the beneficial/adverse impacts of project. The result is
communicated to decision makers to determine the cost and benefits of user
groups and the population.
4
CHAPTER - 2 DESCRIPTION OF PROPOSED ROAD
2.1 Diversified Agricultural Support Project (DASP)
Uttaranchal (Project Coordination Unit), Dehradun vide its letter no. 1728/6/2/DASP
dated 7.9.2002 has entrusted the work of EIA in respect of rural road Kotabagh to Ranikota of
5 km stretch to AHEC. The block Kotabagh has eight motorable roads.
1 Nainital - Kaladungi - Bazpur motor road 33.40 km 2. Haldwani - Ramnagar motor road 23.50 km 3. Bailparao - Kotabagh motor road 12.00 km 4. Kaladungi - Dechauri - Kotabagh motor 17.25 km
road 5. Gurabangar - Baiunia Haldu marg 04.70 km 6. Aonlakot - Kotabagh 04.70 km 7. Aonlakot - Kotabagh via Patlia marg 04.70 km 8. Nainital - Tanki - Kilvari - Pangot motor 04.00 km
bagh TOTAL 102.30 km The proposed road is located in the Ramnagar Tehsil under Kotabagh Block. The
exact location is shown in the block Map Figure 2.1. The road is located at an altitude of =
800 m between 29°24' North and 79°18' East longitude and latitude. The road is motorable
with difficulty for 1.5 km only. The rest of the road is not motorable. It is stony with soil
debris. The road is already provided with a number of cross drainage works. Thirteen culverts
of the following dimensions exist (Kotabagh-Ranikota) Culvert No. 1 1.0 m 2 1.0 m
3 1.0 m 4 1.0 m 5 1.0 m 6 1.0 m 7 1.0 m 8 1.0 m 9 3.0 m 10 3.0 m 11 1.0 m 12 1.0 m 13 4.60 m

5
A number of scuppers also exist, most of them about 1.0 m width. The gradient of the
road varies but on an average it is about 1:18. The actual survey work is on and the details
will be known shortly. A number of cause ways also exist. At one place the covering on a
canal exists (6.4 m) and this need to be increased to 12.0 m. There are yet a few sites which
need to be developed as causeway and other cross drainage works. At majority of locations a
clear road width of 6-10 m is available, however, at some places, where more space is
required, cutting of hill side slope may be necessary. This needs extra care because of slope
stability. This proposed road later, at Ranikota will be connected to a bridge on river Dabka
and link road of 5.0 km sanctioned by Uttaranchal Govt. under state budget.
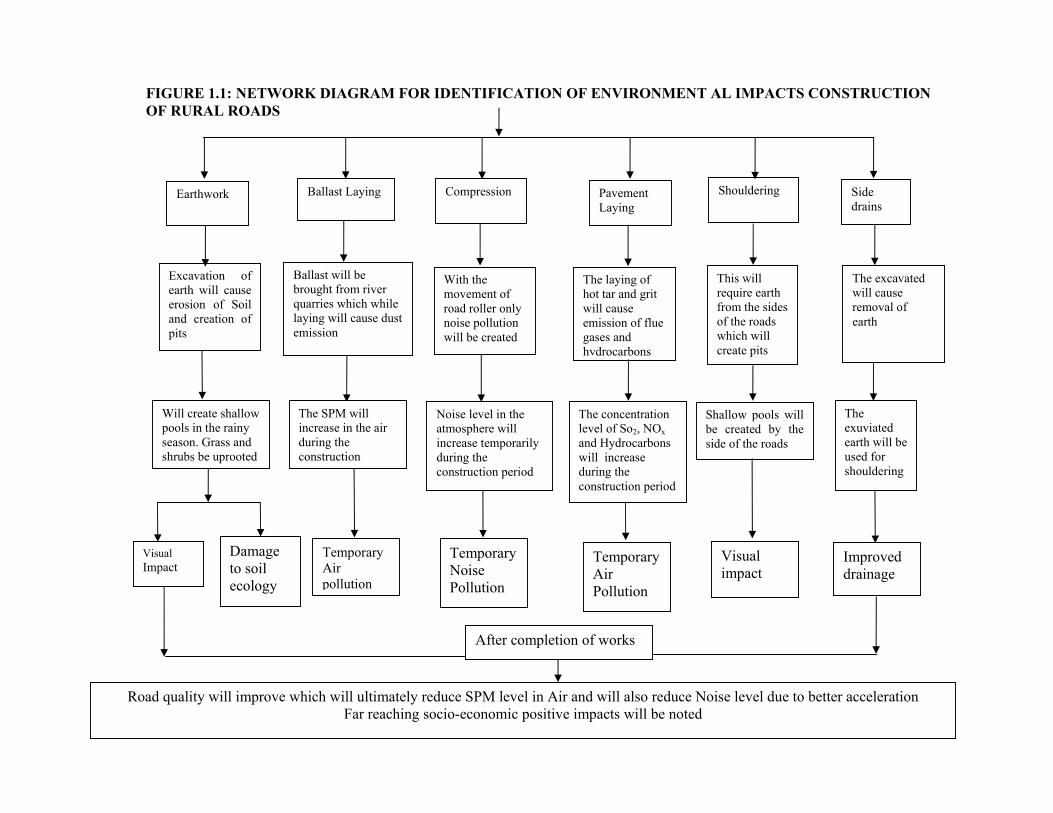
6
Earthwork Ballast Laying Compression Pavement
Laying Shouldering Side
drains
Excavation of earth will cause erosion of Soil and creation of pits
Ballast will be brought from river quarries which while laying will cause dust emission
With the movement of road roller only noise pollution will be created
The laying of hot tar and grit will cause emission of flue gases and hydrocarbons
This will require earth from the sides of the roads which will create pits
The excavated will cause removal of earth
Will create shallow pools in the rainy season. Grass and shrubs be uprooted
The SPM will increase in the air during the construction
Noise level in the atmosphere will increase temporarily during the construction period
The concentration level of So2, NOx and Hydrocarbons will increase during the construction period
Shallow pools will be created by the side of the roads
The exuviated earth will be used for shouldering
Visual Impact
Damage to soil ecology
Temporary Air pollution
Temporary Noise Pollution
Temporary Air Pollution
Visual impact
Improved drainage
After completion of works
Road quality will improve which will ultimately reduce SPM level in Air and will also reduce Noise level due to better acceleration Far reaching socio-economic positive impacts will be noted
FIGURE 1.1: NETWORK DIAGRAM FOR IDENTIFICATION OF ENVIRONMENT AL IMPACTS CONSTRUCTION OF RURAL ROADS
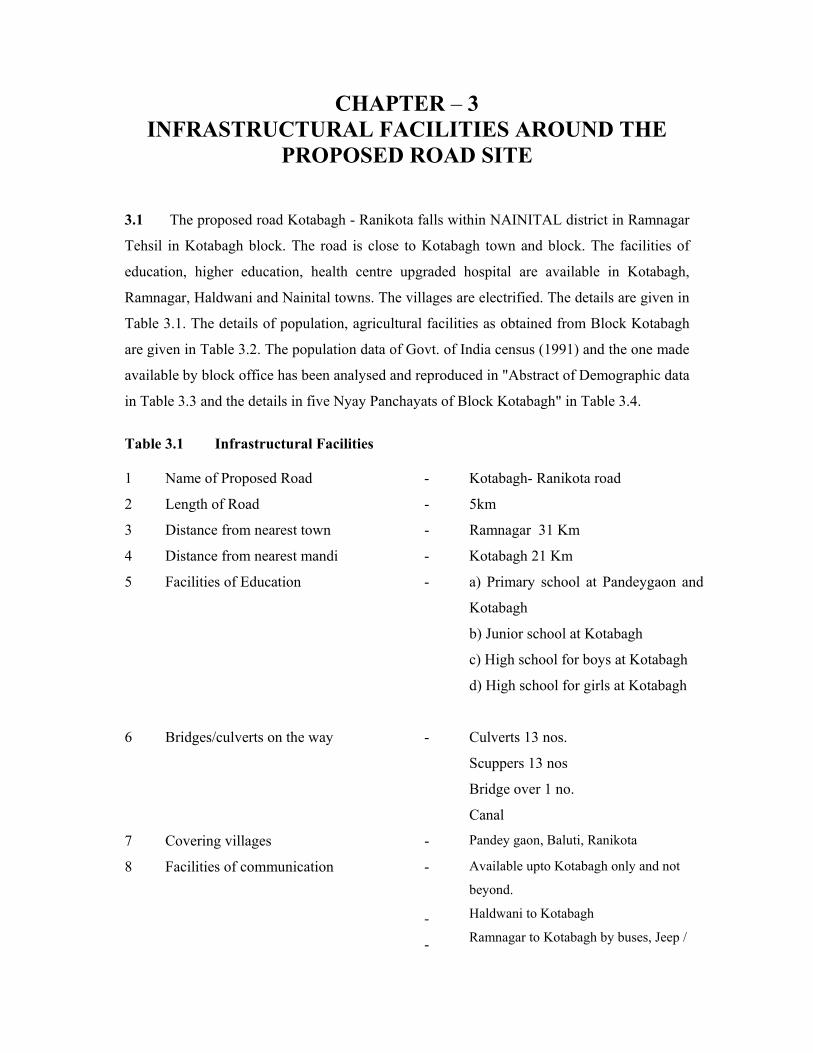
7
CHAPTER – 3 INFRASTRUCTURAL FACILITIES AROUND THE
PROPOSED ROAD SITE 3.1 The proposed road Kotabagh - Ranikota falls within NAINITAL district in Ramnagar
Tehsil in Kotabagh block. The road is close to Kotabagh town and block. The facilities of
education, higher education, health centre upgraded hospital are available in Kotabagh,
Ramnagar, Haldwani and Nainital towns. The villages are electrified. The details are given in
Table 3.1. The details of population, agricultural facilities as obtained from Block Kotabagh
are given in Table 3.2. The population data of Govt. of India census (1991) and the one made
available by block office has been analysed and reproduced in "Abstract of Demographic data
in Table 3.3 and the details in five Nyay Panchayats of Block Kotabagh" in Table 3.4.
Table 3.1 Infrastructural Facilities 1 Name of Proposed Road - Kotabagh- Ranikota road
2 Length of Road - 5km
3 Distance from nearest town - Ramnagar 31 Km
4 Distance from nearest mandi - Kotabagh 21 Km
5 Facilities of Education - a) Primary school at Pandeygaon and
Kotabagh
b) Junior school at Kotabagh
c) High school for boys at Kotabagh
d) High school for girls at Kotabagh
6 Bridges/culverts on the way - Culverts 13 nos.
Scuppers 13 nos
Bridge over 1 no.
Canal
7 Covering villages - Pandey gaon, Baluti, Ranikota
8 Facilities of communication -
-
-
Available upto Kotabagh only and not
beyond.
Haldwani to Kotabagh
Ramnagar to Kotabagh by buses, Jeep /
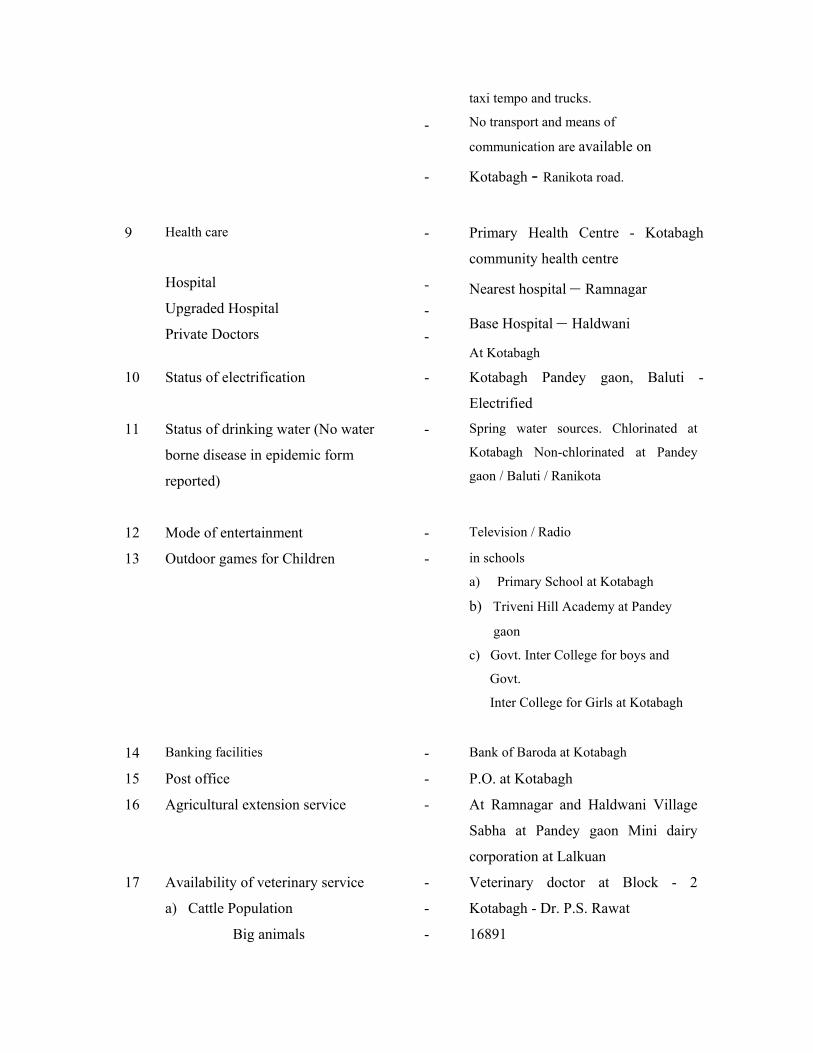
8
-
-
taxi tempo and trucks.
No transport and means of
communication are available on
Kotabagh - Ranikota road.
9 Health care
Hospital
Upgraded Hospital
Private Doctors
-
-
-
-
Primary Health Centre - Kotabagh
community health centre
Nearest hospital – Ramnagar
Base Hospital – Haldwani
At Kotabagh
10 Status of electrification - Kotabagh Pandey gaon, Baluti -
Electrified
11 Status of drinking water (No water
borne disease in epidemic form
reported)
- Spring water sources. Chlorinated at
Kotabagh Non-chlorinated at Pandey
gaon / Baluti / Ranikota
12 Mode of entertainment - Television / Radio
13 Outdoor games for Children - in schools
a) Primary School at Kotabagh
b) Triveni Hill Academy at Pandey
gaon
c) Govt. Inter College for boys and
Govt.
Inter College for Girls at Kotabagh
14 Banking facilities - Bank of Baroda at Kotabagh
15 Post office - P.O. at Kotabagh
16 Agricultural extension service - At Ramnagar and Haldwani Village
Sabha at Pandey gaon Mini dairy
corporation at Lalkuan
17 Availability of veterinary service
a) Cattle Population
Big animals
-
-
-
Veterinary doctor at Block - 2
Kotabagh - Dr. P.S. Rawat
16891
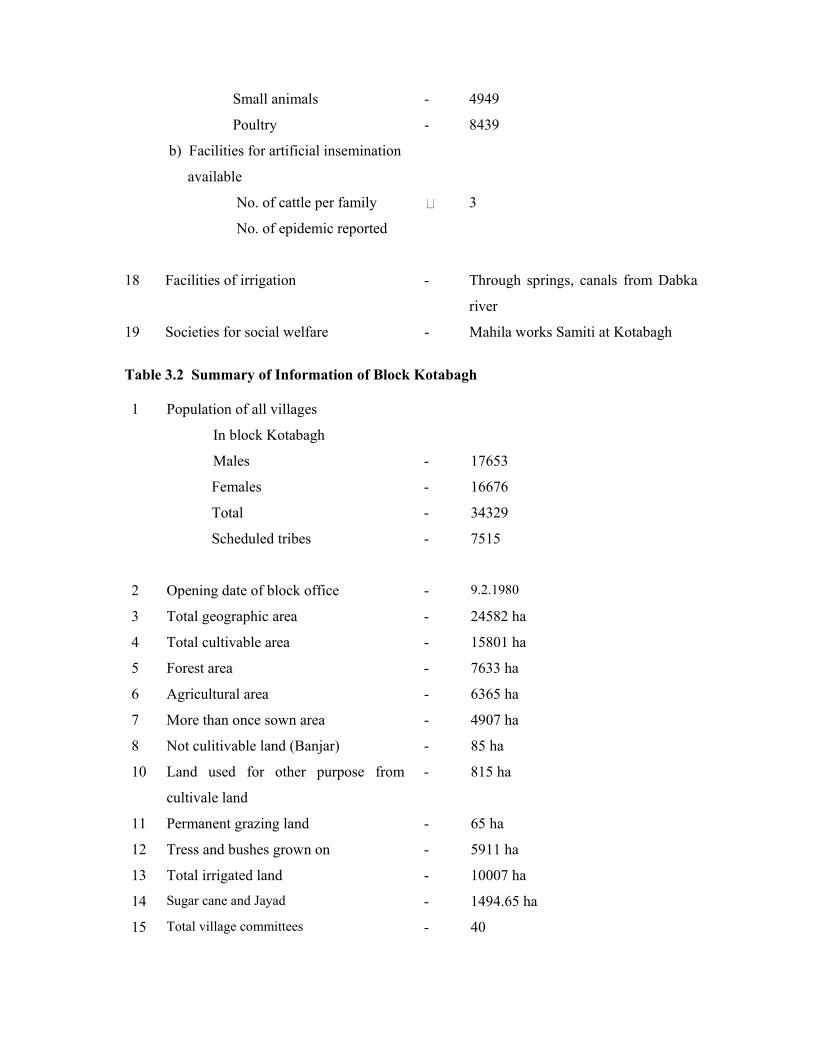
9
Small animals
Poultry
b) Facilities for artificial insemination
available
No. of cattle per family
No. of epidemic reported
-
-
4949
8439
3
18 Facilities of irrigation - Through springs, canals from Dabka
river
19 Societies for social welfare - Mahila works Samiti at Kotabagh
Table 3.2 Summary of Information of Block Kotabagh
1 Population of all villages
In block Kotabagh
Males
Females
Total
Scheduled tribes
-
-
-
-
17653
16676
34329
7515
2 Opening date of block office - 9.2.1980
3 Total geographic area - 24582 ha
4 Total cultivable area - 15801 ha
5 Forest area - 7633 ha
6 Agricultural area - 6365 ha
7 More than once sown area - 4907 ha
8 Not culitivable land (Banjar) - 85 ha
10 Land used for other purpose from
cultivale land
- 815 ha
11 Permanent grazing land - 65 ha
12 Tress and bushes grown on - 5911 ha
13 Total irrigated land - 10007 ha
14 Sugar cane and Jayad - 1494.65 ha
15 Total village committees - 40
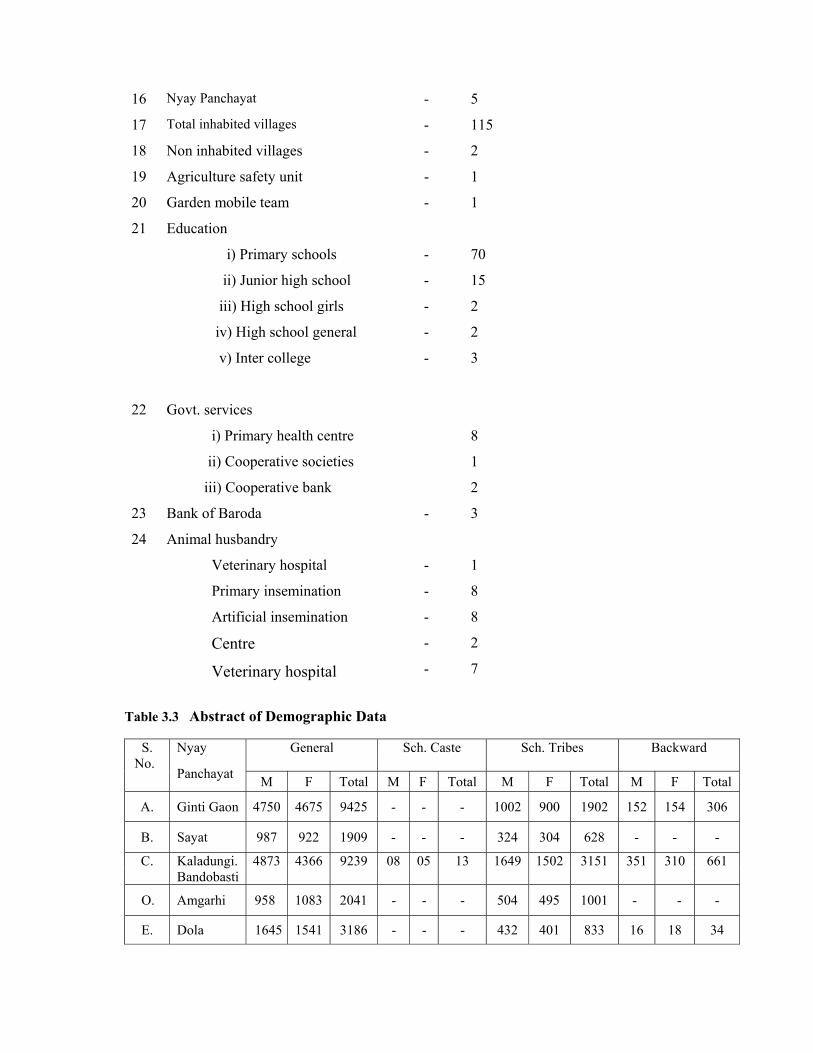
10
16 Nyay Panchayat - 5
17 Total inhabited villages - 115
18 Non inhabited villages - 2
19 Agriculture safety unit - 1
20 Garden mobile team - 1
21 Education
i) Primary schools
ii) Junior high school
iii) High school girls
iv) High school general
v) Inter college
-
-
-
-
-
70
15
2
2
3
22 Govt. services
i) Primary health centre
ii) Cooperative societies
iii) Cooperative bank
8
1
2
23 Bank of Baroda - 3
24 Animal husbandry
Veterinary hospital
Primary insemination
Artificial insemination
Centre
Veterinary hospital
-
-
-
-
-
1
8
8
2
7
Table 3.3 Abstract of Demographic Data
S. Nyay General Sch. Caste Sch. Tribes Backward No.
Panchayat M F Total M F Total M F Total M F Total
A. Ginti Gaon 4750 4675 9425 - - - 1002 900 1902 152 154 306
B. Sayat 987 922 1909 - - - 324 304 628 - - -
C. Kaladungi. 4873 4366 9239 08 05 13 1649 1502 3151 351 310 661 Bandobasti
O. Amgarhi 958 1083 2041 - - - 504 495 1001 - - -
E. Dola 1645 1541 3186 - - - 432 401 833 16 18 34
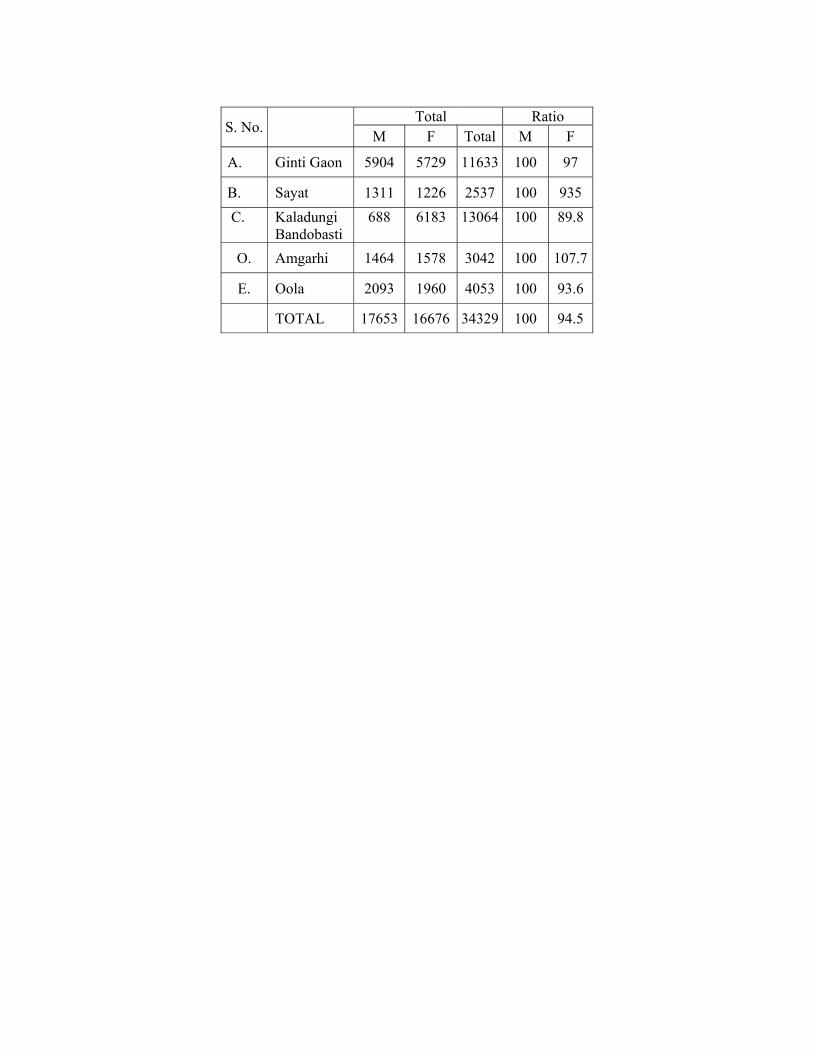
11
Total Ratio
S. No. M F Total M F
A. Ginti Gaon 5904 5729 11633 100 97
B. Sayat 1311 1226 2537 100 935 C. Kaladungi 688 6183 13064 100 89.8
Bandobasti O. Amgarhi 1464 1578 3042 100 107.7
E. Oola 2093 1960 4053 100 93.6
TOTAL 17653 16676 34329 100 94.5
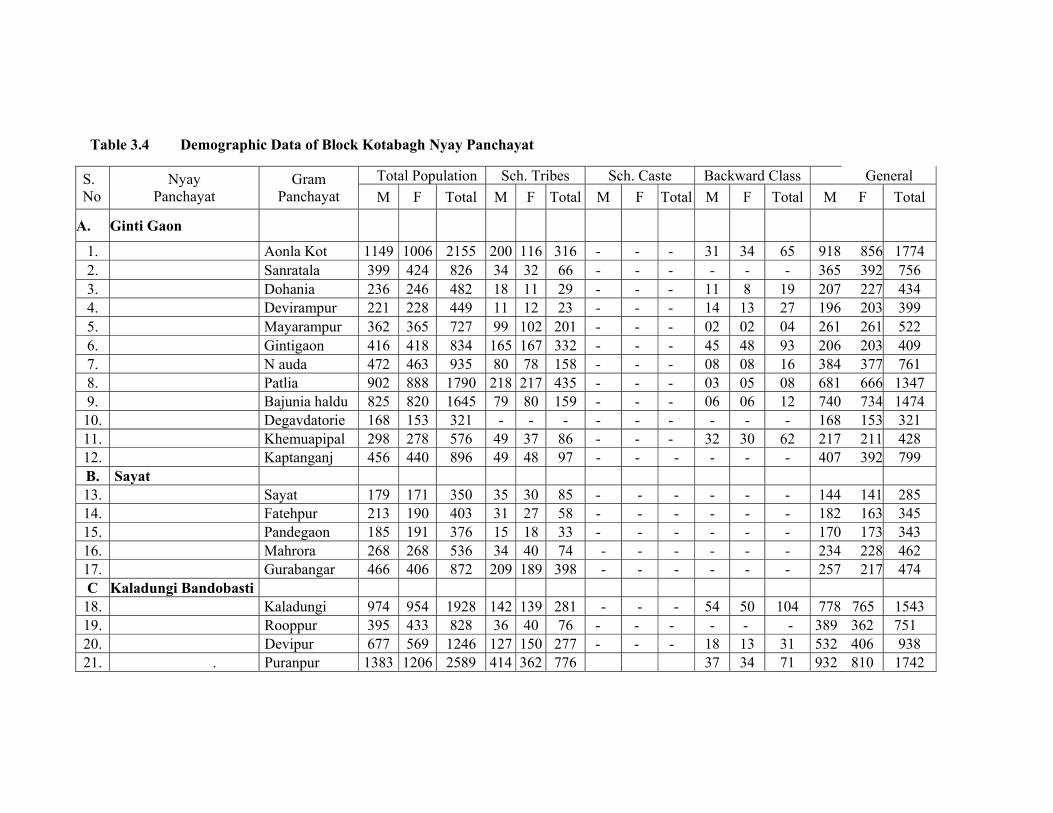
12
Table 3.4 Demographic Data of Block Kotabagh Nyay Panchayat
Total Population Sch. Tribes Sch. Caste Backward Class General S. No
Nyay Panchayat
Gram Panchayat M F Total M F Total M F Total M F Total M F Total
A. Ginti Gaon
1. Aonla Kot 1149 1006 2155 200 116 316 - - - 31 34 65 918 856 1774 2. Sanratala 399 424 826 34 32 66 - - - - - - 365 392 756 3. Dohania 236 246 482 18 11 29 - - - 11 8 19 207 227 434 4. Devirampur 221 228 449 11 12 23 - - - 14 13 27 196 203 399 5. Mayarampur 362 365 727 99 102 201 - - - 02 02 04 261 261 522 6. Gintigaon 416 418 834 165 167 332 - - - 45 48 93 206 203 409 7. N auda 472 463 935 80 78 158 - - - 08 08 16 384 377 761 8. Patlia 902 888 1790 218 217 435 - - - 03 05 08 681 666 1347 9. Bajunia haldu 825 820 1645 79 80 159 - - - 06 06 12 740 734 1474 10. Degavdatorie 168 153 321 - - - - - - - - - 168 153 321 11. Khemuapipal 298 278 576 49 37 86 - - - 32 30 62 217 211 428 12. Kaptanganj 456 440 896 49 48 97 - - - - - - 407 392 799 B. Sayat 13. Sayat 179 171 350 35 30 85 - - - - - - 144 141 285 14. Fatehpur 213 190 403 31 27 58 - - - - - - 182 163 345 15. Pandegaon 185 191 376 15 18 33 - - - - - - 170 173 343 16. Mahrora 268 268 536 34 40 74 - - - - - - 234 228 462 17. Gurabangar 466 406 872 209 189 398 - - - - - - 257 217 474 C Kaladungi Bandobasti
18. Kaladungi 974 954 1928 142 139 281 - - - 54 50 104 778 765 1543 19. Rooppur 395 433 828 36 40 76 - - - - - - 389 362 751 20. Devipur 677 569 1246 127 150 277 - - - 18 13 31 532 406 938 21. . Puranpur 1383 1206 2589 414 362 776 37 34 71 932 810 1742
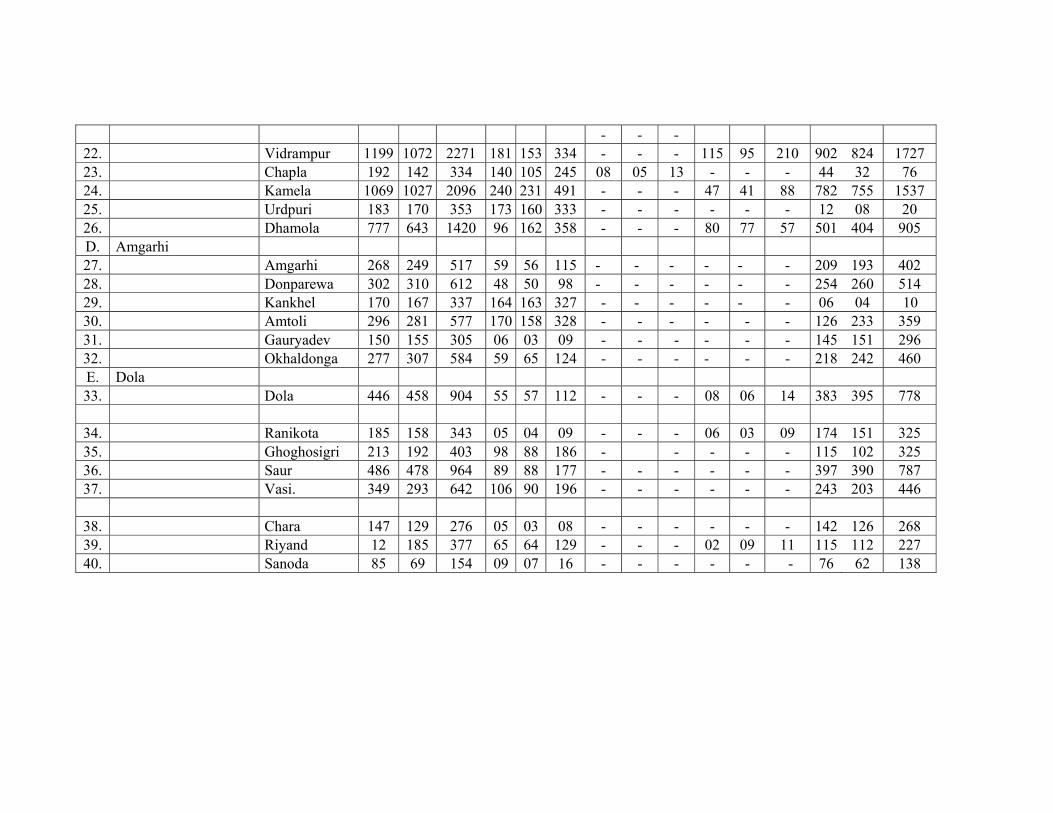
13
- - - 22. Vidrampur 1199 1072 2271 181 153 334 - - - 115 95 210 902 824 1727 23. Chapla 192 142 334 140 105 245 08 05 13 - - - 44 32 76 24. Kamela 1069 1027 2096 240 231 491 - - - 47 41 88 782 755 1537 25. Urdpuri 183 170 353 173 160 333 - - - - - - 12 08 20 26. Dhamola 777 643 1420 96 162 358 - - - 80 77 57 501 404 905 D. Amgarhi 27. Amgarhi 268 249 517 59 56 115 - - - - - - 209 193 402 28. Donparewa 302 310 612 48 50 98 - - - - - - 254 260 514 29. Kankhel 170 167 337 164 163 327 - - - - - - 06 04 10 30. Amtoli 296 281 577 170 158 328 - - - - - - 126 233 359 31. Gauryadev 150 155 305 06 03 09 - - - - - - 145 151 296 32. Okhaldonga 277 307 584 59 65 124 - - - - - - 218 242 460 E. Dola 33. Dola 446 458 904 55 57 112 - - - 08 06 14 383 395 778
34. Ranikota 185 158 343 05 04 09 - - - 06 03 09 174 151 325 35. Ghoghosigri 213 192 403 98 88 186 - - - - - 115 102 325 36. Saur 486 478 964 89 88 177 - - - - - - 397 390 787 37. Vasi. 349 293 642 106 90 196 - - - - - - 243 203 446
38. Chara 147 129 276 05 03 08 - - - - - - 142 126 268 39. Riyand 12 185 377 65 64 129 - - - 02 09 11 115 112 227 40. Sanoda 85 69 154 09 07 16 - - - - - - 76 62 138
14
CHAPTER - 4 METHODOLOGY
4.1 A team consisting of the following made reconnaissance and detailed survey Prof. R.P. Mathur Er. S.K. Rai, Assistant Engineer, PWD accompanied Er. H.Joshi, Junior Engineer, PWD
The team visited, Kotabagh block, three villages Pandey Gaon, Baluti and Ranikota
and walked on the full stretch of the road. The road, Kotabagh to Ranikota is motorable
(with difficulty) for about 1.5 km. The rest of the road is not motorable. They spoke to
people of the area, school principal, Jal Sansthan officials and the forest staff (Ranger of
Dechauri Range) to elicit the views of their perception of the problems, the benefits and the
impact of proposed upgradation. The relevant information of environmental aspects was
collected from officials records of Executive Engineer (PWD), Jal Nigam, Jal Sansthan,
BDO and the Veterinary Centre block-2, Kotabagh.
The proposed upgradation work has been planned on the existing hil1 road to
establish the suitability and feasibility.
The road is located on the hill slopes and is a link road between Kotabagh and
Ranikota. The villages Pandey gaon, Baluti and Ranikota will be served by the link road.
Another proposal of Uttaranchal state government of constructing a bridge on river Dabka
and a link road of 5 km will provide access to other villages of the block as well.
No acquisition of land is involved. Interference on any significant scale with land use,
drainage, vegetation, quarrying other than from designated quarries (Ramnagar, Haldwani) is
not involved. However, in small sections where the available plain land is not sufficient for
shoulders, cutting of hills is required. Hill slope stability in such areas is the most important
consideration and must be seriously attended to. As any large scale construction is not
involved, the activity of construction would be restricted and localised. The biological
components would not be affected as the vegetation in the form of bushes (herbs and shrubs)
will be removed for dressing and making shoulders and berms. These bushes alongwith some
Bryophytes, Pteriodophytes and Mimosa, which are otherwise in plenty, will be removed.
Thus the impact on natural resources and environment is minor. However, it is necessary to
examine the likely environmental impact of the project and to see whether any impact will
15
need mitigative measures. Keeping in view the above facts, the EIA studies have been restricted to the area of
construction only. The components of environment which may get affected have only been
included in the scope viz. air, water land biological and socio-economic environment.
4.2 Air Environment
The air environment of the proposed road is of pristine level. There are no industries
in the area (Kotabagh). In the Ramnagar block also only a few wood based industries are
located, which do not produce any air borne pollutants. The vehicular traffic also is restricted
between Ramnagar and Kotabagh. In the proposed stretch, no vehicle, automobiles, not even
two wheelers ply on the road. The load is carried either as head load or on horses and ponies
which does not produce any air pollutant. Thus, the air in the area is clean with no dust
(SPM), oxides of nitrogen and sulfur, below detection limits.
4.3 Water Environment
The major source of water is springs. The water of springs is sparkling clear and is
consumed by villagers directly. The analysis report of one such source is given later in
Chapter-5. The perusal of the report reveals the presence of inorganics which depends on
geology of the area and no trace of any organic pollutants. At number of places of the hill
slopes, it was noticed that sulfur springs exist and brown patches of deposits are visible.
Even, calcareous outflows are noticed (white deposits).
The regional office of Pollution Control Board also does not maintain any record of
water as well as air quality. An irrigation canal passes through the area and the river Dabka
flows at the end of the proposed road.
4.4 Noise Environment
Since, no activity of any concern exist in the area, recourse to values in literature has
been made. During construction the noise levels will increase because of earth moving
machinery, road rollers and trucks to transport construction material. After construction also
limited vehicular movement is anticipated.
4.5 Land Environment The road exists but is not motorable for about 3.5 km. This is because of stone/hill
16
debris. A clear stretch of 6-10m available althrough. In certain regions the land available is
much more, about 12 m while in others some cutting is needed. The soil texture varies from
loamy sand, fine loamy to silty clay.
4.6 Biological Environment
The basic information available with forest officials and block officials has been
collected and utillised. The flora and fauna has been described later in the report. No impact
of the project on biological environment is anticipated. The project involves only marginal
uprooting of herbs and shrubs in the areas on the shoulders of roads and in small stretches
where cutting of slopes is required. These herbs and shrubs alongwith ferns and mosses will
soon grow in the area and colonise the berms. The impact of such activity will also be not
significant.
4.7 Socio-Economic Environment
Data on population, infrastructural facilities agricultural pattern, living habitats has
been collected and analysed.
17
CHAPTER - 5 BASELINE ENVIRONMENTAL STATUS
5.1 The base line environmental status presented here includes the various components of
environments, air including micrometeorology, water, biological and sociological
environment. 5.2 Air Environment The existing ambient Air Quality status (AAQS) within the impact zone has been
characterized from the data already existing for the specific areas. This has been done to
establish the existing regional background levels of air pollution status in the vicinity of area.
The area under review is typical in the sense that it does not have any industry ,
producing air pollutants and no vehicular movement on the road and in the contiguous area.
The vehicular traffic is restricted from Ramnagar / Haldwani to Kotabagh and not beyond The weather data is maintained either at Nainital, which is located at an altitude of
1938 m above msl or at Pant Nagar which is in the plains. The weather characteristics of Ram
Nagar are more akin to Pant Nagar and the same has been reproduced in Table. 5.1
The climate of the region showns mixed character of Tarai region and upper gangetic
plains. The periodica adjustment of the atmospheric factors form a monsoon type of tropical
climate. The rhythmic changes in the climate brings about three cyclic seasons namely rainy,
winter and summer.
The mean maximum temperature varies between 36°C (April, May and June)
and15°C (Dec. and Jan) and mean minimum temperature between 25°C (May and June) and
4.5 °c (January). The rainfall is restricted to the three months of July - September and
constitutes about 75% of rain and two months in January and February (20%). The rest is
accounted for non monsoon months. In the year 2000 the total rainfall was 3218.5 mm in 74
rainy days. The wind direction is variable. In winter months it is prevalent in WSW and in
Summers ESE. A typical wind rose diagram is depicted in Figure 5.1. The records of ambient
air quality from UPPCB Haldwani (industrial area is given in Table 5.2) reconfirms that in
areas away from the vicinity of industries like Kotabagh will have values much lower, mostly
in negligible ranges.
18
5.3 Water Environment
Base line data of water is represented by the spring water in the area. The analysis of
one such sample is given in Table 5.3. The following generalization can be made.
The water is slightly alkaline and carries a low level of minerals. The values of
alkalinity, hardness, chlorides, TDS and conductivity all corroborate the observation. As
expected the value of calcium is more than sodium and potassium. There is no trace of
nitrogen to indicate availability of organic compounds. The bacterial numbers as borne out by
MPN values is nil. The water is suitable for drinking purposes.
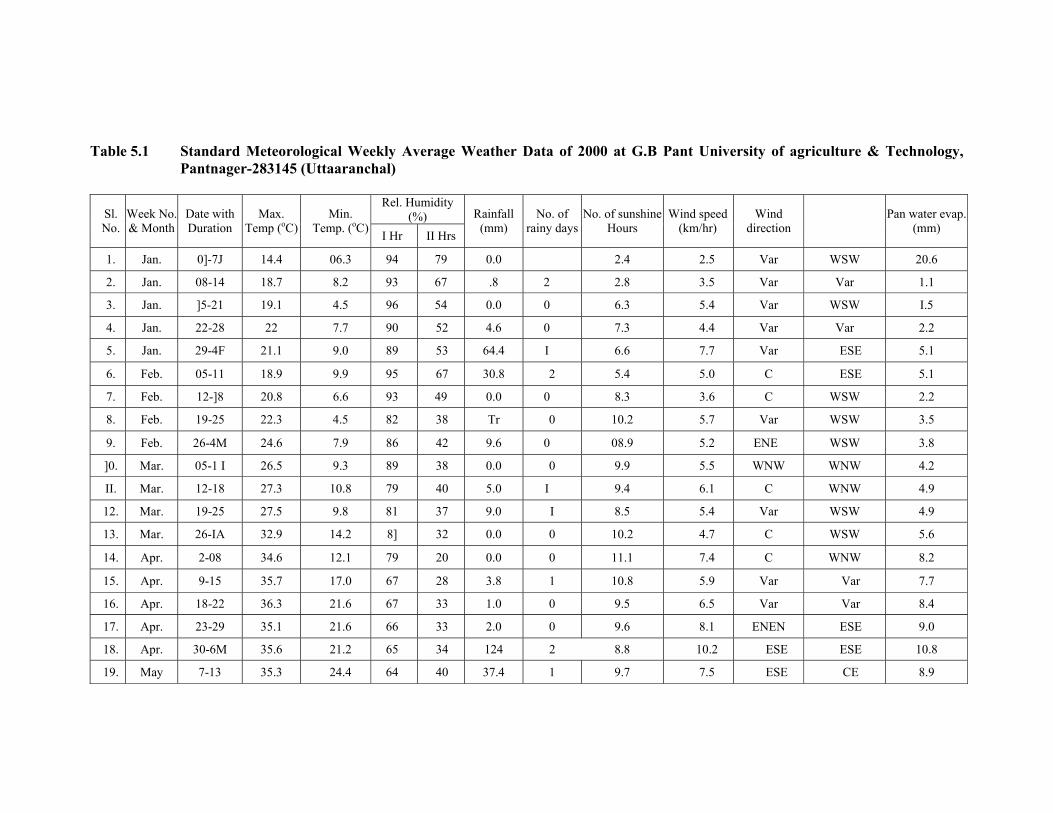
19
Table 5.1 Standard Meteorological Weekly Average Weather Data of 2000 at G.B Pant University of agriculture & Technology,
Pantnager-283145 (Uttaaranchal)
Rel. Humidity (%) Sl.
No. Week No. & Month
Date with Duration
Max. Temp (oC)
Min. Temp. (oC) I Hr II Hrs
Rainfall (mm)
No. of rainy days
No. of sunshine Hours
Wind speed (km/hr)
Wind direction Pan water evap.
(mm)
1. Jan. 0]-7J 14.4 06.3 94 79 0.0 2.4 2.5 Var WSW 20.6
2. Jan. 08-14 18.7 8.2 93 67 .8 2 2.8 3.5 Var Var 1.1
3. Jan. ]5-21 19.1 4.5 96 54 0.0 0 6.3 5.4 Var WSW I.5
4. Jan. 22-28 22 7.7 90 52 4.6 0 7.3 4.4 Var Var 2.2
5. Jan. 29-4F 21.1 9.0 89 53 64.4 I 6.6 7.7 Var ESE 5.1
6. Feb. 05-11 18.9 9.9 95 67 30.8 2 5.4 5.0 C ESE 5.1
7. Feb. 12-]8 20.8 6.6 93 49 0.0 0 8.3 3.6 C WSW 2.2
8. Feb. 19-25 22.3 4.5 82 38 Tr 0 10.2 5.7 Var WSW 3.5
9. Feb. 26-4M 24.6 7.9 86 42 9.6 0 08.9 5.2 ENE WSW 3.8
]0. Mar. 05-1 I 26.5 9.3 89 38 0.0 0 9.9 5.5 WNW WNW 4.2
II. Mar. 12-18 27.3 10.8 79 40 5.0 I 9.4 6.1 C WNW 4.9
12. Mar. 19-25 27.5 9.8 81 37 9.0 I 8.5 5.4 Var WSW 4.9
13. Mar. 26-IA 32.9 14.2 8] 32 0.0 0 10.2 4.7 C WSW 5.6
14. Apr. 2-08 34.6 12.1 79 20 0.0 0 11.1 7.4 C WNW 8.2
15. Apr. 9-15 35.7 17.0 67 28 3.8 1 10.8 5.9 Var Var 7.7
16. Apr. 18-22 36.3 21.6 67 33 1.0 0 9.5 6.5 Var Var 8.4
17. Apr. 23-29 35.1 21.6 66 33 2.0 0 9.6 8.1 ENEN ESE 9.0
18. Apr. 30-6M 35.6 21.2 65 34 124 2 8.8 10.2 ESE ESE 10.8
19. May 7-13 35.3 24.4 64 40 37.4 1 9.7 7.5 ESE CE 8.9
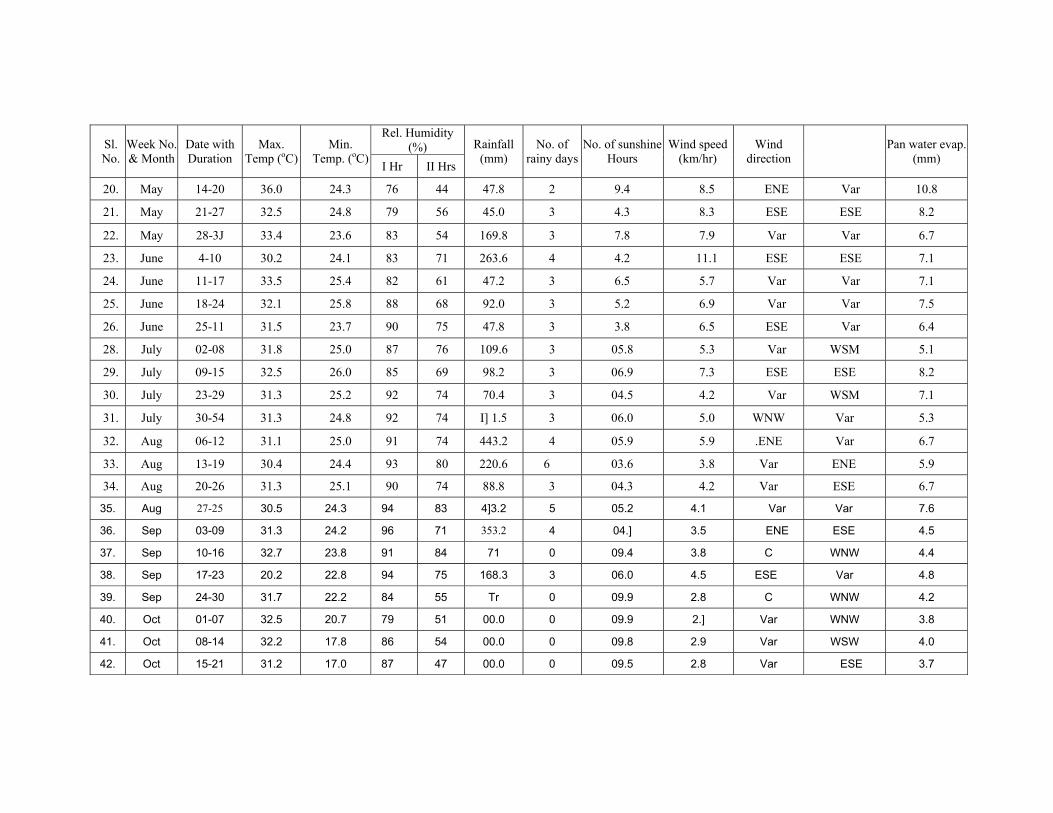
20
Rel. Humidity (%) Sl.
No. Week No. & Month
Date with Duration
Max. Temp (oC)
Min. Temp. (oC) I Hr II Hrs
Rainfall (mm)
No. of rainy days
No. of sunshine Hours
Wind speed (km/hr)
Wind direction Pan water evap.
(mm)
20. May 14-20 36.0 24.3 76 44 47.8 2 9.4 8.5 ENE Var 10.8
21. May 21-27 32.5 24.8 79 56 45.0 3 4.3 8.3 ESE ESE 8.2
22. May 28-3J 33.4 23.6 83 54 169.8 3 7.8 7.9 Var Var 6.7
23. June 4-10 30.2 24.1 83 71 263.6 4 4.2 11.1 ESE ESE 7.1
24. June 11-17 33.5 25.4 82 61 47.2 3 6.5 5.7 Var Var 7.1
25. June 18-24 32.1 25.8 88 68 92.0 3 5.2 6.9 Var Var 7.5
26. June 25-11 31.5 23.7 90 75 47.8 3 3.8 6.5 ESE Var 6.4
28. July 02-08 31.8 25.0 87 76 109.6 3 05.8 5.3 Var WSM 5.1
29. July 09-15 32.5 26.0 85 69 98.2 3 06.9 7.3 ESE ESE 8.2
30. July 23-29 31.3 25.2 92 74 70.4 3 04.5 4.2 Var WSM 7.1
31. July 30-54 31.3 24.8 92 74 I] 1.5 3 06.0 5.0 WNW Var 5.3
32. Aug 06-12 31.1 25.0 91 74 443.2 4 05.9 5.9 .ENE Var 6.7
33. Aug 13-19 30.4 24.4 93 80 220.6 6 03.6 3.8 Var ENE 5.9
34. Aug 20-26 31.3 25.1 90 74 88.8 3 04.3 4.2 Var ESE 6.7
35. Aug 27-25 30.5 24.3 94 83 4]3.2 5 05.2 4.1 Var Var 7.6
36. Sep 03-09 31.3 24.2 96 71 353.2 4 04.] 3.5 ENE ESE 4.5
37. Sep 10-16 32.7 23.8 91 84 71 0 09.4 3.8 C WNW 4.4
38. Sep 17-23 20.2 22.8 94 75 168.3 3 06.0 4.5 ESE Var 4.8
39. Sep 24-30 31.7 22.2 84 55 Tr 0 09.9 2.8 C WNW 4.2
40. Oct 01-07 32.5 20.7 79 51 00.0 0 09.9 2.] Var WNW 3.8
41. Oct 08-14 32.2 17.8 86 54 00.0 0 09.8 2.9 Var WSW 4.0
42. Oct 15-21 31.2 17.0 87 47 00.0 0 09.5 2.8 Var ESE 3.7
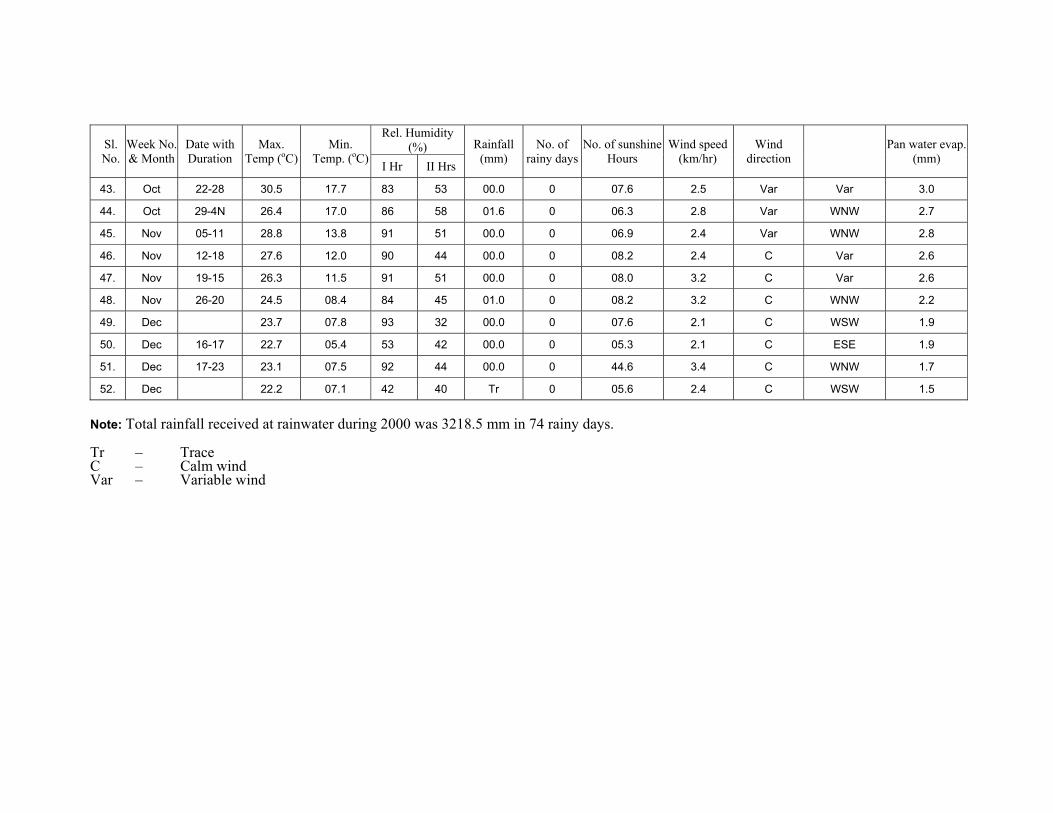
21
Rel. Humidity (%) Sl.
No. Week No. & Month
Date with Duration
Max. Temp (oC)
Min. Temp. (oC) I Hr II Hrs
Rainfall (mm)
No. of rainy days
No. of sunshine Hours
Wind speed (km/hr)
Wind direction Pan water evap.
(mm)
43. Oct 22-28 30.5 17.7 83 53 00.0 0 07.6 2.5 Var Var 3.0
44. Oct 29-4N 26.4 17.0 86 58 01.6 0 06.3 2.8 Var WNW 2.7
45. Nov 05-11 28.8 13.8 91 51 00.0 0 06.9 2.4 Var WNW 2.8
46. Nov 12-18 27.6 12.0 90 44 00.0 0 08.2 2.4 C Var 2.6
47. Nov 19-15 26.3 11.5 91 51 00.0 0 08.0 3.2 C Var 2.6
48. Nov 26-20 24.5 08.4 84 45 01.0 0 08.2 3.2 C WNW 2.2
49. Dec 23.7 07.8 93 32 00.0 0 07.6 2.1 C WSW 1.9
50. Dec 16-17 22.7 05.4 53 42 00.0 0 05.3 2.1 C ESE 1.9
51. Dec 17-23 23.1 07.5 92 44 00.0 0 44.6 3.4 C WNW 1.7
52. Dec 22.2 07.1 42 40 Tr 0 05.6 2.4 C WSW 1.5 Note: Total rainfall received at rainwater during 2000 was 3218.5 mm in 74 rainy days. Tr – Trace C – Calm wind Var – Variable wind
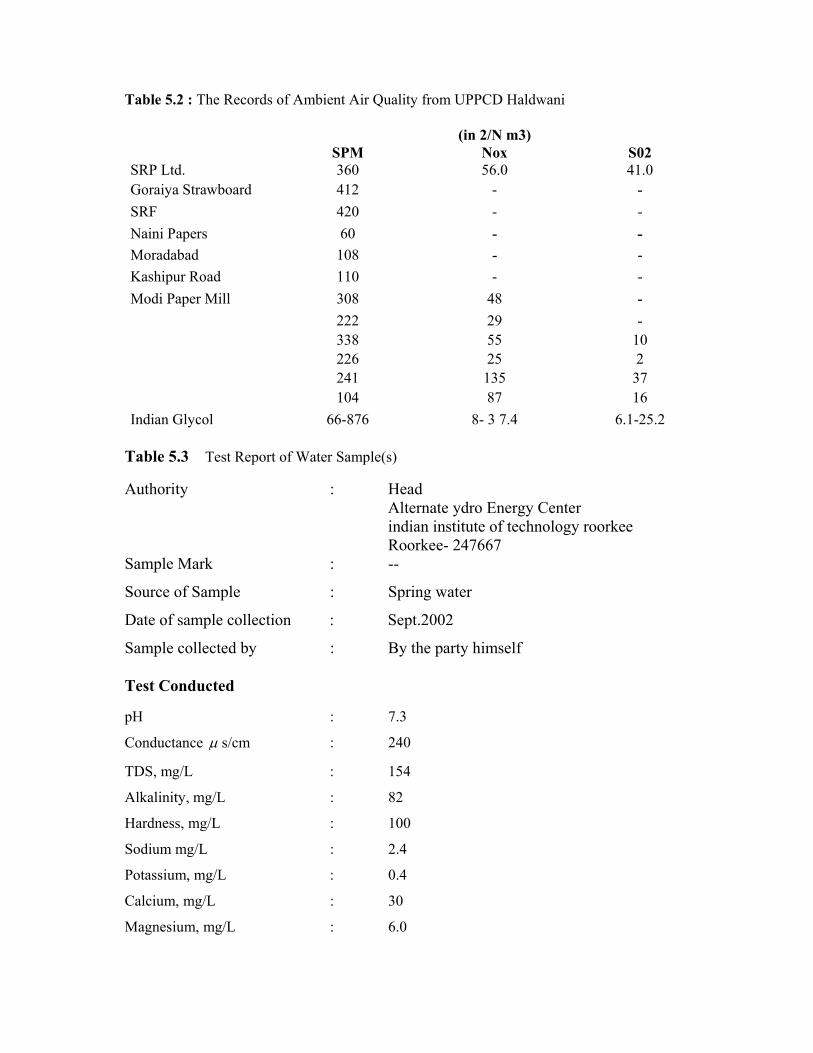
22
Table 5.2 : The Records of Ambient Air Quality from UPPCD Haldwani (in 2/N m3) SPM Nox S02 SRP Ltd. 360 56.0 41.0 Goraiya Strawboard 412 - - SRF 420 - - Naini Papers 60 - - Moradabad 108 - - Kashipur Road 110 - - Modi Paper Mill 308 48 -
222 29 - 338 55 10 226 25 2 241 135 37 104 87 16 Indian Glycol 66-876 8- 3 7.4 6.1-25.2
Table 5.3 Test Report of Water Sample(s) Authority : Head
Alternate ydro Energy Center indian institute of technology roorkee Roorkee- 247667
Sample Mark : --
Source of Sample : Spring water
Date of sample collection : Sept.2002
Sample collected by : By the party himself Test Conducted pH : 7.3
Conductance µ s/cm : 240
TDS, mg/L : 154
Alkalinity, mg/L : 82
Hardness, mg/L : 100
Sodium mg/L : 2.4
Potassium, mg/L : 0.4
Calcium, mg/L : 30
Magnesium, mg/L : 6.0
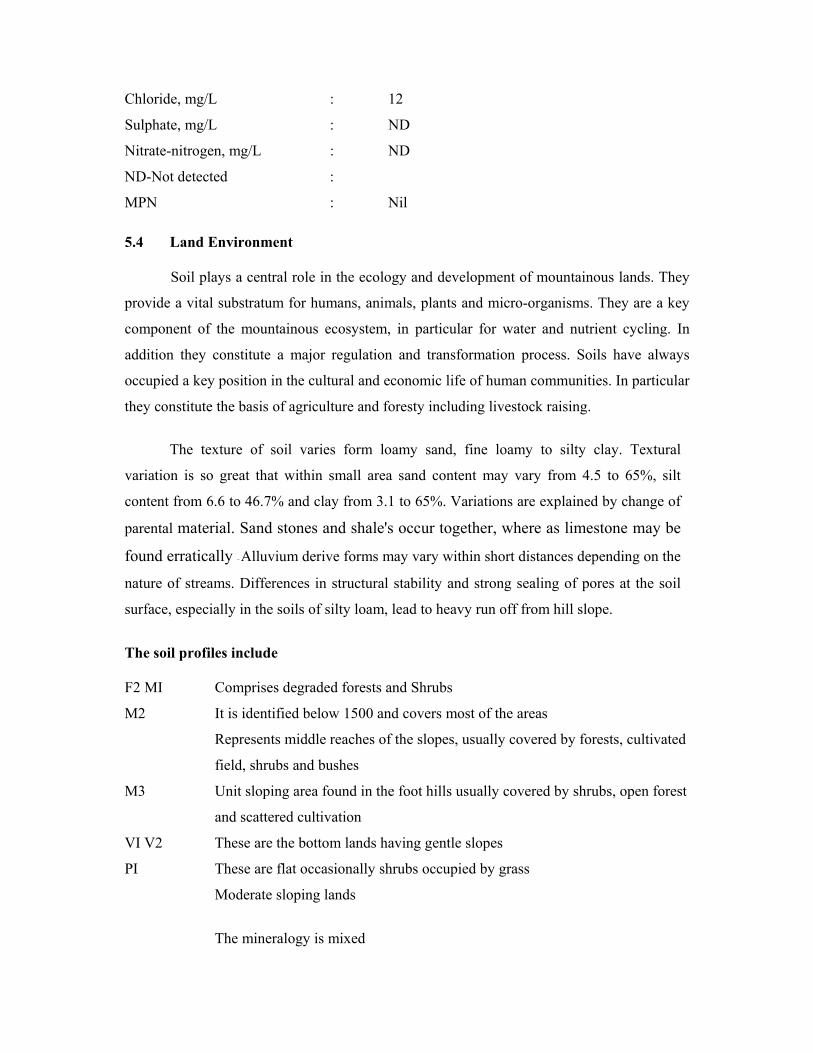
23
Chloride, mg/L : 12
Sulphate, mg/L : ND
Nitrate-nitrogen, mg/L : ND
ND-Not detected :
MPN : Nil 5.4 Land Environment
Soil plays a central role in the ecology and development of mountainous lands. They
provide a vital substratum for humans, animals, plants and micro-organisms. They are a key
component of the mountainous ecosystem, in particular for water and nutrient cycling. In
addition they constitute a major regulation and transformation process. Soils have always
occupied a key position in the cultural and economic life of human communities. In particular
they constitute the basis of agriculture and foresty including livestock raising.
The texture of soil varies form loamy sand, fine loamy to silty clay. Textural
variation is so great that within small area sand content may vary from 4.5 to 65%, silt
content from 6.6 to 46.7% and clay from 3.1 to 65%. Variations are explained by change of
parental material. Sand stones and shale's occur together, where as limestone may be
found erratically ~ Alluvium derive forms may vary within short distances depending on the
nature of streams. Differences in structural stability and strong sealing of pores at the soil
surface, especially in the soils of silty loam, lead to heavy run off from hill slope.
The soil profiles include F2 MI Comprises degraded forests and Shrubs
M2 It is identified below 1500 and covers most of the areas
Represents middle reaches of the slopes, usually covered by forests, cultivated
field, shrubs and bushes
M3 Unit sloping area found in the foot hills usually covered by shrubs, open forest
and scattered cultivation
VI V2 These are the bottom lands having gentle slopes
PI These are flat occasionally shrubs occupied by grass
Moderate sloping lands
The mineralogy is mixed
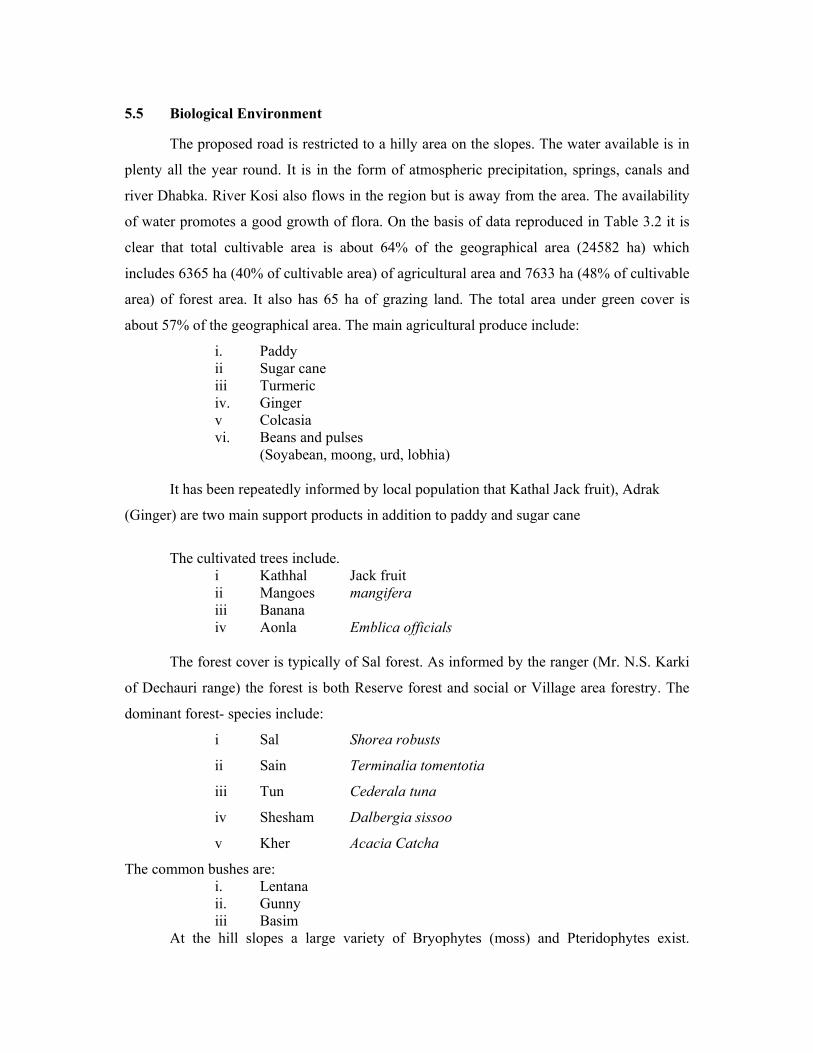
24
5.5 Biological Environment
The proposed road is restricted to a hilly area on the slopes. The water available is in
plenty all the year round. It is in the form of atmospheric precipitation, springs, canals and
river Dhabka. River Kosi also flows in the region but is away from the area. The availability
of water promotes a good growth of flora. On the basis of data reproduced in Table 3.2 it is
clear that total cultivable area is about 64% of the geographical area (24582 ha) which
includes 6365 ha (40% of cultivable area) of agricultural area and 7633 ha (48% of cultivable
area) of forest area. It also has 65 ha of grazing land. The total area under green cover is
about 57% of the geographical area. The main agricultural produce include:
i. Paddy ii Sugar cane iii Turmeric iv. Ginger v Colcasia vi. Beans and pulses (Soyabean, moong, urd, lobhia)
It has been repeatedly informed by local population that Kathal Jack fruit), Adrak
(Ginger) are two main support products in addition to paddy and sugar cane
The cultivated trees include. i Kathhal Jack fruit ii Mangoes mangifera iii Banana iv Aonla Emblica officials The forest cover is typically of Sal forest. As informed by the ranger (Mr. N.S. Karki
of Dechauri range) the forest is both Reserve forest and social or Village area forestry. The
dominant forest- species include:
i Sal Shorea robusts
ii Sain Terminalia tomentotia
iii Tun Cederala tuna
iv Shesham Dalbergia sissoo
v Kher Acacia Catcha
The common bushes are: i. Lentana ii. Gunny iii Basim
At the hill slopes a large variety of Bryophytes (moss) and Pteridophytes exist.
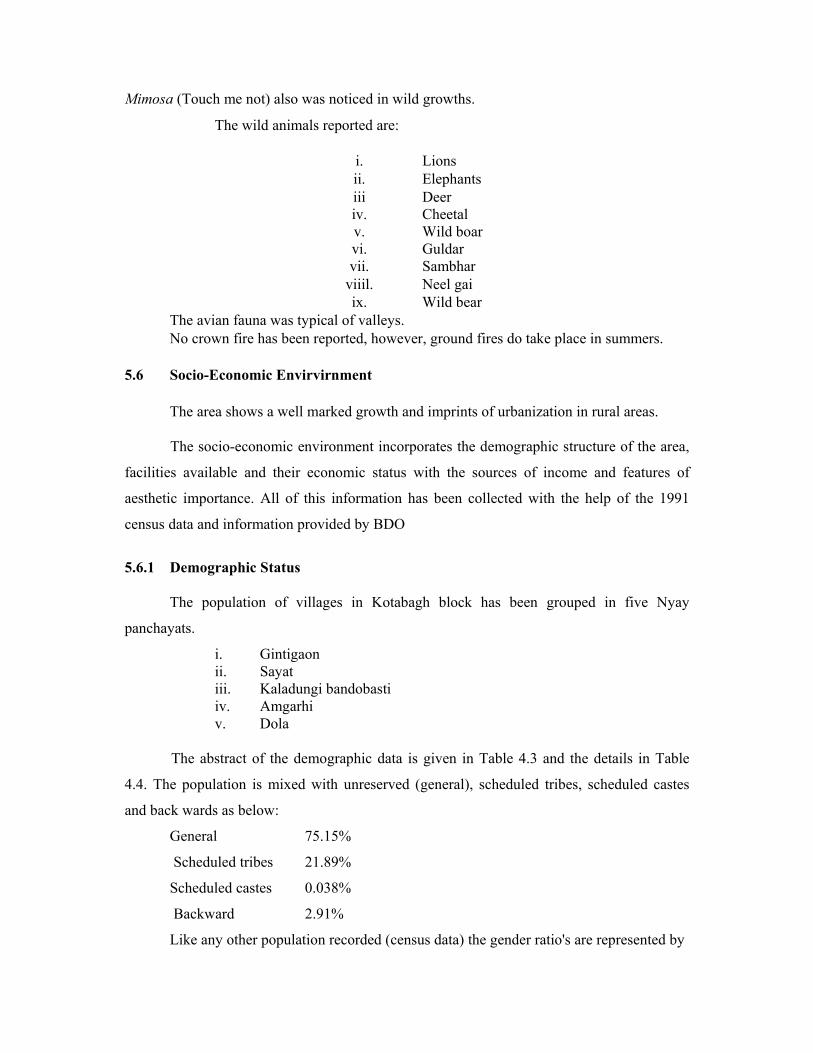
25
Mimosa (Touch me not) also was noticed in wild growths.
The wild animals reported are:
i. Lions ii. Elephants iii Deer iv. Cheetal v. Wild boar vi. Guldar vii. Sambhar
viiil. Neel gai ix. Wild bear
The avian fauna was typical of valleys. No crown fire has been reported, however, ground fires do take place in summers.
5.6 Socio-Economic Envirvirnment The area shows a well marked growth and imprints of urbanization in rural areas.
The socio-economic environment incorporates the demographic structure of the area,
facilities available and their economic status with the sources of income and features of
aesthetic importance. All of this information has been collected with the help of the 1991
census data and information provided by BDO
5.6.1 Demographic Status
The population of villages in Kotabagh block has been grouped in five Nyay
panchayats.
i. Gintigaon ii. Sayat iii. Kaladungi bandobasti iv. Amgarhi v. Dola The abstract of the demographic data is given in Table 4.3 and the details in Table
4.4. The population is mixed with unreserved (general), scheduled tribes, scheduled castes
and back wards as below:
General 75.15%
Scheduled tribes 21.89%
Scheduled castes 0.038%
Backward 2.91%
Like any other population recorded (census data) the gender ratio's are represented by
26
a low female figure except in Amgarhi Nyay Panchyat
Male to Female Ginti gaon 100 : 97 Sayat 100 : 93.5 Ka]adungi 100 : 89.8 Bandobasti Amgarhi 100 : 107.7 Do]a 100 : 93.6 Total 100 : 94.5
The literacy ratio is on the rise. The information given by schools indicate that almost
all children in age group of 6-12 attend school. There is no gender bias in education. The girls
out number boys in colleges. .
5.6.2 Basic Amenities
Under the infrastructural facilities, the basic amenities have been summarized in
Chapter 4. The salient observations are as follows:
- The villages have water supply of spring water. It is stored in tanks, chlorinated and
supplied or it is used as it is. In Kotabagh it is under the control of Jal Santhan, where
as in Pandeygaon and Baluti it is privately managed.
- Villages are electrified.
- Transport facilities are available upto Kotabagh and for other villages,
transportation is not available. .
- Primary Health centre is available at Kotabagh, hospital at Ram Nagar and base
hospital at Ha]dwani. Private RMP are available at Kotabagh.
- Education facilities are available at Kotabagh upto High School. Primary School is
available at Pandeygaon also.
- Postal facilities and PCO's are available at Kotabagh
- Shopping facilities are available at Kotabagh but shops in each village keep items of
general use.
- Animals are kept in every family. Each family has about 3-4 animals. One or two
milch animals and horses/ponies/bulls for transportation.
- Milk is transported to Kotabagh from most of the families for marketing.
- There are no pits on the road side but hill debris often gets accumulated which
interferes in water flow across the road.
27
- Sanitation is fairly good.
- The environment in terms of quality is pristine and pleasant
5.6.3 Socio-Economic Status
The Socio economic survey not only reflects the life style of people within the project
area but also expresses their feelings about the need for construction of the proposed road.
The villagers are very concerned about the transport of perishable commodities, milk, adrak
etc. for which they incur heavy costs. One quintal of adrak is transported to Kotabagh and
costs about Rs. 100/-. With the road in position, their cost will be saved and add up to their
incomes. Majority of villagers work as labourers and agricultural workers. Some of them live
in pucca houses where as others in kuccha houses with thatched roofs covered by tin sheets.
28
CHAPTER - 6 IMPACT ASSESSMENT
6.1 As indicated in Chapter I, the EIA has three-sequential phases. The identification and
characterization of physical, ecological and socio-economic environment existing in
the villages and near the site of proposed road to be upgraded has been discussed in
the preceding chapter. Prediction and Assessment are discussed here.
6.2 The impact has been evaluated in two stages: A- During construction
B- After Construction A. During construction
The construction and upgradation involves clearing the site of extra load burden in the
form of stones, boulders, soil debris and removal of bushes and shrubs. Since the road is on
the hill-slope, removal may involve earth moving machinery. Cutting of rocks in areas where
width available is small and where rounding of curves is to be done, may be resorted to. This
would be followed by laying of 2 ballast layers of 10 cm each and compacting to 7.5 cm. The
material will be brought from Ram Nagar and Haldwani by trucks. These trucks will move in
slow gear. The road rollers will also move slowly. The transportation and compaction would
add to exhaust gases and some dust. The compacted ballast layers will be over laid by
painting PI and P2. Though the material will be transported from Ramnagar/Haldwani but
heating of bitumen and mixing of gravel will be done at the site. This seems unavoidable as
hot mix will not be practical. This will, however, generate air pollutants including oxides of
carbon, nitrogen and sulfur alongwith some soot, unburnt carbon and dust. The impacts are
generalized below:
S.No. Activity Impact Increase/decrease 1. Clearing the road of
stones/soil debris and bushes
- Generation of dust - uprooting of bushes - Release of exhaust gases from earth moving machinery
- dust will increase - bushes will be
uprooted and get collected as biomass
- increase in oxides of C, N,S and SPM
2. Laying of ballast and compaction
Generation of dust and increase in exhaust gases by trucks and road rollers
Increase
29
S.No. Activity Impact Increase/decrease 3. Coal tarring Soot and exhaust gases Increase 4. Drainage Provision of cross drainage in the
form of culverts, cause ways and scuppers
Drainage will improve
5. Arboriculture The bushes will colonise soon on- shoulders
When grown the environment will improve.
6. Land along the road Land use will get altered. Over all benefit
These impacts will be restricted during the construction period and will be of
temporary nature.
B. After Construction
After the road is upgraded the environment will improve. Non paved roads can have
substantial impact, often more than paved and existing roads. The dust load would be
reduced. Wear and tear would be lesser. The traffic would move faster on high gears. Noise
level would reduce. The exhaust gases will be reduced. After completion and upgradation the
impacts will be on positive side.
- The perishable commodities will be transported fast in all weathers. Will mean
economic gain
- The population (students, service personnels and labourers) will be benefited. The
travel time will be reduced.
- With road construction/upgradation it is likely that bus/taxi-service may start which
will facilitate communication.
- With efficient cross drainage works, pools and puddles will not be formed and water
will flow freely.
- The air quality will change with vehicular movement and should be taken as negative
impact but the change will be very small almost negligible which the air environment
will be able to assimilate.
The summary of anticipated impact is given in Table 6.1
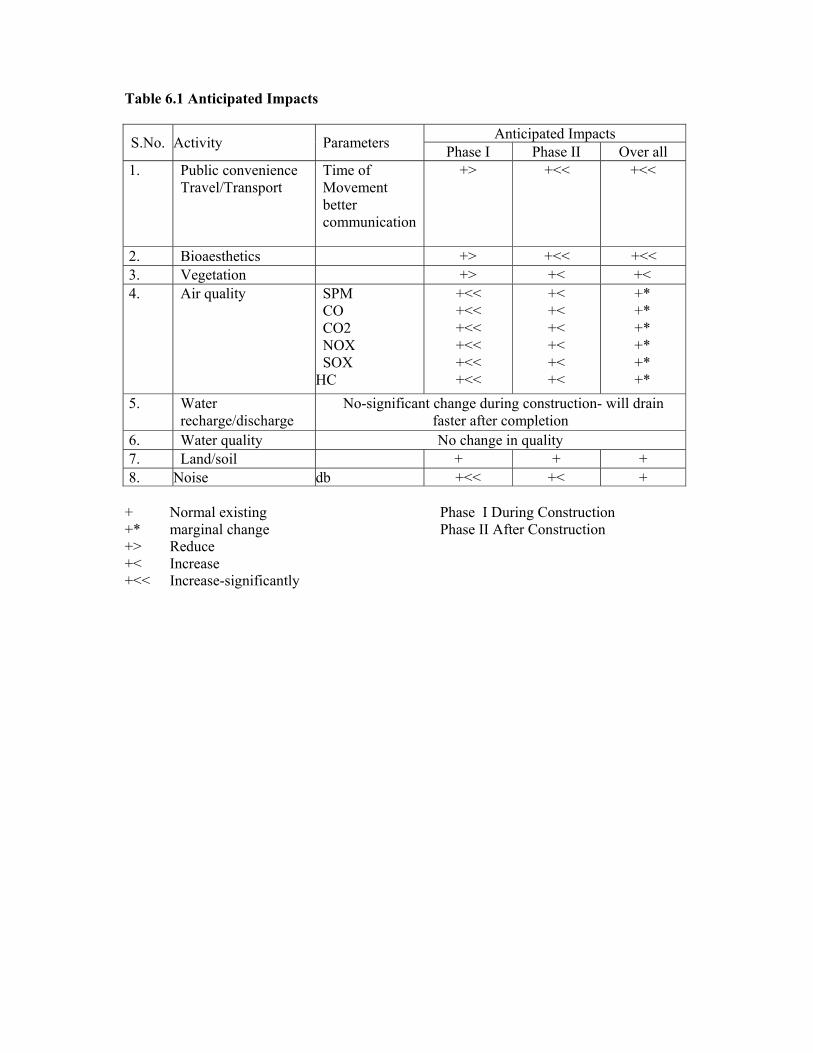
30
Table 6.1 Anticipated Impacts
Anticipated Impacts S.No. Activity Parameters Phase I Phase II Over all 1. Public convenience
Travel/Transport Time of Movement better communication
+> +<< +<<
2. Bioaesthetics +> +<< +<< 3. Vegetation +> +< +< 4. Air quality SPM
CO CO2 NOX SOX
HC
+<< +<< +<< +<< +<< +<<
+< +< +< +< +< +<
+* +* +* +* +* +*
5. Water recharge/discharge
No-significant change during construction- will drain faster after completion
6. Water quality No change in quality 7. Land/soil + + + 8. Noise db +<< +< +
+ Normal existing Phase I During Construction +* marginal change Phase II After Construction +> Reduce +< Increase +<< Increase-significantly

31
CHAPTER- 7
SIMMARY AND CONCLUSIONS
Environmental Impact Assessment of Kotabagh → Ranikota road in Ramnagar tehsil
of District Nainital was entrusted to AHEC, Indian Institute of Technology, Roorkee by the
Diversified Agricultural Support Project of Uttaranchal Govt. Basic data of the activities was
provided by State PWD and DASP. Additional information of base line data was collected
from the records of various organizations. Primary data of water quality, biological
environment and socio-economic environment was also collected. A cause effect network
method was adopted in determining the impacts for road during construction and after
construction. The impacts during construction will be for a short time and the stress on the
environment in terms of generation of dust, exhaust gases, uprooting of herbs and shrubs,
earth work will be small and will be assimilated in the pristine environment. The increase in
transport after construction will ease the problems of local population in terms of
communication and access to nearby market. The children, working population and women
will be benefited by the availability of all weather movable road. The movement of
automobiles though limited would generate dust and exhaust gases and would be a burden on
the air environment. This is a negative impact, but the quantity of this intervention will be
very negligible and can be negated vis-a-vis other positive impacts.
Some salient recommendations and mitigation measures are listed below:
i) There will be negligible effect on the environment by upgradation of the road. The
stress during construction can be negated in terms of short time for which the activity
will persist.
ii) The project will benefit the rural economy as the agricultural produce would reach
market/mandis quicker all the year round and in better condition, therefore fetching a
better price.
iii) The upgradation of road and construction of cross drainage will help the general
movement of population to places of work.
iv) Convenience to school children and women will go a long way in improving the
standards and opportunities for development.
v) There will be a marginal increase in the air pollutants due to vehicular movement but
32
this burden will be so small that the environment will not be stressed beyond its
power of resillience. The sinks of these pollutant around the road are so pronounced
(soil and vegetation sink) that the residence time in the environment will be
negligible.
vi) Aesthetic in general would improve.
Recommendation During construction, in narrow-section, the cutting of hill slopes is unavoidable. Great
care is necessary in stabilizing the hill slopes, vegetative stabilization methods may be
necessary to be followed.
The impact of upgradation over all will be positive.
33
References: 1. The Water (Prevention and Control of Pollution) Act., 1974 Govt. of India, Ministry
of Law, Justice and Company Affairs New Delhi 1974. 2. Environmental Impact Analysis, Jain, R.K., Urban, L.V. and Stacey, G.S., Van
Nostrand Reinhold Company, 1977. 3. Air (Prevention and Control of Pollution) Act., 1981, Eastern Book Agency,
Lucknow 1981. 4. Ecology, Impact Assessment and environment Planning Walter E. Westman., John
Wiley and Sons, Canada, 1985. 5. The Environment (Protection) Act, 1986. Ministry of Environment and Forests,
Department of Environment, Forests and Wild Loge New Delhi 1986. 6. International Laws, Trivedi, P.R., APH Publishing Corporation, New Delhi 1996. 7. Environmental Auditing., Srivastava, A.K. APH Publishing Corporation, New Delhi. 8. Natural Resources conservation. Trivedi, P.R., APH Publishing Corporation, New
Delhi. 9. Environment Impact Assessment, Impact Assessment Division, Ministry of
Environment and Forests, Govt. of India January 2001 Manual. 10. Environmental Impact Assessment, Barthwal, R.R., New Age International, New
Delhi 2002. 11. Environmental Impact Assessment (Practical Solutions to Recurrent Problems, David
P. Lawrence, Wiley Inter Science, New Jersey 2003. 12. Environment Impact Assessment. Srivastava, A.K., APH Publishing Corporation,
New Delhi 2003. 13. Sustainable Development of Water Resources – A Revisit Thatte, C.D. Proceedings
Symp. Hydrological Perspective for Sustainable Development., Vol. 1 (HYDESD), Development of Hydrology, IIT, Roorkee, Allied Publishers, New Delhi 2005.
74
4.4 Air (Prevention and Control of Pollution) Act, 1981 (Act No. 14 of 1981)
An Act to provide for prevention control and abatement of air pollution for the
establishment, with a view to carrying out the aforesaid purposes, of Boards, for
conferring on and assigning to such Boards powers and functions relating thereto and for
matters connected therewith
Whereas decisions were taken at the United Nations Conference on the Human
Environment held in Stockholm in June 1972, in which India participated, to take
appropriate steps for the preservation of the natural resources of the earth which, among
other things, include the preservation of the quality of air and control of air pollution;
And whereas it is considered necessary to implement the decisions aforesaid in so
far as they relate to the preservation of the quality of air and control of air pollution;
Be it enacted by Parliament in the Thirty-second Year of the Republic of India as
follows:-
Statement of Objective
In the United Nations Conference on Human Environment held in Stockholm in
June 1972, in which India participated, decisions were taken to take appropriate steps for
the preservation of natural resources of the earth which, among other things include the
preservation of the quality of air and control of air pollution. The Government of India
decided to implement these decisions of the said Conference in so far as they relate to the
preservation of the quality of air and control of air pollution.
The Air (Prevention and Control Act) 1981 has VII Chapters defining Chapter I,
(Preliminary), Chapter II (Central and State Boards for the Prevention and Control of Air
Pollution), Chapter III (Powers and Functions of Boards), Chapter IV (Prevention and
Control of Air Pollution), Chapter V (Funds, Accounts and Audit), Chapter VI (Penalties
and Procedure) and Chapter VII (Miscellaneous).
75
CHAPTER – I
PRELIMINARY
1. Short title, extent and commencement
This Act may be called the Air (Prevention and Control of Pollution) Act 1981
2. Definitions
The definitions of the Act (air pollution, approved appliance, approved fuel, automobile,
Board, Central Board (means the Central Board for the Prevention and Control of Water
Pollution constituted under Section 3 of the Water Act of 1974), Chimney, Control
equipment, emission, industrial plant, member occupier, prescribed, State Board (means
State Board of Water Pollution Control Act of 1974).
CHAPTER – II
CENTRAL AND STATE BOARD FOR THE PREVENTION AND
CONTROL OF AIR POLLUTION
3. Central Board for the Prevention and Control for Air Pollution
The Central Board for the Prevention and control of water pollution constituted
under Section 3 of the Water (Prevention and Control of Pollution) Act, 1974 (6 of 1974),
shall without prejudice to the exercise and performance of its powers and functions under
that Act, exercise the powers and perform the functions of the Central Board for the
Prevention and Control of Air Pollution under this Act.
4. State Boards for the Prevention and Control of Water Pollution to be State
Boards for the Prevention and Control of Air Pollution In any State in which the Water (Prevention and Control of Pollution) Act, 1974
is in force and State Government has constituted for that State a State Board for the
Prevention and Control of Water Pollution under Section 4 of that Act, such State Board
shall be deemed to be the State Board for the Prevention and Control of Air Pollution
constituted under Section 5 of this Act and accordingly that State Board for the
Prevention and Control of Water Pollution shall, without prejudice to the exercise and
76
performance of its powers and functions under that Act, exercise the powers and perform
that functions of the State Board for the Prevention and Control of Air Pollution under
this Act.
5. Constitution of State Boards
(1) In any State in which the Water (Prevention and Control of Pollution) Act, 1974
(6 of 1974), is not in force, or that Act is in force but the State Government has
not constituted a State Board for the Prevention and Control of Water Pollution
under that Act, the State Government shall, with effect such date as it may, by
notification in the Official Gazette, appoint, constitute a State Board for the
Prevention and Control of Air Pollution under such name as may be specified in
the notification, to exercise the powers conferred on, and perform the functions
assigned to, that Board under this Act.
(2) A State Board constituted under this Act shall consist of the following members
namely:-
(a) a Chairman, being a person having special knowledge or practical
experience in respect of matters relating to environmental protection, to be
nominated by the State Government:
Provided that the Chairman may be either whole-time or part-time as the
State Government may think fit;
(b) such number of officials, not exceeding five, as the State Government may
think fit, to be nominated by the State Government to represent that
Government;
(c) such number of persons, not exceeding five, as the State Government may
think fit, to be nominated by the State Government from amongst the
members of the local authorities functioning within the State;
(d) such member of non-officials, not exceeding three, as the State
Government may think fit, to be nominated by the State Government to
represent the interests of agriculture, fishery or industry or trade or labour
or any other interest which, in the opinion of that Government, ought to be
represented;
77
(e) two persons to represent the companies or corporations owned, controlled
or managed by the State Government, to be nominated by that
Government;
(f) a full-time member-secretary having practical experience in respect of
matters relating to environmental protection and having administrative
experience, to be appointed by the State Government:
Provided that the State Government shall ensure that not less than two of the
members are persons having special knowledge or practical experience in respect
of matters relating to the improvement of the quality of air or the prevention,
control or abatement of air pollution.
(3) Every State Board constituted under this Act shall be a body corporate with the
name specified by the State Government in the notification issued under sub-
section (1), having perpetual succession and a common seal with power, subject
to the provisions of this Act, to acquire and dispose of property and to contract,
and may by the said name sue or be sued.
6. Central Board to exercise the powers and perform the functions of a State
Board in the Union Territories
7. Terms and Condition of Service of members
A member of a State Board constituted under this Act, other than Member
Secretary shall hold office for a period of three years. The term shall come to on end as
soon as he ceases to hold the office of the State Government/Company/Corporation, by
virtue of which he was nominated. The member may at any time resign his office by
writing under his hand to Chairman of the State Board.
A casual vacancy shall be filled by a fresh nomination (for the remaining term)
A member shall be eligible for renomination but not more than two times.
8. Vacation of Seat by members
If a member under any clause has been disqualified his seat will be taken as
vacant
78
9. Meeting of the Board
The Board shall meet at least once in every 3 months.
10. Constitution of committees
A Board may constitute committees consisting of wholly or partially of members
and other persons as it may think fit.
11. A Board may associate any person whose assistance and advice it may desire to
obtain.
12. Vacancy in Board not to invalidate acts or proceedings
13. Member Secretary and officers of the State Board
1) The terms and conditions shall be such as may be prescribed,
2) Exercise such powers and perform such duties as may be prescribed,
3) A State Board may from time to time appoint any qualified person as
consultant
14. A State Board delegate to the Chairman, Member Secretary or any other officer,
such of its powers under the Act as it may deem necessary
CHAPTER – III
POWER AND FUNCTIONS OF BOARDS
15. Functions of Boards
1) Subject to the provisions of the Act, the main functions of the Central Board
shall be to improve the quality of air and to prevent, control or abate air
pollution in the country.
2) The Central Board may
(a) advise the Central Government on any matter concerning the
improvement of the quality of air and the prevention, control or
abatement of air pollution;
(b) plan and cause to be executed a nationwide programme for the
prevention, control or abatement of air pollution;
79
(c) co-ordinate the activities of the State Board and resolve disputes
among them;
(d) provide technical assistance and guidance to the State Boards,
carry out and sponsor investigations and research relating to
problems of air pollution and prevention, control or abatement of
air pollution;
(e) plan and organize the training of person engaged or to be engaged
in programmes for the prevention, control or abatement of air
pollution;
(f) organize through mass media a comprehensive programme
regarding the prevention, control or abatement of air pollution;
(g) collect, compile and publish technical and statistical data relating
to air pollution and measures devised for its effective prevention,
control or abatement and prepare manuals, codes or guides relating
to prevention, control or abatement of air pollution;
(h) lay down standards for the quality of air;
(i) collect and disseminate information in respect of matters relating
to air pollution;
(j) perform such other function as may be prescribed.
3) The Central Board may establish or recognize a laboratory or laboratories
to enable the Central Board to perform its functions under this section
efficiently.
4) The Central Board may-
(a) delegate any of its functions under this Act generally or specially
to any of the committees appointed by it;
(b) do such other things and perform such other acts as it may think
necessary for the proper discharge of its functions and generally
for the purpose of carrying into effect the purposes of this Act.
80
16. Functions of State Boards
(1) Subject to the provisions of this Act, the functions of a State Board shall be-
(a) to plan a comprehensive programme for the prevention, control or
abatement of air pollution and to secure the execution thereof;
(b) to advise the State Government on any matter concerning the
prevention, control or abatement of air pollution;
(c) to collect and disseminate information relating to air pollution;
(d) to collaborate with the Central Board in organizing the training of
persons engaged or to be engaged in programmes relating to
prevention, control or abatement of air pollution and to organize
mass-education programme relating thereto;
(e) to inspect, at all reasonable times, any control equipment,
industrial plant or manufacturing process and to give, by order,
such directions to such persons as it may consider necessary to
take steps for the prevention, control or abatement of air pollution;
(f) to inspect air pollution control areas at such intervals as it may
think necessary, assess the quality of air therein and take steps for
the prevention, control or abatement of air pollution in such areas;
(g) to lay down, in consultation with the Central Board and having
regard to the standards for the quality of air laid down by the
Central Board, standard for emission of air pollutants into the
atmosphere from industrial plants and automobiles or for the
discharge of any air pollutant into the atmosphere from any other
source whatsoever not being a ship or an aircraft:
(h) to advise the State Government with respect to the suitability of
any premises or location for carrying on any industry which is
likely to cause air pollution;
(i) to perform such other functions as may be prescribed or as may,
from time to time, be entrusted to it by the Central Board or the
State Government;
81
(j) to do such other things and to perform such other acts as it may
think necessary for the proper discharge of its functions and
generally for the purpose of carrying into effect the purposes of
this Act.
(2) A State Board may establish or recognize a laboratory or laboratories to
enable the State Board to perform its functions under this section
efficiently.
CHAPTER – IV
PREVENTION AND CONTROL OF AIR POLLUTION
19. Power to declare air pollution control areas
(1) The State Government may, after consultation with the State Board, by the
notification in the Official Gazette, declare in such manner as may be
prescribed, any area or areas within the State as air pollution control area for
the purpose of this Act.
(2) The State Government may, after consultation with the State Board, by
notification in the Official Gazette-
(a) alter any air pollution control area whether by way of extension or
reduction;
(b) declare a new air-pollution control area in which may be merged one or
more existing air pollution control areas or any part or parts thereof.
(3) If the State Government, after consultation with the State Board, is of opinion
that the use of any fuel, other than an approved fuel, in any air pollution
control area or part there of may cause or likely to cause air pollution, it may
prohibit the use of such fuel in such area with effect from such date as may be
specified.
(4) The State Government may after consultation with State Board by notification
direct that with effect from such date, no appliance, other than approved shall
be used in the premises situation air pollution control area.
82
20. Power to give instructions for ensuring standards for emission from
automobiles
21. Restrictions on use of certain industrial plant
No person without the previous consent operate any industrial plant for the
purpose of any industry specified in schedule in air pollution control area.
Every person to whom consent has been granted shall comply with the following
conditions:
(i) the control equipment of such specification as State Board may
approve shall be installed and operated
(ii) the existing control equipment shall be altered or replaced
according to the directions of State Board
(iii) the control equipment shall be kept at all times in good running
condition
(iv) chimneys of such specifications as the State Board may approve
shall be erected in such premises
(v) other conditions which Board may specify.
22. Persons carrying on industry not to allow emission of air pollutants in excess
of standards laid down by State Board
No person carrying on industry in any air pollution control area shall discharge or
cause or permit to be discharged the emission of any air pollutant in excess of the
standards laid down by State Board.
23. Furnishing of information to State Board and other agencies in certain cases
(1) Where in any air pollution control area the emission of any air pollutant
into the atmosphere in excess of the standards laid down by the State
Board occurs or is apprehended to occur due to accident or other
unforeseen act or event, the person in charge of the premises from where
such emission occurs or is apprehended to occur shall forthwith intimate
83
the fact of such occurrence or the apprehension of such occurrence to the
State Board and to such authorities or agencies as may be prescribed.
(2) On receipt of information with respect to the fact or the apprehension of
any occurrence of the nature whether through intimation under that sub-
section or otherwise, the State Board and the authorities or agencies shall,
as early as practicable, cause such remedial measures to be taken as are
necessary to mitigate the emission of such air pollutants.
24. Power of entry and inspection
(1) Subject to the provisions of this section, any person empowered by a state
Board in this behalf shall have a right to enter, at all reasonable times with
such assistance as he considers necessary, any place for the purpose of
performing any of the functions of the State Board entrusted to him.
(2) Every person carrying on any industry specified in the Schedule and every
person operating any control equipment or any industrial plant, in an air
pollution control area shall be bound to render all assistance to the person
empowered by the State Board under sub-section (1) for carrying out the
functions under that sub-section and if he fails to do so without any reasonable
cause or excuse, he shall be guilty of an offence under this Act.
25. Power to obtain information
For carrying out the functions entrusted to State Board from the occupier or any
other person, the State Board will have the right to inspect the premises where
such industry, control equipment or industrial plant is being carried on or
operated.
26. Power to take samples of air or emission and procedure to be followed in
connection there with
(1) A State Board or an officer empowered shall have power to take, for the
purpose of analysis, sample of air or emission from any chimney, flue or duct
or any other outlet is such member as may be prescribed.
84
(2) The results of any analysis of sample of emission taken shall not be admissible
in evidence in legal proceedings unless the provisions of (3) and (4) are
complied with.
(3) The person taking the sample shall
a) serve on the occupier or his agent a notice, in such a form as may be
prescribed of his intentions to have it so analyzed;
b) in the presence of occupier or his agent, collect a sample of emission
for analysis;
c) cause the sample to be placed in a container which shall be marked and
sealed and shall also be signed by both;
d) send, without delay the container to the laboratory established or
recognized by State Board.
27. Report of the result of analysis on samples taken
(1) Where a sample of emission has been sent for analysis to the established and
recognized laboratory shall analyze the sample and submit a report in
triplicate in the prescribed form.
(2) One copy of the report shall be sent to the occupier, another copy shall be
preserved for the court and the third copy shall be kept by the Board.
(3) The same procedure will be followed for reports taken by Board in the
absence of occupier.
28. State Air Laboratory
(1) The State Government may
a) establish one or more State Air Laboratories or
b) specify one or more Laboratories as State Laboratories to carry out the
functions entrusted to the State Air Laboratory under this act.
(2) State Government may after consultation with the State Board, make rules
prescribing
a) the functions of State Laboratory;
b) procedure for the submission of samples of air for analysis or tests
85
c) such other matters expedient to enable the laboratory to carryout its
functions.
29. Analysts
(1) The State Government by notification appoint such persons as it think fit
and the prescribed qualifications to be Government analysts
(2) The State Government appoint such persons, having the prescribed
qualifications for the purpose of analysis to any laboratory established.
30. Reports of analysis
31. Appeals
CHAPTER – V
FUNDS, ACCOUNTS AND AUDIT
32. Contributions by Central Govt.
33. Fund of Board
34. Budget
35. Annual Report
36. Accounts and Audit
CHAPTER – VI
PENALTIES AND PROCEDURES
37. Failure to comply with provisions of Section 21 or Section 22 or with orders or
directions issued under the Act, shall in respect of each failure be punishable with
imprisonment for a term to three months or with fine which can extend to Rs.
10,000.00 or with both, in case of failure continues, with an additional fine which
may extend to Rs. 100/- per day during which, the failure continues.
If the failure continues beyond a period of one year, the offensive will be
punishable with imprisonment for a term which may extend to six months.
Penalties for other certain acts, contravention of certain provisions, offence by
86
companies, Government offices and protection against action taken in good faith
are stipulated under Sections 38-42.
43. Congnizance of offences
44. Members officers and employees of Board to be Public Servants
45. Reports and Returns
46. Bar of Jurisdiction
CHAPTER – VII
MISCELLANEOUS
47. Power of State Government to supersede State Board
If at any time the State Government is of opinion-
(a) that a State Board constituted under this Act has persistently made
default in the performance of the functions imposed on it by or under
this Act, or
(b) that circumstances exist which render it necessary in the public interest
to do, the State Government may, by notification in the Official
Gazette, supersede the State Board for such period, not exceeding six
months, as may be specified in the notification.
48. Special provisions in the case of supersession of the Central Board or State
Boards constituted under the Water Act, 1974
49. Dissolution of State Boards constituted under the Act as and when the Water Act
comes into force in any State the Board constituted under Air Act shall stand
dissolved.
50. Power to amend the schedule
51. Maintenance of register
52. Effect of other laws
53. Power of Central Government to make rules and
54. Power of State Government to make rules
(Lectures 17, 18)
87
4.5 THE ENVIRONMENT (PROTECTION) ACT, 1986 No. 29 of 1986
[23rd May, 1986]
An Act to Provide for the Protection and Improvement of Environment and for
Matters Connected therewith
WHEREAS decisions were taken at the United Nations Conference on the Human
Environment held at Stockholm in June, 1972 in which India participated, to take
appropriate steps for the protection and improvement of human environment;
AND WHEREAS it is considered necessary further to implement the decisions
aforesaid in so far as they relate to the protection and improvement of environment and
the prevention of hazards to human beings, other living creatures, plants and property;
BE it enacted by Parliament in the Thirty seven Year of the Republic of India as
follows:
CHAPTER – I
PRELIMINARY
1. (1) This Act may be called the Environment (Protection) Act, 1986.
(2) It extends to the whole of India.
(3) It shall come into force on such date as the Central Government may, by
notification in the Official Gazette, appoint and different dates may be appointed for
different provisions of this Act and for different areas.
2. Definitions
In this unless the context otherwise requires
(a) environment, (b) environmental pollutant, (c) environmental pollution (d)
handling, (e) hazardous substance (f) occupier (g) prescribed.
88
CHAPTER – II
GENERAL POWERS OF THE CENTRAL GOVERNMENT
3. (1) The Central Government shall have the power to take all such measures as
it deems necessary for the purpose of protecting and improving the quality of
the environment and preventing, controlling and abetting environmental
pollution.
(2) In particular, such measures may include measures with respect to all or any
of the following matters, namely
(i) co-ordination of actions by the State Government officers and
other authorities;
(ii) planning and execution of a nation-wide programme for the
prevention, control and abatement of environmental pollution;
(iii) laying down standards for the quality of environment in its various
aspects;
(iv) laying down standards for emission or discharge of environmental
pollutants from various sources whatsoever;
(v) restriction of areas in which any industries operations, or processes
or class of industries, operations or processes shall not be carried
out or shall be carried out subject to certain safeguards;
(vi) laying down procedures and safeguards for the prevention of
accidents which may cause environmental pollution and remedial
measures for such accidents;
(vii) laying down procedures and safeguards for the handling of
hazardous substances;
(viii) examination of such manufacturing processes, materials and
substances as are likely to cause environmental pollution;
(ix) carrying out and sponsoring investigations and research relating to
problems of environmental pollution;
(x) inspection of any premises, plant, equipment, machinery,
manufacturing or other processes, materials or substances and
89
giving, by order, of such directions to such authorities, officers or
persons as it may consider necessary to take steps for the
prevention, control and abatement of environmental pollution;
(xi) establishment or recognition of environmental laboratories and
institutes to carry out the functions entrusted to such environmental
laboratories and institutes under this Act;
(xii) collection and dissemination of information in respect of matters
relating to environmental pollution;
(xiii) preparation of manuals codes or guides relating to the prevention
control and abatement of environmental pollution;
3. The Central Government may constitute an authority to exercise the powers
and perform the functions as mentioned in the order
4. (a) The Central Govt. may appoint officers with such designations as it thinks
fit for the purposes of this Act and may entrust to them such of the powers
and functions under this act as it may deem fit.
(b) The officers appointed under subsection (1) shall be subject to the general
control and direction of the Central Govt. or, if so directed by that Govt.
also of the authority, constituted under subsection (3) of section 3 or of
any other authority or officer.
5. The Central Govt. may, in the exercise of its powers and performance of its
functions under this Act, issue directions in writing to any person, officer or
any authority and such person, shall be bound to comply with such directions.
6. (1) The Central Government may make rules in respect of all or any of the
matters referred to in section 3:
(a) the standards of quality of air, water or soil for various areas and
purposes;
(b) the maximum allowable limits of concentration of various
environmental pollutants (including noise) for different areas;
(c) the procedures and safeguards for the handling of hazardous
substances;
90
(d) the prohibition and restrictions on the handling of hazardous
substances in different areas;
(e) the prohibition and restrictions on the location of industries and the
carrying on of processes and operations in different areas;
(f) the procedures and safeguards for the prevention of accidents which
may cause environmental pollution and for providing for remedial
measures for such accidents.
CHAPTER – III
PREVENTION, CONTROL AND ABATEMENT OF ENVIRONMENTAL
POLLUTION
7. No person carrying on any industry, operation or process shall discharge or
emit or permit to be discharged or emitted any environmental pollutant in
excess of such standards as may be prescribed.
8. No person shall handle or cause to be handled any hazardous substance except
in accordance with such procedure and after complying with such safeguards
as may be prescribed.
9. (1) Where the discharge of any environmental pollution in excess of the
prescribed standards occurs or is apprehended to occur due to any accident
or other unforeseen act or event, the person responsible for such discharge
and the person in charge of the place at which such discharge occurs or is
apprehended to occur shall be bound to prevent or mitigate the
environmental pollution caused as a result of such discharge and shall also
forthwith:-
(a) intimate the fact of such occurrence or apprehension of such
occurrence; and
(b) be bound, if called upon, to render all assistance, to such authorities or
agencies as may be prescribed.
(2) On receipt of information with respect to the fact or apprehension of any
occurrence of the nature referred to in sub-section (1), shall as early as
91
practicable, cause such remedial measures to be taken as are necessary to
prevent or mitigate the environmental pollution.
10. (1) Subject to the provisions of this section, any person empowered by the
Central Government in this behalf shall have a right to enter, at all
reasonable times with such assistance as he considers necessary, any
place:-
(a) for the purpose of performing any of the functions of the Central
Government entrusted to him;
(b) for the purpose of determining whether and if so in what manner, any
such functions are to be performed or whether any provisions of this
Act or the rules made there under or any notice, order, direction or
authorization served, made, given or granted under this Act is being or
has been complied with;
(c) for the purpose of examining and testing any equipment, industrial
plant, record, register, document or any other material object or for
conducting a search of any building in which he has reason to believe
that an offence under this Act or the rules made there under has been
or is being or is about to be committed and for seizing any such
equipment, industrial plant, record, register, document or other
material object if he has reasons to believe that it may furnish evidence
of the commission of an offence punishable under this Act or the rules
made there under or that such seizure is necessary to prevent or
mitigate environmental pollution.
(2) Every person carrying on any industry, operation or process or handling
any hazardous substance shall be bound to render all assistance to the
person empowered by the Central Government for carrying out the
functions under that sub-section and if he fails to do so without any
reasonable cause or excuse, he shall be guilty of an offence under this Act.
(3) If any person willfully delays or obstructs any person empowered by the
Central Government in the performance of his functions, shall be guilty of
an offence under this Act.
92
11. (1) The Central Government or any officer empowered by it in this behalf
shall have power to take, for the purpose of analysis, samples of air, water,
soil or other substance from any factory, premises or other place in such
manner as may be prescribed.
(2) The result of any analysis of a sample taken shall not be admissible in
evidence in any legal proceeding unless the provisions of section (3) or (4)
are complied with.
(3) Subject to the provisions of sub-section (4), the person taking the sample
under sub-section (1) shall:-
(a) serve on the occupier or his agent or person in charge of the place, a
notice, in such form as may be prescribed, of his intention to have it so
analysed;
(b) in the presence of the occupier or his agent or person, collect a sample
for analysis.
(c) cause the sample to be placed in a container or containers which shall
be marked and sealed and shall also be signed both by the person
taking the sample and the occupier or his agent or person;
(d) send without delay, the container or the containers to the laboratory
established or recognized by the Central Government.
(4) When a sample is taken for analyses and the person taking the sample
serves on the occupier, a notice then:-
(a) in case where the occupier or his agent absents himself, the person
taking the sample will collect the sample, seal and sign and send for
analysis
(b) if the occupier refuses to sign the marked contains the container shall
be signed by the person taking the sample and the containers shall be
sent to Laboratory for analysis.
12. (1) The Central Government may, by notification in the Official Gazette:-
(a) establish one or more environmental laboratories;
(b) recognize one or more laboratories or institutes as environmental
laboratory under this Act.
93
(2) The Central Government may, make rules specifying:-
(a) the functions of the environmental laboratory;
(b) the procedure for the submission of the said laboratory of samples of
air, water, soil or other substance for analysis or tests, the form of the
laboratory report thereon and the fees payable for such report;
(c) such other matters as may be necessary or expedient to enable that
laboratory to carry out its functions.
13. The Central Government may by notification in the Official Gazette, appoint or
recognize such persons as it thinks fit and having the prescribed qualifications to
be Government Analysts for the purpose of analysis of samples of air, water, soil
or other substance sent for analysis to any environmental laboratory established or
recognized under section 12.
14. Any document purporting to be a report signed by a Government analyst may be
used as evidence of the facts stated therein in any proceeding under this Act.
15. (1) Whoever fails to comply with or contravenes any of the provisions of this
Act, or the rules made or orders or directions issued there under, shall, in
respect of each such failure or contravention, be punishable with
imprisonment for a term which may extend to five years or with fine
which may extend to one lakh rupees, or with both and in case the failure
or contravention continues, with additional fine which may extend to five
thousand rupees for every day during which such failure or contravention
continues after the conviction for the first such failure or contravention.
(2) If the failure or contravention referred to in sub-section (1) continues
beyond a period of one year after the date of conviction, the offender shall
be punishable with imprisonment for a term, which may extend to seven
years.
16. Where any offence under this Act has been committed by a company, every
person who, at the time the offence was committed was directly in charge of, and
was responsible to, the company for the conduct of the business of the company,
as well as the company, shall be deemed to be guilty of the offence and shall be
liable to be proceeded against and punished accordingly.
94
17. (1) Where an offence under this Act has been committed by and department
of government, the head of the department shall be deemed to be guilty of
the offence and shall be liable to be proceeded against and punished
accordingly.
(2) Where an offence under this Act has been committed by a Department of
Government and it is proved that the offence has been committed with the
consent or connivance of, or is attributable to any neglect on the part of,
any officer, other than the Head of the Department, such officer shall also
be deemed to be guilty of that offence and shall be liable to be proceeded
against and punished accordingly.
CHAPTER – IV
MISCELLANEOUS
18. No suit, prosecution or other legal proceeding shall be against the Government or
any officer or other employee of the Government or which is done or intended to
be done in good faith in pursuance of this Act or the rules made or orders or
directions issued there under.
19. No court shall take cognizance of any offence under this Act except on a
complaint made by:-
(a) the Central Government or any authority or officer authorized in this
behalf by that Government; or
(b) any person who has given notice of not less than sixty days, in the manner
prescribed, of the alleged offence and of his intention to make a complaint,
to the Central Government or the authority or officer authorized as
aforesaid.
20. The Central Government in relation to functions under this Act can obtain
information, reports returns, statistics and accounts from, such persons, officers
and State Government.
21. All officers, constituted under Section 3, shall be deemed to be public servants
(Section 21 of the IPC)
95
22. No civil court shall have jurisdiction to entertain any suit or proceedings in
respect of action taken or direction issued by Central Government/authority in
pursuance of power conferred by this Act.
23. The Central Government can delegate its powers/functions to any officer, State
Government or authority.
24. The provisions of the Act shall have effect not with standing any thing in -
consistent contained in any enactment other than this Act.
25. The Central Government may make rules for carrying out the purpose of this Act.
(a) standards in excess of which environmental pollutants shall not be
discharged or emitted
(b) the procedure and the safeguards in compliance with which hazardous
substances shall be handled
(c) the authorities/agencies to which intimation of occurrence or apprehension
of occurrence of the discharge of any environmental pollution in excess of
the prescribed standards shall be given and to whom assistance shall be
bound to be rendered
(d) the manner in which samples of air, water, soil or the other substances for
the purpose of analysis shall be taken.
(e) the form in which notice of intention to have a sample analysed shall be
served
(f) the functions of environmental laboratories, the procedure for the
submission of samples for analysis, the form of laboratory report
(g) the qualifications of Government analysts appointed or recognized for the
purpose of analysis of samples
(h) the authority to whom any reports, returns, statistics, accounts and other
information shall be furnished.
(Lectures 19, 20)
96
4.6 Provisions of Environmental Impact Assessment Under Environmental (Protection) Act, 1986
Ministry of Environment Forests, Government of India have taken several policy
initiatives and made provisions of Water (Prevention and Control) Act, 1974; Air
(Prevention and control of pollution) Act, 1981 and Environment (Protection) Act,
1986. These acts are aimed in controlling environmental pollution with legislative
provisions to prevent exploitation of natural resources and to promote integration of
environmental concerns. One such initiative is notification on Environmental Impact
Assessment issued on 27th January 1994 under the provisions of Environment Protection
Act.
The salient features of the notification are given below:
Environment Impact Assessment Notification
Ministry of Environment and Forests
Notification
New Delhi, the 27th January, 1994
(incorporating amendments made on 04/05/1994, 10/04/1997, 27/01/2000, 13/12/2000,
01/08/2001 and 21/11/2001)
1. Note: A notification, under clause (a) of subrule (3) of rule 5 of the EPA Rules,
1986 (SO.60(E)) was issued by MOEF, Government of India inviting objections
from the public within 60 days from the date of notification, against the intentions
of the Central Government to impose restriction and prohibitions on the
expansion and modernization of any activity or new projects being undertaken in
any part of India unless environmental clearance has been accorded by the Central
Government or the State Government in accordance with procedures specified in
the notification, was published as SO NO. 80(E) dated 28th January 1993.
All objections received were duly considered.
The Central Government, in exercise of the powers conferred by sub-section (1)
and clause (v) of sub-section (2) of Section (3) of the Environmentation Protection Act,
Environmental Protection Rules, 1986, directed that on the form and date of publication
97
of notification in official Gazette, expansion or modernization of any activity (if pollution
load is to exceed the existing one), or new projects listed in Schedule - I to the
notification, shall not be undertaken in any part of India unless it has been accorded
Environmental Clearance by Central Government.
2. Requirements and Procedures for Seeking Environmental Clearance of
Projects
I. a) Any person who desires to undertake any New Project in any part of India
or the expansion or modernization of any existing industry or project listed in
Schedule – I, shall, submit an application to the Secretary, Ministry of
Environment and Forests, New Delhi
The application shall be made in the proforma specified in Schedule –II
of this notification and shall be accompanied by a project report which, should
include an Environmental Impact Assessment Report, an **Environmental
Management Plan and details of public hearing as specified in Schedule – IV**
prepared in accordance with the guidelines issued by Central Government in the
MOEF from time to time (public hearing is not required in respect of (i) small
scale industrial undertakings located in (a) notified/designated industrial
areas/industrial estates (b) areas earmarked for industries under the jurisdiction of
industrial development authorities, (ii) widening and strengthening of highways,
iii) mining projects (major minerals) with lease areas upto 25 ha. iv) units located
in export processing zones, special economic zones and v) modification existing
irrigation projects).
b) Cases rejected due to submission of inadequate data and plans may be
reviewed as and when submitted with complete data and plans submission of
incomplete data or plans for the second time would itself be a sufficient reason for
the Impact Assessment Agency to reject the case summarily.
II. In case of the following site specific projects:
a) mining;
b) pit head, thermal power stations
98
c) hydro power major irrigation projects and/or combination
including flood control
d) ports and harbours (excluding minor ports)
e) prospecting and exploration of major minerals in areas > 500 ha.
The project authorities will intimate the location of the project site
to the Central Government MOEF while initiating any
investigation or surveys. The Central Government MOEF will
convey a decision regarding suitability or otherwise of the
proposed site within a maximum period of 30 days. The said site
clearance shall be granted for a sanctioned capacity and shall be
valid for five year for commencing the construction, operation or
mining.
III. a) The reports submitted with the application shall be evaluated by Impact
Assessment Agency (IAA). The IAA may consult experts (Schedule – III). The
IAA will be MOEF.
a) The committee of experts shall have right of entry and inspection of the
site at any time prior to, during or after the commencement of the
operations relating to the project.
b) The IAA shall prepare a set of recommendations based on technical
assessment of documents and data furnished by project authorities,
supplemented by data collected during visit to the sites if undertaken and
details of public hearing.
The Assessment will be completed within a period of 90 days from the receipt of
requisite documents and data from project authorities and decision conveyed
within 30 days thereafter. The clearance granted shall be valid for a period of five
years for commencement of construction or operation of project. No construction
work, preliminary or otherwise, relating to setting up of the project may be
undertaken till the clearance is obtained.
IV. In order to enable the Impact Assessment Agency to monitor effectively
the implementation of the recommendations and conditions subject to
99
which the Environmental clearance has been given, the project authorities
shall submit a half yearly report to the IAA, subject to the public interest,
the IAA shall make compliance reports publically available.
V. If no comments from IAA are received within time limit, the project
would be deemed to have been approved as proposed by project
authorities.
3. Nothing contained in this notification shall apply to
a) any item falling under entry No. 3 (ports harbours, air ports) 17 (tourism
projects) and 20 (mining projects) of Schedule – I to be located in the
areas covered by the Notification of February 1989, February 1991, June
1991 and May 1992.
b) any items falling under entry Nos. 1 – 5, 9 – 10, 13, 16, 18, 19, 21, 25 and
27 of Schedule – I if the investment is less than 50 crores (marked *)
c) any item reserved for Small Scale Industries (SSI) sector with investment
less than 1.0 crore.
d) defence related road construction projects in border areas.
e) any item falling under entry 8 of Schedule – I (Bulk drugs and
Pharmaceuticals) covered by the notification GSR 1037 (E) dated
December 5, 1989.
4. Concealing factual data or submission of false, misleading data/reports, decisions
or recommendations would lead to the project being rejected. Approval if granted
earlier on the basis of false data would be revoked.
[No. 2-12013/4/89-1A-1]
100
Schedule – I
List of Projects Requiring Environmental Clearance From
The Central Government
* 1. Nuclear Power and related projects such as Heavy Water Plants, nuclear fuel
complex, Rare Earths.
* 2. River valley projects including hydel power, major irrigation and their
combination including flood control.
* 3. Ports, Harbours, Air Ports (except minor ports and harbours)
* 4. Petroleum Refineries include crude and product pipelines.
* 5. Chemical Fertilisers (Nitrogenous and Phosphatic other than single
superphosphate)
6. Pesticides (technical)
7. Petrochemical complexes (both olefinic and aromatic) and petrochemical
intermediates such as DMT, caprolactum, LAB etc. and production of basic
plastics such as LLDPE, HDPE, PP, PVC.
8. Bulk drugs and pharmaceuticals
* 9. Exploration for oil and gas and their production, transportation and storage.
* 10. Synthetic Rubber
11. Asbestos and asbestos products.
12. Hydrocyanic acid and its derivatives.
*13. a) Primary metallurgical industries (production of iron and steel, aluminum,
copper, zinc, lead and ferroalloys)
b) Electric arc furnaces (mini steel plates)
14. Chlor-alkali industry
15. Integrated paint complexes including manufacture of resins and basic raw
materials required in manufacture of paints.
* 16. Viscose staple fibres and filament yarn.
17. All tourism projects between 200 m – 500 m of High Water line and at locations
with an elevation of > 1000 m with investment of > Rs. 5.0 crores
101
*18. Storage batteries integrated with manufacture of oxides of lead and lead antimony
alloys
19. Thermal Power plants
20. Mining projects (major minerals)* with leases > 5 Ha.
* 21. Highway projects, **except projects related to improvement works include
widening and strengthening of roads with marginal land acquisition along the
existing alignments provided it does not pass through ecologically sensitive areas
such as National Parks, Sanctuaries, Tiger Reserves, Reserve Forests**
22. Tarred roads in Himalyas and forest areas
23. Distilleries
24. Raw skin and hides
* 25. Pulp, paper and newsprint
26. Dyes
27. Cement
28. Foundries (individual)
29. Electroplating
30. Meta aminophenol
The MOEF vide notification dated 7th July 2004, included the new construction at
Sl. No. 31 in the above notification of 1994. With this notification it is mandatory for
construction fulfilling any one of the following requirements to get the environmental
clearance from MOEF.
a) Any construction project including new township, settlement colonies,
commercial complexes, hotel complexes, hospitals and office complexes
for 1000 (one thousand) persons or more or discharging sewage of 50,000
(fifty thousand) liters per day or more or with an investment of Rs.
50,00,00,000 (Rupees fifty crors) or above.
b) Any industrial estate falling entry 32 of Schedule – I including industrial
estate accommodating industrial units in an area of 50 hectares or below
but excluding the industrial estates irrespective of area if their pollution
potential is high.
102
SCHEDULE – II
APPLICATION FORM
1. a) Name and Address of the Project Proposed:
b) Location of Project
Name of the place
District, Tehsil
Latitude/Longitude
Nearest Airport/Railway Station
c) Alternate sites examined and reasons for selecting the site
d) Does the site conform to stipulated land use plan:
2. Objectives of the project
3. a) Land requirement:
Agricultural land
Forest land and density of vegetation
Other (specify)
b) i) Land use, in the catchment within 10 km radius of proposed site
ii) Topography of the area indicating gradient, aspects and altitude
iii) Erodibility classification of the proposed land
c) Pollution sources existing with in 10 km radius and their impact on quality
of air, water and land.
d) Reserve/Monument/heritage site/reserve forest
e) Distance of the nearest National Park/ Sanctuaries/Biosphere Reserve/
Monument/ Heritage site/ Reserve forest
f) Rehabilation plan for quarries/borrow areas:
g) Green belt plan
h) Compensatory afforestation plan
4. Climate and Air Quality
a) Wind Rose at site:
b) Maximum/Minimum/Mean annual temperature
c) Frequency of inversion
103
d) Frequency of cyclones/Tornadoes/Cloudburst
e) Ambient air quality data:
f) Nature and concentration of emission of SPM, Gas (CO, CO2, NOx, CHn
etc) from the project
5. Water balance:
a) Water balance at site:
b) Lean season water availability
Water requirement
c) Source to be tapped with competing users (River, Lake, Ground, Public
Water Supply):
d) Water Quality:
e) Changes observed in quality and quantity of ground water in the last five
years and present charging and extraction details
f) i) Quantum of waste water to be released with treatment details:
ii) Quantum of quality of water in the receiving body before and after
disposal of wastes
iii) Quantum of waste water to be released on land and type of land
g) i) Details of reservoir water quality with necessary catchment
treatment plan.
ii) Command Area Development Plan
6. Solid Wastes
a) nature and quantity of solid waste generated
b) solid waste disposal method
7. Noise and Vibrations
a) sources of noise and vibrations
b) ambient noise level
c) noise and vibration control measures proposed
d) subsidence problem if any with control measures
8. Power requirement indicating source of supply complete environmental details to
be furnished separately if captive power unit proposed
9. Peak labor force to be deployed giving details of:
104
- Endemic health problems in the area due to waste water/air/soil borne
diseases:
- Health care system existing and proposed:
10. a) Number of villages and population to be displaced:
b) Rehabilitation master plan:
11. Risk Assessment Report and Disaster Management plan:
12. a) Environmental Impact Assessment
b) Environmental Management plan
c) Detailed feasibility report
d) Duly filled in questionnaire
13. Details of Environmental Management Cell
I hereby give above an undertaking that the data and information given above are
due to the best of my knowledge and belief and I am aware that if any part of the
data/information submitted is found to be false or misleading at any stage, the project be
rejected and clearance given if any, to the project is likely to be revoked at our risk and
cast.
Signature of the applicant
Date:
Place:
105
Schedule – III
Composition of the Expert Committees for Environmental Impact Assessment
1. The committee will consist of experts in the following disciplines
i) ECO System Management
ii) Air/Water Pollution Control
iii) Water Resources Management
iv) Flora/Fauna Conservation and Management
v) Land use planning
vi) Social Science/rehabilitation
vii) Project appraisal
viii) Ecology
ix) Environmental Health
x) Subject Area Specialist
xi) Representatives of NGOs/persons concerned with environmental issues
2. Chairman will be an outstanding and experienced ecologist or environmentalist or
technical professional with wide managerial experience in the relevant
development sector
3. The representative of Impact Assessment Agency will act as Member Secretary
4. Chairman and members will serve in their individual capacities except those
specifically nominated as representatives.
5. The membership of a committee shall not exceed 15.
SCHEDULE – IV
PROCEDURE FOR PUBLIC HEARING
1. Process of Public Hearing – Whoever apply for environmental clearance of
projects, shall submit to concerned State Pollution Control Board 20 sets of
following documents:
i) Executive summary containing salient features of the project both in
English and local language
106
ii) Form XII prescribed under Water (prevention and control of pollution)
rules, 1975 where discharge of waste water is required
iii) Form I prescribed under Air (prevention and control of pollution) under
Territory rules, 1983 where discharge of emissions are involved
iv) Any other document, which is necessary in the opinion of the Board for
final disposal of the application
2. Notice of Public Hearing:
i) The State Pollution Control Board shall cause a notice for Public Hearing
which shall be published it at least two newspapers, mentioning date, time
and place. Suggestion and views shall be invited within 30 days.
ii) All persons including residents, environmental groups, likely to be
affected can participate and or make oral/written suggestions
3. Composition of Public Hearing Panel:
Panel way consist of the following
i) Representative of Pollution Control Board
ii) District collector or his nominee
iii) Representative of State Government dealing with environment
iv) Three representatives of local bodies
v) Three senior citizens of the area nominated by D.C.
4. Time Period. The Public Hearing shall be completed within 60 days from the
date of receipt of complete documents.
(Lectures 21)
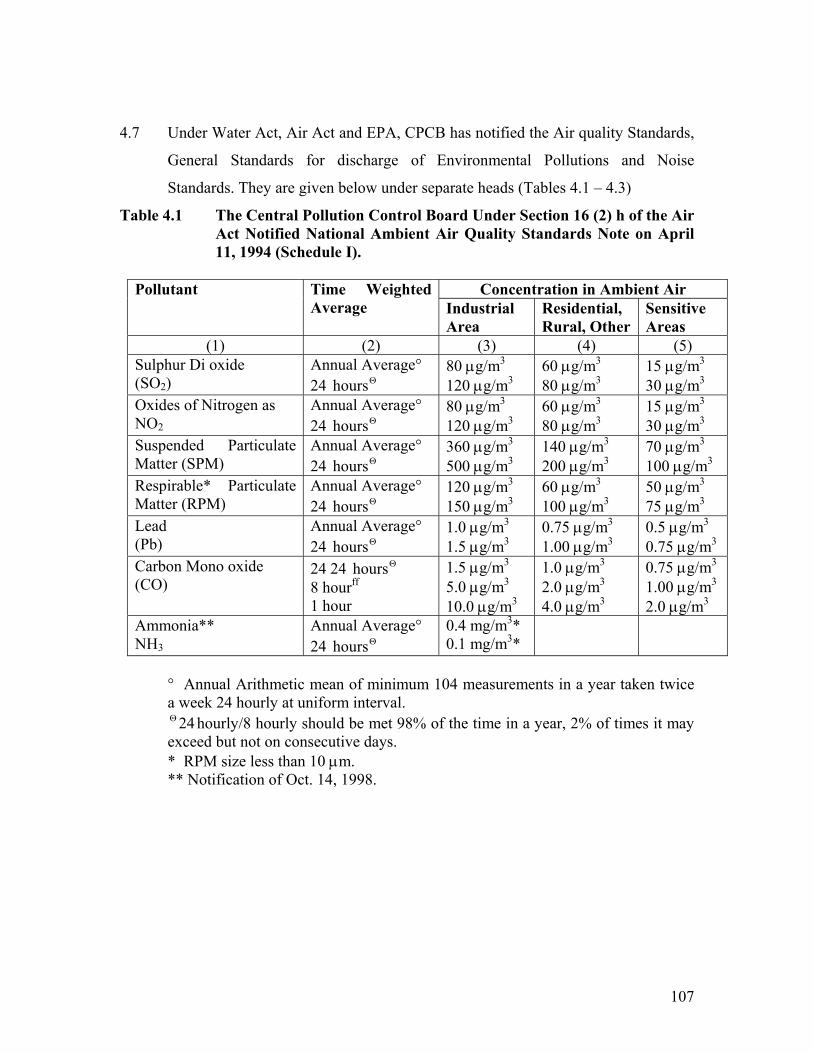
107
4.7 Under Water Act, Air Act and EPA, CPCB has notified the Air quality Standards,
General Standards for discharge of Environmental Pollutions and Noise
Standards. They are given below under separate heads (Tables 4.1 – 4.3)
Table 4.1 The Central Pollution Control Board Under Section 16 (2) h of the Air Act Notified National Ambient Air Quality Standards Note on April 11, 1994 (Schedule I).
Concentration in Ambient Air Pollutant Time Weighted
Average Industrial Area
Residential, Rural, Other
Sensitive Areas
(1) (2) (3) (4) (5) Sulphur Di oxide (SO2)
Annual Average° 24 Θhours
80 µg/m3 120 µg/m3
60 µg/m3 80 µg/m3
15 µg/m3 30 µg/m3
Oxides of Nitrogen as NO2
Annual Average° 24 Θhours
80 µg/m3 120 µg/m3
60 µg/m3 80 µg/m3
15 µg/m3 30 µg/m3
Suspended Particulate Matter (SPM)
Annual Average° 24 Θhours
360 µg/m3 500 µg/m3
140 µg/m3 200 µg/m3
70 µg/m3 100 µg/m3
Respirable* Particulate Matter (RPM)
Annual Average° 24 Θhours
120 µg/m3 150 µg/m3
60 µg/m3 100 µg/m3
50 µg/m3 75 µg/m3
Lead (Pb)
Annual Average° 24 Θhours
1.0 µg/m3 1.5 µg/m3
0.75 µg/m3 1.00 µg/m3
0.5 µg/m3 0.75 µg/m3
Carbon Mono oxide (CO)
24 24 Θhours 8 hourff 1 hour
1.5 µg/m3 5.0 µg/m3
10.0 µg/m3
1.0 µg/m3 2.0 µg/m3
4.0 µg/m3
0.75 µg/m3 1.00 µg/m3
2.0 µg/m3 Ammonia** NH3
Annual Average° 24 Θhours
0.4 mg/m3* 0.1 mg/m3*
° Annual Arithmetic mean of minimum 104 measurements in a year taken twice a week 24 hourly at uniform interval.
24Θ hourly/8 hourly should be met 98% of the time in a year, 2% of times it may exceed but not on consecutive days. * RPM size less than 10 µm. ** Notification of Oct. 14, 1998.
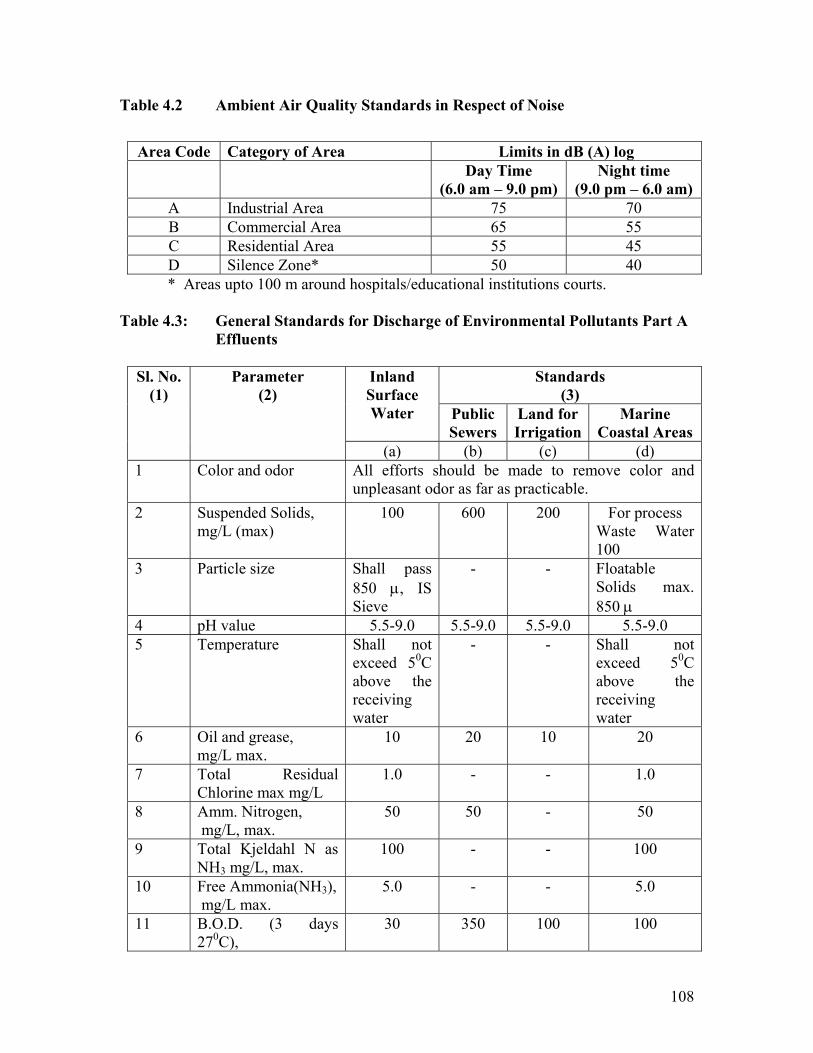
108
Table 4.2 Ambient Air Quality Standards in Respect of Noise
Area Code Category of Area Limits in dB (A) log
Day Time (6.0 am – 9.0 pm)
Night time (9.0 pm – 6.0 am)
A Industrial Area 75 70 B Commercial Area 65 55 C Residential Area 55 45 D Silence Zone* 50 40 * Areas upto 100 m around hospitals/educational institutions courts.
Table 4.3: General Standards for Discharge of Environmental Pollutants Part A Effluents
Standards (3)
Inland Surface Water Public
Sewers Land for Irrigation
Marine Coastal Areas
Sl. No. (1)
Parameter (2)
(a) (b) (c) (d) 1 Color and odor All efforts should be made to remove color and
unpleasant odor as far as practicable. 2 Suspended Solids,
mg/L (max) 100 600
200
For process
Waste Water 100
3 Particle size Shall pass 850 µ, IS Sieve
- - Floatable Solids max. 850 µ
4 pH value 5.5-9.0 5.5-9.0 5.5-9.0 5.5-9.0 5 Temperature Shall not
exceed 50C above the receiving water
- - Shall not exceed 50C above the receiving water
6 Oil and grease, mg/L max.
10 20 10 20
7 Total Residual Chlorine max mg/L
1.0 - - 1.0
8 Amm. Nitrogen, mg/L, max.
50 50 - 50
9 Total Kjeldahl N as NH3 mg/L, max.
100 - - 100
10 Free Ammonia(NH3), mg/L max.
5.0 - - 5.0
11 B.O.D. (3 days 270C),
30 350 100 100
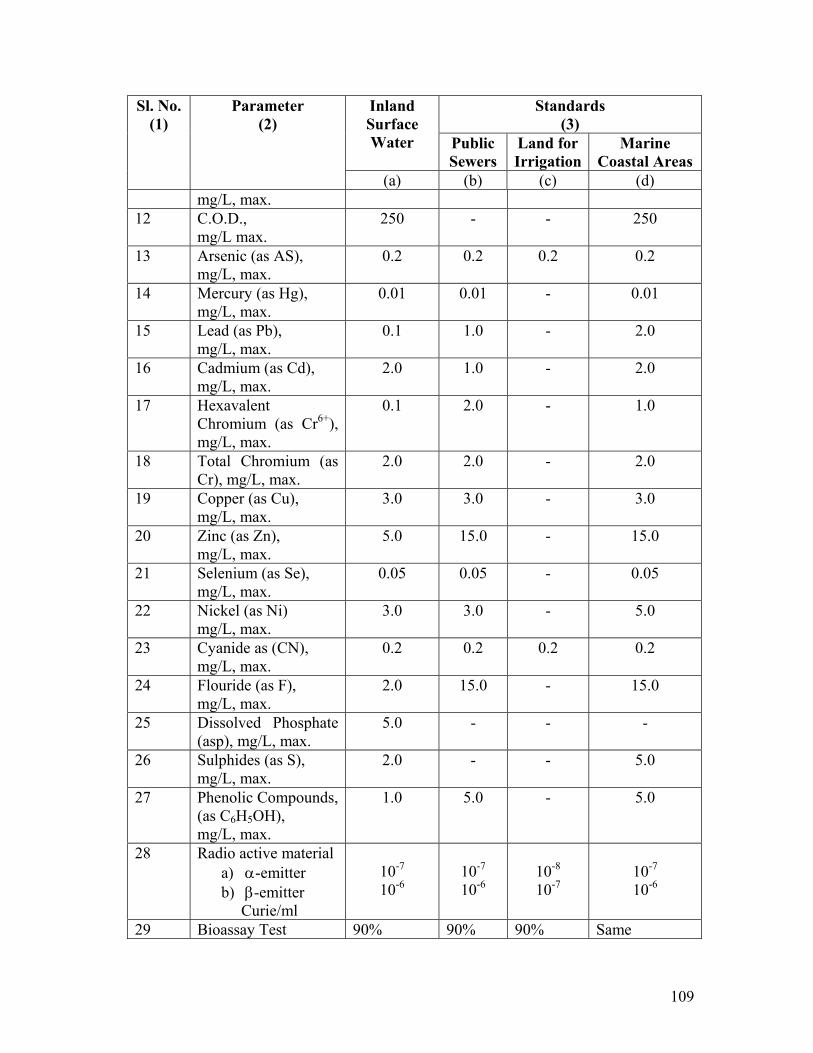
109
Standards (3)
Inland Surface Water Public
Sewers Land for Irrigation
Marine Coastal Areas
Sl. No. (1)
Parameter (2)
(a) (b) (c) (d) mg/L, max.
12 C.O.D., mg/L max.
250 - - 250
13 Arsenic (as AS), mg/L, max.
0.2 0.2 0.2 0.2
14 Mercury (as Hg), mg/L, max.
0.01 0.01 - 0.01
15 Lead (as Pb), mg/L, max.
0.1 1.0 - 2.0
16 Cadmium (as Cd), mg/L, max.
2.0 1.0 - 2.0
17 Hexavalent Chromium (as Cr6+), mg/L, max.
0.1 2.0 - 1.0
18 Total Chromium (as Cr), mg/L, max.
2.0 2.0 - 2.0
19 Copper (as Cu), mg/L, max.
3.0 3.0 - 3.0
20 Zinc (as Zn), mg/L, max.
5.0 15.0 - 15.0
21 Selenium (as Se), mg/L, max.
0.05 0.05 - 0.05
22 Nickel (as Ni) mg/L, max.
3.0 3.0 - 5.0
23 Cyanide as (CN), mg/L, max.
0.2 0.2 0.2 0.2
24 Flouride (as F), mg/L, max.
2.0 15.0 - 15.0
25 Dissolved Phosphate (asp), mg/L, max.
5.0 - - -
26 Sulphides (as S), mg/L, max.
2.0 - - 5.0
27 Phenolic Compounds,(as C6H5OH), mg/L, max.
1.0 5.0 - 5.0
28 Radio active material a) α-emitter b) β-emitter Curie/ml
10-7 10-6
10-7 10-6
10-8 10-7
10-7 10-6
29 Bioassay Test 90% 90% 90% Same
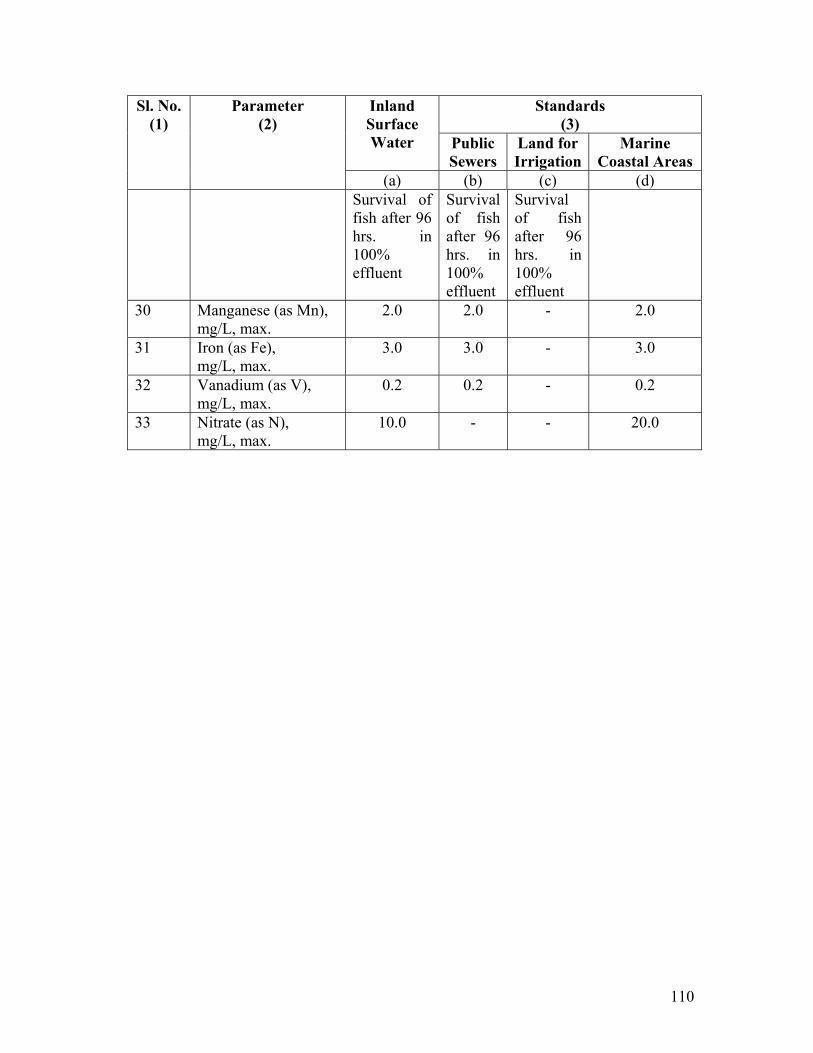
110
Standards (3)
Inland Surface Water Public
Sewers Land for Irrigation
Marine Coastal Areas
Sl. No. (1)
Parameter (2)
(a) (b) (c) (d) Survival of fish after 96 hrs. in 100% effluent
Survival of fish after 96 hrs. in 100% effluent
Survival of fish after 96 hrs. in 100% effluent
30 Manganese (as Mn), mg/L, max.
2.0 2.0 - 2.0
31 Iron (as Fe), mg/L, max.
3.0 3.0 - 3.0
32 Vanadium (as V), mg/L, max.
0.2 0.2 - 0.2
33 Nitrate (as N), mg/L, max.
10.0 - - 20.0
111
4.8 Govt. of Indian under EIA requirements issued to limit the activities in the following areas
• Prohibiting location of industries except those related to tourism in a belt of 1.0
km from high tide mark from Ravanda creek upto Devgarh, as well as in 1.0 km belt along the banks of Rajpura creek in in Murud Janjira areas in Raigarh district of Mahrashtra (6.1.1989)
• Restricting location of industries, mining operation and regulating other activities in Doon Valley (1.2.1989)
• Restricting activities is coastal stretches of the country by classifying them as coastal Regulation Zone and prohibiting certain activities (19.2.1991)
• Restricting location of industries and regulating other activities in Dhanu Taluka of Mahrashtra (6.6.1991)
• Restricting certain activities in specified areas of Aravalli Range in Gurgaon district of Haryana and Alwar District of Rajasthan (7.5.1992)
• Regulating industrial and other activities in an area noth west of Numaligarh in Assam (5.7.1996)
Suggested Reading
1. Water (Prevention and control of Pollution) Act. 1074, GoI, Ministry of Law
Justice and Company Affairs, New Delhi.
2. Air (Prevention and Control of Pollution) Act, 1981 Eastern Book Agency,
Lucknow.
3. Environment (Protection) Act, 1986, Ministry of Environment and Forests,
Department of Environment Forest and Wild Life, New Delhi.
4. International Laws, Trivedi, P.R., APH Publishing Corporation, New Delhi –
1996.
5. Environment Impact Assessment, Impact Assessment Division, MoEF, GoI, January 2001.
(Lecture 22)
112
CHAPTER - V
Environmental Impact Assessment
5.1 All anthropogenic activities have some impact on environment. The impacts may
be significant or controversial, positive or negative. The negative, harmful, effects are
often far more common than useful. There is thus a pressing need to evaluate the
potentialities of a proposed project before it is undertaken. There is no danger to
environment if the impacts are within the sustainability of environment but when they
exceed the carrying capacity and produce ecological changes that the alarm bells start
ringing. These ecological changes must be characterized early in the project cycle and
corrective steps taken. The need to foresee the problems of a development project is the
primary objective of Environmental Impact Assessment (EIA). It is an exercise to
document the consequences of a proposed project in totality alongwith measures
necessary to keep the environment clean and healthy. Administrative and legislative
decisions are needed to go ahead with the project or to curb/restrain activities. These
provisions have been made in the Environment (Protection) Act, 1986*. Similar steps
have been taken elsewhere in the world. The National Environmental Policy Act of USA
(NEPA), 1970 is a forerunner of such efforts. An inter relationship between EIA and EIS
(Environment Impact Statement) was indicated by Jain et. al (1977).
In order to prepare an EIA/EIS document, number of steps are needed. They are
represented in the Fig. 5.1.
* Impact Assessment Notification of January 27, 1994 (2, III, a) and Manual of EIA produced by Ministry of Environment and Forest January 2001.
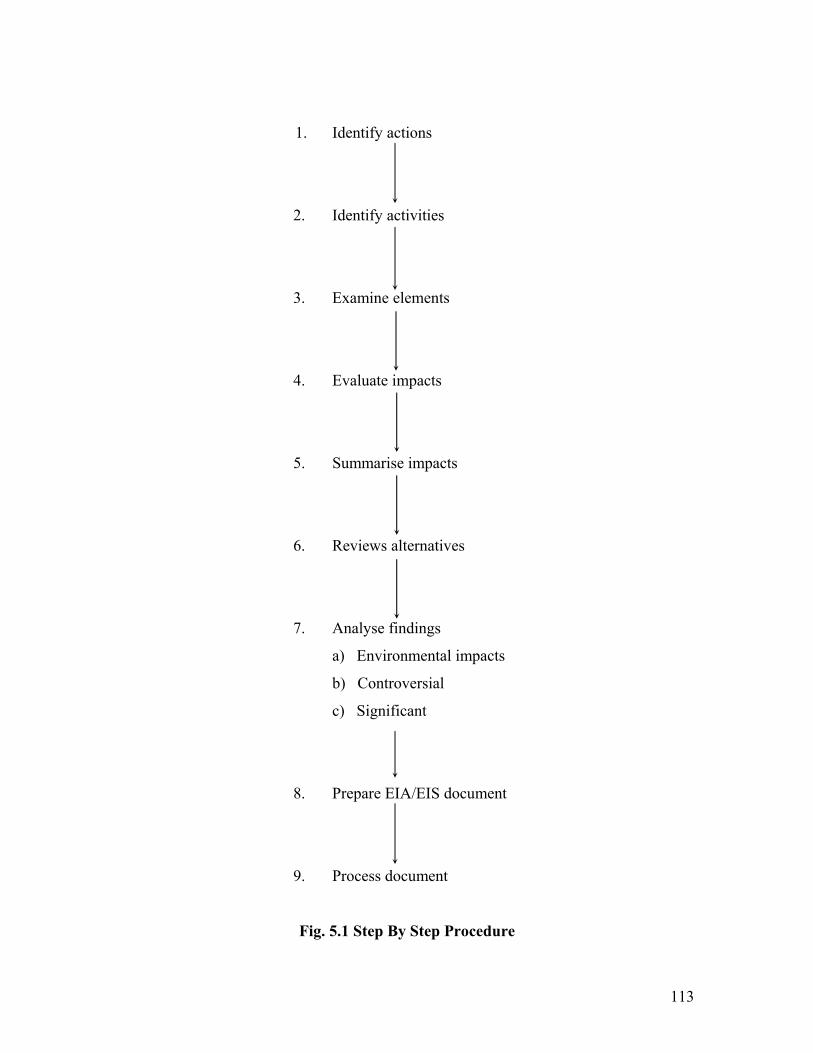
113
1. Identify actions
2. Identify activities
3. Examine elements
4. Evaluate impacts
5. Summarise impacts
6. Reviews alternatives
7. Analyse findings
a) Environmental impacts
b) Controversial
c) Significant
8. Prepare EIA/EIS document
9. Process document
Fig. 5.1 Step By Step Procedure
114
The first step in the series requires identification of actions on the part of
proponents. Ministry of Environment and Forests have identified 30 + 2 category of
actions which need to be examined. If the project requires EIA document, it requires
identification of activities in Step 2. All project specific activities shall be listed and those
elements/attributes which are important and can have an impact must be examined and
evaluated. Alternatives to the project must also be reviewed and the one with least
environmental disturbance selected. The environmental impacts, controversial,
significant, positive, negatives analysed. All possible mitigation measures, environmental
management programmes worked out and documented in EIA/EIS.
The basic premise in preparing the document/statement is to promote Sustainable
Development without/or least impairing the quality of environment, protection and
restoration of resources and leaving a good quality settings for future generations. If by a
proposed project a component of environment is in danger, the document will also alert
the concerned agencies. The document can also predict short/long term effects and can be
used in the planning process.
In order that all/most of the issues are addressed in the document/statement, it
should have the following:
1. Project details
a) Definition, objectives, goals and purpose of action.
b) Area, magnitude of action during planning, construction,
maintenance and operation.
c) Total requirement of man, material and time required.
d) Energy requirements during construction, operation and
maintenance.
e) Complete environment settings, present population of area and rate
of growth, biophysical and socio-economic.
f) Historical data and topography.
g) Water bodies in and around.
h) Any religious or tourist resort, sensitive area around like hospital,
academic institutes and air port.
115
i) Forest cover in the vicinity (core zone refers to the area where the
project has to be undertaken and buffer zone within 10 km radius).
2. Land use plan
a) Existing land use in terms of agriculture, forest, green cover, water
bodies, community and commercial uses.
b) Land use projections in Master Plan.
c) Changes anticipated in land use.
3. Probable Impacts of Proposed Actions
a) Anticipated changes in environmental attributes, air, water, land,
noise, vibration, ecology and natural settings.
b) Effects of changes on human health, welfare and surroundings
(Impacts include, direct, indirect, primary and secondary).
4. Alternatives to the present, proposed actions
For every proposed project, there are a few alternatives which may include
another site, another technology, mitigation measures and costs. All possible
alternatives with merits, demerits, risks and cost benefit analysis must be put forth
and the one with least effects, least risks and positive cost benefit ratio must be
recommended.
5. Adverse impact which can not be avoided
Despite all possible precautions in avoiding impacts on one or more of
environmental attribute, some adverse effects on air, water, land, human health
can not be avoided. All these must be discussed with all conceived mitigation
measures. These could be by Waste Water Treatment (Municipal or package
plants), Scrubber, system for air pollution control, high rise stacks to abet
pollutant dispersion, acoustic housing for DG sets for noise control, green belt for
aesthetic and many more.
6. Conservation of Natural Resources
The irreversible commitment to natural resources must be discussed and include
i) Human Resources, labor and other technical workmen
ii) Local materials
iii) Natural ecosystem imbalance
116
iv) Change in natural land use pattern
v) Consumption of natural energy sources, fossil fuel, natural gas
vi) Cultural
- destruction of human interest sites
- archeological sites
- scenic view
- open space
- social and economic effects
- aesthetics
(Lecture 23)
5.2 Environment Impacts
Having visualized the composition, structure and quality of various components
of environment and their likely deterioration, it is prudent to assess which of the
multitudes of attributes influences the environment in relation to the execution of a
planned project. The projects could be of various types. However, World Bank (1989)
have categorized them into:
i) Projects related to highway construction
ii) Large Water Resources Developmental Projects
iii) Construction of Thermal Power Plants
iv) Residential construction projects
v) Petrochemical and fertiliser projects and
vi) Mining and metallurgical projects.
5.2.1 Environmental Impacts involves the study of various attributes, their complex
interrelationship and consequent changes in the attributes. Jain, Urban and Stacey in the
book on EIA (1977) have listed the attributes as:
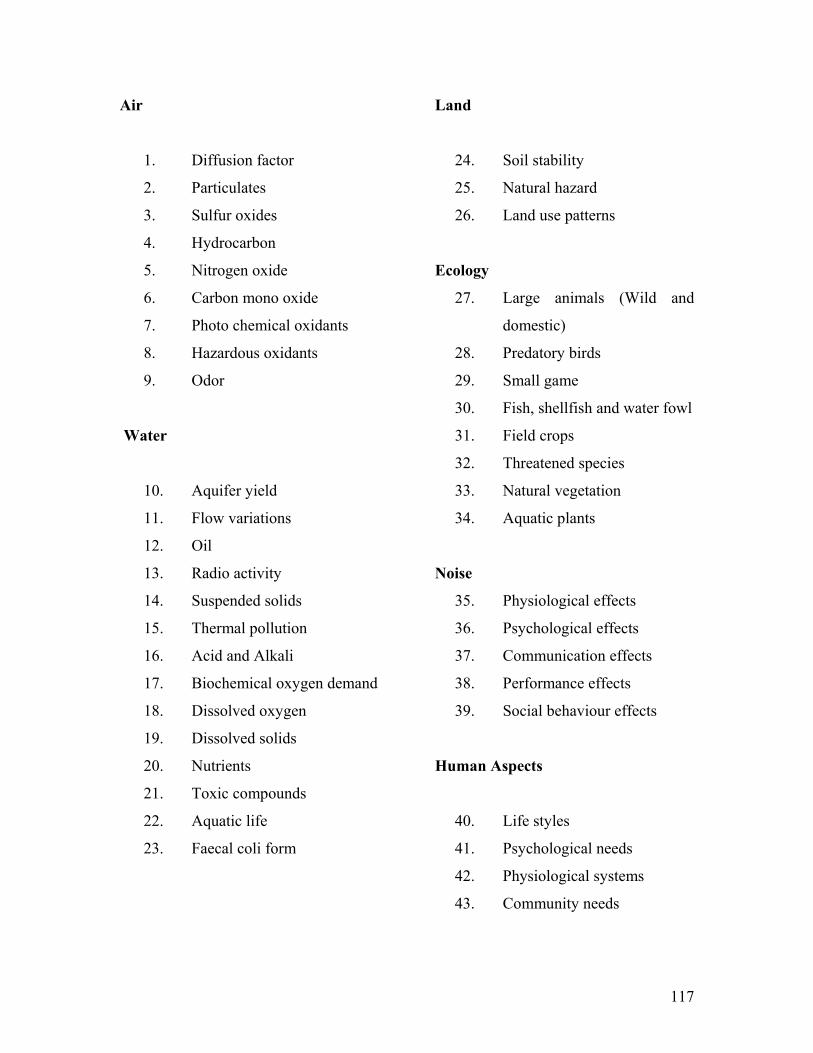
117
Air
1. Diffusion factor
2. Particulates
3. Sulfur oxides
4. Hydrocarbon
5. Nitrogen oxide
6. Carbon mono oxide
7. Photo chemical oxidants
8. Hazardous oxidants
9. Odor
Water
10. Aquifer yield
11. Flow variations
12. Oil
13. Radio activity
14. Suspended solids
15. Thermal pollution
16. Acid and Alkali
17. Biochemical oxygen demand
18. Dissolved oxygen
19. Dissolved solids
20. Nutrients
21. Toxic compounds
22. Aquatic life
23. Faecal coli form
Land
24. Soil stability
25. Natural hazard
26. Land use patterns
Ecology
27. Large animals (Wild and
domestic)
28. Predatory birds
29. Small game
30. Fish, shellfish and water fowl
31. Field crops
32. Threatened species
33. Natural vegetation
34. Aquatic plants
Noise
35. Physiological effects
36. Psychological effects
37. Communication effects
38. Performance effects
39. Social behaviour effects
Human Aspects
40. Life styles
41. Psychological needs
42. Physiological systems
43. Community needs
118
Economics
44. Regional economic stability
45. Public sector review
46. Per capita consumption
Resources
47. Fuel resources
48. Non fuel resources
49. Aesthetics
5.2.2 Descriptor Package
These attributes, however, need some explanation. The importance of air and
noise over water and land is because polluted air and exceeding noise can not be
contained and centrally treated, while this is possible for water and land. The water drawn
from a polluted source could be treated before utilization, similarly land can be controlled
by localized treatment. The air attributes are thus more important.
The diffusion factor pertains to the dispersion of pollution from the source to the
ambient environment. The dispersion depends on atmospheric conditions viz. wind
structure, temperature profile and insulation. The amount of air available to dilute the
pollutants is related to wind speed and the extent to which the emission can rise into the
atmosphere. The atmospheric temperature profile and wind determines the stability and
the vertical dispersion. The product of the mean maximum mixing depth (MMMD) and
the average wind speed with the mixing depth is termed “Ventilation Coefficient” and is
taken as an indicator of atmospheric diffusion capability.
The particulate matter (dust) is the amount of particulate matter present as
aerosols in the ambient atmosphere. Particles which are larger than 10µ settle down
gradually while those less than 10µ remain suspended in air and are inhaled along with
air. The penetration and retention in the bronchi and lungs also depends on size.
Particulates in the size range of 3 - 5µ are filtered out in the upper respiratory passage and
those below 3µ penetrate into the alveoli. As particle size decreases the deposition
increases (3 - 1µ). Particles less than 0.25 µ are exhaled out with air. Thus the respirable
particulate matter between 1 - 3 µ are most important.
Hydro-Carbons are compounds containing only hydrogen and carbon and are
gaseous at room temperatures. Methane is a natural decay product. The other
hydrocarbons are present in natural gas, petroleum products and gasoline. Other
hydrocarbons of importance are alkanes, alkenes, olefins and acetylenes. Aromatic
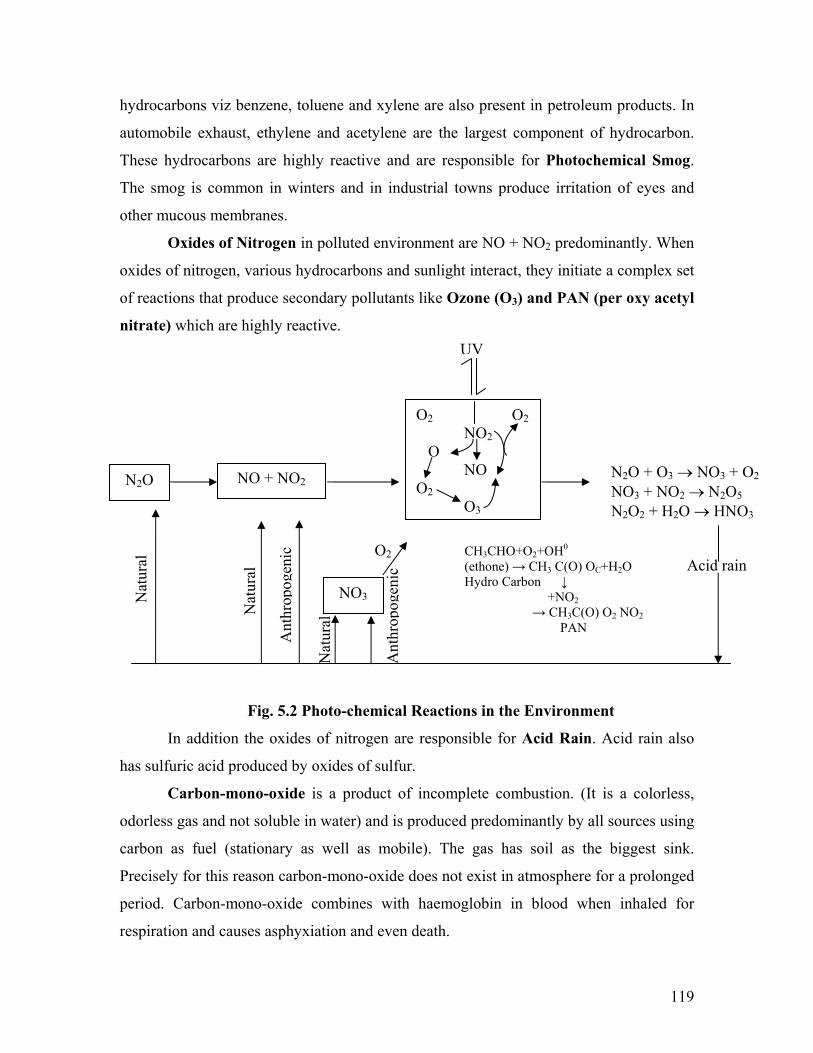
119
hydrocarbons viz benzene, toluene and xylene are also present in petroleum products. In
automobile exhaust, ethylene and acetylene are the largest component of hydrocarbon.
These hydrocarbons are highly reactive and are responsible for Photochemical Smog.
The smog is common in winters and in industrial towns produce irritation of eyes and
other mucous membranes.
Oxides of Nitrogen in polluted environment are NO + NO2 predominantly. When
oxides of nitrogen, various hydrocarbons and sunlight interact, they initiate a complex set
of reactions that produce secondary pollutants like Ozone (O3) and PAN (per oxy acetyl
nitrate) which are highly reactive.
Fig. 5.2 Photo-chemical Reactions in the Environment
In addition the oxides of nitrogen are responsible for Acid Rain. Acid rain also
has sulfuric acid produced by oxides of sulfur.
Carbon-mono-oxide is a product of incomplete combustion. (It is a colorless,
odorless gas and not soluble in water) and is produced predominantly by all sources using
carbon as fuel (stationary as well as mobile). The gas has soil as the biggest sink.
Precisely for this reason carbon-mono-oxide does not exist in atmosphere for a prolonged
period. Carbon-mono-oxide combines with haemoglobin in blood when inhaled for
respiration and causes asphyxiation and even death.
NO + NO2
NO3
O2
Nat
ural
Acid rain
O2 O2 NO2 O NO O2
O3
UV
Nat
ural
N2O N2O + O3 → NO3 + O2
NO3 + NO2 → N2O5 N2O2 + H2O → HNO3
Ant
hrop
ogen
ic
Nat
ural
Ant
hro p
ogen
ic
CH3CHO+O2+OH0 (ethone) → CH3 C(O) OC+H2O Hydro Carbon ↓ +NO2 → CH3C(O) O2 NO2 PAN
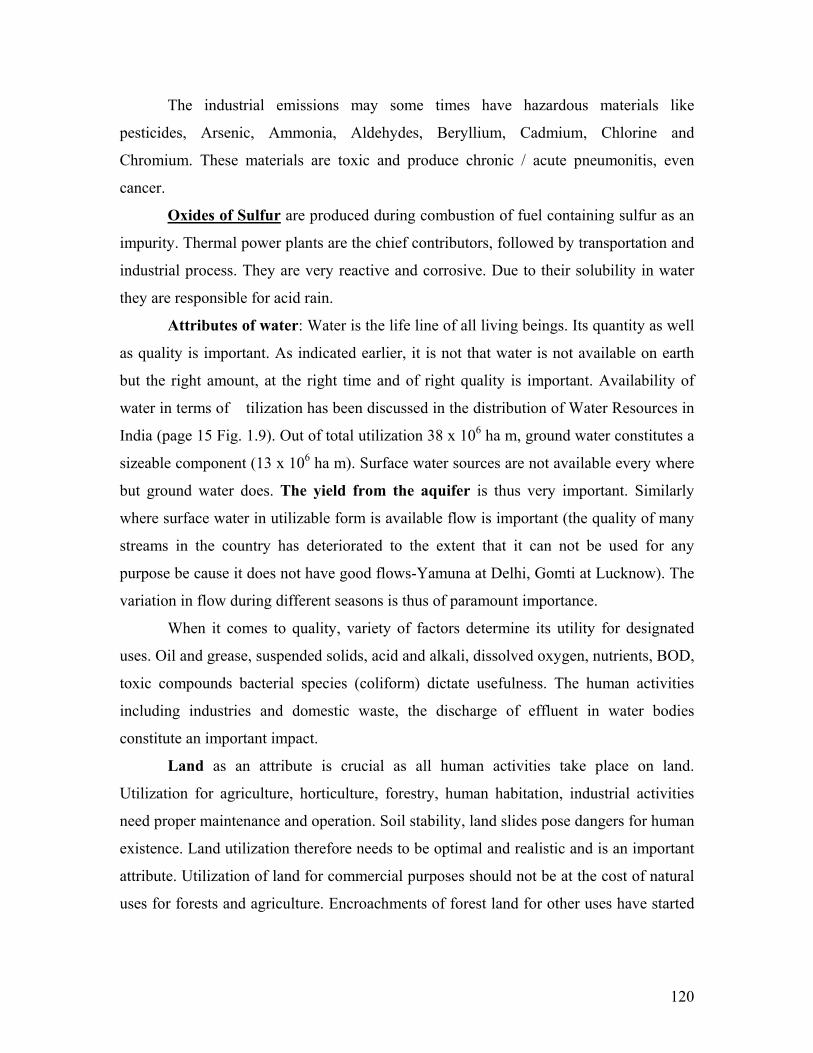
120
The industrial emissions may some times have hazardous materials like
pesticides, Arsenic, Ammonia, Aldehydes, Beryllium, Cadmium, Chlorine and
Chromium. These materials are toxic and produce chronic / acute pneumonitis, even
cancer.
Oxides of Sulfur are produced during combustion of fuel containing sulfur as an
impurity. Thermal power plants are the chief contributors, followed by transportation and
industrial process. They are very reactive and corrosive. Due to their solubility in water
they are responsible for acid rain.
Attributes of water: Water is the life line of all living beings. Its quantity as well
as quality is important. As indicated earlier, it is not that water is not available on earth
but the right amount, at the right time and of right quality is important. Availability of
water in terms of �tilization has been discussed in the distribution of Water Resources in
India (page 15 Fig. 1.9). Out of total utilization 38 x 106 ha m, ground water constitutes a
sizeable component (13 x 106 ha m). Surface water sources are not available every where
but ground water does. The yield from the aquifer is thus very important. Similarly
where surface water in utilizable form is available flow is important (the quality of many
streams in the country has deteriorated to the extent that it can not be used for any
purpose be cause it does not have good flows-Yamuna at Delhi, Gomti at Lucknow). The
variation in flow during different seasons is thus of paramount importance.
When it comes to quality, variety of factors determine its utility for designated
uses. Oil and grease, suspended solids, acid and alkali, dissolved oxygen, nutrients, BOD,
toxic compounds bacterial species (coliform) dictate usefulness. The human activities
including industries and domestic waste, the discharge of effluent in water bodies
constitute an important impact.
Land as an attribute is crucial as all human activities take place on land.
Utilization for agriculture, horticulture, forestry, human habitation, industrial activities
need proper maintenance and operation. Soil stability, land slides pose dangers for human
existence. Land utilization therefore needs to be optimal and realistic and is an important
attribute. Utilization of land for commercial purposes should not be at the cost of natural
uses for forests and agriculture. Encroachments of forest land for other uses have started
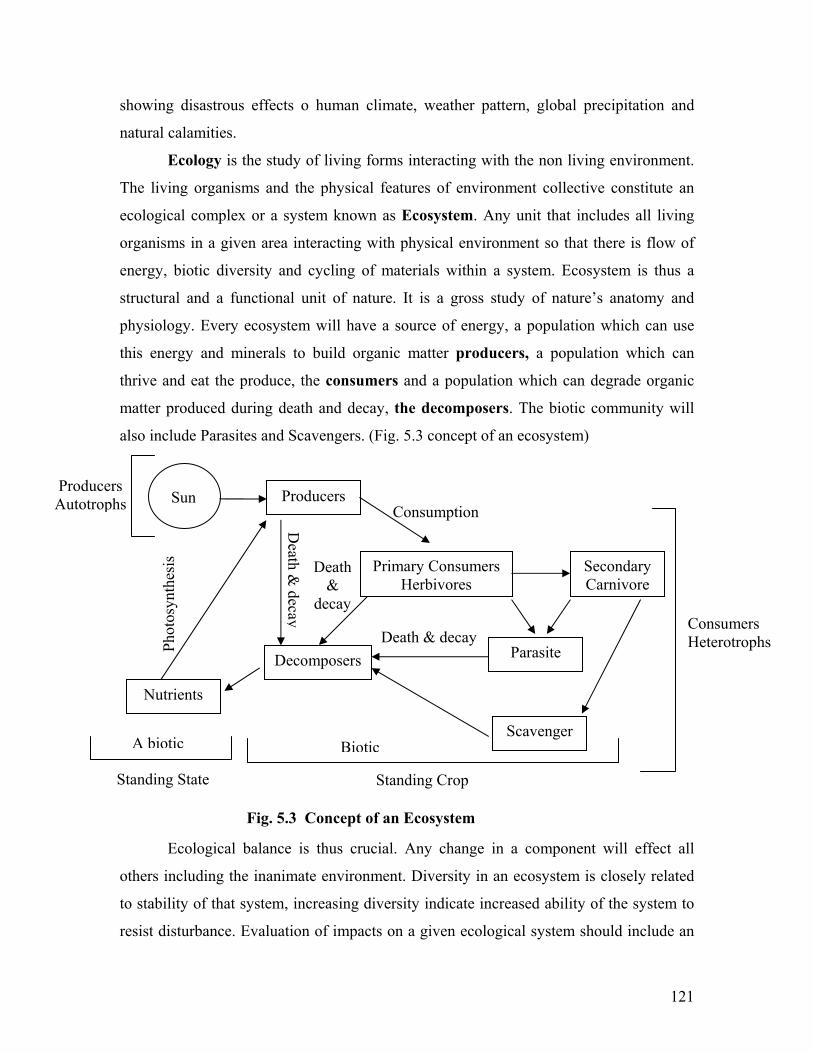
121
showing disastrous effects o human climate, weather pattern, global precipitation and
natural calamities.
Ecology is the study of living forms interacting with the non living environment.
The living organisms and the physical features of environment collective constitute an
ecological complex or a system known as Ecosystem. Any unit that includes all living
organisms in a given area interacting with physical environment so that there is flow of
energy, biotic diversity and cycling of materials within a system. Ecosystem is thus a
structural and a functional unit of nature. It is a gross study of nature’s anatomy and
physiology. Every ecosystem will have a source of energy, a population which can use
this energy and minerals to build organic matter producers, a population which can
thrive and eat the produce, the consumers and a population which can degrade organic
matter produced during death and decay, the decomposers. The biotic community will
also include Parasites and Scavengers. (Fig. 5.3 concept of an ecosystem)
Ecological balance is thus crucial. Any change in a component will effect all
others including the inanimate environment. Diversity in an ecosystem is closely related
to stability of that system, increasing diversity indicate increased ability of the system to
resist disturbance. Evaluation of impacts on a given ecological system should include an
Producers Autotrophs
Death &
decay
Death &
decay
Phot
osyn
thes
is
Death & decay
Sun Producers
Primary Consumers Herbivores
Secondary Carnivore
Nutrients
Decomposers Parasite
Scavenger
Consumption
Standing State
Consumers Heterotrophs
A biotic Biotic
Standing Crop
Fig. 5.3 Concept of an Ecosystem
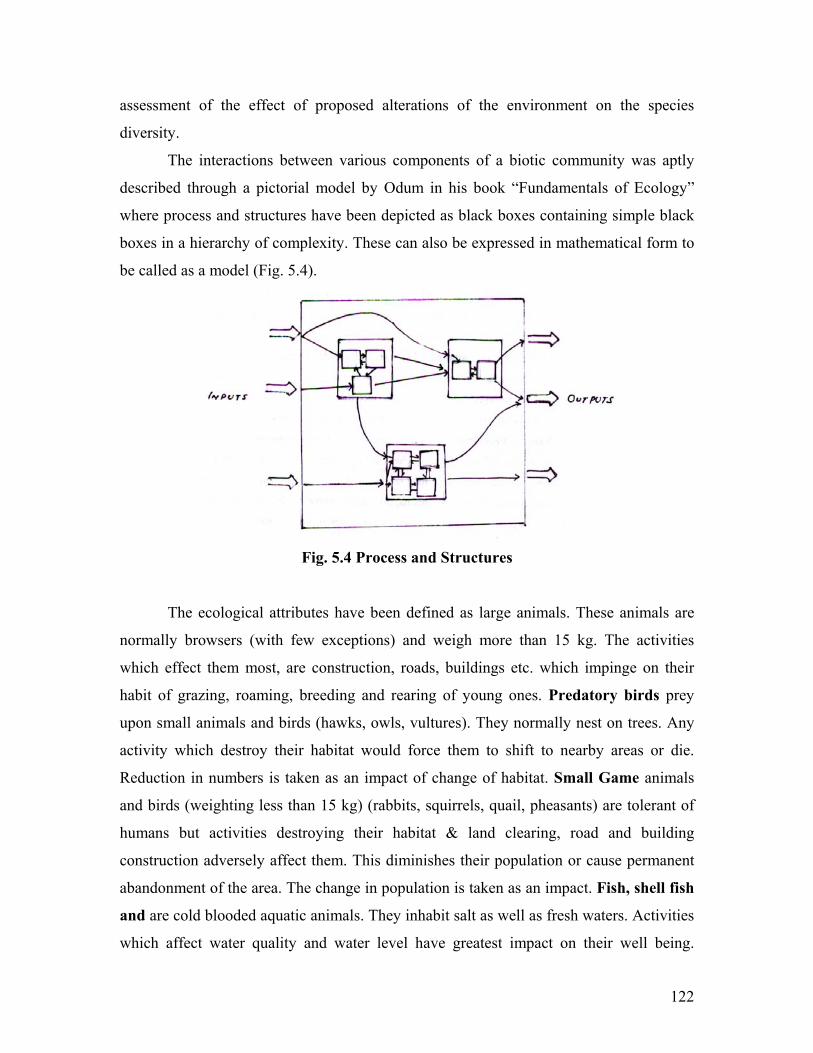
122
assessment of the effect of proposed alterations of the environment on the species
diversity.
The interactions between various components of a biotic community was aptly
described through a pictorial model by Odum in his book “Fundamentals of Ecology”
where process and structures have been depicted as black boxes containing simple black
boxes in a hierarchy of complexity. These can also be expressed in mathematical form to
be called as a model (Fig. 5.4).
Fig. 5.4 Process and Structures
The ecological attributes have been defined as large animals. These animals are
normally browsers (with few exceptions) and weigh more than 15 kg. The activities
which effect them most, are construction, roads, buildings etc. which impinge on their
habit of grazing, roaming, breeding and rearing of young ones. Predatory birds prey
upon small animals and birds (hawks, owls, vultures). They normally nest on trees. Any
activity which destroy their habitat would force them to shift to nearby areas or die.
Reduction in numbers is taken as an impact of change of habitat. Small Game animals
and birds (weighting less than 15 kg) (rabbits, squirrels, quail, pheasants) are tolerant of
humans but activities destroying their habitat & land clearing, road and building
construction adversely affect them. This diminishes their population or cause permanent
abandonment of the area. The change in population is taken as an impact. Fish, shell fish
and are cold blooded aquatic animals. They inhabit salt as well as fresh waters. Activities
which affect water quality and water level have greatest impact on their well being.
123
Similarly presence of toxic chemicals/or heated waters have great impact. Dredging,
stream channelisation also affect them.
Field crops include crops that are commercially grown like wheat, rice, barley,
gram, pulses and sugar cane. Land acquisition for non agricultural purposes is likely to
have the greatest impact. Multipurpose Water Resource Projects may result in flooding of
large areas. This would adversely affect the biodiversity.
Threatened or endangered-species include all species of plants and animals
whose procreation has been adversely affected to the extent of completely disappearing
Ministry of Environment and Forests have included 583 plant species and 158 animals
species in the list (CSO, GoI, 1999). This also reduces biodiversity.
Natural Vegetation refers to plant species which grow on land and are not
cultivated. Herbs, shrubs, grasses, lichens grow naturally on soil and bind particles of
soil. When removed temporarily they reestablish later. All such activities which remove
the top soil, remove them also. This happens during planning, leveling and construction.
Road and complex residential commercial construction projects have direct impacts on
their existence. Like natural vegetation, water bodies (shallow) support the growth of
aquatic plants. These are hydrophytes including rooted, floating and submerged
vegetation. Plants like Hydrilla, Valeseneria, Najas, Duck Weed, Lemna and some times
Eichornia are included in this category. In slightly deeper portions where such plants can
not grow (>2.0 m depth) phytoplankton grows both filamentous and non filamentous.
Changes in water quality due to discharge of domestic/industrial waste create problems
where some species or all species degenerate, decay and disappear. Physical changes like
dredging channelisation also disturb them and change their structure. Changes in
biodiversity and or disappearance of sensitive species is an important impact and attribute
under ecology.
Noise: Noise is unwanted sound and is a pollution having serious effects on
human beings. Noise constitute pressure waves. The time taken by the air pressure to
complete one cycle of propagation is called period of oscillation and its inverse frequency
of oscillation which means cycles per second. Frequency is related to pitch. Higher
frequency would mean higher pitch. Humans can detect frequency ranging from 16000 –
20,000 Hz (frequencies are measured as Hertz (Hz)). Noise is measured in a weighted
124
sound level dBA (indicates loudness experienced by people rather than physical
magnitude).
dBA 0 = Thresh hold of human hearing
10 = breathing in sleep
40 = quiet room
50 = residences
60 = conversational speech
70 = street traffic
110 = loud motor cycle
140 = jet plane take off
Noise measured for 24 hrs, midnight to midnight in termed LdN – dBA
Leq – determines fluctuating sound pressures, represented by a constant energy
equivalent sound.
Noise in excess interferes with human activities specially hearing and health (A
person working in a noise environment may change the threshold value), interferes in
work tasks, interferes in speech communication, interferes in sleep and causes annoyance
and irritation.
Central Pollution Control Board under Noise Act has notified limits of Ambient
Noise.
Limits in dBA Area code Category of Area
Daytimes* Night time**
A Industrial area 75 70
B Commercial area 65 55
C Residential area 55 45
D*** Silence zone 50 40
5.3 6.0 A.M. to 9.0 P.M.
** 9.0 P.M. to 6.0 A.M.
*** Area around (100 m) hospital, educational institutions and courts
125
(Horns, loudspeakers are banned).
ISI has also notified outdoor noise levels
Location Noise level dBA
Rural 25 – 35
Sub urban 30 – 40
Residential urban 35 – 45
Residential and commercial urban 40 – 45
City urban 45 – 66
Industrial areas 50 – 60
In terms of impacts, assessment is necessary of ambient noise level at site and the
noise potential of the planned activities.
Noise produces both physiological as well psychological effects on human health.
Physiological effects mean effects on internal body system (increase pulse rate, increased
respiration rate and increased tension which has bearing on cardio vascular systems)
hearing threshold change and sleep disorders (depth, continuity and duration of sleep).
Psychological effects include annoyance, anxiety, fear, mental well being, anger and
irritability. Communication system also gets disturbed by increased noise.
Human Aspects It is an important attribute and is characterized by way in which
man lives and interacts with other men and the environment. In view of complexities in
life and interrelationships it is difficult to identify common parameters. Human aspects
can be best analysed in view of Changes in life styles. Man by nature is social and the
organizations largely depends on social activities which may vary in character, interests
and objectives (racial, ethical, political, religious). The life styles so get fixed up that any
change is not welcome. Attributes affects employment, job security and standards of
living and interwoven communities develop. The needs of community resolves on
housing, water supply, electricity, sewerage and solid waste generation haulage and
disposal, communication among themselves and the outside world now takes centre
stage. Close on life style are Psychological needs of human populations which are
related to instinct, learning process and motivation and are emotional stability, security
126
and behaviour. Attributes affecting employment, job security, standards of living and
modes of travel. Changes due to developmental activities of a larger scale disturbs the life
style and psychological aspects. Two Water Resources Development Projects in the
country viz. Tehri Dam (Uttarakhand) and Narmada (MP & Gujrat) Projects are live even
today which has made large population to move as the towns have been inundated.
Rehabilitation has yet not been completed and accepted. Another aspect deals with
Physiological effects which are related to body function. Memory is fresh in regard to
Bhopal tragedy where neighborhood calamities out number those of the project (Union
Carbide).
(Lectures 24 & 25)
5.4 Identify Activities
Identify detailed activities associated with implementing a project. The activities
may be categorized in functional areas. For each functional area detailed activities
associated with implementation may be identified. For a construction of multiple housing
system the basic activities will be:
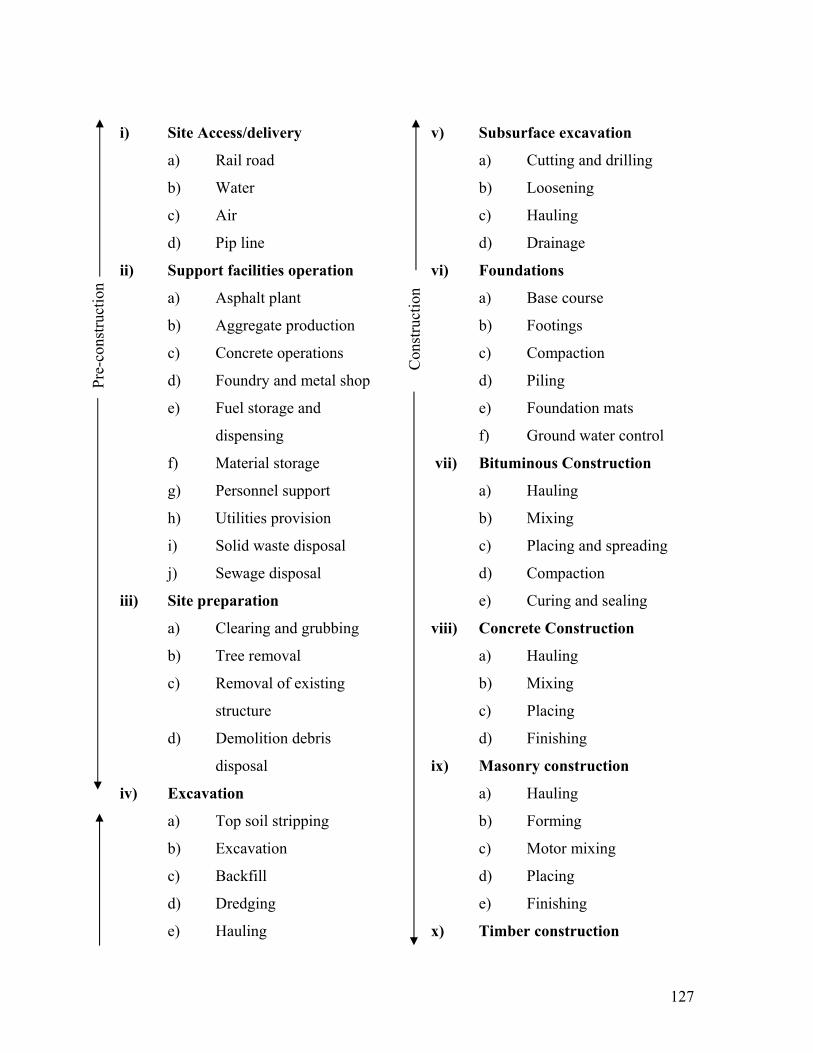
127
i) Site Access/delivery
a) Rail road
b) Water
c) Air
d) Pip line
ii) Support facilities operation
a) Asphalt plant
b) Aggregate production
c) Concrete operations
d) Foundry and metal shop
e) Fuel storage and
dispensing
f) Material storage
g) Personnel support
h) Utilities provision
i) Solid waste disposal
j) Sewage disposal
iii) Site preparation
a) Clearing and grubbing
b) Tree removal
c) Removal of existing
structure
d) Demolition debris
disposal
iv) Excavation
a) Top soil stripping
b) Excavation
c) Backfill
d) Dredging
e) Hauling
v) Subsurface excavation
a) Cutting and drilling
b) Loosening
c) Hauling
d) Drainage
vi) Foundations
a) Base course
b) Footings
c) Compaction
d) Piling
e) Foundation mats
f) Ground water control
vii) Bituminous Construction
a) Hauling
b) Mixing
c) Placing and spreading
d) Compaction
e) Curing and sealing
viii) Concrete Construction
a) Hauling
b) Mixing
c) Placing
d) Finishing
ix) Masonry construction
a) Hauling
b) Forming
c) Motor mixing
d) Placing
e) Finishing
x) Timber construction
Pre-
cons
truct
ion
Con
stru
ctio
n
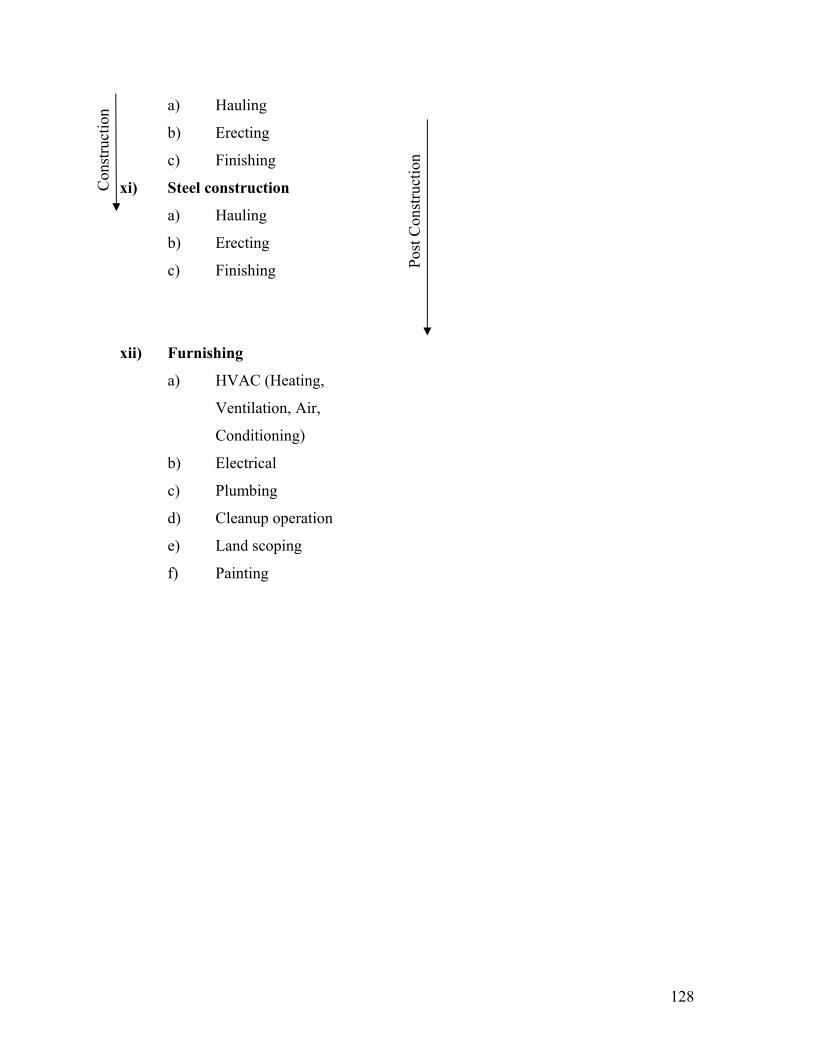
128
a) Hauling
b) Erecting
c) Finishing
xi) Steel construction
a) Hauling
b) Erecting
c) Finishing
xii) Furnishing
a) HVAC (Heating,
Ventilation, Air,
Conditioning)
b) Electrical
c) Plumbing
d) Cleanup operation
e) Land scoping
f) Painting
Con
stru
ctio
n
Post
Con
stru
ctio
n
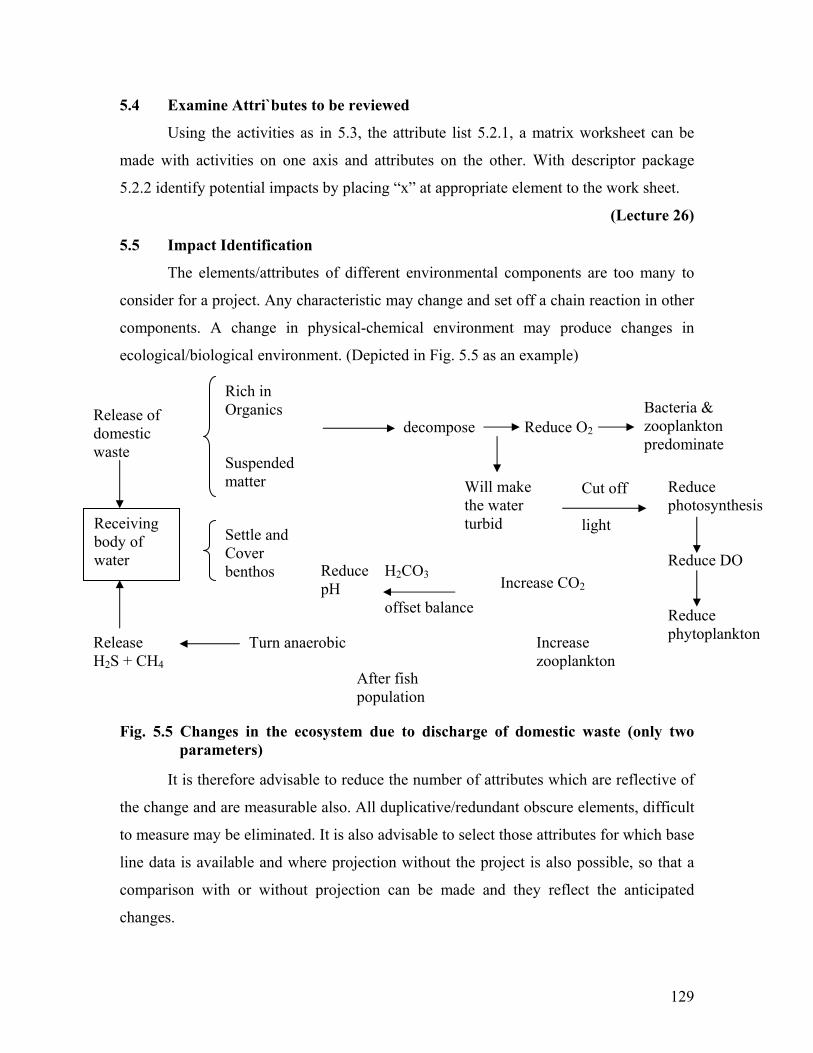
129
5.4 Examine Attri`butes to be reviewed
Using the activities as in 5.3, the attribute list 5.2.1, a matrix worksheet can be
made with activities on one axis and attributes on the other. With descriptor package
5.2.2 identify potential impacts by placing “x” at appropriate element to the work sheet.
(Lecture 26)
5.5 Impact Identification
The elements/attributes of different environmental components are too many to
consider for a project. Any characteristic may change and set off a chain reaction in other
components. A change in physical-chemical environment may produce changes in
ecological/biological environment. (Depicted in Fig. 5.5 as an example)
Fig. 5.5 Changes in the ecosystem due to discharge of domestic waste (only two
parameters)
It is therefore advisable to reduce the number of attributes which are reflective of
the change and are measurable also. All duplicative/redundant obscure elements, difficult
to measure may be eliminated. It is also advisable to select those attributes for which base
line data is available and where projection without the project is also possible, so that a
comparison with or without projection can be made and they reflect the anticipated
changes.
Release of domestic waste
Receiving body of water
Release H2S + CH4
Rich in Organics
Suspended matter
decompose Reduce O2 Bacteria & zooplankton predominate
Will make the water turbid
Cut off light
Reduce photosynthesis Reduce DO Reduce phytoplankton
Increase CO2
Increase zooplankton
Settle and Cover benthos Reduce H2CO3
pH offset balance
Turn anaerobic
After fish population
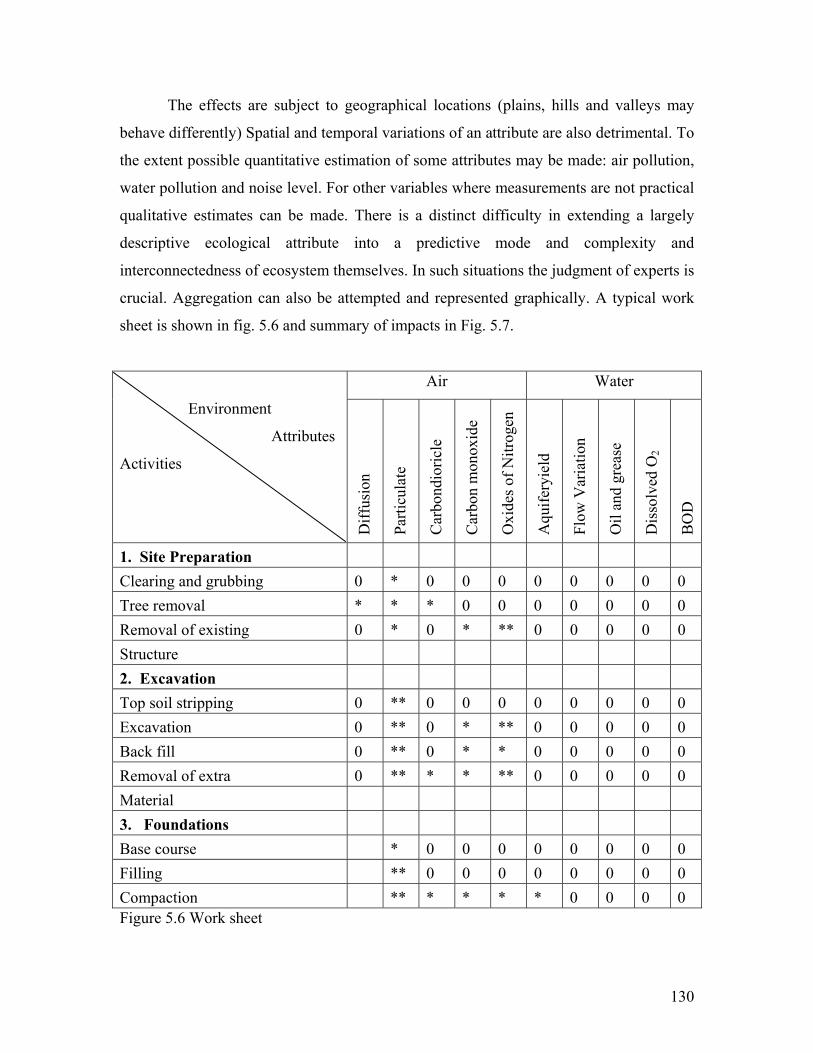
130
The effects are subject to geographical locations (plains, hills and valleys may
behave differently) Spatial and temporal variations of an attribute are also detrimental. To
the extent possible quantitative estimation of some attributes may be made: air pollution,
water pollution and noise level. For other variables where measurements are not practical
qualitative estimates can be made. There is a distinct difficulty in extending a largely
descriptive ecological attribute into a predictive mode and complexity and
interconnectedness of ecosystem themselves. In such situations the judgment of experts is
crucial. Aggregation can also be attempted and represented graphically. A typical work
sheet is shown in fig. 5.6 and summary of impacts in Fig. 5.7.
Air Water
Environment
Attributes
Activities
Diff
usio
n
Parti
cula
te
Car
bond
ioric
le
Car
bon
mon
oxid
e
Oxi
des o
f Nitr
ogen
Aqu
ifery
ield
Flow
Var
iatio
n
Oil
and
grea
se
Dis
solv
ed O
2
BO
D
1. Site Preparation Clearing and grubbing 0 * 0 0 0 0 0 0 0 0 Tree removal * * * 0 0 0 0 0 0 0 Removal of existing 0 * 0 * ** 0 0 0 0 0 Structure 2. Excavation Top soil stripping 0 ** 0 0 0 0 0 0 0 0 Excavation 0 ** 0 * ** 0 0 0 0 0 Back fill 0 ** 0 * * 0 0 0 0 0 Removal of extra 0 ** * * ** 0 0 0 0 0 Material 3. Foundations Base course * 0 0 0 0 0 0 0 0 Filling ** 0 0 0 0 0 0 0 0 Compaction ** * * * * 0 0 0 0 Figure 5.6 Work sheet
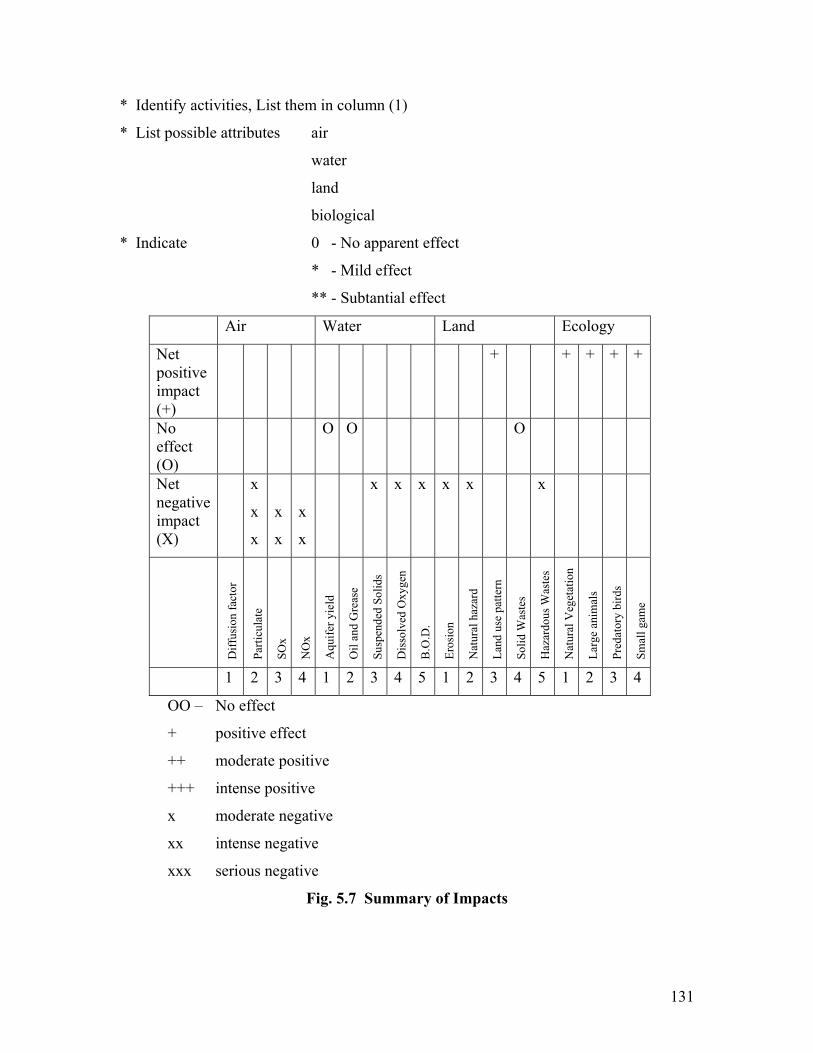
131
* Identify activities, List them in column (1)
* List possible attributes air
water
land
biological
* Indicate 0 - No apparent effect
* - Mild effect
** - Subtantial effect
Air Water Land Ecology
Net positive impact (+)
+ + + + +
No effect (O)
O O O
Net negative impact (X)
x
x
x
x
x
x
x
x x x x x x
Diff
usio
n fa
ctor
Parti
cula
te
SOx
NO
x
Aqu
ifer y
ield
Oil
and
Gre
ase
Susp
ende
d So
lids
Dis
solv
ed O
xyge
n
B.O
.D.
Eros
ion
Nat
ural
haz
ard
Land
use
pat
tern
Solid
Was
tes
Haz
ardo
us W
aste
s
Nat
ural
Veg
etat
ion
Larg
e an
imal
s
Pred
ator
y bi
rds
Smal
l gam
e
1 2 3 4 1 2 3 4 5 1 2 3 4 5 1 2 3 4
OO – No effect
+ positive effect
++ moderate positive
+++ intense positive
x moderate negative
xx intense negative
xxx serious negative
Fig. 5.7 Summary of Impacts
132
5.6 Impact Prediction
Impact prediction is a way of mapping the environmental consequences of the
significant-aspects of the project and its alternatives. Environmental Impact can never be
predicted with absolute certainity and this is all the more reason to consider all possible
facts and take all possible precautions for reducing the degree of un-certainity.
(Lecture 27)
5.7 Methodologies
There are about six methodologies followed in literature for determining the
impacts and to adhere to the stipulations of regulating agencies, which in our case is
Ministry of Environment and Forests.
Choice of a Methodology
Choice of methodology will depend on the specific user and project being
undertaken. The key considerations are:
i) Use: Whether the document is for information or a decision document
The decision document requires more details and greater emphasis is on
key issues, quantification and comparison of alternatives.
ii) Alternatives: Much would depend on what alternatives to the project are
available since these would require a more thorough quantification and
comparison.
iii) Public involvement: The role of stake holders and their participation may
also require issues which are relevant and need discussion and thus details.
iv) Resources: What resources are available for the document preparation in
terms of experts available, data, time and money.
v) Familiarity: Familiarity with ground conditions will also be a keen
element. Greater familiarity will improve the validity of subjective
significance.
vi) Issue significance: If the issues involved are larger than more details are
needed, quantification is important and hence the choice
vii) Administrative: Are the documents being prepared are dictated by
procedure of implementing agency
133
Methodologies
Based on identified impacts, the methodologies will be:
Ad-HOC This method is only primary and provides impact of the project on larger
issues only (Flora, Fauna, Forest, Lake). No specific parameters are discussed. Such
projects are more for information.
Over lays
These methods are graphical and rely on a set of maps of the characteristics of the
project area (physical, social, ecological, aesthetic). These maps are overlaid by
projected alterations of the impacted environment.
Check list
A common method followed and involves the identification of environmental
parameters for possible impacts. They do not require direct cause effect links to the
project activities. They do not include guidelines about how parameter data are to be
measured and interpreted.
Matrix method
A method which is widely followed and incorporates a list of activities related to
the project with impacted environmental characteristics. The two lists are related in
matrix which identifies cause effect relationship.
The method is able to identify the actions with environmental characteristics. The
matrix method may indicate the actions which need to be taken into consideration for
appropriate mitigation.
Net work
These methodologies work from a list of projected activities to establish cause-
condition-effect relationship. They are an attempt to recognize that a series of impacts
may be initiated by a project action. The approach generally define a set of possible
network and allow the user to identify impacts by selecting appropriate project actions.
Combination Computer Aided
These methods use a combination of matrices, net work, analytical models and
computer aided approach to identify activities associated with implementing program,
identify potential environmental impacts and provide guidance for mitigation techniques.
134
5.8. Reviewing of EIA and EMP Reports*
a) Environmental Impact Assessment
Although it is the responsibility of the proponent of the project in a transparent
and logical matter, the review will be based on technical grounds including:
Description of Project and base line conditions
Methods and models used
Risk analysis and disaster management
Public review
Mitigation measures
Description of project and baseline conditions:
Base line conditions of the project area (site) known as core area and surrounding
identified area known as buffer zone (within 10 km radius) are collectively referred as
project impact area. The check list of key parameters will be:
Land
1. Landforms including coastal zone
2. Lithology and geomorphology
3. Soil composition and characteristics
4. Slope stability
5. Subsidence and compaction
6. Seismicity / zone
7. Flood plains/swamps
8. Land use
9. Mineral resources
10. Buffer zones (National park, wild life habitat)
11. Soil erosian
12. Catchments area treatment
Surface water
1. Shore line
2. Bottom interface
* The review details are as per Manual – EIA, MOEF
135
3. Flow variations
4. Water quality
5. Drainage pattern/water logging
6. Water balance
7. Flooding
8. Existing and planned future use
9. Siltation
Atmosphere
1. Air quality
2. Visibility
3. Meteorology
Noise and vibration
1. Intensity
2. Duration
Ground water potential
1. Water table
2. Flow regime
3. Water quality
4. Recharge rate
5. Aquifer characteristics
6. Existing use and proposed plans
Species and population
1. Terrestrial flora/fauna
2. Other terrestrial vegetation
3. Aquatic flora/fauna
4. Fish
5. Other aquatic flora/fauna
Habitat and communities
1. Terrestrial
2. Aquatic communities
3. Migratory path
136
4. Benthic flora and fauna
Health and safety
1. Physical
2. Psychological
3. Occupational
4. Parasitic diseases
5. Communicable diseases
6. Water born diseases
7. Disease vectors
Socio- Economic
1. Agricultural land
2. Employment/Training
3. Housing
4. Education
5. Utilities
6. Amenities (water, sanitation, electricity, transportation)
7. Community health
Aesthetic/Cultural
1. Landscape
2. Wilderness
3. Climate
4. Tranquility
5. Community structure
6. Religious places
7. Historical/Archaeological structures
When describing project base line conditions a good practice is mapping the
impacted region on a 1:25000 scale. Mapping for critical themes of relevant
environmental components may also be presented.
Site and process alternatives
Project description will need to address the main attributes during phase of the
implementation process
137
General siting, layout map, showing water resources, roads, sewage, storm drains,
land use
Project construction - Direct employment, water, power lines usage, earth work,
dredging drilling, schedule of activity
Operation – Direct employment, raw materials, transport, pollution control,
utilities, stacks, vents, noise control, quantities of solid. Liquid and gaseous waste.
Risk Analysis and Disaster Management
Hazard identification, inventory analysis, natural hazards. Maximum credible
accident analysis to identify hazardous scenarios, fire.
Preparation on site and offsite, disaster management plan.
Public Review
The state Pollution Control Boards provide the details of Public Hearing. The
proponent is obliged to respond to the issues raised by stake holders. It is imperative to
identify stake holders representing the sections as given in Schedule IV of the
Notification.
Stake holders identification Is the project proponent aware of all groups who will be directly affected by social/environmental impacts of the project.
Impact identification Has the project proponent addressed to mitigation options on all social / environmental impacts of significance to local population.
Mitigation options Has the project proponent addressed the issues of project compensation and rehabilitation as per procedure.
Monitoring Has the project proponent involved the affected groups in monitoring the effectiveness of social/environmental impact mitigation.
Community development Is the proponent working to promote local development within community.
Review of EMP and Monitoring
Environment Management Plan should include:
Delineation of mitigation/compensation measures for all the identified significant
impacts*
138
* The impact is significant and unacceptable if emission/discharge load and characteristics or the resulting environmental quality are in violation or exceed Ambient Environmental Quality Standards
- Environmental (Protection) Rules 1986 (Air Quality Standards) - Environmental Production Act (Central Pollution Control No. 29 of
(Ambient Noise Standards 23.05.1986)) - Indian Standard of drinking water (IS:2490:1982) - Environment Protection Rules 1986 (Indian Standard Schedule VII
Standards/prescribed for industrial and sewage effluent discharge) Where standards are not prescribed in India the following may be referred
- Damage criteria for heat load and pressure (Deptt. Of Industrial Safety, the Netherlands) - Risk acceptance criteria (Organisation for Applied scenario and Research
(TNO), the Netherlands - Damage Risk Criteria, OSHA of USA
Delineation of unmitigated impacts
Physical planning including work program, time schedule and locations for
putting mitigation and compensation system in place
Delineation of financial plan for implementing the mitigation measures
(budgetary estimates).
Suggested Reading
1. Environmental Impact Analysis, Jain, R.K., Urban, L.V., and Stacey, G.S., Van
Nostrand Rein hold Co. 1977.
2. Environment Impact Assessment, Barthwal, R.R. New Age International, New
Delhi 2002.
3. Environment Impact Assessment (Practical Solutions to Recurrent Problems).
David P. Lowrence. Wiley Interscience, New Jersey 2003.
4. Environment Impact Assessment, Srivastava, A.K., APH Publishing Corporation,
New Delhi – 2003.
5. Ecology, Impact Assessment and environment Planning, Walter E. Westman.,
John Wiley & Sons, Canada 1985.
(Lecture 26 & 27)
139
CHAPTER – VI
6.0 Assessment of Socio-Economic Impacts
Socio-economic impacts are the influence of projects and/or progammes or
policies on the human values, culture, living standard. Institutions undertaking
large investment projects such as highways, air ports, sewerage systems, water
resources projects (DOMS, reservoirs, water relating systems, diversions, canals)
stimulates secondary impacts in the form of associated investments and changes
in socio-economic activities. These effects include changes in the existing
community facilities and activities, induced new facilities in the next round and
changes in natural conditions. All such effects may be substantial than the
primary impacts of the original actions.
(Displacement of people from a project area → reduction in permanent population
from the project area → displaced people resettlement somewhere requiring
economic cost, housing, water power, public services at new place, with cultural
and psychological adjustments (Tehri Dam project, Narmada project). During
construction of project temporary population (labourers and their families) will
come to the project area. Such persons will be accommodated in the project area.
They will need all kind of services for living. The area will undergo changes by
the temporary population.
All such changes will come under socio-economic changes of the project or
Socio-economic Impacts Assessment (SIA). The following should always be
taken care of:
a) Demographic impacts Labour force, population shift, employment
and multiplier effects, displacement and
relocation and change in population make up
b) Socio-economic
Impacts
Includes income and multiplier effects,
employment rates and patterns, prices of local
goods and services, taxation effects and
property value
140
c) Institutional Impacts Demands on Government and Social Services
NGO’s in the areas, housing, schools, policing,
justice health and welfare
d) Cultural Impacts Such as those on traditional patterns of life and
work, family structure, authority, religion,
tribal factors, archaeological features and
social work, community cohesion
e) Gender Impacts Implications of development projects on
women’s role in society, income generating
opportunities access to resources and
employment opportunities
Along with changes in physical environment due to a development project, there
will be changes in Socio-economic environment. Social Impact Assessment
should pay special attention to vulnerable sections of population (elderly, poor,
children, minorities)
Some of the variable have measurement dimensions (both positive and negative)
with increasing size of the variables population size, growth, rate of population
growth, age dependency on community; job opportunity, job distribution,
employment level, participation in labour force, price level, educational
attainment, socio-economic status, housing availability public services; social
well being; collective response). These are cumulative effects. These impacts can
be put in (i) Social impacts and (ii) Public Services impacts
A very important aspect is displacement of population. They will have all types of
problems and should go hand in hand with rehabilitation and resettlement policy
of state and Central Government.
6.1 Socio-economic Impact Assessment Methodology
The general methodology will include the following
141
Step 1. Identification of potential socio-economic impact assessment. This is to
identify the basic indicators to assess the environmental impacts of all
kinds (air pollution, water pollution, noise pollution) which will effect
human quality of life
Other important factors will be
a) demographic factors – population, density, literacy
b) economic variables – land use patterns, income levels, price
levels, employment/unemployment level, commercial activities
c) social variables – patterns of life and work, ethnic composition,
religious and tribal factors, public utilities
d) project specific variables – displacement, business, recruitment
of manpower, project technology
Step 2. Description of existing socio-economic or human environment of the
project area
Developing a social profile based on siting of projects
Step 3. Procurement of relevant standards, criteria and guidelines
There are direct effects of pollutants/emissions on the public and
whenever people are affected, health and welfare socio economic
considerations become important
Step 4. Prediction of Socio-economic Impacts
Prediction of Socio-economic Impacts with or without the project is an
important technical exercise. There is no unique method for predicting
the impacts yet four approache are indicated:
a) qualitative description
b) quantitative description
c) application specific prediction technique (may involve survey
from secondary sources or qualitative descriptive approach like
Delphi method or Historical analogies
d) comparison of the effects of alternatives
Step 5. Assessment of Socio-economic Impact
Assessment of socio-economic impacts with or without project in its
142
surrounding areas is difficult as there are no established standards for
these. Some impacts may be clearly visible and assessable such as:
a) generation of employment for local people (+ve impact)
b) increase in earnings of people (+ve impact)
c) pressure on local services (-ve impact)
d) increase in business and trade (+ve impact)
e) increase in crime rate in the region (-ve impact)
f) interaction with outside people (+ve impact)
g) opening of attitudes of people (+ve impact)
There are no threshold levels of comparison for such impacts. They
may be perceived on the basis of experience gained elsewhere about
similar projects (historical analogy). Professional judgment may also be
important. Some projects might have broader impacts on National
economy (Tehri Dam, Narmada, Bhakhra Nangal) rather than local
level impacts. The significance of such impacts may be judged by
National goals, such as power generation, employment generation,
income generation, irrigation, provision of food.
Step 6.1 Mitigation Measures
Though there is very little in the form of mitigation measure to reduce
the adverse socio-economic impacts of the project. However, Some
local benefits, particularly employment of the local people,
rehabilitation and resettlement of project affected people will be
mandatory by law. The project is a user of local resources and in lieu it
has to give back some benefits to the local population otherwise they
resent its activities and the project functioning is jeopardized.
Mitigation measures will include, providing housing schools, colleges,
hospital, power and other social services.
(Lecture 28 & 29)
1 Information mentioned here in is largely based on “Environmental Impact Assessment” by R.R. Barthwal, New Age International Publishers, 2002
143
Suggested Reading
1. Environmental Impact Analysis, Jain, R.K., Urban, L.V., and Stacey, G.S., Van
Nostrand Rein hold Co. 1977.
2. Environment Impact Assessment, Barthwal, R.R. New Age International, New
Delhi 2002.
3. Environment Impact Assessment (Practical Solutions to Recurrent Problems).
David P. Lowrence. Wiley Interscience, New Jersey 2003.
4. Environment Impact Assessment, Srivastava, A.K., APH Publishing Corporation,
New Delhi – 2003.
5. Ecology, Impact Assessment and environment Planning, Walter E. Westman.,
John Wiley & Sons, Canada 1985.
144
CHAPTER – VII
7.0 Procedure for EIA clearance
Every human activity produces some effect on environment. The Consequential
effect are more negative than positive. Ministry of Environment and Forests have
outlined the procedure as below:
EIA Cycle and Procedures
The EIA processes in India is made up of eight phases
Phase I Screening
Screening is done to visualize whether a project requires Environmental
Clearance or not as per the statutory notifications (as per Environment Protection Act
(1986) MOEF Notification on EIA dated January 27, 1994 and July 7, 2004).
Screening is needed on the part of proponents and regulating agencies vis-a vis
scales of investment, type of development and location of development. A project
requires statutory environmental clearance only if the provisions of EIA notification
cover it in as much as:
Prohibiting locations of industries except those related to tourism in a belt of
1.0 km from high tide mark from the Revdanda Creek upto Devgarh point
(near Shrivardhan) as well as in 1.0 km belt along the banks of Rajpure Creek
in Murud Janjira area in the Raigarh district of Maharastra (6th January 1989)
Restricting locations of industries, mining operations and other activities in
Doon Valley (Uttaranchal) (1st February 1989)
Regulating activities in the coastal stretches of the country by classifying them
as coastal regulation zone and prohibiting certain activities (19th February
1991)
Restricting location of industries and regulating other activities in Dhonu
Taluka in Maharashtra (6th January 1991)
Restricting certain activities in specified areas of Aravalle Range in the
Gurgaon district of Hayana and Alwar district of Rajasthan (7th May 1992)
145
Regulating industrial and other activities, which could lead to pollution and
congestion in an area north west of Numaligarh in Assam (5th July 1992)
Phase II Scoping and consideration of Alternatives
Scoping is an important consideration of detailing terms of reference of EIA. The
project proponent either by a team of experts (scientist and engineers) or consultants so
appointed should work it out or may also be referred to the Environment Impact Agency.
The MOEF has published guidelines for different sectors signifying issues to be
addressed in EIA studies. Quantifiable impacts are to be assessed on the basis of
magnitude, prevalence, frequency and duration and non quantifiable impacts (such as
aesthetic or recreational value). Significance is determined by socio-economic criteria.
After the area is identified, the base line data should be obtained and likely
changes predicted for important attributes during construction and operation.
Phase III Base line data
Base line data denotes the existing conditions and environmental status of the
identified area. The site specific primary data should be collected for identified attributes
and supplemented by secondary data if available.
Phase IV Impact Prediction
Impact prediction is a way of mapping the environmental consequences of
selected significant attributes of the project and its alternatives. The prediction can not be
absolute and therefore it would be prudent to consider all the possible factors and take all
precautions for reducing the degree of uncertainty.
The following impacts of the project should be assessed:
Air – Changes in ambient levels and ground level conc. from point, line and area
sources. Effects on soil, materials, vegetation and human health.
Noise – Changes in ambient levels due to noise produced from equipment, DG
sets and movement of vehicles.
Water – availability to competing users, changes in quality, sediment transport
and ingress of saline water.
146
Land – Changes in land use, drainage pattern, changes in land quality including
effects of waste disposal.
Biological – Deforestation, tree felling and shrinkage in animal habitat. Impact on
flora and fauna (including aquatic), impact on rare, threatened or endangered
species endemic sp. or migratory animals. Impact on breeding on nesting sites.
Socio-economic – Impact on local community including demographic changes,
economic status, human health and increase traffic.
Phase V Assessment of alternatives, delineation of mitigation measures and
Environmental Impact
For every project, alternatives should be identified and environmental attributes
compared. This should include location, and technologies. One of the alternative could be
no project. Alternatives should than be ranked in terms of predicted impacts, mitigation
and socio-economic costs.
Once the alternative has been chosen, a mitigation plan be drawn with
Environmental Management Plan (EMP). Risk factor should also be discussed.
Phase VI Public Hearing
The law requires that public must be informed and consulted in the proposed
development after the completion of EIA report.
The stake holders are entitled to have access to executive summary of EIA. They
may include:
bonafide local residents
local associations
environmental groups
any other person located at the site/site of displacement
The State Pollution Control Board shall cause a notice for environmental public
hearing (published in at least two news papers, one of them should be in local
language) mentioning date, time and place. Suggestions, views, comments shall
be invited within 30 days from the date of publication. Details are given in
Schedule IV of notification (page 97).
147
Phase V Decision making
Decision making process involve consultation between the project proponents
(assisted by Technical experts/consultants/and the impact assessment authority (assisted
by an expert group/committee if necessary). The decision is arrived at through evaluation
of EIA and EMP.
Phase VI Monitoring the Clearance conditions
Monitoring should be done during construction and operation phases of a project.
This is to ensure that:
a) Commitments made are complied,
b) observe that whether the predictions made in the EIA reports were correct or
not,
c) corrective measures have been made or not,
d) Environmental Management Plan is in place or not.
(Lecture 31) Suggested Reading
1. Environmental Impact Assessment Impact Assessment Division, Ministry of
Environment and forest, GoI, Jan. 2001 (Manual)
148
CHAPTER VIII
8.0 Environment Management
Environment Management is a comprehensive term which involves conservation
of natural resources and energy (energy and resource saving), Pollution prevention,
disposal of treated effluents (Waste regularization), Solid waste disposal, environmental
audit and concept of green cities.
8.1 Natural Resource Conservation
A natural resource is a thing needed by on organism or group of Organisms
(population, community) for well being. Its usefulness changes with growth of
technology. The sum of all physical, Chemical, biological and social factors which
comprise the surroundings constitutes a resource on which man draws to have a better
living. Thus any part of our natural environment such as land, water, air, minerals, forest,
rangeland, wild life, fish or even human population, that man can utilize to promote his
welfare is regarded as a natural resource.
Ramade (1984) defined a resource as a form of energy and / or matter which is
essential for the functioning of organisms, population and Ecosystem.
8.1.1. Classification of Natural Resources
The classic subdivisions of resources include renewable and non renewable
resources.
Renewable sources are those which are reproducible and are obtained from the
biomass of living organisms e.g. Forest & fish.
Non renewable sources are those which are not reproducible and are obtained
from the finite non living reserves e.g. coal oil and minerals.
Solar energy although have a finite life, as a special use is considered as
Renewable as it will in exhaustible on human scale.
Some authors classify resources, into biotic (living) and abiotic (non living). A
broader classification is given below: (proposed by Owen 1971).
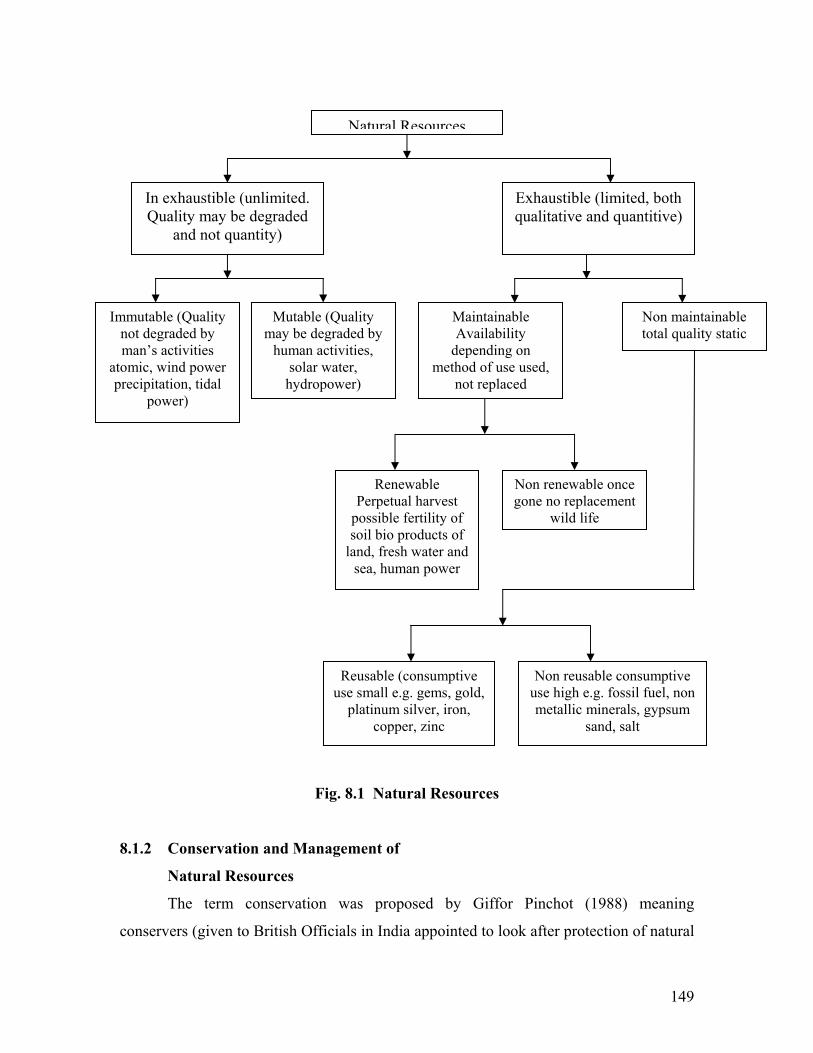
149
Fig. 8.1 Natural Resources
8.1.2 Conservation and Management of
Natural Resources
The term conservation was proposed by Giffor Pinchot (1988) meaning
conservers (given to British Officials in India appointed to look after protection of natural
Natural Resources
In exhaustible (unlimited. Quality may be degraded
and not quantity)
Exhaustible (limited, both qualitative and quantitive)
Immutable (Quality not degraded by man’s activities
atomic, wind power precipitation, tidal
power)
Mutable (Quality may be degraded by
human activities, solar water,
hydropower)
Maintainable Availability
depending on method of use used,
not replaced
Non maintainable total quality static
Renewable Perpetual harvest
possible fertility of soil bio products of
land, fresh water and sea, human power
Non renewable once gone no replacement
wild life
Reusable (consumptive use small e.g. gems, gold,
platinum silver, iron, copper, zinc
Non reusable consumptive use high e.g. fossil fuel, non metallic minerals, gypsum
sand, salt
150
resources). It is driven from two Latin words con (together) and Server (to keep guard)
thus meaning to keep together. The dictionary meaning is to preserve. In 1967 John F.
Kennedy (US President) looked upon Conservation as “The wish use of our Natural
Environment ….” The prevention of waste and despoilment while preserving and
renewing the quality and usefulness of all our resources. The aim of conservation is two
fold.
(i) preservation of quality of environment and
(ii) to ensure continuous yield of useful material- living or nonliving – by
establishing a balanced cycle of harvest and renewal
The concept of resource conservation has become still wider now to cover
Environmental Management, which is in essence, the process of allocating natural and
man made resources, so that optimum use of environment is achieved for an idefinite
future and at the same time preventing depletion and degradation of resources.
8.1.3 Conservation of Water
Water moves from the ocean to Air to land to ocean in set Cycling Pattern Called
Hydrologic Cycle (discussed in para 1.2.3).
Goethe said “Every thing originated in the water and every thing is sustained by
water”. Water is needed to fulfill diverse requirements in so many diverse ways. It is vital
to life since for all physiological activities of plants and animals. It constitutes 80% of
protoplasm.
Flood plains of rivers have been the cradle of civilization and centers of
population historically. Besides temperature, water is the other key factor that influences
global ecology. Covering 70% of land surface and circulating in hydrologic cycle, water
influences weather and climate on any region and thus its flora and fauna.
Agriculture is dependent on water may it be rainfall or surface or ground water
irrigation. In India, agriculture being the most important economy critically depends on
water.
The kinetic energy of gravitational flow of water is tapped and transformed into
electricity hydropower. It leaves no pollution burden on nature as in case of thermal or
atomic power generation.
151
Hardly any industry can do without water. It has many applications in industrial
processes viz. a raw material, solvent, chemical reactant, Coolant and Cleaning reagent.
Water requirement for domestic needs cannot be over emphasized yet it is spoiled
significantly by its usage, as it is the cheapest dilution medium for liquid and solid
wastes.
Water at many places serves as convenient means of navigation. Besides it adds to
the aesthetic, recreation and sports value.
Water being unevenly distributed over land influences, interstate (Punjab,
Haryana, Rajasthan, M.P., Gujrat, Karanataka, Tamil Nadu), international relations (India
– Bangladesh) and thus is the cause of Hydro politics.
It can thus be said that while water is essential for life it is significantly linked
with social economic political and ecological intricacies.
8.1.4 Problems and Management of Water
Management of water implies making the best use of available resources for
human benefit while not only preventing and controlling its depletion and degradation but
also developing it for present and future needs. Water is a multipurpose resource and it is
important that various uses are not in conflict and can be utilized by one and all. Its
allocation and qualitative and quantitative conservation are primary tasks before
managers.
Floods, droughts improper use, pollution and disease transmission are important
problems related to water. Because usable inland water is a very minute fraction of
world’s total water and because largely depends upon this minute fraction, it is important
to make efficient use of available water. This has to be considered in
(a) Irrigation projects
(b) Industrial usage
(c) Municipal process
(d) Daily utilization – domestic needs
The qualitative degradation of water is also in a way quantitative depletion of
usable resources.
Thus recycling of waste water is very important.
152
8.1.5 Future Needs
The demand of fresh water is linked to the growth of population and improved
methods of living.
Possible means of meeting out the impending water deficit include:
(i) Reclamation of sewage and waste water
(ii) Development of Ground water sources and surface storages
(iii) Rain water harvesting
(iv) Desalination of sea water
(Lecture 31)
8.2 Conservation of Energy
The energy crisis of 1970’s has influenced the world at large and a realization has
come that the depletion of fossil fuels is a reality. This was following the OPEC’S refusal
to supply fossil fuel to USA (during Israel War). The developed countries thought that
the crisis can reoccur at any time and that there is no one solution to energy crisis because
the problem is multidimensional involving not only innovations in technology but also
political and social issues.
8.2.1 Energy Production and Balance
Energy is derived from non renewable and renewable resources. The non-
renewable resources are in the process of depletion and include fossil fuels – oil, coal and
natural gas. These resources were built over geological time scale involving million’s of
years. Renewable sources are solar energy wind energy and biomass. It is opined that
about 80% of the world’s energy is produced from fossil fuels. Nuclear plants have been
installed in many countries to tide over the problem. 70% of energy needs in France is
met from Nuclear Power Plants.
An estimate of how much energy was avoidable, how much is available and how
much will be available, is difficult. The most abundant fossil fuel (oil reserves) resource
and production are in the middle East Saudi Arabia in general is the largest oil producing
nation in the World. All fuel resources are in the processes of depletion because of great
demand both by developed World and developing nations. The demand for oil, coal and
Natural gas for the whole world is as below (UN estimate).
153
World’s Demand
1960 1977 1999
Oil 436 x 106 tons 2189 x 106 tons 3200 x 106 tons
Coal 1043 x 106 tons 1635 x 108 tons 2146 x 106 tons
Natural Gas 187 x 106 tons 1022 x 106 tons 2301 x 106 tons
U.S.A. is the leading country where per capita consumption is largest. China has
the maximum consumption among the developing nations and India occupies the second
slot. These are commercial figures and does not include non commercial products like
wood picked and animal dung cakes.
8.2.2 Renewable Energy Resources
The emphasis on the use of non renewable resources (Solar, Wind and Wood) in
developed countries is because of environmental concern while in developing countries it
is due to economic reasons. Among the non conventional resources, hydropower is the
largest. Hydropower projects are in operation both in developed and developing
countries. Notable among the countries using hydropower potential are Brazil, China and
India. Of the total Hydropower potential only 15% is being used at present (14000
Megawatt, 2000). Germany dominated wind installations in 1999 providing 10% of
energy in wind dominated zones. The potential of wind energy is immense and can meet
10% of World’s need (Estimates of Green peace International) by 2020.
The use of solar energy through photovoltaic cells is limited and World’s
production is around 2000 megawatts (1999). The progress is however limited though
supported by Govt. and International agencies.
Biomass resources include mainly wood through various types of cultivated and
uncultivated vegetation has been used. The major countries using biomass, primarily due
to economic reasons are India and Africa. Excessive use of wood has led to depletion of
forest reserves (in patches).
154
8.2.3 Energy Reserves in India
India is relatively endowed with both renewable and nonrenewable sources of
energy. Coal (non coking coal with high ash content, 40-50% and low calorific value,
1300-4200 kcal/kg) is major nonrenewable resource in the country. India has substantial
reserves of nuclear fuels (Thorium 368 x 103 tons. Uranium 34 x 103 tons) but only about
44% are economically exploitable. The country also has reserves of Natural gas. India
ranks 3rd among the coal producing countries of the world. Coal production has grown
100 million tons in 1975-76 to 306 million tons in 1998-99.
Renewable sources are also expected to play an important role in decentralized
locations and remote areas.
The potential of renewable energy is estimated to 10,000 Mega Watts (and
include solar, wind, biomass and small hydroproject) of these 0.9% will be from animal
wastes; solar, 2.6%; solar voltaic cells 13.1% hydropower, 16% biomass and 67.4% wind
power.
Energy Consumption
Major energy consumers are industrial, sector, transport sector and domestic sectors. The total consumption is estimated around 138 billion kWh (104 billion from utilities and 34 billion from captive plants to be met from Industrial sector Coal lignite - 57% December `996-97
Oil and gas - 33%
Hydropower - 3%
Nuclear power - 0.2%
Transport Sector
Transport sector is one of the largest consumer of energy. The main fuel used in
HSD and gasoline which accents for 50% of the total consumption. Consumption of HSD
increased from 9 M tons usage in 1980/81 to 30 M tons in 1996/97. The consumption is
continuously increasing.
155
Agricultural Sector
With mechanized agricultural activities, the consumption of commercial energy
has grown, significantly. There is a decrease in human and animal labor. Electricity
consumption has grown from 8.7 billion kwh in 1975 – 76 to 23.4 billion kWh in 1985/86
to 84 billion kWh in 1996/97.
Domestic Sector
In rural and Urban India the patterns of energy consumption are distinct. The rural
sector is still utilizing biomass (fire wood and animal waste cakes) and kerosene. 78% of
rural population is dependent on conventional sources. Urban population is using LPG
and commercial energy.
8.2.4 Energy and Environmental Concerns
The combustion of various fuels are associated with production of SPM; SO2,
Nox and CO. They pose a threat to the human health. Recent reports (TERI/WHO)
indicate that air quality standard are violated in most of the Indian cities. In addition large
burden on land resources is due to huge quantities of fly ash accumulation. Electric
power generation is also the largest source of green house gases.
The utilization of nuclear resources is limited. Uncertainties about safety and
economics still persists. Accidents also are a major threat. Negotiations for use of nuclear
energy for civilian purposes with USA is on the anvil.
Hydropower generation is the cleanest yet they are under controversy due to
social and environmental costs including displacement and rehabilitation of populations
(Kosi, Tehri). Submergence of forest and wild type habitatt is also of great concern.
Destruction of estuaries and adverse effects on downstream hydrology also can not be
easily wished away.
Industrial and vehicular emissions have become grave in urban area. Daily, the
population of vehicles is increasing on roads. They constitute a big traffic and consequent
social problem. Consumption of both traditional and commercial fuels add up to indoor
pollution problems. Human health is under serious threat both outdoor and indoors.
At the Rio conference (Earth Summit 1992) a clear message was communicated
for efficient use of energy by improving end use efficiency.
156
Some important developments in energy management are
- The contribution of natural gas to energy management.
- advanced technologies for electric power generation have resulted in energy
efficient gains.
- fuel cells that combine H2 and O2 electrochemically to produce electricity, water
and heat
- Development of biomass as fuel
- Photo voltaic power of energy for domestic and small scale Industrial sector is
also promising.
- Use of biodiesel
(Lecture 31&32)
157
8.3 Pollution Prevention
Pollution of all components of environment is one of most important challenge
facing the world today. Traditional pollution control, also called end of the pipe line
treatment has not been found to deliver the goods. These approaches are not
comprehensive or sustainable. There is a paradigm shift from pollution control to
pollution prevention. This approach can be adopted within all sectors, domestic
commercial or industrial “Pollution Prevention (PP) is the continuous application of on
integrated preventive environmental and business strategy to procure resources, processes
and produce or provide services at higher efficiency and increase profitability and reduce
risks to the environment”.
Pollution prevention provides a practical way to gather clues from the conceptual
frame work of sustainable development towards action. It is a tool for industry to achieve
environmental improvement while remaining competitive and profitable. It focuses on
reducing volumes and toxicity of all emissions and waste streams rather than treating
emissions. This approach is also called waste minimization waste avoidance, waste
reduction, waste prevention, green productivity, eco-efficiency and cleaner production.
8.3.1 Waste Management hierarchy
Waste can be in the form of defective products, waste water discharges, air
emissions, solid wastes, hazardous wastes (sometimes), production loss, excess
consumption of water and energy, inefficient use of raw material and human resource.
These are produced at different stages of life cycle as shown in Fig. 8.2.
The hierarchy of waste management as depicted in Fig. 8.3 puts pollution
prevention as the highest priority through avoidance, minimization and closed loop
recycling. Pollution prevention also gestures as “Waste as a misplaced source”.

158
Fig. 8.2 Life Cycle of Waste Generation
Fig. 8.3 Waste Management Hierarchy
Pollution prevention is a continuous endeavor for environmental management.
Pollution prevention emphasizes the elimination and / or reduction of waste at the
source of generation. Energy efficiency is also a pollution prevention concept.
End of pipe line pollution control technologies focus on waste treatment. They
tend to transform wastes from one to another rather than achieving genuine waste
reduction. (Treatment of waste water → Sludge production → Land disposal → Leachate
pollute ground water) Generally, industries consider waste treatment in isolation of
manufacturing process and not together with improved production technologies.
Avoid
Minimise
Recover, Recycle & Re use
Treat and Process
Dispose (controlled)
Dump
Extraction Production Distribution Consumption
Final Disposal
Primary Prod. waste
Industrial waste
Municipal & Industrial
Municipal waste
Waste
Waste
159
8.4 Disposal of Treated Effluents
The treated waste water is either reused or disposed in the environment. This
could be either by disposing in a water body or applied on land, where waste water, seeps
through soil and recharges ground water. Regulating agencies viz State and Central
Pollution Control Boards and Ministry of Environment and Forests under water Act 1974
have stipulated standards for discharge of treated wastes in inland waters and on Land.
A fundamental element of waste disposal is the impact on environment. The
regulatory frame work affects not only the discharge regulations and outfall structures but
also the level of treatment required.
8.4.1 Water Quality Parameters (Discharge/ Disposal in Water)
Important water quality parameters relating to waste water discharges are
dissolved oxygen (D.O.), suspended solids, coliform bacteria, nutrients, pH, biochemical
oxygen demand (BODs) and toxic chemicals including volatile organics, acid/base
neutrals, metals, pesticides and PCBS. (Notifications Under EPA 1986 are mentioned
under chapter 4 para 4.6)
Dissolved Oxygen is important to aquatic life as waters below 4.0 mg/L or 40%.
saturation produces deterimental effect to fauna which depends on it for meeting the
respiratory needs. This however, may vary is different species.
Suspended solids affect the water column by producing turbidity. The solids
finely settle at the bottom and lead to benthic enrichment, toxicity and increased oxygen
demand of the sediment. The solids in suspension also occlude light penetration.
Nutrients, in the form of nitrogen in various forms and phosphates promote the growth of
phytoplankton and other hydrophytes leading to Eutrophication and consequent D.O.
depletion.
Coliform bactria, of enteric origin are indicators of the presence of water borne
pathogens (Salmonella, Shigella and Vibro) of faecal Origin and as such provide a
measure of safety of water for recreation and other uses.
The acid/basic or neutral character of the water is indicated by pH value. This also
determines the chemical and ecological balance of water.
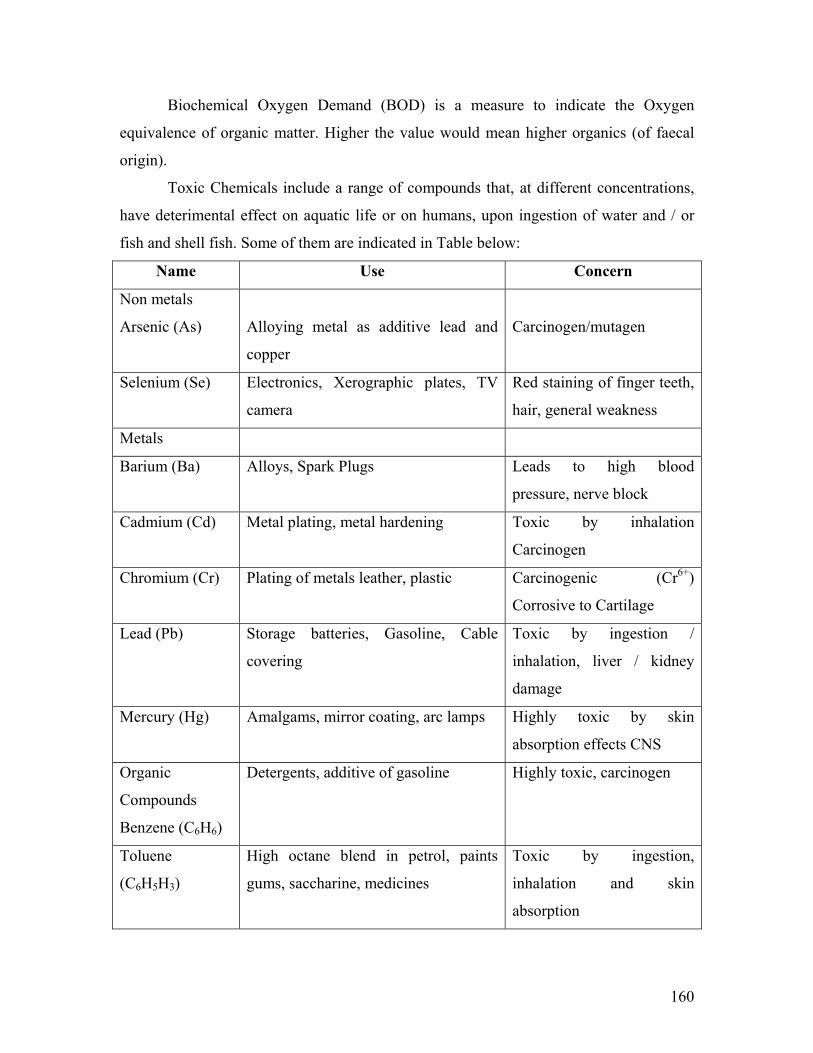
160
Biochemical Oxygen Demand (BOD) is a measure to indicate the Oxygen
equivalence of organic matter. Higher the value would mean higher organics (of faecal
origin).
Toxic Chemicals include a range of compounds that, at different concentrations,
have deterimental effect on aquatic life or on humans, upon ingestion of water and / or
fish and shell fish. Some of them are indicated in Table below:
Name Use Concern
Non metals
Arsenic (As)
Alloying metal as additive lead and
copper
Carcinogen/mutagen
Selenium (Se) Electronics, Xerographic plates, TV
camera
Red staining of finger teeth,
hair, general weakness
Metals
Barium (Ba) Alloys, Spark Plugs Leads to high blood
pressure, nerve block
Cadmium (Cd) Metal plating, metal hardening Toxic by inhalation
Carcinogen
Chromium (Cr) Plating of metals leather, plastic Carcinogenic (Cr6+)
Corrosive to Cartilage
Lead (Pb) Storage batteries, Gasoline, Cable
covering
Toxic by ingestion /
inhalation, liver / kidney
damage
Mercury (Hg) Amalgams, mirror coating, arc lamps Highly toxic by skin
absorption effects CNS
Organic
Compounds
Benzene (C6H6)
Detergents, additive of gasoline Highly toxic, carcinogen
Toluene
(C6H5H3)
High octane blend in petrol, paints
gums, saccharine, medicines
Toxic by ingestion,
inhalation and skin
absorption
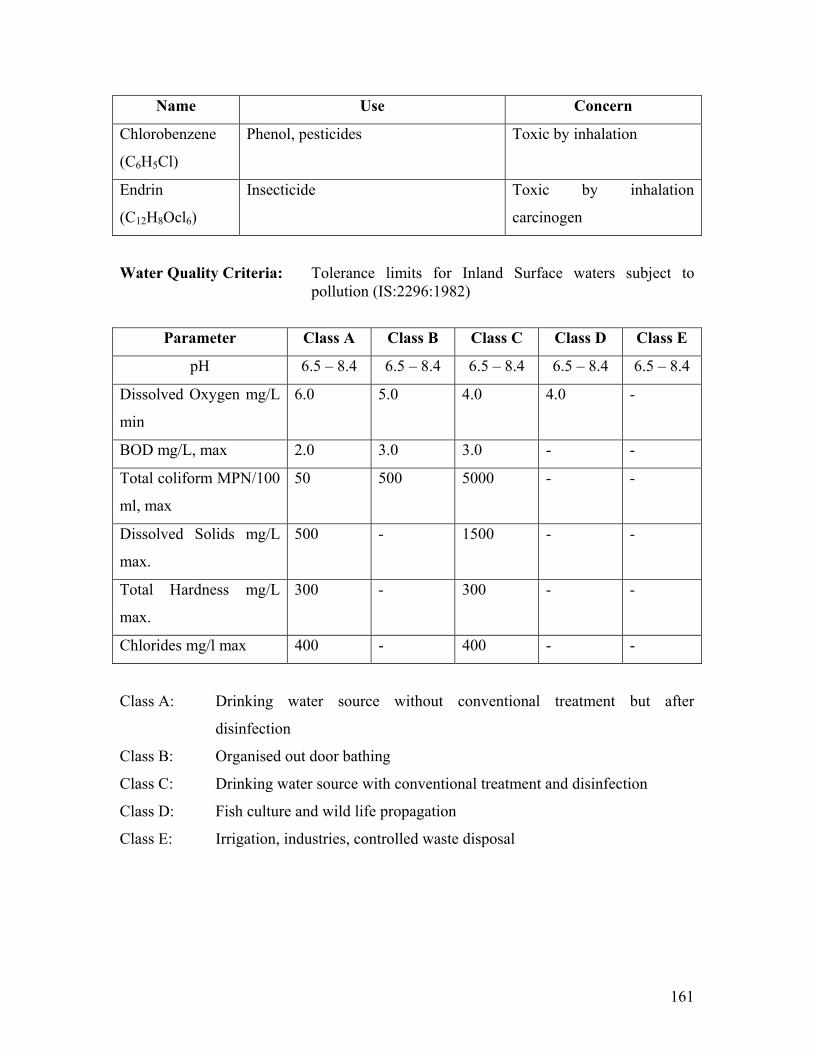
161
Name Use Concern
Chlorobenzene
(C6H5Cl)
Phenol, pesticides Toxic by inhalation
Endrin
(C12H8Ocl6)
Insecticide Toxic by inhalation
carcinogen
Water Quality Criteria: Tolerance limits for Inland Surface waters subject to pollution (IS:2296:1982)
Parameter Class A Class B Class C Class D Class E
pH 6.5 – 8.4 6.5 – 8.4 6.5 – 8.4 6.5 – 8.4 6.5 – 8.4
Dissolved Oxygen mg/L
min
6.0 5.0 4.0 4.0 -
BOD mg/L, max 2.0 3.0 3.0 - -
Total coliform MPN/100
ml, max
50 500 5000 - -
Dissolved Solids mg/L
max.
500 - 1500 - -
Total Hardness mg/L
max.
300 - 300 - -
Chlorides mg/l max 400 - 400 - -
Class A: Drinking water source without conventional treatment but after
disinfection
Class B: Organised out door bathing
Class C: Drinking water source with conventional treatment and disinfection
Class D: Fish culture and wild life propagation
Class E: Irrigation, industries, controlled waste disposal
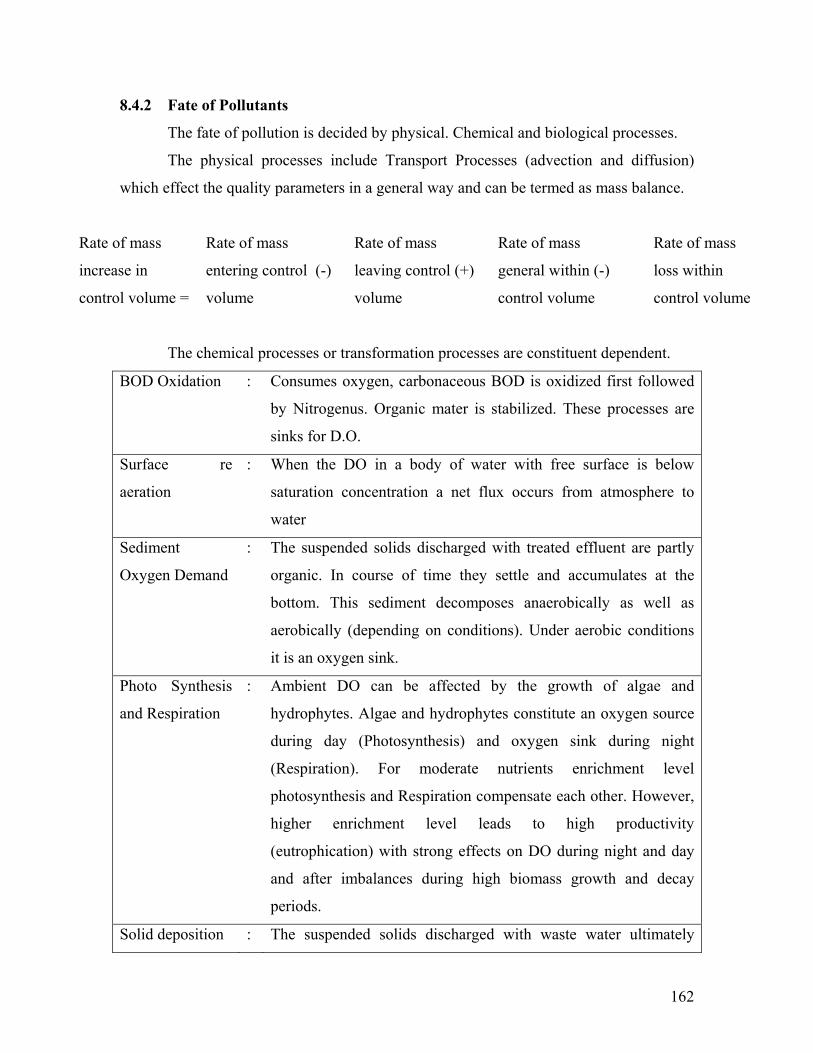
162
8.4.2 Fate of Pollutants
The fate of pollution is decided by physical. Chemical and biological processes.
The physical processes include Transport Processes (advection and diffusion)
which effect the quality parameters in a general way and can be termed as mass balance.
Rate of mass
increase in
control volume =
Rate of mass
entering control (-)
volume
Rate of mass
leaving control (+)
volume
Rate of mass
general within (-)
control volume
Rate of mass
loss within
control volume
The chemical processes or transformation processes are constituent dependent.
BOD Oxidation : Consumes oxygen, carbonaceous BOD is oxidized first followed
by Nitrogenus. Organic mater is stabilized. These processes are
sinks for D.O.
Surface re
aeration
: When the DO in a body of water with free surface is below
saturation concentration a net flux occurs from atmosphere to
water
Sediment
Oxygen Demand
: The suspended solids discharged with treated effluent are partly
organic. In course of time they settle and accumulates at the
bottom. This sediment decomposes anaerobically as well as
aerobically (depending on conditions). Under aerobic conditions
it is an oxygen sink.
Photo Synthesis
and Respiration
: Ambient DO can be affected by the growth of algae and
hydrophytes. Algae and hydrophytes constitute an oxygen source
during day (Photosynthesis) and oxygen sink during night
(Respiration). For moderate nutrients enrichment level
photosynthesis and Respiration compensate each other. However,
higher enrichment level leads to high productivity
(eutrophication) with strong effects on DO during night and day
and after imbalances during high biomass growth and decay
periods.
Solid deposition : The suspended solids discharged with waste water ultimately
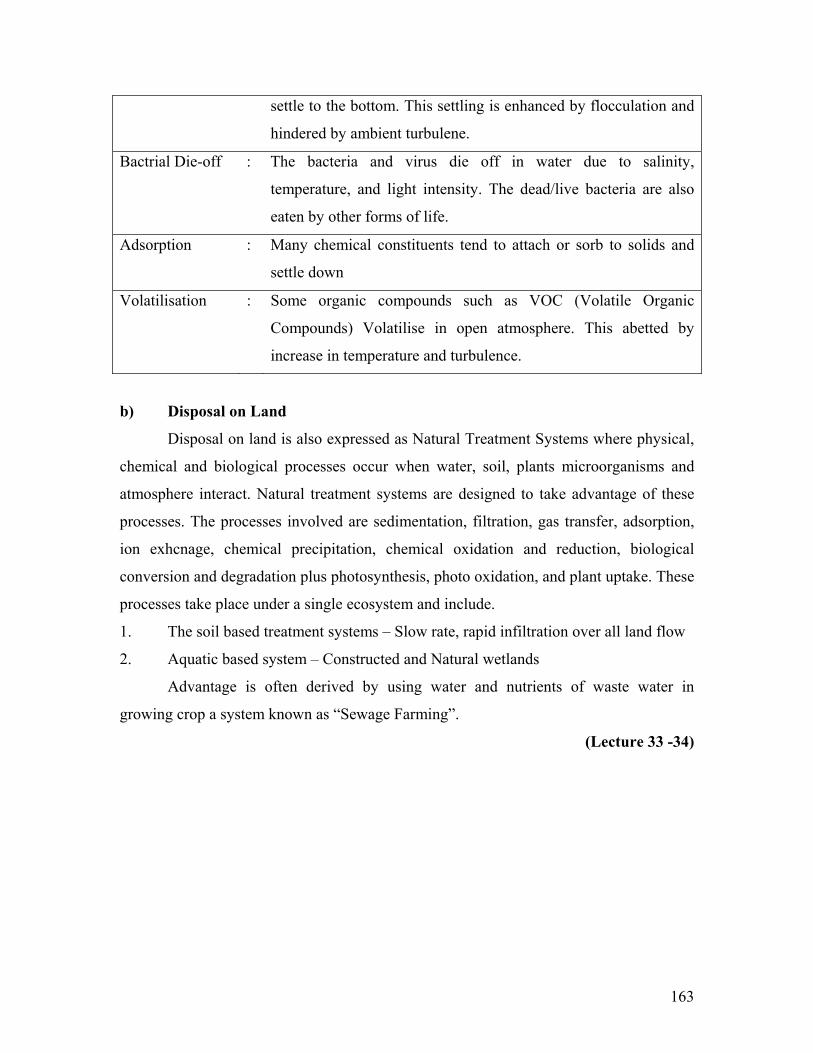
163
settle to the bottom. This settling is enhanced by flocculation and
hindered by ambient turbulene.
Bactrial Die-off : The bacteria and virus die off in water due to salinity,
temperature, and light intensity. The dead/live bacteria are also
eaten by other forms of life.
Adsorption : Many chemical constituents tend to attach or sorb to solids and
settle down
Volatilisation : Some organic compounds such as VOC (Volatile Organic
Compounds) Volatilise in open atmosphere. This abetted by
increase in temperature and turbulence.
b) Disposal on Land
Disposal on land is also expressed as Natural Treatment Systems where physical,
chemical and biological processes occur when water, soil, plants microorganisms and
atmosphere interact. Natural treatment systems are designed to take advantage of these
processes. The processes involved are sedimentation, filtration, gas transfer, adsorption,
ion exhcnage, chemical precipitation, chemical oxidation and reduction, biological
conversion and degradation plus photosynthesis, photo oxidation, and plant uptake. These
processes take place under a single ecosystem and include.
1. The soil based treatment systems – Slow rate, rapid infiltration over all land flow
2. Aquatic based system – Constructed and Natural wetlands
Advantage is often derived by using water and nutrients of waste water in
growing crop a system known as “Sewage Farming”.
(Lecture 33 -34)
164
8.5 Environmental Audit
Environmental audit is a management tool comprising a systematic, documented
periodic and objective evaluation of an organization performing functions of production
within the mandated regulatory requirements.
The environmental audit studies serve the following three basic purposes.
(i) Compilation of the complete information on the operation of the industrial facility
and its potential sources of pollution through technical inspection.
(ii) Evaluation of the conditions surrounding the industrial facility in order to estimate
possible impacts which may be caused and suggested measures for such
situations.
(iii) Preparation and implementation of action plans for better control of the
environment and environmentally related industrial activities, including further
developmental activities of the areas.
The obvious advantages of environmental auditing is to help safeguard the
environment and to substantiate compliance with local, regional and national laws and
regulations, and with the company policy and standards.
8.5.1 General Approach of Environmental Audit
The general approach cover three main phases:
(a) Collection of information
(b) Evaluation of information collected
(c) Formulation of conclusions including identification of aspects needing
improvement
These phases cover, pre audit preparation, a site visit normally involving
interviews with persons and inspection of facilities and post visit activities.
(i) Pre audit Activities :
- Selection and review of site by audit team
- Development of an audit plan, which defines the technical, geographic and
time scope.
- Arranging for sample collection, preservation transport and analysis
165
- Obtaining background information on the plant as well as the Criteria to
be used for evaluation
- Preparation of questionnaires
(ii) Activities at site
- Identification and assessment of the management control system
- Data collection, collation, compilation and evaluation
- Reporting audit findings
(iii) Post Audit Activities
- Preparation of the final report
- Development and follow up for implementation of a corrective action
programme
8.5.2 Problems Encountered During Audit
Problems which the audit team may face are variable with respect to facility.
However what is expected and needs attention are:
(i) Prior history of the site
(ii) Age of relevant equipment
(iii) Lack of records related to the relevant equipment
(iv) Attitude of concerned personnel on site towards audit studies
(v) Responses of the concerned management for implementation the corrective
measures.
8.5.3 Audit Programmes in India
The environment audit programmes were initiated in early ninetys. The Central
Pollution Control Board initiated a study in 18 major polluting industries in 1991-92. At
the same time a paper on “Outline of Environmental Audits was prepared by MOEF and
circulated for comments. This process resulted into issuing a gazette notification on
March 13, 1992 through which submission of the Environmental Audit Report has been
made mandatory. The term Audit Report was later changed to “Statement” through a
revised notification of April 22, 1993. The industries are now supposed to submit their
Auditing Statements to the concerned Boards on or before Sept. 30 every year beginning
1993.
(Lecture 35)
166
8.6 Solid Waste Disposal
The term “Solid Waste” as per USEPA includes any garbage, refuse, sludges and
other discarded material, including solid, semi solid resulting from municipal, domestic,
industrial, commercial and agricultural activities”. This problem is not new. It existed
even before man became aware of sanitation. The problem was initially very low. This
was due to small population, large open spaces and primitive methods of living. It is only
in the last three decades that the dragon of solid wastes raised its head. The problem was
compounded by explosive population growth, rapid industrialization, throw away culture,
discovery and use of plastic in daily life and decline in the concept of recycle.
8.6.1 Characteristics of Solid Wastes
The solid wastes can be categorized into:
(a) Municipal solid wastes
(b) Industrial solid wastes
Municipal solid wastes (MSN) include wastes generated in residential and
commercial areas whereas industrial solid wastes (ISN) are those which are generated
from industrial and agricultural operations.
(a) Municipal Solid Wastes: MSW includes wastes generated in residential areas,
house hold, street wastes and wastes from construction sites. The amount generated per
capita per day varies between 0.85 – 0.25 kg averaging about 0.5 kg. These values for
USA are (2.25 kg), Canada (1.64 kg), U.K. (1.0 kg), Sweden (0.79 kg) and France (0.72
kg). In India the generated wastes from houses undergo change because of unauthorized
picking and salvaging recyclable material by rag pickers and other scavengers. The
quality and the quality at houses and at disposal sites is different. The wastes emanating
from streets includes natural wastes viz. dust blown from unused lands, dead and
decaying vegetation, seeds, leaf fall out and wastes from road traffic; dropping of animals
and excrements.
The quantity of urban wastes also vary seasonally. During festivals the amount of
refuse increases. Physical Characteristics of city refuse from some Indian cities is given
below in Table 8.4.
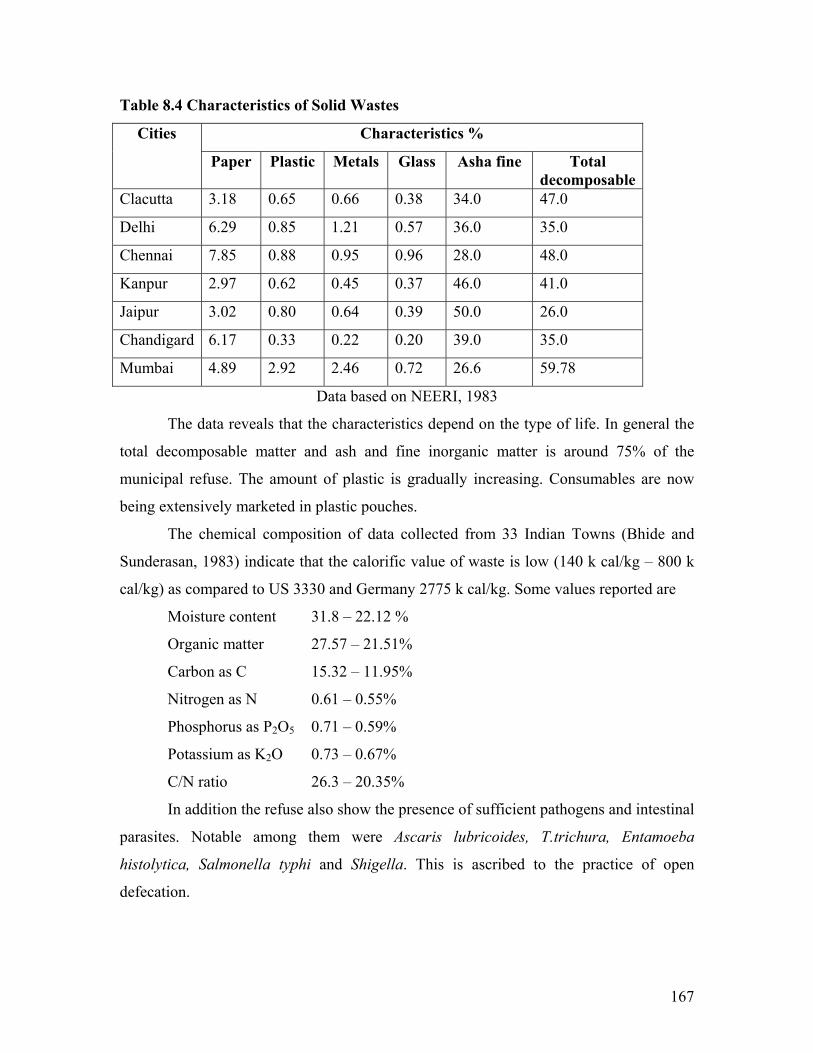
167
Table 8.4 Characteristics of Solid Wastes
Characteristics % Cities
Paper Plastic Metals Glass Asha fine Total decomposable
Clacutta 3.18 0.65 0.66 0.38 34.0 47.0
Delhi 6.29 0.85 1.21 0.57 36.0 35.0
Chennai 7.85 0.88 0.95 0.96 28.0 48.0
Kanpur 2.97 0.62 0.45 0.37 46.0 41.0
Jaipur 3.02 0.80 0.64 0.39 50.0 26.0
Chandigard 6.17 0.33 0.22 0.20 39.0 35.0
Mumbai 4.89 2.92 2.46 0.72 26.6 59.78
Data based on NEERI, 1983
The data reveals that the characteristics depend on the type of life. In general the
total decomposable matter and ash and fine inorganic matter is around 75% of the
municipal refuse. The amount of plastic is gradually increasing. Consumables are now
being extensively marketed in plastic pouches.
The chemical composition of data collected from 33 Indian Towns (Bhide and
Sunderasan, 1983) indicate that the calorific value of waste is low (140 k cal/kg – 800 k
cal/kg) as compared to US 3330 and Germany 2775 k cal/kg. Some values reported are
Moisture content 31.8 – 22.12 %
Organic matter 27.57 – 21.51%
Carbon as C 15.32 – 11.95%
Nitrogen as N 0.61 – 0.55%
Phosphorus as P2O5 0.71 – 0.59%
Potassium as K2O 0.73 – 0.67%
C/N ratio 26.3 – 20.35%
In addition the refuse also show the presence of sufficient pathogens and intestinal
parasites. Notable among them were Ascaris lubricoides, T.trichura, Entamoeba
histolytica, Salmonella typhi and Shigella. This is ascribed to the practice of open
defecation.
168
(b) Industrial Solid Wastes:
All industries generate wastes and the amount is highly variable. The composition
depends on the type of industry. The wastes may be inert, biodegradable, toxic and even
hazardous. There is no accepted method of categorization. The wastes from hospitals and
pathology labs (bio-medical) are hazardous and categorized highly hazardous warranting
separation and treatment. The industries are categorized in three broad categories:
(i) Extractive industries : Where material is extracted from earth, minning, quarrying
and agriculture (including poultry, fruits, (crops)
(ii) Process industries: where raw materials are processed to useful products,
metallurgical industries, chemicals (including oil refineries, pulp and paper,
plastic, glass, textiles,
(iii) Fabricating industries: where processed products are converted to goods,
packaging, automotive, electronics, construction, food processing.
8.6.2 Collection, Storage and Haulage
The problems of solid waste management lie more on collection and
transportation than on final disposal. It is surmised and reported that 80% of the costs are
on collection and transportation that on disposal. (In a community of 5.0 lac people in
USA four million US dollars are spent on solid waste management of which 3.5 million
dollars are spent on collection and transportation). It is a sad commentary that in India
and many other developing countries even a fraction of the amount generated by local
bodies / municipalities is spent on Solid Waste Management. Only a few cosmopolitan
towns, tourist places, religious places have some arrangements. The result of this callous
attitude are visible everywhere. Under Jawahar Lal Nehru National Urban Renewable
Mission (JNNURM) and Urban Infrastructure Development Scheme for Small and
medium towns (UIDSSMT), Ministry of Urban Development, GOI have made large
provisions to improve sanitation including Solid Waste Management in 5161 urban
agglomerates during 11th Plan period.
169
Four arrangements are possible for the collection of solid waste.
(i) Municipal – City employees collect the refuse with city equipment under the
supervision of Public Health Department.
(ii) Contract – Local govt. (municipality) hires an agency on contract to collect and
transport the waste area wise or sector wise and pays to them. The agency utilizes
its equipment and manpower.
(iii) Private – a private arrangement is a contracted to a private firm with the
individual to collect the refuse. He collects payment directly. Govt./Municipality
has no obligation. Many societies in metros have taken upon themselves to collect
and transfer refuse to a designated site.
(iv) Franchise – In this arrangement local govt. authorizes a firm with exclusive rights
of solid waste collection from an area or locality. He collects payment from the
individuals under the scheme.
Out of all the four arrangements, municipal system should be the cheapest but less
efficient. A contract/franchise system though is more costly but is more effective.
A couple of NGOs, utilizing the services of rag pickers have evolved a system in
which a small levy is put on individuals. They sort out the wastes in separate containers
so marked, biodegradable / recyclable / non biodegradable and keep them outside their
houses in containers from where they are picked and transferred to the site of disposal
(transferring station).
The solid wastes from houses (under municipal / contractual) is collected by one
of the following methods.
(a) Curb-service: Collection at the curb of house holds on specified days
(b) Alley service: dust bins placed at the alley line
(c) Set out set back: workmen collect the refuse from houses
(d) backyard service: workment collect the refuse from backyards
Planning a Collection System
The collection system is cost intensive and must be planed in advance, no matter
who owns the responsibility. The most important issue is co-ordination between
collection and transportation system.
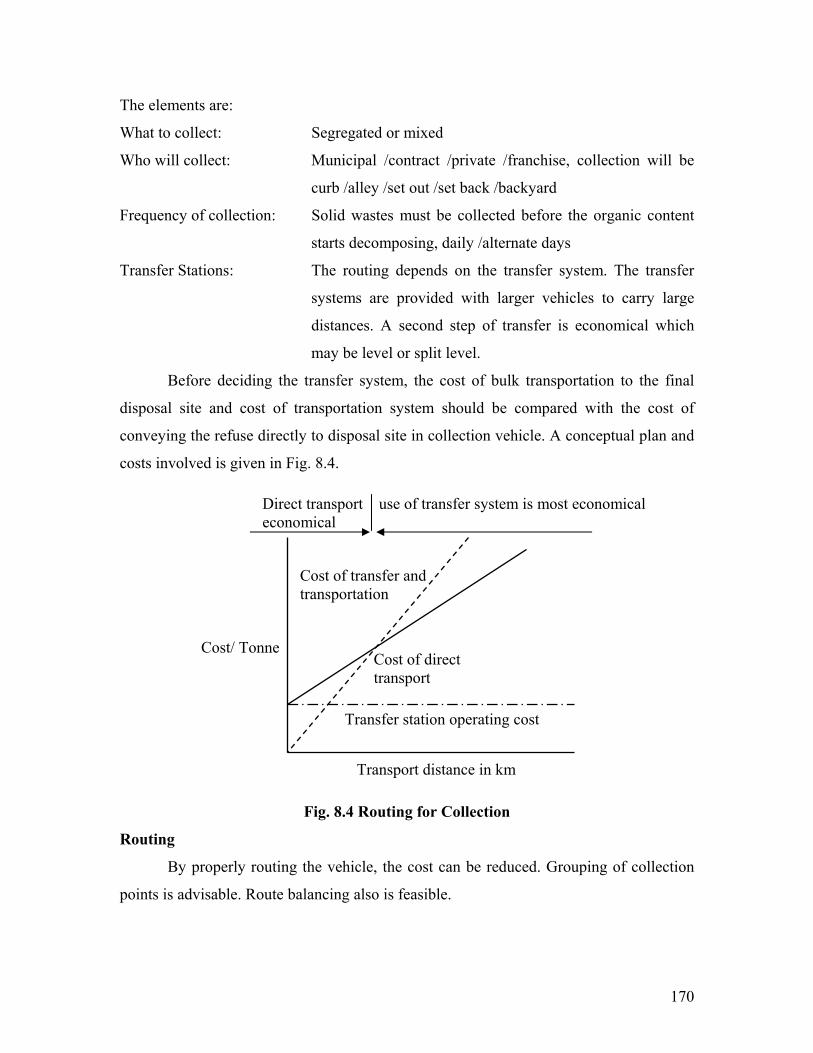
170
The elements are:
What to collect: Segregated or mixed
Who will collect: Municipal /contract /private /franchise, collection will be
curb /alley /set out /set back /backyard
Frequency of collection: Solid wastes must be collected before the organic content
starts decomposing, daily /alternate days
Transfer Stations: The routing depends on the transfer system. The transfer
systems are provided with larger vehicles to carry large
distances. A second step of transfer is economical which
may be level or split level.
Before deciding the transfer system, the cost of bulk transportation to the final
disposal site and cost of transportation system should be compared with the cost of
conveying the refuse directly to disposal site in collection vehicle. A conceptual plan and
costs involved is given in Fig. 8.4.
Fig. 8.4 Routing for Collection
Routing
By properly routing the vehicle, the cost can be reduced. Grouping of collection
points is advisable. Route balancing also is feasible.
Direct transport use of transfer system is most economical economical
Cost/ Tonne
Cost of transfer and transportation
Cost of direct transport
Transfer station operating cost
Transport distance in km
171
8.6.3 Treatment and Disposal
Treatment and disposal involve three methods:
(a) Direct disposal
(b) Processing to facilitate subsequent disposal
(c) Processing to recover materials and energy
(a) Direct disposal
(i) Open dumps: A primitive method in which waste is piled up in open dumps;
common in small towns and rural areas. These dumps are hazardous as they
promote breeding of rodents and flies. The bottom layers of dumps turn anaerobic
and cause odor problems. Due to release of decay gas (methane) they may catch
fires and produce obnoxious smoke.
(ii) Marine disposal: In coastal towns open dumping in sea is practiced. Though sea
is a gigantic sink but the practice is not environmentally compatible. The littoral
zone ecosystems are disturbed. High tide also returns a part of material on shores
making them ugly and non aesthetic.
(iii) Grinding the garbage: The garbage is ground by domestic grinders and dumped
in sewer system. This tends to choke the sewers completely or else partially. This
increases the total solid concentration by 20-50% and oxygen demand by 10%.
(iv) Hog feeding: Hog feeding is selectively practiced on wastes collected from hotels
/ restaurants / institutions / industries (food processing) which are rich in organic
matter. The method is risky and may increase Nematode infestation.
(v) Sanitary land fill: Land fill method is an improvement of open dumping of solid
wastes in pits, ponds, depressions. It is an environmentally safe method of
disposal. A sanitary land fill is defined as “a method of disposal of solid waste in
a small confined area to reduce it to a small volume and to cover it with a layer of
soil after each days operation”. The following steps are necessary in the operation
of a landfill:
(i) deposition in a prepared section
(ii) spreading and compaction in thin layers in order to get maximum density
(iii) covering the waste with a layer of compacted soil cover daily
172
(iv) final covering with 0.6-0.9 m soil
This method is environmentally safe since compaction achieves maximum density
preventing reduction in volume. Soil cover makes it inaccessible for rodents and flies.
Heat generated during decomposition makes it safe as fly larvae, pupae and other
parasites are eliminated.
Land filling operations are brought about in three distinct ways depending on
existing land conditions.
(a) Trench method: Suited for flat land and at places where ground water table is
low. A trench of 2 m deep and 2 x 5m wide is cut. The solid waste is placed in the
trench. Spread and compacted and covered by soil cover (15 cm) and compacted
again. Soil is available as dug material.
(b) Area method: Suited where natural depressions exist (quarries, ravines, ponds
and valleys). The solid waste is placed in the area compacted and covered by soil.
This schedule is followed daily till the depression is filled. The earth required is
taken from adjoining area.
(c) Ramp method: Modified trench method and area method. A trench is cut
transversely across width. The collected solid waste is put through a ramp into the
trench. It is spread compacted and covered by soil daily and compacted again.
The total settlement is summation of primary consolidation. Secondary
Consolidation (or Creep) and decomposition. As a result of natural and artificial
rearrangement of particles the densities of landfill increases. The value reported are 475-
600 kg/m3 (USA), 700 kg/m3 (UK) and 1128 kg/m3 (India). The land fill sites have been
used to locate parks, playgrounds and parking lots. Before locating any activity it must be
ensured that there is no gas production.
(d) Processing to facilitate subsequent disposal
The primary objective of processing before disposal is to reduce the volume
which is intended to cut down haulage and disposal costs. Though volume reduction is
advantageous, the capital and operating cost must be taken into consideration. The
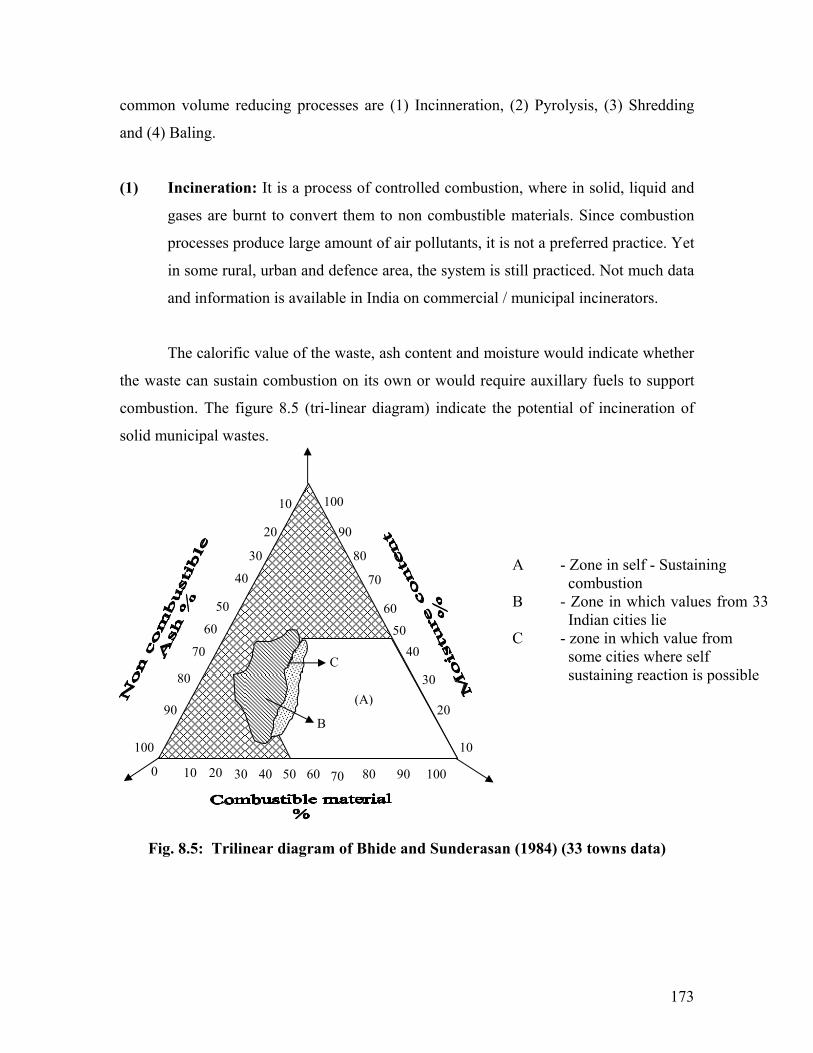
173
common volume reducing processes are (1) Incinneration, (2) Pyrolysis, (3) Shredding
and (4) Baling.
(1) Incineration: It is a process of controlled combustion, where in solid, liquid and
gases are burnt to convert them to non combustible materials. Since combustion
processes produce large amount of air pollutants, it is not a preferred practice. Yet
in some rural, urban and defence area, the system is still practiced. Not much data
and information is available in India on commercial / municipal incinerators.
The calorific value of the waste, ash content and moisture would indicate whether
the waste can sustain combustion on its own or would require auxillary fuels to support
combustion. The figure 8.5 (tri-linear diagram) indicate the potential of incineration of
solid municipal wastes.
Fig. 8.5: Trilinear diagram of Bhide and Sunderasan (1984) (33 towns data)
10
20
30 40
50 60
70
80
90
100
90
80
70
60
5040
30
20
10
100
0 10 20 30 40 50 60 70 80 90 100
C
B (A)
A - Zone in self - Sustaining combustion B - Zone in which values from 33 Indian cities lie C - zone in which value from some cities where self sustaining reaction is possible
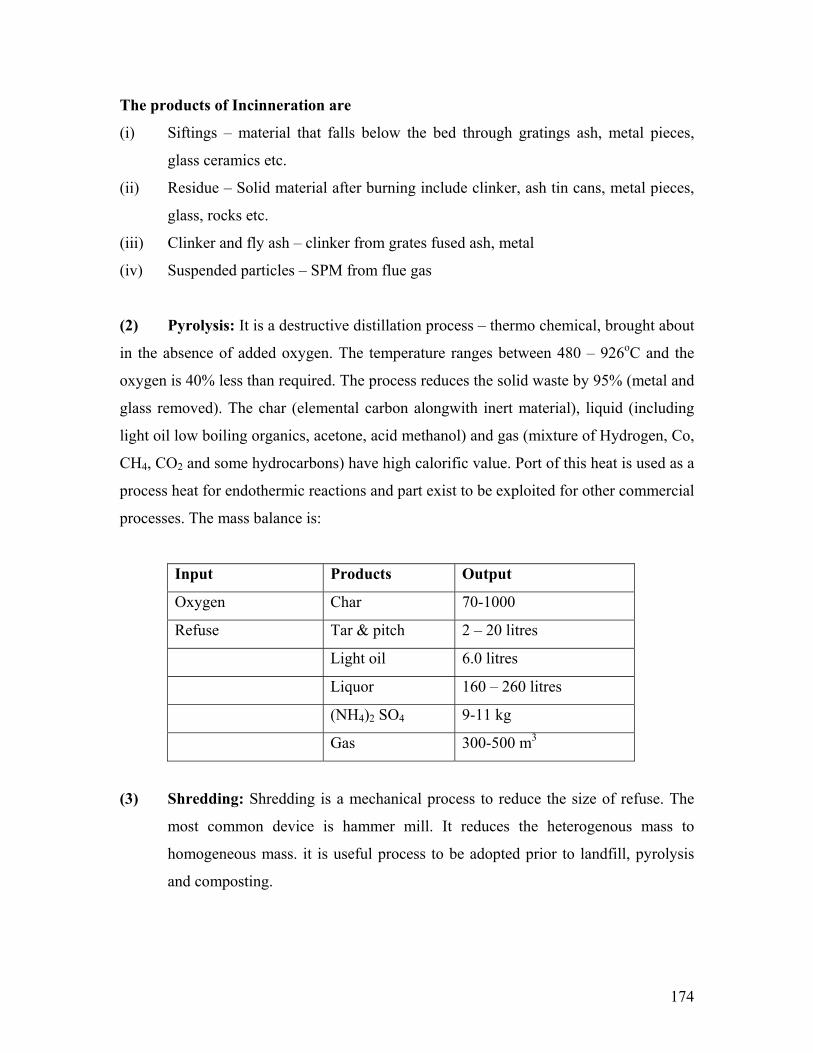
174
The products of Incinneration are
(i) Siftings – material that falls below the bed through gratings ash, metal pieces,
glass ceramics etc.
(ii) Residue – Solid material after burning include clinker, ash tin cans, metal pieces,
glass, rocks etc.
(iii) Clinker and fly ash – clinker from grates fused ash, metal
(iv) Suspended particles – SPM from flue gas
(2) Pyrolysis: It is a destructive distillation process – thermo chemical, brought about
in the absence of added oxygen. The temperature ranges between 480 – 926oC and the
oxygen is 40% less than required. The process reduces the solid waste by 95% (metal and
glass removed). The char (elemental carbon alongwith inert material), liquid (including
light oil low boiling organics, acetone, acid methanol) and gas (mixture of Hydrogen, Co,
CH4, CO2 and some hydrocarbons) have high calorific value. Port of this heat is used as a
process heat for endothermic reactions and part exist to be exploited for other commercial
processes. The mass balance is:
Input Products Output
Oxygen Char 70-1000
Refuse Tar & pitch 2 – 20 litres
Light oil 6.0 litres
Liquor 160 – 260 litres
(NH4)2 SO4 9-11 kg
Gas 300-500 m3
(3) Shredding: Shredding is a mechanical process to reduce the size of refuse. The
most common device is hammer mill. It reduces the heterogenous mass to
homogeneous mass. it is useful process to be adopted prior to landfill, pyrolysis
and composting.
175
(4) Bailing: It is process to increase the density. The material is crushed under brute
force to produce a compact bale. Its density ranges between 950 – 1070 kg/m3.
This is twice the density of a landfill. The bales can be transported to landfill site.
C. Process to recover material and energy: Variety of products can be salvaged
from solid waste viz. metals, glass, ceramics, rubber, plastic. Organic matter can
be stabilized to produce manure and biogas. The stabilization is brought about by
composting.
Composting
The controlled decomposition process to produce stabilized organics is called
composting and the end material as compost. In India, with agricultural base, composting
is a very useful method of solid waste disposal. The compost is useful as a plant nutrient
since it contains NPK in optimum amounts in such form that it can be gradually taken
without leaching. It also contains other soil conditioner agents and improves the soil
texture.
The organic matter in the solid waste is converted to CO2, NO3 and water during
aerobic conditions. The reactions are exothermic and temperature of the mass increases.
The Nitrogen is recycled and CO2 is utilized. Under anaerobic conditions the
decomposition proceeds under reductive conditions and the stabilization is partial. The
products produced are NH4, H2S and CH4.
The composting has some merits and demerits:
Merits
(i) Complete and effective disposal of refuse
(ii) It has great manure value
(iii) It destroys pathogens.
Demerits
(i) Composting mass requires large space.
(ii) Composting mass is associated with unsanitary conditions while turning.
176
Where preferred
(i) Where both refuse and animal dung are to be disposed together.
(ii) Where land is available.
(iii) Where there is market for compost.
(iv) Where ambient temperatures are high.
(Lecture 37 - 39)
8.7 Concept of Green Cities
Four types of Ecosystems exist on the planet earth. They are differentiated on the
basis of utilization of energy. Ecosystems rely on two sources of energy i.e. solar energy
and the energy from chemical fuels. The solar energy is a dilute form of energy as
compared to chemical fuels which are concentrated.
(i) Subsidized Solar powered systems – with energy flow around 1000-10,000
kcal/m2/year averaging about 2000 kcal. Examples – open seas, upland forests,
grass lands, large deep lakes.
(ii) Naturally subsidized solar powered systems – with energy flow around 10,000-
40,000 kcal/m2/year, averaging about 20,000 kcal. Examples, coastal estuary,
rainforests.
(iii) Mansubsidised solar powered Ecosystems - with energy flow of 10,000-40,000
kcal/m2/year averaging about 20,000 kcal. Examples, Aqua culture, agriculture.
(iv) Fuel powered urban industrial systems – with energy flow 10,000-3000,000
kcal/m2 Examples cities, Urban areas, industrial parks.
Every natural system is stable with production equaling consumption except the
fuel powered urban industrial systems. They are not self sustaining. They survive only by
importing food, water, energy and other resources from somewhere else and produce vast
amounts of wastes and affect not only the health of inhabitants but also the environmental
health of rural areas and health of the planet. They are heterotrophic systems. Following
attributes make cities unique ecosystem.
(i) They are heterotrophic and extremely energy intensive.
(ii) They require large inputs of energy and materials,
(iii) They produce copious amount of wastes and lack effective assimilation
mechanism to handle these wastes.
177
(iv) They function not by biophysical interactions but also by social and political
forces.
(v) One keystone species humans exerts over whelming control on ecosystems
process.
Although cities occupy just 2% of Earths surface, their inhabitants use 75% of the
planets natural resources, contribute more than half of the total economy and in some
developing countries upto 80% of their economic activity. On average, urban dwellers
earn higher wages and live easier life than their rural counterparts.
Causes of Urbanization
Urbanization is an outcome of historical compulsions such as defence and
establishment of trade routes. Social reasons include – extended opportunities of social
interactions, and establishment of institutions representing a society (Govt., religion and
education). Economic benefits such as linking with agricultural surpluses, increased
economic opportunities due to access to labour. Specialization and economies of scale
and of agglomeration facilitated setting of urban centers. Causes of rapid urban growth
include natural centers. Causes of rapid urban growth include natural increase – more
births than deaths, immigration (from rural areas). Cities are main centers of education,
jobs higher income, innovation, culture, better health care and trade.
As cities and towns grow, their reliance on resources from afar increase, as well
as their environmental impact ecological foot print. The foot print of city is the total area
of productive land required to support its activities in a sustainable way. Cities imprints
can be 10-100 times larger than their actual area (Food, water, energy requirements,
industrial production, wastes production) Per capita requirement in a city of USA is 20 a
cres of agricultural land, paper and wood products from 1.0 acre of forest and 2000
gallons of water per day. Therefore a city with 1.0 million inhabitants will require 2
million acres of land for food and 2 billion gallons of water.
Urbanization is also responsible for mushrooming of slums which thrive in most
decongested space and unsanitary conditions.
178
Managing Urbanization
Cities need to be managed as local environments. For biodiversity, for human
health and well being and for economic stability. In order to confront the challenges
posed by unprecedented rate of urban growth and increasing urban poverty, cities need to
plan ahead in order to make more informed choices about the future and they need to act
now. Well planned cities can also be environmentally friendly is the concept of green
cities where people can live in a clean and healthy environment. A major part of the
strategy will have environmental focus. Designing effective land use, meeting the
challenge of effective and environmentally friendly transportation, preserving open
space, providing healthy air and water. Investing in the environment closest to them –
urban parks, energy efficiency.
The message of Executive Director UNEP, Mr Klaus Toepfor on World
Environment day sums up the concept of GREEN CITY “Imagine a City where buildings
are solar powered to help generate their own energy, and waste less because they use
power saving lighting and are well insulated, where public transport is affordable and
efficient, where vehicles pollute less because they are powered by electricity or hydrogen.
The city has became part of the solution, not the problem. It is the city of the future. With
support of communities, business and, above all Governments, it can also be the city of
today”.
(Lecture 39)
Suggested Reading
1. Environmental Auditing, Srivastava, A.K. APH Publishing Corporation, New
Delhi.
2. Natural Resources Conservation. Trivedi, P.R., APH Publishing Corporation,
New Delhi.
3. Solid Waste Management in Developing Countries Bhide, A. D. and Sundaresan,
B.B., INSDOC, New Delhi.
4. Waste Water Engineering Treatment Disposal Reuse, Metcalf & EDDY, Inc.
Revised by George Techobanogloes and Franklin L. Burton McGraw – Hill, Inc.
179
CHAPTER IX
9.0 Post Project Monitoring Case History
9.1 Post Project Monitoring
Environment Impact Assessment (Statement) delineates all aspects of the project
and predictable impacts of activities on environment. It provides detail of mitigation
measures alongwith a detailed Environment Management Plan (EMP).
Post project monitoring is aimed at evaluating the progress of project
implementation. Each project is Unique in terms of activities involved. The project
proponents while submitting the projects claim to achieve and ameliorate the impacts of
diverse environmental attributes. The regulatory agency also suggests additional
measures for the protection of environment. The objectives of monitoring thus is to
ascertain whether expressed and suggested measures have been incorporated in the
project and to confirm that they satisfy all legal provisions vis. a vis. Environment
(Protection) Rules 1986 (National Ambient Air Quality Standards; Environment
Protection Act (CPCB) No 29 of 23.5.1986; Classification of Inland Surface Water
(Central Pollution Control Board Standards, IS 10500 – 1983); Indian Standard /
Specifications for Drinking Water (152490 – 1982); Environment (Protection) Rules,
1986, Schedule VI/Standard Prescribed by SPCB’s (Indian Standards for Industrial and
Sewage Discharge, General Standards for discharge of Environment Pollutants) and
Govt. Policies (National Water Policy, 1987; National land use Policy, 1988; National
Forest Policy, 1988, Policy Statement for Abatement of Pollution, 1991; Industrial
Policy, 1991; National Conservation Strategy and Policy Statement on Environment and
Development, 1992; National Rehabilitation and Resettlement Policy and National
Mineral Policy 1993).
Every project has three defined phases
Phase I – Preconstruction phase, planning and development. It includes land
procurement, Clearing and grubbing, removal of existing structures, top soil stripping
excavation and back fill and removal of extra material. Procurement of all support
facilities for the next phase.
180
Phase II – Construction phase. It involves plethora of jobs including excavation,
foundations, bituminous construction. Concrete construction, masonry, timber and steel
construction and furnishing.
The activities during these phases are transient and continue till the project is
completed. They may be operated separately or jointly. The quantum would however,
depend on the magnitude of the project. A close watch during the period is helpful. The
construction phase can lead to significant impacts through high intensity pressures on the
physico chemical environment in relation to air, ground and, surface water, soil and land.
Risks to the sensitive systems are of particular importance.
Phase III – Operation and maintenance is very critical in monitoring. The agency
identified for post project monitoring has to verify all significant impacts specially.
(a) Impacts on Public utilities:
Stress on distributive resources, water, transportation, traffic, loss of open space,
visual impairment, sewage and drainage, solid wastes, noise and health.
(b) Impacts on Resources:
Downstream pollution arising out of use of water extraction of ground water,
lowering of water table and on use of by population in the vicinity. Changes in land
topography top soil and decrease in drainage.
(c) Ecological impacts:
Effect on plant and animal life changes in habitat requirements changes in
biodiversity and occupational health.
The most critical parameters for monitoring would require
i) Water: - Changes in flow patterns, aquifer yield changes in the quality of water
downstream of project progress of rainwater harvesting.
ii) Waste Water: - Collection, carriage, treatment and disposal. The use of treated
waste water in green area development and or other indicated disposal methods.
iii) Solid Waste: - Collection, haulage and disposal as included in the project
proposals of special consideration is changes in aesthetic environment.
iv) Air: - Quality of stack emissions and changes in the ambient air.
v) Land: - Subsistenance and noise.
181
vi) Plantation: - Green cover as envisaged.
vii) Socio economic: - Employment / Placement of stake holders, rehabilitation of
displaced persons, provisions and facilities promised by the promoters of the
affected population changes if any an economic conditions.
The monitoring programme be so drawn as to achieve the basic objectives and
critical parameters.
Lecture 41
9.2 Case Histories
Case histories of some EIA studies should also be discussed. One such study
undertaken by AHEC/I.I.T. Roorkee is appended.
(Lectures 41 - 43)