td mutual funds - 2017 annual financial statements · 2018-03-26 · annual financial statements...
TRANSCRIPT
TD Emerging Markets Fund
for the period ended December 31, 2017
TD Mutual Funds
Annual Financial Statements
(03/18)532152

December 31, 2017 Annual Financial Statements
nManagement’s Responsibility for Financial ReportingThe accompanying financial statements have been prepared by TD AssetManagement Inc. (“TDAM”) as manager of the TD Mutual Fund Trusts,TD Managed Assets Program Portfolios and TD Managed ETF Portfolios(collectively the “Funds” and individually the “Fund”) and approved byTDAM’s board of directors. The manager is responsible for the integrity,objectivity and reliability of the data presented. This responsibility includesselecting appropriate accounting principles and making judgments andestimates consistent with International Financial Reporting Standards(“IFRS”). The manager is also responsible for the development of internalcontrols over the financial reporting process, which are designed toprovide reasonable assurance that relevant and reliable financial informa -tion is produced, and the safeguarding of all assets of the Funds.
The board of directors of TDAM is responsible for reviewing and approvingthe financial statements and overseeing management’s performance of itsfinancial reporting responsibilities.
PricewaterhouseCoopers LLP is the external auditor of the Funds. Theauditor has audited the financial statements in accordance with Canadiangenerally accepted auditing standards to enable them to express theiropinion on the financial statements. The auditor’s report is included on the follow ing page of this annual report.
On behalf of TDAM, manager of the Funds.
Bruce Cooper David LambieDirector and Director andChief Executive Officer Chief Financial OfficerMarch 16, 2018 March 16, 2018
1
To the Unitholders and Trustee of:
December 31, 2017 Annual Financial Statements
nIndependent Auditor’s Report
TD Canadian Money Market FundTD Premium Money Market FundTD U.S. Money Market FundTD Ultra Short Term Bond FundTD Short Term Bond FundTD Canadian Bond FundTD Income Advantage PortfolioTD Canadian Core Plus Bond FundTD Canadian Corporate Bond FundTD Corporate Bond Plus FundTD U.S. Corporate Bond FundTD Real Return Bond FundTD Global Income FundTD Global Core Plus Bond FundTD Global Unconstrained Bond FundTD High Yield Bond FundTD Global Conservative Opportunities FundTD Global Balanced Opportunities FundTD Monthly Income FundTD Tactical Monthly Income FundTD U.S. Monthly Income FundTD U.S. Monthly Income Fund – C$TD Balanced Income FundTD Diversified Monthly Income FundTD Strategic Yield FundTD Balanced Growth FundTD Dividend Income FundTD Canadian Diversified Yield FundTD Canadian Low Volatility FundTD Dividend Growth FundTD Canadian Blue Chip Dividend FundTD Canadian Large-Cap Equity FundTD Canadian Equity FundTD Core Canadian Value FundTD Canadian Value FundTD Canadian Small-Cap Equity FundTD U.S. Risk Managed Equity FundTD U.S. Low Volatility FundTD U.S. Low Volatility Currency Neutral FundTD North American Dividend FundTD U.S. Dividend Growth FundTD U.S. Blue Chip Equity FundTD U.S. Quantitative Equity FundTD U.S. Equity PortfolioTD North American Small-Cap Equity FundTD U.S. Mid-Cap Growth FundTD U.S. Small-Cap Equity Fund
TD Global Risk Managed Equity FundTD Global Low Volatility FundTD International Growth FundTD International Stock FundTD Emerging Markets Low Volatility FundTD Asian Growth FundTD Emerging Markets FundEpoch U.S. Shareholder Yield FundEpoch U.S. Blue Chip Equity FundEpoch U.S. Blue Chip Equity Currency Neutral Fund
Epoch U.S. Large-Cap Value FundEpoch Global Shareholder Yield FundEpoch Global Shareholder Yield Currency Neutral Fund
Epoch Global Equity FundEpoch International Equity FundEpoch European Equity FundTD Resource FundTD Precious Metals FundTD Entertainment & Communications FundTD Science & Technology FundTD Health Sciences FundTD Canadian Bond Index FundTD Balanced Index FundTD Canadian Index FundTD Dow Jones Industrial Average Index FundTD U.S. Index FundTD U.S. Index Currency Neutral FundTD Nasdaq® Index FundTD International Index FundTD International Index Currency Neutral Fund
TD European Index FundTD US$ Retirement PortfolioTD Retirement Conservative PortfolioTD Retirement Balanced PortfolioTD Advantage Balanced Income PortfolioTD Advantage Balanced PortfolioTD Advantage Balanced Growth PortfolioTD Advantage Growth PortfolioTD Advantage Aggressive Growth PortfolioTD Comfort Conservative Income PortfolioTD Comfort Balanced Income PortfolioTD Comfort Balanced PortfolioTD Comfort Balanced Growth PortfolioTD Comfort Growth PortfolioTD Comfort Aggressive Growth Portfolio
TD Fixed Income PoolTD Risk Management PoolTD Canadian Equity PoolTD Global Equity PoolTD Tactical PoolTD Managed Income PortfolioTD Managed Income & Moderate Growth Portfolio
TD Managed Balanced Growth PortfolioTD Managed Aggressive Growth PortfolioTD Managed Maximum Equity Growth Portfolio
TD FundSmart Managed Income & Moderate Growth Portfolio
TD FundSmart Managed Balanced Growth Portfolio
TD FundSmart Managed Aggressive Growth Portfolio
TD Managed Index Income PortfolioTD Managed Index Income & Moderate Growth Portfolio
TD Managed Index Balanced Growth Portfolio
TD Managed Index Aggressive Growth Portfolio
TD Managed Index Maximum Equity Growth Portfolio
TD Managed Income ETF PortfolioTD Managed Income & Moderate Growth ETF Portfolio
TD Managed Balanced Growth ETF PortfolioTD Managed Aggressive Growth ETF PortfolioTD Managed Maximum Equity Growth ETF Portfolio
(collectively, the “Funds”)
2

December 31, 2017 Annual Financial Statements
nIndependent Auditor’s ReportWe have audited the accompanying financial statements of each of theFunds, which comprise the statements of financial position, comprehensiveincome, changes in net assets attributable to holders of redeemable unitsand cash flows as at and for the periods indicated in note 1, and therelated notes, which comprise a summary of significant accounting policiesand other explanatory information.
Management’s responsibility for the financial statementsManagement is responsible for the preparation and fair presentation of the financial statements of each of the Funds in accordance with Inter national Financial Reporting Standards, and for such internal control as manage ment determines is necessary to enable the preparation offinancial statements that are free from material misstatement, whether due to fraud or error.
Auditor’s responsibilityOur responsibility is to express an opinion on the financial statements of each of the Funds based on our audits. We conducted our audits inaccordance with Canadian generally accepted auditing standards. Thosestandards require that we comply with ethical requirements and plan and perform the audit to obtain reasonable assurance about whether thefinancial statements are free from material misstatement.
An audit involves performing procedures to obtain audit evidence aboutthe amounts and disclosures in the financial statements. The proceduresselected depend on the auditor’s judgment, including the assessment of the risks of material misstatement of the financial statements, whetherdue to fraud or error. In making those risk assessments, the auditorconsiders internal control relevant to the entity’s preparation and fairpresentation of the financial statements in order to design audit pro -cedures that are appropriate in the circumstances, but not for the purposeof expressing an opinion on the effectiveness of the entity’s internalcontrol. An audit also includes evaluating the appropriateness of account -ing policies used and the reasonableness of accounting estimates made by management, as well as evaluating the overall presentation of thefinancial statements.
We believe that the audit evidence we have obtained in each of our auditsis sufficient and appropriate to provide a basis for our audit opinion.
OpinionIn our opinion, the financial statements of each of the Funds present fairly, in all material respects, the financial position, financial performanceand cash flows of each of the Funds as at and for the periods indicated in note 1 in accordance with Inter national Financial Reporting Standards.
Chartered Professional Accountants, Licensed Public AccountantsToronto, OntarioMarch 16, 2018
3

December 31, 2017 Annual Financial Statements
nTD Emerging Markets FundStatements of Financial Position (in 000s except per unit amounts)as at December 31, 2017 and 2016
2017 2016
AssetsCurrent AssetsInvestments $ 211,013 $ 165,881Cash 4,995 2,718Dividends Receivable 299 400Subscriptions Receivable 148 200Receivable for Investments Sold 185 158Derivative AssetsRights 0 6Unrealized Appreciation on Open Foreign Exchange Forward Contracts 0 0
216,640 169,363
LiabilitiesCurrent LiabilitiesAccrued Liabilities 46 43Redemptions Payable 176 305Payable for Investments Purchased 15 170Derivative LiabilitiesUnrealized Depreciation on Open Foreign Exchange Forward Contracts 0 0
237 518
Net Assets Attributable to Holders of Redeemable Units $ 216,403 $ 168,845
Net Assets Attributable to Holders of Redeemable Units – Per Series (Note 5)Investor Series $ 141,491 $ 126,513Advisor Series $ 13,922 $ 12,353F-Series $ 16,970 $ 3,411Private-EM Series $ 3,470 $ 1,370O-Series $ 40,550 $ 25,198
$ 216,403 $ 168,845
Net Assets Attributable to Holders of Redeemable Units – Per Series Unit
Investor Series $ 21.21 $ 17.00
Advisor Series $ 26.80 $ 21.48
F-Series $ 31.53 $ 24.94
Private-EM Series $ 13.86 $ 10.92
O-Series $ 18.27 $ 14.31
The accompanying notes are an integral part of the financial statements.
4

December 31, 2017 Annual Financial Statements
nTD Emerging Markets FundStatements of Comprehensive Income (in 000s except per unit amounts)for the periods ended December 31, 2017 and 2016
2017 2016
IncomeForeign Exchange Gain (Loss) on Cash $ (216) $ (346)Securities Lending Income 32 50Net Gain (Loss) on Investments and DerivativesNet Gain (Loss) on InvestmentsInterest for Distribution Purposes 34 14Dividend Income 5,167 3,473Net Realized Gain (Loss) 8,901 5,225Net Change in Unrealized Appreciation/Depreciation 34,350 (673)
Net Gain (Loss) on Investments 48,452 8,039Net Gain (Loss) on DerivativesNet Realized Gain (Loss) (191) (27)Net Change in Unrealized Appreciation/Depreciation (6) (13)
Net Gain (Loss) on Derivatives (197) (40)
Total Net Gain (Loss) on Investments and Derivatives 48,255 7,999
Total Income (Net) 48,071 7,703
Expenses (Note 6)Management Fees 3,855 3,316Securityholder Reporting Costs 1 3Custodial Fees 2 2Administration Fees 575 508Independent Review Committee Fees 2 2Transaction Costs 386 361Interest Charges 0 3
Total Expenses before Waivers 4,821 4,195Less: Waived Expenses 0 (3)
Total Expenses (Net) 4,821 4,192
Increase (Decrease) in Net Assets Attributable to Holders of Redeemable Units before Tax 43,250 3,511
Tax Reclaims (Withholding Taxes) (611) (437)
Increase (Decrease) in Net Assets Attributable to Holders of Redeemable Units $ 42,639 $ 3,074
2017 2016
Increase (Decrease) in Net Assets Attributable to Holders of Redeemable Units – Per SeriesInvestor Series $ 29,828 $ 3,500Advisor Series $ 2,835 $ 193F-Series $ 1,771 $ 118Private-EM Series $ 410 $ 132O-Series $ 7,795 $ (869)
$ 42,639 $ 3,074
Weighted Average Units Outstanding for the Period – Per Series
Investor Series 6,990 7,054
Advisor Series 517 642
F-Series 349 122
Private-EM Series 151 124
O-Series 1,935 350
Increase (Decrease) in Net Assets Attributable to Holders of Redeemable Units – Per Series Unit
Investor Series $ 4.27 $ 0.49
Advisor Series $ 5.48 $ 0.30
F-Series $ 5.08 $ 0.96
Private-EM Series $ 2.72 $ 1.07
O-Series $ 4.03 $ (2.48)
The accompanying notes are an integral part of the financial statements.
5
December 31, 2017 Annual Financial Statements
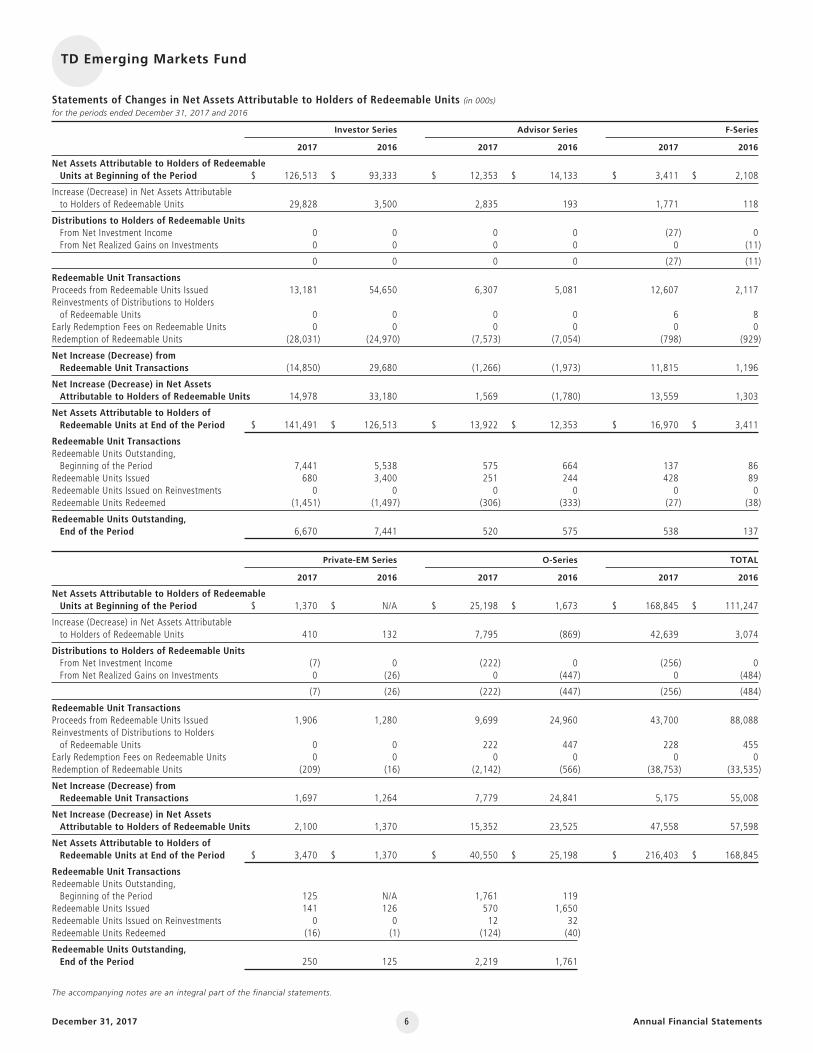
Statements of Changes in Net Assets Attributable to Holders of Redeemable Units (in 000s)for the periods ended December 31, 2017 and 2016
Investor Series Advisor Series F-Series
2017 2016 2017 2016 2017 2016
Net Assets Attributable to Holders of Redeemable Units at Beginning of the Period $ 126,513 $ 93,333 $ 12,353 $ 14,133 $ 3,411 $ 2,108
Increase (Decrease) in Net Assets Attributable to Holders of Redeemable Units 29,828 3,500 2,835 193 1,771 118
Distributions to Holders of Redeemable UnitsFrom Net Investment Income 0 0 0 0 (27) 0From Net Realized Gains on Investments 0 0 0 0 0 (11)
0 0 0 0 (27) (11)
Redeemable Unit TransactionsProceeds from Redeemable Units Issued 13,181 54,650 6,307 5,081 12,607 2,117Reinvestments of Distributions to Holders of Redeemable Units 0 0 0 0 6 8
Early Redemption Fees on Redeemable Units 0 0 0 0 0 0Redemption of Redeemable Units (28,031) (24,970) (7,573) (7,054) (798) (929)
Net Increase (Decrease) from Redeemable Unit Transactions (14,850) 29,680 (1,266) (1,973) 11,815 1,196
Net Increase (Decrease) in Net Assets Attributable to Holders of Redeemable Units 14,978 33,180 1,569 (1,780) 13,559 1,303
Net Assets Attributable to Holders of Redeemable Units at End of the Period $ 141,491 $ 126,513 $ 13,922 $ 12,353 $ 16,970 $ 3,411
Redeemable Unit TransactionsRedeemable Units Outstanding, Beginning of the Period 7,441 5,538 575 664 137 86
Redeemable Units Issued 680 3,400 251 244 428 89Redeemable Units Issued on Reinvestments 0 0 0 0 0 0Redeemable Units Redeemed (1,451) (1,497) (306) (333) (27) (38)
Redeemable Units Outstanding, End of the Period 6,670 7,441 520 575 538 137
Private-EM Series O-Series TOTAL
2017 2016 2017 2016 2017 2016
Net Assets Attributable to Holders of Redeemable Units at Beginning of the Period $ 1,370 $ N/A $ 25,198 $ 1,673 $ 168,845 $ 111,247
Increase (Decrease) in Net Assets Attributable to Holders of Redeemable Units 410 132 7,795 (869) 42,639 3,074
Distributions to Holders of Redeemable UnitsFrom Net Investment Income (7) 0 (222) 0 (256) 0From Net Realized Gains on Investments 0 (26) 0 (447) 0 (484)
(7) (26) (222) (447) (256) (484)
Redeemable Unit TransactionsProceeds from Redeemable Units Issued 1,906 1,280 9,699 24,960 43,700 88,088Reinvestments of Distributions to Holders of Redeemable Units 0 0 222 447 228 455
Early Redemption Fees on Redeemable Units 0 0 0 0 0 0Redemption of Redeemable Units (209) (16) (2,142) (566) (38,753) (33,535)
Net Increase (Decrease) from Redeemable Unit Transactions 1,697 1,264 7,779 24,841 5,175 55,008
Net Increase (Decrease) in Net Assets Attributable to Holders of Redeemable Units 2,100 1,370 15,352 23,525 47,558 57,598
Net Assets Attributable to Holders of Redeemable Units at End of the Period $ 3,470 $ 1,370 $ 40,550 $ 25,198 $ 216,403 $ 168,845
Redeemable Unit TransactionsRedeemable Units Outstanding, Beginning of the Period 125 N/A 1,761 119
Redeemable Units Issued 141 126 570 1,650Redeemable Units Issued on Reinvestments 0 0 12 32Redeemable Units Redeemed (16) (1) (124) (40)
Redeemable Units Outstanding, End of the Period 250 125 2,219 1,761
nTD Emerging Markets Fund
The accompanying notes are an integral part of the financial statements.
6

December 31, 2017 Annual Financial Statements
nTD Emerging Markets FundStatements of Cash Flows (in 000s)for the periods ended December 31, 2017 and 2016
2017 2016
Cash Flows from (used in) Operating ActivitiesIncrease (Decrease) in Net Assets Attributable to Holders of Redeemable Units $ 42,639 $ 3,074
Adjustment For:Unrealized Foreign Exchange (Gain) Loss on Cash 53 24Net Realized (Gain) Loss on Sale of Investments and Derivatives (8,710) (5,198)
Net Change in Unrealized Appreciation/Depreciation of Investments and Derivatives (34,344) 686
Purchase of Investments (75,998) (71,766)Proceeds from Sale and/or Maturity of Investments 73,749 69,694
(Increase) Decrease in Dividends Receivable 96 (188)Increase (Decrease) in Accrued Liabilities 3 (220)
Net Cash from (used in) Operating Activities (2,512) (3,894)
Cash Flows from (used in) Financing ActivitiesDistributions Paid to Holders of Redeemable Units, Net of Reinvested Distributions (28) (29)
Proceeds from Issuance of Redeemable Units 42,909 35,408Amounts Paid on Redemption of Redeemable Units, Net of Early Redemption Fees (38,039) (30,599)
Net Cash from (used in) Financing Activities 4,842 4,780
Unrealized Foreign Exchange Gain (Loss) on Cash (53) (24)Net Increase (Decrease) in Cash 2,330 886Cash (Bank Overdraft) at Beginning of the Period 2,718 1,856
Cash (Bank Overdraft) at End of the Period $ 4,995 $ 2,718
Interest for Distribution Purposes Received*, Net of Withholding Taxes $ 34 $ 14
Dividends Received*, Net of Withholding Taxes $ 4,654 $ 2,851
* Included as part of Cash Flows from (used in) Operating Activities.
The accompanying notes are an integral part of the financial statements.
7
December 31, 2017 Annual Financial Statements
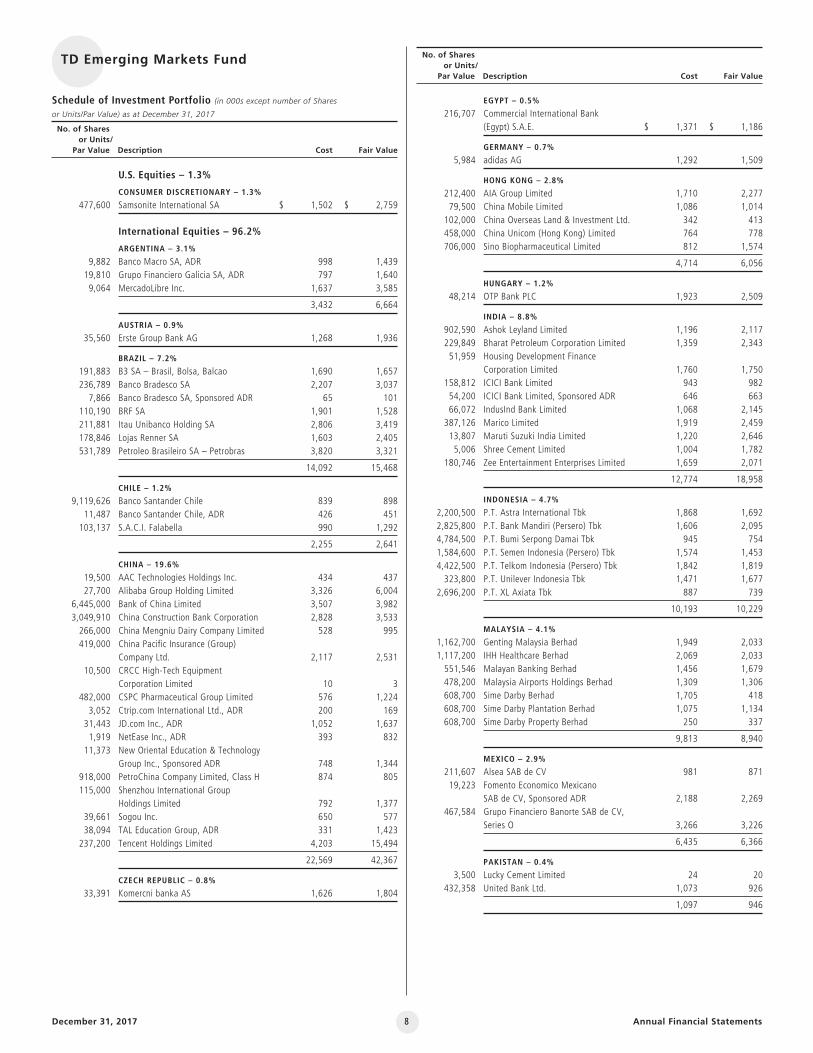
U.S. Equities – 1.3%
CONSUMER DISCRETIONARY – 1.3%
477,600 Samsonite International SA $ 1,502 $ 2,759
International Equities – 96.2%
ARGENTINA – 3.1%
9,882 Banco Macro SA, ADR 998 1,439 19,810 Grupo Financiero Galicia SA, ADR 797 1,640 9,064 MercadoLibre Inc. 1,637 3,585
3,432 6,664
AUSTRIA – 0.9%
35,560 Erste Group Bank AG 1,268 1,936
BRAZIL – 7.2%
191,883 B3 SA – Brasil, Bolsa, Balcao 1,690 1,657 236,789 Banco Bradesco SA 2,207 3,037 7,866 Banco Bradesco SA, Sponsored ADR 65 101 110,190 BRF SA 1,901 1,528 211,881 Itau Unibanco Holding SA 2,806 3,419 178,846 Lojas Renner SA 1,603 2,405 531,789 Petroleo Brasileiro SA – Petrobras 3,820 3,321
14,092 15,468
CHILE – 1.2%
9,119,626 Banco Santander Chile 839 898 11,487 Banco Santander Chile, ADR 426 451 103,137 S.A.C.I. Falabella 990 1,292
2,255 2,641
CHINA – 19.6%
19,500 AAC Technologies Holdings Inc. 434 437 27,700 Alibaba Group Holding Limited 3,326 6,004 6,445,000 Bank of China Limited 3,507 3,982 3,049,910 China Construction Bank Corporation 2,828 3,533 266,000 China Mengniu Dairy Company Limited 528 995 419,000 China Pacific Insurance (Group)
Company Ltd. 2,117 2,531 10,500 CRCC High-Tech Equipment
Corporation Limited 10 3 482,000 CSPC Pharmaceutical Group Limited 576 1,224 3,052 Ctrip.com International Ltd., ADR 200 169 31,443 JD.com Inc., ADR 1,052 1,637 1,919 NetEase Inc., ADR 393 832 11,373 New Oriental Education & Technology
Group Inc., Sponsored ADR 748 1,344 918,000 PetroChina Company Limited, Class H 874 805 115,000 Shenzhou International Group
Holdings Limited 792 1,377 39,661 Sogou Inc. 650 577 38,094 TAL Education Group, ADR 331 1,423 237,200 Tencent Holdings Limited 4,203 15,494
22,569 42,367
CZECH REPUBLIC – 0.8%
33,391 Komercni banka AS 1,626 1,804
EGYPT – 0.5%
216,707 Commercial International Bank (Egypt) S.A.E. 1,371 1,186
GERMANY – 0.7%
5,984 adidas AG 1,292 1,509
HONG KONG – 2.8%
212,400 AIA Group Limited 1,710 2,277 79,500 China Mobile Limited 1,086 1,014 102,000 China Overseas Land & Investment Ltd. 342 413 458,000 China Unicom (Hong Kong) Limited 764 778 706,000 Sino Biopharmaceutical Limited 812 1,574
4,714 6,056
HUNGARY – 1.2%
48,214 OTP Bank PLC 1,923 2,509
INDIA – 8.8%
902,590 Ashok Leyland Limited 1,196 2,117 229,849 Bharat Petroleum Corporation Limited 1,359 2,343 51,959 Housing Development Finance
Corporation Limited 1,760 1,750 158,812 ICICI Bank Limited 943 982 54,200 ICICI Bank Limited, Sponsored ADR 646 663 66,072 IndusInd Bank Limited 1,068 2,145 387,126 Marico Limited 1,919 2,459 13,807 Maruti Suzuki India Limited 1,220 2,646 5,006 Shree Cement Limited 1,004 1,782 180,746 Zee Entertainment Enterprises Limited 1,659 2,071
12,774 18,958
INDONESIA – 4.7%
2,200,500 P.T. Astra International Tbk 1,868 1,692 2,825,800 P.T. Bank Mandiri (Persero) Tbk 1,606 2,095 4,784,500 P.T. Bumi Serpong Damai Tbk 945 754 1,584,600 P.T. Semen Indonesia (Persero) Tbk 1,574 1,453 4,422,500 P.T. Telkom Indonesia (Persero) Tbk 1,842 1,819 323,800 P.T. Unilever Indonesia Tbk 1,471 1,677 2,696,200 P.T. XL Axiata Tbk 887 739
10,193 10,229
MALAYSIA – 4.1%
1,162,700 Genting Malaysia Berhad 1,949 2,033 1,117,200 IHH Healthcare Berhad 2,069 2,033 551,546 Malayan Banking Berhad 1,456 1,679 478,200 Malaysia Airports Holdings Berhad 1,309 1,306 608,700 Sime Darby Berhad 1,705 418 608,700 Sime Darby Plantation Berhad 1,075 1,134 608,700 Sime Darby Property Berhad 250 337
9,813 8,940
MEXICO – 2.9%
211,607 Alsea SAB de CV 981 871 19,223 Fomento Economico Mexicano
SAB de CV, Sponsored ADR 2,188 2,269 467,584 Grupo Financiero Banorte SAB de CV,
Series O 3,266 3,226
6,435 6,366
PAKISTAN – 0.4%
3,500 Lucky Cement Limited 24 20 432,358 United Bank Ltd. 1,073 926
1,097 946
$ $
nTD Emerging Markets FundSchedule of Investment Portfolio (in 000s except number of Shares or Units/Par Value) as at December 31, 2017
No. of Shares or Units/ Par Value Description Cost Fair Value
No. of Shares or Units/ Par Value Description Cost Fair Value
8
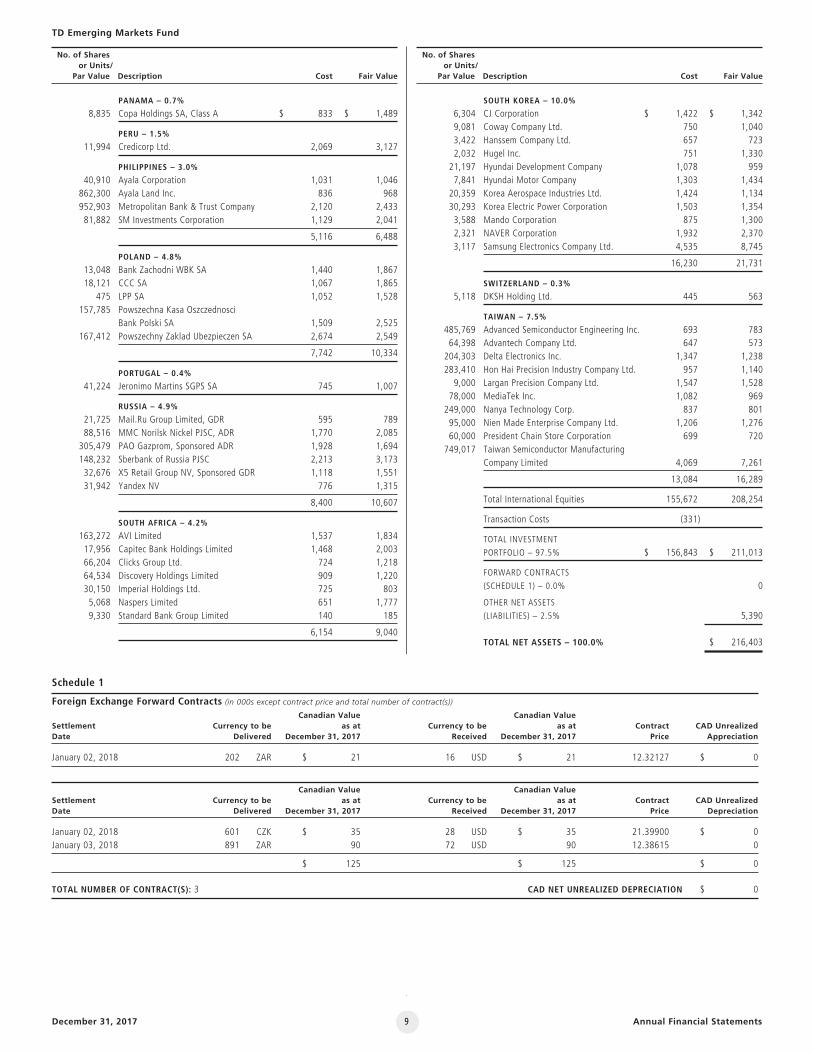
PANAMA – 0.7%
8,835 Copa Holdings SA, Class A 833 1,489
PERU – 1.5%
11,994 Credicorp Ltd. 2,069 3,127
PHILIPPINES – 3.0%
40,910 Ayala Corporation 1,031 1,046 862,300 Ayala Land Inc. 836 968 952,903 Metropolitan Bank & Trust Company 2,120 2,433 81,882 SM Investments Corporation 1,129 2,041
5,116 6,488
POLAND – 4.8%
13,048 Bank Zachodni WBK SA 1,440 1,867 18,121 CCC SA 1,067 1,865 475 LPP SA 1,052 1,528 157,785 Powszechna Kasa Oszczednosci
Bank Polski SA 1,509 2,525 167,412 Powszechny Zaklad Ubezpieczen SA 2,674 2,549
7,742 10,334
PORTUGAL – 0.4%
41,224 Jeronimo Martins SGPS SA 745 1,007
RUSSIA – 4.9%
21,725 Mail.Ru Group Limited, GDR 595 789 88,516 MMC Norilsk Nickel PJSC, ADR 1,770 2,085 305,479 PAO Gazprom, Sponsored ADR 1,928 1,694 148,232 Sberbank of Russia PJSC 2,213 3,173 32,676 X5 Retail Group NV, Sponsored GDR 1,118 1,551 31,942 Yandex NV 776 1,315
8,400 10,607
SOUTH AFRICA – 4.2%
163,272 AVI Limited 1,537 1,834 17,956 Capitec Bank Holdings Limited 1,468 2,003 66,204 Clicks Group Ltd. 724 1,218 64,534 Discovery Holdings Limited 909 1,220 30,150 Imperial Holdings Ltd. 725 803 5,068 Naspers Limited 651 1,777 9,330 Standard Bank Group Limited 140 185
6,154 9,040
$ $ SOUTH KOREA – 10.0%
6,304 CJ Corporation 1,422 1,342 9,081 Coway Company Ltd. 750 1,040 3,422 Hanssem Company Ltd. 657 723 2,032 Hugel Inc. 751 1,330 21,197 Hyundai Development Company 1,078 959 7,841 Hyundai Motor Company 1,303 1,434 20,359 Korea Aerospace Industries Ltd. 1,424 1,134 30,293 Korea Electric Power Corporation 1,503 1,354 3,588 Mando Corporation 875 1,300 2,321 NAVER Corporation 1,932 2,370 3,117 Samsung Electronics Company Ltd. 4,535 8,745
16,230 21,731
SWITZERLAND – 0.3%
5,118 DKSH Holding Ltd. 445 563
TAIWAN – 7.5%
485,769 Advanced Semiconductor Engineering Inc. 693 783 64,398 Advantech Company Ltd. 647 573 204,303 Delta Electronics Inc. 1,347 1,238 283,410 Hon Hai Precision Industry Company Ltd. 957 1,140 9,000 Largan Precision Company Ltd. 1,547 1,528 78,000 MediaTek Inc. 1,082 969 249,000 Nanya Technology Corp. 837 801 95,000 Nien Made Enterprise Company Ltd. 1,206 1,276 60,000 President Chain Store Corporation 699 720 749,017 Taiwan Semiconductor Manufacturing
Company Limited 4,069 7,261
13,084 16,289
Total International Equities 155,672 208,254
Transaction Costs (331)
TOTAL INVESTMENT
PORTFOLIO – 97.5% $ 156,843 $ 211,013
FORWARD CONTRACTS
(SCHEDULE 1) – 0.0% 0
OTHER NET ASSETS (LIABILITIES) – 2.5% 5,390
TOTAL NET ASSETS – 100.0% $ 216,403
$ $
December 31, 2017 Annual Financial Statements
No. of Shares or Units/ Par Value Description Cost Fair Value
No. of Shares or Units/ Par Value Description Cost Fair Value
TD Emerging Markets Fund
Schedule 1
Foreign Exchange Forward Contracts (in 000s except contract price and total number of contract(s)) Canadian Value Canadian Value Settlement Currency to be as at Currency to be as at Contract CAD Unrealized Date Delivered December 31, 2017 Received December 31, 2017 Price Appreciation
January 02, 2018 202 ZAR $ 21 16 USD $ 21 12.32127 $ 0
Canadian Value Canadian Value Settlement Currency to be as at Currency to be as at Contract CAD Unrealized Date Delivered December 31, 2017 Received December 31, 2017 Price Depreciation
January 02, 2018 601 CZK $ 35 28 USD $ 35 21.39900 $ 0January 03, 2018 891 ZAR 90 72 USD 90 12.38615 0
$ 125 $ 125 $ 0
TOTAL NUMBER OF CONTRACT(S): 3 CAD NET UNREALIZED DEPRECIATION $ 0
9
December 31, 2017 Annual Financial Statements
Fund-Specific Notes to the Financial Statements
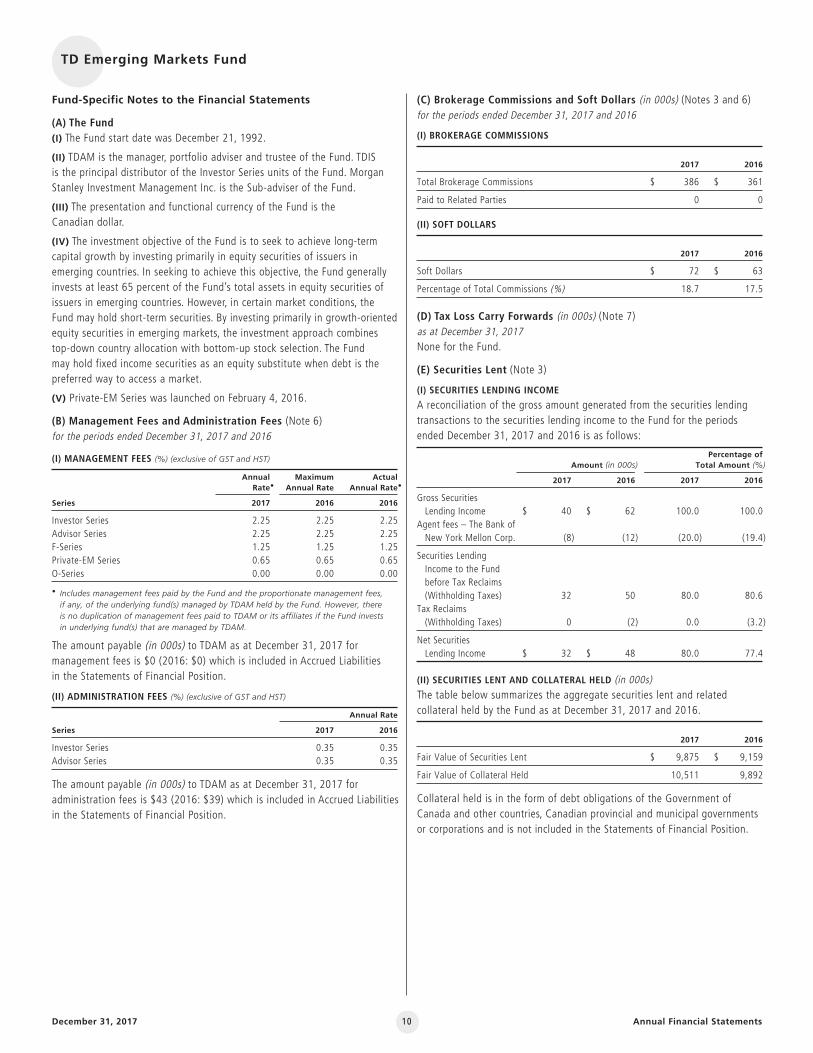
(A) The Fund(I) The Fund start date was December 21, 1992.
(II) TDAM is the manager, portfolio adviser and trustee of the Fund. TDIS is the principal distributor of the Investor Series units of the Fund. MorganStanley Investment Management Inc. is the Sub-adviser of the Fund.
(III) The presentation and functional currency of the Fund is the Canadian dollar.
(IV) The investment objective of the Fund is to seek to achieve long-termcapital growth by investing primarily in equity securities of issuers inemerging countries. In seeking to achieve this objective, the Fund generallyinvests at least 65 percent of the Fund’s total assets in equity securities ofissuers in emerging countries. However, in certain market conditions, the Fund may hold short-term securities. By investing primarily in growth-orientedequity securities in emerging markets, the investment approach combines top-down country allocation with bottom-up stock selection. The Fund may hold fixed income securities as an equity substitute when debt is thepreferred way to access a market.
(V) Private-EM Series was launched on February 4, 2016.
(B) Management Fees and Administration Fees (Note 6)for the periods ended December 31, 2017 and 2016
(I) MANAGEMENT FEES (%) (exclusive of GST and HST)
Annual Maximum Actual Rate• Annual Rate Annual Rate•
Series 2017 2016 2016
Investor Series 2.25 2.25 2.25Advisor Series 2.25 2.25 2.25F-Series 1.25 1.25 1.25Private-EM Series 0.65 0.65 0.65O-Series 0.00 0.00 0.00
• Includes management fees paid by the Fund and the proportionate management fees, if any, of the underlying fund(s) managed by TDAM held by the Fund. However, there is no duplication of management fees paid to TDAM or its affiliates if the Fund invests in underlying fund(s) that are managed by TDAM.
The amount payable (in 000s) to TDAM as at December 31, 2017 formanagement fees is $0 (2016: $0) which is included in Accrued Liabilities in the Statements of Financial Position.
(II) ADMINISTRATION FEES (%) (exclusive of GST and HST)
Annual Rate
Series 2017 2016
Investor Series 0.35 0.35Advisor Series 0.35 0.35
The amount payable (in 000s) to TDAM as at December 31, 2017 foradministration fees is $43 (2016: $39) which is included in Accrued Liabilitiesin the Statements of Financial Position.
(C) Brokerage Commissions and Soft Dollars (in 000s) (Notes 3 and 6)for the periods ended December 31, 2017 and 2016
(I) BROKERAGE COMMISSIONS
2017 2016
Total Brokerage Commissions $ 386 $ 361
Paid to Related Parties 0 0
(II) SOFT DOLLARS
2017 2016
Soft Dollars $ 72 $ 63
Percentage of Total Commissions (%) 18.7 17.5
(D) Tax Loss Carry Forwards (in 000s) (Note 7)as at December 31, 2017None for the Fund.
(E) Securities Lent (Note 3)
(I) SECURITIES LENDING INCOME
A reconciliation of the gross amount generated from the securities lendingtransactions to the securities lending income to the Fund for the periodsended December 31, 2017 and 2016 is as follows:
Percentage of Amount (in 000s) Total Amount (%)
2017 2016 2017 2016
Gross Securities Lending Income $ 40 $ 62 100.0 100.0
Agent fees – The Bank of New York Mellon Corp. (8) (12) (20.0) (19.4)
Securities Lending Income to the Fund before Tax Reclaims (Withholding Taxes) 32 50 80.0 80.6
Tax Reclaims (Withholding Taxes) 0 (2) 0.0 (3.2)
Net Securities Lending Income $ 32 $ 48 80.0 77.4
(II) SECURITIES LENT AND COLLATERAL HELD (in 000s)The table below summarizes the aggregate securities lent and relatedcollateral held by the Fund as at December 31, 2017 and 2016.
2017 2016
Fair Value of Securities Lent $ 9,875 $ 9,159
Fair Value of Collateral Held 10,511 9,892
Collateral held is in the form of debt obligations of the Government ofCanada and other countries, Canadian provincial and municipal governmentsor corporations and is not included in the Statements of Financial Position.
nTD Emerging Markets Fund
10

December 31, 2017 Annual Financial Statements
(F) Financial Risk Management (Notes 3, 4 and 8)as at December 31, 2017 and 2016
(I) INTEREST RATE RISK
Not significant or applicable to the Fund.
(II) CURRENCY RISK
The following table indicates the foreign currencies to which the fund hadexposure to as at December 31, 2017 and 2016 in Canadian dollar terms,including the underlying principal amount of foreign exchange forwardcontracts, as applicable. The table also illustrates the potential impact to the Fund’s net assets if the Fund’s functional currency, the Canadian dollar,had strengthened or weakened by 5 percent in relation to all exposure to other currencies, with all other variables held constant. In practice, theactual trading results may differ from these approximate sensitivity amountsand the differences could be material.
Foreign Exchange Financial Forward Total Impact on Currency (in 000s) Instruments Contracts Exposure* Net Assets*
December 31, 2017Brazilian Real $ 15,507 $ 0 $ 15,507 $ 775Chilean Peso 2,190 0 2,190 110Czech Koruna 1,838 (35) 1,803 90Egyptian Pound 1,185 0 1,185 59Euro 4,452 0 4,452 223Hong Kong Dollar 39,201 0 39,201 1,960Hungarian Forint 2,509 0 2,509 125Indian Rupee 18,295 0 18,295 915Indonesian Rupiah 10,229 0 10,229 511Malaysian Ringgit 8,940 0 8,940 447Mexican Peso 4,097 0 4,097 205New Taiwan Dollar 16,289 0 16,289 814Pakistan Rupee 1,010 0 1,010 51Philippine Peso 6,491 0 6,491 325Polish Zloty 10,334 0 10,334 517South African Rand 9,152 (111) 9,041 452South Korean Won 21,884 0 21,884 1,094Swiss Franc 563 0 563 28United States Dollar 42,449 146 42,595 2,130
Total $ 216,615 $ 0 $ 216,615 $ 10,831
As Percentage of Net Assets (%) 100.1 5.0
* Includes both monetary and non-monetary instruments, where applicable.
Total Impact on Currency (in 000s) Exposure* Net Assets*
December 31, 2016Brazilian Real $ 13,126 $ 656Chilean Peso 1,094 55Colombian Peso 1,228 61Czech Koruna 1,536 77Egyptian Pound 897 45Euro 4,002 200Hong Kong Dollar 28,724 1,436Hungarian Forint 866 43Indian Rupee 13,820 691Indonesian Rupiah 9,111 456Japanese Yen 876 44Mexican Peso 4,800 240New Taiwan Dollar 15,372 769New Turkish Lira 439 22Pakistan Rupee 2,358 118Philippine Peso 6,180 309Polish Zloty 5,423 271South African Rand 9,295 465South Korean Won 18,152 908Swiss Franc 1,188 59Thai Baht 3,764 188United States Dollar 26,821 1,341
Total $ 169,072 $ 8,454
As Percentage of Net Assets (%) 100.1 5.0
* Includes both monetary and non-monetary instruments, where applicable.
(III) OTHER PRICE RISK
The table below summarizes the impact of other price risk to the Fund. As atDecember 31, 2017 and 2016, had the benchmark of the Fund increased ordecreased by 5 percent, with all other variables held constant, the net assetsof the Fund would have increased or decreased by approximately:
Impact on Impact on Net Assets (in 000s) Net Assets (%)
Benchmark 2017 2016 2017 2016
MSCI Emerging Markets Index (Net Dividend, C$) $ 9,918 $ 7,548 4.6 4.5
In practice, the actual trading results may differ from the above estimatedamounts and the differences could be material.
(IV) CREDIT RISK
Not significant or applicable to the Fund.
Fund-Specific Notes to the Financial StatementsTD Emerging Markets Fund
11
December 31, 2017 Annual Financial Statements
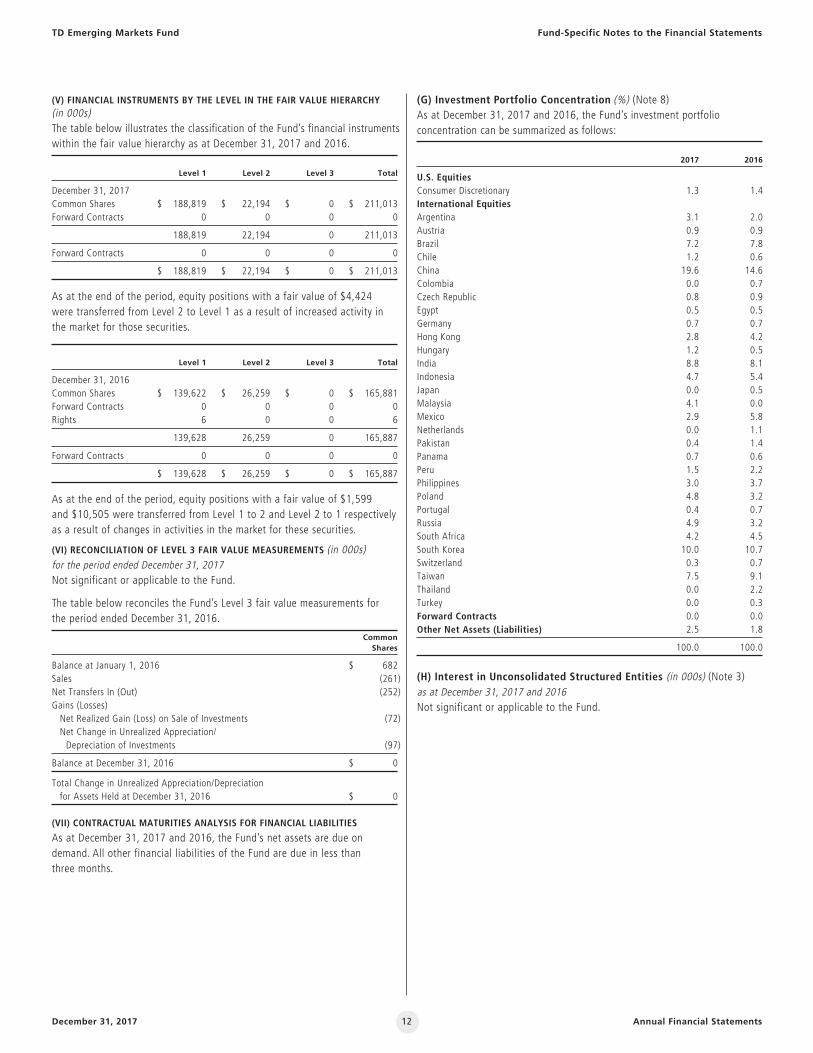
(V) FINANCIAL INSTRUMENTS BY THE LEVEL IN THE FAIR VALUE HIERARCHY (in 000s)The table below illustrates the classification of the Fund’s financial instrumentswithin the fair value hierarchy as at December 31, 2017 and 2016.
Level 1 Level 2 Level 3 Total
December 31, 2017Common Shares $ 188,819 $ 22,194 $ 0 $ 211,013Forward Contracts 0 0 0 0
188,819 22,194 0 211,013
Forward Contracts 0 0 0 0
$ 188,819 $ 22,194 $ 0 $ 211,013
As at the end of the period, equity positions with a fair value of $4,424 were transferred from Level 2 to Level 1 as a result of increased activity in the market for those securities.
Level 1 Level 2 Level 3 Total
December 31, 2016Common Shares $ 139,622 $ 26,259 $ 0 $ 165,881Forward Contracts 0 0 0 0Rights 6 0 0 6
139,628 26,259 0 165,887
Forward Contracts 0 0 0 0
$ 139,628 $ 26,259 $ 0 $ 165,887
As at the end of the period, equity positions with a fair value of $1,599 and $10,505 were transferred from Level 1 to 2 and Level 2 to 1 respectivelyas a result of changes in activities in the market for these securities.
(VI) RECONCILIATION OF LEVEL 3 FAIR VALUE MEASUREMENTS (in 000s)for the period ended December 31, 2017Not significant or applicable to the Fund.
The table below reconciles the Fund’s Level 3 fair value measurements for the period ended December 31, 2016.
Common Shares
Balance at January 1, 2016 $ 682Sales (261)Net Transfers In (Out) (252)Gains (Losses)Net Realized Gain (Loss) on Sale of Investments (72)Net Change in Unrealized Appreciation/Depreciation of Investments (97)
Balance at December 31, 2016 $ 0
Total Change in Unrealized Appreciation/Depreciation for Assets Held at December 31, 2016 $ 0
(VII) CONTRACTUAL MATURITIES ANALYSIS FOR FINANCIAL LIABILITIES
As at December 31, 2017 and 2016, the Fund’s net assets are due ondemand. All other financial liabilities of the Fund are due in less than three months.
(G) Investment Portfolio Concentration (%) (Note 8)As at December 31, 2017 and 2016, the Fund’s investment portfolioconcentration can be summarized as follows:
2017 2016
U.S. EquitiesConsumer Discretionary 1.3 1.4International EquitiesArgentina 3.1 2.0Austria 0.9 0.9Brazil 7.2 7.8Chile 1.2 0.6China 19.6 14.6Colombia 0.0 0.7Czech Republic 0.8 0.9Egypt 0.5 0.5Germany 0.7 0.7Hong Kong 2.8 4.2Hungary 1.2 0.5India 8.8 8.1Indonesia 4.7 5.4Japan 0.0 0.5Malaysia 4.1 0.0Mexico 2.9 5.8Netherlands 0.0 1.1Pakistan 0.4 1.4Panama 0.7 0.6Peru 1.5 2.2Philippines 3.0 3.7Poland 4.8 3.2Portugal 0.4 0.7Russia 4.9 3.2South Africa 4.2 4.5South Korea 10.0 10.7Switzerland 0.3 0.7Taiwan 7.5 9.1Thailand 0.0 2.2Turkey 0.0 0.3Forward Contracts 0.0 0.0Other Net Assets (Liabilities) 2.5 1.8
100.0 100.0
(H) Interest in Unconsolidated Structured Entities (in 000s) (Note 3)as at December 31, 2017 and 2016Not significant or applicable to the Fund.
Fund-Specific Notes to the Financial StatementsTD Emerging Markets Fund
12
December 31, 2017 Annual Financial Statements
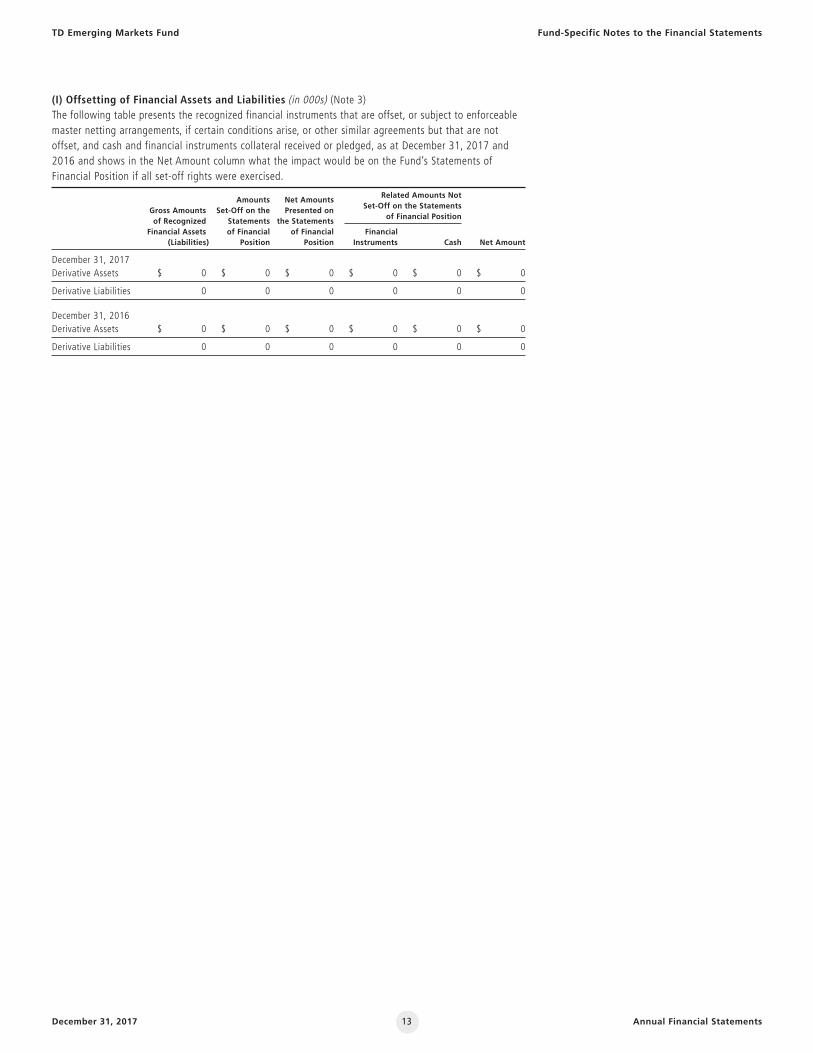
(I) Offsetting of Financial Assets and Liabilities (in 000s) (Note 3)The following table presents the recognized financial instruments that are offset, or subject to enforceablemaster netting arrangements, if certain conditions arise, or other similar agreements but that are notoffset, and cash and financial instruments collateral received or pledged, as at December 31, 2017 and2016 and shows in the Net Amount column what the impact would be on the Fund’s Statements ofFinancial Position if all set-off rights were exercised.
Amounts Net Amounts Related Amounts Not
Gross Amounts Set-Off on the Presented on Set-Off on the Statements
of Recognized Statements the Statements of Financial Position
Financial Assets of Financial of Financial Financial (Liabilities) Position Position Instruments Cash Net Amount
December 31, 2017Derivative Assets $ 0 $ 0 $ 0 $ 0 $ 0 $ 0
Derivative Liabilities 0 0 0 0 0 0
December 31, 2016Derivative Assets $ 0 $ 0 $ 0 $ 0 $ 0 $ 0
Derivative Liabilities 0 0 0 0 0 0
TD Emerging Markets Fund Fund-Specific Notes to the Financial Statements
13

1. The Funds
The TD Mutual Fund Trusts and TD Managed Assets Program Portfolios(collectively, the “Funds” and individually, the “Fund”) are open-endmutual funds established under the laws of Ontario and governed by the Declaration of Trust, as amended from time to time.
The TD Managed Assets Program Portfolios invest primarily in units ofother investment funds including in units of exchange-traded funds.
TD Asset Management Inc. (“TDAM”) is the manager, portfolio adviserand trustee of the Funds. TDAM, TDAM USA Inc., TD Investment Services Inc. (“TDIS”), TD Waterhouse Canada Inc. (“TDW”) and EpochInvestment Partners, Inc. (“Epoch”) are wholly-owned subsidiaries of The Toronto-Dominion Bank (“TD”). The registered address of theFunds is P.O. Box 100, 66 Wellington Street West, TD Bank Tower,Toronto-Dominion Centre, Toronto, Ontario M5K 1G8.
The financial year-end for the Funds is December 31. The Statements ofFinancial Position are presented as at December 31, 2017 and 2016. The Statements of Comprehensive Income, Statements of Changes in Net Assets Attributable to Holders of Redeemable Units and Statementsof Cash Flows are presented for the periods ended December 31, 2017and 2016. Where a Fund or series of a Fund was established duringeither period, the information for that Fund or series is provided from theinception date and a comparative statement has only been presented forany period for which that Fund was in existence as at the reporting date.
Each Fund’s start date as indicated in the Fund-Specific Notes to theFinancial Statements is the date that it commenced operations or in the case of a new series, the date the series was first offered and not its inception date.
These financial statements were authorized for issue by TDAM onMarch 16, 2018.
2. Basis of Presentation
These financial statements have been prepared in compliance withInternational Financial Reporting Standards (“IFRS”) as published by the International Accounting Standards Board (“IASB”). These financialstatements have been prepared under the historical cost convention, as modified by the revaluation of financial assets and financial liabilities(including derivative financial instruments) at fair value through profit or loss (“FVTPL”).
3. Summary of Significant Accounting Policies
Financial InstrumentsThe Funds recognize financial instruments at fair value upon initialrecognition, plus transaction costs in the case of financial instrumentsnot measured at FVTPL. Regular way purchases and sales of financialinstruments are recognized at their trade date. The Funds’ non-derivativeinvestments, which are designated at FVTPL, and derivative assets andliabilities, which are classified as held for trading (“HFT”), are measuredat FVTPL.
All other financial assets and liabilities are measured at amortized cost.Under this method, financial assets and liabilities reflect the amountrequired to be received or paid, discounted, when appropriate, at thecontract’s effective interest rate.
The Funds have determined that they meet the definition of an‘investment entity’ and as a result, the Funds measure subsidiaries, if any, at FVTPL. An investment entity is an entity that: obtains fundsfrom one or more investors for the purpose of providing them withinvestment management services; commits to its investors that itsbusiness purpose is to invest funds solely for returns from capitalappreciation, investment income, or both; and measures and evaluatesthe performance of substantially all of its investments on a fair valuebasis. The significant judgment that the Funds have made in determiningthat this definition is met is that fair value is the primary measurementattribute used to measure and evaluate the performance of substantiallyall of the Funds’ investments. The Funds’ investments may also includeassociates and joint ventures which are designated at FVTPL.
The Funds’ outstanding redeemable units’ entitlements include acontractual obligation to distribute any net income and net realizedcapital gains in cash (at the request of the unitholder) and therefore the ongoing redemption feature is not the Funds’ only contractualobligation. Consequently, the Funds’ outstanding redeemable units areclassified as financial liabilities in accordance with the requirements ofIAS 32, “Financial Instruments: Presentation” (“IAS 32”). The Funds’obligations for Net Assets Attributable to Holders of Redeemable Unitsare presented at the redemption amount.
The accounting policies for measuring the fair value of the Funds’ investments and derivatives are substantially similar to those used inmeasuring the Funds’ net asset value (“NAV”) for transactions withunitholders. The NAV is the value of the total assets of a fund less the value of its total liabilities determined, on each valuation day, inaccordance with Part 14 of National Instrument 81-106, “InvestmentFund Continuous Disclosure”, for the purpose of processing unitholdertransactions. Net Assets Attributable to Holders of Redeemable Units,also referred to as net assets, refers to net assets calculated in accor-dance with IFRS. As at all dates presented, there were no differencesbetween the Funds’ NAV per series unit and net assets per series unit.
nNotes to the Financial Statements
December 31, 2017 Annual Financial Statements14
Fair Value MeasurementFair value is the price that would be received to sell an asset or paid to transfer a liability in an orderly transaction between market partici-pants at the measurement date. The fair value of financial assets and liabilities traded in active markets (such as publicly traded derivativesand marketable securities) are based on quoted market prices at theclose of trading on the reporting date. The Funds use the last traded market price for both financial assets and financial liabilities where thelast traded price falls within that day’s bid-ask spread. In circumstanceswhere the last traded price is not within the bid-ask spread, TDAM determines the point within the bid-ask spread that is most representa-tive of fair value based on the specific facts and circumstances. TheFunds’ policy is to recognize transfers into and out of the fair value hierarchy levels at the end of reporting periods.
The fair value of financial assets and liabilities that are not traded in an active market, including over-the-counter derivatives, is determinedusing valuation techniques. The Funds use a variety of methods and make assumptions that are based on market conditions existing at eachreporting date. Valuation techniques include the use of comparablerecent arm’s length transactions, reference to other instruments that are substantially the same, discounted cash flow analysis, option pricingmodels and other techniques commonly used by market participants and which make the maximum use of observable inputs.
The valuation methodology for specific types of investments held by the Funds is summarized below.
(a) Securities not listed on any recognized public securities exchange are valued based on available quotations from recognized dealers insuch securities, where readily available. If securities have no availablebroker-dealer bid/ask quotes, TDAM uses its own pricing model toprice the securities. The pricing model will generally include thediscounted cash flow valuation approach, the use of a credit spreadbased on the terms of the security and the use of such credit andyield analysis comparables as TDAM believes are relevant in thecircumstances. Debt instruments are valued based on mid prices,where readily available. Other valuation techniques may be used, as described above, where applicable.
(b) Short-term debt instruments, repurchase and reverse repurchaseagreements are valued based on quotations received from recognizedinvestment dealers.
(c) Real return bonds are valued based on the available public quotations from recognized dealers. Changes in the inflation factorare included in Interest for Distribution Purposes in the Statements of Comprehensive Income.
(d) The Funds may use foreign exchange forward contracts to hedgeagainst or profit from fluctuations in foreign exchange rates. Thesecontracts are valued on each valuation day based on the differencebetween the contract rates and the current forward rates at themeasurement date applied to the contracts’ notional amount. The net change in unrealized appreciation or depreciation and the netrealized gain or loss from closing out contracts are reflected in the Statements of Comprehensive Income as part of Net Gain (Loss)on Derivatives.
(e) The Funds may enter into a forward contract to obtain exposure to a specific type of investment without actually investing directly insuch investment. These contracts are valued based on the differencebetween the contract rate and the current market rate for theunderlying investment, at the measurement date. The unrealized gainor loss and the net realized gain or loss from closing out contractsare reflected in the Statements of Comprehensive Income as part ofNet Gain (Loss) on Derivatives.
(f) The Funds may purchase standardized, exchange-traded futurescontracts. Any difference between the value at the close of businesson the current valuation day and that of the previous valuation day is settled in cash daily and recorded in the Statements ofComprehensive Income as Derivatives Income (Loss). Any amountsreceivable (payable) from settlement of futures contracts are reflectedin the Statements of Financial Position as Futures Margin Receivable(Payable). Short-term debt instruments as indicated in the Schedule of Investment Portfolio have been segregated and are held as marginagainst the futures contracts purchased by the Funds, as applicable.
(g) Options contracts that are traded in exchange markets are valued at their closing prices on each valuation day. The premium received or paid on options written or purchased is included in the cost of the options. Any difference between the current value of the contract and the value of the contract originated is recognized as net changein unrealized appreciation/depreciation on derivatives. When optionsare closed or exercised, the difference between the premium and the amount paid or received, or the full amount of the premium if the option expires worthless, is reflected in the Statements ofComprehensive Income as part of Net Gain (Loss) on Derivatives. Thecost of a security purchased will be reduced by the premium receivedon options when a written put option is exercised or increased by the amount paid on options when a purchased option is exercised.
(h) Investments in underlying conventional mutual funds andTD Exchange-Traded Funds are generally valued at the NAV perseries unit of the investment funds as reported by the investmentfunds’ managers.
(i) The exchange-traded funds (ETFs) that are not managed by TDAM are valued based on quoted market prices at the close of trading onthe reporting date.
Fair Value Hierarchy
The Funds classify their investments into fair value measurements within a hierarchy that prioritizes the inputs to fair value measurement.The fair value hierarchy has the following three levels:
Level 1 Quoted (unadjusted) prices in active markets for identicalassets or liabilities;
Level 2 Inputs other than quoted prices that are observable for the asset or liability either directly (that is, as prices) orindirectly (that is, derived from prices); and
Level 3 Inputs that are not based on observable market data (that is, unobservable inputs).
nNotes to the Financial Statements
Annual Financial StatementsDecember 31, 2017 15
All fair value measurements are recurring. The carrying values of Cash,Subscriptions Receivable, Interest Receivable, Dividends Receivable,Receivable for Investments Sold, Payable for Investments Purchased,Redemptions Payable, Distributions Payable, Accrued Liabilities and theFunds’ obligation for Net Assets Attributable to Holders of RedeemableUnits approximate their fair values due to their short-term nature.
Fair values are classified as Level 1 when the related security orderivative is actively traded and a quoted price is available. If aninstrument classified as Level 1 subsequently ceases to be activelytraded, it is transferred out of Level 1. In such cases, instruments are reclassified into Level 2, unless the measurement of its fair value requires the use of significant unobservable inputs, in which case it is classified as Level 3.
The hierarchy gives the highest priority to unadjusted quoted prices inactive markets for identical assets or liabilities (Level 1) and the lowestpriority to unobservable inputs (Level 3).
The classification within the hierarchy is based on the lowest level inputthat is significant to the fair value measurement. For this purpose, thesignificance of an input is assessed against the fair value measurementin its entirety. If a fair value measurement uses observable inputs thatrequire significant adjustment based on unobservable inputs, thatmeasurement is a Level 3 measurement. Assessing the significance of a particular input to the fair value measurement in its entirety requiresjudgment, considering factors specific to the asset or liability.
The determination of what constitutes ‘observable’ requires significantjudgment. Observable data is considered to be that market data that isreadily available, regularly distributed or updated, reliable and verifiable,not proprietary, and provided by independent sources that are activelyinvolved in the relevant market.
TDAM has a Global Fair Value Committee which oversees the perform-ance of the fair value measurements included in the financial statementsof the Funds, including any Level 3 measurements. TDAM utilizes a variety of methods (as listed in the Fair Value Measurement section) in determining the fair value of securities classified as Level 3. The committee also meets quarterly to perform reviews of the valuations of investments held by the Funds.
The classification of the Funds’ financial instruments within the fair valuehierarchy as at December 31 2017 and 2016, and any transfers betweenlevels at end of the reporting period as a result of changes in the lowestlevel input that is significant to the fair value measurement are disclosedin the Fund-Specific Notes to the Financial Statements, where applicable.
Interest in Unconsolidated Structured EntitiesA structured entity is an entity that has been designed so that voting or similar rights are not the dominant factor in deciding who controls the entity, such as when any voting rights relate to administrative tasksonly and the relevant activities are directed by means of contractualarrangements. TDAM has determined that all of the underlying funds in which the Funds invest are unconsolidated structured entities. Inmaking this determination, TDAM evaluated the fact that decisionmaking about underlying funds’ activities is generally not governed byvoting or similar rights held by the Funds and other investors in anyunderlying funds.
The Funds may invest in underlying funds whose investment objectivesrange from achieving short- to long-term income and capital growthpotential. The Funds’ interests in these securities as at December 31,2017 and 2016 are included at their fair value in the Statements ofFinancial Position, which represent the Funds’ exposure in theseunderlying funds. The Funds do not provide and have not committed to provide any additional significant financial or other support to theunderlying funds. The change in fair value of each of the underlying fundsduring the reporting periods is included in Net Change in UnrealizedAppreciation/Depreciation in the Statements of Comprehensive Income in Net Gain (Loss) on Investments. Additional information on the Funds’interest in underlying funds, where applicable, is provided in the Fund-Specific Notes to the Financial Statements.
The TD Mutual Fund Trusts may also invest in mortgage-related and otherasset-backed securities that directly or indirectly represent a participationin, or are secured by and payable from, mortgage loans on real property.Mortgage-related securities are created from pools of residential orcommercial mortgage loans, including mortgage loans made by savingsand loan institutions, mortgage bankers, commercial banks and others.The debt and equity securities issued by these issuers may includetranches with varying levels of subordination. These Funds may alsoinvest in senior notes that have a first lien on assets and have minimumexposure to junior or subordinate tranches. These securities may providea monthly payment which consists of both interest and principalpayments. Other asset-backed securities are created from many types ofassets, including auto loans, credit card receivables, home equity loans,and student loans.
As at December 31, 2017 and 2016, the fair value of mortgage-relatedand other asset-backed securities of these Funds, where applicable, isdisclosed as part of the Investments in the Statements of FinancialPosition. This amount represents the maximum exposure to losses at that date. The change in fair value of mortgage-related and other asset-backed securities during the reporting periods are included in theNet Change in Unrealized Appreciation/Depreciation in the Statements of Comprehensive Income in Net Gain (Loss) on Investments.
Translation of Foreign CurrenciesA Fund’s functional currency, as disclosed in the Fund-Specific Notes to the Financial Statements, represents the currency that TDAM views tomost faithfully represent the economic effects of the Fund’s underlyingtransactions, events and conditions taking into consideration how unitsare issued or redeemed and how returns are measured. Foreign currencytransactions are translated into the functional currency using theexchange rates prevailing at the dates that transactions occur. Realizedforeign exchange gains and losses on income are recognized in invest -ment income in the Statements of Comprehensive Income.
nNotes to the Financial Statements
December 31, 2017 Annual Financial Statements16
Assets and liabilities denominated in a foreign currency are translatedinto the functional currency using the exchange rate prevailing at themeasurement date. Foreign exchange gains and losses on the sale ofinvestments are included in Net Realized Gain (Loss). Unrealized foreignexchange gains and losses on investments held and other assets andliabilities are included in Net Change in Unrealized Appreciation/Depreciation. Realized and unrealized foreign exchange gains and lossesrelating to cash are presented as Foreign Exchange Gain (Loss) on Cashin the Statements of Comprehensive Income.
Offsetting Financial Assets and LiabilitiesFinancial assets and liabilities are offset and the net amount reported in the Statements of Financial Position where the Funds have a legallyenforceable right to offset the recognized amounts and there is anintention to settle on a net basis or realize the asset and settle theliability simultaneously. In all other situations they are presented on agross basis. In the normal course of business, the Funds may enter intovarious master netting agreements or other similar arrangements that do not meet the criteria for offsetting in the Statements of FinancialPosition but still allow for the related amounts to be set-off in certaincircumstances, such as bankruptcy or the termination of the contracts.Offsetting information, where applicable, is presented in the Fund-Specific Notes to the Financial Statements.
Reverse Repurchase AgreementsCertain Funds may enter into reverse repurchase transactions. In areverse repurchase transaction, a Fund buys a security at one price froma third party and agree to sell the same security back to the same partyat a specified price on an agreed future date and the difference isincluded as part of Net Gain (Loss) on Investments in the Statements of Comprehensive Income.
The risk with these types of transactions is that the other party maydefault under the agreement or go bankrupt. These risks are reduced byrequiring the other party to provide collateral to the Fund. The value ofthe collateral has to be at least 102 percent of the market value of thesecurity and the collateral is marked to market on each business day. The type of securities received and related collateral held by the Fund,where applicable, are listed in the Schedule of Investment Portfolio.
CashCash is comprised of deposits with financial institutions. Bank overdrafts are shown under Current Liabilities in the Statements ofFinancial Position.
Receivable for Investments Sold/Payable for Investments PurchasedReceivable for Investments Sold and Payable for Investments Purchasedrepresent trades that have been contracted for but not yet settled ordelivered on the Statements of Financial Position dates.
MarginMargin accounts represent margin deposits held with brokers in respect of open exchange-traded futures contracts.
Impairment of Financial AssetsAt each reporting date, the Funds assess whether there is objectiveevidence that a financial asset at amortized cost is impaired. If suchevidence exists, the Funds recognize an impairment loss as the differencebetween the amortized cost of the financial asset and the present valueof the estimated future cash flows, discounted using the instrument’soriginal effective interest rate. Impairment losses on financial assets atamortized cost are reversed in subsequent periods if the amount of theloss decreases and the decrease can be related objectively to an eventoccurring after the impairment was recognized.
Valuation of Series UnitsTDAM generally calculates the NAV for each series of the Funds as at4 p.m. Eastern Time on each day that the Toronto Stock Exchange is open for trading. However, in some unforeseen circumstances, the seriesNAV per unit may be calculated at another time.
The NAV is calculated, for processing subscription, switch, conversion or redemption orders of series units, for each series of units of the Funds by taking the series’ proportionate share of the individual Fund’scommon assets less that series’ proportionate share of its commonliabilities and deducting from this amount all liabilities that relate solelyto that specific series.
The Net Assets Attributable to Holders of Redeemable Units – Per SeriesUnit is determined by dividing the total Net Assets Attributable toHolders of Redeemable Units of each series of the Funds by the totalnumber of units outstanding of that series at the reporting date.
Income RecognitionInterest for Distribution Purposes as shown in the Statements ofComprehensive Income includes interest income from cash and thecoupon interest on debt instruments accounted for on an accrual basis.Interest Receivable is disclosed in the Statements of Financial Positionbased on the debt instruments’ stated rates of interest. The Funds do not amortize premiums paid or discounts received on the purchase ofdebt securities except for zero coupon bonds which are amortized.
Dividend income from ETFs and distributions from any underlying mutualfunds are recognized on the ex-dividend and ex-distribution date,respectively. Dividends received from ETFs are recognized and presentedin the financial statements based on the nature of the underlyingcomponents such as interest income, dividend income, capital gains and return of capital.
The TD Mutual Fund Trusts may engage in securities lending pursuant to the terms of an agreement which includes restrictions as set out inCanadian securities legislation. The income earned from securities lend-ing, where applicable, is included in the Statements of ComprehensiveIncome as it is earned. The fair value of the securities loaned and fairvalue of the collateral held is determined daily. The details of securitieslending income, aggregate values of securities on loan and related collateral held are provided in the Fund-Specific Notes to the FinancialStatements, where applicable.
nNotes to the Financial Statements
Annual Financial StatementsDecember 31, 2017 17

Investment Transactions and Transaction CostsFor the purposes of calculating realized and unrealized gains and lossesfrom investment transactions, the cost of each investment security isdetermined on an average cost basis, excluding transactions costs.
Transaction costs, such as brokerage commissions, incurred by the Fundsin the purchase and sale of investments at fair value are recognized inthe Statements of Comprehensive Income in the period incurred.Commissions paid, where applicable, are included in the Fund-SpecificNotes to the Financial Statements. No transaction costs are incurredwhen the Funds invest in underlying mutual funds. However, theunderlying funds’ investments may be subject to transaction costs.
Allocation of Income and Expenses, Realized and Unrealized Gains (Losses)Expenses (excluding interest charges and portfolio transaction costs) areaccrued daily, separately for each series. Interest charges and portfoliotransaction costs along with income, gains and losses, are allocated toeach series based on their respective Net Assets Attributable to Holdersof Redeemable Units.
Increase (Decrease) in Net assets Attributable to Holders of Redeemable Units – Per Series UnitThe Increase (Decrease) in Net Assets Attributable to Holders ofRedeemable Units – Per Series Unit is calculated by dividing the Increase(Decrease) in Net Assets Attributable to Holders of Redeemable Units of each series by the weighted average units outstanding of that seriesfor the period, except when a series was established during a reportingperiod, in which case the Weighted Average Units Outstanding for thePeriod – Per Series is calculated from the start date.
Accounting Standards Issued but Not Yet AdoptedThe final version of IFRS 9, “Financial Instruments” (“IFRS 9”) wasissued by the IASB in July 2014 and will replace International AccountingStandards (“IAS”) 39, “Financial Instruments: Recognition andMeasurement” (“IAS 39”). IFRS 9 introduces a model for classificationand measurement, a single, forward-looking ‘expected loss’ impairmentmodel and a substantially reformed approach to hedge accounting.
The new single, principle based approach for determining the classifi -cation of financial assets is driven by cash flow characteristics and thebusiness model in which an asset is held. The new model also results in a single impairment model being applied to all financial instruments,which will require more timely recognition of expected credit losses. It also includes changes in respect of own credit risk in measuring liabilities elected to be measured at fair value, so that gains caused bythe deterioration of an entity’s own credit risk on such liabilities are nolonger recognized in profit or loss. IFRS 9 is effective for annual periodsbeginning on or after January 1, 2018. The manager has assessed theimpact of IFRS 9 by analyzing the current business model of the Fundsand does not anticipate significant changes to the valuation of theFunds’ financial instruments. As a result, the adoption of IFRS 9 is notexpected to have a material impact on the Fund’s financial statements.
4. Critical Accounting Estimates and Judgments
The preparation of financial statements requires management to usejudgment in applying its accounting policies and to make estimates and assumptions about the future. The following discusses the mostsignificant accounting judgments and estimates that the Funds havemade in preparing the financial statements:
Fair Value Measurement of Derivatives and Securities Not Quoted in an Active MarketThe Funds may hold financial instruments that are not quoted in activemarkets, including derivatives. As described in Note 3, the use ofvaluation techniques for financial instruments and derivatives that arenot quoted in an active market requires TDAM to make assumptions that are based on market conditions existing as at the reporting date ofthe financial statements. Changes in assumptions about these factorscould affect the reported fair values of financial instruments. Refer to theFund-Specific Notes to the Financial Statements for further informationabout the fair value measurement of the Funds’ financial instruments,where applicable.
Classification and Measurement of Investments and Application of the Fair Value OptionIn classifying and measuring financial instruments held by the Funds,TDAM is required to make significant judgments about whether or notthe business of the Funds is to invest on a total return basis for thepurpose of applying the fair value option for financial assets underIAS 39. The most significant judgments made include the determinationthat certain investments are HFT and that the fair value option can beapplied to those which are not.
Investment EntityIn determining whether a Fund meets the definition of an investmententity, TDAM may be required to make significant judgments aboutwhether a Fund has the typical characteristics of an investment entity.Each Fund may hold only one investment, an underlying fund (or haveonly one investor or have investors that are its related parties), however,consistent with the investment entity definition, each Fund primarilyobtains funds from one or more investors for the purpose of providinginvestment management services, commits to its investors that thebusiness purpose is to invest the funds solely for returns from capitalappreciation, investment income or both, and measures and evaluatesthe performance of its investments on a fair value basis.
nNotes to the Financial Statements
December 31, 2017 Annual Financial Statements18

5. Redeemable Units
For TD Mutual Fund Trusts and TD Managed Assets Program Portfolios,each individual series of units is sold under differing purchase optionsand may have higher or lower management fees based on their specificattributes, as summarized below, reflecting the extent of the investmentadvice provided.
TD Mutual Fund TrustsEach TD Mutual Fund Trust is authorized to issue an unlimited number ofunits of multiple series that rank equally and are available for sale undera single simplified prospectus. In addition, each of these Funds is alsoauthorized to issue an unlimited number of units of multiple series to besold under a confidential offering memorandum or other separatesimplified prospectus. The various series that may be offered by theseFunds are as described below.
Investor Series: Offered on a no-load basis to investors.
H-Series: Offered on a no-load basis to investors who wish to receivea regular monthly cash flow from the Funds. Monthly distributions may consist of net income, net realized capitalgains and/or a return of capital.
Premium Series: Offered on a no-load basis to large investors and others who make the required minimum investment, as determinedby TDAM from time to time.
K-Series: Offered on a no-load basis to large investors and others who make the required minimum investment, as determinedby TDAM from time to time, and who wish to receive a regular monthly cash flow from the Funds. Monthly distribu-tions may consist of net income, net realized capital gains,and/or a return of capital.
e-Series: Offered on a no-load basis to investors who want to complete their transactions electronically.
D-Series: Offered on a no-load basis to investors who want to complete their transactions through TD Direct Investing, a division of TDW, or other discount brokers.
Advisor Series: Offered to investors who seek investment advice and wantthe option of transacting on a front-end load, back-end load,low-load or low-load-2 basis.
T-Series: Offered to investors who seek investment advice; want theoption of transacting on a front-end load, back-end load,low-load or low-load-2 basis; and who wish to receive a regular monthly cash flow from the Funds. Monthly distribu-tions may consist of net income, net realized capital gainsand/or a return of capital.
F-Series: Offered to investors, through fee-based financial advisors or dealer-sponsored “wrap accounts”, and others who pay an annual fee to their dealer instead of transactionalsales charges.
S-Series: Offered to investors who wish to receive a regular monthlycash flow from the Funds, through fee-based financialadvisors or dealer-sponsored “wrap accounts”. This seriesmay also be offered to other investors who pay an annualfee to their dealer instead of transactional sales charges.Monthly distributions may consist of net income, net realizedcapital gains, and/or a return of capital.
Premium Offered to large investors, through fee-based financial F-Series: advisors or dealer-sponsored “wrap accounts”, and others
who pay an annual fee to their dealer instead of trans -actional sales charges. For this series, investors must makethe required minimum investment, as determined by TDAMfrom time to time.
PS Series: Offered to large investors who wish to receive a regularmonthly cash flow from the Funds, through fee-based financial advisors or dealer-sponsored “wrap accounts”, and others who pay an annual fee to their dealer instead of transactional sales charges. For this series, investors must make the required minimum investment, as determinedby TDAM from time to time. Monthly distributions may consist of net income, net realized capital gains, and/ areturn of capital.
W-Series: Offered to investors, through certain wealth managementbusinesses of TD Bank Group, including certain divisions of TDW, or other dealers authorized by TDAM, who pay an annual fee to their dealer instead of transactional sales charges.
Private Series and Private-EM Offered on a no-load basis to large investors who make theSeries: required minimum investment as determined by TDAM, and
have entered into a Private Series agreement with TDAM.
Institutional Offered on a no-load basis to large investors, such as group Series: savings plans and others who make the required minimum
investment, as determined by TDAM from time to time.
Q-Series: Offered on a no-load basis to large investors such as groupsavings plans and others who wish to receive a regularmonthly cash flow from the Funds, and who make therequired minimum investment, as determined by TDAM from time to time. Monthly distributions may consist of netincome, net realized capital gains and/or a return of capital.
C-Series Offered on a no-load basis to large investors who make the required minimum investment as determined by TDAMand have entered into a C-Series agreement with TDAM.
O-Series: Offered on a no-load basis to large investors who make the required minimum investment as determined by TDAM,and have entered into an O-Series agreement with TDAM.
nNotes to the Financial Statements
Annual Financial StatementsDecember 31, 2017 19

TD Managed Assets Program Portfolios
Each TD Managed Assets Program Portfolio is authorized to issue anunlimited number of units of multiple series that rank equally and are available for sale under a single simplified prospectus. The variousseries that may be offered by these Funds are as described below.
Investor Series: Offered on a no-load basis to investors.
H-Series: Offered on a no-load basis to investors who wish to receivea regular monthly cash flow from the Funds. Monthly distributions may consist of net income, net realized capitalgains and/or a return of capital.
Premium Series: Offered on a no-load basis to large investors and others who make the required minimum investment, as determinedby TDAM from time to time.
K-Series: Offered on a no-load basis to large investors and others who make the required minimum investment, as determinedby TDAM from time to time, and who wish to receive a regular monthly cash flow from the Funds. Monthly distribu-tions may consist of net income, net realized capital gains,and/or a return of capital.
e-Series: Offered on a no-load basis to investors who want to complete their transactions electronically.
D-Series: Offered on a no-load basis to investors who want to complete their transactions through TD Direct Investing, a division of TDW, or other discount brokers.
Advisor Series: Offered to investors who seek investment advice and wantthe option of transacting on a front-end load, back-end load,low-load or low-load-2 basis.
T-Series: Offered to investors who seek investment advice; want theoption of transacting on a front-end load, back-end load,low-load or low-load-2 basis; and who wish to receive a regular monthly cash flow from the Funds. Monthly distribu-tions may consist of net income, net realized capital gainsand/or a return of capital.
F-Series: Offered to investors, through fee-based financial advisors or dealer-sponsored “wrap accounts”, and others who pay an annual fee to their dealer instead of transactionalsales charges.
S-Series: Offered to investors who wish to receive a regular monthlycash flow from the Funds, through fee-based financialadvisors or dealer-sponsored “wrap accounts”. This seriesmay also be offered to other investors who pay an annualfee to their dealer instead of transactional sales charges.Monthly distributions may consist of net income, net realizedcapital gains, and/or a return of capital.
Units of TD Mutual Fund Trusts and TD Managed Assets ProgramPortfolios are redeemable at the option of the unitholder in accordancewith the provisions of the Declaration of Trust. Units of these Funds are issued or redeemed on a daily basis at the NAV per series unit nextdetermined after the subscription, switch, conversion order or redemp-tion request, respectively, is received by TDAM. Subscriptions andredemptions include units converted from one series to another series
within a Fund in the Statements of Changes in Net Assets Attributable to Holders of Redeemable Units. However, conversions between serieswithin a Fund are excluded from Proceeds from Issuances of RedeemableUnits and Amounts Paid on Redeemable Units, Net of Early RedemptionFees in the Statements of Cash Flows.
6. Related Party Transactions
Management Fees(a) TD Mutual Fund Trusts
In consideration for the provision of management, distribution and port-folio management services and oversight of any portfolio sub-advisoryservices provided to the TD Mutual Fund Trusts, TDAM receives an annualmanagement fee in respect of certain series of these Funds. The manage-ment fee is calculated and accrued on a daily basis for each series basedon the NAV of that series and paid monthly to TDAM. Where these Fundsinvest in any underlying funds, there are fees and expenses payable bythe underlying funds in addition to those paid by the Funds. However,there is no duplication of management fees paid to TDAM or its affiliatesif these Funds invest in underlying funds that are managed by TDAM.
No management fees are charged with respect to Private Series andO-Series units. Instead, unitholders in Private Series and O-Series unitsmay be charged a fee directly by TDAM.
Prior to July 27, 2017, the simplified prospectus disclosed the maximumannual management fee rate that TDAM could charge for each series ofunits of the TD Mutual Fund Trusts (so the actual management fee beingcharged to these Funds might have been less than the maximum annualmanagement fee rate). TDAM was able to charge the maximum annualmanagement fee without notice to unitholders. Effective July 27, 2017,the simplified prospectus discloses a specified annual management feerate. Where TDAM chooses to charge a management fee rate below thespecified annual management fee rate, the difference represents a waiverof management fees and is included as Waived Expenses in theStatements of Comprehensive Income. TDAM may waive all or a portionof the management fees charged to these Funds, which may bediscontinued at any time by TDAM at its discretion without notice tounitholders. Detailed information on the management fees of theseFunds is provided in the Fund-Specific Notes to the Financial Statements.
(b) TD Managed Assets Program Portfolios(I) TD MANAGED ASSETS PROGRAM PORTFOLIOS
(Excluding TD Managed ETF Portfolios)
In consideration for the provision of management, distribution andportfolio management services to the TD Managed Assets ProgramPortfolios (other than the TD Managed ETF Portfolios), each series ofthese Funds pay TDAM an annual management fee. The management feeis calculated and accrued on a daily basis for each series based on theNAV of that series and paid monthly to TDAM. Where these Funds investin any underlying funds, there are fees and expenses payable by theunderlying funds in addition to those paid by the Funds. However, thereis no duplication of management fees paid to TDAM or its affiliates ifthese Funds invest in underlying funds that are managed by TDAM.
nNotes to the Financial Statements
December 31, 2017 Annual Financial Statements20

Prior to October 26, 2017, the simplified prospectus disclosed themaximum annual management fee rate that TDAM could charge for eachseries of units of these Funds (so the actual management fee beingcharged to these Funds might have been less than the maximum annualmanagement fee rate). Effective October 26, 2017, the simplifiedprospectus discloses a specified annual management fee rate. WhereTDAM chooses to charge a management fee rate below the specifiedannual management fee rate, the difference represents a waiver ofmanagement fees and is included as Waived Expenses in the Statementsof Comprehensive Income. TDAM may waive all or a portion of themanagement fees being charged to these Funds, which may bediscontinued at any time by TDAM at its discretion without notice tounitholders. Detailed information on the management fees of theseFunds is provided in the Fund-Specific Notes to the Financial Statements.
(II) TD MANAGED ETF PORTFOLIOS
In consideration for the provision of management, distribution and port-folio management services to the TD Managed ETF Portfolios, each seriesof these Funds pay TDAM an annual management fee. The managementfee is calculated and accrued on a daily basis for each series based onthe NAV of that series and paid monthly to TDAM.
Where a TD Managed ETF Portfolio invests in any underlying TD ETFs,there are fees and expenses payable by the underlying TD ETFs inaddition to those paid by the Funds. However, there is no duplication of management fees paid to TDAM or its affiliates. TDAM may waive all or a portion of the management fees being charged to these Funds,which may be discontinued at any time by TDAM at its discretion without notice to unitholders. Detailed information on the managementfees of these Funds is provided in the Fund-Specific Notes to theFinancial Statements.
Administration Fees(A) TD Mutual Fund Trusts
In consideration for paying certain operating expenses, TDAM is paid anannual administration fee with respect to certain series of the TD MutualFund Trusts. The administration fee includes recordkeeping and commu -nication costs, custodial costs, certain legal fees, audit fees, regulatory filing fees and bank charges. The administration fee is calculated and accrued on a daily basis for each series based on the NAV of theapplicable series and paid monthly to TDAM. Annual administration feesfor each series of these Funds, where applicable, are provided in theFund-Specific Notes to the Financial Statements.
The administration fee is payable in respect of Investor Series, H-Series,D-Series, Advisor Series and T-Series of the TD Mutual Fund Trusts, asapplicable, other than the money market funds, TD Ultra Short Term BondFund, TD Short Term Bond Fund, TD Canadian Bond Fund, TD GlobalConservative Opportunities Fund, TD Global Balanced OpportunitiesFund, the Index funds and Advisor Series units of TD U.S. Equity Portfolio.The administration fee is also payable in respect of Premium Series andK-Series of the TD Mutual Fund Trusts other than TD U.S. Money MarketFund, TD Short Term Bond Fund, TD Canadian Bond Fund, TD IncomeAdvantage Portfolio, TD Canadian Core Plus Bond Fund, TD CorporateBond Plus Fund, TD Global Conservative Opportunities Fund andTD Global Balanced Opportunities Fund.
No administration fee is charged with respect to other series of theTD Mutual Fund Trusts.
(B) TD Managed Assets Program Portfolios
Except for the TD Managed ETF Portfolios, no administration fee ischarged to the TD Managed Assets Program Portfolios. For theTD Managed ETF Portfolios, in consideration for paying certain operating expenses, TDAM is paid an annual administration fee withrespect to D-Series of the Funds. The administration fee includesrecordkeeping and communication costs, custodial costs, certain legal fees, audit fees, regulatory filing fees and bank charges. Theadministration fee is calculated and accrued on a daily basis based onthe NAV of D-Series and paid monthly to TDAM. Annual administrationfees for D-Series of the Funds are provided in the Fund-Specific Notes to the Financial Statements.
Operating Expenses(A) Fund’s Independent Review Committee (“IRC”)
TDAM is responsible for management of the Funds’ investment portfolio,including the making of decisions relating to the investment of theFunds’ assets.
TDAM has established an IRC in respect of the Funds and the underlyingfunds managed by TDAM. The IRC acts as an impartial and independentcommittee to review and provide recommendations or, if appropriate,approvals respecting any transactions in which TDAM may have a conflictof interest.
The IRC has approved standing instructions to permit the Funds and/orthe underlying funds managed by TDAM to enter into the followingsecurities transactions:
(a) trades in securities of TD or any affiliate or associate thereof;(b) investments in the securities of an issuer where TD Securities Inc.,
TDW, or any other affiliate of TDAM (a “Related Dealer”) acted as an underwriter during the distribution of such securities and the 60-day period following the completion of the distribution of the underwritten securities;
(c) purchases or sales of securities of an issuer from or to anotherinvestment fund or discretionary managed account managed byTDAM; and
(d) purchases of securities from or sales of securities to a Related Dealer,where it acted as principal.
Investments in securities of TD, interests in underlying funds managed byTDAM, or investments in any affiliates that were held by the Funds at theend of the reporting period are disclosed in the Schedule of InvestmentPortfolio and/or the Fund-Specific Notes to the Financial Statements.
The compensation and relevant expenses of IRC members were allocated among the investment funds managed by TDAM and disclosedin the Statements of Comprehensive Income as Independent ReviewCommittee Fees.
nNotes to the Financial Statements
Annual Financial StatementsDecember 31, 2017 21

(B) TD Mutual Fund Trusts
TDAM pays all of the operating expenses with respect to O-Series unitsof the TD Mutual Fund Trusts.
Private Series and Private–EM Series of the TD Mutual Fund Trusts and Advisor Series of TD U.S. Equity Portfolio bear their respective prorata share of the operating expenses of the applicable Fund which are common to the operation of all series of the Fund as well as thoseexpenses which are attributable solely to that series (which may bepayable to TDAM or its affiliates), including IRC costs; recordkeeping and communication costs; custodial, legal, audit and filing fees; bankcharges; borrowing costs; all taxes, and costs relating to compliance with any new governmental and regulatory requirements.
For other series of the TD Mutual Fund Trusts, TDAM pays all of theoperating expenses (including services provided by TDAM or affiliates of TDAM), other than costs and expenses associated with: all taxes;borrowing; the IRC and compliance with any new governmental andregulatory requirements and new types of costs or expenses. Any newtypes of governmental and regulatory expenses are disclosed as “OtherTrust Fund Costs” in the Statements of Comprehensive Income.
(C) TD Managed Assets Program Portfolios
Except for the TD Managed ETF Portfolios, all operating expenses of theTD Managed Assets Program Portfolios (including for services providedby TDAM or its affiliates) are paid for by TDAM, including cost of the IRC; recordkeeping and communication costs; custodial, legal, audit andfiling fees; bank charges; borrowing costs; and all taxes on such costs.
For the TD Managed ETF Portfolios, TDAM pays certain operatingexpenses. Each TD Managed ETF Portfolio is responsible for payingexpenses associated with borrowing; the IRC and compliance with anynew governmental and regulatory requirements, new types of costs orexpenses and all taxes on such costs and expenses.
Taxes on ExpensesThe Funds also pay applicable goods and services tax and harmonizedsales tax at a blended rate to TDAM on management fees, administrationfees and certain operating expenses based on the province or territory ofresidence of the investors in each series of the Funds, which are includedwith the respective expense in the Statements of Comprehensive Income.
Waived ExpensesTDAM, at its discretion, may waive or absorb a portion of the operatingexpenses otherwise payable by the Funds. These waivers or absorptionsmay be terminated at any time without notice to unitholders. The amount of expenses waived or absorbed is disclosed in the Statements of Comprehensive Income as Waived Expenses, where applicable.
Brokerage Commissions and Soft Dollars(A) TD Mutual Fund Trusts
Brokerage commissions (including other transaction costs) paid onsecurities transactions and amounts paid to related parties of TD forbrokerage services provided to these Funds for the periods endedDecember 31, 2017 and 2016, where applicable, are disclosed in theFund-Specific Notes to the Financial Statements.
Client brokerage commissions are used as payment for order executionservices or research services. The portfolio advisers or TDAM may selectbrokers including its affiliates, who charge a commission in excess of
that charged by other brokers (“soft dollars”) if they determine in goodfaith that the commission is reasonable in relation to the order executionand research services utilized.
For debt instruments traded in the over the counter markets where clientbrokerage commissions are not charged, soft dollars or client brokeragecommissions are not generated. For equities or other securities whereclient brokerage commissions are charged, the soft dollar portion of theamount paid or payable for goods and services other than order execu-tion for the Funds is not generally ascertainable. Any ascertainable softdollar value received as a percentage of total brokerage commissionspaid under the soft dollar arrangement entered into by the portfolioadvisers or TDAM, where applicable, is disclosed in the Fund-SpecificNotes to the Financial Statements.
(B) TD Managed Assets Program Portfolios
Except for the TD Managed ETF Portfolios, these Funds did not incur anybrokerage commissions during the periods ended December 31, 2017and 2016 to execute transactions in the underlying funds and debtinstruments, and accordingly did not receive any investment or researchservices from brokers in exchange for commissions paid by the Funds. For TD Managed ETF Portfolios, brokerage commissions paid on thepurchase or sale of units of the underlying TD ETFs and amounts paid to related parties of TD for brokerage services provided to the Funds forthe period ended December 31, 2017, where applicable, are disclosed in the Fund-Specific Notes to the Financial Statements.
Certain of the underlying funds have incurred brokerage commissions, a portion of which may have been received by the underlying funds’investment advisers in the form of investment or research services (“softdollars”). Such amounts for each of the underlying funds are disclosed inthe underlying funds’ financial statements, where ascertainable.
7. Taxation
The Funds (except for TD Managed ETF Portfolios) qualify or intend toqualify as mutual fund trusts under the Income Tax Act (Canada) (“Tax Act”), unless otherwise disclosed in the Fund-Specific notes to theFinancial Statements. TD Managed ETF Portfolios qualify as unit trustsunder the Tax Act. All or substantially all of the net investment incomeand sufficient amounts of net capital gains realized in any period aredistributed to unitholders such that no income tax is payable by theFunds, except that in certain circumstances, a Fund that is not a mutualfund trust may become liable to pay alternative minimum tax under theTax Act . As a result of the distribution, the Funds have determined thatthey are in substance not taxable and therefore, do not record incometaxes in the Statements of Comprehensive Income nor do they recognizeany deferred tax assets or liabilities in the Statements of FinancialPosition. The Funds’ capital and/or non-capital losses, where applicable,are provided in the Fund-Specific Notes to the Financial Statements.Capital losses have no expiry. Non-Capital losses can be carried forwardfor up to twenty years.
The Funds currently incur withholding taxes imposed by certain countries on investment income and capital gains. Such income andgains are recorded on a gross basis and the related withholding taxesare reported as Tax Reclaims (Withholding Taxes) in the Statements of Comprehensive Income.
nNotes to the Financial Statements
December 31, 2017 Annual Financial Statements22

8. Financial Risk Management
Financial Risk FactorsEach Fund is exposed to a variety of financial risks: these may includemarket risk (including interest rate risk, currency risk, and other pricerisk), credit risk, liquidity risk and concentration risk. All investmentspresent a risk of loss of capital.
TDAM seeks to reduce financial risks by employing and overseeingprofessional and experienced portfolio advisers that regularly monitorthe Funds’ positions and market events and diversify investmentportfolios within the constraints of each Fund’s investment objectives,investment strategies and applicable TDAM policies and procedures(collectively referred to as “Investment Restrictions”).
If a Fund invests in underlying funds, TDAM seeks to reduce financialrisks by diversifying investments across the three main asset classes:money market investments for safety, bonds for income and equityinvestments for growth, where applicable. Since different types of invest-ments tend to move independently from one another, positive perform-ance in one asset class can help offset negative performance in another,thereby reducing volatility and overall risk in the long-term.
The Funds are managed in accordance with their respective InvestmentRestrictions.
(a) Market Risk(i) Interest Rate Risk
Interest rate risk arises from the possibility that changes in interest rates will affect the future cash flows or the fair values of interest-bearing investments.
A Fund’s exposure to interest rate risk is concentrated in its investmentsin debt instruments (such as bonds and debentures) and interest ratederivative instruments, if any. Short-term investments, currencies andother assets and liabilities are short-term in nature and/or non-interestbearing and not subject to significant amounts of risk due to fluctuationsin the prevailing levels of market interest rates.
If a Fund invests in underlying funds, it is exposed to indirect interestrate risk to the extent of the interest-bearing financial instruments held by the underlying funds. A Fund’s sensitivity exposure to interestrate risk, where significant, is disclosed in the Fund-Specific Notes to the Financial Statements.
(ii) Currency Risk
A Fund may hold assets denominated in currencies other than itsfunctional currency. It is therefore exposed to currency risk, as the valueof the securities denominated in other currencies will fluctuate due tochanges in the foreign exchange rates of those currencies in relation tosuch Fund’s functional currency. Where a Fund invests in any underlyingfunds, it is exposed to indirect currency risk in the event that theunderlying funds invest in financial instruments that are denominated ina currency other than the underlying funds’ functional currency.
A Fund may also enter into foreign exchange forward contracts forhedging purposes to reduce its foreign currency exposure or to establishexposure to foreign currencies.
A Fund’s direct exposure to currency risk, where significant, is disclosedin the Fund-Specific Notes to the Financial Statements.
(iii) Other Price RiskOther price risk is the risk that securities will fluctuate in value becauseof changes in market prices (other than those arising from interest rate risk or currency risk). TDAM seeks to reduce this risk through itsInvestment Restrictions.
In determining each Fund’s sensitivity impact from exposure to otherprice risk, a historical beta may be used when applicable. Historical beta,a measure of the sensitivity of a Fund’s returns to market returns, isgenerally derived from comparing 36 months of returns between a Fundand its benchmark. As such, beta inherently includes effects previouslyreflected in the interest rate and currency risk disclosures. Historical betamay not be representative of future beta.
Where a Fund invests in a single underlying fund, it is exposed toindirect other price risk in the event that the underlying fund invests inequity securities that trade on a market. Where a Fund invests in severalunderlying funds, the exposure to other price risk includes allinvestments in underlying funds.
A Fund’s direct exposure to other price risk, where applicable, isdisclosed in the Fund-Specific Notes to the Financial Statements.
Except for written options and equities sold short, the maximum riskresulting from financial instruments is the fair value of the financialinstruments as presented in the Statements of Financial Position. Possiblelosses from written options and equities sold short can be unlimited.
(b) Credit RiskCredit risk is the risk that one party to a financial instrument will cause a financial loss to the other party by failing to discharge an obligation.Where applicable, a Fund’s main credit risk concentration is in debtinstruments and derivative instruments it holds. A Fund’s exposure tocredit risk is the risk that an issuer of investments or a counterparty toderivative instruments will be unable to pay amounts in full when due.All transactions in listed securities are settled or paid for upon deliveryusing approved brokers. The risk of default with a broker is consideredminimal, as delivery of securities sold is only made once the broker hasreceived payment. Payment is made on a purchase once the securitieshave been received by the broker. The trade will fail if either party fails to meet its obligation.
A Fund may also be exposed indirectly to credit risk if it invests inunderlying funds in the event that the underlying funds invest in debtinstruments and derivatives.
nNotes to the Financial Statements
Annual Financial StatementsDecember 31, 2017 23

The Funds and the underlying funds only buy and hold short-term noteswith a minimum R1- Low credit rating by DBRS Limited or an equivalentrating from another recognized credit rating agency. The credit risk fromthe use of counterparties for foreign exchange forward contracts is,where applicable, minimized by:
(i) using counterparties with a minimum credit rating of A by S&P Global Ratings (“SPGR”) or an equivalent rating from anotherrecognized credit rating agency;
(ii) limiting the term of the foreign exchange forward contracts to a maximum of 365 days; and,
(iii) limiting the mark-to-market exposure to any one counterparty to 10 percent of the portfolio value.
A Fund’s direct exposure to short term and/or debt instruments, byratings categories, where applicable, are disclosed in the Fund-SpecificNotes to the Financial Statements.
The TD Mutual Fund Trusts may also engage in securities lendingtransactions with counterparties that have a minimum credit rating ofA by SPGR or an equivalent rating from another credit agency. The value of cash or securities held as collateral by these Funds in connection with these transactions is at least 102 percent of the fair value of thesecurities loaned. The collateral and loaned securities are marked tomarket on each business day. The aggregate fair value of the securitiesloaned is limited to 50 percent of each Fund’s NAV. Information aboutthe fair values of securities lent and collateral held and securities lendingincome earned, where applicable, is disclosed in the Fund-Specific Notesto the Financial Statements.
In the TD Managed Assets Program Portfolios, where applicable, theportfolio adviser reviews these Funds’ credit positions as part of theinvestment management process.
(c) Liquidity RiskLiquidity risk is defined as the risk that a fund may not be able to settleor meet its obligations on time or at a reasonable price. A Fund’sexposure to this risk is concentrated in the daily cash redemptions ofredeemable units. The Funds primarily invest in securities that are tradedin active markets and can be readily disposed. In addition, the Fundsretain sufficient cash and cash equivalents to maintain liquidity, andhave the ability to borrow up to 5 percent of their respective NAV for the purpose of funding redemptions.
The contractual maturities analysis for a Fund’s financial liabilities, where applicable, is disclosed in the Fund-Specific Notes to the Financial Statements.
(d) Concentration RiskConcentration risk arises as a result of the concentration of exposureswithin the same category, whether it is geographical location, producttype or industry sector. A Fund’s concentration risk is disclosed in theFund-Specific Notes to the Financial Statements.
9. Capital Risk Management
Units issued and outstanding represent the capital of the Funds. The Funds do not have any specific capital requirements on thesubscription and redemption of units, other than certain minimumsubscription requirements. Changes in a Fund’s capital during thereporting periods are reflected in the Statements of Changes in Net Assets Attributable to Holders of Redeemable Units. TDAM isresponsible for managing the capital of the Funds in accordance witheach Fund’s investment objectives and for managing liquidity in order to meet redemption requests.
If applicable, the most recent financial statements of the underlyingfunds managed by TDAM are available, without charge, by writing to:
TD Asset Management Inc.P.O. Box 10066 Wellington Street WestTD Bank TowerToronto-Dominion CentreToronto, OntarioM5K 1G8
nNotes to the Financial Statements
December 31, 2017 Annual Financial Statements
Currency codes used throughout the report:
Currency Code Description
ARS Argentine PesoAUD Australian DollarBRL Brazilian RealCAD/C$ Canadian DollarCHF Swiss FrancCLP Chilean PesoCZK Czech KorunaDEM German Deutsche MarkDKK Danish KroneEGP Egyptian PoundEUR EuroGBP British PoundHKD Hong Kong DollarHUF Hungarian ForintIDR Indonesian RupiahINR Indian RupeeILS Israeli ShekelJOD Jordanian DinarJPY Japanese YenKRW South Korean WonLKR Sri Lanka RupeeMAD Moroccan DirhamMYR Malaysian RinggitNOK Norwegian KroneNZD New Zealand DollarPHP Philippine PesoPKR Pakistan RupeePLN Polish ZlotyRON Romanian LeuSEK Swedish KronaSGD Singapore DollarTHB Thai BahtTRY New Turkish LiraTWD New Taiwan DollarUSD/US$ United States DollarZAR South African Rand
24

December 31, 2017 Annual Financial Statements
For Funds with references to FTSE TMX Canada indices:FTSE TMX Global Debt Capital Markets Inc. 2018 “FTSE®” is a trade mark of FTSE International Ltd and is used under licence. “TMX” is a trade mark of TSX Inc. and is used under licence. All rights in the FTSE TMX Global Debt Capital Markets Inc.’s indices and/or FTSE TMX Global Debt Capital Markets Inc.’s ratings vest in FTSE TMX Global Debt Capital Markets Inc. and/or its licensors.Neither FTSE TMX Global Debt Capital Markets Inc. nor its licensors accept any liability for any errors or omissions in such indices and/or ratings or underlying data. No further distribution of FTSE TMX Global Debt Capital Markets Inc.’s data is permitted without FTSE TMX Global Debt Capital Markets Inc.’s express written consent.
TD Mutual Funds, TD Pools and the TD Managed Assets Program portfolios are managed by TD Asset Management Inc., a wholly-ownedsubsidiary of The Toronto-Dominion Bank and are available through authorized dealers.
Epoch Investment Partners, Inc. (“Epoch”) is a wholly-owned subsidiary of The Toronto-Dominion Bank and an affiliate of TD AssetManagement. TD Asset Management operates in Canada through TD Asset Management, Inc. and in the U.S. through TDAM USA Inc.
All trademarks are the property of their respective owners.
® The TD logo and other trade-marks are the property of The Toronto-Dominion Bank.
25