tceq offshore platform final report no. 0227.03.025 tceq contract no. 582-7-84003 work order no....
TRANSCRIPT
ERG No. 0227.03.025
TCEQ Contract No. 582-7-84003
Work Order No. 582-7-84003-FY10-25
Offshore Oil and Gas Platform Report
FINAL REPORT
TCEQ Contract No. 582-7-84003
Work Order No. 582-7-84003-FY10-25
Prepared by:
Richard Billings, Heather Perez, Susan McClutchey,
Eastern Research Group, Inc.
1600 Perimeter Park Drive
Morrisville, NC 27560
Prepared for:
Martha Maldonado
Texas Commission on Environmental Quality
Air Quality Division
August 16, 2010
i
TABLE OF CONTENTS
Section Page No.
List of Acronyms ........................................................................................................................v
EXECUTIVE SUMMARY ........................................................................................................vi
1.0 INTRODUCTION ...................................................................................................... 1-1
2.0 Platform-specific Data Assessment ............................................................................. 2-1
2.1 General Land Office......................................................................................... 2-1
2.2 TCEQ State of Texas Air Reporting System..................................................... 2-3
2.3 TCEQ Central Registry .................................................................................... 2-5
2.4 Texas Railroad Commission............................................................................. 2-5
2.5 Other Data Sources .......................................................................................... 2-8
2.5.1 Google Earth Data................................................................................ 2-8
2.5.2 Minerals Management Service.............................................................. 2-9
2.5.3 Toxics Release Inventory Data ............................................................. 2-9
2.5.4 National Emissions Inventory Data..................................................... 2-10
2.5.5 U.S. Department of Energy................................................................. 2-10
3.0 TYPICAL UNIT PROCESSES OPERATING ON OFFSHORE OIL AND GAS
PLATFORMS ........................................................................................................... 3-12
3.1 Offshore Process Equipment Census .............................................................. 3-13
3.2 Offshore Process Equipment Annual Activity Estimates ................................ 3-13
4.0 OFFSHORE OIL/GAS PROCESS EMISSION FACTORS AND HAP SPECIATION
PROFILES .................................................................................................................. 4-1
4.1 AP-42 .............................................................................................................. 4-1
4.1.1 Amine Units ......................................................................................... 4-3
4.1.2 Boilers, Heaters, and Burners ............................................................... 4-4
4.1.3 Diesel Engines/Gasoline Engines.......................................................... 4-4
4.1.4 Drilling Rigs......................................................................................... 4-4
4.1.5 Combustion Flares................................................................................ 4-5
4.1.6 Natural Gas Engines ............................................................................. 4-5
4.1.7 Natural Gas Turbines............................................................................ 4-6
4.1.8 Loading Operations .............................................................................. 4-6
4.2 MMS Calculated/Derived Emission Factors..................................................... 4-7
4.2.1 Fugitives............................................................................................... 4-7
4.2.2 Cold Vents ........................................................................................... 4-9
4.2.3 Glycol Dehydrators ............................................................................ 4-10
4.2.4 Mud Degassing................................................................................... 4-11
4.2.5 Pneumatic Pumps ............................................................................... 4-13
4.2.6 Pressure/Level Controllers.................................................................. 4-14
4.2.7 Storage Tanks..................................................................................... 4-15
4.3 Hazardous Air Pollutant Speciation Profiles ................................................... 4-16
4.3.1 HAP Data Sources.............................................................................. 4-17
5.0 MODEL OIL AND GAS PLATFORMS..................................................................... 5-1
6.0 EMISSION CALCULATIONS................................................................................... 6-1
7.0 RESULTS................................................................................................................... 7-1
8.0 LIMITATIONS/RECOMMENDATIONS................................................................... 8-1
9.0 BIBLIOGRAPHY....................................................................................................... 9-1

ii
Appendix A – Copies of Platform Permit Information from the Texas Central Registry
Appendix B – Compiled Offshore Platform Emission Factors
Appendix C – HAP Factors
Appendix D – Emission Estimates

iii
LIST OF FIGURES
Figures Page No.
Figure 1-1. Data Processing Flow Chart .................................................................................. 1-3
Figure 2-1. General Land Office Platform Locations ............................................................... 2-3
Figure 2-3. Mapping of Natural Gas Offshore Platforms ....................................................... 2-10
Figure 4-1. Example Amine Units ........................................................................................... 4-2
Figure 4-2. Example Offshore Flare ........................................................................................ 4-4
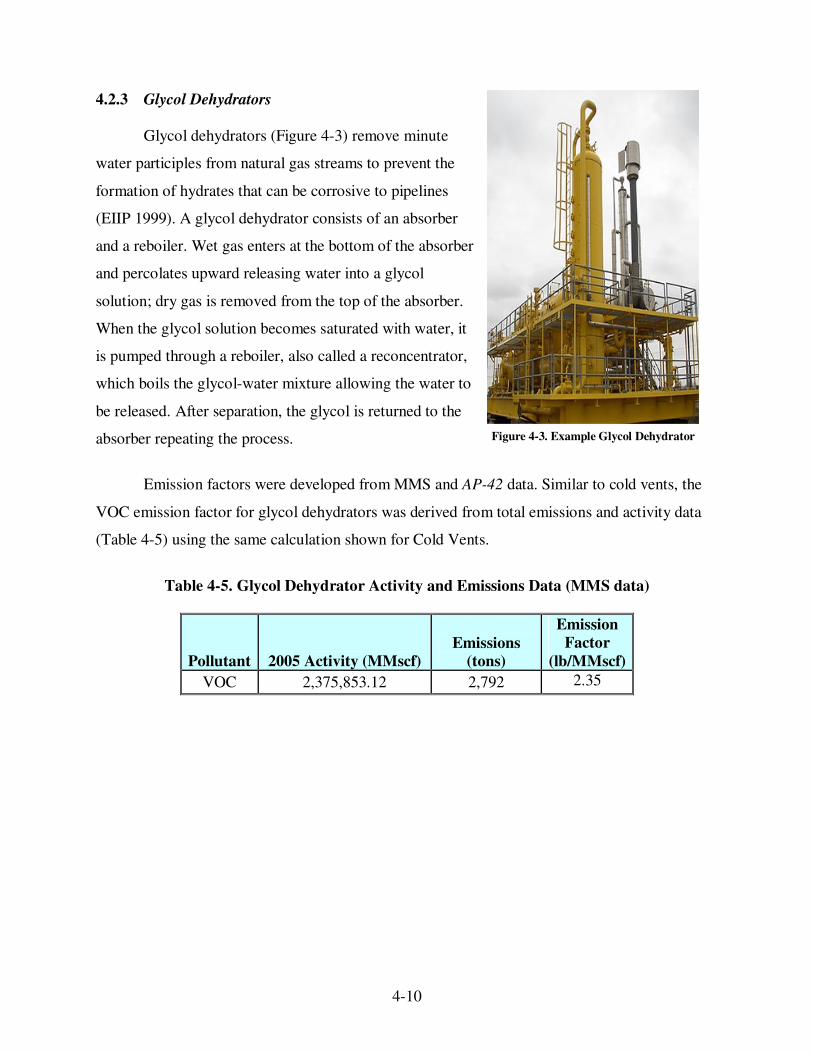
Figure 4-3. Example Glycol Dehydrator.................................................................................. 4-9
Figure 4-4. Example Mud Degasser ...................................................................................... 4-10
Figure 4-5. Example of Gas Activated Piston Pump .............................................................. 4-12
iv
LIST OF TABLES
Tables Page No.
Table E-1. 2008 Texas Offshore Oil and Gas Production............................................................vi
Table E-2. 2008 Annual and Ozone Season Daily Texas Offshore Platform Criteria Emissions..ix
Table E-3. 2008 Annual Texas Offshore Platform HAP Emissions..............................................x
Table 2-1. The Number of Platforms per County in the General Land Office Dataset ............. 2-2
Table 2-2. The Number of Platforms per County in the TCEQ State of Texas Air Reporting
System (STARS) Dataset ........................................................................................................ 2-4
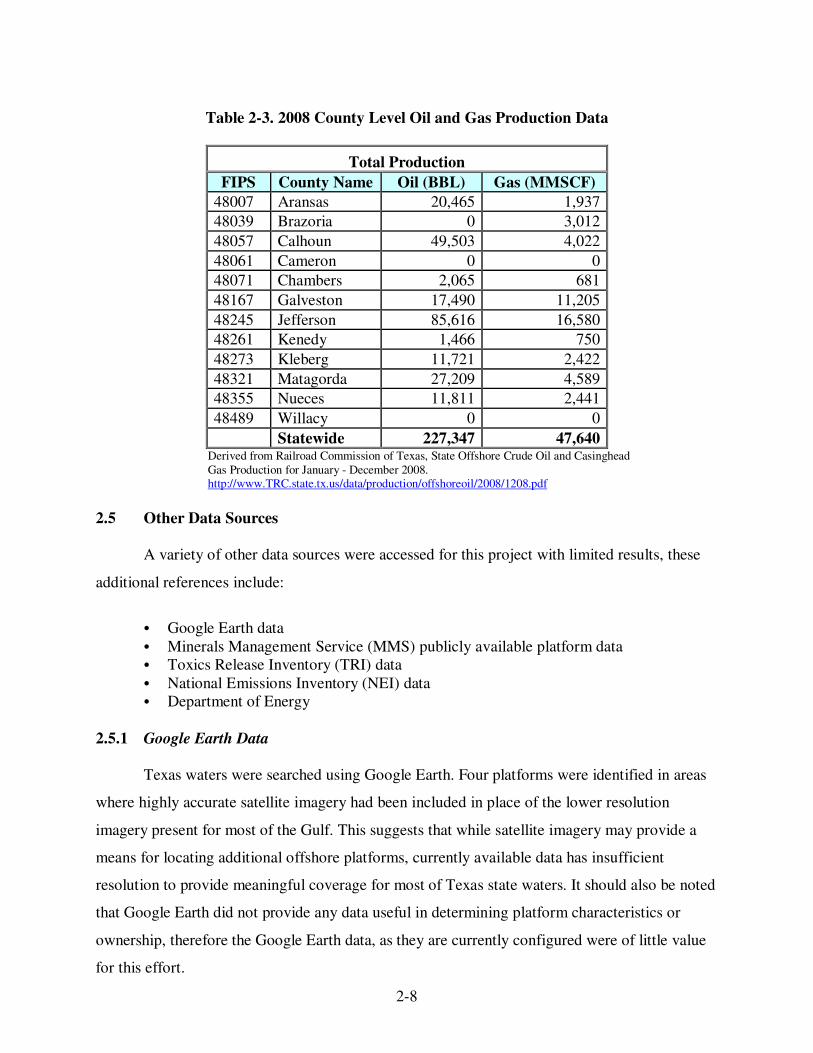
Table 2-3. 2008 County Level Oil and Gas Production Data.................................................... 2-8
Table 3-1. Total Equipment Count by Process Type and Average Number of Units for Oil
Platform................................................................................................................................ 3-15
Table 3-2. Total Equipment Count by Process Type and Average Number of Units for Gas
Platform................................................................................................................................ 3-16
Table 3-3. Total Equipment Count by Process Type and Average Number of Units for Mixed
Platform................................................................................................................................ 3-17
Table 3-4. Annual Production Activity for Oil Platforms....................................................... 3-20
Table 3-5. Annual Production Activity for Gas Platforms...................................................... 3-21
Table 4-1. Loading Operations VOC Emission Factor Data Inputs .......................................... 4-6
Table 4-2. THC Emission Factors for Oil and Gas Production Operations
(lb/component-day)a................................................................................................................ 4-8
Table 4-3. Default Speciation Weight Fractions for THC Emissions by Stream Typea............. 4-9
Table 4-4. Cold Vent Activity and Emission Data ................................................................... 4-9
Table 4-5. Glycol Dehydrator Activity and Emissions Data (MMS data)............................... 4-10
Table 4-6. Speciated Weight Fractions for THC Emissions ................................................... 4-12
Table 4-7. Mud Degassing Emission Factors......................................................................... 4-12
Table 4-8. Default Sales Gas Composition (MMS 2010) ....................................................... 4-14
Table 4-9. Emission Factors for Pneumatic Pumps ................................................................ 4-14
Table 4-10. Emission Factors for Pressure/Level Controllers................................................. 4-15
Table 4-11. Glycol Dehydrator Factors.................................................................................. 4-19
Table 5-1. Model Offshore Oil Platform.................................................................................. 5-1
Table 5-2. Model Offshore Natural Gas Platform .................................................................... 5-2
Table 7-1. County Oil and Gas Annual Emissions for 2008..................................................... 7-1
Table 7-2. Process Criteria Annual Emissions for 2008 ........................................................... 7-2
Table 7-3. 2008 Annual Texas Offshore Platform HAP Emissions .......................................... 7-4
v
List of Acronyms
Acronym Definition
API American Petroleum Institute
BBL Barrels
CH4 Methane
CO2 Carbon dioxide
DOE U.S. Department of Energy
EBCDIC Extended Binary Coded Decimal Interchange Code
EIA Energy Information Administration
EIS Emission Inventory System
EPA U.S. Environmental Protection Agency
EPCRA Emergency Planning and Community Right-To-Know Act
ERG Eastern Research Group
GIS Geographic Information System
GLO General Land Office
HAP Hazardous Air Pollutants
HARC Houston Advanced Research Center
Hp-Hrs Horsepower Hours
Hp Horsepower
kW Kilowatts
MMSCF Million standard cubic feet
MMS Mineral Management Service
NEI National Emissions Inventory
NIF NEI Input Format
N2O Nitrous Oxide
NOx Nitrogen Oxides
OCS Outer Continental Shelf
OSD Ozone Season Daily
TRC Railroad Commission
SCC Source Classification Codes
STARS State of Texas Air Reporting System
SOx Sulfur Oxide Emission
TCEQ Texas Commission on Environmental Quality
TexAER Texas Air Emissions Repository
TRI Toxics Release Inventory
VOC Volatile Organic Compound
vi
EXECUTIVE SUMMARY
This report is a deliverable for Texas Commission on Environmental Quality (TCEQ)
Work Order No. 582-07-84003-FY10-25 to better identify and characterize oil and gas platforms
that operated in Texas state waters (0 to 10 miles from shoreline) in 2008 in order to develop
accurate county level emission estimates for these sources.
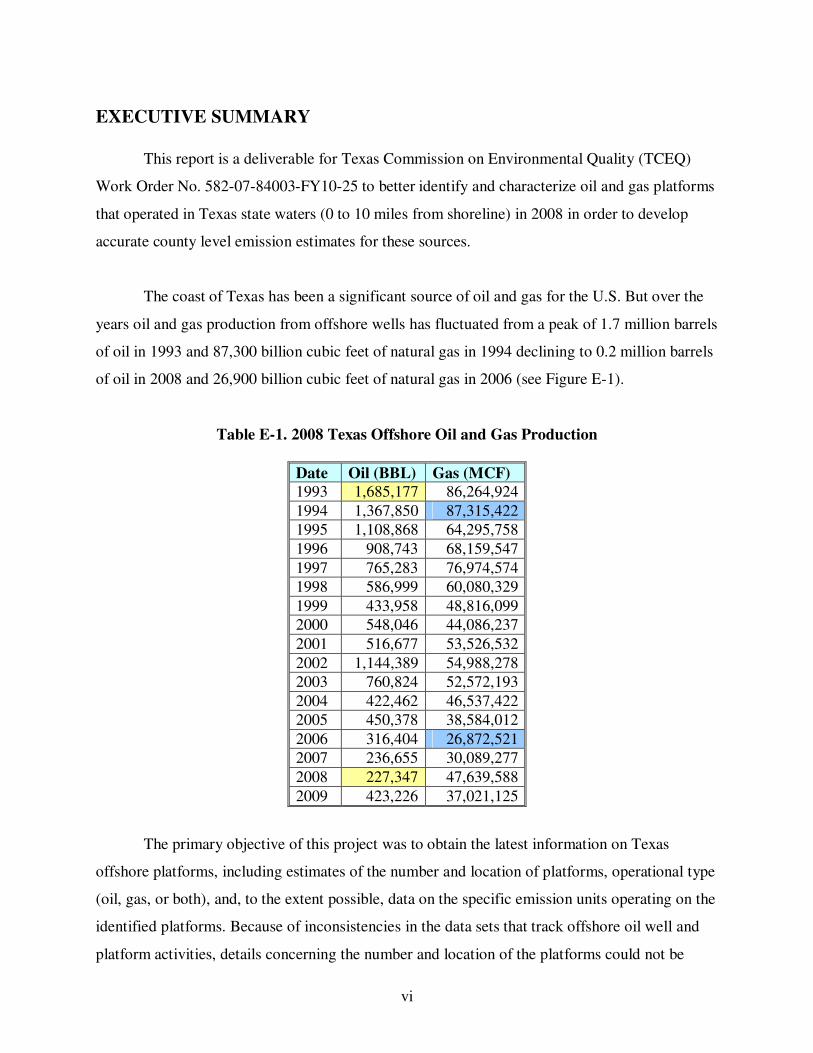
The coast of Texas has been a significant source of oil and gas for the U.S. But over the
years oil and gas production from offshore wells has fluctuated from a peak of 1.7 million barrels
of oil in 1993 and 87,300 billion cubic feet of natural gas in 1994 declining to 0.2 million barrels
of oil in 2008 and 26,900 billion cubic feet of natural gas in 2006 (see Figure E-1).
Table E-1. 2008 Texas Offshore Oil and Gas Production
Date Oil (BBL) Gas (MCF)
1993 1,685,177 86,264,924
1994 1,367,850 87,315,422
1995 1,108,868 64,295,758
1996 908,743 68,159,547
1997 765,283 76,974,574
1998 586,999 60,080,329
1999 433,958 48,816,099
2000 548,046 44,086,237
2001 516,677 53,526,532
2002 1,144,389 54,988,278
2003 760,824 52,572,193
2004 422,462 46,537,422
2005 450,378 38,584,012
2006 316,404 26,872,521
2007 236,655 30,089,277
2008 227,347 47,639,588
2009 423,226 37,021,125
The primary objective of this project was to obtain the latest information on Texas
offshore platforms, including estimates of the number and location of platforms, operational type
(oil, gas, or both), and, to the extent possible, data on the specific emission units operating on the
identified platforms. Because of inconsistencies in the data sets that track offshore oil well and
platform activities, details concerning the number and location of the platforms could not be
vii
validated. Offshore platforms operating in Texas state waters appear not major point sources, a
finding corroborated by this study; as a result, detailed information about the processes that
operate on these facilities could not be obtained from permits and the STARS database, which
only include major point sources. To approximate the processes that tend to be found on
platforms, detailed data from the 2005 MMS Gulfwide inventory were evaluated in order to
develop typical model oil and gas platforms that were then used to estimate emissions in state
waters. The MMS dataset provides the most recent, comprehensive inventory of process-level
offshore platform activity in the Gulf, making it the best source available to identify the
processes associated with oil and gas platforms. This approach assumes that a typical platform in
federal waters is representative of a typical platform in state waters in terms of processes and
overall efficiency.
More detailed information about the number of platforms operating in 2008, their
location, and associated processes could only be obtained by surveying the platform operators.
Implementation of a survey of offshore platform operators could not be implemented at this time,
making the use of model platforms the only reasonable option to estimate process level
emissions.
ERG attempted to identify the location of offshore platforms using a variety of
appropriate data sources such as the Texas Railroad Commissions (TRC) who is responsible for
permitting well heads and the Texas General Land Office (GLO) who are responsible for
permitting offshore platforms. TCEQ’s State of Texas Air Reporting System (STARS) database
and the Central Registry were also considered as possible data sources along with the EPA’s
Toxic Release Inventory (TRI) and National Emission Inventory (NEI) and Google Earth.
Unfortunately, the primary data sources TRC and GLO providing conflicting information about
which oil and gas operations were active in 2008. Furthermore, detailed information about unit
processes that operating on these platforms was not available from STARS, the Central Registry,
TRI, or NEI.
ERG was able to compile 2005 Gulf of Mexico process level platform data from the
Department of Interior’s Mineral Management Services in order to identify the typical processes
associated with for both oil platforms and gas platforms. Activity data were also compiled for

viii
each process and normalized relative to production (i.e., barrels for oil production and million
standard cubic feet for natural gas production). The activity data were applied to available
emission factors and hazardous air pollutant (HAP) speciation profiles yielding a model oil
platform and a natural gas platform. Production data for ten coastal counties were obtained from
the TRC and applied to the appropriate model platforms to estimate emissions from each
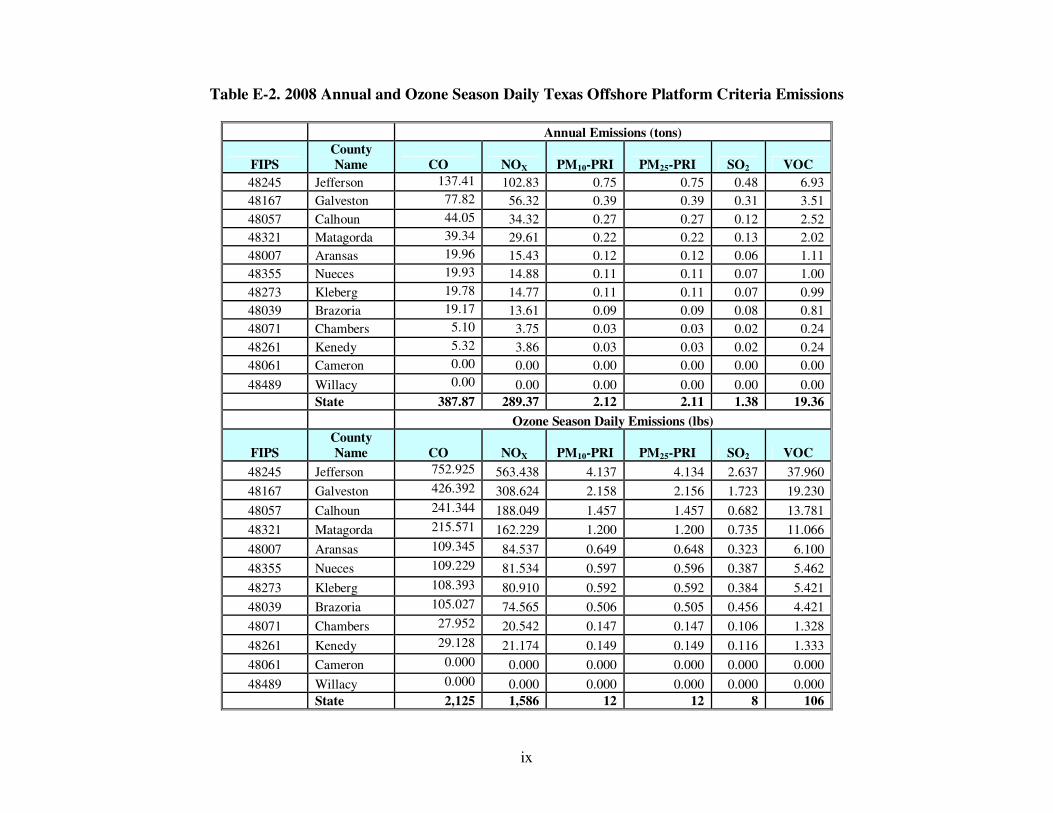
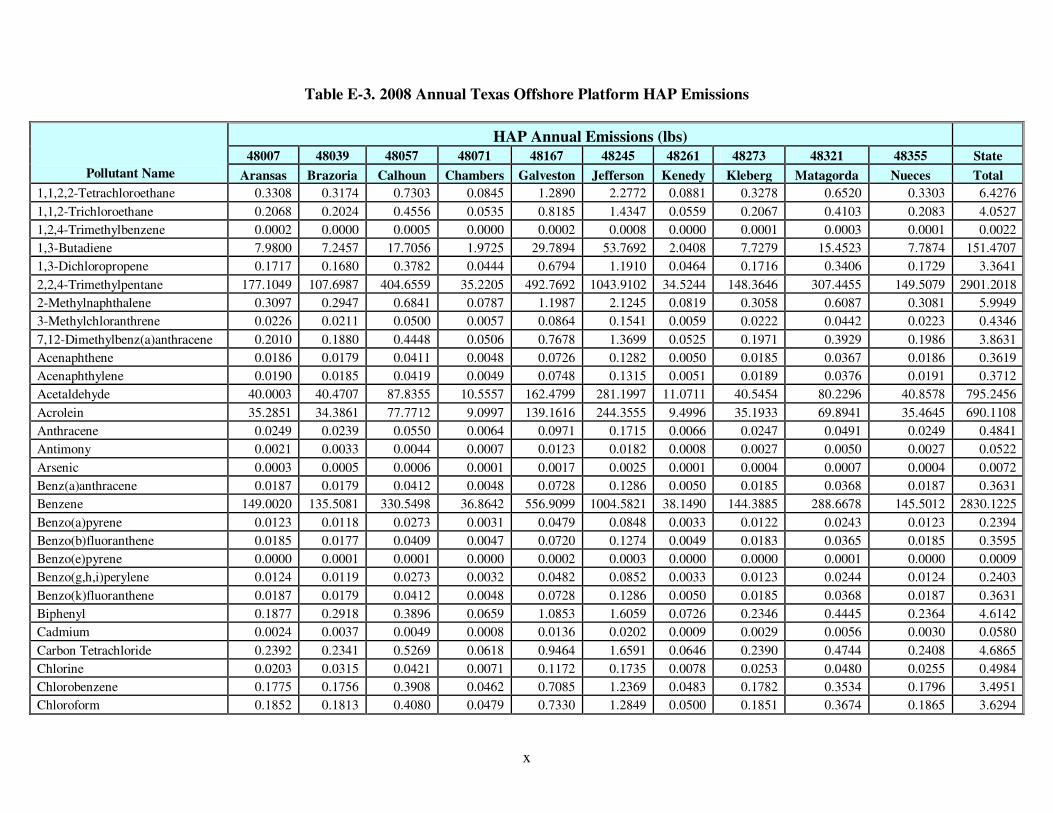
process. Table E-2 summarizes the criteria emissions and Table E-3 summarizes the HAP
emission estimates.
ix
Table E-2. 2008 Annual and Ozone Season Daily Texas Offshore Platform Criteria Emissions
Annual Emissions (tons)
FIPS
County
Name CO NOX PM10-PRI PM25-PRI SO2 VOC
48245 Jefferson 137.41 102.83 0.75 0.75 0.48 6.93
48167 Galveston 77.82 56.32 0.39 0.39 0.31 3.51
48057 Calhoun 44.05 34.32 0.27 0.27 0.12 2.52
48321 Matagorda 39.34 29.61 0.22 0.22 0.13 2.02
48007 Aransas 19.96 15.43 0.12 0.12 0.06 1.11
48355 Nueces 19.93 14.88 0.11 0.11 0.07 1.00
48273 Kleberg 19.78 14.77 0.11 0.11 0.07 0.99
48039 Brazoria 19.17 13.61 0.09 0.09 0.08 0.81
48071 Chambers 5.10 3.75 0.03 0.03 0.02 0.24
48261 Kenedy 5.32 3.86 0.03 0.03 0.02 0.24
48061 Cameron 0.00 0.00 0.00 0.00 0.00 0.00
48489 Willacy 0.00 0.00 0.00 0.00 0.00 0.00
State 387.87 289.37 2.12 2.11 1.38 19.36
Ozone Season Daily Emissions (lbs)
FIPS
County
Name CO NOX PM10-PRI PM25-PRI SO2 VOC
48245 Jefferson 752.925 563.438 4.137 4.134 2.637 37.960
48167 Galveston 426.392 308.624 2.158 2.156 1.723 19.230
48057 Calhoun 241.344 188.049 1.457 1.457 0.682 13.781
48321 Matagorda 215.571 162.229 1.200 1.200 0.735 11.066
48007 Aransas 109.345 84.537 0.649 0.648 0.323 6.100
48355 Nueces 109.229 81.534 0.597 0.596 0.387 5.462
48273 Kleberg 108.393 80.910 0.592 0.592 0.384 5.421
48039 Brazoria 105.027 74.565 0.506 0.505 0.456 4.421
48071 Chambers 27.952 20.542 0.147 0.147 0.106 1.328
48261 Kenedy 29.128 21.174 0.149 0.149 0.116 1.333
48061 Cameron 0.000 0.000 0.000 0.000 0.000 0.000
48489 Willacy 0.000 0.000 0.000 0.000 0.000 0.000
State 2,125 1,586 12 12 8 106
x
Table E-3. 2008 Annual Texas Offshore Platform HAP Emissions
HAP Annual Emissions (lbs)
48007 48039 48057 48071 48167 48245 48261 48273 48321 48355 State
Pollutant Name Aransas Brazoria Calhoun Chambers Galveston Jefferson Kenedy Kleberg Matagorda Nueces Total
1,1,2,2-Tetrachloroethane 0.3308 0.3174 0.7303 0.0845 1.2890 2.2772 0.0881 0.3278 0.6520 0.3303 6.4276
1,1,2-Trichloroethane 0.2068 0.2024 0.4556 0.0535 0.8185 1.4347 0.0559 0.2067 0.4103 0.2083 4.0527
1,2,4-Trimethylbenzene 0.0002 0.0000 0.0005 0.0000 0.0002 0.0008 0.0000 0.0001 0.0003 0.0001 0.0022
1,3-Butadiene 7.9800 7.2457 17.7056 1.9725 29.7894 53.7692 2.0408 7.7279 15.4523 7.7874 151.4707
1,3-Dichloropropene 0.1717 0.1680 0.3782 0.0444 0.6794 1.1910 0.0464 0.1716 0.3406 0.1729 3.3641
2,2,4-Trimethylpentane 177.1049 107.6987 404.6559 35.2205 492.7692 1043.9102 34.5244 148.3646 307.4455 149.5079 2901.2018
2-Methylnaphthalene 0.3097 0.2947 0.6841 0.0787 1.1987 2.1245 0.0819 0.3058 0.6087 0.3081 5.9949
3-Methylchloranthrene 0.0226 0.0211 0.0500 0.0057 0.0864 0.1541 0.0059 0.0222 0.0442 0.0223 0.4346
7,12-Dimethylbenz(a)anthracene 0.2010 0.1880 0.4448 0.0506 0.7678 1.3699 0.0525 0.1971 0.3929 0.1986 3.8631
Acenaphthene 0.0186 0.0179 0.0411 0.0048 0.0726 0.1282 0.0050 0.0185 0.0367 0.0186 0.3619
Acenaphthylene 0.0190 0.0185 0.0419 0.0049 0.0748 0.1315 0.0051 0.0189 0.0376 0.0191 0.3712
Acetaldehyde 40.0003 40.4707 87.8355 10.5557 162.4799 281.1997 11.0711 40.5454 80.2296 40.8578 795.2456
Acrolein 35.2851 34.3861 77.7712 9.0997 139.1616 244.3555 9.4996 35.1933 69.8941 35.4645 690.1108
Anthracene 0.0249 0.0239 0.0550 0.0064 0.0971 0.1715 0.0066 0.0247 0.0491 0.0249 0.4841
Antimony 0.0021 0.0033 0.0044 0.0007 0.0123 0.0182 0.0008 0.0027 0.0050 0.0027 0.0522
Arsenic 0.0003 0.0005 0.0006 0.0001 0.0017 0.0025 0.0001 0.0004 0.0007 0.0004 0.0072
Benz(a)anthracene 0.0187 0.0179 0.0412 0.0048 0.0728 0.1286 0.0050 0.0185 0.0368 0.0187 0.3631
Benzene 149.0020 135.5081 330.5498 36.8642 556.9099 1004.5821 38.1490 144.3885 288.6678 145.5012 2830.1225
Benzo(a)pyrene 0.0123 0.0118 0.0273 0.0031 0.0479 0.0848 0.0033 0.0122 0.0243 0.0123 0.2394
Benzo(b)fluoranthene 0.0185 0.0177 0.0409 0.0047 0.0720 0.1274 0.0049 0.0183 0.0365 0.0185 0.3595
Benzo(e)pyrene 0.0000 0.0001 0.0001 0.0000 0.0002 0.0003 0.0000 0.0000 0.0001 0.0000 0.0009
Benzo(g,h,i)perylene 0.0124 0.0119 0.0273 0.0032 0.0482 0.0852 0.0033 0.0123 0.0244 0.0124 0.2403
Benzo(k)fluoranthene 0.0187 0.0179 0.0412 0.0048 0.0728 0.1286 0.0050 0.0185 0.0368 0.0187 0.3631
Biphenyl 0.1877 0.2918 0.3896 0.0659 1.0853 1.6059 0.0726 0.2346 0.4445 0.2364 4.6142
Cadmium 0.0024 0.0037 0.0049 0.0008 0.0136 0.0202 0.0009 0.0029 0.0056 0.0030 0.0580
Carbon Tetrachloride 0.2392 0.2341 0.5269 0.0618 0.9464 1.6591 0.0646 0.2390 0.4744 0.2408 4.6865
Chlorine 0.0203 0.0315 0.0421 0.0071 0.1172 0.1735 0.0078 0.0253 0.0480 0.0255 0.4984
Chlorobenzene 0.1775 0.1756 0.3908 0.0462 0.7085 1.2369 0.0483 0.1782 0.3534 0.1796 3.4951
Chloroform 0.1852 0.1813 0.4080 0.0479 0.7330 1.2849 0.0500 0.1851 0.3674 0.1865 3.6294
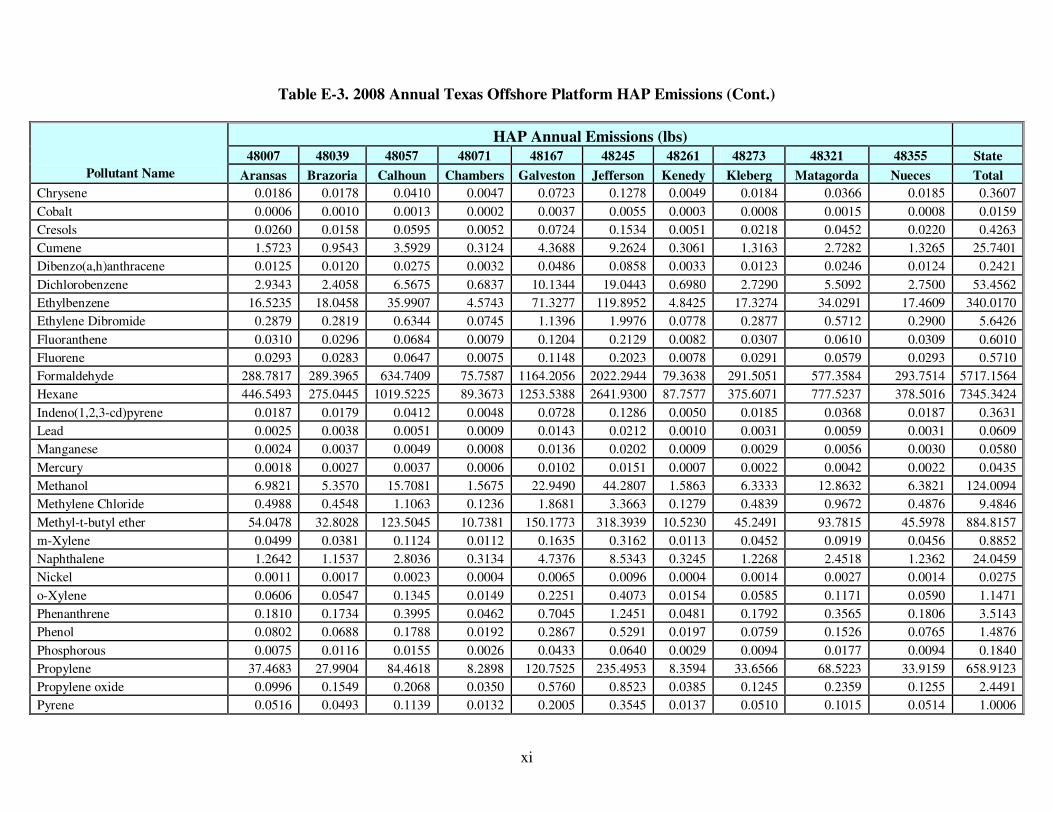
xi
Table E-3. 2008 Annual Texas Offshore Platform HAP Emissions (Cont.)
HAP Annual Emissions (lbs)
48007 48039 48057 48071 48167 48245 48261 48273 48321 48355 State
Pollutant Name Aransas Brazoria Calhoun Chambers Galveston Jefferson Kenedy Kleberg Matagorda Nueces Total
Chrysene 0.0186 0.0178 0.0410 0.0047 0.0723 0.1278 0.0049 0.0184 0.0366 0.0185 0.3607
Cobalt 0.0006 0.0010 0.0013 0.0002 0.0037 0.0055 0.0003 0.0008 0.0015 0.0008 0.0159
Cresols 0.0260 0.0158 0.0595 0.0052 0.0724 0.1534 0.0051 0.0218 0.0452 0.0220 0.4263
Cumene 1.5723 0.9543 3.5929 0.3124 4.3688 9.2624 0.3061 1.3163 2.7282 1.3265 25.7401
Dibenzo(a,h)anthracene 0.0125 0.0120 0.0275 0.0032 0.0486 0.0858 0.0033 0.0123 0.0246 0.0124 0.2421
Dichlorobenzene 2.9343 2.4058 6.5675 0.6837 10.1344 19.0443 0.6980 2.7290 5.5092 2.7500 53.4562
Ethylbenzene 16.5235 18.0458 35.9907 4.5743 71.3277 119.8952 4.8425 17.3274 34.0291 17.4609 340.0170
Ethylene Dibromide 0.2879 0.2819 0.6344 0.0745 1.1396 1.9976 0.0778 0.2877 0.5712 0.2900 5.6426
Fluoranthene 0.0310 0.0296 0.0684 0.0079 0.1204 0.2129 0.0082 0.0307 0.0610 0.0309 0.6010
Fluorene 0.0293 0.0283 0.0647 0.0075 0.1148 0.2023 0.0078 0.0291 0.0579 0.0293 0.5710
Formaldehyde 288.7817 289.3965 634.7409 75.7587 1164.2056 2022.2944 79.3638 291.5051 577.3584 293.7514 5717.1564
Hexane 446.5493 275.0445 1019.5225 89.3673 1253.5388 2641.9300 87.7577 375.6071 777.5237 378.5016 7345.3424
Indeno(1,2,3-cd)pyrene 0.0187 0.0179 0.0412 0.0048 0.0728 0.1286 0.0050 0.0185 0.0368 0.0187 0.3631
Lead 0.0025 0.0038 0.0051 0.0009 0.0143 0.0212 0.0010 0.0031 0.0059 0.0031 0.0609
Manganese 0.0024 0.0037 0.0049 0.0008 0.0136 0.0202 0.0009 0.0029 0.0056 0.0030 0.0580
Mercury 0.0018 0.0027 0.0037 0.0006 0.0102 0.0151 0.0007 0.0022 0.0042 0.0022 0.0435
Methanol 6.9821 5.3570 15.7081 1.5675 22.9490 44.2807 1.5863 6.3333 12.8632 6.3821 124.0094
Methylene Chloride 0.4988 0.4548 1.1063 0.1236 1.8681 3.3663 0.1279 0.4839 0.9672 0.4876 9.4846
Methyl-t-butyl ether 54.0478 32.8028 123.5045 10.7381 150.1773 318.3939 10.5230 45.2491 93.7815 45.5978 884.8157
m-Xylene 0.0499 0.0381 0.1124 0.0112 0.1635 0.3162 0.0113 0.0452 0.0919 0.0456 0.8852
Naphthalene 1.2642 1.1537 2.8036 0.3134 4.7376 8.5343 0.3245 1.2268 2.4518 1.2362 24.0459
Nickel 0.0011 0.0017 0.0023 0.0004 0.0065 0.0096 0.0004 0.0014 0.0027 0.0014 0.0275
o-Xylene 0.0606 0.0547 0.1345 0.0149 0.2251 0.4073 0.0154 0.0585 0.1171 0.0590 1.1471
Phenanthrene 0.1810 0.1734 0.3995 0.0462 0.7045 1.2451 0.0481 0.1792 0.3565 0.1806 3.5143
Phenol 0.0802 0.0688 0.1788 0.0192 0.2867 0.5291 0.0197 0.0759 0.1526 0.0765 1.4876
Phosphorous 0.0075 0.0116 0.0155 0.0026 0.0433 0.0640 0.0029 0.0094 0.0177 0.0094 0.1840
Propylene 37.4683 27.9904 84.4618 8.2898 120.7525 235.4953 8.3594 33.6566 68.5223 33.9159 658.9123
Propylene oxide 0.0996 0.1549 0.2068 0.0350 0.5760 0.8523 0.0385 0.1245 0.2359 0.1255 2.4491
Pyrene 0.0516 0.0493 0.1139 0.0132 0.2005 0.3545 0.0137 0.0510 0.1015 0.0514 1.0006
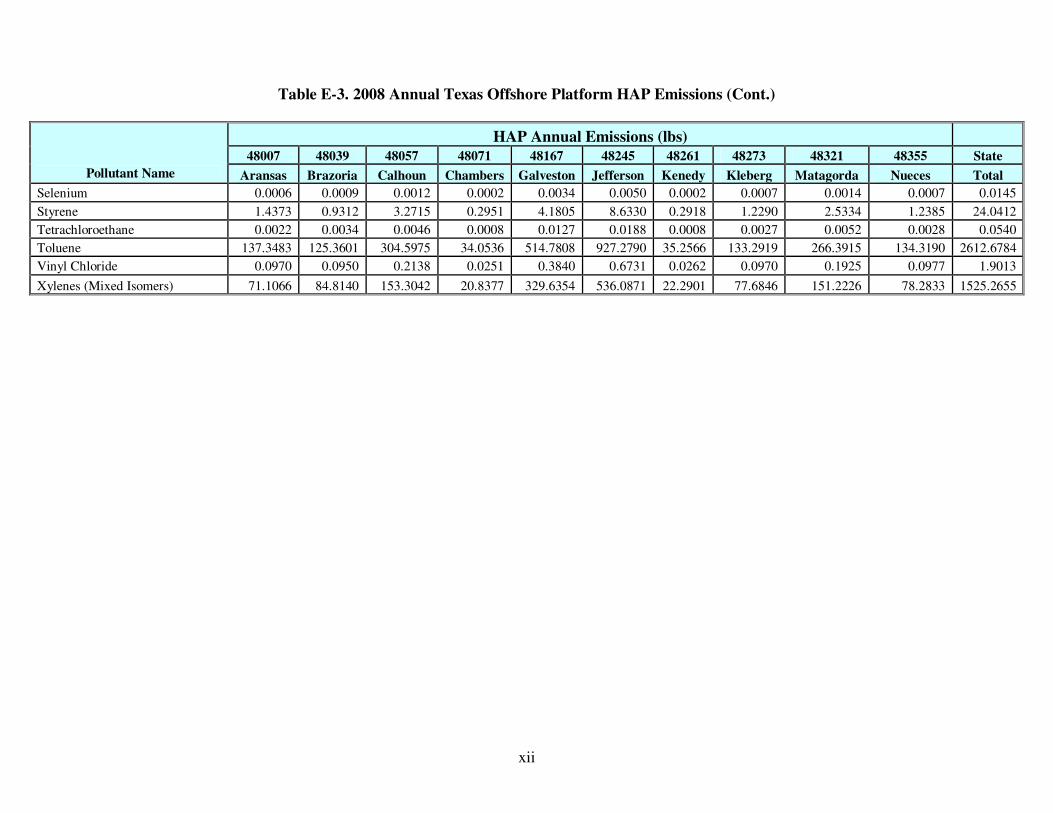
xii
Table E-3. 2008 Annual Texas Offshore Platform HAP Emissions (Cont.)
HAP Annual Emissions (lbs)
48007 48039 48057 48071 48167 48245 48261 48273 48321 48355 State
Pollutant Name Aransas Brazoria Calhoun Chambers Galveston Jefferson Kenedy Kleberg Matagorda Nueces Total
Selenium 0.0006 0.0009 0.0012 0.0002 0.0034 0.0050 0.0002 0.0007 0.0014 0.0007 0.0145
Styrene 1.4373 0.9312 3.2715 0.2951 4.1805 8.6330 0.2918 1.2290 2.5334 1.2385 24.0412
Tetrachloroethane 0.0022 0.0034 0.0046 0.0008 0.0127 0.0188 0.0008 0.0027 0.0052 0.0028 0.0540
Toluene 137.3483 125.3601 304.5975 34.0536 514.7808 927.2790 35.2566 133.2919 266.3915 134.3190 2612.6784
Vinyl Chloride 0.0970 0.0950 0.2138 0.0251 0.3840 0.6731 0.0262 0.0970 0.1925 0.0977 1.9013
Xylenes (Mixed Isomers) 71.1066 84.8140 153.3042 20.8377 329.6354 536.0871 22.2901 77.6846 151.2226 78.2833 1525.2655

xiii
It should be noted that emission estimates provided in this study do not take into account
control devices that may be used on the platforms to reduce emissions. More accurate estimates
of platform emissions would require a comprehensive survey of platform operators to quantify
use of control devices, validate equipment profiles, update typical equipment characteristics, and
develop more accurate estimates of activity.
1-1
1.0 INTRODUCTION
This study was implemented for the Texas Commission on Environmental Quality
(TCEQ) to identify and characterize oil and gas platforms that operated in Texas state waters in
2008, providing county level emission estimates for these sources.
ERG attempted to identify the location of offshore platforms using a variety of
appropriate data sources such as the Texas Railroad Commissions (TRC) who is responsible for
permitting well heads and the Texas General Land Office (GLO) who are responsible for
permitting offshore platforms. Unfortunately, the primary data sources TRC and GLO providing
conflicting information about which oil and gas operations were active in 2008. Other sources
such as the State of Texas Air Reporting System (STARS), the Texas Central Registering and the
EPA’s Toxic Release Inventories (TRI) and the National Emission Inventory (NEI), were
considered to obtain detailed information about unit processes that operating on these platforms,
but such data were not available. Efforts to compile platform-specific data are discussed in detail
in Section 2 of this report.
Given the lack of platform-specific data available for Texas offshore facilities, ERG
obtained the 2005 Gulf of Mexico process level platform data from the Department of Interior’s
Mineral Management Services (MMS). Even though the MMS inventory only addresses
platforms operating in Federal waters, it is a useful reference to identify typical processes
associated with for both oil platforms and gas platforms operating in the Gulf of Mexico. MMS
activity data were also compiled for each process and normalized relative to production (i.e.;
barrels for oil production and million standard cubic feet for natural gas production) as presented
in Section 3 of this report. The activity data were applied to available emission factors and
hazardous air pollutant (HAP) speciation profiles, as summarized in Section 4. The normalized
activity data, emission factors and HAP speciation profiles allow for the creation of a complete
emission profile for a model oil platform and a natural gas platform, which is discussed in
Section 5. County level production data from the TRC were applied to the appropriate model
platforms to estimate emissions from each process which is noted in Section 6 and results are
presented in Section 7. This approach to estimate county level offshore oil and gas emission is
1-2
summarized in Figure 1-1. Section 8 of this report provides an assessment of the limitations of
the approach used with recommendations for potential improvements. Section 9 includes a
bibliography of all references used to implement this study.

1-3
Emission Estimates by County and
Platform Type
TRC
Lease/District Oil Gas
Productionby County
Model Offshore Platforms
Platform
Equipment
Profiles
Offshore
Oil/Gas
Emission
Factors
HAP Profiles
Oil Gas
Format County Offshore
Platform Emission
Data into
NIF 3.0 and TexAER Format
Emission Estimates by County and
Platform Type
TRC
Lease/District Oil Gas
Productionby County
Model Offshore Platforms
Platform
Equipment
Profiles
Offshore
Oil/Gas
Emission
Factors
HAP Profiles
Oil Gas
Format County Offshore
Platform Emission
Data into
NIF 3.0 and TexAER Format
Figure 1-1. Data Processing Flow Chart

2-1
2.0 Platform-specific Data Assessment
Identification of platforms operating in 2008 in state waters is important to insure that the
inventory is complete and no platforms are excluded. In order to obtain information about
individual platforms a number of different data sources were considered. The primary data
sources used in this task including the following:
C Texas General Land Office (GLO)
C Texas Railroad Commission (TRC) data from its publicly available databases
C Data from TCEQ’s State of Texas Air Reporting System (STARS) database
C Data from TCEQ’s Central Registry
It was anticipated that the STARS data would be a subset of the facilities that are reported
in the GLO data file, but only one facility could be matched in the two datasets. This issue was
raised with GLO staff, they noted that they are currently updating their files to more accurately
represent platforms currently in operation. Unfortunately, the update platform data will not be
available within the period of performance for this project. There were similar concerns with
regard to the reporting requirements for STARS. Many state water platforms are not major
sources and therefore not required to report emission data to the STARS. Lastly, TRC’s well data
files were obtained, but they were provided in an unusable format.
Though GLO and STARS data does provide limited information about the location of
platforms, there is no data to quantify activity level associated with each platform. As an
alternative approach the TRC’s district and county production data were used to quantify activity
in terms of the volume of oil and natural gas produced in 2008.
This section of the report summarizes the publically available data associated with each
of these data sources, noting any limitations or data gaps encountered.
2.1 General Land Office
The General Land Office (GLO) is responsible for the management of state lands and
mineral-right properties. Relative to the interest of this project, the Land Office leases drilling
rights for oil and gas production on state lands, including beaches, bays, estuaries and other

2-2
submerged lands out to 10.3 miles in the Gulf of Mexico. To track these activities, GLO
maintains data on issued permits for all offshore platforms.
This dataset includes 73 individual platforms, assuming that the GLO inst number is the
unique platform identifier. This dataset includes the county location for all platforms and latitude
and longitude coordinates for 56 of the platforms. The number of platforms located in each
county is presented in Table 2-1. The Geographic Information System (GIS) group of GLO was
contacted to see if they had more complete coordinate information, and two GIS shapefiles were
provided that included GLO ID and complete location information for all platforms (Figure 2-1).
The shapefiles provided came in two formats: first, a point file showing locations for
63 platforms; and a second polygon file showing area delineations for 10 additional GLO IDs,
with one ID having two polygons (11 shapes total). Since the locations varied slightly between
the original GLO spreadsheet and the GIS shapefiles, new centroids were calculated in the GIS
to provide consistent location information for all 73 platforms.
Table 2-1. The Number of Platforms per County in the
General Land Office Dataset
County
Number of
Platforms in
the GLO
Dataset
Aransas 10
Brazoria 4
Calhoun 9
Chambers 9
Galveston 9
Jefferson 6
Matagorda 5
Nueces 20
Orange 1
Total 73
2-3
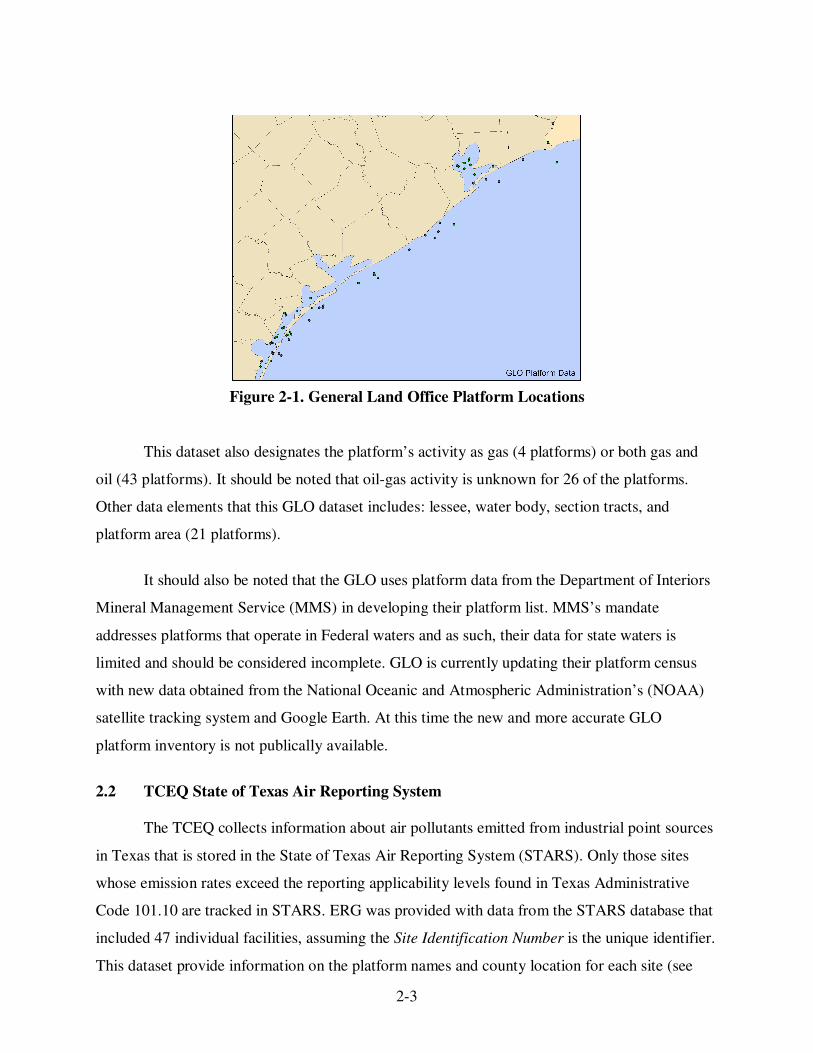
Figure 2-1. General Land Office Platform Locations
This dataset also designates the platform’s activity as gas (4 platforms) or both gas and
oil (43 platforms). It should be noted that oil-gas activity is unknown for 26 of the platforms.
Other data elements that this GLO dataset includes: lessee, water body, section tracts, and
platform area (21 platforms).
It should also be noted that the GLO uses platform data from the Department of Interiors
Mineral Management Service (MMS) in developing their platform list. MMS’s mandate
addresses platforms that operate in Federal waters and as such, their data for state waters is
limited and should be considered incomplete. GLO is currently updating their platform census
with new data obtained from the National Oceanic and Atmospheric Administration’s (NOAA)
satellite tracking system and Google Earth. At this time the new and more accurate GLO
platform inventory is not publically available.
2.2 TCEQ State of Texas Air Reporting System
The TCEQ collects information about air pollutants emitted from industrial point sources
in Texas that is stored in the State of Texas Air Reporting System (STARS). Only those sites
whose emission rates exceed the reporting applicability levels found in Texas Administrative
Code 101.10 are tracked in STARS. ERG was provided with data from the STARS database that
included 47 individual facilities, assuming the Site Identification Number is the unique identifier.
This dataset provide information on the platform names and county location for each site (see
2-4
Table 2-2), latitude and longitude coordinates for 45 sites, and owner/operator information. For
owner/operator information, all sites include the company name and account number. Other data
elements included in this dataset are the last emissions inventory year, the primary SIC, and the
registration number (RN).
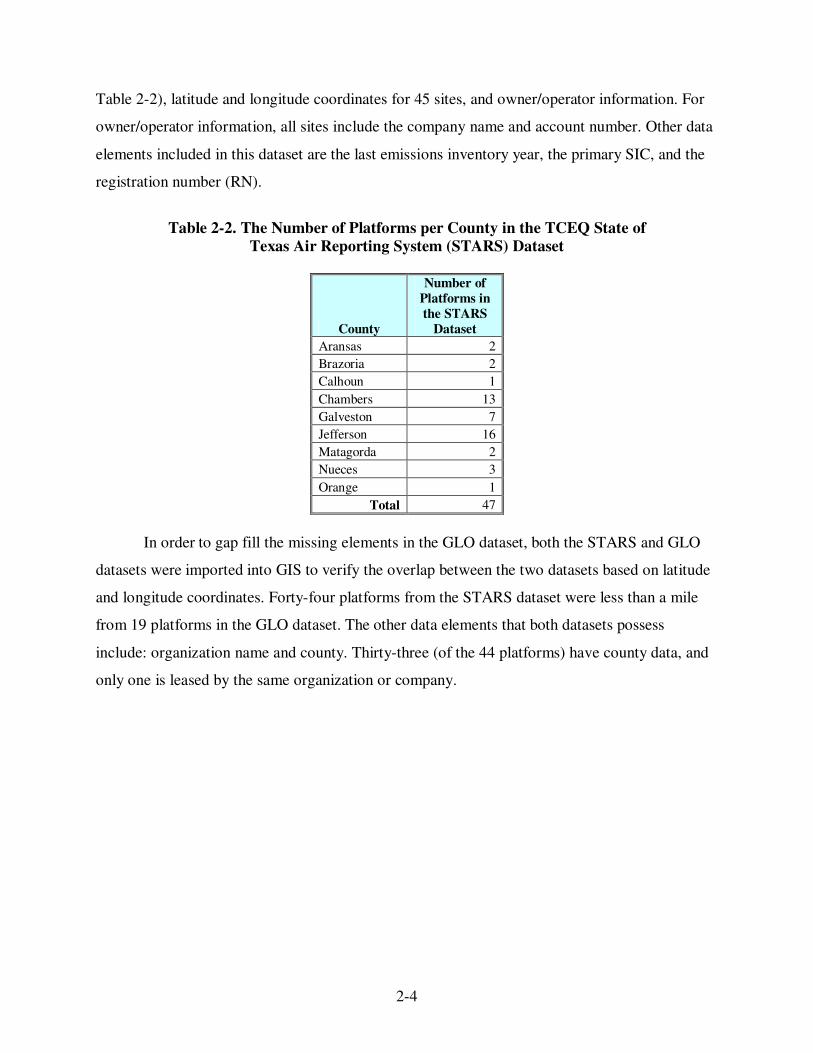
Table 2-2. The Number of Platforms per County in the TCEQ State of
Texas Air Reporting System (STARS) Dataset
County
Number of
Platforms in
the STARS
Dataset
Aransas 2
Brazoria 2
Calhoun 1
Chambers 13
Galveston 7
Jefferson 16
Matagorda 2
Nueces 3
Orange 1
Total 47
In order to gap fill the missing elements in the GLO dataset, both the STARS and GLO
datasets were imported into GIS to verify the overlap between the two datasets based on latitude
and longitude coordinates. Forty-four platforms from the STARS dataset were less than a mile
from 19 platforms in the GLO dataset. The other data elements that both datasets possess
include: organization name and county. Thirty-three (of the 44 platforms) have county data, and
only one is leased by the same organization or company.

2-5
2.3 TCEQ Central Registry
The TCEQ also maintains the Central Registry, which is a centralized database that
maintains records of common information, such as the company names, addresses, and telephone
numbers of regulated entities. This system was searched for any permit data associated with
offshore oil and gas platforms. General searchers were implemented, but no platform permits
were identified in these queries. Additional searches were implemented to gap fill missing data
for the specific platforms identified in the GLO and STARS data files. Permit information was
obtained for eight facilities. Unfortunately, the permit data did not provide any additional details
about the location or unit processes included on the platform. Copies of the data from the Central
Registry are included in Appendix A.
2.4 Texas Railroad Commission
The Texas Railroad Commission (TRC) has primary regulatory jurisdiction over the oil
and natural gas industry, pipeline transporters, natural gas and hazardous liquid pipeline industry,
natural gas utilities, the LP-gas industry, and coal and uranium surface mining operations. The
TRC maintains several databases that contain detailed data that may be applicable for this
project. ERG purchased two datasets from the TRC’s website, Production Database and the Full
Well Bore Data file. These datasets are discussed in greater detail below:
It was ERG’s intention to obtain production data from the TRC’s Production Database,
the primary file of the automated oil and gas production reporting system. These data are
provided by the well operator on Form P-2 which is a required reporting form for the TRC. This
dataset contains 24 months of production information, including commingled production, and
26 months of allowable data, balancing status and capability for gas wells, and oil lease
overproduction status. The TRC’s associated documentation indicated that the dataset included
production data by district and by lease in terms of barrels for oil production and million cubic
feet for gas production.
The TRC’s Full Well Bore Data file was also considered to be an important data source
as this dataset contains information on every oil and gas well ever drilled in Texas by American
Petroleum Institute (API) number and includes information regarding the well’s completion,
2-6
plugging, formation, and location. According to the TRC documentation, the dataset includes
individual well latitude and longitude location and lease identification codes.
Unfortunately, the TRC data are provided in Extended Binary Coded Decimal
Interchange Code (EBCDIC) which is a very old file format developed specifically for IBM
mainframe computers. Because the data is in EBCDIC format, it is difficult to translate into data
files that can be used in this project. Senior ERG programmers worked on the TRC files to
determine how to extract the elements required for this project and compile them into a
Microsoft Access® table or Excel
® spreadsheet format for incorporation into the project database.
Staff at TRC acknowledged that several organizations have trouble using this data format and
recommended using a data converter developed by VEdit.com. A fully-functioning trial version
of the software was applied to the TRC file, unfortunately, the converter was only able to open
one of the TRC data files, but was not able to generate a usable output file. Other EBCDIC
converters were identified and applied to TRC’s data, but none of them were able to translate the
raw data into a file that they could use for this project.
As neither the Production Database nor the Full Well Bore Datasets could be converted
into a usable format, ERG compiled district and county level offshore production data from the
TRC. The districts are presented in Figure 2-2 and the production data are provided in Table 2-3.
GIS shape file (as noted in Figure 2-2) were used to ensure that the district data was associated
with an appropriate county. It should be noted that the TRC data quantified oil and gas
production for 2008 for twelve counties, in contrast to the GLO and STARS dataset that
indicated that nine counties had offshore platforms.
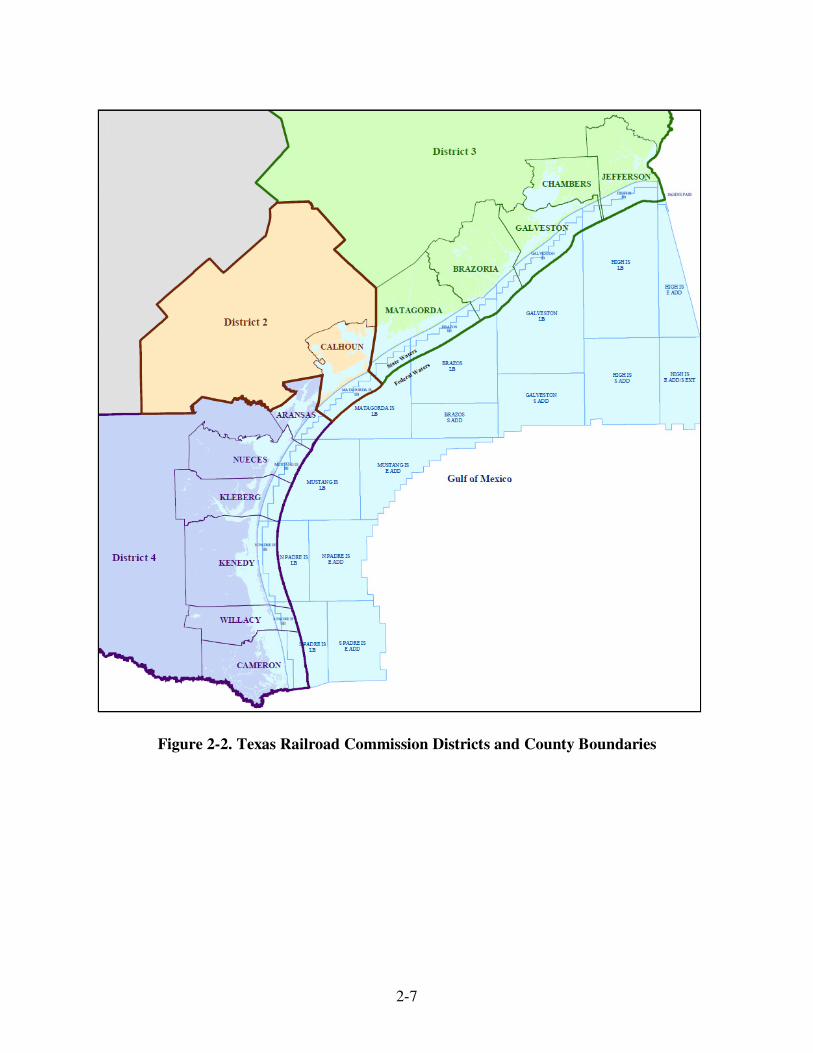
2-7
Figure 2-2. Texas Railroad Commission Districts and County Boundaries
2-8
Table 2-3. 2008 County Level Oil and Gas Production Data
Total Production
FIPS County Name Oil (BBL) Gas (MMSCF)
48007 Aransas 20,465 1,937
48039 Brazoria 0 3,012
48057 Calhoun 49,503 4,022
48061 Cameron 0 0
48071 Chambers 2,065 681
48167 Galveston 17,490 11,205
48245 Jefferson 85,616 16,580
48261 Kenedy 1,466 750
48273 Kleberg 11,721 2,422
48321 Matagorda 27,209 4,589
48355 Nueces 11,811 2,441
48489 Willacy 0 0
Statewide 227,347 47,640 Derived from Railroad Commission of Texas, State Offshore Crude Oil and Casinghead
Gas Production for January - December 2008. http://www.TRC.state.tx.us/data/production/offshoreoil/2008/1208.pdf
2.5 Other Data Sources
A variety of other data sources were accessed for this project with limited results, these
additional references include:
C Google Earth data
C Minerals Management Service (MMS) publicly available platform data
C Toxics Release Inventory (TRI) data
C National Emissions Inventory (NEI) data
C Department of Energy
2.5.1 Google Earth Data
Texas waters were searched using Google Earth. Four platforms were identified in areas
where highly accurate satellite imagery had been included in place of the lower resolution
imagery present for most of the Gulf. This suggests that while satellite imagery may provide a
means for locating additional offshore platforms, currently available data has insufficient
resolution to provide meaningful coverage for most of Texas state waters. It should also be noted
that Google Earth did not provide any data useful in determining platform characteristics or
ownership, therefore the Google Earth data, as they are currently configured were of little value
for this effort.
2-9
2.5.2 Minerals Management Service
The Department of Interior’s Minerals Management Service (MMS) is responsible for
determining if air pollutant emissions from Outer Continental Shelf (OCS) oil and natural gas
platforms and other sources in the Gulf of Mexico on the OCS influence the ozone attainment
and nonattainment status of onshore areas. Consequently, MMS initiated a research study to
develop a base year 2005 inventory of criteria air pollutant emissions and greenhouse gas
emissions from offshore oil and gas exploration, development, and production in the Gulf of
Mexico on the OCS. The objectives of the MMS study are to describe and quantify emission
sources in the OCS that release criteria air pollutants (i.e., carbon monoxide (CO), sulfur dioxide
(SO2), nitrogen oxides (NOx), particulate matter (PM), and volatile organic compounds (VOC))
and greenhouse gases (i.e., carbon dioxide (CO2), methane (CH4), and nitrous oxide (N2O)) for
the inventory year 2005.
ERG reviewed the publicly available platform data included in the 2005 Gulfwide
Emission Inventory to see if any platforms were included that are in Texas State waters.
Unfortunately all platforms included in the MMS inventory were located outside of the
state/federal water boundary, therefore no platforms that operate in Texas waters were identified.
MMS’s inventory did include detailed platform data including emission factors, activity
data, process specific emission estimates that were used in other aspects of this project, such as
characterizing typical processes that are associated with oil platforms, and natural gas platforms.
2.5.3 Toxics Release Inventory Data
The EPA’s Toxics Release Inventory (TRI) is a database containing detailed information
on nearly 650 chemicals and chemical categories released from approximately 22,000 industrial
and federal facilities. This inventory was established under the Emergency Planning and
Community Right-to-Know Act of 1986 (EPCRA) and expanded by the Pollution Prevention Act
of 1990. A facility is required to report to TRI if it is associated with one of the listed Standard
Industrial Classification Codes (SICC) or the North American Industrial Classification System
(NAICS) codes. Offshore oil platforms are not covered by these codes, and thus, are not part of
the TRI database. ERG reviewed the 2008 publically available TRI data confirming that all oil
and gas industry sector facilities for Texas that report to TRI are located inland.
2-10
2.5.4 National Emissions Inventory Data
EPA’s National Emission Inventory (NEI) database contains information about sources
that emit criteria air pollutants, and their precursors and hazardous air pollutants. The database
includes estimates of annual air pollutant emissions from point, nonpoint, and mobile sources in
the 50 States, the District of Columbia, Puerto Rico, and the Virgin Islands. In 2005, the State of
Texas provided data to the NEI for five platforms that it classified as major emission sources.
These five facilities are included in the STARS database discussed earlier in this section.
States must make their 2008 submittals to the EPA’s Emission Inventory System (EIS),
which is replacing the NEI by June 1, 2010. It is anticipated that Texas will continue to included
the platform data reported to the STARS dataset in their EIS submittal.
2.5.5 U.S. Department of Energy
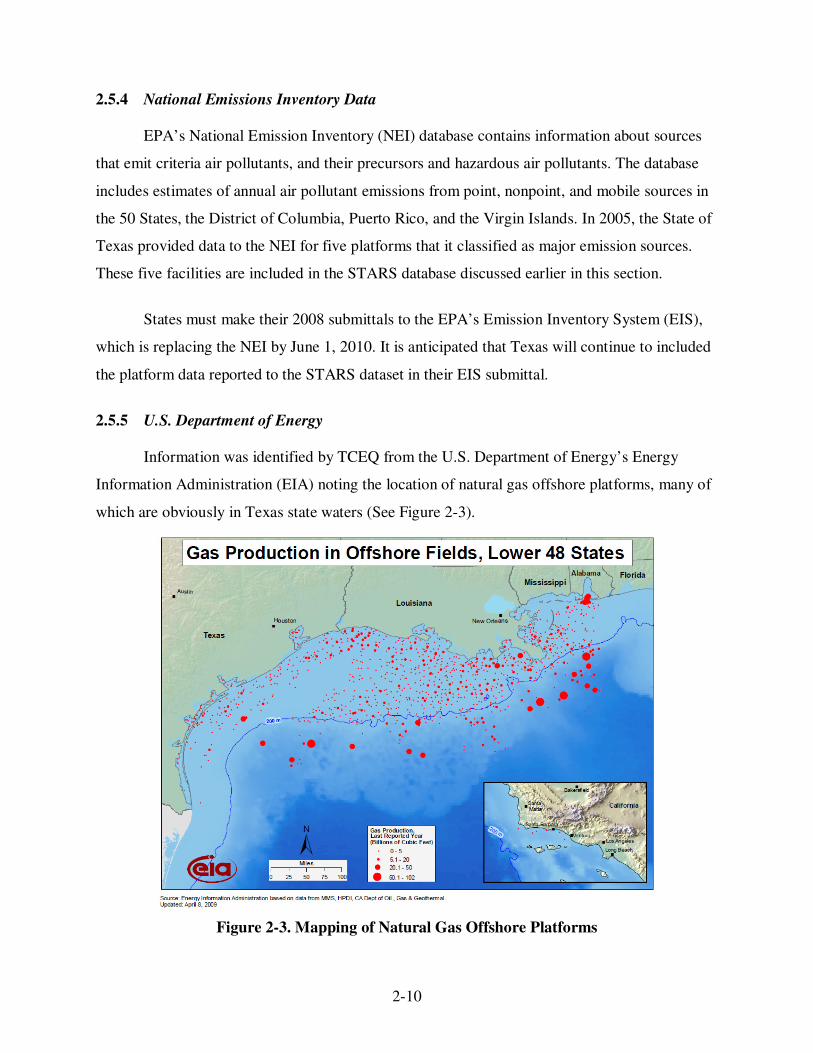
Information was identified by TCEQ from the U.S. Department of Energy’s Energy
Information Administration (EIA) noting the location of natural gas offshore platforms, many of
which are obviously in Texas state waters (See Figure 2-3).
Figure 2-3. Mapping of Natural Gas Offshore Platforms

2-11
The map suggests that the DOE has natural gas platform location and production data that
can be used directly in this study. The DOE website indicated that related shape files were
available on the site, but ERG could only find on-shore information when we downloaded the
gas field data. ERG contacted the EIA and they recommended that we contact the Dallas Field
Office for the detailed data, which we did. ERG indicated that natural gas platform location and
production data for 2008 would be useful for this TCEQ project along with any oil platform
location and production data they may have for platforms operating in State waters.
Unfortunately at this time we have not received any information from the Dallas Field office.
3-12
3.0 TYPICAL UNIT PROCESSES OPERATING ON OFFSHORE OIL
AND GAS PLATFORMS
This project required compilation of data for unit process equipment that operate on
offshore platforms. These processes include:
C Amine units (SCC 2310022410);
C Boilers/heaters/burners (SCC 2310022090);
C Diesel engines (SCC 2310022105);
C Drilling equipment (SCCs 2310012000, 2310022000);
C Combustion flares (SCCs 2310002301, 2310002305);
C Fugitive sources (SCCs 2310022501, 2310012511, 2310012521, 2310022502,
2310012512, 2310012522, 2310022506, 2310012516, 2310012526, 2310022505,
2310012515, 2310012525, 2310012000, 2310022000);
C Glycol dehydrators (SCC 2310022420);
C Loading operations (SCC 2310012201);
C Mud degassing (SCCs 2310112100, 2310122100);
C Natural gas engines (SCCs 2310012000, 2310022000, 2310022109);
C Natural gas turbines (SCC 2310022051);
C Pneumatic pumps (SCC 2310002401);
C Pressure/level controllers (SCC 2310002411);
C Storage tanks (SCCs 2310022010, 2310012020); and
C Cold vents (SCC 2310002421).
It should be noted that data on processes used specifically for platforms operating in
Texas State Waters are not documented in the permits that were obtained from the Texas Central
Registry database nor is such information included in the STARS data files. Typical profiles of
equipment and activity levels for oil platforms and gas platforms were developed using platform
equipment information from the Mineral Management Services (MMS) 2005 Gulfwide
emissions inventory. Note that the MMS inventory applies to emission sources operating in
Federal waters, defined as being 10.3 miles or greater off the Texas coast. For the purpose of this
study, it was assumed that the equipment used on offshore platforms were similar whether the
production occurred in state or Federal waters.
Activity profiles were developed both in terms of hours of operation or fuel consumption
to match the compiled emission factors in Section 4 of this report, but also in terms of production
in order to estimate emissions from individual unit processes using the county oil and gas
production data from the TRC.
3-13
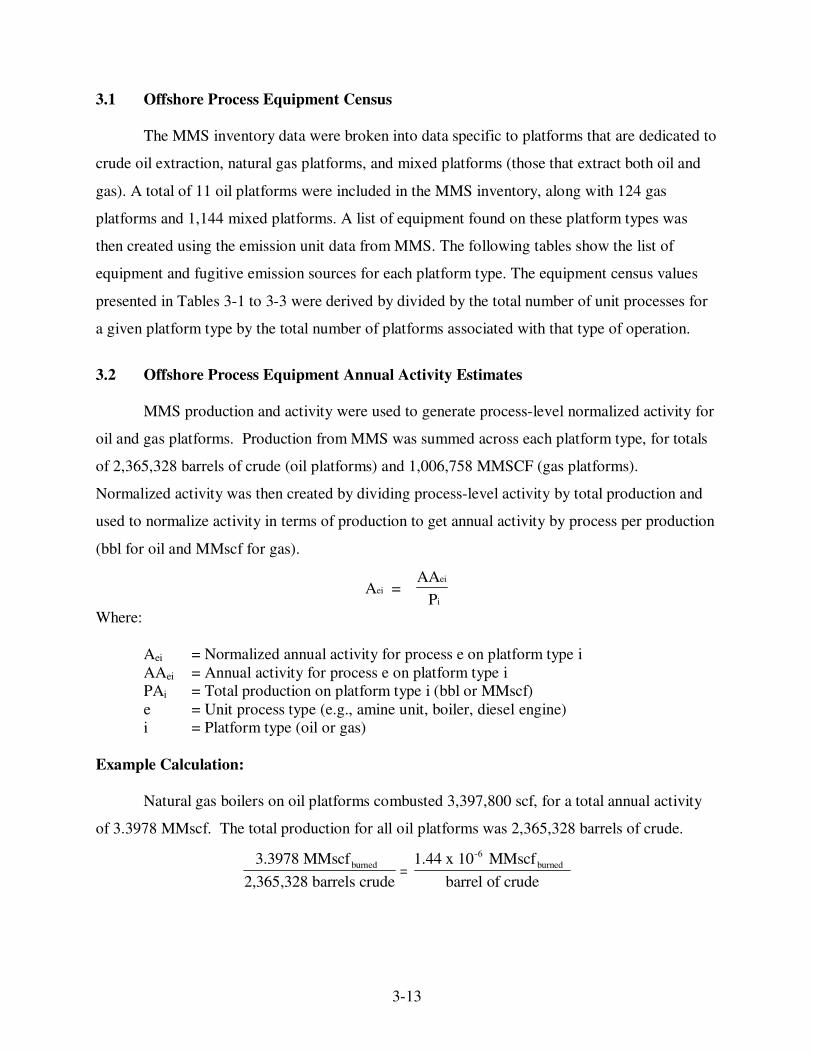
3.1 Offshore Process Equipment Census
The MMS inventory data were broken into data specific to platforms that are dedicated to
crude oil extraction, natural gas platforms, and mixed platforms (those that extract both oil and
gas). A total of 11 oil platforms were included in the MMS inventory, along with 124 gas
platforms and 1,144 mixed platforms. A list of equipment found on these platform types was
then created using the emission unit data from MMS. The following tables show the list of
equipment and fugitive emission sources for each platform type. The equipment census values
presented in Tables 3-1 to 3-3 were derived by divided by the total number of unit processes for
a given platform type by the total number of platforms associated with that type of operation.
3.2 Offshore Process Equipment Annual Activity Estimates
MMS production and activity were used to generate process-level normalized activity for
oil and gas platforms. Production from MMS was summed across each platform type, for totals
of 2,365,328 barrels of crude (oil platforms) and 1,006,758 MMSCF (gas platforms).
Normalized activity was then created by dividing process-level activity by total production and
used to normalize activity in terms of production to get annual activity by process per production
(bbl for oil and MMscf for gas).
A = AA
Pei
ei
i
Where:
Aei = Normalized annual activity for process e on platform type i
AAei = Annual activity for process e on platform type i
PAi = Total production on platform type i (bbl or MMscf)
e = Unit process type (e.g., amine unit, boiler, diesel engine)
i = Platform type (oil or gas)
Example Calculation:
Natural gas boilers on oil platforms combusted 3,397,800 scf, for a total annual activity
of 3.3978 MMscf. The total production for all oil platforms was 2,365,328 barrels of crude.
3.3978 MMs cf
2,365,328 barrels crude
1.44 x 10 MMscf
barrel of crude
burned
-6
burned=
3-14
Note that this calculation was not performed for mixed platforms because the MMS data
did not differentiate which individual pieces of equipment were associated with oil production
and which were associated with gas production.

3-15
Table 3-1. Total Equipment Count by Process Type and Average Number of Units
for Oil Platform
Equipment Type Process Type
Total
Number
of Units
Count/Total
Platforms
(rounded
number)
Boilers/Heaters/Burners <10 MMBtu/hr 2 0
Diesel Engine <600 hp 20 2
Diesel Engine >600 hp 1 0
Fugitives-connectors gas stream 13 1
Fugitives-connectors oil stream 8 1
Fugitives-connectors oil/water stream 7 1
Fugitives-Cent Packa gas stream 1 0
Fugitives-Cent Packa oil stream 1 0
Fugitives-Cent Packa oil/water stream 3 0
Fugitives-Cent Weta gas stream 3 0
Fugitives-Cent Weta oil stream 1 0
Fugitives-flanges gas stream 13 1
Fugitives-flanges oil stream 8 1
Fugitives-flanges oil/water stream 7 1
Fugitives-other gas stream 9 1
Fugitives-other oil stream 8 1
Fugitives-other oil/water stream 11 1
Fugitives-pumps gas stream 2 0
Fugitives-pumps oil stream 3 0
Fugitives-pumps oil/water stream 3 0
Fugitives-valves gas stream 13 1
Fugitives-valves oil stream 8 1
Fugitives-valves oil/water stream 7 1
Natural Gas Engine 2-cycle, lean 2 0
Natural Gas Engine 4-cycle, clean 3 0
Natural Gas Engine 4-cycle, rich 11 1
Pneumatic Pumps - 20 2
Pressure/Level Controllers - 19 2
Storage Tanks Condensate 3 0
Storage Tanks Crude Oil 4 0
Cold Vent - 1 0 a Due to large variation in emissions for compressor seals, seal types were reported separately. “Cent Pack” is a
centrifugal compressor with shaft packing and “Cent Wet” is a centrifugal compressor with a wet seal.

3-16
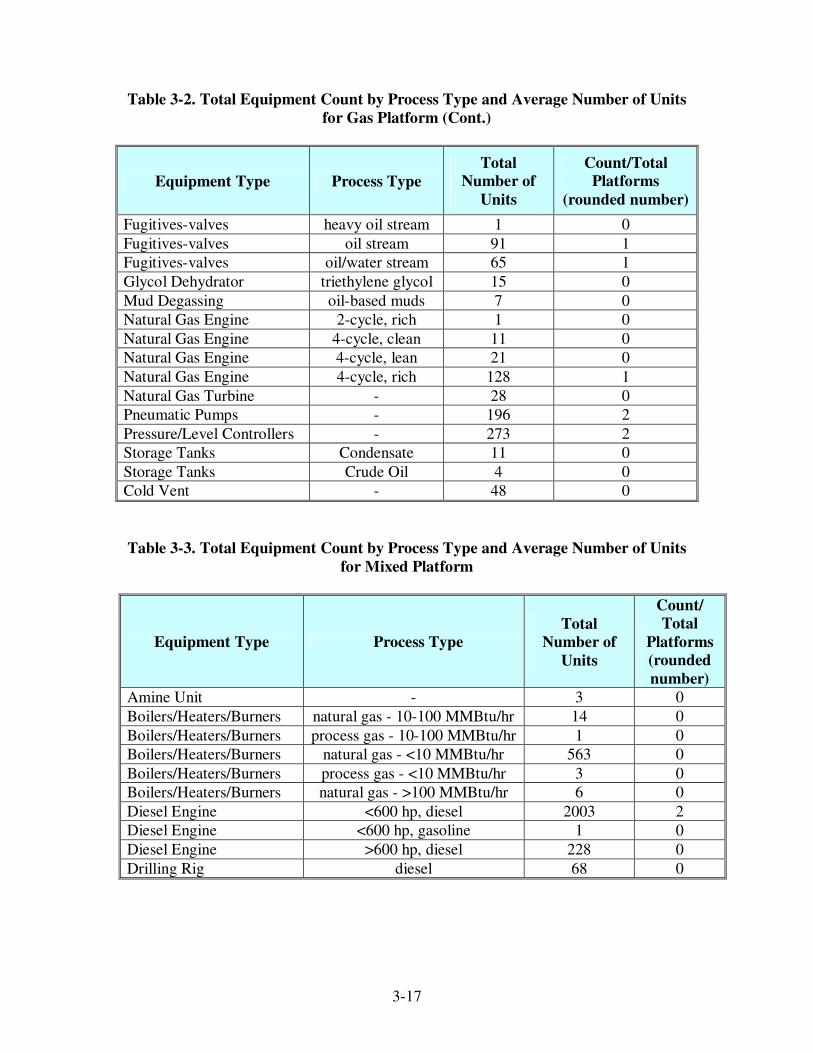
Table 3-2. Total Equipment Count by Process Type and Average Number of Units
for Gas Platform
Equipment Type Process Type
Total
Number of
Units
Count/Total
Platforms
(rounded number)
Amine Unit - 1 0
Boilers/Heaters/Burners 10-100 MMBtu/hr 1 0
Boilers/Heaters/Burners <10 MMBtu/hr 42 0
Boilers/Heaters/Burners >100 MMBtu/hr 1 0
Diesel Engine <600 hp, diesel 187 2
Diesel Engine >600 hp, diesel 4 0
Diesel Engine >600 hp, gas 1 0
Drilling Rig Diesel 7 0
Flare flaring 2 0
Flare flaring 1 0
Flare continuous pilot 3 0
Fugitives-Cent-dry gas stream 1 0
Fugitives-Cent-dry oil/water stream 3 0
Fugitives-connectors gas stream 150 1
Fugitives-connectors heavy oil stream 1 0
Fugitives-connectors oil stream 90 1
Fugitives-connectors oil/water stream 64 1
Fugitives-Cent Pack gas stream 33 0
Fugitives-Cent Pack oil stream 16 0
Fugitives-Cent Pack oil/water stream 28 0
Fugitives-Cent Wet gas stream 7 0
Fugitives-Cent Wet oil stream 3 0
Fugitives-Cent Wet oil/water stream 2 0
Fugitives-flanges gas stream 147 1
Fugitives-flanges heavy oil stream 1 0
Fugitives-flanges oil stream 84 1
Fugitives-flanges oil/water stream 65 1
Fugitives-open-end gas stream 3 0
Fugitives-open-end oil stream 7 0
Fugitives-other gas stream 105 1
Fugitives-other heavy oil stream 1 0
Fugitives-other oil stream 91 1
Fugitives-other oil/water stream 109 1
Fugitives-pumps gas stream 23 0
Fugitives-pumps oil stream 21 0
Fugitives-pumps oil/water stream 21 0
Fugitives-valves gas stream 150 1
3-17
Table 3-2. Total Equipment Count by Process Type and Average Number of Units
for Gas Platform (Cont.)
Equipment Type Process Type
Total
Number of
Units
Count/Total
Platforms
(rounded number)
Fugitives-valves heavy oil stream 1 0
Fugitives-valves oil stream 91 1
Fugitives-valves oil/water stream 65 1
Glycol Dehydrator triethylene glycol 15 0
Mud Degassing oil-based muds 7 0
Natural Gas Engine 2-cycle, rich 1 0
Natural Gas Engine 4-cycle, clean 11 0
Natural Gas Engine 4-cycle, lean 21 0
Natural Gas Engine 4-cycle, rich 128 1
Natural Gas Turbine - 28 0
Pneumatic Pumps - 196 2
Pressure/Level Controllers - 273 2
Storage Tanks Condensate 11 0
Storage Tanks Crude Oil 4 0
Cold Vent - 48 0
Table 3-3. Total Equipment Count by Process Type and Average Number of Units
for Mixed Platform
Equipment Type Process Type
Total
Number of
Units
Count/
Total
Platforms
(rounded
number)
Amine Unit - 3 0
Boilers/Heaters/Burners natural gas - 10-100 MMBtu/hr 14 0
Boilers/Heaters/Burners process gas - 10-100 MMBtu/hr 1 0
Boilers/Heaters/Burners natural gas - <10 MMBtu/hr 563 0
Boilers/Heaters/Burners process gas - <10 MMBtu/hr 3 0
Boilers/Heaters/Burners natural gas - >100 MMBtu/hr 6 0
Diesel Engine <600 hp, diesel 2003 2
Diesel Engine <600 hp, gasoline 1 0
Diesel Engine >600 hp, diesel 228 0
Drilling Rig diesel 68 0

3-18
Table 3-3. Total Equipment Count by Process Type and Average Number of Units
for Mixed Platform (Cont.)
Equipment Type Process Type
Total
Number of
Units
Count/
Total
Platforms
(rounded
number)
Flare Light Smoke - flaring 2 0
Flare Light Smoke - flaring 12 0
Flare Light Smoke - continuous pilot 13 0
Flare Medium Smoke - flaring 3 0
Flare
Medium Smoke - continuous
pilot 3 0
Flare No Smoke - flaring 13 0
Flare No Smoke - flaring 61 0
Flare No Smoke - continuous pilot 65 0
Fugitives - Cent Dry gas stream 12 0
Fugitives - Cent Dry oil stream 1 0
Fugitives - Cent Dry oil/water stream 17 0
Fugitives - Connectors gas stream 1422 1
Fugitives - Connectors heavy oil stream 23 0
Fugitives - Connectors oil stream 910 1
Fugitives - Connectors oil/water stream 596 1
Fugitives - Cent Pack gas stream 211 0
Fugitives - Cent Pack heavy oil stream 4 0
Fugitives - Cent Pack oil 160 0
Fugitives - Cent Pack oil/water stream 214 0
Fugitives - Cent Wet gas stream 96 0
Fugitives - Cent Wet oil stream 39 0
Fugitives - Cent Wet oil/water stream 54 0
Fugitives - Flanges gas stream 1422 1
Fugitives - Flanges heavy oil stream 24 0
Fugitives - Flanges oil stream 831 1
Fugitives - Flanges oil/water stream 595 1
Fugitives - Open-Ended
Lines gas stream 15 0
Fugitives - Open-Ended
Lines heavy oil stream 2 0
Fugitives - Open-Ended
Lines oil stream 84 0
Fugitives - Open-Ended
Lines oil/water stream 8 0

3-19
Table 3-3. Total Equipment Count by Process Type and Average Number of Units
for Mixed Platform (Cont.)
Equipment Type Process Type
Total
Number of
Units
Count/
Total
Platforms
(rounded
number)
Fugitives - Other
Equipment gas stream 921 1
Fugitives - Other
Equipment heavy oil stream 22 0
Fugitives - Other
Equipment oil stream 912 1
Fugitives - Other
Equipment oil/water stream 1095 1
Fugitives - Pumps gas stream 265 0
Fugitives - Pumps heavy oil stream 15 0
Fugitives - Pumps oil stream 408 0
Fugitives - Pumps oil/water stream 269 0
Fugitives - Valves gas stream 1426 1
Fugitives - Valves heavy oil stream 24 0
Fugitives - Valves oil stream 912 1
Fugitives - Valves oil/water stream 596 1
Glycol Dehydrator ethelyene glycol 1 0
Glycol Dehydrator triethylene glycol 157 0
Loading Operations oil 5 0
Losses from Flashing - 65 0
Mud Degassing oil-based muds 55 0
Mud Degassing synthetic-based muds 4 0
Mud Degassing water-based muds 7 0
Natural Gas Engine 2-stroke, clean 7 0
Natural Gas Engine 2-stroke, lean 31 0
Natural Gas Engine 2-stroke, rich 19 0
Natural Gas Engine 4-stroke, clean 127 0
Natural Gas Engine 4-stroke, lean 139 0
Natural Gas Engine 4-stroke, rich 1397 1
Natural Gas Turbine - 325 0
Pneumatic Pump - 2546 2
Pressure/Level Controller - 2687 2
Storage Tank Operations condensate 103 0
Storage Tank Operations crude oil 448 0
Cold Vent - 680 1
3-20
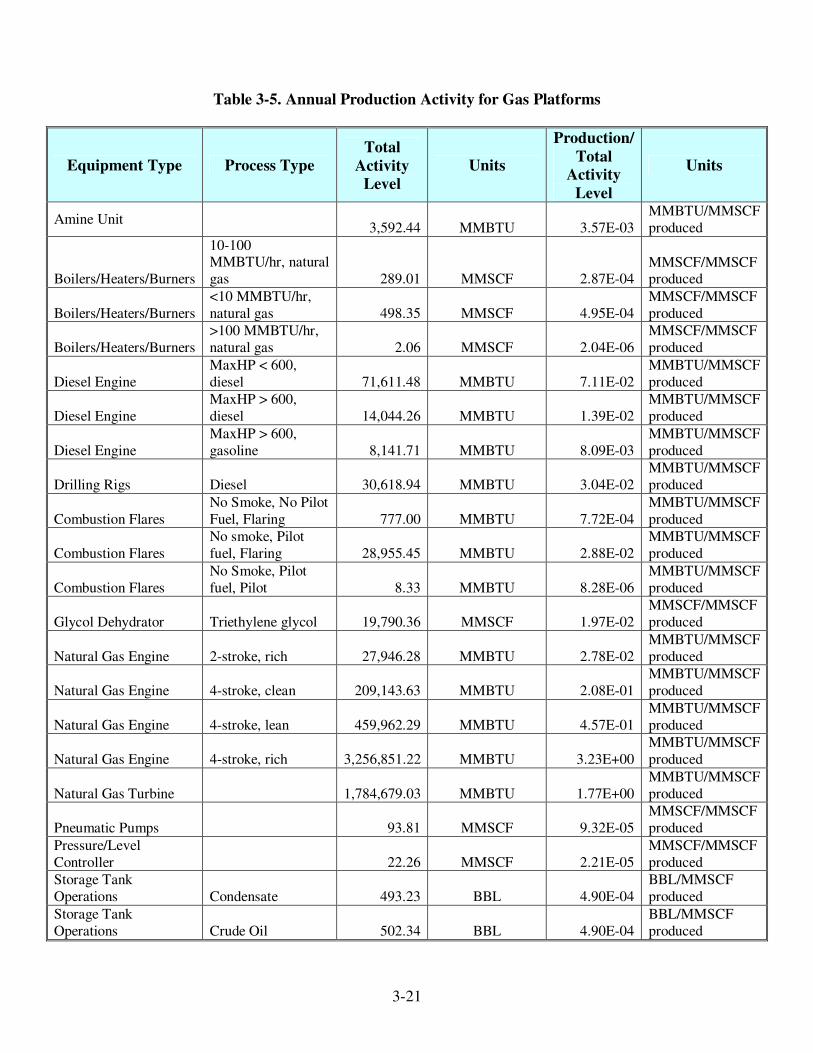
Table 3-4. Annual Production Activity for Oil Platforms
Equipment Type Process Type
Total
Activity
Level
Units Production/
Total Activity
Level
Units
Boilers/Heaters/Burners
<10 MMBTU/hr, natural gas 3.40 MMSCF 1.44E-06
MMSCF/barrel of crude
Diesel Engine
MaxHP < 600,
diesel 1,857.44 MMBTU 7.85E-04
MMBTU/barrel
of crude
Diesel Engine
MaxHP > 600, diesel 420.00 MMBTU 1.78E-04
MMBTU/barrel of crude
Natural Gas Engine 2-stroke, lean 228,840.00 MMBTU 9.67E-02
MMBTU/barrel
of crude
Natural Gas Engine 4-stroke, clean 133,582.62 MMBTU 5.65E-02
MMBTU/barrel of crude
Natural Gas Engine 4-stroke, rich 445,139.74 MMBTU 1.88E-01
MMBTU/barrel
of crude
Pneumatic Pumps 20.49 MMSCF 8.66E-06
MMSCF/barrel of crude
Pressure/Level
Controller 1.06 MMSCF 4.47E-07
MMSCF/barrel
of crude
Storage Tank Operations Condensate 24.70 BBL 1.04E-05
BBL/barrel of crude
Storage Tank Operations Crude Oil 7,826.03 BBL 3.30E-03
BBL/barrel of
crude
Cold Vent 6,129.45 MMSCF 2.59E-03
MMSCF/barrel of crude
3-21
Table 3-5. Annual Production Activity for Gas Platforms
Equipment Type Process Type
Total
Activity
Level
Units
Production/
Total
Activity
Level
Units
Amine Unit 3,592.44 MMBTU 3.57E-03
MMBTU/MMSCF
produced
Boilers/Heaters/Burners
10-100 MMBTU/hr, natural
gas 289.01 MMSCF 2.87E-04 MMSCF/MMSCF produced
Boilers/Heaters/Burners
<10 MMBTU/hr,
natural gas 498.35 MMSCF 4.95E-04
MMSCF/MMSCF
produced
Boilers/Heaters/Burners
>100 MMBTU/hr,
natural gas 2.06 MMSCF 2.04E-06
MMSCF/MMSCF
produced
Diesel Engine
MaxHP < 600,
diesel 71,611.48 MMBTU 7.11E-02
MMBTU/MMSCF
produced
Diesel Engine
MaxHP > 600,
diesel 14,044.26 MMBTU 1.39E-02
MMBTU/MMSCF
produced
Diesel Engine
MaxHP > 600,
gasoline 8,141.71 MMBTU 8.09E-03
MMBTU/MMSCF
produced
Drilling Rigs Diesel 30,618.94 MMBTU 3.04E-02
MMBTU/MMSCF
produced
Combustion Flares
No Smoke, No Pilot
Fuel, Flaring 777.00 MMBTU 7.72E-04
MMBTU/MMSCF
produced
Combustion Flares
No smoke, Pilot
fuel, Flaring 28,955.45 MMBTU 2.88E-02
MMBTU/MMSCF
produced
Combustion Flares
No Smoke, Pilot
fuel, Pilot 8.33 MMBTU 8.28E-06
MMBTU/MMSCF
produced
Glycol Dehydrator Triethylene glycol 19,790.36 MMSCF 1.97E-02
MMSCF/MMSCF
produced
Natural Gas Engine 2-stroke, rich 27,946.28 MMBTU 2.78E-02
MMBTU/MMSCF
produced
Natural Gas Engine 4-stroke, clean 209,143.63 MMBTU 2.08E-01
MMBTU/MMSCF
produced
Natural Gas Engine 4-stroke, lean 459,962.29 MMBTU 4.57E-01
MMBTU/MMSCF
produced
Natural Gas Engine 4-stroke, rich 3,256,851.22 MMBTU 3.23E+00
MMBTU/MMSCF
produced
Natural Gas Turbine 1,784,679.03 MMBTU 1.77E+00
MMBTU/MMSCF
produced
Pneumatic Pumps 93.81 MMSCF 9.32E-05
MMSCF/MMSCF
produced
Pressure/Level
Controller 22.26 MMSCF 2.21E-05
MMSCF/MMSCF
produced
Storage Tank
Operations Condensate 493.23 BBL 4.90E-04
BBL/MMSCF
produced
Storage Tank
Operations Crude Oil 502.34 BBL 4.90E-04
BBL/MMSCF
produced

3-22
Table 3-5. Annual Production Activity for Gas Platforms (Cont.)
Equipment Type Process Type
Total
Activity
Level
Units
Production/
Total
Activity
Level
Units
Cold Vent 17,645.32 MMSCF 1.75E-02
MMSCF/MMSCF
produced
4-1
4.0 OFFSHORE OIL/GAS PROCESS EMISSION FACTORS AND HAP
SPECIATION PROFILES
Emission factors were compiled for all criteria pollutants, and where available HAP
profiles for each process included in this study.
To obtain appropriate criteria emission factor information required for this project, a
number of different data sources were employed. The primary data sources used in this task
including the following:
C AP-42 (U.S. EPA 2002)
C Mineral Management Service (MMS) (U.S. Department of the Interior 2010),
Calculated/Derived Emission Factors
This section of the report discusses each data source investigated for this project,
summarizing the publically available data and noting any limitations or data gaps.
4.1 AP-42
AP-42 is the U.S. EPA’s compiled list of air pollutant emission factors by emission
source. The following processes had emission factors in AP-42:
C Amine Units;
C Boilers/Heaters/Burners;
C Diesel Engines/ Gasoline Engines;
C Drilling Rigs;
C Combustion Flares;
C Natural Gas Engines;
C Natural Gas Turbines; and
C Loading Operations.
To obtain emission factors for pollutants, SO2, PM10, and PM2.5, the fuel oil sulfur
content (weight percent) or H2S content must be applied to the numerical value from AP-42. The
MMS provided surrogate values for the fuel sulfur content and H2S content.
Diesel fuel sulfur content = 0.4 weight percent
Natural gas hydrogen sulfide (H2S) content = 3.38 ppm-v

4-2
In some cases VOC emission factors were only available as THC. These factors
were converted to VOC to using conversion factors in the 2005 TCEQ Oil and Gas
Study.
4-3
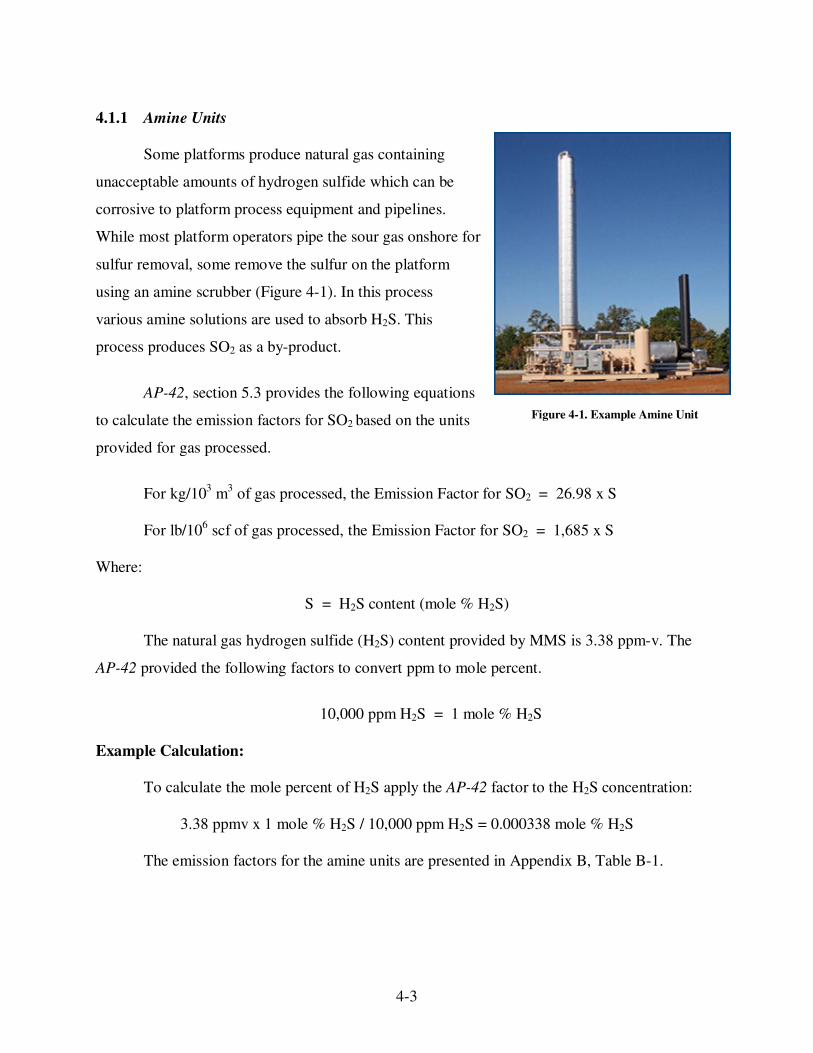
4.1.1 Amine Units
Some platforms produce natural gas containing
unacceptable amounts of hydrogen sulfide which can be
corrosive to platform process equipment and pipelines.
While most platform operators pipe the sour gas onshore for
sulfur removal, some remove the sulfur on the platform
using an amine scrubber (Figure 4-1). In this process
various amine solutions are used to absorb H2S. This
process produces SO2 as a by-product.
AP-42, section 5.3 provides the following equations
to calculate the emission factors for SO2 based on the units
provided for gas processed.
For kg/10
3 m
3 of gas processed, the Emission Factor for SO2 = 26.98 x S
For lb/106 scf of gas processed, the Emission Factor for SO2 = 1,685 x S
Where:
S = H2S content (mole % H2S)
The natural gas hydrogen sulfide (H2S) content provided by MMS is 3.38 ppm-v. The
AP-42 provided the following factors to convert ppm to mole percent.
10,000 ppm H2S = 1 mole % H2S
Example Calculation:
To calculate the mole percent of H2S apply the AP-42 factor to the H2S concentration:
3.38 ppmv x 1 mole % H2S / 10,000 ppm H2S = 0.000338 mole % H2S
The emission factors for the amine units are presented in Appendix B, Table B-1.
Figure 4-1. Example Amine Unit

4-4
4.1.2 Boilers, Heaters, and Burners
Boilers, heaters, and burners provide heat, electricity, and steam required for many
processes. These combustion sources include steam turbines, glycol dehydrator reboilers, and
amine reboiler units (EIIP 1999), emitting NOx, CO, VOC, SOx, and PM.
The emission factors for boilers, heaters, and burners are presented in Table B-2.0 to
B-2.1 (Appendix B). These factors come from AP-42, Sections 1.3 and 1.4 (U.S. EPA 2002). All
boilers are assumed to be wall-fired boilers (no tangential-fired boilers). Emission factors for
No. 6 residual oil were used to estimate emissions from waste-oil-fueled units.
4.1.3 Diesel Engines/Gasoline Engines
Diesel and gasoline engines are used to run generators, pumps, compressors, and well-
drilling equipment. Most of the pollutants emitted from these engines are from the exhaust.
Evaporative losses are insignificant in diesel engines due to the low volatility of diesel fuels
(U.S. EPA 2002).
The emission factors for diesel and gasoline engines are presented in Table B-3.0 to
B-3.2 (Appendix B). These factors came from AP-42, Sections 3.3 and 3.4 (U.S. EPA 2002).
4.1.4 Drilling Rigs
Drilling activities associated with an existing facility or from a jack-up rig adjacent to a
platform are included because of the emissions are associated with gasoline, diesel, and natural
gas fuel usage. Total emissions equal the sum of emissions due to each engine type (i.e.,
gasoline, diesel, and natural gas engines).
The emission factors for drilling rigs are presented in Appendix B, Table B-4.0. These
factors come from AP-42, Sections 3.2, 3.3, and 3.4 (U.S. EPA 2002). Diesel engines are
assumed to be ≥ 600 hp. Natural gas engines are assumed to be 4-cycle and evenly distributed
between lean and rich burns (by averaging).
4-5
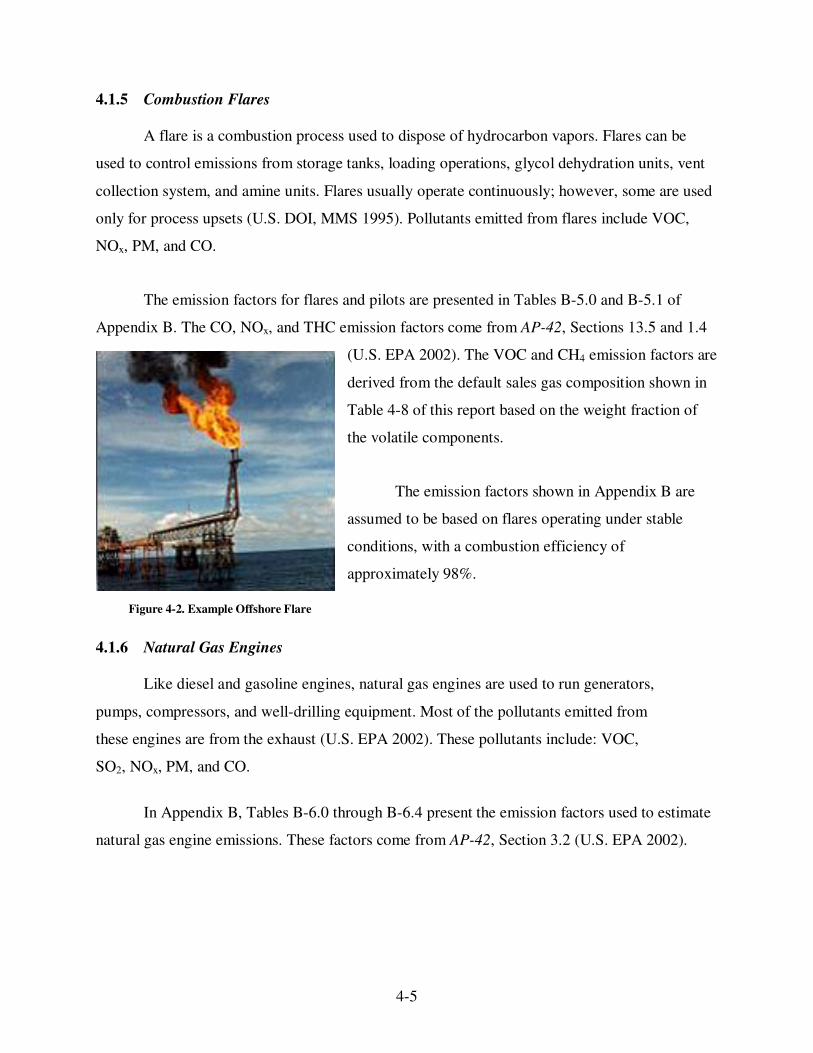
4.1.5 Combustion Flares
A flare is a combustion process used to dispose of hydrocarbon vapors. Flares can be
used to control emissions from storage tanks, loading operations, glycol dehydration units, vent
collection system, and amine units. Flares usually operate continuously; however, some are used
only for process upsets (U.S. DOI, MMS 1995). Pollutants emitted from flares include VOC,
NOx, PM, and CO.
The emission factors for flares and pilots are presented in Tables B-5.0 and B-5.1 of
Appendix B. The CO, NOx, and THC emission factors come from AP-42, Sections 13.5 and 1.4
(U.S. EPA 2002). The VOC and CH4 emission factors are
derived from the default sales gas composition shown in
Table 4-8 of this report based on the weight fraction of
the volatile components.
The emission factors shown in Appendix B are
assumed to be based on flares operating under stable
conditions, with a combustion efficiency of
approximately 98%.
4.1.6 Natural Gas Engines
Like diesel and gasoline engines, natural gas engines are used to run generators,
pumps, compressors, and well-drilling equipment. Most of the pollutants emitted from
these engines are from the exhaust (U.S. EPA 2002). These pollutants include: VOC,
SO2, NOx, PM, and CO.
In Appendix B, Tables B-6.0 through B-6.4 present the emission factors used to estimate
natural gas engine emissions. These factors come from AP-42, Section 3.2 (U.S. EPA 2002).
Figure 4-2. Example Offshore Flare

4-6
4.1.7 Natural Gas Turbines
A gas turbine is an internal combustion engine that operates with rotary rather than
reciprocating motion. Turbines are primarily used to power compressors (Boyer and Brodnax
1996). Pollutants emitted from natural gas turbines include VOC, SO2, NOx, PM, and CO.
The emission factors for natural gas turbines are presented in Table B-7.0, Appendix B.
These factors come from AP-42 Section 3.1 (U.S. EPA 2002).
4.1.8 Loading Operations
Loading oil onto barges or lightering vessels for transportation to shore offers an
opportunity for emissions to escape during the oil transfer. The emission factors for loading
operations are calculated using a procedure in Section 5.2 of AP-42. Table 4-1 presents the data
inputs needed for developing the loading emission factor, and the following equation shows how
the factor is derived:
Loading EF = (Ca + 1.84 x ((0.44 x P) – 0.42) x ((M x G)/T) x VOC wt% x 42 gal/BBL
Where:
Ca = Arrival factor, any condition (lb/1000 gallons)
P = True vapor pressure of loaded crude oil (psia)
M = Molecular weight of vapors (lb/lb-mole)
G = Growth factor (dimensionless)
T = Temperature of vapors (º R where º R = º F +459.67)
Table 4-1. Loading Operations VOC Emission Factor Data Inputs
Source Category Ca P
M G T (R) VOC wt %
Loading Operations - Oil 0.33 3.4 50 1.02 529.67 85
Example Calculation:
Loading emission factor using the data inputs noted in Table 4-1.
Loading EF = (0.33 + 1.84 x ((0.44 x 3.4) – 0.42) x (50 x 1.02/529.67))
= 0.52 lb/1000gal x 0.85 x 42 gal/BBL
Loading EF = 0.016 lb/BBL

4-7
4.2 MMS Calculated/Derived Emission Factors
Platforms can have unique processes for which accurate emission factors are not
available. For some of these processes (e.g., fugitive sources, vents, mud degassing, pneumatic
pumps and controllers), detailed information about chemical composition of a processes stream
is required, in other cases (e.g., equipment components, glycol dehydrators and storage tanks)
detailed information about the operation and configuration of the system is needed.
Unfortunately, such detailed information is not available for platforms that operate in Texas
waters. As an alternative, emission factors were developed for these sources from data obtained
from MMS, AP-42, and in the case of storage tanks, data from the Houston Advanced Research
Center (HARC). The following processes were derived and calculated using these data sources:
C Fugitive Sources;
C Cold Vents;
C Glycol Dehydrators;
C Mud Degassing;
C Pneumatic Pumps; and
C Pressure/level controllers.
The following sections of the report describes how emission factors for these sources were
derived noting all assumptions that needed to be made.
4.2.1 Fugitives
Fugitive emissions are leaks from sealed surfaces associated with process equipment.
Specific fugitive source types include equipment components such as valves, flanges, and
connectors (EIIP 1999). Because equipment leaks are not a combustion process, the only criteria
pollutant of interest emitted from these sources is VOCs.
THC emission factors for fugitive components were obtained from MMS and shown in
Table 4-2. Fugitive THC emissions are estimated using the following equation, as described in
the MMS Gulfwide inventory:
( )∑ ×=comp
compstreamcomp,THC NEFE × D
4-8
Where:
ETHC = THC emissions in pounds per month
EFcomp,stream = Emission factor unique the type of component and process
Stream (lb/component-day)
Ncomp = Count of components of a given type present on the
facility (Note: Null values are treated as zero.)
D = Number of days per month
Table 4-2. THC Emission Factors for Oil and Gas Production Operations
(lb/component-day)a
Component Gas
Natural
Gas
Liquid
Light Oil
(≥≥≥≥ 20 API
Gravity)
Heavy Oil
(< 20 API
Gravity) Water/Oil
Oil/Water/
Gasc
Connector 1.1E-02 1.1E-02 1.1E-02 4.0E-04 5.8E-03 1.1E-02
Flange 2.1E-02 5.8E-03 5.8E-03 2.1E-05 1.5E-04 2.1E-02
Open-end 1.1E-01 7.4E-02 7.4E-02 7.4E-02 1.3E-02 1.1E-01
Otherb
4.7E-01 4.0E-01 4.0E-01 1.7E-03 7.4E-01 7.4E-01
Pump 1.3E-01 6.9E-01 6.9E-01 6.9E-01 1.3E-03 1.3E-01
Valve 2.4E-01 1.3E-01 1.3E-01 4.4E-04 5.2E-03 2.4E-01 a Source: API 1996 b Includes compressor seals, diaphragms, drains, dump arms, hatches, instruments, meters, pressure relief valves,
polished rods, and vents. c Assumed to be equal to either gas or water/oil, whichever is greater.
The VOC emission factor was calculated based on default speciation weight fractions for
THC emissions by stream type (Table 4-3).
Fugitive VOC emissions are estimated according to the following equation:
streamcomp,THCVOC WtFrVOCE E ×=
Where:
EVOC = VOC emissions in pounds per month
ETHC = THC emissions in pounds per month WtFrVOCcomp,stream = Weight fraction of VOC unique to the process stream
4-9
Table 4-3. Default Speciation Weight Fractions for THC
Emissions by Stream Typea
THC Fraction Gas
Natural
Gas
Liquid
Light Oil
(≥≥≥≥ 20 API
Gravity)
Heavy Oil
(<20 API
Gravity) Water/Oilb
Oil/Water/
Gas
CH4 0.945 0.612 0.612 0.942 0.612 0.612
VOC 0.0137 0.296 0.296 0.030 0.296 0.296 a Source: API 1996
b Water/oil refers to water streams in oil service with a water content greater than 50% from the point of origin to
the point where the water content reaches 99%. For water streams with a water content greater than 99%, the
emission rate is considered negligible.
Table B-8 in Appendix B presents the calculated emission factors for fugitive emissions.
4.2.2 Cold Vents
Production facilities often discharge natural gas to the atmosphere via vents. The
discharges can be due to routine or emergency releases. Vents receive exhaust streams from
miscellaneous sources, as well as manifold exhaust streams from other equipment on the same
platform such as amine units, glycol dehydrators, loading operations, and storage tanks.
Emissions from vents are calculated based on the volume of gas vented from miscellaneous
equipment, adjusted for the volume of emission from the manifold equipment, which are
reported at the equipment-level, including periods of upset venting in the total.
Derived and calculated emission factors were developed from MMS and AP-42 data.
VOC emission factors for cold vents were derived from total emissions and activity data reported
in MMS' 2005 Gulfwide emission inventory (Table 4-4) using the following equation:
Emissions (tons) x 2000 lbs/ton / Activity Data (MMscf) = Emission factor (lb/MMscf)
Table 4-4. Cold Vent Activity and Emission Data
Pollutant 2005 Activity (mscf) Emissions (tons) Emission Factor (lb/mscf)
VOC 3,548,778.00 18,073 10.19
THC 3,548,778.00 82,042 46.24
H2S 3,548,778.00 0.565 0.00032
4-10
4.2.3 Glycol Dehydrators
Glycol dehydrators (Figure 4-3) remove minute
water participles from natural gas streams to prevent the
formation of hydrates that can be corrosive to pipelines
(EIIP 1999). A glycol dehydrator consists of an absorber
and a reboiler. Wet gas enters at the bottom of the absorber
and percolates upward releasing water into a glycol
solution; dry gas is removed from the top of the absorber.
When the glycol solution becomes saturated with water, it
is pumped through a reboiler, also called a reconcentrator,
which boils the glycol-water mixture allowing the water to
be released. After separation, the glycol is returned to the
absorber repeating the process.
Emission factors were developed from MMS and AP-42 data. Similar to cold vents, the
VOC emission factor for glycol dehydrators was derived from total emissions and activity data
(Table 4-5) using the same calculation shown for Cold Vents.
Table 4-5. Glycol Dehydrator Activity and Emissions Data (MMS data)
Pollutant 2005 Activity (MMscf)
Emissions
(tons)
Emission
Factor
(lb/MMscf)
VOC 2,375,853.12 2,792 2.35
Figure 4-3. Example Glycol Dehydrator
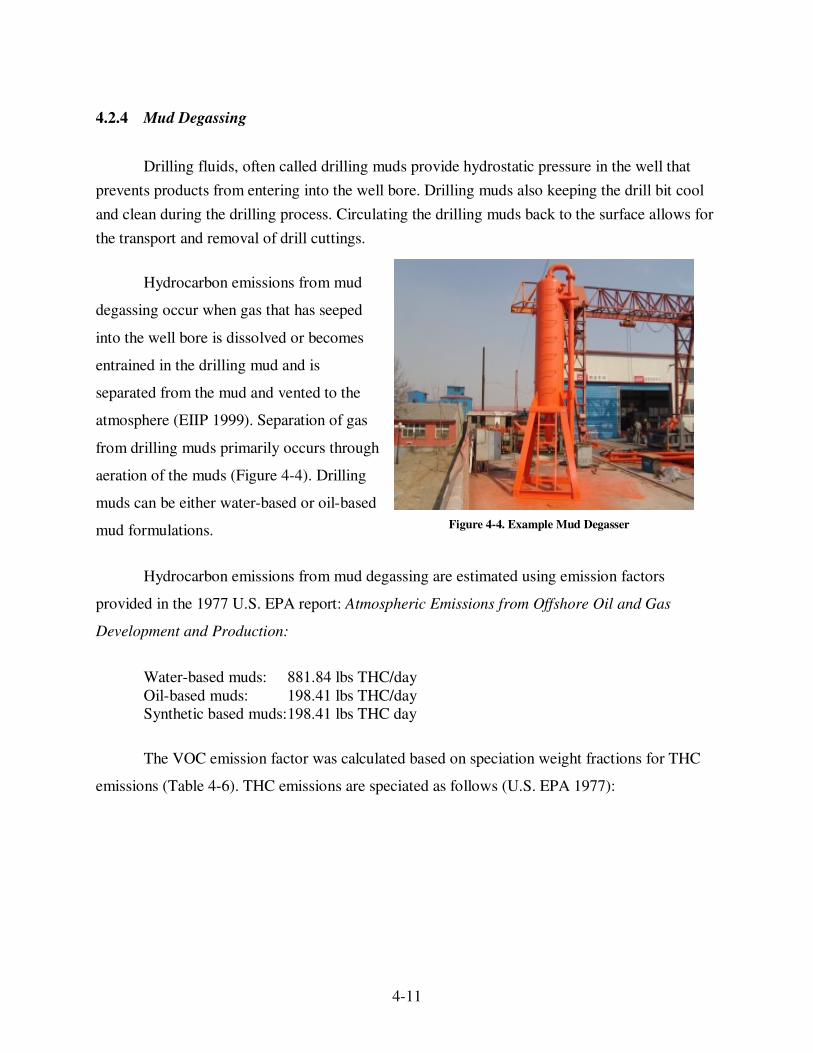
4-11
4.2.4 Mud Degassing
Drilling fluids, often called drilling muds provide hydrostatic pressure in the well that
prevents products from entering into the well bore. Drilling muds also keeping the drill bit cool
and clean during the drilling process. Circulating the drilling muds back to the surface allows for
the transport and removal of drill cuttings.
Hydrocarbon emissions from mud
degassing occur when gas that has seeped
into the well bore is dissolved or becomes
entrained in the drilling mud and is
separated from the mud and vented to the
atmosphere (EIIP 1999). Separation of gas
from drilling muds primarily occurs through
aeration of the muds (Figure 4-4). Drilling
muds can be either water-based or oil-based
mud formulations.
Hydrocarbon emissions from mud degassing are estimated using emission factors
provided in the 1977 U.S. EPA report: Atmospheric Emissions from Offshore Oil and Gas
Development and Production:
Water-based muds: 881.84 lbs THC/day
Oil-based muds: 198.41 lbs THC/day Synthetic based muds:198.41 lbs THC day
The VOC emission factor was calculated based on speciation weight fractions for THC
emissions (Table 4-6). THC emissions are speciated as follows (U.S. EPA 1977):
Figure 4-4. Example Mud Degasser
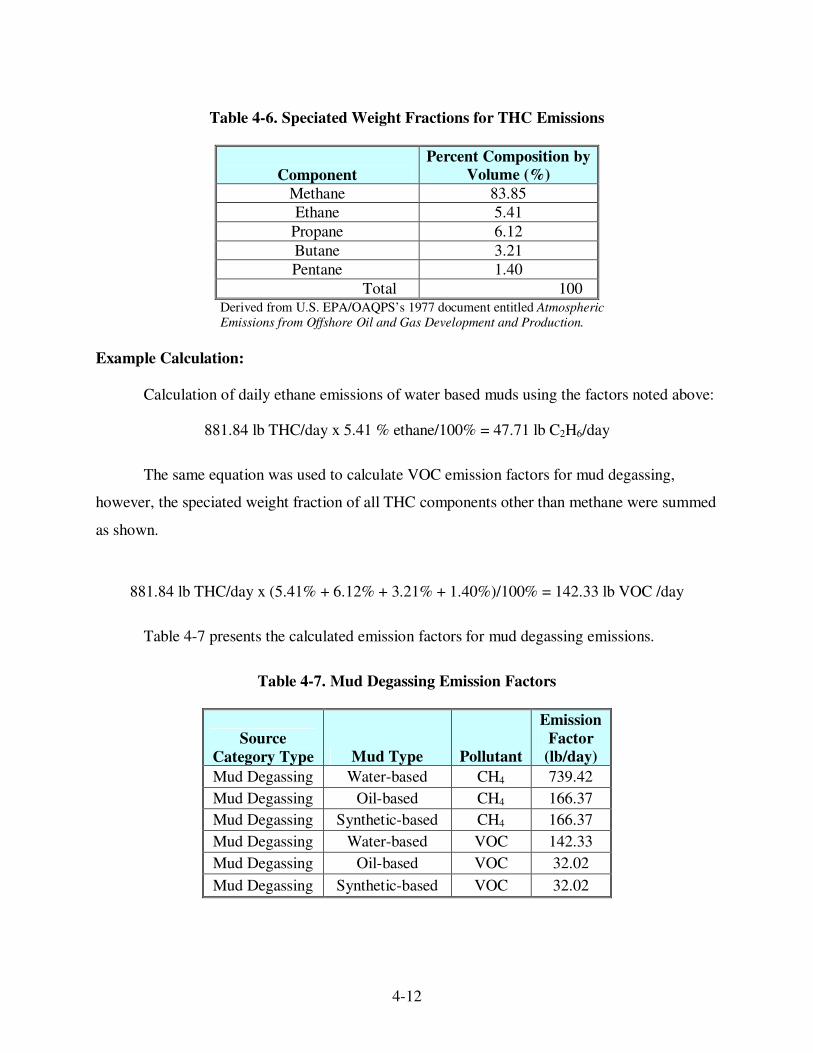
4-12
Table 4-6. Speciated Weight Fractions for THC Emissions
Component
Percent Composition by
Volume (%)
Methane 83.85
Ethane 5.41
Propane 6.12
Butane 3.21
Pentane 1.40
Total 100 Derived from U.S. EPA/OAQPS’s 1977 document entitled Atmospheric
Emissions from Offshore Oil and Gas Development and Production.
Example Calculation:
Calculation of daily ethane emissions of water based muds using the factors noted above:
881.84 lb THC/day x 5.41 % ethane/100% = 47.71 lb C2H6/day
The same equation was used to calculate VOC emission factors for mud degassing,
however, the speciated weight fraction of all THC components other than methane were summed
as shown.
881.84 lb THC/day x (5.41% + 6.12% + 3.21% + 1.40%)/100% = 142.33 lb VOC /day
Table 4-7 presents the calculated emission factors for mud degassing emissions.
Table 4-7. Mud Degassing Emission Factors
Source
Category Type Mud Type Pollutant
Emission
Factor
(lb/day)
Mud Degassing Water-based CH4 739.42
Mud Degassing Oil-based CH4 166.37
Mud Degassing Synthetic-based CH4 166.37
Mud Degassing Water-based VOC 142.33
Mud Degassing Oil-based VOC 32.02
Mud Degassing Synthetic-based VOC 32.02

4-13
4.2.5 Pneumatic Pumps
A readily-available supply of compressed natural gas is used to
power gas-actuated pneumatic pumps. There is no combustion of the gas
associated with these pumps because the energy is derived from the gas
pressure. These pumps include reciprocating pumps such as diaphragm,
plunger, and piston pumps (Figure 4-5). Most gas actuated pumps vent
directly to the atmosphere (Boyer and Brodnax, 1996).
THC and VOC emission factors (in lb/scf) for pneumatic pumps are developed using the
following equation.
EF = (mole weight of gas, lbs/lb-mole) x (1 lb-mole/379.4 scf)
Where:
EF = Emission Factor (in lb/ scf)
Mole weight of Gas = Mole percent of constituent/100 x mole weight of constituent/gas
MW
Example Calculation:
Pneumatic pump carbon dioxide emission factor using default sales gas composition and
mole weight (Table 4-8) using the above equations:
Mole weight of Gas = 0.80%/100% x 44.010 lb/lb-mol /17.2 Carbon Dioxide Emission Factor = 0.0205 lb/lb-mole x 1 lb-mol/379.4 scf
= 0.000054 lb/scf
To determine the mole percent of each constituent (CH4, CO2, THC, and VOC), sales gas
composition data for natural gas was obtained from the MMS data, and the VOC weight % was
calculated. Table 4-8 presents the default gas composition and the mole weight for each gas
constituent. Table 4-9 shows the emission factors for pneumatic pumps using these gas
compositions.
Figure 4-5. Example of Gas Activated
Piston Pump

4-14
Table 4-8. Default Sales Gas Composition (MMS 2010)
Component Default Mol%
Mole Weight
(lb/lb-mole)
CO2 0.80 44.010
CH4 94.50 16.043
C2 3.33 30.070
C3 0.75 44.097
i-C4 0.15 58.124
n-C4 0.15 58.124
i-C5 0.05 72.150
n-C5 0.05 72.150
C6 0.099 86.177
C7 0.011 100.272
C8+ 0.007 114.231
Table 4-9. Emission Factors for Pneumatic Pumps
Source Category Pollutant
Mole Weight,
Gas
Mole
Weight,
Constituent
Emission
Factor
(lb/scf)
Pneumatic Pump VOC 17.20 0.68 0.0001
Pneumatic Pump CO2 17.20 0.35 0.0001
Pneumatic Pump CH4 17.20 15.16 0.0023
Pneumatic Pump THC 17.20 16.84 0.0026
4.2.6 Pressure/Level Controllers
Devices that control both pressure and liquid levels on vessels and flow lines are
used extensively in oil and gas production operations. The units are designed to open or
close a valve when a preset pressure or liquid level is reached. The valves are
automatically actuated by bleeding compressed gas from a diaphragm or piston. The gas
is vented to the atmosphere in the process. Most production facilities use natural gas to
actuate the controllers. The amount of gas vented is dependent on several factors,
including the manufacturer and application (Boyer and Brodnax 1996).
Similar to pneumatic pumps, THC and VOC emission factors (in lb/scf) are developed
using the following equation.

4-15
EF = (mole weight of gas, lbs/lb-mole) x (1 lb-mole/379.4 scf)
Where:
EF = Emission Factor (in lb/ scf)
Mole weight of Gas = Mole percent of constituent/100 x mole weight of constituent/gas
MW
Example Calculation:
Carbon dioxide emission factor for pressure/level controller using default sales gas
composition and mole weight (Table 4-8) using the above equations:
Mole weight of Gas = 0.80%/100% x 44.010 lb/lb-mol /17.2 Carbon Dioxide Emission Factor = 0.0205 lb/lb-mole x 1 lb-mol/379.4 scf
= 0.000054 lb/scf
To determine the mole percent of each constituent (CH4, CO2, THC, and VOC), sales gas
composition data for natural gas was obtained from the MMS data, and the VOC weight % was
calculated. Table 4-10 presents the default gas composition and the mole weight for each gas
constituent.
Table 4-10. Emission Factors for Pressure/Level Controllers
Source Category Pollutant
Mole Weight,
Gas
Mole
Weight,
Constituent
Emission
Factor
(lb/scf)
Pressure/Level Controllers
VOC 17.20 0.68 0.0001
Pressure/Level Controllers
CO2 17.20 0.35 0.0001
Pressure/Level Controllers
CH4 17.20 15.16 0.0023
Pressure/Level Controllers
THC 17.20 16.84 0.0026
4.2.7 Storage Tanks
VOC may be lost from oil storage tanks as a result of flashing, working and standing
losses. The HARC study reports measurements of speciated volatile organic compound (VOC)

4-16
emissions from oil storage. The measurements were made by monitoring the flow rates of gases
escaping from storage tank vents and sampling the vent gases for chemical composition.
Emission factors are in units of pounds of VOC per barrel of oil were derived from the
measurement data. The study resulted in the following emission factor found in the 2007 TCEQ
report, Emissions from Oil and Gas Production Facilities:
Crude Oil Storage Tanks = 0.44 lb VOC/BBL
4.3 Hazardous Air Pollutant Speciation Profiles
Emission factors and speciation profiles were developed for the following
offshore processes:
C Boilers/heaters/burners; C Combustion flares;
C Diesel engines; C Drilling equipment;
C Glycol dehydrators; C Loading operations;
C Natural gas engines; C Natural gas turbines;
C Storage tanks; and C Cold vents.
For evaporative and fugitive sources, HAP emission factors and speciation profiles are
highly dependant on the chemical composition of the product being emitted. Typical refinery
data obtained from a 2002 EPA source characterization study implemented by RTI of petroleum
refinery processes were used for cold vents and chemical storage tanks associated with oil
production. The compiled HAP emission factors and profiles are presented in Appendix C of this
report and used to populate the project’s HAP data table. Appropriate HAP emission factor or
speciation profiles were not indentified for the following source categories:
C Fugitive sources; C Mud degassing;
C Pneumatic pumps; and C Pressure/level controllers.
To develop better factors and profiles that more accurately represent offshore oil and gas
facilities that operate in Texas waters would require obtaining source test data or gas
composition profiles from operators.
4-17
4.3.1 HAP Data Sources
For this project, the following data sources were accessed and available HAP emission
factors and profiles evaluated:
C U.S. Environmental Protection Agency’s (EPA) AP-42,
C U.S. Environmental Protection Agency’s SPECIATE Database,
C California Air Resources Board’s (CARB) California Air Toxic Emission Factor database,
C EPA - Petroleum Refinery Source Characterization and Emission Model for Residual
Risk Assessment, and
C 2008 Annual Emission Inventory submittals to TCEQ.
AP-42 data were given priority in this study as this data source represents the EPA’s
official reference for emission factors, including HAPs for many, though not all oil and gas
source categories. The AP-42 emission factors were compiled and converted into fractions
relative to the VOC and PM emission factors associated with the HAP data. The EPA’s
SPECIATE data base was used to gap fill any missing pollutants not addressed in AP-42; note
that SPECIATE only provides VOC and PM HAP fractions, not emission factors. Next, CARB
data were reviewed to ensure that the compiled HAP factors and profiles included all possible
HAPs. As noted above the EPA’s petroleum refinery source characterization study was also
considered for evaporative and fugitive emission sources. 2008 Annual Emission Inventory
submittals provided by TCEQ for major point sources were used to develop HAP profiles for
glycol dehydrators. In all cases, the HAP fractions were evaluated for each process to ensure that
the total HAP species were not larger than the pollutant that was being speciated.
All compiled HAP emission factors and profiles were included in the project’s HAP
profile dataset and are provided in Appendix C.
AP-42
The EPA’s AP-42, Compilation of Air Pollutant Emission Factors, has been
published since 1972 as the primary compilation of EPA’s emission factor information. It
contains emission factors and process information for more than 200 air pollution
4-18
source categories. The emission factors have been developed and compiled from
source test data, material balance studies, and engineering estimates. The fifth edition
of AP-42 was published in January 1995. Since then EPA has published supplements
and updates to the fifteen chapters of Volume I, Stationary Point and Area Sources. The
following processes had HAP emission factors in AP-42 that were incorporated into this
project’s HAP data table:
C Boilers/Heaters/Burners; C Diesel Engines/ Gasoline Engines; C Natural Gas Engines; and C Natural Gas Turbines
SPECIATE Database
The SPECIATE database serves as the EPA repository for source category-
specific emission speciation profiles. The profiles contain weight fractions of species of
both VOC and PM. The database was first compiled in 1988 and is maintained as a
component of the Clearing House for Inventories and Emission Factors (CHIEF)
website. The data base includes over 3,000 PM profiles and 1,600 organic gas profiles.
SPECIATE data were used to add benzene, toluene, formaldehyde, and 1,3-butadiene
for boilers and diesel engines to this project’s HAP data table.
CARB Air Toxic Emission Factor Database
The California Air Toxics Emission Factor (CATEF) database contains
approximately 2,000 air toxics emission factors calculated from source test data
collected for the California Air Toxics Hot Spots Program. The emission factors developed
under this program have been compiled into a database for use by CARB and facility
owners/operators. The CATEF database uses a graphical-user-interface (GUI) to easily view,
search, sort, export, and print compiled emission factor information. For this project, factors for
acetaldehyde, acrolein, formaldehyde, hexane, naphthalene, propylene, toluene, and
xylene were added to the project HAP data table for combustion sources.
Petroleum Refinery Source Characterization Study
In 2002, the EPA commissioned a source character study for petroleum refineries that
was incorporated into the Refinery Emission Model (REM) which is an Access database model
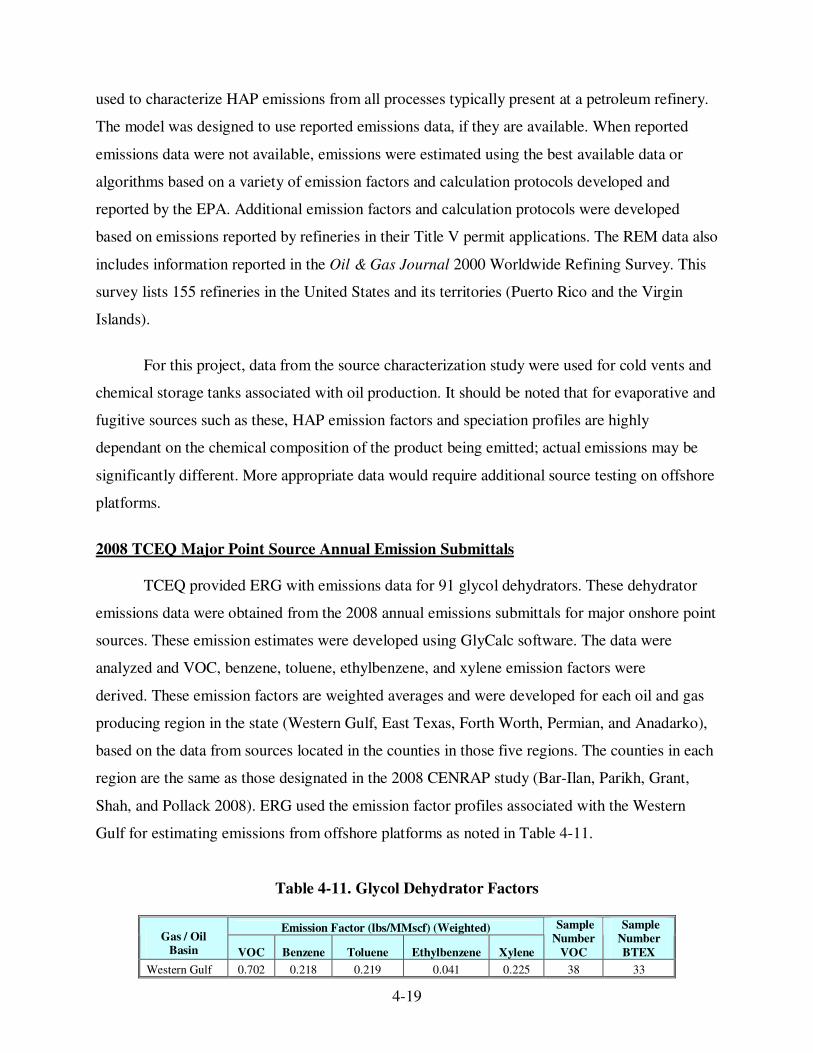
4-19
used to characterize HAP emissions from all processes typically present at a petroleum refinery.
The model was designed to use reported emissions data, if they are available. When reported
emissions data were not available, emissions were estimated using the best available data or
algorithms based on a variety of emission factors and calculation protocols developed and
reported by the EPA. Additional emission factors and calculation protocols were developed
based on emissions reported by refineries in their Title V permit applications. The REM data also
includes information reported in the Oil & Gas Journal 2000 Worldwide Refining Survey. This
survey lists 155 refineries in the United States and its territories (Puerto Rico and the Virgin
Islands).
For this project, data from the source characterization study were used for cold vents and
chemical storage tanks associated with oil production. It should be noted that for evaporative and
fugitive sources such as these, HAP emission factors and speciation profiles are highly
dependant on the chemical composition of the product being emitted; actual emissions may be
significantly different. More appropriate data would require additional source testing on offshore
platforms.
2008 TCEQ Major Point Source Annual Emission Submittals
TCEQ provided ERG with emissions data for 91 glycol dehydrators. These dehydrator
emissions data were obtained from the 2008 annual emissions submittals for major onshore point
sources. These emission estimates were developed using GlyCalc software. The data were
analyzed and VOC, benzene, toluene, ethylbenzene, and xylene emission factors were
derived. These emission factors are weighted averages and were developed for each oil and gas
producing region in the state (Western Gulf, East Texas, Forth Worth, Permian, and Anadarko),
based on the data from sources located in the counties in those five regions. The counties in each
region are the same as those designated in the 2008 CENRAP study (Bar-Ilan, Parikh, Grant,
Shah, and Pollack 2008). ERG used the emission factor profiles associated with the Western
Gulf for estimating emissions from offshore platforms as noted in Table 4-11.
Table 4-11. Glycol Dehydrator Factors
Emission Factor (lbs/MMscf) (Weighted) Gas / Oil
Basin VOC Benzene Toluene Ethylbenzene Xylene
Sample
Number
VOC
Sample
Number
BTEX
Western Gulf 0.702 0.218 0.219 0.041 0.225 38 33

4-20
It should be noted that these glycol dehydrator estimates were derived from point sources
that include a mix of controlled and uncontrolled processes. Because these data are from
facilities which are larger than typical area source operations, it may be that emissions at these
facilities are qualitatively different from the emissions at smaller offshore sources as operators of
large point sources may be more likely to install control devices on their dehydrators. Further
study may be required to evaluate this issue.

5-1
5.0 MODEL OIL AND GAS PLATFORMS
Oil and gas platforms often include a variety of industrial processes that aid in the
extraction and storage of the product, removal of water and sulfur compounds that allow for the
product to be piped or shipped to shore with out corrosion, power to run equipment on the
platform, and operation of drilling equipment to allow for further development of the well site.
Detailed information about the processes that operate on offshore platforms in Texas
water was not available, and survey of platform operators could not be implemented at this time.
Therefore, it was necessary to approximate the processes that tend to be found on platforms by
evaluating detailed data from the 2005 MMS Gulf-wide inventory. These data lead to the
development of typical model oil and gas platforms which include equipment profiles and
operational data.
It should be noted that platforms in Federal waters may be different than platforms in
state waters. It is believe that platforms that operate further out to sea may be larger than those
operating closer to shore. This could mean that the power demands are less for platform in state
waters reducing the need for large stationary engines and boilers. Because state water platforms
are closer to shore, they may have less need for product storage and some processes such as
amine units are not used as extensively as sulfur removal may occur at a nearby onshore facility.
A survey of offshore platforms would help quantify the processes that are actually used on these
facilities.
Based on the typical process-level activity presented in Section 3 of this report and the
associated emission factors presented in Section 4, these data were combined using the following
equation into an emissions profile or “model factor” oil and gas platforms in terms of annual
productions. Tables 5-1 and 5-2 show each oil and gas platform model individually.
PEFepi = EFepi x Aei
Where:
PEFepi = Platform emission profile for process e, pollutant p on platform type i (lbs/bbl or MMscf)
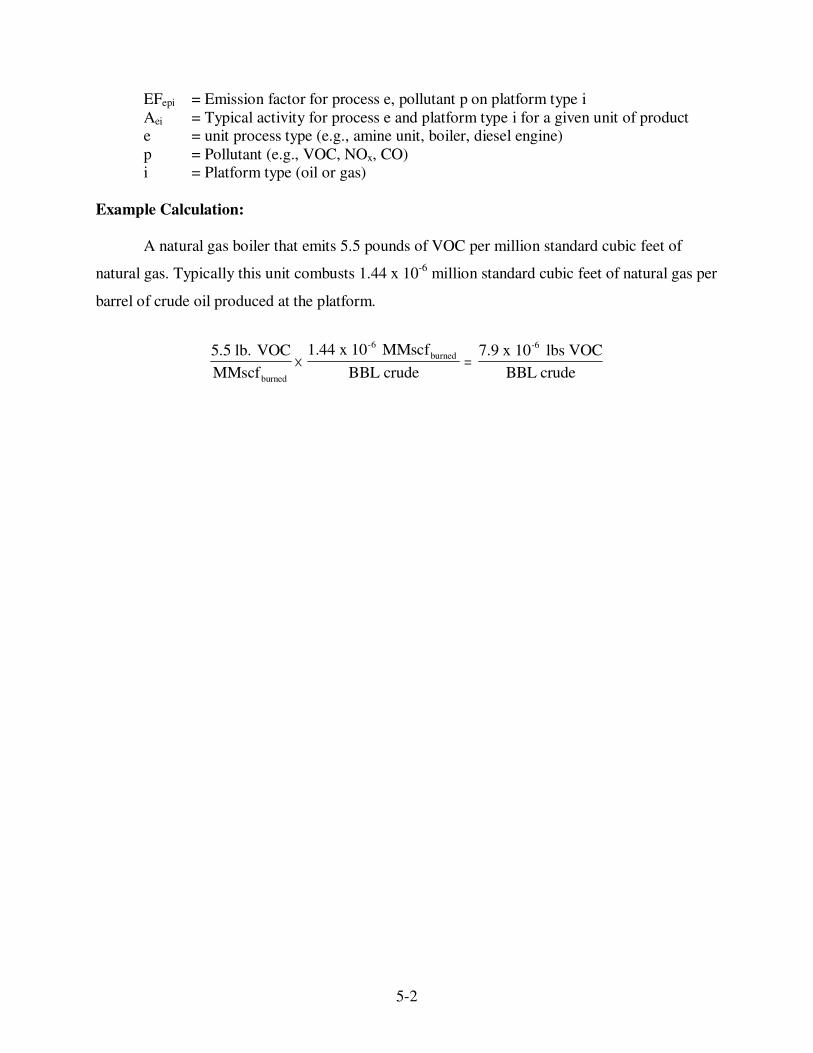
5-2
EFepi = Emission factor for process e, pollutant p on platform type i
Aei = Typical activity for process e and platform type i for a given unit of product e = unit process type (e.g., amine unit, boiler, diesel engine)
p = Pollutant (e.g., VOC, NOx, CO) i = Platform type (oil or gas)
Example Calculation:
A natural gas boiler that emits 5.5 pounds of VOC per million standard cubic feet of
natural gas. Typically this unit combusts 1.44 x 10⁻⁶
million standard cubic feet of natural gas per
barrel of crude oil produced at the platform.
5.5 lb. VOC
MMscf
1.44 x 10 MMscf
BBL crude
7.9 x 10 lbs VOC
BBL crudeburned
-6
burned
-6
× =

5-1
Table 5-1. Model Offshore Oil Platform
Model Factor in lb/Barrel of Crude Oil Platform Source Category
CO NOX
PM10-
PRI PM25-PRI SO2 VOC
Boilers/Heaters/Burners < 10
MMBTU/hr, natural gas 1.21E-04 1.44E-04 2.73E-06 2.73E-06 8.62E-07 7.90E-06
Diesel Engine, MaxHP < 600, diesel 7.46E-04 3.46E-03 2.43E-04 2.43E-04 2.70E-04 2.59E-04
Diesel Engine, MaxHP > 600, diesel 1.51E-04 5.68E-04 1.01E-05 9.94E-06 6.10E-05 1.42E-05
Fugitives - Connectors - natural gas 6.37E-06
Fugitives - Connectors - oil 1.23E-07
Fugitives - Connectors - oil/water 1.08E-07
Fugitives - Flanges - natural gas 3.28E-06
Fugitives - Flanges - oil 1.23E-08
Fugitives - Flanges - oil/water 4.32E-08
Fugitives - Other Equipment - natural
gas 1.60E-04
Fugitives - Other Equipment - oil 6.17E-07
Fugitives - Other Equipment - oil/water 3.63E-04
Fugitives - Pumps - natural gas 6.30E-05
Fugitives - Pumps - oil 9.45E-05
Fugitives - Pumps - oil/water 1.85E-07
Fugitives - Valves - natural gas 7.43E-05
Fugitives - Valves - heavy oil 1.23E-07
Fugitives - Valves - oil 1.62E-06
Natural Gas Engine, 2-stroke, lean 3.42E-02 1.88E-01 3.72E-03 3.72E-03 5.69E-05 1.16E-02
Natural Gas Engine, 4-stroke, clean 4.97E-02 3.33E-02 4.35E-06 4.35E-06 3.32E-05 6.78E-03
Natural Gas Engine, 4-stroke, rich 6.61E-01 4.27E-01 1.79E-03 1.79E-03 1.11E-04 5.65E-03
Pneumatic Pumps 9.06E-04
Pressure/Level Controller 4.68E-05
Storage Tank Operations, Condensate 3.48E-04
Storage Tank Operations, Crude Oil 5.29E-03
Cold Vent 2.64E-02
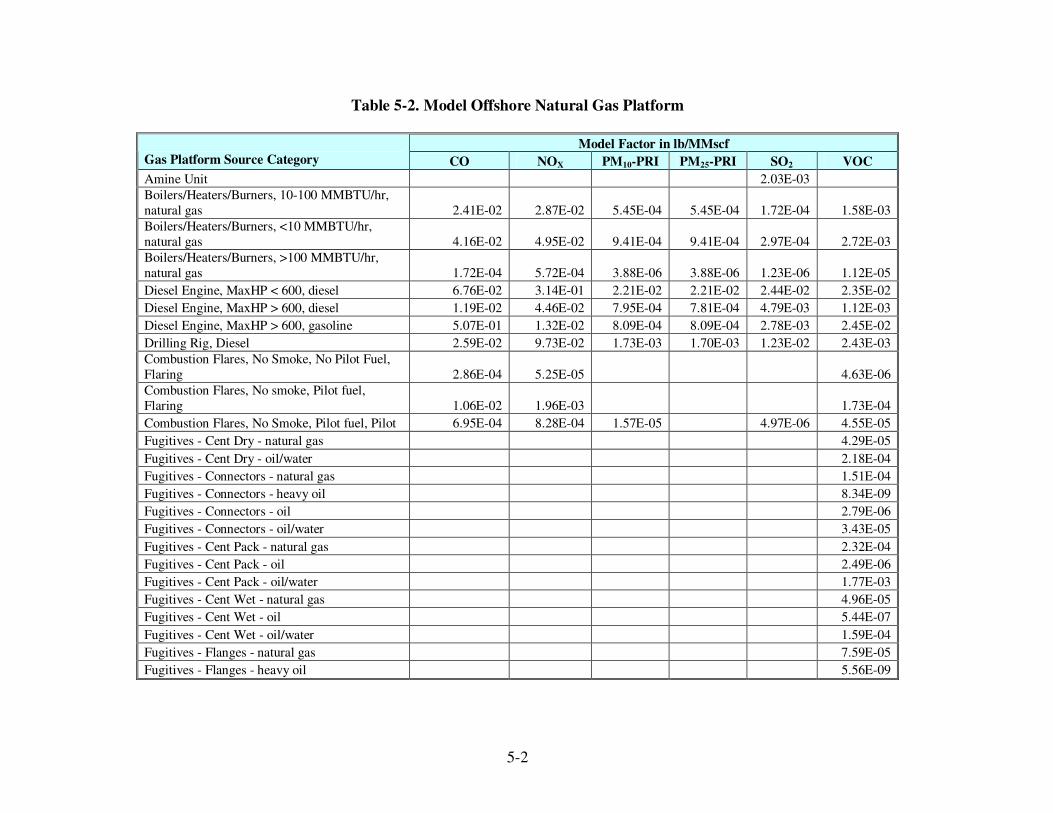
5-2
Table 5-2. Model Offshore Natural Gas Platform
Model Factor in lb/MMscf
Gas Platform Source Category CO NOX PM10-PRI PM25-PRI SO2 VOC
Amine Unit 2.03E-03
Boilers/Heaters/Burners, 10-100 MMBTU/hr,
natural gas 2.41E-02 2.87E-02 5.45E-04 5.45E-04 1.72E-04 1.58E-03
Boilers/Heaters/Burners, <10 MMBTU/hr,
natural gas 4.16E-02 4.95E-02 9.41E-04 9.41E-04 2.97E-04 2.72E-03
Boilers/Heaters/Burners, >100 MMBTU/hr,
natural gas 1.72E-04 5.72E-04 3.88E-06 3.88E-06 1.23E-06 1.12E-05
Diesel Engine, MaxHP < 600, diesel 6.76E-02 3.14E-01 2.21E-02 2.21E-02 2.44E-02 2.35E-02
Diesel Engine, MaxHP > 600, diesel 1.19E-02 4.46E-02 7.95E-04 7.81E-04 4.79E-03 1.12E-03
Diesel Engine, MaxHP > 600, gasoline 5.07E-01 1.32E-02 8.09E-04 8.09E-04 2.78E-03 2.45E-02
Drilling Rig, Diesel 2.59E-02 9.73E-02 1.73E-03 1.70E-03 1.23E-02 2.43E-03
Combustion Flares, No Smoke, No Pilot Fuel,
Flaring 2.86E-04 5.25E-05 4.63E-06
Combustion Flares, No smoke, Pilot fuel,
Flaring 1.06E-02 1.96E-03 1.73E-04
Combustion Flares, No Smoke, Pilot fuel, Pilot 6.95E-04 8.28E-04 1.57E-05 4.97E-06 4.55E-05
Fugitives - Cent Dry - natural gas 4.29E-05
Fugitives - Cent Dry - oil/water 2.18E-04
Fugitives - Connectors - natural gas 1.51E-04
Fugitives - Connectors - heavy oil 8.34E-09
Fugitives - Connectors - oil 2.79E-06
Fugitives - Connectors - oil/water 3.43E-05
Fugitives - Cent Pack - natural gas 2.32E-04
Fugitives - Cent Pack - oil 2.49E-06
Fugitives - Cent Pack - oil/water 1.77E-03
Fugitives - Cent Wet - natural gas 4.96E-05
Fugitives - Cent Wet - oil 5.44E-07
Fugitives - Cent Wet - oil/water 1.59E-04
Fugitives - Flanges - natural gas 7.59E-05
Fugitives - Flanges - heavy oil 5.56E-09

5-3
Table 5-2. Model Offshore Natural Gas Platform (Cont.)
Model Factor in lb/MMscf
Gas Platform Source Category CO NOX PM10-PRI PM25-PRI SO2 VOC
Fugitives - Flanges - oil 2.60E-07
Fugitives - Flanges - oil/water 8.23E-07
Fugitives - Open-Ended Lines - natural gas 2.25E-05
Fugitives - Open-Ended Lines - oil 2.20E-03
Fugitives - Other Equipment - natural gas 3.94E-03
Fugitives - Other Equipment - heavy oil 3.34E-07
Fugitives - Other Equipment - oil 1.41E-05
Fugitives - Other Equipment - oil/water 7.15E-03
Fugitives - Pumps - natural gas 1.49E-03
Fugitives - Pumps - oil 1.38E-03
Fugitives - Pumps - oil/water 2.74E-06
Fugitives - Valves - natural gas 1.76E-03
Fugitives - Valves - heavy oil 1.08E-07
Fugitives - Valves - oil 2.82E-06
Fugitives - Valves - oil/water 3.08E-05
Glycol Dehydrator, Triethylene glycol 6.91E-02
Mud Degassing 2.90E-03
Natural Gas Engine, 2-stroke, rich 9.74E-02 6.30E-02 2.64E-04 2.64E-04 1.63E-05 8.33E-04
Natural Gas Engine, 4-stroke, clean 1.83E-01 1.23E-01 1.60E-05 1.60E-05 1.22E-04 2.49E-02
Natural Gas Engine, 4-stroke, lean 2.56E-01 3.88E-01 3.52E-05 3.52E-05 2.69E-04 5.48E-02
Natural Gas Engine, 4-stroke, rich 1.14E+01 7.34E+00 3.07E-02 3.07E-02 1.90E-03 9.70E-02
Natural Gas Turbine 1.45E-01 5.67E-01 3.37E-03 3.37E-03 6.20E-03 3.72E-03
Pneumatic Pumps 9.75E-03
Pressure/Level Controller 2.31E-03
Storage Tank Operations, Condensate 1.63E-02
Storage Tank Operations, Crude Oil 7.98E-04
Cold Vent 1.79E-01
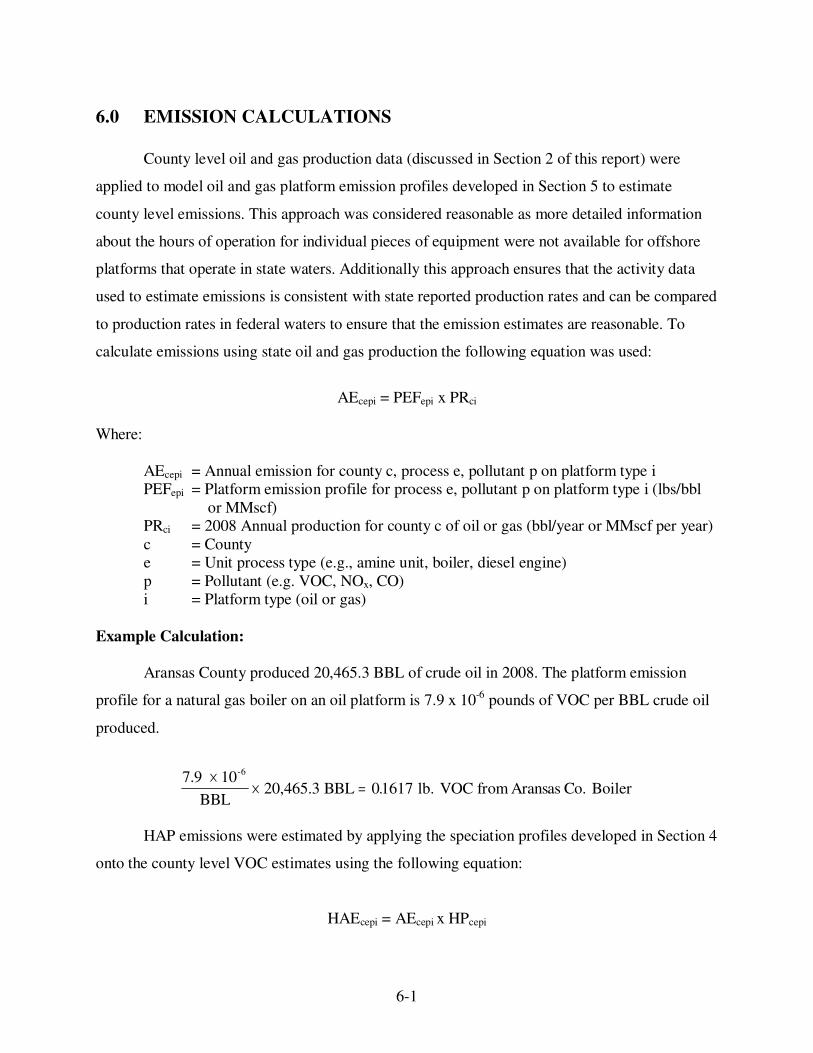
6-1
6.0 EMISSION CALCULATIONS
County level oil and gas production data (discussed in Section 2 of this report) were
applied to model oil and gas platform emission profiles developed in Section 5 to estimate
county level emissions. This approach was considered reasonable as more detailed information
about the hours of operation for individual pieces of equipment were not available for offshore
platforms that operate in state waters. Additionally this approach ensures that the activity data
used to estimate emissions is consistent with state reported production rates and can be compared
to production rates in federal waters to ensure that the emission estimates are reasonable. To
calculate emissions using state oil and gas production the following equation was used:
AEcepi = PEFepi x PRci
Where:
AEcepi = Annual emission for county c, process e, pollutant p on platform type i PEFepi = Platform emission profile for process e, pollutant p on platform type i (lbs/bbl
or MMscf) PRci = 2008 Annual production for county c of oil or gas (bbl/year or MMscf per year)
c = County e = Unit process type (e.g., amine unit, boiler, diesel engine)
p = Pollutant (e.g. VOC, NOx, CO) i = Platform type (oil or gas)
Example Calculation:
Aransas County produced 20,465.3 BBL of crude oil in 2008. The platform emission
profile for a natural gas boiler on an oil platform is 7.9 x 10⁻⁶
pounds of VOC per BBL crude oil
produced.
7.9 10
BBL20,465.3 BBL lb. VOC from Aransas Co. Boiler
-6×
× = 01617.
HAP emissions were estimated by applying the speciation profiles developed in Section 4
onto the county level VOC estimates using the following equation:
HAEcepi = AEcepi x HPcepi
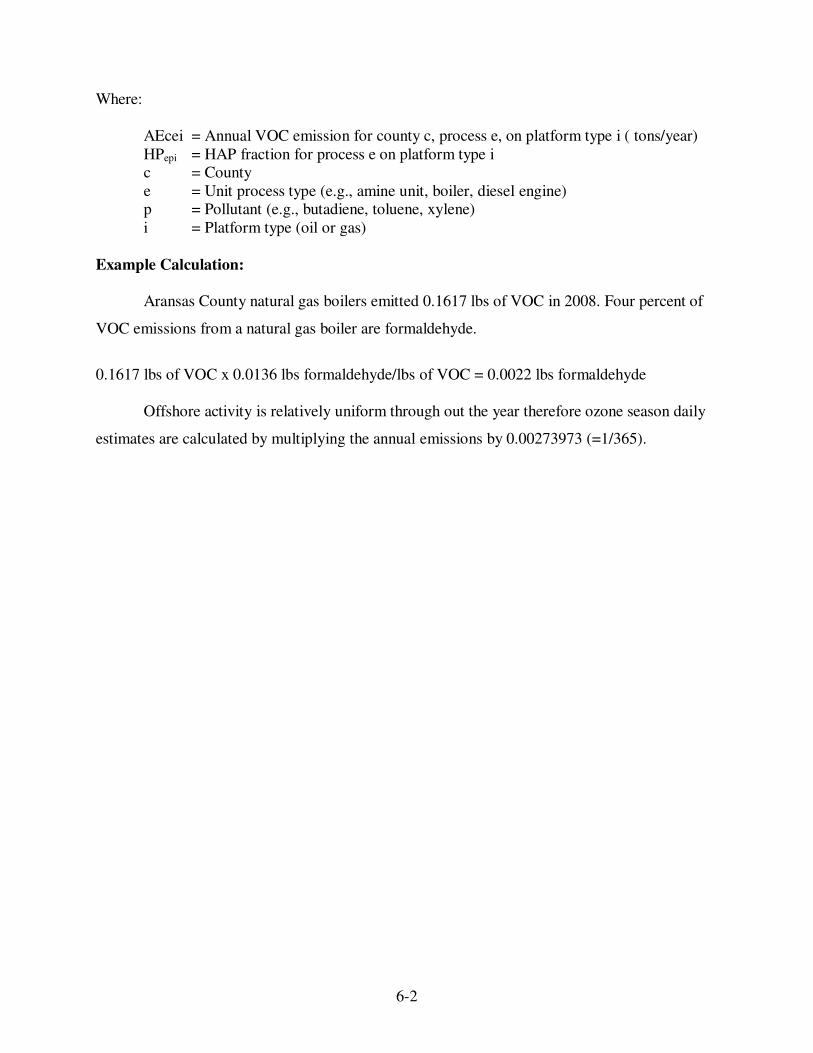
6-2
Where:
AEcei = Annual VOC emission for county c, process e, on platform type i ( tons/year)
HPepi = HAP fraction for process e on platform type i c = County
e = Unit process type (e.g., amine unit, boiler, diesel engine) p = Pollutant (e.g., butadiene, toluene, xylene)
i = Platform type (oil or gas)
Example Calculation:
Aransas County natural gas boilers emitted 0.1617 lbs of VOC in 2008. Four percent of
VOC emissions from a natural gas boiler are formaldehyde.
0.1617 lbs of VOC x 0.0136 lbs formaldehyde/lbs of VOC = 0.0022 lbs formaldehyde
Offshore activity is relatively uniform through out the year therefore ozone season daily
estimates are calculated by multiplying the annual emissions by 0.00273973 (=1/365).

7-1
7.0 RESULTS
The emission estimates developed for this project, found in Appendix D, are significantly
smaller than the values presented in the 2007 study ERG developed for TCEQ entitled Emissions
from Oil and Gas Production Facilities (TCEQ, 2007). We believe the difference is due to the
use of the current studies methodology that focused on processes used specifically for oil
production and gas production. We compared our emissions with the MMS emissions and based
on overall production levels, the estimates in the current study are proportional to those
associated with platforms operating in Federal waters. For example, 2008 oil production in
Federal waters in the Gulf of Mexico was approximately 420,000,000 barrels, compared with oil
production for the same period in Texas state waters of 230,000 barrels. NOx emission for
offshore platforms in Federal waters in 2008 was 75,000 tons per year. Relative to the production
level of platforms in state waters, we would anticipate around 40 tons per year. This study
provides a NOx estimate of approximately 290 tons per year, not taking into account controls.
Note that control information relative to platforms operating in state waters was not available.
The approach based on model oil and gas offshore platforms used in this study was
considered reasonable as more detailed information about the hours of operation for individual
pieces of equipment were not available for platforms that operate in state waters. Such detailed
data would require implementation of a survey of the platform operators similar to that
implemented by MMS. Unfortunately, at this time it was not possible to implement such a
survey. This model based approach provides a useful screening tool to approximate emissions
from these facilities and prioritize the need for further study of this source category. This model
approach also ensures that the activity data used to estimate emissions is consistent with state
reported production rates.
The EPA’s proposed mandatory greenhouse gas reporting rule may require platforms to
use a similar electronic system to that used by MMS to document processes and monthly activity
levels. Such detailed data from state water platforms would allow for a more accurate estimate of
emissions from these sources. But with relatively declining yields for state water platforms it is
unclear how many, if any of these facilities would trigger this requirement.

7-2
The 2008 annual emission estimates developed for this project (as presented in Table 7-1)
indicate that approximately three quarters of emissions were from natural gas operations.
Jefferson County has the most emissions accounting for 36 percent of NOx with Galveston
accounting for 20 percent, Calhoun accounting for 12 percent, and Matagorda accounting for
10 percent. Collectively, these four counties account for approximately 80 percent of NOx
emissions, which is appropriate given the reported oil and gas production associated with these
counties.
As Table 7-2 indicates, natural gas engines account for 95 percent of NOx emissions with
boilers, diesel engines and natural gas turbines accounting for the remaining 5 percent. The
profile is different for VOC where cold vents account for 37 percent of emissions, natural gas
engines for 36 percent, and glycol dehydrators for 8 percent. Collectively these three processes
account for approximately 80 percent of VOC emissions. For SO2, diesel engines account for
58 percent of emissions, drilling rigs for 21 percent, and natural gas turbines for 10 percent,
collectively accounting for approximately 90 percent of SO2 emissions. Complete criteria and
HAP emission estimates can be found in Appendix D.

7-1
Table 7-1. County Oil and Gas Annual Emissions for 2008
Annual Emissions (Tons)
FIPS County Name Source CO NOX PM10-PRI PM25-PRI SO2 VOC
48007 Aransas Gas 12.33 8.75 0.06 0.06 0.05 0.52
48007 Aransas Oil 7.63 6.68 0.06 0.06 0.01 0.59
48039 Brazoria Gas 19.17 13.61 0.09 0.09 0.08 0.81
48039 Brazoria Oil 0.00 0.00 0.00 0.00 0.00 0.00
48057 Calhoun Gas 25.59 18.17 0.12 0.12 0.11 1.08
48057 Calhoun Oil 18.45 16.15 0.14 0.14 0.01 1.44
48061 Cameron Gas 0.00 0.00 0.00 0.00 0.00 0.00
48061 Cameron Oil 0.00 0.00 0.00 0.00 0.00 0.00
48071 Chambers Gas 4.33 3.08 0.02 0.02 0.02 0.18
48071 Chambers Oil 0.77 0.67 0.01 0.01 0.00 0.06
48167 Galveston Gas 71.30 50.62 0.34 0.34 0.31 3.00
48167 Galveston Oil 6.52 5.71 0.05 0.05 0.00 0.51
48245 Jefferson Gas 105.50 74.90 0.51 0.51 0.46 4.44
48245 Jefferson Oil 31.91 27.93 0.25 0.25 0.02 2.49
48261 Kenedy Gas 4.77 3.39 0.02 0.02 0.02 0.20
48261 Kenedy Oil 0.55 0.48 0.00 0.00 0.00 0.04
48273 Kleberg Gas 15.41 10.94 0.07 0.07 0.07 0.65
48273 Kleberg Oil 4.37 3.82 0.03 0.03 0.00 0.34
48321 Matagorda Gas 29.20 20.73 0.14 0.14 0.13 1.23
48321 Matagorda Oil 10.14 8.88 0.08 0.08 0.01 0.79
48355 Nueces Gas 15.53 11.03 0.07 0.07 0.07 0.65
48355 Nueces Oil 4.40 3.85 0.03 0.03 0.00 0.34
48489 Willacy Gas 0.00 0.00 0.00 0.00 0.00 0.00
48489 Willacy Oil 0.00 0.00 0.00 0.00 0.00 0.00
State Total Gas 303.13 215.21 1.46 1.46 1.32 12.76
State Total Oil 84.74 74.16 0.66 0.66 0.06 6.60
State Total Combined 387.87 289.37 2.12 2.12 1.38 19.36
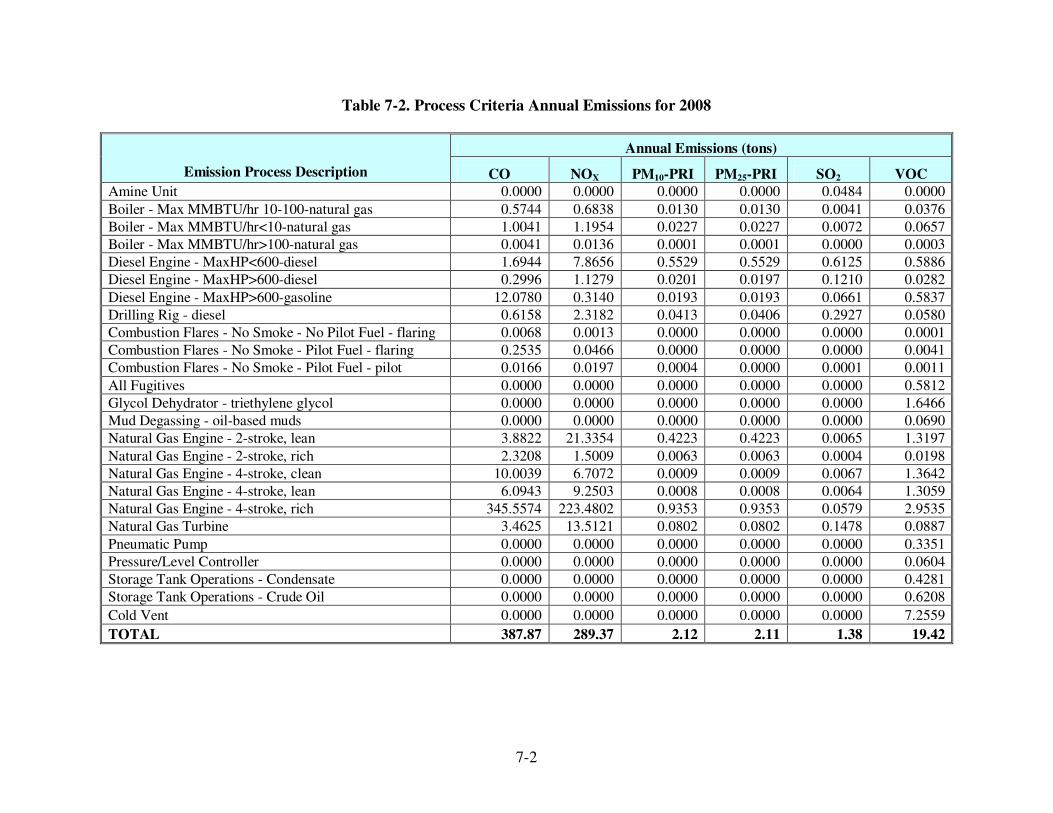
7-2
Table 7-2. Process Criteria Annual Emissions for 2008
Annual Emissions (tons)
Emission Process Description CO NOX PM10-PRI PM25-PRI SO2 VOC
Amine Unit 0.0000 0.0000 0.0000 0.0000 0.0484 0.0000
Boiler - Max MMBTU/hr 10-100-natural gas 0.5744 0.6838 0.0130 0.0130 0.0041 0.0376
Boiler - Max MMBTU/hr<10-natural gas 1.0041 1.1954 0.0227 0.0227 0.0072 0.0657
Boiler - Max MMBTU/hr>100-natural gas 0.0041 0.0136 0.0001 0.0001 0.0000 0.0003
Diesel Engine - MaxHP<600-diesel 1.6944 7.8656 0.5529 0.5529 0.6125 0.5886
Diesel Engine - MaxHP>600-diesel 0.2996 1.1279 0.0201 0.0197 0.1210 0.0282
Diesel Engine - MaxHP>600-gasoline 12.0780 0.3140 0.0193 0.0193 0.0661 0.5837
Drilling Rig - diesel 0.6158 2.3182 0.0413 0.0406 0.2927 0.0580
Combustion Flares - No Smoke - No Pilot Fuel - flaring 0.0068 0.0013 0.0000 0.0000 0.0000 0.0001
Combustion Flares - No Smoke - Pilot Fuel - flaring 0.2535 0.0466 0.0000 0.0000 0.0000 0.0041
Combustion Flares - No Smoke - Pilot Fuel - pilot 0.0166 0.0197 0.0004 0.0000 0.0001 0.0011
All Fugitives 0.0000 0.0000 0.0000 0.0000 0.0000 0.5812
Glycol Dehydrator - triethylene glycol 0.0000 0.0000 0.0000 0.0000 0.0000 1.6466
Mud Degassing - oil-based muds 0.0000 0.0000 0.0000 0.0000 0.0000 0.0690
Natural Gas Engine - 2-stroke, lean 3.8822 21.3354 0.4223 0.4223 0.0065 1.3197
Natural Gas Engine - 2-stroke, rich 2.3208 1.5009 0.0063 0.0063 0.0004 0.0198
Natural Gas Engine - 4-stroke, clean 10.0039 6.7072 0.0009 0.0009 0.0067 1.3642
Natural Gas Engine - 4-stroke, lean 6.0943 9.2503 0.0008 0.0008 0.0064 1.3059
Natural Gas Engine - 4-stroke, rich 345.5574 223.4802 0.9353 0.9353 0.0579 2.9535
Natural Gas Turbine 3.4625 13.5121 0.0802 0.0802 0.1478 0.0887
Pneumatic Pump 0.0000 0.0000 0.0000 0.0000 0.0000 0.3351
Pressure/Level Controller 0.0000 0.0000 0.0000 0.0000 0.0000 0.0604
Storage Tank Operations - Condensate 0.0000 0.0000 0.0000 0.0000 0.0000 0.4281
Storage Tank Operations - Crude Oil 0.0000 0.0000 0.0000 0.0000 0.0000 0.6208
Cold Vent 0.0000 0.0000 0.0000 0.0000 0.0000 7.2559
TOTAL 387.87 289.37 2.12 2.11 1.38 19.42

7-3
In terms of mass of HAP emissions for Texas offshore platforms, hexane is the HAP with
the greatest emissions at 7,345 pounds per year; followed by formaldehyde with 5,717 pounds;
2,2,4-trimethylpentane with 2,901; benzene with 2,830 pounds; toluene with 2,612 pounds and
xylene with 1,525 pounds as shown in Table 7-3.

7-4
Table 7-3. 2008 Annual Texas Offshore Platform HAP Emissions
HAP Annual Emissions (lbs)
48007 48039 48057 48071 48167 48245 48261 48273 48321 48355 State
Pollutant Name Aransas Brazoria Calhoun Chambers Galveston Jefferson Kenedy Kleberg Matagorda Nueces Total
1,1,2,2-Tetrachloroethane 0.3308 0.3174 0.7303 0.0845 1.2890 2.2772 0.0881 0.3278 0.6520 0.3303 6.4276
1,1,2-Trichloroethane 0.2068 0.2024 0.4556 0.0535 0.8185 1.4347 0.0559 0.2067 0.4103 0.2083 4.0527
1,2,4-Trimethylbenzene 0.0002 0.0000 0.0005 0.0000 0.0002 0.0008 0.0000 0.0001 0.0003 0.0001 0.0022
1,3-Butadiene 7.9800 7.2457 17.7056 1.9725 29.7894 53.7692 2.0408 7.7279 15.4523 7.7874 151.4707
1,3-Dichloropropene 0.1717 0.1680 0.3782 0.0444 0.6794 1.1910 0.0464 0.1716 0.3406 0.1729 3.3641
2,2,4-Trimethylpentane 177.1049 107.6987 404.6559 35.2205 492.7692 1043.9102 34.5244 148.3646 307.4455 149.5079 2901.2018
2-Methylnaphthalene 0.3097 0.2947 0.6841 0.0787 1.1987 2.1245 0.0819 0.3058 0.6087 0.3081 5.9949
3-Methylchloranthrene 0.0226 0.0211 0.0500 0.0057 0.0864 0.1541 0.0059 0.0222 0.0442 0.0223 0.4346
7,12-Dimethylbenz(a)anthracene 0.2010 0.1880 0.4448 0.0506 0.7678 1.3699 0.0525 0.1971 0.3929 0.1986 3.8631
Acenaphthene 0.0186 0.0179 0.0411 0.0048 0.0726 0.1282 0.0050 0.0185 0.0367 0.0186 0.3619
Acenaphthylene 0.0190 0.0185 0.0419 0.0049 0.0748 0.1315 0.0051 0.0189 0.0376 0.0191 0.3712
Acetaldehyde 40.0003 40.4707 87.8355 10.5557 162.4799 281.1997 11.0711 40.5454 80.2296 40.8578 795.2456
Acrolein 35.2851 34.3861 77.7712 9.0997 139.1616 244.3555 9.4996 35.1933 69.8941 35.4645 690.1108
Anthracene 0.0249 0.0239 0.0550 0.0064 0.0971 0.1715 0.0066 0.0247 0.0491 0.0249 0.4841
Antimony 0.0021 0.0033 0.0044 0.0007 0.0123 0.0182 0.0008 0.0027 0.0050 0.0027 0.0522
Arsenic 0.0003 0.0005 0.0006 0.0001 0.0017 0.0025 0.0001 0.0004 0.0007 0.0004 0.0072
Benz(a)anthracene 0.0187 0.0179 0.0412 0.0048 0.0728 0.1286 0.0050 0.0185 0.0368 0.0187 0.3631
Benzene 149.0020 135.5081 330.5498 36.8642 556.9099 1004.5821 38.1490 144.3885 288.6678 145.5012 2830.1225
Benzo(a)pyrene 0.0123 0.0118 0.0273 0.0031 0.0479 0.0848 0.0033 0.0122 0.0243 0.0123 0.2394
Benzo(b)fluoranthene 0.0185 0.0177 0.0409 0.0047 0.0720 0.1274 0.0049 0.0183 0.0365 0.0185 0.3595
Benzo(e)pyrene 0.0000 0.0001 0.0001 0.0000 0.0002 0.0003 0.0000 0.0000 0.0001 0.0000 0.0009
Benzo(g,h,i)perylene 0.0124 0.0119 0.0273 0.0032 0.0482 0.0852 0.0033 0.0123 0.0244 0.0124 0.2403
Benzo(k)fluoranthene 0.0187 0.0179 0.0412 0.0048 0.0728 0.1286 0.0050 0.0185 0.0368 0.0187 0.3631
Biphenyl 0.1877 0.2918 0.3896 0.0659 1.0853 1.6059 0.0726 0.2346 0.4445 0.2364 4.6142
Cadmium 0.0024 0.0037 0.0049 0.0008 0.0136 0.0202 0.0009 0.0029 0.0056 0.0030 0.0580
Carbon Tetrachloride 0.2392 0.2341 0.5269 0.0618 0.9464 1.6591 0.0646 0.2390 0.4744 0.2408 4.6865
Chlorine 0.0203 0.0315 0.0421 0.0071 0.1172 0.1735 0.0078 0.0253 0.0480 0.0255 0.4984
Chlorobenzene 0.1775 0.1756 0.3908 0.0462 0.7085 1.2369 0.0483 0.1782 0.3534 0.1796 3.4951
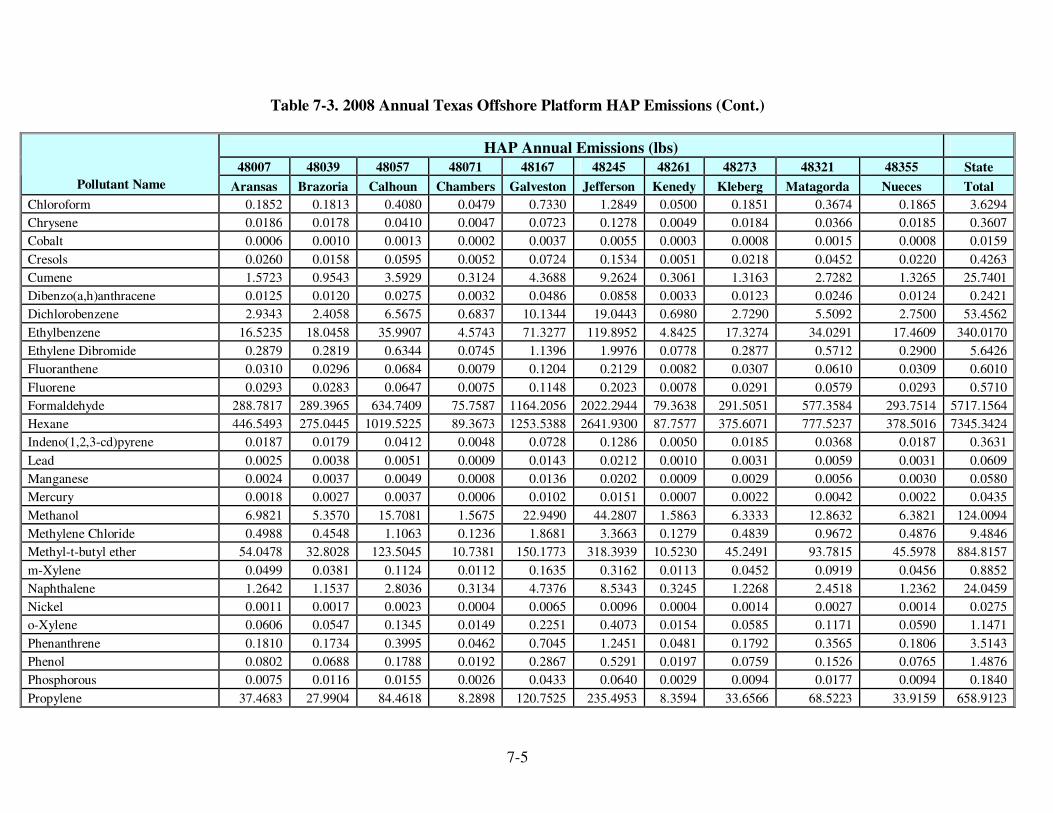
7-5
Table 7-3. 2008 Annual Texas Offshore Platform HAP Emissions (Cont.)
HAP Annual Emissions (lbs)
48007 48039 48057 48071 48167 48245 48261 48273 48321 48355 State
Pollutant Name Aransas Brazoria Calhoun Chambers Galveston Jefferson Kenedy Kleberg Matagorda Nueces Total
Chloroform 0.1852 0.1813 0.4080 0.0479 0.7330 1.2849 0.0500 0.1851 0.3674 0.1865 3.6294
Chrysene 0.0186 0.0178 0.0410 0.0047 0.0723 0.1278 0.0049 0.0184 0.0366 0.0185 0.3607
Cobalt 0.0006 0.0010 0.0013 0.0002 0.0037 0.0055 0.0003 0.0008 0.0015 0.0008 0.0159
Cresols 0.0260 0.0158 0.0595 0.0052 0.0724 0.1534 0.0051 0.0218 0.0452 0.0220 0.4263
Cumene 1.5723 0.9543 3.5929 0.3124 4.3688 9.2624 0.3061 1.3163 2.7282 1.3265 25.7401
Dibenzo(a,h)anthracene 0.0125 0.0120 0.0275 0.0032 0.0486 0.0858 0.0033 0.0123 0.0246 0.0124 0.2421
Dichlorobenzene 2.9343 2.4058 6.5675 0.6837 10.1344 19.0443 0.6980 2.7290 5.5092 2.7500 53.4562
Ethylbenzene 16.5235 18.0458 35.9907 4.5743 71.3277 119.8952 4.8425 17.3274 34.0291 17.4609 340.0170
Ethylene Dibromide 0.2879 0.2819 0.6344 0.0745 1.1396 1.9976 0.0778 0.2877 0.5712 0.2900 5.6426
Fluoranthene 0.0310 0.0296 0.0684 0.0079 0.1204 0.2129 0.0082 0.0307 0.0610 0.0309 0.6010
Fluorene 0.0293 0.0283 0.0647 0.0075 0.1148 0.2023 0.0078 0.0291 0.0579 0.0293 0.5710
Formaldehyde 288.7817 289.3965 634.7409 75.7587 1164.2056 2022.2944 79.3638 291.5051 577.3584 293.7514 5717.1564
Hexane 446.5493 275.0445 1019.5225 89.3673 1253.5388 2641.9300 87.7577 375.6071 777.5237 378.5016 7345.3424
Indeno(1,2,3-cd)pyrene 0.0187 0.0179 0.0412 0.0048 0.0728 0.1286 0.0050 0.0185 0.0368 0.0187 0.3631
Lead 0.0025 0.0038 0.0051 0.0009 0.0143 0.0212 0.0010 0.0031 0.0059 0.0031 0.0609
Manganese 0.0024 0.0037 0.0049 0.0008 0.0136 0.0202 0.0009 0.0029 0.0056 0.0030 0.0580
Mercury 0.0018 0.0027 0.0037 0.0006 0.0102 0.0151 0.0007 0.0022 0.0042 0.0022 0.0435
Methanol 6.9821 5.3570 15.7081 1.5675 22.9490 44.2807 1.5863 6.3333 12.8632 6.3821 124.0094
Methylene Chloride 0.4988 0.4548 1.1063 0.1236 1.8681 3.3663 0.1279 0.4839 0.9672 0.4876 9.4846
Methyl-t-butyl ether 54.0478 32.8028 123.5045 10.7381 150.1773 318.3939 10.5230 45.2491 93.7815 45.5978 884.8157
m-Xylene 0.0499 0.0381 0.1124 0.0112 0.1635 0.3162 0.0113 0.0452 0.0919 0.0456 0.8852
Naphthalene 1.2642 1.1537 2.8036 0.3134 4.7376 8.5343 0.3245 1.2268 2.4518 1.2362 24.0459
Nickel 0.0011 0.0017 0.0023 0.0004 0.0065 0.0096 0.0004 0.0014 0.0027 0.0014 0.0275
o-Xylene 0.0606 0.0547 0.1345 0.0149 0.2251 0.4073 0.0154 0.0585 0.1171 0.0590 1.1471
Phenanthrene 0.1810 0.1734 0.3995 0.0462 0.7045 1.2451 0.0481 0.1792 0.3565 0.1806 3.5143
Phenol 0.0802 0.0688 0.1788 0.0192 0.2867 0.5291 0.0197 0.0759 0.1526 0.0765 1.4876
Phosphorous 0.0075 0.0116 0.0155 0.0026 0.0433 0.0640 0.0029 0.0094 0.0177 0.0094 0.1840
Propylene 37.4683 27.9904 84.4618 8.2898 120.7525 235.4953 8.3594 33.6566 68.5223 33.9159 658.9123
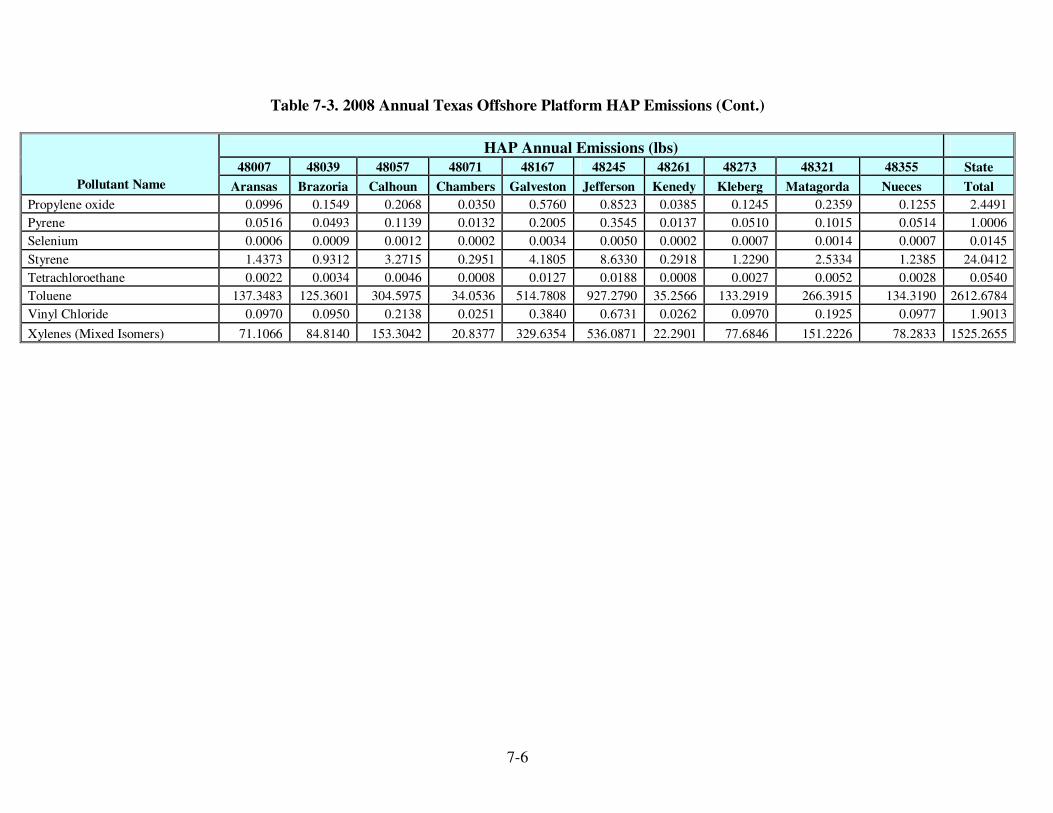
7-6
Table 7-3. 2008 Annual Texas Offshore Platform HAP Emissions (Cont.)
HAP Annual Emissions (lbs)
48007 48039 48057 48071 48167 48245 48261 48273 48321 48355 State
Pollutant Name Aransas Brazoria Calhoun Chambers Galveston Jefferson Kenedy Kleberg Matagorda Nueces Total
Propylene oxide 0.0996 0.1549 0.2068 0.0350 0.5760 0.8523 0.0385 0.1245 0.2359 0.1255 2.4491
Pyrene 0.0516 0.0493 0.1139 0.0132 0.2005 0.3545 0.0137 0.0510 0.1015 0.0514 1.0006
Selenium 0.0006 0.0009 0.0012 0.0002 0.0034 0.0050 0.0002 0.0007 0.0014 0.0007 0.0145
Styrene 1.4373 0.9312 3.2715 0.2951 4.1805 8.6330 0.2918 1.2290 2.5334 1.2385 24.0412
Tetrachloroethane 0.0022 0.0034 0.0046 0.0008 0.0127 0.0188 0.0008 0.0027 0.0052 0.0028 0.0540
Toluene 137.3483 125.3601 304.5975 34.0536 514.7808 927.2790 35.2566 133.2919 266.3915 134.3190 2612.6784
Vinyl Chloride 0.0970 0.0950 0.2138 0.0251 0.3840 0.6731 0.0262 0.0970 0.1925 0.0977 1.9013
Xylenes (Mixed Isomers) 71.1066 84.8140 153.3042 20.8377 329.6354 536.0871 22.2901 77.6846 151.2226 78.2833 1525.2655
8-1
8.0 LIMITATIONS/RECOMMENDATIONS
Because detailed information about the processes that operating on specific platforms in
Texas state waters were not available, emissions were developed based on typical model oil and
gas platforms. This approach provides an approximate estimate of emissions appropriate for an
area source county level inventory. More accurate emission estimates are possible if platform-
specific data were available.
In order to implement a platform-specific approach, it is recommended that a survey of
platform operators be implemented. Such a survey will help quantify the number and location of
existing platforms that are currently operating. This list can be compared to platforms included in
the updated GLO list of platforms which is currently being revised.
Apportioning production to platforms is possible by using well production data and
mapping the well heads to the closest identified platform using GIS tools. Well head location and
production data are available from the TRC, but TCEQ may have to make a specific data request
to TRC to get the data in a usable format.
The survey of platform operators would also be useful to identify which unit processes
actually operate on state water platforms. In this study, process data were obtained from MMS
that includes platforms that operate in deeper waters. Given the relative short distance to shore
associated with state water platforms, some of these processes may not be needed, such as amine
units or storage tanks. Some of the state water platforms may also be smaller than platforms that
operate in Federal waters, such that large boilers and diesel engines may also not be required to
support day to day activities.
A survey would also help fine tune operational assumptions made about platform
processes. For example, because only the TRC county production data were available to quantify
activity in state waters, assumptions had to be made to link the production data to the available
emission factors. These assumptions would not be required if the platform operators provided
operational data specific to their platforms.

8-2
Most, though not all platforms produce both oil and gas. Because detailed platform data
were not available and county level production data was, assumptions had to be made based on
the MMS study about the processes associated with each product separately. This approach may
over estimate emissions from processes that can be used by both product streams such as diesel
and natural gas engines, combustion flares and fugitive sources, and will under estimate emission
from processes involved in separating the two product streams. Again, detailed information
about platform operations in state waters can help develop more appropriate platform models and
provide more accurate emission estimates.
Also, for some of the emission factors and HAP profiles, generic assumptions had to be
made about the chemical composition of the process stream. If data on product stream
composition could be provided by Texas offshore platform operators this would help generate
more accurate estimates from fugitive and evaporative emission sources.
It is likely the current inventory is overestimating emissions to some degree from state
water platforms due to the lack of information on control devices used on offshore platforms.
Again, information submitted by the operators would help account for emission control measures
providing more accurate emission estimates.
Currently MMS has an electronic reporting system where operators provide monthly
activity and production data from each process located on a platform. This reporting information
is applied to AP-42 emission factors to generate monthly process specific estimates for all
platforms operating in Federal waters in the Gulf of Mexico. Note that MMS’s system complies
with the proposed mandatory greenhouse gas reporting rule for offshore platforms. TCEQ may
want to consider using this system or something similar to collect and organize data from
platform operators.
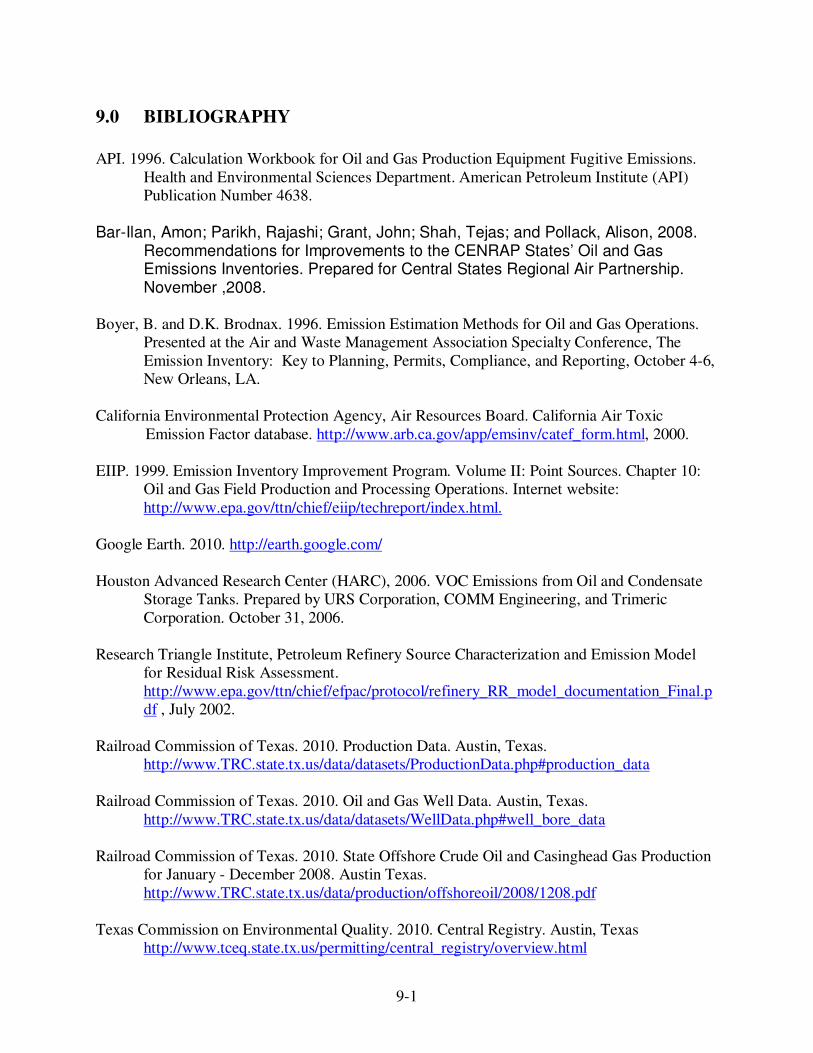
9-1
9.0 BIBLIOGRAPHY
API. 1996. Calculation Workbook for Oil and Gas Production Equipment Fugitive Emissions.
Health and Environmental Sciences Department. American Petroleum Institute (API) Publication Number 4638.
Bar-Ilan, Amon; Parikh, Rajashi; Grant, John; Shah, Tejas; and Pollack, Alison, 2008.
Recommendations for Improvements to the CENRAP States’ Oil and Gas Emissions Inventories. Prepared for Central States Regional Air Partnership. November ,2008.
Boyer, B. and D.K. Brodnax. 1996. Emission Estimation Methods for Oil and Gas Operations.
Presented at the Air and Waste Management Association Specialty Conference, The
Emission Inventory: Key to Planning, Permits, Compliance, and Reporting, October 4-6, New Orleans, LA.
California Environmental Protection Agency, Air Resources Board. California Air Toxic
Emission Factor database. http://www.arb.ca.gov/app/emsinv/catef_form.html, 2000.
EIIP. 1999. Emission Inventory Improvement Program. Volume II: Point Sources. Chapter 10:
Oil and Gas Field Production and Processing Operations. Internet website:
http://www.epa.gov/ttn/chief/eiip/techreport/index.html.
Google Earth. 2010. http://earth.google.com/
Houston Advanced Research Center (HARC), 2006. VOC Emissions from Oil and Condensate Storage Tanks. Prepared by URS Corporation, COMM Engineering, and Trimeric
Corporation. October 31, 2006.
Research Triangle Institute, Petroleum Refinery Source Characterization and Emission Model for Residual Risk Assessment.
http://www.epa.gov/ttn/chief/efpac/protocol/refinery_RR_model_documentation_Final.pdf , July 2002.
Railroad Commission of Texas. 2010. Production Data. Austin, Texas.
http://www.TRC.state.tx.us/data/datasets/ProductionData.php#production_data
Railroad Commission of Texas. 2010. Oil and Gas Well Data. Austin, Texas.
http://www.TRC.state.tx.us/data/datasets/WellData.php#well_bore_data
Railroad Commission of Texas. 2010. State Offshore Crude Oil and Casinghead Gas Production for January - December 2008. Austin Texas.
http://www.TRC.state.tx.us/data/production/offshoreoil/2008/1208.pdf
Texas Commission on Environmental Quality. 2010. Central Registry. Austin, Texas http://www.tceq.state.tx.us/permitting/central_registry/overview.html

9-2
Texas Commission on Environmental Quality. 2010. Central Registry. Austin, Texas http://www.tceq.state.tx.us/permitting/central_registry/overview.html
Texas Commission on Environmental Quality. 2010. Point Source Emission Inventory. Austin,
Texas. http://www.tceq.state.tx.us/implementation/air/industei/psei/psei.html
Texas Commission on Environmental Quality. 2007. Emissions from Oil and Gas Production Facilities. Final Report. Prepared by ERG. August 31, 2007.
Texas General Land Office, Offshore Wells and Platform Data. 2010. Austin, Texas
http://www.glo.state.tx.us/energy/leasesales/offshore/index.html
U.S. DOI, Minerals Management Service (MMS). 2010. Year 2008 Gulfwide Emission Inventory Study: Draft Report. U.S. Department of the Interior, Minerals Management
Service, Gulf of Mexico OCS Region, New Orleans, LA. OCS Study MMS 2010-.
U.S. DOI, Minerals Management Service (MMS). 2007. Year 2005 Gulfwide Emission
Inventory Study. U.S. Department of the Interior, Minerals Management Service, Gulf of Mexico OCS Region, New Orleans, LA. OCS Study MMS 2007-067.
http://www.gomr.mms.gov/homepg/regulate/environ/airquality/gulfwide_emission_inventory/2005GulfwideEmissionInventory.html
U.S. DOI, Minerals Management Service (MMS). 1995. Gulf of Mexico Air Quality Study:
Final Report, Volumes I-III. U.S. Department of the Interior, Minerals Management Service, Gulf of Mexico OCS Region, New Orleans, LA. OCS Study MMS 95-0038,
95-0039, and 95-0040.
U.S. Environmental Protection Agency (EPA). 2010. National Emission Inventory, Office of Air Quality Planning and Standards, Research Triangle Park, NC
http://www.epa.gov/oar/data/neidb.html
U.S. Environmental Protection Agency (EPA). 2008. Toxic Release Inventory, http://www.epa.gov/tri/tridata/tri08/national_analysis/index.htm#Q2
U.S. Environmental Protection Agency (EPA). November 2008. SPECIATE Database (Version
4.2), http://www.epa.gov/ttnchie1/software/speciate.
U.S. Environmental Protection Agency (EPA). 2002. Compilation of Air Pollutant Emission Factors, Volume I: Stationary Point and Area Sources. AP-42. U.S. Environmental
Protection Agency, Office of Air Quality Planning and Standards, Research Triangle Park, NC. http://www.epa.gov/ttn/chief/ap42/index.html
U.S. Environmental Protection Agency (EPA), 2002. AP-42, Compilation of Air Pollutant
Emission Factors: Volume I, Stationary Point and Area Sources, Sections 1.3, 3.2, 3.3, 3.4. http://www.epa.gov/ttnchie1/ap42/

9-3
U.S. Environmental Protection Agency (EPA). 1977. Atmospheric Emissions from Offshore Oil
and Gas Development and Production. Office of Air Quality Planning and Standards, Research Triangle Park, NC. PB272268.
VEDIT. 2010. Editing EBCDIC files with VEDIT. Ann Arbor, MI,
http://www.vedit.com/ebcdic.htm

Appendix A
Copies of Platform Permit Information from the
Texas Central Registry

TCEQ CR Query - Regulated Entity Information Page 1 of 1
> > Questionsor Comments
Central Registry Query - Regulated Entity InformationRegulated Entity Information
RN Number: RN105793509
Name: HILCORP ENERGY COMPANY-OLD OCEAN NO 248 FACILITY
Primary Business: GAS PRODUCTION
Street Address: No street address on file.
County: BRAZORIA
Nearest City: SWEENY
State: TX
Near ZIP Code: 77480
Physical Location: FROM INTX FM 524 & CR 359 GO W ~3000 FEET TO LEASE RD ON L TURN S & TRAVEL ON LEASE RD ~3000FEET TO ENTRANCE TO WELL LOCATION ON R
Affiliated Customers - Current
Customer Role Details
HILCORP ENERGYCOMPANY OWNER OPERATOR ~
Industry Type Codes
Crude Petroleum and Natural Gas
Name
Permits, Registrations, or Other AuthorizationsThere is 1 program and ID for this regulated entity.1-1 of 1 Records
AIR NEW SOURCE PERMITS REGISTRATION
Program ID Type
Disclaimer I Web Policies I Accessibility I Serving Our Customers I TCEQ Homeland Security I Central Registry I Search Hints I Report Data Errors-~~Last Modified 12/4/08© 2002 - 2008 Texas Commission on Environmental Quality
http://www12.tceq.state.tx.us/crpub/index.cfin?fuseaction=regent.showSingleRE®_ ent... 3/26/2010

TCEQ CR Query - Regulated Entity Information Page 1 of 1
> > Questionsor Comments
Central Registry Query - Regulated Entity InformationRegulated Entity Information
RN Number: RN102152667
Name: HILCORP ENERGY COMPANY OLD OCEAN UNIT NO 237 View Prior Names
Primary Business: Oil and gas production
Street Address: No street address on file.
County: BRAZORIA
Nearest City: SWEENY
State: TX
Near ZIP Code: No near zip code on file.
Physical Location: FM 524 & W SH 35, SON FM 524 TO CR 321, RT 2,5 MI ON LEFT
Affiliated Customers - Current
Customer Name Customer Role Details
HILCORP ENERGYCOMPANY OWNER OPERATOR Ii
Industry Type CodesCode Classification Name Primary211111 NAICS Crude Petroleum and Natural Gas Extraction Yes1311 SIC Crude Petroleum and Natural Gas Yes
Permits, Registrations, or Other AuthorizationsThere are a total of 4 programs and IDs for this regulated entity. Click on a column name to change the sortorder,
1 4 of 4 Records-Program .••• ID Type ID Number ID Status
AIR EMISSIONS INVENTORY ACCOUNT NUMBER BLA001A ACTIVE
AIR NEW SOURCE PERMITS ACCOUNT NUMBER BLA001A ACTIVE
AIR NEW SOURCE PERMITS AFS NUM 4803900683 ACTIVE
AIR NEW SOURCE PERMITS REGISTRATION 50888 ACTIVE
. "., ..:t;",,,,,: "",,,,,,,,,,,:' ... " ..... ".,.:."" """":':',,'.''''''
Disclaimer I Web Policies I Accessibility I Serving Our Customers I TCEQ Homeland Security I Central Registry I Search Hints I Report Data Errors_a~Last Modified 12/4/08© 2002 - 2008 Texas Commission on Environmental Quality
http://www12.tceq.state.tx.us/crpub/index.cfm?fuseaction=regent.showSingleRE®_ ent... 3/26/20 I0
TCEQ CR Query - Affiliation Information Page 1 of 1
» Questionsor Comments
CN603S63123 Affiliation with RN10080S03SCustomer Information
CN Number: CN603563123
Name: DSITRANSPORTSINC
Legal Name:
Customer Type: CORPORATION
Mailing Address: PO BOX 674421
HOUSTON, TX 77267 4421
Affiliation InformationCustomer's Role: OPERATOR
Begin Date: 11/19/1986
End Date:
Regulated Entity InformationRN Number: RN100805035
Name: TRIMAC TRANSPORTATION SOUTH View Prior NamesPrimary Business: FLEET REFUELING
Mailing Address: No regulated entity mailing address on file.
Street Address: 5055 WASHINGTON BLVD, BEAUMONT TX 77707 4313County: JEFFERSON
Nearest City: BEAUMONT
State: TX
Near ZIP Code: 77707
Physical Location: 5055 Washington Blvd, Beaumont, TX
Industry Type CodesCode Classification Name Primary484121 NArcS General Freight Trucking
48849 NArcS Other Support Activities for Road Transportation Yes488490 NAICS Other Support Activities for Road Transportation4213 SIC Trucking
4231 SIC Terminal and Joint Terminal Maintenance Facilities for Motor Freight Yes
Permits, Registrations, or Other AuthorizationsThere Is 1 program and ID for this regulated entity and customer.
1-1 of 1 RecordsProgram 10 Type
PETROLEUMSTORAGETANK REGISTRATION REGISTRATION
................ " ,,,.,,, ..,,,,,.,,,, ..,,,,, """'Ii::",,,,,,,,,,·,,.,,,,···
Disclaimer I Web Policies I Accessibility I Serving Our Customers I TCEQ Homeland Security I Central Registry I Search Hints I Report Data Errors
iJIIII ~ ~Last Modified 12/4/08© 2002 • 2008 Texas Commission on Environmental Quality
http://www12.tceq.state.tx.us/crpub/index.cfin?fuseaction=affil.showSingleAffil&affil_id= ... 3/26/2010
TCEQ CR Query - Affiliation Information Page 1 of 1
" Questionsor Commentsy
CN601451529 Affiliation with RN100805035Customer Information
CN Number: CN601451529Name: TRIMAC DSI TRANSPORTS INC
Legal Name: Trimac DSI Transports Inc
Customer Type: ORGANIZATION
Mailing Address: 15600 JOHN F KENNEDY BLVD
HOUSTON, TX 77032 2349
Affiliation InformationCustomer's Role: OWNER OPERATOR
Begin Date: 10/31/2001
End Date:
Regulated Entity InformationRN Number: RNI00805035
Name: TRIMAC TRANSPORTATION SOUTH View Prior NamesPrimary Business: FLEET REFUELING
Mailing Address: No regulated entity mailing address on file.
Street Address: 5055 WASHINGTON BLVD, BEAUMONT TX 77707 4313
County: JEFFERSON
Nearest City: BEAUMONT
State: TX
Near ZIP Code: 77707
Physical Location: 5055 Washington Blvd, Beaumont, TX
Industry Type CodesCode Classification Name Primary484121 NAICS General Freight Trucking
48849 NAICS Other Support Activities for Road Transportation Yes488490 NAICS Other Support Activities for Road Transportation
4213 SIC Trucking
4231 SIC Terminal and Joint Terminal Maintenance Facilities for Motor Freight Yes
Permits, Registrations, or Other AuthorizationsThere are a total of 0 programs and IDs for this regulated entity and customer.
Disclaimer I Web Policies I Accessibility I Serving Our Customers I TCEQ Homeland Security I Central Registry I Search Hints I Report Data Errors-~.~Last Modified 12/4/08© 2002 - 2008 Texas Commission on Environmental Quality
http://www12.tceq.state.tx.us/crpub/index.cfm?fuseaction=affil.showSingleAffil&affil_id= ... 3/26/2010

TCEQ CR Query - Regulated Entity Information Page 1 of 1
> > Questionsor Comments
Central Registry Query - Regulated Entity InformationRegulated Entity Information
RN Number: RN100519644
Name: STAR ENTERPRISE 19TH ST PORT ARTHUR View Prior NamesPrimary Business: WHOLESALE
Street Address: 401 W 19TH ST, PORT ARTHUR TX 77640 3284
County: JEFFERSON
Nearest City: PORT ARTHUR
State: TX
Near ZIP Code: 77640
Physical Location: No physical location description on file.
Affiliated Customers - CurrentYour Search Returned 4 Current Affiliation Records (View Affiliation History)
1-4 of 4 RecordsCN Number Customer Name Customer Role DetailsCN600124051 MOTIVA ENTERPRISESLLC OWNER OPERATOR ~CN600124051 MOTIVA ENTERPRISESLLC BILLING ~CN600569453 EQUIVA SERVICES LLC OWNER OPERATOR ~CN601311277 STAR ENTERPRISESINC OWNER OPERATOR ~
Industry Type Codes
Permits, Registrations, or Other AuthorizationsThere are a total of 6 programs and IDs for this regulated entity. Click on a column name to change the sortorder.
1 6 of 6 Records-Program. ID Type ID Number ID StatusIHW CORRECTIVEACTION SOLID WASTE REGISTRATION # (SWR) 35851 INACTIVEINDUSTRIAL AND HAZARDOUS WASTE GENERATION EPA lD TXDOO0792911 INACTIVEINDUSTRIAL AND HAZARDOUS WASTE GENERATION SOLID WASTE REGISTRATION # (SWR) 35851 INACTIVEPETROLEUMSTORAGETANK REGISTRATION REGISTRATION 16804 ACTIVEPETROLEUMSTORAGETANK STAGE II
WASTE WATER GENERAL PERMIT PERMIT TXG341534 CANCELLED
Disclaimer I Web Policies I Accessibility I Serving Our Customers I TCEQ Homeland Security I Central Registry I Search Hints I Report Data Errors-~~Last Modified 12/4/08© 2002 - 2008 Texas Commission on Environmental Quality
http://www12.tceq.state.tx.us/crpub/index. cfm?fuseaction=regent. showS ingleRE®_ ent... 3/26/20 I0
TCEQ CR Query - Affiliation Information Page 1 of 1
»Questionsor Comments
CN601256522 Affiliation with RN102432804Customer Information
CN Number: CN601256522
Name: CAMBS MARINE SERVICE
Legal Name: Cambs Marine Service, LLC
Customer Type: CORPORATION
Mailing Address: PO BOX 5860
BEAUMONT, TX 77726 5860
Affiliation InformationCustomer's Role: OWNER
BegIn Date: 11/15/1991
End Date:
Regulated Entity InformationRN Number: RNI02432804
Name: CAMBS MARINE TERMINAL
Primary Business: No primary business description on file.
Mailing Address: No regulated entity mailing address on file.
Street Address: No street address on file.
County: JEFFERSON
Nearest City: FAN NET
State: TX
Near ZIP Code: No near zip code on file.Physical Location: HWY 124
Permits, Registrations, or Other AuthorizationsThere is 1 program and ID for this regulated entity and customer.1-1 of 1 Records
PETROLEUMSTORAGETANK REGISTRATION REGISTRATION
Program 10 Type
Disclaimer I Web Policies I Accessibility I Serving Our Customers I TCEQ Homeland Security I Central Registry I Search Hints I Report Data Errors-~~Last Modified 12/4/08© 2002 - 2008 Texas Commission on Environmental Quality
http://www12.tceq.state.tx.us/crpub/index.cfin?fuseaction=affi1.showSingleAffil&affil_id= ... 3/26/2010

TCEQ CR Query - Regulated Entity Information Page 1 of 1
> > Qllestions or Comments
Central Registry Query - Regulated Entity InformationRegulated Entity Information
RN Number: RN100635093
Name: TICONA POLYMERS View Prior Names
Primary Business: No primary business description on file.
Street Address: 2500 W BROADWAY ST, CORPUS CHRISTI TX 78407 2403County: NUECES
Nearest City: CORPUS CHRISTI
State: TX
Near ZIP Code: 78407
Physical Location: 2500 W Broadway, Corpus Christi, TX
Affiliated Customers - Current
Customer Role Details
TICONA POLYMERSINC OWNER OPERATOR II
Industry Type CodesCode Classification Name Primary484110 NAICS General Freight Trucking, Local
4212 SIC Local Trucking Without Storage Yes
Permits, Registrations, or Other AuthorizationsThere are a total of 3 programs and IDs for this regulated entity. Click on a column name to change the sortorder.
1 3 of 3 Records-Program .••. 10 Type 10 Number 10 StatusINDUSTRIAL AND HAZARDOUS WASTE GENERATION EPA ID TXDOO0803080 INACTIVEINDUSTRIAL AND HAZARDOUS WASTE GENERATION SOLID WASTE REGISTRATION # (SWR) 32472 INACTIVEINDUSTRIAL AND HAZARDOUS WASTE STORAGE
Disclaimer I Web Policies I Accesslbtlltv I Serving Our Customers I TCEQ Homeland Security I Central Registry I Search Hints I Report Data Errors-~~Last Modified 12/4/08© 2002 - 2008 Texas Commission on Environmental Quality
http://wwwI2.tceq.state.tx.us/crpub/index.cfm?fuseaction=regent.showSingleRE®_ ent... 3/26/20 I 0
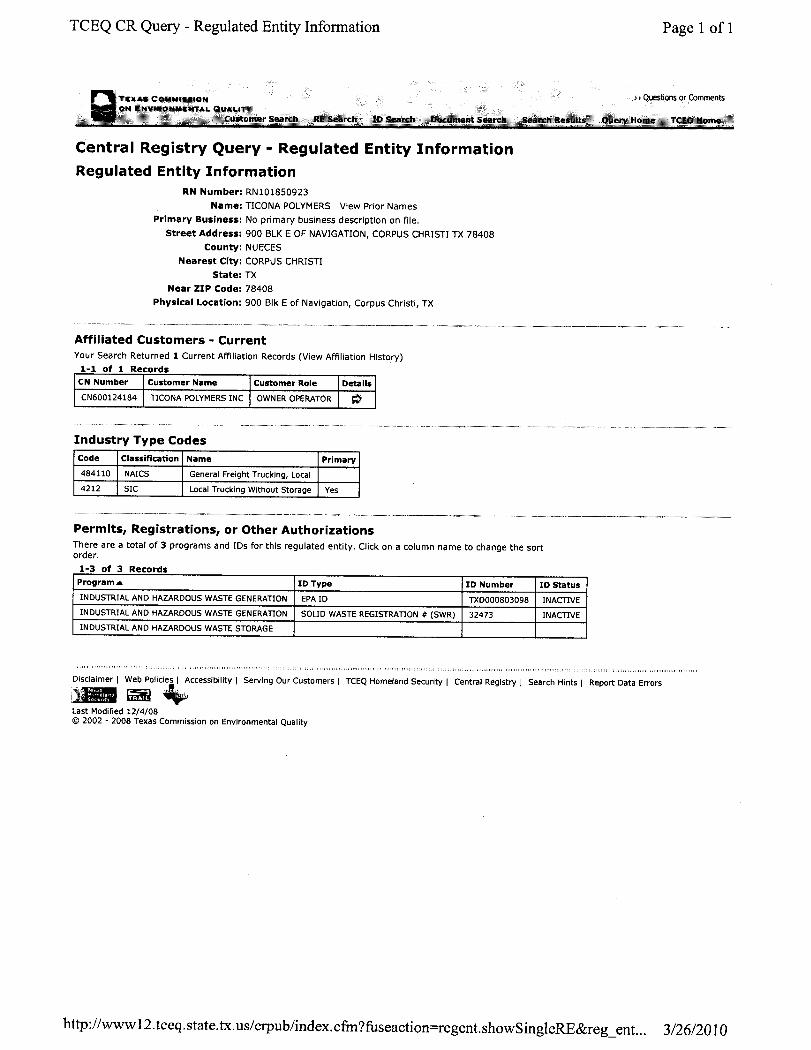
TCEQ CR Query - Regulated Entity Information Page 1 of 1
> > Questionsor Comments
Central Registry Query - Regulated Entity InformationRegulated Entity Information
RN Number: RNI01850923
Name: T1CONA POLYMERS View Prior Names
Primary Business: No primary business description on file.
Street Address: 900 BLK E OF NAVIGATION, CORPUS CHRISTI TX 78408
County: NUECES
Nearest City: CORPUS CHRISTI
State: TX
Near ZIP Code: 78408
Physical Location: 900 Blk E of Navigation, Corpus Christi, TX
Affiliated Customers - Current
TICONA POLYMERSINC OWNER OPERATOR IICustomer Role Details
Industry Type CodesCode Classification Name Primary
484110 NAICS General Freight Trucking, Local
4212 SIC Local Trucking Without Storage Yes
Permits, Registrations, or Other AuthorizationsThere are a total of 3 programs and IDs for this regulated entity. Click on a column name to change the sortorder.
1 3 of 3 Records-Program. 10 Type 10 Number 10 StatusINDUSTRIAL AND HAZARDOUS WASTE GENERATION EPA ID TXDOO0803098 INACTIVEINDUSTRIAL AND HAZARDOUS WASTE GENERATION SOLID WASTE REGISTRATION # (SWR) 32473 INACTIVEINDUSTRIAL AND HAZARDOUS WASTE STORAGE
Disclaimer I Web Policies I Accessibility I Serving Our Customers I TCEQ Homeland Security I Central Registry I Search Hints I Report Data Errors-~~Last Modified 12/4/08© 2002 - 2008 Texas Commission on Environmental Quality
http://www12.tceq.state.tx.us/crpub/index.cfm?fuseaction=regent.showSingleRE®_ ent... 3/26/20 I0
Appendix B
Compiled Offshore Platform Emission Factors

B-1
Table B-1.0
Amine Unit Emission Factors
(From AP-42, section 5.3)
Source
Category
Units for
Gas
Processed SO2
Amine Unit kg/103 m
3 0.0091
Amine Unit lb/106 scf 0.5695
Table B-2.0
Emission Factors for Gas-Fueled Units – Natural Gas or Process Gas where Max Rated Heat Input > 100 MMBtu/hr
Emission Factors (lb/MMscf)
Source Category Pollutant Uncontrolled
Low NOx
Burner
Flu Gas
Recirculation
Boiler/Heater/Burner VOC 5.5 5.5 5.5
Boiler/Heater/Burner SO2 0.6 0.6 0.6
Boiler/Heater/Burner NOx 280 140 100
Boiler/Heater/Burner PM2.5 1.9 1.9 1.9
Boiler/Heater/Burner PM10 1.9 1.9 1.9
Boiler/Heater/Burner CO 84 84 84
Boiler/Heater/Burner N2O 2.2 0.64 0.64
Boiler/Heater/Burner CH4 2.3 2.3 2.3
Boiler/Heater/Burner CO2 120,000 120,000 120,000

B-2
Table B-2.1
Emission Factors for Gas-Fueled Units – Natural Gas or Process Gas where Max Rated Heat Input < 100 MMBtu/hr
Emission Factors (lb/MMscf)
Source Category Pollutant Uncontrolled
Low NOx
Burner
Flu Gas
Recirculation
Boiler/Heater/Burner VOC 5.5 5.5 5.5
Boiler/Heater/Burner SO2 0.6 0.6 0.6
Boiler/Heater/Burner NOx 100 50 32
Boiler/Heater/Burner PM2.5 1.9 1.9 1.9
Boiler/Heater/Burner PM10 1.9 1.9 1.9
Boiler/Heater/Burner CO 84 84 84
Boiler/Heater/Burner N2O 2.2 0.64 0.64
Boiler/Heater/Burner CH4 2.3 2.3 2.3
Boiler/Heater/Burner CO2 120,000 120,000 120,000
Table B-3.0
Emission Factors for Gasoline Engines
EFfu EFpo
Source Category Pollutant (lb/MMBtu) (g/hp-hr)
Gasoline Engines VOC 3.03 9.8
Gasoline Engines SO2 0.084 0.268
Gasoline Engines NOx 1.63 4.99
Gasoline Engines PM2.5 0.1 0.327
Gasoline Engines PM10 0.1 0.327
Gasoline Engines CO 62.7 199
Gasoline Engines CO2 154 489.9
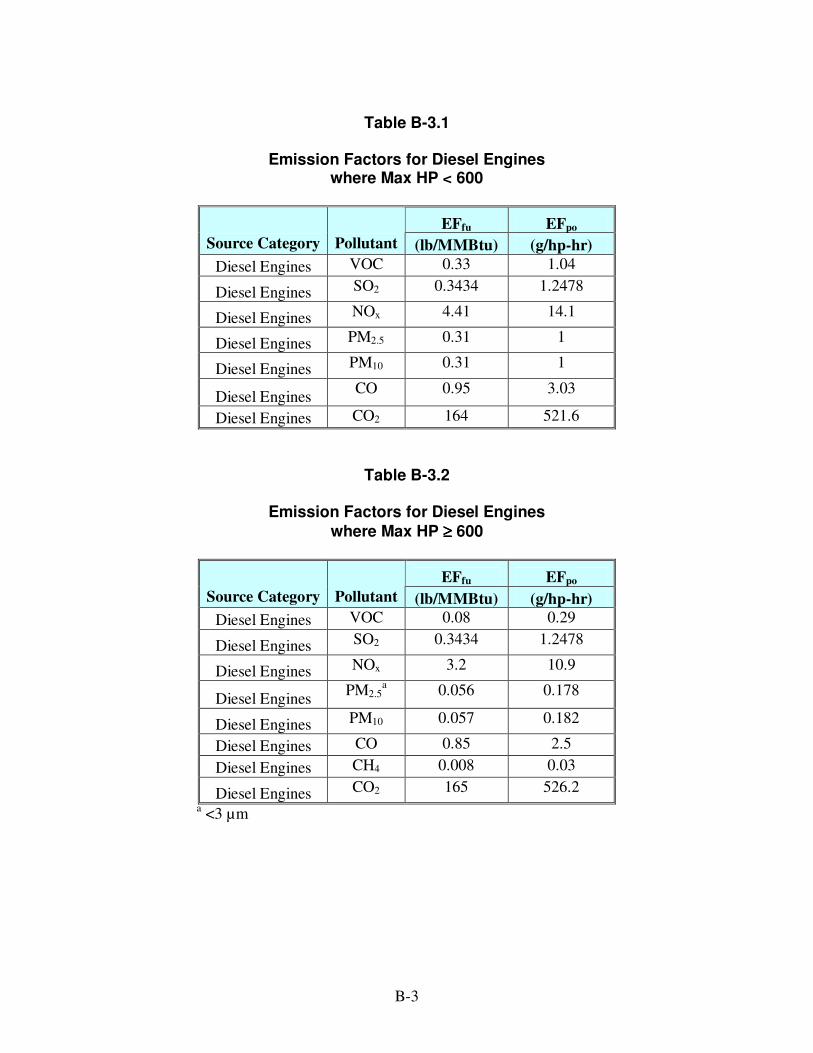
B-3
Table B-3.1
Emission Factors for Diesel Engines
where Max HP < 600
EFfu EFpo
Source Category Pollutant (lb/MMBtu) (g/hp-hr)
Diesel Engines VOC 0.33 1.04
Diesel Engines SO2 0.3434 1.2478
Diesel Engines NOx 4.41 14.1
Diesel Engines PM2.5 0.31 1
Diesel Engines PM10 0.31 1
Diesel Engines CO 0.95 3.03
Diesel Engines CO2 164 521.6
Table B-3.2
Emission Factors for Diesel Engines
where Max HP ≥≥≥≥ 600
EFfu EFpo
Source Category Pollutant (lb/MMBtu) (g/hp-hr)
Diesel Engines VOC 0.08 0.29
Diesel Engines SO2 0.3434 1.2478
Diesel Engines NOx 3.2 10.9
Diesel Engines PM2.5
a 0.056 0.178
Diesel Engines PM10 0.057 0.182
Diesel Engines CO 0.85 2.5
Diesel Engines CH4 0.008 0.03
Diesel Engines CO2 165 526.2
a <3 µm
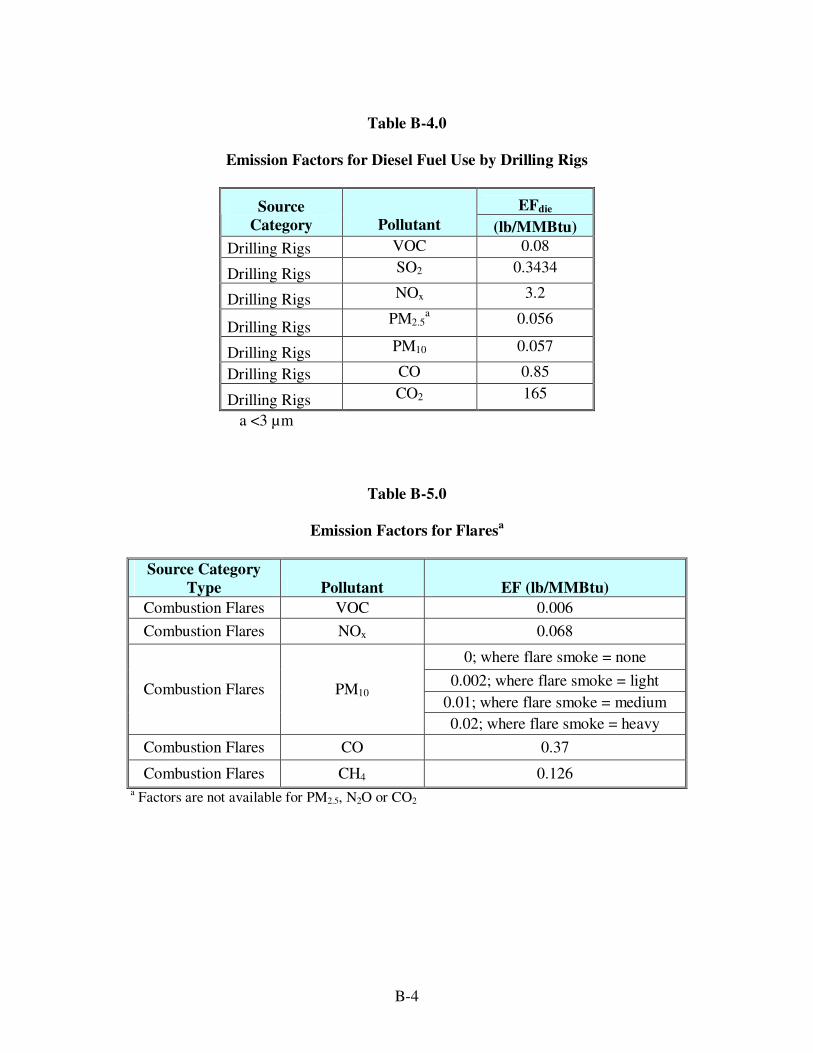
B-4
Table B-4.0
Emission Factors for Diesel Fuel Use by Drilling Rigs
EFdie Source
Category Pollutant (lb/MMBtu)
Drilling Rigs VOC 0.08
Drilling Rigs SO2 0.3434
Drilling Rigs NOx 3.2
Drilling Rigs PM2.5
a 0.056
Drilling Rigs PM10 0.057
Drilling Rigs CO 0.85
Drilling Rigs CO2 165
a <3 µm
Table B-5.0
Emission Factors for Flaresa
Source Category
Type Pollutant EF (lb/MMBtu)
Combustion Flares VOC 0.006
Combustion Flares NOx 0.068
0; where flare smoke = none
0.002; where flare smoke = light
0.01; where flare smoke = medium Combustion Flares PM10
0.02; where flare smoke = heavy
Combustion Flares CO 0.37
Combustion Flares CH4 0.126 a
Factors are not available for PM2.5, N2O or CO2
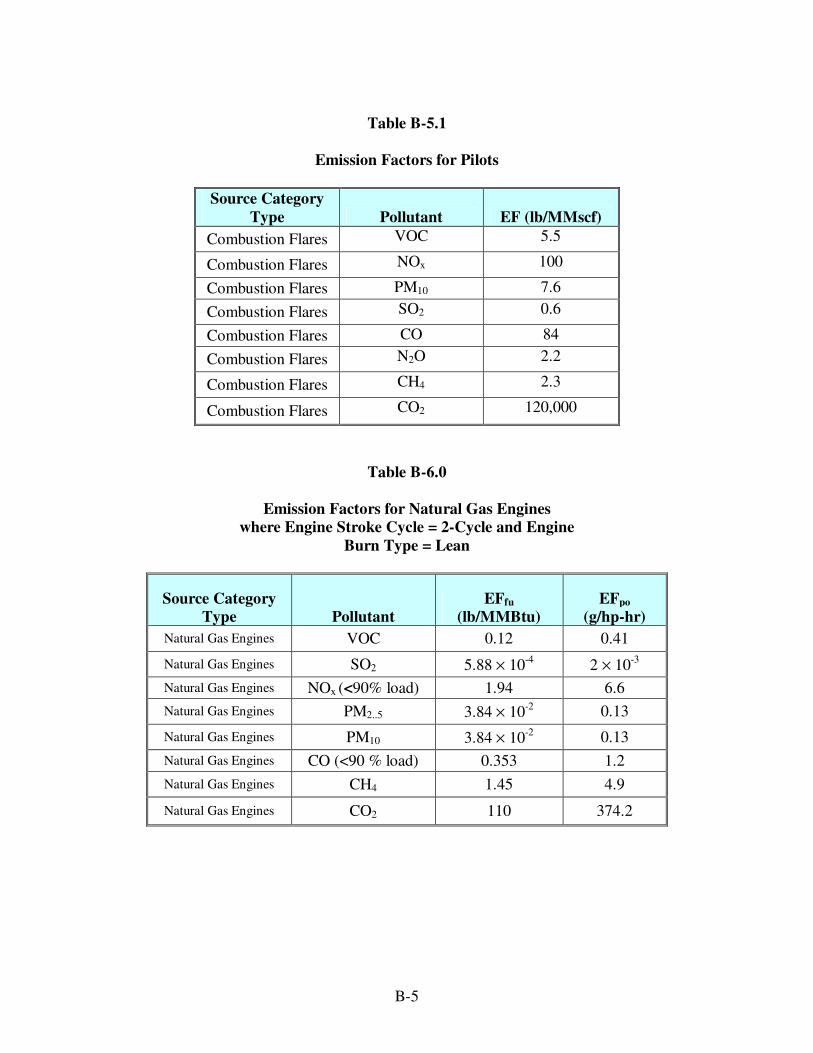
B-5
Table B-5.1
Emission Factors for Pilots
Source Category
Type Pollutant EF (lb/MMscf)
Combustion Flares VOC 5.5
Combustion Flares NOx 100
Combustion Flares PM10 7.6
Combustion Flares SO2 0.6
Combustion Flares CO 84
Combustion Flares N2O 2.2
Combustion Flares CH4 2.3
Combustion Flares CO2 120,000
Table B-6.0
Emission Factors for Natural Gas Engines
where Engine Stroke Cycle = 2-Cycle and Engine
Burn Type = Lean
Source Category
Type Pollutant
EFfu
(lb/MMBtu)
EFpo
(g/hp-hr)
Natural Gas Engines VOC 0.12 0.41
Natural Gas Engines SO2 5.88 × 10⁻⁴
2 × 10⁻³
Natural Gas Engines NOx (<90% load) 1.94 6.6
Natural Gas Engines PM2..5 3.84 × 10⁻²
0.13
Natural Gas Engines PM10 3.84 × 10⁻²
0.13
Natural Gas Engines CO (<90 % load) 0.353 1.2
Natural Gas Engines CH4 1.45 4.9
Natural Gas Engines CO2 110 374.2

B-6
Table B-6.1
Emission Factors for Natural Gas Engines
where Engine Stroke Cycle =
4-Cycle and Engine Burn Type = Lean
Source Category
Type Pollutant
EFfu
(lb/MMBtu)
EFpo
(g/hp-hr)
Natural Gas Engines VOC 0.12 0.41
Natural Gas Engines SO2 5.88 × 10⁻⁴
2.00 × 10⁻³
Natural Gas Engines NOx (<90% load) 0.85 2.89
Natural Gas Engines PM2.5 7.71 × 10⁻⁵
2.6 × 10⁻⁴
Natural Gas Engines PM10 7.71 × 10⁻⁵
2.6 × 10⁻⁴
Natural Gas Engines CO (<90 % load) 0.56 1.9
Natural Gas Engines CH4 1.25 4.25
Natural Gas Engines CO2 110 374.2
Table B-6.2
Emission Factors for Natural Gas Engines
where Engine Stroke Cycle =
2-Cycle and Engine Burn Type = Rich
Source Category
Type Pollutant
EFfu
(lb/MMBtu)
EFpo
(g/hp-hr)
Natural Gas Engines VOC 0.03 0.1
Natural Gas Engines SO2 5.88 × 10⁻⁴
2.00 × 10⁻³
Natural Gas Engines NOx (<90% load) 2.27 7.72
Natural Gas Engines PM2.5 9.5 × 10⁻³
0.03
Natural Gas Engines PM10 9.5 × 10⁻³
0.03
Natural Gas Engines CO (<90 % load) 3.51 11.94
Natural Gas Engines CH4 0.23 0.78
Natural Gas Engines CO2 110 374.22
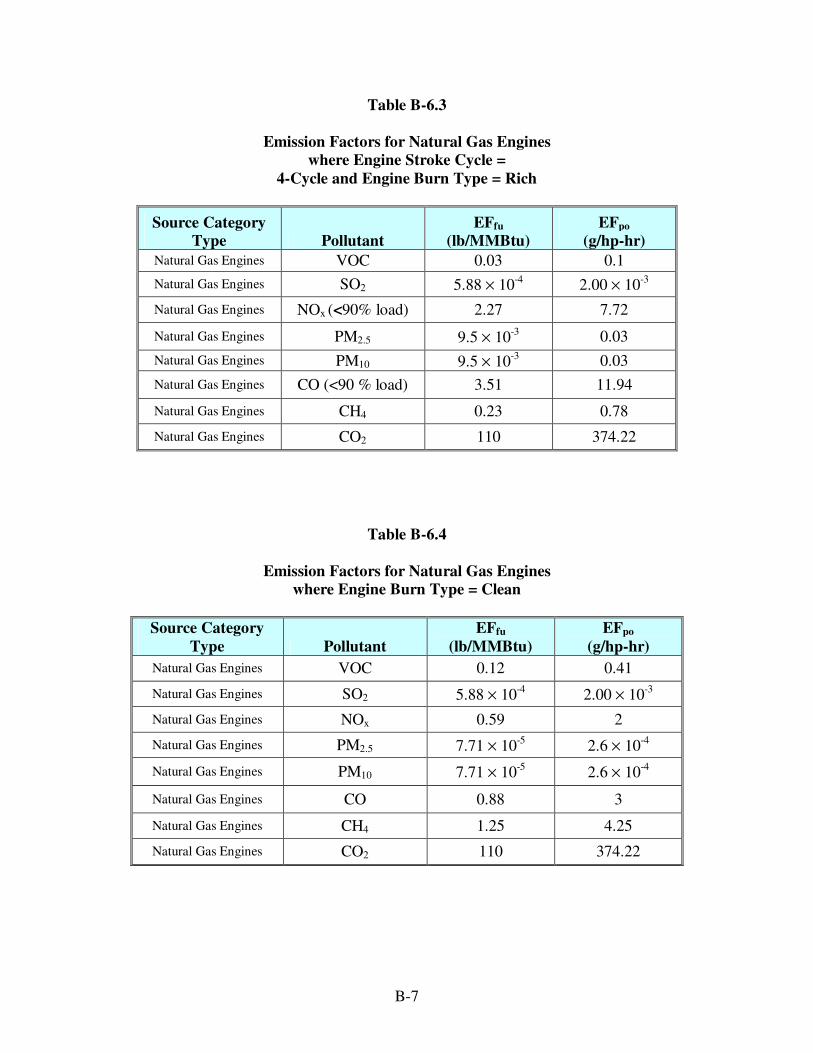
B-7
Table B-6.3
Emission Factors for Natural Gas Engines
where Engine Stroke Cycle =
4-Cycle and Engine Burn Type = Rich
Source Category
Type Pollutant
EFfu
(lb/MMBtu)
EFpo
(g/hp-hr)
Natural Gas Engines VOC 0.03 0.1
Natural Gas Engines SO2 5.88 × 10⁻⁴
2.00 × 10⁻³
Natural Gas Engines NOx (<90% load) 2.27 7.72
Natural Gas Engines PM2.5 9.5 × 10⁻³
0.03
Natural Gas Engines PM10 9.5 × 10⁻³
0.03
Natural Gas Engines CO (<90 % load) 3.51 11.94
Natural Gas Engines CH4 0.23 0.78
Natural Gas Engines CO2 110 374.22
Table B-6.4
Emission Factors for Natural Gas Engines
where Engine Burn Type = Clean
Source Category
Type Pollutant
EFfu
(lb/MMBtu)
EFpo
(g/hp-hr)
Natural Gas Engines VOC 0.12 0.41
Natural Gas Engines SO2 5.88 × 10⁻⁴
2.00 × 10⁻³
Natural Gas Engines NOx 0.59 2
Natural Gas Engines PM2.5 7.71 × 10⁻⁵
2.6 × 10⁻⁴
Natural Gas Engines PM10 7.71 × 10⁻⁵
2.6 × 10⁻⁴
Natural Gas Engines CO 0.88 3
Natural Gas Engines CH4 1.25 4.25
Natural Gas Engines CO2 110 374.22
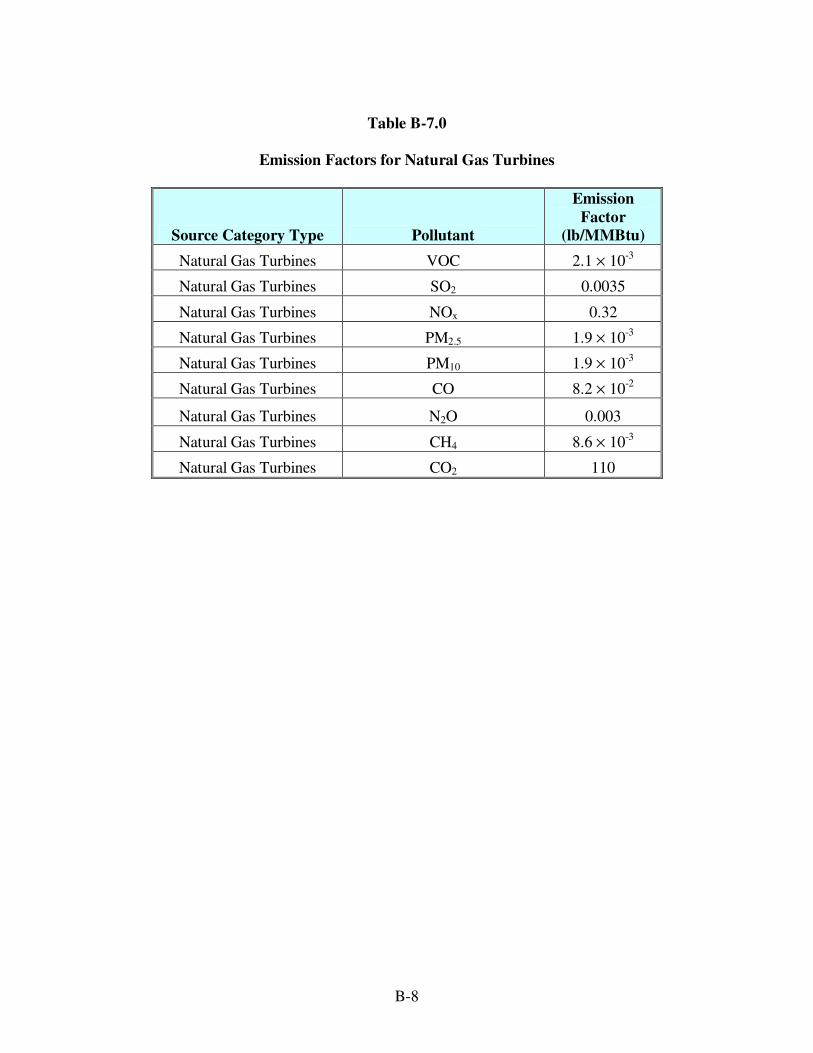
B-8
Table B-7.0
Emission Factors for Natural Gas Turbines
Source Category Type Pollutant
Emission
Factor
(lb/MMBtu)
Natural Gas Turbines VOC 2.1 × 10⁻³
Natural Gas Turbines SO2 0.0035
Natural Gas Turbines NOx 0.32
Natural Gas Turbines PM2.5 1.9 × 10⁻³
Natural Gas Turbines PM10 1.9 × 10⁻³
Natural Gas Turbines CO 8.2 × 10⁻²
Natural Gas Turbines N2O 0.003
Natural Gas Turbines CH4 8.6 × 10⁻³
Natural Gas Turbines CO2 110
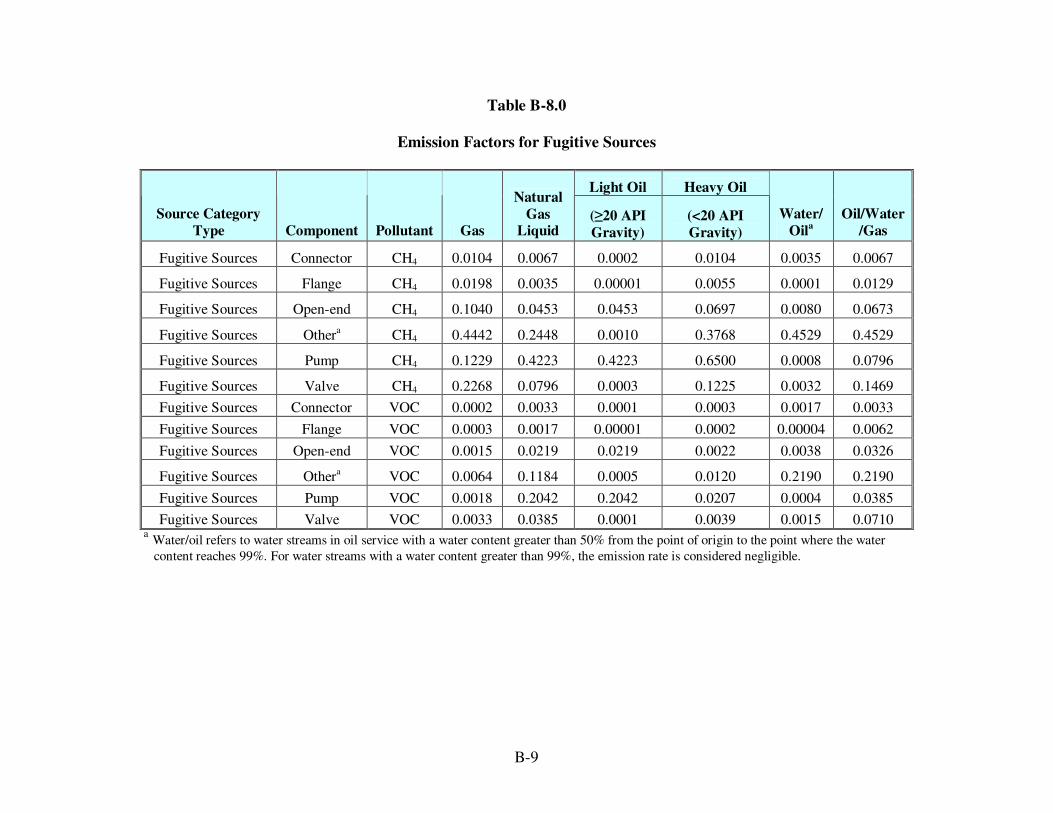
B-9
Table B-8.0
Emission Factors for Fugitive Sources
Light Oil Heavy Oil
Source Category
Type Component Pollutant Gas
Natural
Gas
Liquid (≥20 API
Gravity)
(<20 API
Gravity)
Water/
Oila
Oil/Water
/Gas
Fugitive Sources Connector CH4 0.0104 0.0067 0.0002 0.0104 0.0035 0.0067
Fugitive Sources Flange CH4 0.0198 0.0035 0.00001 0.0055 0.0001 0.0129
Fugitive Sources Open-end CH4 0.1040 0.0453 0.0453 0.0697 0.0080 0.0673
Fugitive Sources Othera CH4 0.4442 0.2448 0.0010 0.3768 0.4529 0.4529
Fugitive Sources Pump CH4 0.1229 0.4223 0.4223 0.6500 0.0008 0.0796
Fugitive Sources Valve CH4 0.2268 0.0796 0.0003 0.1225 0.0032 0.1469
Fugitive Sources Connector VOC 0.0002 0.0033 0.0001 0.0003 0.0017 0.0033
Fugitive Sources Flange VOC 0.0003 0.0017 0.00001 0.0002 0.00004 0.0062
Fugitive Sources Open-end VOC 0.0015 0.0219 0.0219 0.0022 0.0038 0.0326
Fugitive Sources Othera VOC 0.0064 0.1184 0.0005 0.0120 0.2190 0.2190
Fugitive Sources Pump VOC 0.0018 0.2042 0.2042 0.0207 0.0004 0.0385
Fugitive Sources Valve VOC 0.0033 0.0385 0.0001 0.0039 0.0015 0.0710 a Water/oil refers to water streams in oil service with a water content greater than 50% from the point of origin to the point where the water
content reaches 99%. For water streams with a water content greater than 99%, the emission rate is considered negligible.

Appendix C
HAP Factors
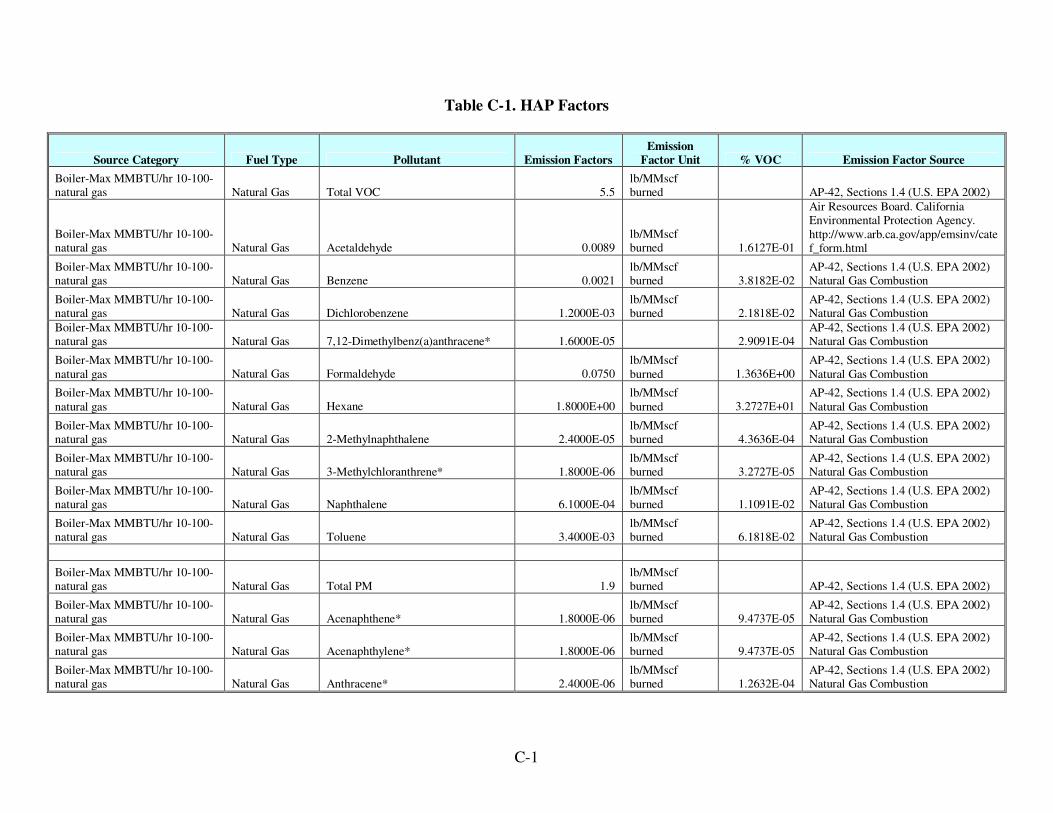
C-1
Table C-1. HAP Factors
Source Category Fuel Type Pollutant Emission Factors
Emission
Factor Unit % VOC Emission Factor Source
Boiler-Max MMBTU/hr 10-100-natural gas Natural Gas Total VOC 5.5
lb/MMscf burned AP-42, Sections 1.4 (U.S. EPA 2002)
Boiler-Max MMBTU/hr 10-100-natural gas Natural Gas Acetaldehyde 0.0089
lb/MMscf burned 1.6127E-01
Air Resources Board. California Environmental Protection Agency.
http://www.arb.ca.gov/app/emsinv/catef_form.html
Boiler-Max MMBTU/hr 10-100-natural gas Natural Gas Benzene 0.0021
lb/MMscf burned 3.8182E-02
AP-42, Sections 1.4 (U.S. EPA 2002) Natural Gas Combustion
Boiler-Max MMBTU/hr 10-100-natural gas Natural Gas Dichlorobenzene 1.2000E-03
lb/MMscf burned 2.1818E-02
AP-42, Sections 1.4 (U.S. EPA 2002) Natural Gas Combustion
Boiler-Max MMBTU/hr 10-100-natural gas Natural Gas 7,12-Dimethylbenz(a)anthracene* 1.6000E-05 2.9091E-04
AP-42, Sections 1.4 (U.S. EPA 2002) Natural Gas Combustion
Boiler-Max MMBTU/hr 10-100-
natural gas Natural Gas Formaldehyde 0.0750 lb/MMscf
burned 1.3636E+00 AP-42, Sections 1.4 (U.S. EPA 2002)
Natural Gas Combustion
Boiler-Max MMBTU/hr 10-100-
natural gas Natural Gas Hexane 1.8000E+00 lb/MMscf
burned 3.2727E+01 AP-42, Sections 1.4 (U.S. EPA 2002)
Natural Gas Combustion
Boiler-Max MMBTU/hr 10-100-natural gas Natural Gas 2-Methylnaphthalene 2.4000E-05
lb/MMscf burned 4.3636E-04
AP-42, Sections 1.4 (U.S. EPA 2002) Natural Gas Combustion
Boiler-Max MMBTU/hr 10-100-natural gas Natural Gas 3-Methylchloranthrene* 1.8000E-06
lb/MMscf burned 3.2727E-05
AP-42, Sections 1.4 (U.S. EPA 2002) Natural Gas Combustion
Boiler-Max MMBTU/hr 10-100-natural gas Natural Gas Naphthalene 6.1000E-04
lb/MMscf burned 1.1091E-02
AP-42, Sections 1.4 (U.S. EPA 2002) Natural Gas Combustion
Boiler-Max MMBTU/hr 10-100-natural gas Natural Gas Toluene 3.4000E-03
lb/MMscf burned 6.1818E-02
AP-42, Sections 1.4 (U.S. EPA 2002) Natural Gas Combustion
Boiler-Max MMBTU/hr 10-100-natural gas Natural Gas Total PM 1.9
lb/MMscf burned AP-42, Sections 1.4 (U.S. EPA 2002)
Boiler-Max MMBTU/hr 10-100-natural gas Natural Gas Acenaphthene* 1.8000E-06
lb/MMscf burned 9.4737E-05
AP-42, Sections 1.4 (U.S. EPA 2002) Natural Gas Combustion
Boiler-Max MMBTU/hr 10-100-natural gas Natural Gas Acenaphthylene* 1.8000E-06
lb/MMscf burned 9.4737E-05
AP-42, Sections 1.4 (U.S. EPA 2002) Natural Gas Combustion
Boiler-Max MMBTU/hr 10-100-natural gas Natural Gas Anthracene* 2.4000E-06
lb/MMscf burned 1.2632E-04
AP-42, Sections 1.4 (U.S. EPA 2002) Natural Gas Combustion
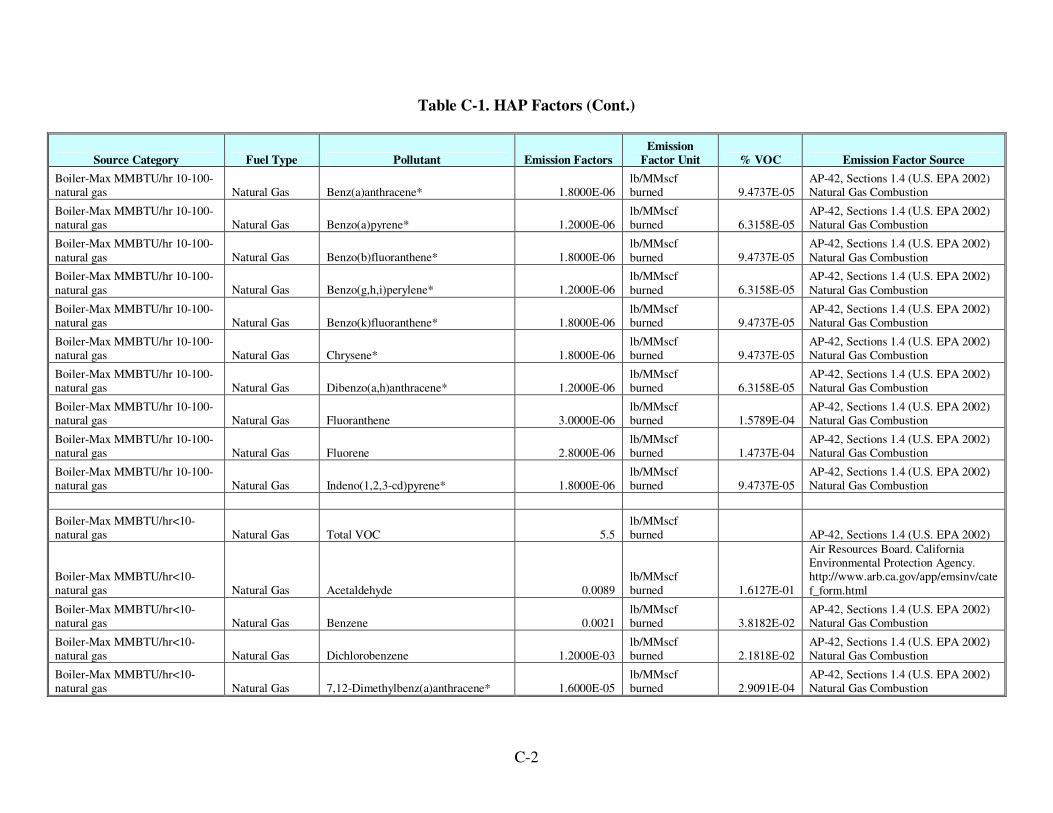
C-2
Table C-1. HAP Factors (Cont.)
Source Category Fuel Type Pollutant Emission Factors
Emission
Factor Unit % VOC Emission Factor Source
Boiler-Max MMBTU/hr 10-100-natural gas Natural Gas Benz(a)anthracene* 1.8000E-06
lb/MMscf burned 9.4737E-05
AP-42, Sections 1.4 (U.S. EPA 2002) Natural Gas Combustion
Boiler-Max MMBTU/hr 10-100-natural gas Natural Gas Benzo(a)pyrene* 1.2000E-06
lb/MMscf burned 6.3158E-05
AP-42, Sections 1.4 (U.S. EPA 2002) Natural Gas Combustion
Boiler-Max MMBTU/hr 10-100-
natural gas Natural Gas Benzo(b)fluoranthene* 1.8000E-06 lb/MMscf
burned 9.4737E-05 AP-42, Sections 1.4 (U.S. EPA 2002)
Natural Gas Combustion
Boiler-Max MMBTU/hr 10-100-
natural gas Natural Gas Benzo(g,h,i)perylene* 1.2000E-06 lb/MMscf
burned 6.3158E-05 AP-42, Sections 1.4 (U.S. EPA 2002)
Natural Gas Combustion
Boiler-Max MMBTU/hr 10-100-natural gas Natural Gas Benzo(k)fluoranthene* 1.8000E-06
lb/MMscf burned 9.4737E-05
AP-42, Sections 1.4 (U.S. EPA 2002) Natural Gas Combustion
Boiler-Max MMBTU/hr 10-100-natural gas Natural Gas Chrysene* 1.8000E-06
lb/MMscf burned 9.4737E-05
AP-42, Sections 1.4 (U.S. EPA 2002) Natural Gas Combustion
Boiler-Max MMBTU/hr 10-100-natural gas Natural Gas Dibenzo(a,h)anthracene* 1.2000E-06
lb/MMscf burned 6.3158E-05
AP-42, Sections 1.4 (U.S. EPA 2002) Natural Gas Combustion
Boiler-Max MMBTU/hr 10-100-natural gas Natural Gas Fluoranthene 3.0000E-06
lb/MMscf burned 1.5789E-04
AP-42, Sections 1.4 (U.S. EPA 2002) Natural Gas Combustion
Boiler-Max MMBTU/hr 10-100-natural gas Natural Gas Fluorene 2.8000E-06
lb/MMscf burned 1.4737E-04
AP-42, Sections 1.4 (U.S. EPA 2002) Natural Gas Combustion
Boiler-Max MMBTU/hr 10-100-natural gas Natural Gas Indeno(1,2,3-cd)pyrene* 1.8000E-06
lb/MMscf burned 9.4737E-05
AP-42, Sections 1.4 (U.S. EPA 2002) Natural Gas Combustion
Boiler-Max MMBTU/hr<10-natural gas Natural Gas Total VOC 5.5
lb/MMscf burned AP-42, Sections 1.4 (U.S. EPA 2002)
Boiler-Max MMBTU/hr<10-natural gas Natural Gas Acetaldehyde 0.0089
lb/MMscf burned 1.6127E-01
Air Resources Board. California Environmental Protection Agency. http://www.arb.ca.gov/app/emsinv/cate
f_form.html
Boiler-Max MMBTU/hr<10-natural gas Natural Gas Benzene 0.0021
lb/MMscf burned 3.8182E-02
AP-42, Sections 1.4 (U.S. EPA 2002) Natural Gas Combustion
Boiler-Max MMBTU/hr<10-natural gas Natural Gas Dichlorobenzene 1.2000E-03
lb/MMscf burned 2.1818E-02
AP-42, Sections 1.4 (U.S. EPA 2002) Natural Gas Combustion
Boiler-Max MMBTU/hr<10-natural gas Natural Gas 7,12-Dimethylbenz(a)anthracene* 1.6000E-05
lb/MMscf burned 2.9091E-04
AP-42, Sections 1.4 (U.S. EPA 2002) Natural Gas Combustion
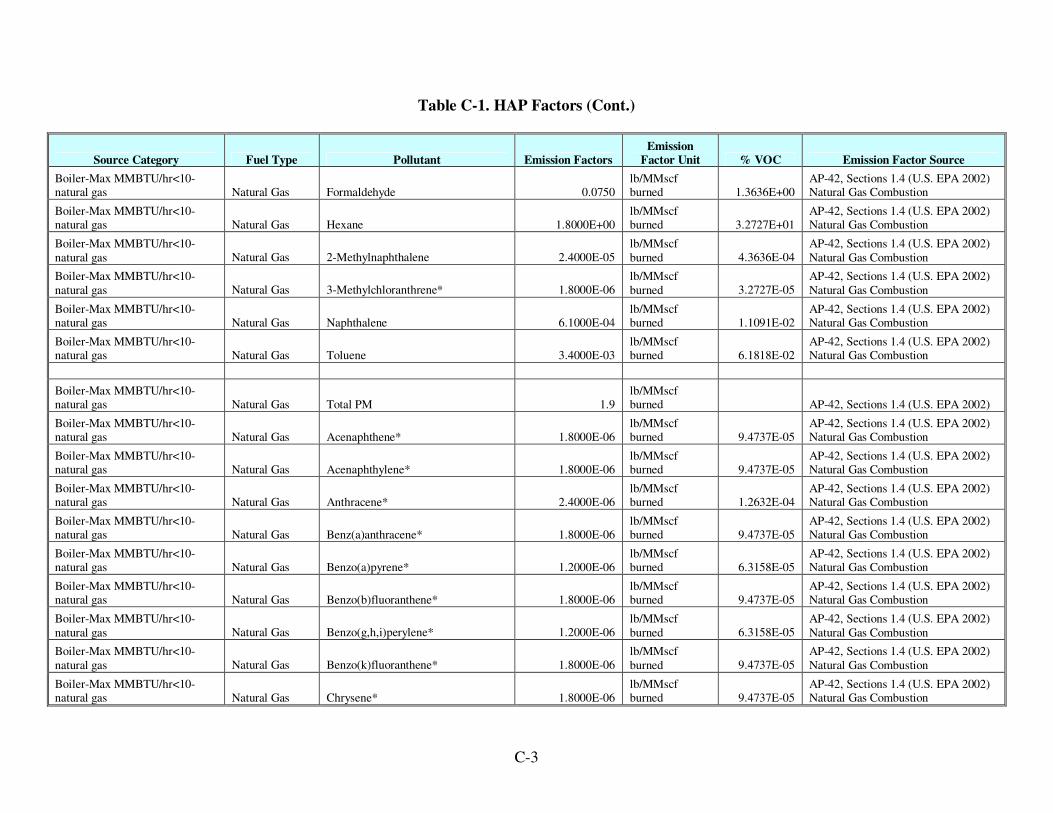
C-3
Table C-1. HAP Factors (Cont.)
Source Category Fuel Type Pollutant Emission Factors
Emission
Factor Unit % VOC Emission Factor Source
Boiler-Max MMBTU/hr<10-natural gas Natural Gas Formaldehyde 0.0750
lb/MMscf burned 1.3636E+00
AP-42, Sections 1.4 (U.S. EPA 2002) Natural Gas Combustion
Boiler-Max MMBTU/hr<10-natural gas Natural Gas Hexane 1.8000E+00
lb/MMscf burned 3.2727E+01
AP-42, Sections 1.4 (U.S. EPA 2002) Natural Gas Combustion
Boiler-Max MMBTU/hr<10-
natural gas Natural Gas 2-Methylnaphthalene 2.4000E-05 lb/MMscf
burned 4.3636E-04 AP-42, Sections 1.4 (U.S. EPA 2002)
Natural Gas Combustion
Boiler-Max MMBTU/hr<10-
natural gas Natural Gas 3-Methylchloranthrene* 1.8000E-06 lb/MMscf
burned 3.2727E-05 AP-42, Sections 1.4 (U.S. EPA 2002)
Natural Gas Combustion
Boiler-Max MMBTU/hr<10-natural gas Natural Gas Naphthalene 6.1000E-04
lb/MMscf burned 1.1091E-02
AP-42, Sections 1.4 (U.S. EPA 2002) Natural Gas Combustion
Boiler-Max MMBTU/hr<10-natural gas Natural Gas Toluene 3.4000E-03
lb/MMscf burned 6.1818E-02
AP-42, Sections 1.4 (U.S. EPA 2002) Natural Gas Combustion
Boiler-Max MMBTU/hr<10-natural gas Natural Gas Total PM 1.9
lb/MMscf burned AP-42, Sections 1.4 (U.S. EPA 2002)
Boiler-Max MMBTU/hr<10-natural gas Natural Gas Acenaphthene* 1.8000E-06
lb/MMscf burned 9.4737E-05
AP-42, Sections 1.4 (U.S. EPA 2002) Natural Gas Combustion
Boiler-Max MMBTU/hr<10-natural gas Natural Gas Acenaphthylene* 1.8000E-06
lb/MMscf burned 9.4737E-05
AP-42, Sections 1.4 (U.S. EPA 2002) Natural Gas Combustion
Boiler-Max MMBTU/hr<10-natural gas Natural Gas Anthracene* 2.4000E-06
lb/MMscf burned 1.2632E-04
AP-42, Sections 1.4 (U.S. EPA 2002) Natural Gas Combustion
Boiler-Max MMBTU/hr<10-natural gas Natural Gas Benz(a)anthracene* 1.8000E-06
lb/MMscf burned 9.4737E-05
AP-42, Sections 1.4 (U.S. EPA 2002) Natural Gas Combustion
Boiler-Max MMBTU/hr<10-natural gas Natural Gas Benzo(a)pyrene* 1.2000E-06
lb/MMscf burned 6.3158E-05
AP-42, Sections 1.4 (U.S. EPA 2002) Natural Gas Combustion
Boiler-Max MMBTU/hr<10-natural gas Natural Gas Benzo(b)fluoranthene* 1.8000E-06
lb/MMscf burned 9.4737E-05
AP-42, Sections 1.4 (U.S. EPA 2002) Natural Gas Combustion
Boiler-Max MMBTU/hr<10-
natural gas Natural Gas Benzo(g,h,i)perylene* 1.2000E-06 lb/MMscf
burned 6.3158E-05 AP-42, Sections 1.4 (U.S. EPA 2002)
Natural Gas Combustion
Boiler-Max MMBTU/hr<10-
natural gas Natural Gas Benzo(k)fluoranthene* 1.8000E-06 lb/MMscf
burned 9.4737E-05 AP-42, Sections 1.4 (U.S. EPA 2002)
Natural Gas Combustion
Boiler-Max MMBTU/hr<10-natural gas Natural Gas Chrysene* 1.8000E-06
lb/MMscf burned 9.4737E-05
AP-42, Sections 1.4 (U.S. EPA 2002) Natural Gas Combustion
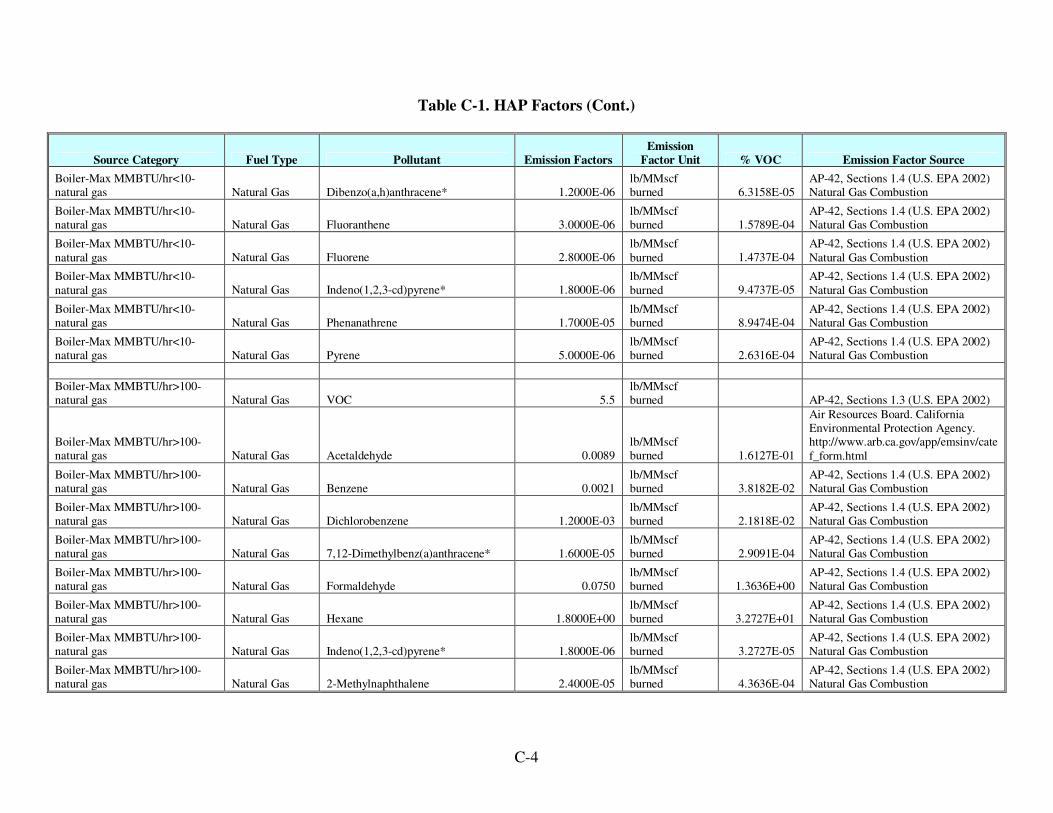
C-4
Table C-1. HAP Factors (Cont.)
Source Category Fuel Type Pollutant Emission Factors
Emission
Factor Unit % VOC Emission Factor Source
Boiler-Max MMBTU/hr<10-natural gas Natural Gas Dibenzo(a,h)anthracene* 1.2000E-06
lb/MMscf burned 6.3158E-05
AP-42, Sections 1.4 (U.S. EPA 2002) Natural Gas Combustion
Boiler-Max MMBTU/hr<10-natural gas Natural Gas Fluoranthene 3.0000E-06
lb/MMscf burned 1.5789E-04
AP-42, Sections 1.4 (U.S. EPA 2002) Natural Gas Combustion
Boiler-Max MMBTU/hr<10-
natural gas Natural Gas Fluorene 2.8000E-06 lb/MMscf
burned 1.4737E-04 AP-42, Sections 1.4 (U.S. EPA 2002)
Natural Gas Combustion
Boiler-Max MMBTU/hr<10-
natural gas Natural Gas Indeno(1,2,3-cd)pyrene* 1.8000E-06 lb/MMscf
burned 9.4737E-05 AP-42, Sections 1.4 (U.S. EPA 2002)
Natural Gas Combustion
Boiler-Max MMBTU/hr<10-natural gas Natural Gas Phenanathrene 1.7000E-05
lb/MMscf burned 8.9474E-04
AP-42, Sections 1.4 (U.S. EPA 2002) Natural Gas Combustion
Boiler-Max MMBTU/hr<10-natural gas Natural Gas Pyrene 5.0000E-06
lb/MMscf burned 2.6316E-04
AP-42, Sections 1.4 (U.S. EPA 2002) Natural Gas Combustion
Boiler-Max MMBTU/hr>100-natural gas Natural Gas VOC 5.5
lb/MMscf burned AP-42, Sections 1.3 (U.S. EPA 2002)
Boiler-Max MMBTU/hr>100-natural gas Natural Gas Acetaldehyde 0.0089
lb/MMscf burned 1.6127E-01
Air Resources Board. California Environmental Protection Agency. http://www.arb.ca.gov/app/emsinv/cate
f_form.html
Boiler-Max MMBTU/hr>100-natural gas Natural Gas Benzene 0.0021
lb/MMscf burned 3.8182E-02
AP-42, Sections 1.4 (U.S. EPA 2002) Natural Gas Combustion
Boiler-Max MMBTU/hr>100-natural gas Natural Gas Dichlorobenzene 1.2000E-03
lb/MMscf burned 2.1818E-02
AP-42, Sections 1.4 (U.S. EPA 2002) Natural Gas Combustion
Boiler-Max MMBTU/hr>100-natural gas Natural Gas 7,12-Dimethylbenz(a)anthracene* 1.6000E-05
lb/MMscf burned 2.9091E-04
AP-42, Sections 1.4 (U.S. EPA 2002) Natural Gas Combustion
Boiler-Max MMBTU/hr>100-natural gas Natural Gas Formaldehyde 0.0750
lb/MMscf burned 1.3636E+00
AP-42, Sections 1.4 (U.S. EPA 2002) Natural Gas Combustion
Boiler-Max MMBTU/hr>100-natural gas Natural Gas Hexane 1.8000E+00
lb/MMscf burned 3.2727E+01
AP-42, Sections 1.4 (U.S. EPA 2002) Natural Gas Combustion
Boiler-Max MMBTU/hr>100-natural gas Natural Gas Indeno(1,2,3-cd)pyrene* 1.8000E-06
lb/MMscf burned 3.2727E-05
AP-42, Sections 1.4 (U.S. EPA 2002) Natural Gas Combustion
Boiler-Max MMBTU/hr>100-natural gas Natural Gas 2-Methylnaphthalene 2.4000E-05
lb/MMscf burned 4.3636E-04
AP-42, Sections 1.4 (U.S. EPA 2002) Natural Gas Combustion
C-5
Table C-1. HAP Factors (Cont.)
Source Category Fuel Type Pollutant Emission Factors
Emission
Factor Unit % VOC Emission Factor Source
Boiler-Max MMBTU/hr>100-natural gas Natural Gas 3-Methylchloranthrene* 1.8000E-06
lb/MMscf burned 3.2727E-05
AP-42, Sections 1.4 (U.S. EPA 2002) Natural Gas Combustion
Boiler-Max MMBTU/hr>100-natural gas Natural Gas Naphthalene 6.1000E-04
lb/MMscf burned 1.1091E-02
AP-42, Sections 1.4 (U.S. EPA 2002) Natural Gas Combustion
Boiler-Max MMBTU/hr>100-
natural gas Natural Gas Phenanathrene 1.7000E-05 lb/MMscf
burned 3.0909E-04 AP-42, Sections 1.4 (U.S. EPA 2002)
Natural Gas Combustion
Boiler-Max MMBTU/hr>100-
natural gas Natural Gas Pyrene 5.0000E-06 lb/MMscf
burned 9.0909E-05 AP-42, Sections 1.4 (U.S. EPA 2002)
Natural Gas Combustion
Boiler-Max MMBTU/hr>100-natural gas Natural Gas Toluene 3.4000E-03
lb/MMscf burned 6.1818E-02
AP-42, Sections 1.4 (U.S. EPA 2002) Natural Gas Combustion
Boiler-Max MMBTU/hr>100-natural gas Natural Gas PM 1.9
lb/MMscf burned AP-42, Sections 1.3 (U.S. EPA 2002)
Boiler-Max MMBTU/hr>100-natural gas Natural Gas Acenaphthene* 1.8000E-06
lb/MMscf burned 9.4737E-05
AP-42, Sections 1.4 (U.S. EPA 2002) Natural Gas Combustion
Boiler-Max MMBTU/hr>100-natural gas Natural Gas Acenaphthylene* 1.8000E-06
lb/MMscf burned 9.4737E-05
AP-42, Sections 1.4 (U.S. EPA 2002) Natural Gas Combustion
Boiler-Max MMBTU/hr>100-natural gas Natural Gas Anthracene* 2.4000E-06
lb/MMscf burned 1.2632E-04
AP-42, Sections 1.4 (U.S. EPA 2002) Natural Gas Combustion
Boiler-Max MMBTU/hr>100-natural gas Natural Gas Benz(a)anthracene* 1.8000E-06
lb/MMscf burned 9.4737E-05
AP-42, Sections 1.4 (U.S. EPA 2002) Natural Gas Combustion
Boiler-Max MMBTU/hr>100-
natural gas Natural Gas Benzo(a)pyrene* 1.2000E-06 lb/MMscf
burned 6.3158E-05 AP-42, Sections 1.4 (U.S. EPA 2002)
Natural Gas Combustion
Boiler-Max MMBTU/hr>100-
natural gas Natural Gas Benzo(b)fluoranthene* 1.8000E-06 lb/MMscf
burned 9.4737E-05 AP-42, Sections 1.4 (U.S. EPA 2002)
Natural Gas Combustion
Boiler-Max MMBTU/hr>100-natural gas Natural Gas Benzo(g,h,i)perylene* 1.2000E-06
lb/MMscf burned 6.3158E-05
AP-42, Sections 1.4 (U.S. EPA 2002) Natural Gas Combustion
Boiler-Max MMBTU/hr>100-natural gas Natural Gas Benzo(k)fluoranthene* 1.8000E-06
lb/MMscf burned 9.4737E-05
AP-42, Sections 1.4 (U.S. EPA 2002) Natural Gas Combustion
Boiler-Max MMBTU/hr>100-natural gas Natural Gas Chrysene* 1.8000E-06
lb/MMscf burned 9.4737E-05
AP-42, Sections 1.4 (U.S. EPA 2002) Natural Gas Combustion
C-6
Table C-1. HAP Factors (Cont.)
Source Category Fuel Type Pollutant Emission Factors
Emission
Factor Unit % VOC Emission Factor Source
Boiler-Max MMBTU/hr>100-natural gas Natural Gas Dibenzo(a,h)anthracene* 1.2000E-06
lb/MMscf burned 6.3158E-05
AP-42, Sections 1.4 (U.S. EPA 2002) Natural Gas Combustion
Boiler-Max MMBTU/hr>100-natural gas Natural Gas Fluoranthene 3.0000E-06
lb/MMscf burned 1.5789E-04
AP-42, Sections 1.4 (U.S. EPA 2002) Natural Gas Combustion
Boiler-Max MMBTU/hr>100-
natural gas Natural Gas Fluorene 2.8000E-06 lb/MMscf
burned 1.4737E-04 AP-42, Sections 1.4 (U.S. EPA 2002)
Natural Gas Combustion
Boiler-Max MMBTU/hr>100-
natural gas Natural Gas Indeno(1,2,3-cd)pyrene* 1.8000E-06 lb/MMscf
burned 9.4737E-05 AP-42, Sections 1.4 (U.S. EPA 2002)
Natural Gas Combustion
Boiler-Max MMBTU/hr>100-natural gas Natural Gas Phenanathrene 1.7000E-05
lb/MMscf burned 8.9474E-04
AP-42, Sections 1.4 (U.S. EPA 2002) Natural Gas Combustion
Boiler-Max MMBTU/hr>100-natural gas Natural Gas Pyrene 5.0000E-06
lb/MMscf burned 2.6316E-04
AP-42, Sections 1.4 (U.S. EPA 2002) Natural Gas Combustion
Diesel Engine Max HP < 600 Diesel VOC 0.33 lb/MMBtu AP-42, Sections 3.3 and 3.4 (U.S. EPA 2002)
Diesel Engine Max HP < 600 Diesel Acetaldehyde 2.52E-05 lb/MMBtu 7.64E-03 AP-42, Section 3.4 (U.S. EPA 2002)
Diesel Engine Max HP < 600 Diesel Acrolein 7.88E-06 lb/MMBtu 2.39E-03 AP-42, Section 3.4 (U.S. EPA 2002)
Diesel Engine Max HP < 600 Diesel Benzene 7.76E-04 lb/MMBtu 2.35E-01 AP-42, Section 3.4 (U.S. EPA 2002)
Diesel Engine Max HP < 600 Diesel Formaldehyde 7.89E-05 lb/MMBtu 2.39E-02 AP-42, Section 3.4 (U.S. EPA 2002)
Diesel Engine Max HP < 600 Diesel Hexane 1.00216E-08 lb/MMBtu 3.04E-06
Air Resources Board. California
Environmental Protection Agency. http://www.arb.ca.gov/app/emsinv/catef_form.html

C-7
Table C-1. HAP Factors (Cont.)
Source Category Fuel Type Pollutant Emission Factors
Emission
Factor Unit % VOC Emission Factor Source
Diesel Engine Max HP < 600 Diesel Naphthalene 2.5721E-07 lb/MMBtu 7.79E-05
Air Resources Board. California Environmental Protection Agency. http://www.arb.ca.gov/app/emsinv/cate
f_form.html
Diesel Engine Max HP < 600 Diesel Propylene 2.48738E-06 lb/MMBtu 7.54E-04
Air Resources Board. California Environmental Protection Agency. http://www.arb.ca.gov/app/emsinv/catef_form.html
Diesel Engine Max HP < 600 Diesel Toluene 2.81E-04 lb/MMBtu 8.52E-02 AP-42, Section 3.4 (U.S. EPA 2002)
Diesel Engine Max HP < 600 Diesel Xylenes (isomers and mixture) 1.93E-04 lb/MMBtu 5.85E-02 AP-42, Section 3.4 (U.S. EPA 2002)
Diesel Engine Max HP < 600 Diesel o-Xylenes 1.50685E-07 lb/MMBtu 4.57E-05
Air Resources Board. California Environmental Protection Agency. http://www.arb.ca.gov/app/emsinv/catef_form.html
Diesel Engine Max HP < 600 Diesel m,p-Xylenes 1.55732E-07 lb/MMBtu 4.72E-05
Air Resources Board. California Environmental Protection Agency. http://www.arb.ca.gov/app/emsinv/catef_form.html
Diesel Engine Max HP>600 Diesel VOC 0.08 lb/MMBtu AP-42, Sections 3.3 and 3.4 (U.S. EPA 2002)
Diesel Engine Max HP>600 Diesel Acetaldehyde 2.52E-05 lb/MMBtu 3.15E-02 AP-42, Section 3.4 (U.S. EPA 2002)
Diesel Engine Max HP>600 Diesel Acrolein 7.88E-06 lb/MMBtu 9.85E-03 AP-42, Section 3.4 (U.S. EPA 2002)
Diesel Engine Max HP>600 Diesel Benzene 7.76E-04 lb/MMBtu 9.70E-01 AP-42, Section 3.4 (U.S. EPA 2002)
Diesel Engine Max HP>600 Diesel Formaldehyde 7.89E-05 lb/MMBtu 9.86E-02 AP-42, Section 3.4 (U.S. EPA 2002)
Diesel Engine Max HP>600 Diesel Hexane 1.00216E-08 lb/MMBtu 1.25E-05
Air Resources Board. California
Environmental Protection Agency. http://www.arb.ca.gov/app/emsinv/catef_form.html
Diesel Engine Max HP>600 Diesel Naphthalene 2.5721E-07 lb/MMBtu 3.22E-04
Air Resources Board. California Environmental Protection Agency. http://www.arb.ca.gov/app/emsinv/catef_form.html
Diesel Engine Max HP>600 Diesel Propylene 2.48738E-06 lb/MMBtu 3.11E-03
Air Resources Board. California Environmental Protection Agency. http://www.arb.ca.gov/app/emsinv/catef_form.html
C-8
Table C-1. HAP Factors (Cont.)
Source Category Fuel Type Pollutant Emission Factors
Emission
Factor Unit % VOC Emission Factor Source
Diesel Engine Max HP>600 Diesel Toluene 2.81E-04 lb/MMBtu 3.51E-01 AP-42, Section 3.4 (U.S. EPA 2002)
Diesel Engine Max HP>600 Diesel Xylenes (isomers and mixture) 1.93E-04 lb/MMBtu 2.41E-01 AP-42, Section 3.4 (U.S. EPA 2002)
Diesel Engine Max HP>600 Diesel o-Xylenes 1.50685E-07 lb/MMBtu 1.88E-04
Air Resources Board. California
Environmental Protection Agency. http://www.arb.ca.gov/app/emsinv/catef_form.html
Diesel Engine Max HP>600 Diesel m,p-Xylenes 1.55732E-07 lb/MMBtu 1.95E-04
Air Resources Board. California Environmental Protection Agency. http://www.arb.ca.gov/app/emsinv/catef_form.html
Drilling Rigs Max HP <600 Diesel VOC 0.33 lb/MMBtu AP-42, Sections 3.3 and 3.4 (U.S. EPA 2002)
Drilling Rigs Max HP <600 Diesel Acetaldehyde 2.52E-05 lb/MMBtu 7.64E-03 AP-42, Section 3.4 (U.S. EPA 2002)
Drilling Rigs Max HP <600 Diesel Acrolein 7.88E-06 lb/MMBtu 2.39E-03 AP-42, Section 3.4 (U.S. EPA 2002)
Drilling Rigs Max HP <600 Diesel Benzene 7.76E-04 lb/MMBtu 2.35E-01 AP-42, Section 3.4 (U.S. EPA 2002)
Drilling Rigs Max HP <600 Diesel Formaldehyde 7.89E-05 lb/MMBtu 2.39E-02 AP-42, Section 3.4 (U.S. EPA 2002)
Drilling Rigs Max HP <600 Diesel Hexane 1.00216E-08 lb/MMBtu 3.04E-06
Air Resources Board. California Environmental Protection Agency.
http://www.arb.ca.gov/app/emsinv/catef_form.html
Drilling Rigs Max HP <600 Diesel Naphthalene 2.5721E-07 lb/MMBtu 7.79E-05
Air Resources Board. California Environmental Protection Agency. http://www.arb.ca.gov/app/emsinv/catef_form.html
Drilling Rigs Max HP <600 Diesel Propylene 2.48738E-06 lb/MMBtu 7.54E-04
Air Resources Board. California
Environmental Protection Agency. http://www.arb.ca.gov/app/emsinv/catef_form.html
Drilling Rigs Max HP <600 Diesel Toluene 2.81E-04 lb/MMBtu 8.52E-02 AP-42, Section 3.4 (U.S. EPA 2002)
Drilling Rigs Max HP <600 Diesel Xylenes (isomers and mixture) 1.93E-04 lb/MMBtu 5.85E-02 AP-42, Section 3.4 (U.S. EPA 2002)
Drilling Rigs Max HP <600 Diesel o-Xylenes 1.50685E-07 lb/MMBtu 4.57E-05
Air Resources Board. California Environmental Protection Agency. http://www.arb.ca.gov/app/emsinv/cate
f_form.html
C-9
Table C-1. HAP Factors (Cont.)
Source Category Fuel Type Pollutant Emission Factors
Emission
Factor Unit % VOC Emission Factor Source
Drilling Rigs Max HP <600 Diesel m,p-Xylenes 1.55732E-07 lb/MMBtu 4.72E-05
Air Resources Board. California Environmental Protection Agency. http://www.arb.ca.gov/app/emsinv/cate
f_form.html
Drilling Rigs Max HP <600 Diesel PM 0.057 lb/MMBtu AP-42, Sections 3.3 and 3.4 (U.S. EPA 2002)
Drilling Rigs Max HP <600 Diesel Antimony 3.60E-05 lb/MMBtu 6.32E-02
Air Resources Board. California Environmental Protection Agency.Speciation Profile Database
Drilling Rigs Max HP <600 Diesel Arsenic 5.00E-06 lb/MMBtu 8.77E-03
Air Resources Board. California Environmental Protection Agency.Speciation Profile Database
Drilling Rigs Max HP <600 Diesel Cadmium 4.00E-05 lb/MMBtu 7.02E-02
Air Resources Board. California Environmental Protection Agency.Speciation Profile Database
Drilling Rigs Max HP <600 Diesel Cobalt 0.000011 lb/MMBtu 1.93E-02
Air Resources Board. California Environmental Protection Agency.Speciation Profile Database
Drilling Rigs Max HP <600 Diesel Chlorine 3.44E-04 lb/MMBtu 6.04E-01
Air Resources Board. California Environmental Protection Agency.Speciation Profile Database
Drilling Rigs Max HP <600 Diesel Lead 0.000042 lb/MMBtu 7.37E-02
Air Resources Board. California
Environmental Protection Agency.Speciation Profile Database
Drilling Rigs Max HP <600 Diesel Manganese 0.00004 lb/MMBtu 7.02E-02
Air Resources Board. California Environmental Protection Agency.Speciation Profile Database
Drilling Rigs Max HP <600 Diesel Nickel 0.000019 lb/MMBtu 3.33E-02
Air Resources Board. California Environmental Protection
Agency.Speciation Profile Database
Drilling Rigs Max HP <600 Diesel Mercury 3.00E-05 lb/MMBtu 5.26E-02
Air Resources Board. California Environmental Protection Agency.Speciation Profile Database
Drilling Rigs Max HP <600 Diesel Phosphorous 1.27E-04 lb/MMBtu 2.23E-01
Air Resources Board. California Environmental Protection Agency.Speciation Profile Database
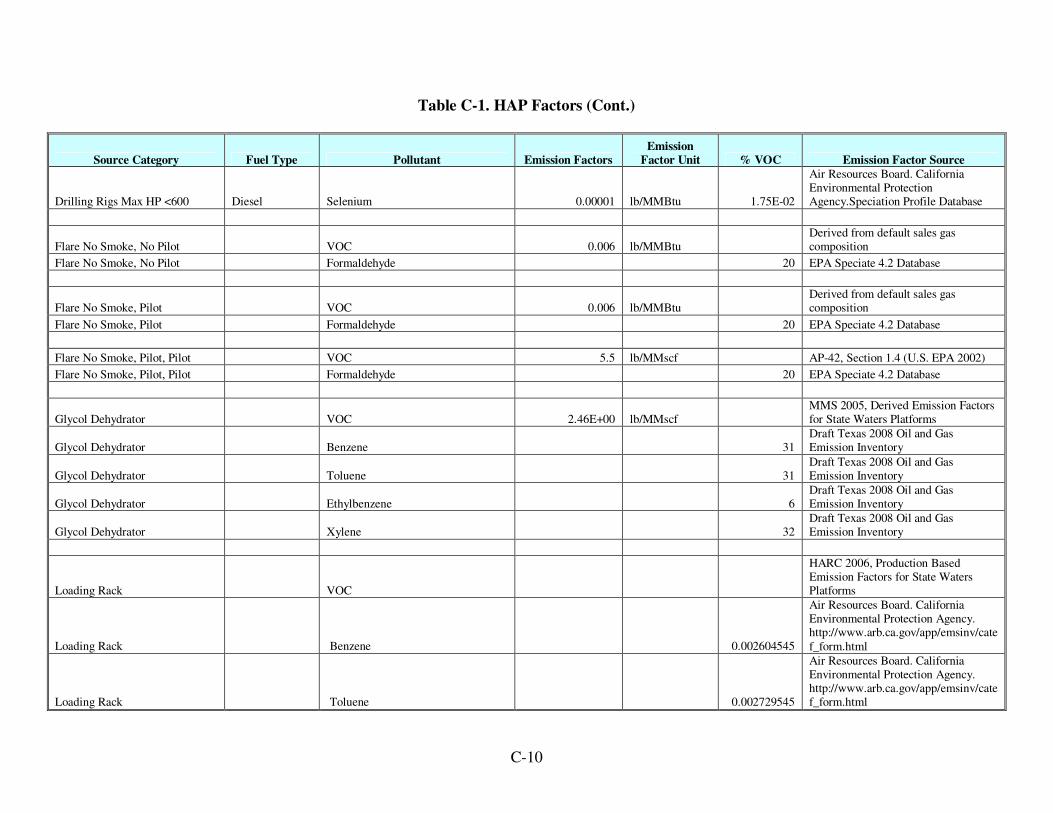
C-10
Table C-1. HAP Factors (Cont.)
Source Category Fuel Type Pollutant Emission Factors
Emission
Factor Unit % VOC Emission Factor Source
Drilling Rigs Max HP <600 Diesel Selenium 0.00001 lb/MMBtu 1.75E-02
Air Resources Board. California Environmental Protection Agency.Speciation Profile Database
Flare No Smoke, No Pilot VOC 0.006 lb/MMBtu Derived from default sales gas composition
Flare No Smoke, No Pilot Formaldehyde 20 EPA Speciate 4.2 Database
Flare No Smoke, Pilot VOC 0.006 lb/MMBtu Derived from default sales gas composition
Flare No Smoke, Pilot Formaldehyde 20 EPA Speciate 4.2 Database
Flare No Smoke, Pilot, Pilot VOC 5.5 lb/MMscf AP-42, Section 1.4 (U.S. EPA 2002)
Flare No Smoke, Pilot, Pilot Formaldehyde 20 EPA Speciate 4.2 Database
Glycol Dehydrator VOC 2.46E+00 lb/MMscf MMS 2005, Derived Emission Factors for State Waters Platforms
Glycol Dehydrator Benzene 31 Draft Texas 2008 Oil and Gas Emission Inventory
Glycol Dehydrator Toluene 31 Draft Texas 2008 Oil and Gas Emission Inventory
Glycol Dehydrator Ethylbenzene 6 Draft Texas 2008 Oil and Gas Emission Inventory
Glycol Dehydrator Xylene 32 Draft Texas 2008 Oil and Gas Emission Inventory
Loading Rack VOC
HARC 2006, Production Based Emission Factors for State Waters Platforms
Loading Rack Benzene 0.002604545
Air Resources Board. California Environmental Protection Agency. http://www.arb.ca.gov/app/emsinv/cate
f_form.html
Loading Rack Toluene 0.002729545
Air Resources Board. California Environmental Protection Agency. http://www.arb.ca.gov/app/emsinv/catef_form.html
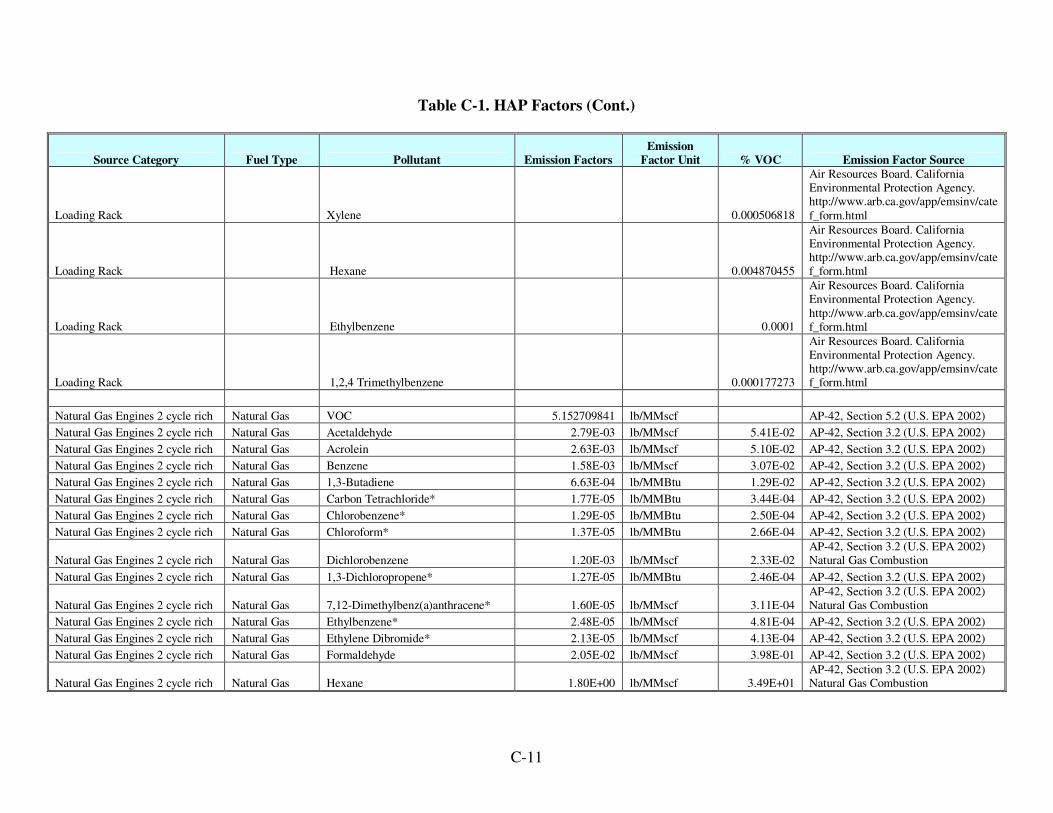
C-11
Table C-1. HAP Factors (Cont.)
Source Category Fuel Type Pollutant Emission Factors
Emission
Factor Unit % VOC Emission Factor Source
Loading Rack Xylene 0.000506818
Air Resources Board. California Environmental Protection Agency. http://www.arb.ca.gov/app/emsinv/cate
f_form.html
Loading Rack Hexane 0.004870455
Air Resources Board. California Environmental Protection Agency. http://www.arb.ca.gov/app/emsinv/catef_form.html
Loading Rack Ethylbenzene 0.0001
Air Resources Board. California Environmental Protection Agency.
http://www.arb.ca.gov/app/emsinv/catef_form.html
Loading Rack 1,2,4 Trimethylbenzene 0.000177273
Air Resources Board. California Environmental Protection Agency. http://www.arb.ca.gov/app/emsinv/catef_form.html
Natural Gas Engines 2 cycle rich Natural Gas VOC 5.152709841 lb/MMscf AP-42, Section 5.2 (U.S. EPA 2002)
Natural Gas Engines 2 cycle rich Natural Gas Acetaldehyde 2.79E-03 lb/MMscf 5.41E-02 AP-42, Section 3.2 (U.S. EPA 2002)
Natural Gas Engines 2 cycle rich Natural Gas Acrolein 2.63E-03 lb/MMscf 5.10E-02 AP-42, Section 3.2 (U.S. EPA 2002)
Natural Gas Engines 2 cycle rich Natural Gas Benzene 1.58E-03 lb/MMscf 3.07E-02 AP-42, Section 3.2 (U.S. EPA 2002)
Natural Gas Engines 2 cycle rich Natural Gas 1,3-Butadiene 6.63E-04 lb/MMBtu 1.29E-02 AP-42, Section 3.2 (U.S. EPA 2002)
Natural Gas Engines 2 cycle rich Natural Gas Carbon Tetrachloride* 1.77E-05 lb/MMBtu 3.44E-04 AP-42, Section 3.2 (U.S. EPA 2002)
Natural Gas Engines 2 cycle rich Natural Gas Chlorobenzene* 1.29E-05 lb/MMBtu 2.50E-04 AP-42, Section 3.2 (U.S. EPA 2002)
Natural Gas Engines 2 cycle rich Natural Gas Chloroform* 1.37E-05 lb/MMBtu 2.66E-04 AP-42, Section 3.2 (U.S. EPA 2002)
Natural Gas Engines 2 cycle rich Natural Gas Dichlorobenzene 1.20E-03 lb/MMscf 2.33E-02 AP-42, Section 3.2 (U.S. EPA 2002) Natural Gas Combustion
Natural Gas Engines 2 cycle rich Natural Gas 1,3-Dichloropropene* 1.27E-05 lb/MMBtu 2.46E-04 AP-42, Section 3.2 (U.S. EPA 2002)
Natural Gas Engines 2 cycle rich Natural Gas 7,12-Dimethylbenz(a)anthracene* 1.60E-05 lb/MMscf 3.11E-04 AP-42, Section 3.2 (U.S. EPA 2002) Natural Gas Combustion
Natural Gas Engines 2 cycle rich Natural Gas Ethylbenzene* 2.48E-05 lb/MMscf 4.81E-04 AP-42, Section 3.2 (U.S. EPA 2002)
Natural Gas Engines 2 cycle rich Natural Gas Ethylene Dibromide* 2.13E-05 lb/MMscf 4.13E-04 AP-42, Section 3.2 (U.S. EPA 2002)
Natural Gas Engines 2 cycle rich Natural Gas Formaldehyde 2.05E-02 lb/MMscf 3.98E-01 AP-42, Section 3.2 (U.S. EPA 2002)
Natural Gas Engines 2 cycle rich Natural Gas Hexane 1.80E+00 lb/MMscf 3.49E+01 AP-42, Section 3.2 (U.S. EPA 2002) Natural Gas Combustion

C-12
Table C-1. HAP Factors (Cont.)
Source Category Fuel Type Pollutant Emission Factors
Emission
Factor Unit % VOC Emission Factor Source
Natural Gas Engines 2 cycle rich Natural Gas Methanol 3.06E-03 lb/MMscf 5.94E-02 AP-42, Section 3.2 (U.S. EPA 2002)
Natural Gas Engines 2 cycle rich Natural Gas Methylene Chloride 4.12E-05 lb/MMscf 8.00E-04 AP-42, Section 3.2 (U.S. EPA 2002)
Natural Gas Engines 2 cycle rich Natural Gas 2-Methylnaphthalene 2.40E-05 lb/MMscf 4.66E-04 AP-42, Section 3.2 (U.S. EPA 2002)
Natural Gas Combustion
Natural Gas Engines 2 cycle rich Natural Gas 3-Methylchloranthrene* 1.80E-06 lb/MMscf 3.49E-05 AP-42, Section 3.2 (U.S. EPA 2002) Natural Gas Combustion
Natural Gas Engines 2 cycle rich Natural Gas Naphthalene* 9.71E-05 lb/MMBtu 1.88E-03 AP-42, Section 3.2 (U.S. EPA 2002)
Natural Gas Engines 2 cycle rich Natural Gas Propylene 0.016842105 lb/MMBtu 3.27E-01
Air Resources Board. California Environmental Protection Agency. http://www.arb.ca.gov/app/emsinv/cate
f_form.html
Natural Gas Engines 2 cycle rich Natural Gas Styrene* 1.19E-05 lb/MMBtu 2.31E-04 AP-42, Section 3.2 (U.S. EPA 2002)
Natural Gas Engines 2 cycle rich Natural Gas 1,1,2,2-Tetrachloroethane 2.53E-05 lb/MMBtu 4.91E-04 AP-42, Section 3.2 (U.S. EPA 2002)
Natural Gas Engines 2 cycle rich Natural Gas Toluene 5.58E-04 lb/MMBtu 1.08E-02 AP-42, Section 3.2 (U.S. EPA 2002)
Natural Gas Engines 2 cycle rich Natural Gas 1,1,2-Trichloroethane* 1.53E-05 lb/MMBtu 2.97E-04 AP-42, Section 3.2 (U.S. EPA 2002)
Natural Gas Engines 2 cycle rich Natural Gas Vinyl Chloride* 7.18E-06 lb/MMBtu 1.39E-04 AP-42, Section 3.2 (U.S. EPA 2002)
Natural Gas Engines 2 cycle rich Natural Gas Xylenes (isomers and mixture) 1.95E-04 lb/MMBtu 3.78E-03 AP-42, Section 3.2 (U.S. EPA 2002)
Natural Gas Engines 2 cycle rich Natural Gas o-Xylenes 0.01 EPA Speciate 4.2 Database
Natural Gas Engines 2 cycle rich Natural Gas m-Xylenes 0.01 EPA Speciate 4.2 Database
Natural Gas Engines 2 cycle rich Natural Gas PM 3.84E-02 lb/MMscf AP-42, Section 5.2 (U.S. EPA 2002)
Natural Gas Engines 2 cycle rich Natural Gas Acenaphthene* 1.80E-06 lb/MMscf 4.69E-03 AP-42, Section 3.2 (U.S. EPA 2002) Natural Gas Combustion
Natural Gas Engines 2 cycle rich Natural Gas Acenaphthylene* 1.80E-06 lb/MMscf 4.69E-03 AP-42, Section 3.2 (U.S. EPA 2002) Natural Gas Combustion
Natural Gas Engines 2 cycle rich Natural Gas Anthracene* 2.40E-06 lb/MMscf 6.25E-03 AP-42, Section 3.2 (U.S. EPA 2002) Natural Gas Combustion
Natural Gas Engines 2 cycle rich Natural Gas Benz(a)anthracene* 1.80E-06 lb/MMscf 4.69E-03 AP-42, Section 3.2 (U.S. EPA 2002) Natural Gas Combustion
Natural Gas Engines 2 cycle rich Natural Gas Benzo(a)pyrene* 1.20E-06 lb/MMscf 3.13E-03 AP-42, Section 3.2 (U.S. EPA 2002) Natural Gas Combustion
Natural Gas Engines 2 cycle rich Natural Gas Benzo(b)fluoranthene* 1.80E-06 lb/MMscf 4.69E-03 AP-42, Section 3.2 (U.S. EPA 2002) Natural Gas Combustion
Natural Gas Engines 2 cycle rich Natural Gas Benzo(g,h,i)perylene* 1.20E-06 lb/MMscf 3.13E-03 AP-42, Section 3.2 (U.S. EPA 2002) Natural Gas Combustion

C-13
Table C-1. HAP Factors (Cont.)
Source Category Fuel Type Pollutant Emission Factors
Emission
Factor Unit % VOC Emission Factor Source
Natural Gas Engines 2 cycle rich Natural Gas Benzo(k)fluoranthene* 1.80E-06 lb/MMscf 4.69E-03 AP-42, Section 3.2 (U.S. EPA 2002) Natural Gas Combustion
Natural Gas Engines 2 cycle rich Natural Gas Chrysene* 1.80E-06 lb/MMscf 4.69E-03 AP-42, Section 3.2 (U.S. EPA 2002) Natural Gas Combustion
Natural Gas Engines 2 cycle rich Natural Gas Dibenzo(a,h)anthracene* 1.20E-06 lb/MMscf 3.13E-03 AP-42, Section 3.2 (U.S. EPA 2002) Natural Gas Combustion
Natural Gas Engines 2 cycle rich Natural Gas Fluoranthene 3.00E-06 lb/MMscf 7.81E-03 AP-42, Section 3.2 (U.S. EPA 2002) Natural Gas Combustion
Natural Gas Engines 2 cycle rich Natural Gas Fluorene 2.80E-06 lb/MMscf 7.29E-03 AP-42, Section 3.2 (U.S. EPA 2002) Natural Gas Combustion
Natural Gas Engines 2 cycle rich Natural Gas Indeno(1,2,3-cd_pyrene* 1.80E-06 lb/MMscf 4.69E-03 AP-42, Section 3.2 (U.S. EPA 2002) Natural Gas Combustion
Natural Gas Engines 2 cycle rich Natural Gas Phenanathrene 1.75E-05 lb/MMscf 4.56E-02 AP-42, Section 3.2 (U.S. EPA 2002) Natural Gas Combustion
Natural Gas Engines 2 cycle rich Natural Gas Pyrene 5.00E-06 lb/MMscf 1.30E-02 AP-42, Section 3.2 (U.S. EPA 2002) Natural Gas Combustion
Natural Gas Engines 4 cycle clean Natural Gas VOC 0.12 lb/MMBtu AP-42, Section 3.2 (U.S. EPA 2002)
Natural Gas Engines 4 cycle clean Natural Gas Acetaldehyde 2.79E-03 lb/MMscf 2.33E+00 AP-42, Section 3.2 (U.S. EPA 2002)
Natural Gas Engines 4 cycle clean Natural Gas Acrolein 2.63E-03 lb/MMscf 2.19E+00 AP-42, Section 3.2 (U.S. EPA 2002)
Natural Gas Engines 4 cycle clean Natural Gas Benzene 1.58E-03 lb/MMscf 1.32E+00 AP-42, Section 3.2 (U.S. EPA 2002)
Natural Gas Engines 4 cycle clean Natural Gas 1,3-Butadiene 6.63E-04 lb/MMBtu 5.53E-01 AP-42, Section 3.2 (U.S. EPA 2002)
Natural Gas Engines 4 cycle clean Natural Gas Carbon Tetrachloride* 1.77E-05 lb/MMBtu 1.48E-02 AP-42, Section 3.2 (U.S. EPA 2002)
Natural Gas Engines 4 cycle clean Natural Gas Chlorobenzene* 1.29E-05 lb/MMBtu 1.08E-02 AP-42, Section 3.2 (U.S. EPA 2002)
Natural Gas Engines 4 cycle clean Natural Gas Chloroform* 1.37E-05 lb/MMBtu 1.14E-02 AP-42, Section 3.2 (U.S. EPA 2002)
Natural Gas Engines 4 cycle clean Natural Gas Dichlorobenzene 1.20E-03 lb/MMscf 1.00E+00
AP-42, Section 3.2 (U.S. EPA 2002) Natural Gas Combustion
Natural Gas Engines 4 cycle clean Natural Gas 1,3-Dichloropropene* 1.27E-05 lb/MMBtu 1.06E-02 AP-42, Section 3.2 (U.S. EPA 2002)

C-14
Table C-1. HAP Factors (Cont.)
Source Category Fuel Type Pollutant Emission Factors
Emission
Factor Unit % VOC Emission Factor Source
Natural Gas Engines 4 cycle clean Natural Gas 7,12-Dimethylbenz(a)anthracene* 1.60E-05 lb/MMscf 1.33E-02
AP-42, Section 3.2 (U.S. EPA 2002) Natural Gas Combustion
Natural Gas Engines 4 cycle clean Natural Gas Ethylbenzene* 2.48E-05 lb/MMscf 2.07E-02 AP-42, Section 3.2 (U.S. EPA 2002)
Natural Gas Engines 4 cycle clean Natural Gas Ethylene Dibromide* 2.13E-05 lb/MMscf 1.78E-02 AP-42, Section 3.2 (U.S. EPA 2002)
Natural Gas Engines 4 cycle clean Natural Gas Formaldehyde 2.05E-02 lb/MMscf 1.71E+01 AP-42, Section 3.2 (U.S. EPA 2002)
Natural Gas Engines 4 cycle clean Natural Gas Methanol 3.06E-03 lb/MMscf 2.55E+00 AP-42, Section 3.2 (U.S. EPA 2002)
Natural Gas Engines 4 cycle clean Natural Gas Methylene Chloride 4.12E-05 lb/MMscf 3.43E-02 AP-42, Section 3.2 (U.S. EPA 2002)
Natural Gas Engines 4 cycle clean Natural Gas 2-Methylnaphthalene 2.40E-05 lb/MMscf 2.00E-02
AP-42, Section 3.2 (U.S. EPA 2002) Natural Gas Combustion
Natural Gas Engines 4 cycle clean Natural Gas 3-Methylchloranthrene* 1.80E-06 lb/MMscf 1.50E-03
AP-42, Section 3.2 (U.S. EPA 2002) Natural Gas Combustion
Natural Gas Engines 4 cycle clean Natural Gas Naphthalene* 9.71E-05 lb/MMBtu 8.09E-02 AP-42, Section 3.2 (U.S. EPA 2002)
Natural Gas Engines 4 cycle clean Natural Gas n-Hexane 0.00E+00 EPA Speciate 4.2 Database
Natural Gas Engines 4 cycle clean Natural Gas Propylene 0.016842105 lb/MMBtu 1.40E+01
Air Resources Board. California Environmental Protection Agency. http://www.arb.ca.gov/app/emsinv/catef_form.html
Natural Gas Engines 4 cycle clean Natural Gas Styrene* 1.19E-05 lb/MMBtu 9.92E-03 AP-42, Section 3.2 (U.S. EPA 2002)
Natural Gas Engines 4 cycle
clean Natural Gas 1,1,2,2-Tetrachloroethane 2.53E-05 lb/MMBtu 2.11E-02 AP-42, Section 3.2 (U.S. EPA 2002)
Natural Gas Engines 4 cycle clean Natural Gas Toluene 5.58E-04 lb/MMBtu 4.65E-01 AP-42, Section 3.2 (U.S. EPA 2002)
Natural Gas Engines 4 cycle clean Natural Gas 1,1,2-Trichloroethane* 1.53E-05 lb/MMBtu 1.28E-02 AP-42, Section 3.2 (U.S. EPA 2002)
Natural Gas Engines 4 cycle clean Natural Gas Vinyl Chloride* 7.18E-06 lb/MMBtu 5.98E-03 AP-42, Section 3.2 (U.S. EPA 2002)
Natural Gas Engines 4 cycle clean Natural Gas Xylenes (isomers and mixture) 1.95E-04 lb/MMBtu 1.63E-01 AP-42, Section 3.2 (U.S. EPA 2002)
Natural Gas Engines 4 cycle clean Natural Gas o-Xylenes 0.01 EPA Speciate 4.2 Database
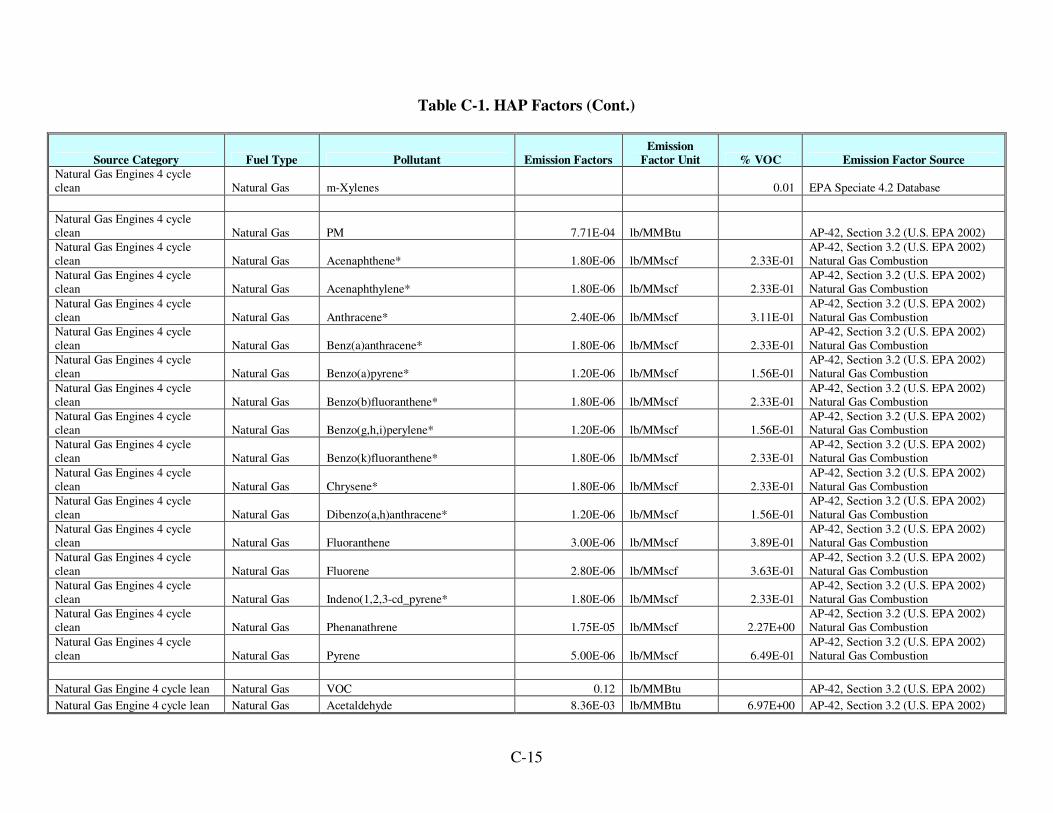
C-15
Table C-1. HAP Factors (Cont.)
Source Category Fuel Type Pollutant Emission Factors
Emission
Factor Unit % VOC Emission Factor Source
Natural Gas Engines 4 cycle clean Natural Gas m-Xylenes 0.01 EPA Speciate 4.2 Database
Natural Gas Engines 4 cycle clean Natural Gas PM 7.71E-04 lb/MMBtu AP-42, Section 3.2 (U.S. EPA 2002)
Natural Gas Engines 4 cycle clean Natural Gas Acenaphthene* 1.80E-06 lb/MMscf 2.33E-01
AP-42, Section 3.2 (U.S. EPA 2002) Natural Gas Combustion
Natural Gas Engines 4 cycle clean Natural Gas Acenaphthylene* 1.80E-06 lb/MMscf 2.33E-01
AP-42, Section 3.2 (U.S. EPA 2002) Natural Gas Combustion
Natural Gas Engines 4 cycle clean Natural Gas Anthracene* 2.40E-06 lb/MMscf 3.11E-01
AP-42, Section 3.2 (U.S. EPA 2002) Natural Gas Combustion
Natural Gas Engines 4 cycle clean Natural Gas Benz(a)anthracene* 1.80E-06 lb/MMscf 2.33E-01
AP-42, Section 3.2 (U.S. EPA 2002) Natural Gas Combustion
Natural Gas Engines 4 cycle clean Natural Gas Benzo(a)pyrene* 1.20E-06 lb/MMscf 1.56E-01
AP-42, Section 3.2 (U.S. EPA 2002) Natural Gas Combustion
Natural Gas Engines 4 cycle clean Natural Gas Benzo(b)fluoranthene* 1.80E-06 lb/MMscf 2.33E-01
AP-42, Section 3.2 (U.S. EPA 2002) Natural Gas Combustion
Natural Gas Engines 4 cycle clean Natural Gas Benzo(g,h,i)perylene* 1.20E-06 lb/MMscf 1.56E-01
AP-42, Section 3.2 (U.S. EPA 2002) Natural Gas Combustion
Natural Gas Engines 4 cycle clean Natural Gas Benzo(k)fluoranthene* 1.80E-06 lb/MMscf 2.33E-01
AP-42, Section 3.2 (U.S. EPA 2002) Natural Gas Combustion
Natural Gas Engines 4 cycle clean Natural Gas Chrysene* 1.80E-06 lb/MMscf 2.33E-01
AP-42, Section 3.2 (U.S. EPA 2002) Natural Gas Combustion
Natural Gas Engines 4 cycle clean Natural Gas Dibenzo(a,h)anthracene* 1.20E-06 lb/MMscf 1.56E-01
AP-42, Section 3.2 (U.S. EPA 2002) Natural Gas Combustion
Natural Gas Engines 4 cycle clean Natural Gas Fluoranthene 3.00E-06 lb/MMscf 3.89E-01
AP-42, Section 3.2 (U.S. EPA 2002) Natural Gas Combustion
Natural Gas Engines 4 cycle clean Natural Gas Fluorene 2.80E-06 lb/MMscf 3.63E-01
AP-42, Section 3.2 (U.S. EPA 2002) Natural Gas Combustion
Natural Gas Engines 4 cycle clean Natural Gas Indeno(1,2,3-cd_pyrene* 1.80E-06 lb/MMscf 2.33E-01
AP-42, Section 3.2 (U.S. EPA 2002) Natural Gas Combustion
Natural Gas Engines 4 cycle clean Natural Gas Phenanathrene 1.75E-05 lb/MMscf 2.27E+00
AP-42, Section 3.2 (U.S. EPA 2002) Natural Gas Combustion
Natural Gas Engines 4 cycle clean Natural Gas Pyrene 5.00E-06 lb/MMscf 6.49E-01
AP-42, Section 3.2 (U.S. EPA 2002) Natural Gas Combustion
Natural Gas Engine 4 cycle lean Natural Gas VOC 0.12 lb/MMBtu AP-42, Section 3.2 (U.S. EPA 2002)
Natural Gas Engine 4 cycle lean Natural Gas Acetaldehyde 8.36E-03 lb/MMBtu 6.97E+00 AP-42, Section 3.2 (U.S. EPA 2002)
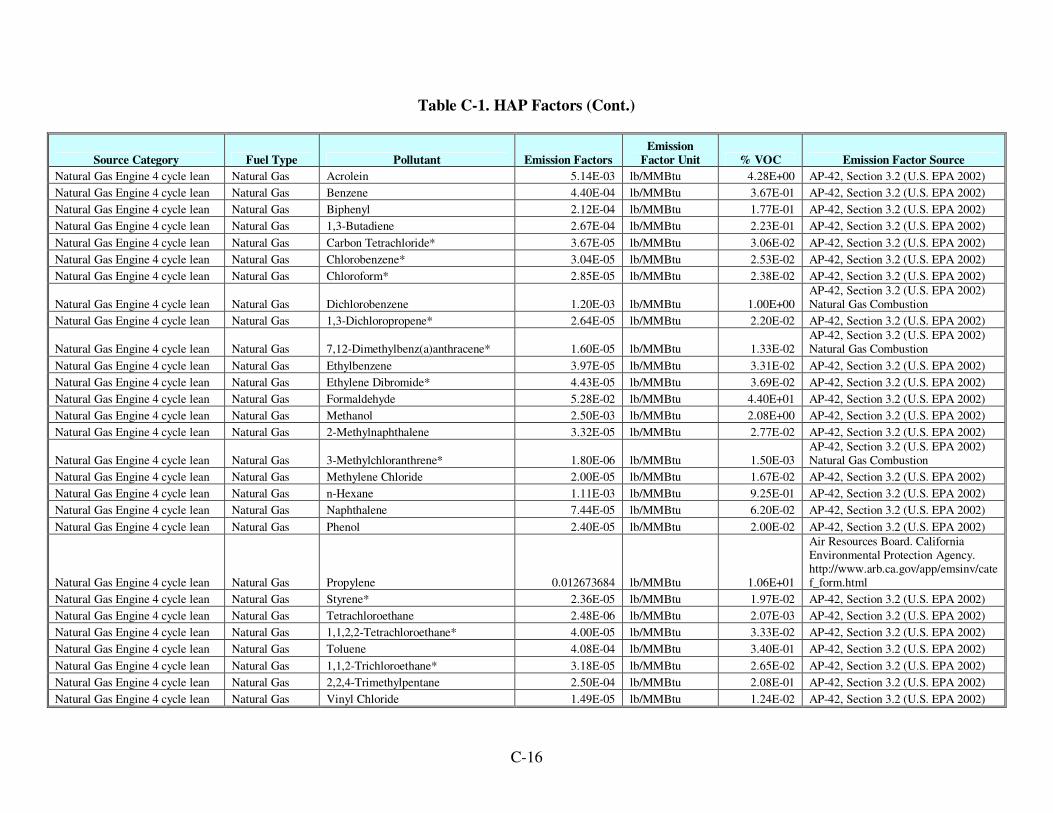
C-16
Table C-1. HAP Factors (Cont.)
Source Category Fuel Type Pollutant Emission Factors
Emission
Factor Unit % VOC Emission Factor Source
Natural Gas Engine 4 cycle lean Natural Gas Acrolein 5.14E-03 lb/MMBtu 4.28E+00 AP-42, Section 3.2 (U.S. EPA 2002)
Natural Gas Engine 4 cycle lean Natural Gas Benzene 4.40E-04 lb/MMBtu 3.67E-01 AP-42, Section 3.2 (U.S. EPA 2002)
Natural Gas Engine 4 cycle lean Natural Gas Biphenyl 2.12E-04 lb/MMBtu 1.77E-01 AP-42, Section 3.2 (U.S. EPA 2002)
Natural Gas Engine 4 cycle lean Natural Gas 1,3-Butadiene 2.67E-04 lb/MMBtu 2.23E-01 AP-42, Section 3.2 (U.S. EPA 2002)
Natural Gas Engine 4 cycle lean Natural Gas Carbon Tetrachloride* 3.67E-05 lb/MMBtu 3.06E-02 AP-42, Section 3.2 (U.S. EPA 2002)
Natural Gas Engine 4 cycle lean Natural Gas Chlorobenzene* 3.04E-05 lb/MMBtu 2.53E-02 AP-42, Section 3.2 (U.S. EPA 2002)
Natural Gas Engine 4 cycle lean Natural Gas Chloroform* 2.85E-05 lb/MMBtu 2.38E-02 AP-42, Section 3.2 (U.S. EPA 2002)
Natural Gas Engine 4 cycle lean Natural Gas Dichlorobenzene 1.20E-03 lb/MMBtu 1.00E+00 AP-42, Section 3.2 (U.S. EPA 2002) Natural Gas Combustion
Natural Gas Engine 4 cycle lean Natural Gas 1,3-Dichloropropene* 2.64E-05 lb/MMBtu 2.20E-02 AP-42, Section 3.2 (U.S. EPA 2002)
Natural Gas Engine 4 cycle lean Natural Gas 7,12-Dimethylbenz(a)anthracene* 1.60E-05 lb/MMBtu 1.33E-02 AP-42, Section 3.2 (U.S. EPA 2002) Natural Gas Combustion
Natural Gas Engine 4 cycle lean Natural Gas Ethylbenzene 3.97E-05 lb/MMBtu 3.31E-02 AP-42, Section 3.2 (U.S. EPA 2002)
Natural Gas Engine 4 cycle lean Natural Gas Ethylene Dibromide* 4.43E-05 lb/MMBtu 3.69E-02 AP-42, Section 3.2 (U.S. EPA 2002)
Natural Gas Engine 4 cycle lean Natural Gas Formaldehyde 5.28E-02 lb/MMBtu 4.40E+01 AP-42, Section 3.2 (U.S. EPA 2002)
Natural Gas Engine 4 cycle lean Natural Gas Methanol 2.50E-03 lb/MMBtu 2.08E+00 AP-42, Section 3.2 (U.S. EPA 2002)
Natural Gas Engine 4 cycle lean Natural Gas 2-Methylnaphthalene 3.32E-05 lb/MMBtu 2.77E-02 AP-42, Section 3.2 (U.S. EPA 2002)
Natural Gas Engine 4 cycle lean Natural Gas 3-Methylchloranthrene* 1.80E-06 lb/MMBtu 1.50E-03 AP-42, Section 3.2 (U.S. EPA 2002) Natural Gas Combustion
Natural Gas Engine 4 cycle lean Natural Gas Methylene Chloride 2.00E-05 lb/MMBtu 1.67E-02 AP-42, Section 3.2 (U.S. EPA 2002)
Natural Gas Engine 4 cycle lean Natural Gas n-Hexane 1.11E-03 lb/MMBtu 9.25E-01 AP-42, Section 3.2 (U.S. EPA 2002)
Natural Gas Engine 4 cycle lean Natural Gas Naphthalene 7.44E-05 lb/MMBtu 6.20E-02 AP-42, Section 3.2 (U.S. EPA 2002)
Natural Gas Engine 4 cycle lean Natural Gas Phenol 2.40E-05 lb/MMBtu 2.00E-02 AP-42, Section 3.2 (U.S. EPA 2002)
Natural Gas Engine 4 cycle lean Natural Gas Propylene 0.012673684 lb/MMBtu 1.06E+01
Air Resources Board. California Environmental Protection Agency. http://www.arb.ca.gov/app/emsinv/catef_form.html
Natural Gas Engine 4 cycle lean Natural Gas Styrene* 2.36E-05 lb/MMBtu 1.97E-02 AP-42, Section 3.2 (U.S. EPA 2002)
Natural Gas Engine 4 cycle lean Natural Gas Tetrachloroethane 2.48E-06 lb/MMBtu 2.07E-03 AP-42, Section 3.2 (U.S. EPA 2002)
Natural Gas Engine 4 cycle lean Natural Gas 1,1,2,2-Tetrachloroethane* 4.00E-05 lb/MMBtu 3.33E-02 AP-42, Section 3.2 (U.S. EPA 2002)
Natural Gas Engine 4 cycle lean Natural Gas Toluene 4.08E-04 lb/MMBtu 3.40E-01 AP-42, Section 3.2 (U.S. EPA 2002)
Natural Gas Engine 4 cycle lean Natural Gas 1,1,2-Trichloroethane* 3.18E-05 lb/MMBtu 2.65E-02 AP-42, Section 3.2 (U.S. EPA 2002)
Natural Gas Engine 4 cycle lean Natural Gas 2,2,4-Trimethylpentane 2.50E-04 lb/MMBtu 2.08E-01 AP-42, Section 3.2 (U.S. EPA 2002)
Natural Gas Engine 4 cycle lean Natural Gas Vinyl Chloride 1.49E-05 lb/MMBtu 1.24E-02 AP-42, Section 3.2 (U.S. EPA 2002)
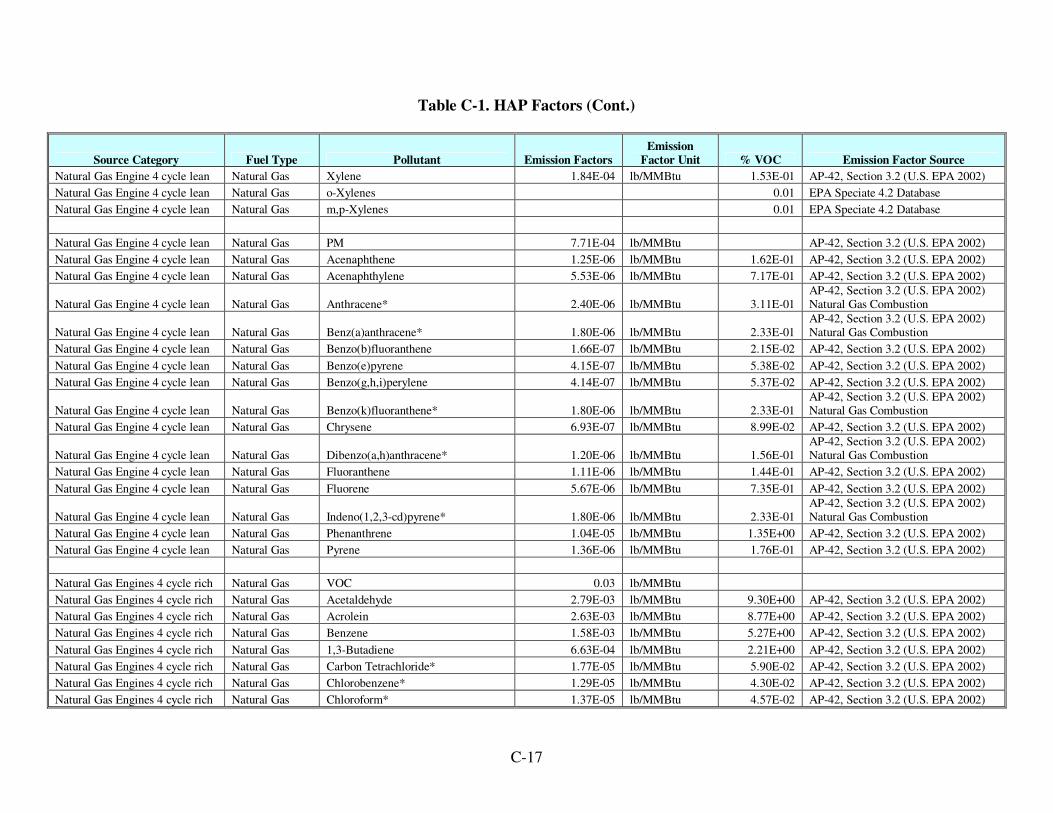
C-17
Table C-1. HAP Factors (Cont.)
Source Category Fuel Type Pollutant Emission Factors
Emission
Factor Unit % VOC Emission Factor Source
Natural Gas Engine 4 cycle lean Natural Gas Xylene 1.84E-04 lb/MMBtu 1.53E-01 AP-42, Section 3.2 (U.S. EPA 2002)
Natural Gas Engine 4 cycle lean Natural Gas o-Xylenes 0.01 EPA Speciate 4.2 Database
Natural Gas Engine 4 cycle lean Natural Gas m,p-Xylenes 0.01 EPA Speciate 4.2 Database
Natural Gas Engine 4 cycle lean Natural Gas PM 7.71E-04 lb/MMBtu AP-42, Section 3.2 (U.S. EPA 2002)
Natural Gas Engine 4 cycle lean Natural Gas Acenaphthene 1.25E-06 lb/MMBtu 1.62E-01 AP-42, Section 3.2 (U.S. EPA 2002)
Natural Gas Engine 4 cycle lean Natural Gas Acenaphthylene 5.53E-06 lb/MMBtu 7.17E-01 AP-42, Section 3.2 (U.S. EPA 2002)
Natural Gas Engine 4 cycle lean Natural Gas Anthracene* 2.40E-06 lb/MMBtu 3.11E-01 AP-42, Section 3.2 (U.S. EPA 2002) Natural Gas Combustion
Natural Gas Engine 4 cycle lean Natural Gas Benz(a)anthracene* 1.80E-06 lb/MMBtu 2.33E-01 AP-42, Section 3.2 (U.S. EPA 2002) Natural Gas Combustion
Natural Gas Engine 4 cycle lean Natural Gas Benzo(b)fluoranthene 1.66E-07 lb/MMBtu 2.15E-02 AP-42, Section 3.2 (U.S. EPA 2002)
Natural Gas Engine 4 cycle lean Natural Gas Benzo(e)pyrene 4.15E-07 lb/MMBtu 5.38E-02 AP-42, Section 3.2 (U.S. EPA 2002)
Natural Gas Engine 4 cycle lean Natural Gas Benzo(g,h,i)perylene 4.14E-07 lb/MMBtu 5.37E-02 AP-42, Section 3.2 (U.S. EPA 2002)
Natural Gas Engine 4 cycle lean Natural Gas Benzo(k)fluoranthene* 1.80E-06 lb/MMBtu 2.33E-01 AP-42, Section 3.2 (U.S. EPA 2002) Natural Gas Combustion
Natural Gas Engine 4 cycle lean Natural Gas Chrysene 6.93E-07 lb/MMBtu 8.99E-02 AP-42, Section 3.2 (U.S. EPA 2002)
Natural Gas Engine 4 cycle lean Natural Gas Dibenzo(a,h)anthracene* 1.20E-06 lb/MMBtu 1.56E-01 AP-42, Section 3.2 (U.S. EPA 2002) Natural Gas Combustion
Natural Gas Engine 4 cycle lean Natural Gas Fluoranthene 1.11E-06 lb/MMBtu 1.44E-01 AP-42, Section 3.2 (U.S. EPA 2002)
Natural Gas Engine 4 cycle lean Natural Gas Fluorene 5.67E-06 lb/MMBtu 7.35E-01 AP-42, Section 3.2 (U.S. EPA 2002)
Natural Gas Engine 4 cycle lean Natural Gas Indeno(1,2,3-cd)pyrene* 1.80E-06 lb/MMBtu 2.33E-01 AP-42, Section 3.2 (U.S. EPA 2002) Natural Gas Combustion
Natural Gas Engine 4 cycle lean Natural Gas Phenanthrene 1.04E-05 lb/MMBtu 1.35E+00 AP-42, Section 3.2 (U.S. EPA 2002)
Natural Gas Engine 4 cycle lean Natural Gas Pyrene 1.36E-06 lb/MMBtu 1.76E-01 AP-42, Section 3.2 (U.S. EPA 2002)
Natural Gas Engines 4 cycle rich Natural Gas VOC 0.03 lb/MMBtu
Natural Gas Engines 4 cycle rich Natural Gas Acetaldehyde 2.79E-03 lb/MMBtu 9.30E+00 AP-42, Section 3.2 (U.S. EPA 2002)
Natural Gas Engines 4 cycle rich Natural Gas Acrolein 2.63E-03 lb/MMBtu 8.77E+00 AP-42, Section 3.2 (U.S. EPA 2002)
Natural Gas Engines 4 cycle rich Natural Gas Benzene 1.58E-03 lb/MMBtu 5.27E+00 AP-42, Section 3.2 (U.S. EPA 2002)
Natural Gas Engines 4 cycle rich Natural Gas 1,3-Butadiene 6.63E-04 lb/MMBtu 2.21E+00 AP-42, Section 3.2 (U.S. EPA 2002)
Natural Gas Engines 4 cycle rich Natural Gas Carbon Tetrachloride* 1.77E-05 lb/MMBtu 5.90E-02 AP-42, Section 3.2 (U.S. EPA 2002)
Natural Gas Engines 4 cycle rich Natural Gas Chlorobenzene* 1.29E-05 lb/MMBtu 4.30E-02 AP-42, Section 3.2 (U.S. EPA 2002)
Natural Gas Engines 4 cycle rich Natural Gas Chloroform* 1.37E-05 lb/MMBtu 4.57E-02 AP-42, Section 3.2 (U.S. EPA 2002)
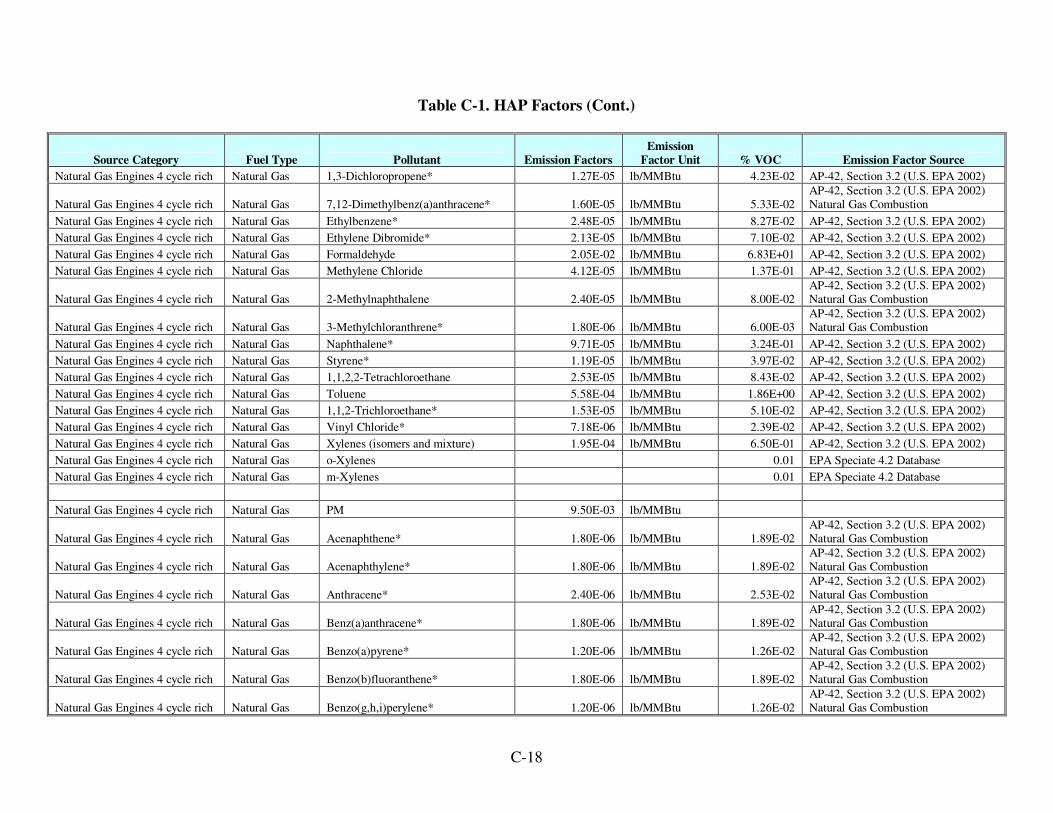
C-18
Table C-1. HAP Factors (Cont.)
Source Category Fuel Type Pollutant Emission Factors
Emission
Factor Unit % VOC Emission Factor Source
Natural Gas Engines 4 cycle rich Natural Gas 1,3-Dichloropropene* 1.27E-05 lb/MMBtu 4.23E-02 AP-42, Section 3.2 (U.S. EPA 2002)
Natural Gas Engines 4 cycle rich Natural Gas 7,12-Dimethylbenz(a)anthracene* 1.60E-05 lb/MMBtu 5.33E-02 AP-42, Section 3.2 (U.S. EPA 2002) Natural Gas Combustion
Natural Gas Engines 4 cycle rich Natural Gas Ethylbenzene* 2.48E-05 lb/MMBtu 8.27E-02 AP-42, Section 3.2 (U.S. EPA 2002)
Natural Gas Engines 4 cycle rich Natural Gas Ethylene Dibromide* 2.13E-05 lb/MMBtu 7.10E-02 AP-42, Section 3.2 (U.S. EPA 2002)
Natural Gas Engines 4 cycle rich Natural Gas Formaldehyde 2.05E-02 lb/MMBtu 6.83E+01 AP-42, Section 3.2 (U.S. EPA 2002)
Natural Gas Engines 4 cycle rich Natural Gas Methylene Chloride 4.12E-05 lb/MMBtu 1.37E-01 AP-42, Section 3.2 (U.S. EPA 2002)
Natural Gas Engines 4 cycle rich Natural Gas 2-Methylnaphthalene 2.40E-05 lb/MMBtu 8.00E-02 AP-42, Section 3.2 (U.S. EPA 2002) Natural Gas Combustion
Natural Gas Engines 4 cycle rich Natural Gas 3-Methylchloranthrene* 1.80E-06 lb/MMBtu 6.00E-03 AP-42, Section 3.2 (U.S. EPA 2002) Natural Gas Combustion
Natural Gas Engines 4 cycle rich Natural Gas Naphthalene* 9.71E-05 lb/MMBtu 3.24E-01 AP-42, Section 3.2 (U.S. EPA 2002)
Natural Gas Engines 4 cycle rich Natural Gas Styrene* 1.19E-05 lb/MMBtu 3.97E-02 AP-42, Section 3.2 (U.S. EPA 2002)
Natural Gas Engines 4 cycle rich Natural Gas 1,1,2,2-Tetrachloroethane 2.53E-05 lb/MMBtu 8.43E-02 AP-42, Section 3.2 (U.S. EPA 2002)
Natural Gas Engines 4 cycle rich Natural Gas Toluene 5.58E-04 lb/MMBtu 1.86E+00 AP-42, Section 3.2 (U.S. EPA 2002)
Natural Gas Engines 4 cycle rich Natural Gas 1,1,2-Trichloroethane* 1.53E-05 lb/MMBtu 5.10E-02 AP-42, Section 3.2 (U.S. EPA 2002)
Natural Gas Engines 4 cycle rich Natural Gas Vinyl Chloride* 7.18E-06 lb/MMBtu 2.39E-02 AP-42, Section 3.2 (U.S. EPA 2002)
Natural Gas Engines 4 cycle rich Natural Gas Xylenes (isomers and mixture) 1.95E-04 lb/MMBtu 6.50E-01 AP-42, Section 3.2 (U.S. EPA 2002)
Natural Gas Engines 4 cycle rich Natural Gas o-Xylenes 0.01 EPA Speciate 4.2 Database
Natural Gas Engines 4 cycle rich Natural Gas m-Xylenes 0.01 EPA Speciate 4.2 Database
Natural Gas Engines 4 cycle rich Natural Gas PM 9.50E-03 lb/MMBtu
Natural Gas Engines 4 cycle rich Natural Gas Acenaphthene* 1.80E-06 lb/MMBtu 1.89E-02 AP-42, Section 3.2 (U.S. EPA 2002) Natural Gas Combustion
Natural Gas Engines 4 cycle rich Natural Gas Acenaphthylene* 1.80E-06 lb/MMBtu 1.89E-02 AP-42, Section 3.2 (U.S. EPA 2002) Natural Gas Combustion
Natural Gas Engines 4 cycle rich Natural Gas Anthracene* 2.40E-06 lb/MMBtu 2.53E-02 AP-42, Section 3.2 (U.S. EPA 2002) Natural Gas Combustion
Natural Gas Engines 4 cycle rich Natural Gas Benz(a)anthracene* 1.80E-06 lb/MMBtu 1.89E-02 AP-42, Section 3.2 (U.S. EPA 2002) Natural Gas Combustion
Natural Gas Engines 4 cycle rich Natural Gas Benzo(a)pyrene* 1.20E-06 lb/MMBtu 1.26E-02 AP-42, Section 3.2 (U.S. EPA 2002) Natural Gas Combustion
Natural Gas Engines 4 cycle rich Natural Gas Benzo(b)fluoranthene* 1.80E-06 lb/MMBtu 1.89E-02 AP-42, Section 3.2 (U.S. EPA 2002) Natural Gas Combustion
Natural Gas Engines 4 cycle rich Natural Gas Benzo(g,h,i)perylene* 1.20E-06 lb/MMBtu 1.26E-02 AP-42, Section 3.2 (U.S. EPA 2002) Natural Gas Combustion
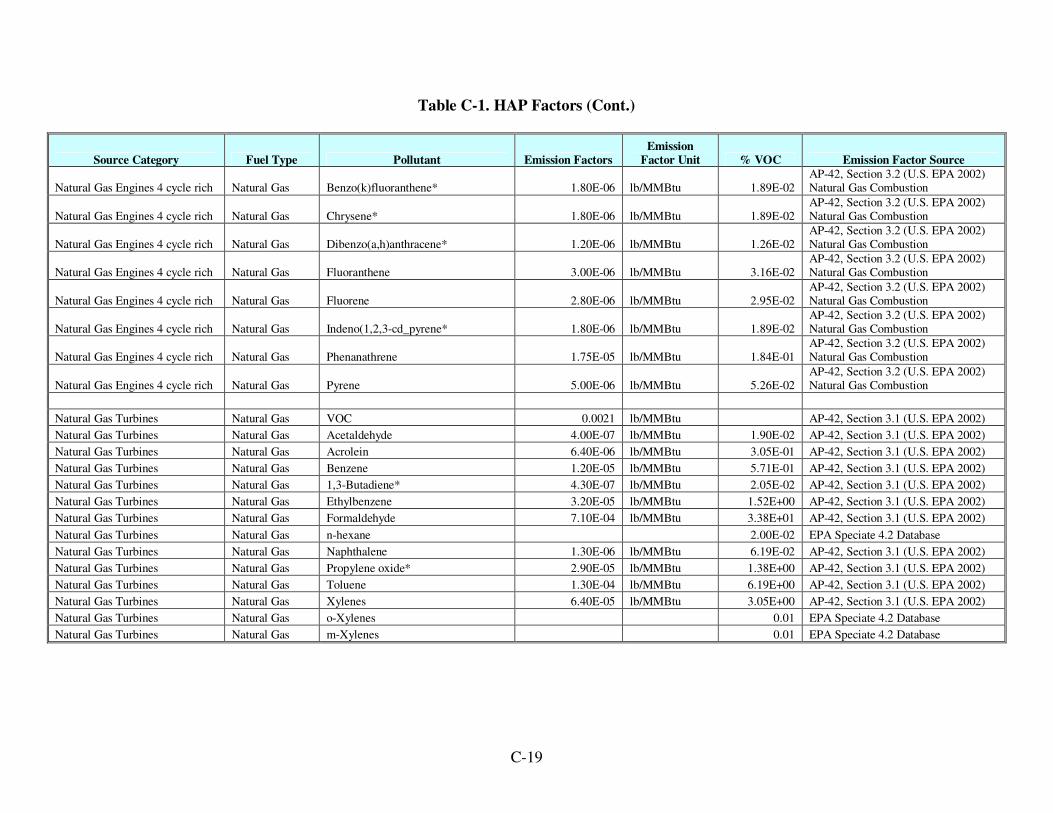
C-19
Table C-1. HAP Factors (Cont.)
Source Category Fuel Type Pollutant Emission Factors
Emission
Factor Unit % VOC Emission Factor Source
Natural Gas Engines 4 cycle rich Natural Gas Benzo(k)fluoranthene* 1.80E-06 lb/MMBtu 1.89E-02 AP-42, Section 3.2 (U.S. EPA 2002) Natural Gas Combustion
Natural Gas Engines 4 cycle rich Natural Gas Chrysene* 1.80E-06 lb/MMBtu 1.89E-02 AP-42, Section 3.2 (U.S. EPA 2002) Natural Gas Combustion
Natural Gas Engines 4 cycle rich Natural Gas Dibenzo(a,h)anthracene* 1.20E-06 lb/MMBtu 1.26E-02 AP-42, Section 3.2 (U.S. EPA 2002) Natural Gas Combustion
Natural Gas Engines 4 cycle rich Natural Gas Fluoranthene 3.00E-06 lb/MMBtu 3.16E-02 AP-42, Section 3.2 (U.S. EPA 2002) Natural Gas Combustion
Natural Gas Engines 4 cycle rich Natural Gas Fluorene 2.80E-06 lb/MMBtu 2.95E-02 AP-42, Section 3.2 (U.S. EPA 2002) Natural Gas Combustion
Natural Gas Engines 4 cycle rich Natural Gas Indeno(1,2,3-cd_pyrene* 1.80E-06 lb/MMBtu 1.89E-02 AP-42, Section 3.2 (U.S. EPA 2002) Natural Gas Combustion
Natural Gas Engines 4 cycle rich Natural Gas Phenanathrene 1.75E-05 lb/MMBtu 1.84E-01 AP-42, Section 3.2 (U.S. EPA 2002) Natural Gas Combustion
Natural Gas Engines 4 cycle rich Natural Gas Pyrene 5.00E-06 lb/MMBtu 5.26E-02 AP-42, Section 3.2 (U.S. EPA 2002) Natural Gas Combustion
Natural Gas Turbines Natural Gas VOC 0.0021 lb/MMBtu AP-42, Section 3.1 (U.S. EPA 2002)
Natural Gas Turbines Natural Gas Acetaldehyde 4.00E-07 lb/MMBtu 1.90E-02 AP-42, Section 3.1 (U.S. EPA 2002)
Natural Gas Turbines Natural Gas Acrolein 6.40E-06 lb/MMBtu 3.05E-01 AP-42, Section 3.1 (U.S. EPA 2002)
Natural Gas Turbines Natural Gas Benzene 1.20E-05 lb/MMBtu 5.71E-01 AP-42, Section 3.1 (U.S. EPA 2002)
Natural Gas Turbines Natural Gas 1,3-Butadiene* 4.30E-07 lb/MMBtu 2.05E-02 AP-42, Section 3.1 (U.S. EPA 2002)
Natural Gas Turbines Natural Gas Ethylbenzene 3.20E-05 lb/MMBtu 1.52E+00 AP-42, Section 3.1 (U.S. EPA 2002)
Natural Gas Turbines Natural Gas Formaldehyde 7.10E-04 lb/MMBtu 3.38E+01 AP-42, Section 3.1 (U.S. EPA 2002)
Natural Gas Turbines Natural Gas n-hexane 2.00E-02 EPA Speciate 4.2 Database
Natural Gas Turbines Natural Gas Naphthalene 1.30E-06 lb/MMBtu 6.19E-02 AP-42, Section 3.1 (U.S. EPA 2002)
Natural Gas Turbines Natural Gas Propylene oxide* 2.90E-05 lb/MMBtu 1.38E+00 AP-42, Section 3.1 (U.S. EPA 2002)
Natural Gas Turbines Natural Gas Toluene 1.30E-04 lb/MMBtu 6.19E+00 AP-42, Section 3.1 (U.S. EPA 2002)
Natural Gas Turbines Natural Gas Xylenes 6.40E-05 lb/MMBtu 3.05E+00 AP-42, Section 3.1 (U.S. EPA 2002)
Natural Gas Turbines Natural Gas o-Xylenes 0.01 EPA Speciate 4.2 Database
Natural Gas Turbines Natural Gas m-Xylenes 0.01 EPA Speciate 4.2 Database
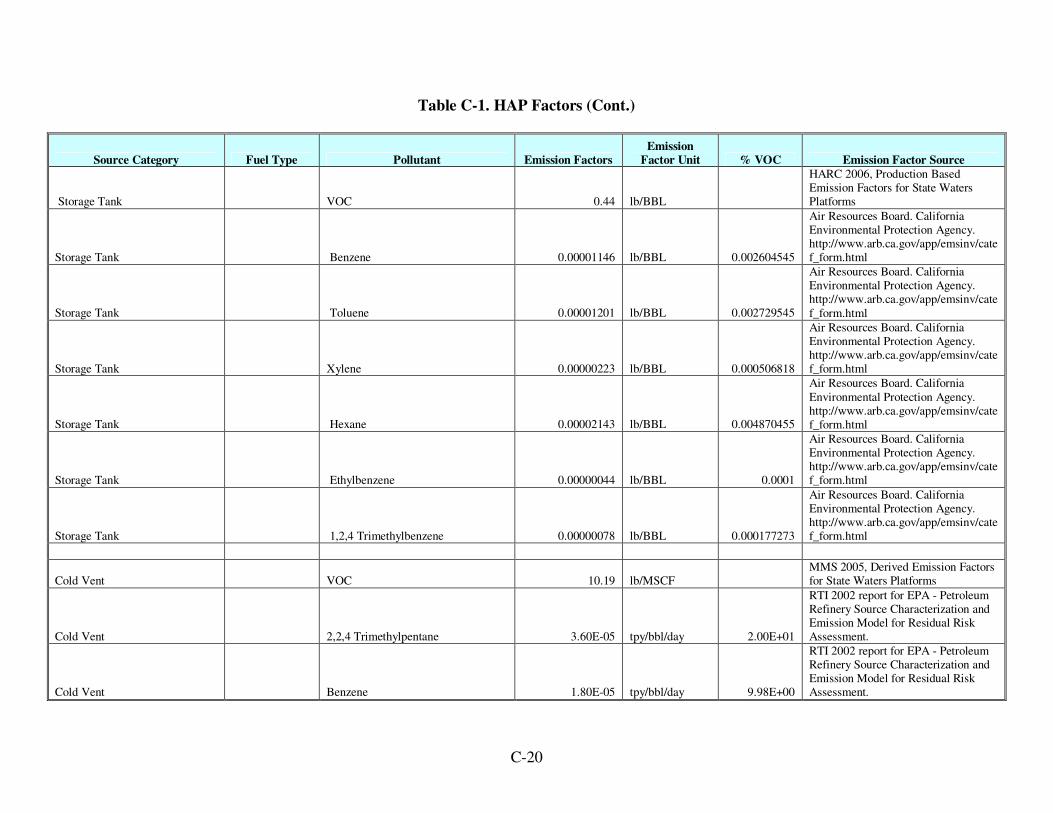
C-20
Table C-1. HAP Factors (Cont.)
Source Category Fuel Type Pollutant Emission Factors
Emission
Factor Unit % VOC Emission Factor Source
Storage Tank VOC 0.44 lb/BBL
HARC 2006, Production Based Emission Factors for State Waters Platforms
Storage Tank Benzene 0.00001146 lb/BBL 0.002604545
Air Resources Board. California Environmental Protection Agency. http://www.arb.ca.gov/app/emsinv/catef_form.html
Storage Tank Toluene 0.00001201 lb/BBL 0.002729545
Air Resources Board. California Environmental Protection Agency. http://www.arb.ca.gov/app/emsinv/cate
f_form.html
Storage Tank Xylene 0.00000223 lb/BBL 0.000506818
Air Resources Board. California Environmental Protection Agency. http://www.arb.ca.gov/app/emsinv/catef_form.html
Storage Tank Hexane 0.00002143 lb/BBL 0.004870455
Air Resources Board. California
Environmental Protection Agency. http://www.arb.ca.gov/app/emsinv/catef_form.html
Storage Tank Ethylbenzene 0.00000044 lb/BBL 0.0001
Air Resources Board. California Environmental Protection Agency. http://www.arb.ca.gov/app/emsinv/catef_form.html
Storage Tank 1,2,4 Trimethylbenzene 0.00000078 lb/BBL 0.000177273
Air Resources Board. California Environmental Protection Agency. http://www.arb.ca.gov/app/emsinv/catef_form.html
Cold Vent VOC 10.19 lb/MSCF MMS 2005, Derived Emission Factors for State Waters Platforms
Cold Vent 2,2,4 Trimethylpentane 3.60E-05 tpy/bbl/day 2.00E+01
RTI 2002 report for EPA - Petroleum Refinery Source Characterization and Emission Model for Residual Risk Assessment.
Cold Vent Benzene 1.80E-05 tpy/bbl/day 9.98E+00
RTI 2002 report for EPA - Petroleum Refinery Source Characterization and Emission Model for Residual Risk Assessment.

C-21
Table C-1. HAP Factors (Cont.)
Source Category Fuel Type Pollutant Emission Factors
Emission
Factor Unit % VOC Emission Factor Source
Cold Vent Cresols 5.30E-09 tpy/bbl/day 2.94E-03
RTI 2002 report for EPA - Petroleum Refinery Source Characterization and Emission Model for Residual Risk
Assessment.
Cold Vent Cumene 3.20E-07 tpy/bbl/day 1.77E-01
RTI 2002 report for EPA - Petroleum Refinery Source Characterization and Emission Model for Residual Risk Assessment.
Cold Vent Ethylbenzene 1.60E-06 tpy/bbl/day 8.87E-01
RTI 2002 report for EPA - Petroleum Refinery Source Characterization and
Emission Model for Residual Risk Assessment.
Cold Vent Hexane 9.00E-05 tpy/bbl/day 4.99E+01
RTI 2002 report for EPA - Petroleum Refinery Source Characterization and Emission Model for Residual Risk Assessment.
Cold Vent Methyl-t-butyl ether 1.10E-05 tpy/bbl/day 6.10E+00
RTI 2002 report for EPA - Petroleum Refinery Source Characterization and Emission Model for Residual Risk Assessment.
Cold Vent Naphthalene 1.20E-08 tpy/bbl/day 6.65E-03
RTI 2002 report for EPA - Petroleum Refinery Source Characterization and Emission Model for Residual Risk Assessment.
Cold Vent Phenol 1.20E-08 tpy/bbl/day 6.65E-03
RTI 2002 report for EPA - Petroleum Refinery Source Characterization and Emission Model for Residual Risk Assessment.
Cold Vent Styrene 2.60E-07 tpy/bbl/day 1.44E-01
RTI 2002 report for EPA - Petroleum Refinery Source Characterization and Emission Model for Residual Risk
Assessment.
Cold Vent Toluene 1.80E-05 tpy/bbl/day 9.98E+00
RTI 2002 report for EPA - Petroleum Refinery Source Characterization and Emission Model for Residual Risk Assessment.
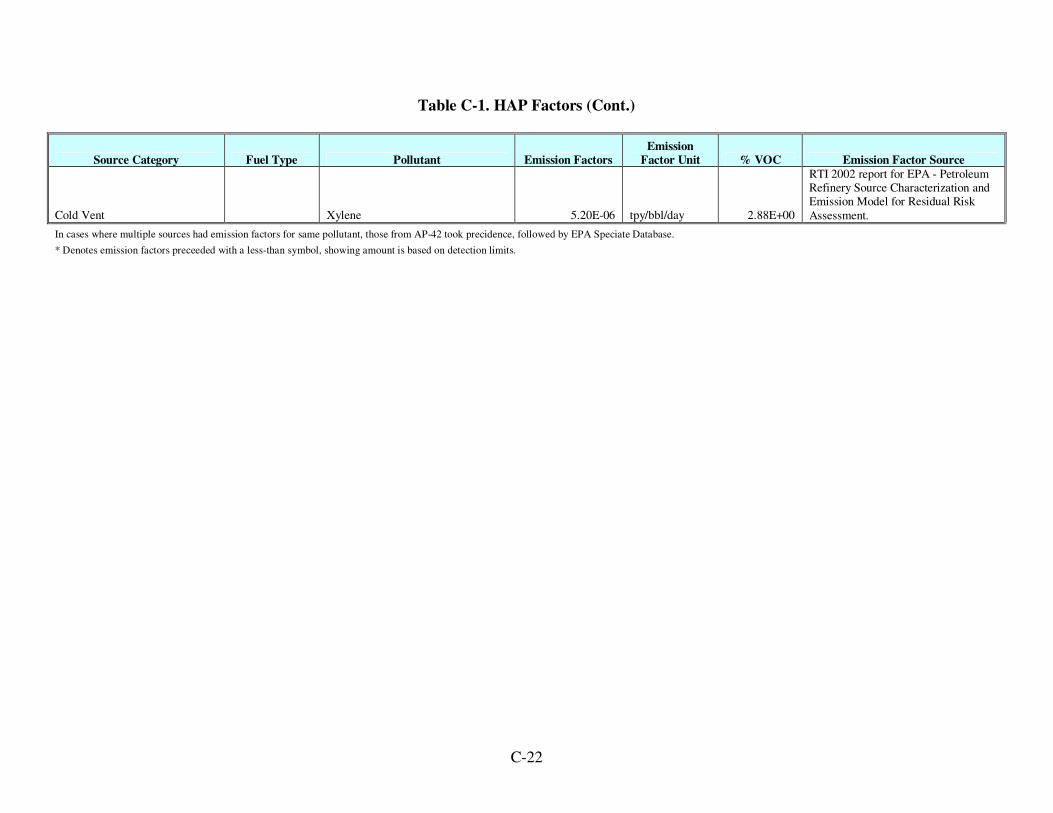
C-22
Table C-1. HAP Factors (Cont.)
Source Category Fuel Type Pollutant Emission Factors
Emission
Factor Unit % VOC Emission Factor Source
Cold Vent Xylene 5.20E-06 tpy/bbl/day 2.88E+00
RTI 2002 report for EPA - Petroleum Refinery Source Characterization and Emission Model for Residual Risk
Assessment.
In cases where multiple sources had emission factors for same pollutant, those from AP-42 took precidence, followed by EPA Speciate Database.
* Denotes emission factors preceeded with a less-than symbol, showing amount is based on detection limits.
Appendix D
Emission Estimates
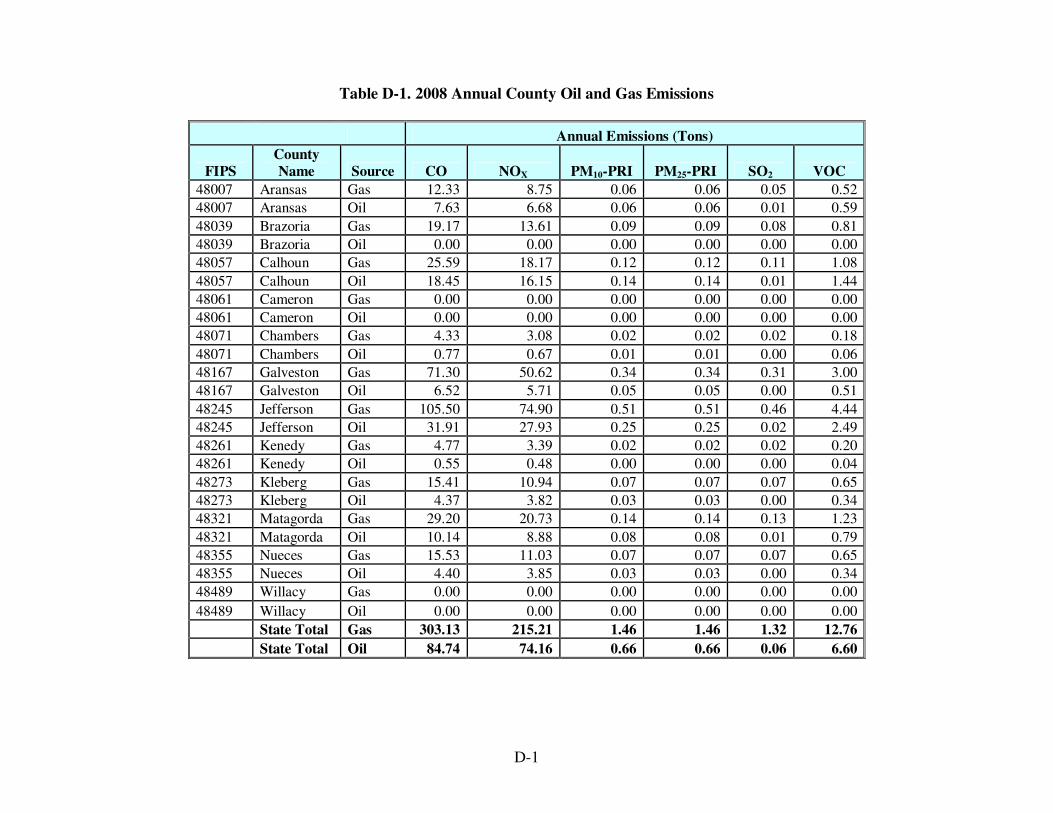
D-1
Table D-1. 2008 Annual County Oil and Gas Emissions
Annual Emissions (Tons)
FIPS
County
Name Source CO NOX PM10-PRI PM25-PRI SO2 VOC
48007 Aransas Gas 12.33 8.75 0.06 0.06 0.05 0.52
48007 Aransas Oil 7.63 6.68 0.06 0.06 0.01 0.59
48039 Brazoria Gas 19.17 13.61 0.09 0.09 0.08 0.81
48039 Brazoria Oil 0.00 0.00 0.00 0.00 0.00 0.00
48057 Calhoun Gas 25.59 18.17 0.12 0.12 0.11 1.08
48057 Calhoun Oil 18.45 16.15 0.14 0.14 0.01 1.44
48061 Cameron Gas 0.00 0.00 0.00 0.00 0.00 0.00
48061 Cameron Oil 0.00 0.00 0.00 0.00 0.00 0.00
48071 Chambers Gas 4.33 3.08 0.02 0.02 0.02 0.18
48071 Chambers Oil 0.77 0.67 0.01 0.01 0.00 0.06
48167 Galveston Gas 71.30 50.62 0.34 0.34 0.31 3.00
48167 Galveston Oil 6.52 5.71 0.05 0.05 0.00 0.51
48245 Jefferson Gas 105.50 74.90 0.51 0.51 0.46 4.44
48245 Jefferson Oil 31.91 27.93 0.25 0.25 0.02 2.49
48261 Kenedy Gas 4.77 3.39 0.02 0.02 0.02 0.20
48261 Kenedy Oil 0.55 0.48 0.00 0.00 0.00 0.04
48273 Kleberg Gas 15.41 10.94 0.07 0.07 0.07 0.65
48273 Kleberg Oil 4.37 3.82 0.03 0.03 0.00 0.34
48321 Matagorda Gas 29.20 20.73 0.14 0.14 0.13 1.23
48321 Matagorda Oil 10.14 8.88 0.08 0.08 0.01 0.79
48355 Nueces Gas 15.53 11.03 0.07 0.07 0.07 0.65
48355 Nueces Oil 4.40 3.85 0.03 0.03 0.00 0.34
48489 Willacy Gas 0.00 0.00 0.00 0.00 0.00 0.00
48489 Willacy Oil 0.00 0.00 0.00 0.00 0.00 0.00
State Total Gas 303.13 215.21 1.46 1.46 1.32 12.76
State Total Oil 84.74 74.16 0.66 0.66 0.06 6.60
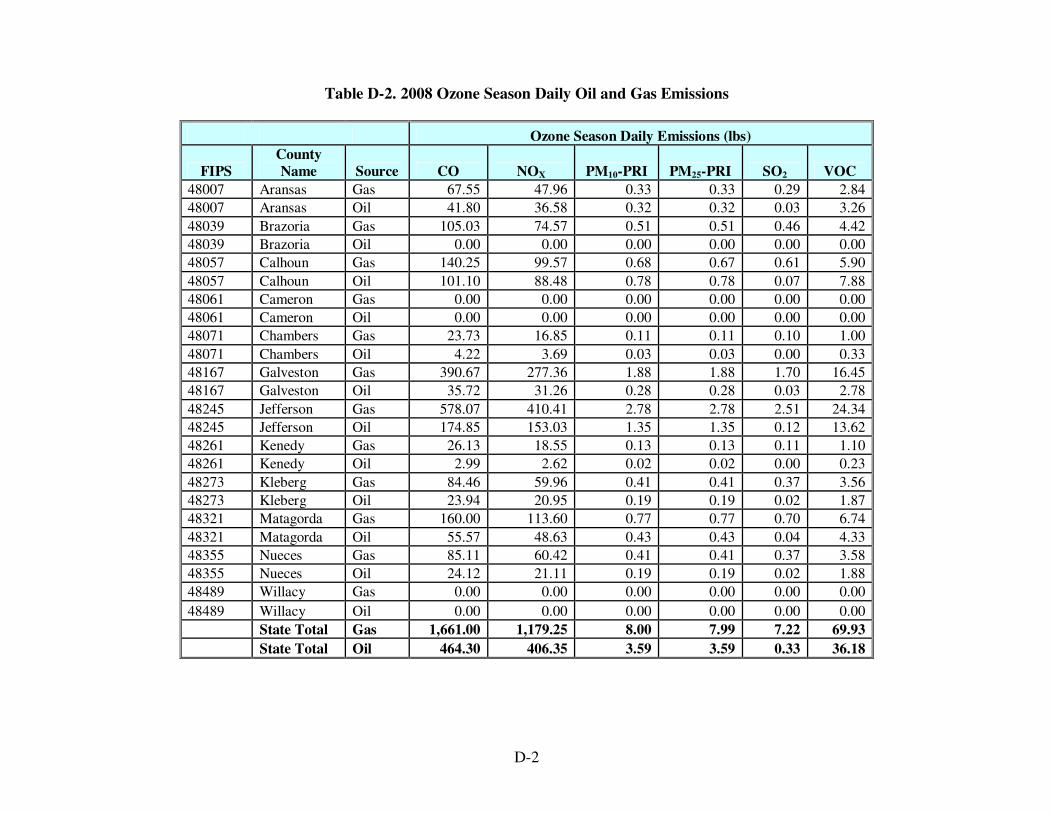
D-2
Table D-2. 2008 Ozone Season Daily Oil and Gas Emissions
Ozone Season Daily Emissions (lbs)
FIPS
County
Name Source CO NOX PM10-PRI PM25-PRI SO2 VOC
48007 Aransas Gas 67.55 47.96 0.33 0.33 0.29 2.84
48007 Aransas Oil 41.80 36.58 0.32 0.32 0.03 3.26
48039 Brazoria Gas 105.03 74.57 0.51 0.51 0.46 4.42
48039 Brazoria Oil 0.00 0.00 0.00 0.00 0.00 0.00
48057 Calhoun Gas 140.25 99.57 0.68 0.67 0.61 5.90
48057 Calhoun Oil 101.10 88.48 0.78 0.78 0.07 7.88
48061 Cameron Gas 0.00 0.00 0.00 0.00 0.00 0.00
48061 Cameron Oil 0.00 0.00 0.00 0.00 0.00 0.00
48071 Chambers Gas 23.73 16.85 0.11 0.11 0.10 1.00
48071 Chambers Oil 4.22 3.69 0.03 0.03 0.00 0.33
48167 Galveston Gas 390.67 277.36 1.88 1.88 1.70 16.45
48167 Galveston Oil 35.72 31.26 0.28 0.28 0.03 2.78
48245 Jefferson Gas 578.07 410.41 2.78 2.78 2.51 24.34
48245 Jefferson Oil 174.85 153.03 1.35 1.35 0.12 13.62
48261 Kenedy Gas 26.13 18.55 0.13 0.13 0.11 1.10
48261 Kenedy Oil 2.99 2.62 0.02 0.02 0.00 0.23
48273 Kleberg Gas 84.46 59.96 0.41 0.41 0.37 3.56
48273 Kleberg Oil 23.94 20.95 0.19 0.19 0.02 1.87
48321 Matagorda Gas 160.00 113.60 0.77 0.77 0.70 6.74
48321 Matagorda Oil 55.57 48.63 0.43 0.43 0.04 4.33
48355 Nueces Gas 85.11 60.42 0.41 0.41 0.37 3.58
48355 Nueces Oil 24.12 21.11 0.19 0.19 0.02 1.88
48489 Willacy Gas 0.00 0.00 0.00 0.00 0.00 0.00
48489 Willacy Oil 0.00 0.00 0.00 0.00 0.00 0.00
State Total Gas 1,661.00 1,179.25 8.00 7.99 7.22 69.93
State Total Oil 464.30 406.35 3.59 3.59 0.33 36.18

D-3
Table D-3. 2008 Process Criteria Annual Emissions
Annual Emissions (tons)
Emission Process Description CO NOX PM10-PRI PM25-PRI SO2 VOC
Amine Unit 0.0000 0.0000 0.0000 0.0000 0.0484 0.0000
Boiler - Max MMBTU/hr 10-
100-natural gas 0.5744 0.6838 0.0130 0.0130 0.0041 0.0376
Boiler - Max MMBTU/hr<10-natural gas 1.0041 1.1954 0.0227 0.0227 0.0072 0.0657
Boiler - Max MMBTU/hr>100-
natural gas 0.0041 0.0136 0.0001 0.0001 0.0000 0.0003
Diesel Engine - MaxHP<600-diesel 1.6944 7.8656 0.5529 0.5529 0.6125 0.5886
Diesel Engine - MaxHP>600-
diesel 0.2996 1.1279 0.0201 0.0197 0.1210 0.0282
Diesel Engine - MaxHP>600-gasoline 12.0780 0.3140 0.0193 0.0193 0.0661 0.5837
Drilling Rig - diesel 0.6158 2.3182 0.0413 0.0406 0.2927 0.0580
Combustion Flares - No Smoke -
No Pilot Fuel - flaring 0.0068 0.0013 0.0000 0.0000 0.0000 0.0001
Combustion Flares - No Smoke - Pilot Fuel - flaring 0.2535 0.0466 0.0000 0.0000 0.0000 0.0041
Combustion Flares - No Smoke -
Pilot Fuel - pilot 0.0166 0.0197 0.0004 0.0000 0.0001 0.0011
All Fugitives 0.0000 0.0000 0.0000 0.0000 0.0000 0.5812
Glycol Dehydrator - triethylene
glycol 0.0000 0.0000 0.0000 0.0000 0.0000 1.6466
Mud Degassing - oil-based muds 0.0000 0.0000 0.0000 0.0000 0.0000 0.0690
Natural Gas Engine - 2-stroke, lean 3.8822 21.3354 0.4223 0.4223 0.0065 1.3197
Natural Gas Engine - 2-stroke,
rich 2.3208 1.5009 0.0063 0.0063 0.0004 0.0198
Natural Gas Engine - 4-stroke, clean 10.0039 6.7072 0.0009 0.0009 0.0067 1.3642
Natural Gas Engine - 4-stroke,
lean 6.0943 9.2503 0.0008 0.0008 0.0064 1.3059
D-4
Table D-3. 2008 Process Criteria Annual Emissions (Cont.)
Annual Emissions (tons)
Emission Process Description CO NOX PM10-PRI PM25-PRI SO2 VOC
Natural Gas Engine - 4-stroke,
rich 345.5574 223.4802 0.9353 0.9353 0.0579 2.9535
Natural Gas Turbine 3.4625 13.5121 0.0802 0.0802 0.1478 0.0887
Pneumatic Pump 0.0000 0.0000 0.0000 0.0000 0.0000 0.3351
Pressure/Level Controller 0.0000 0.0000 0.0000 0.0000 0.0000 0.0604
Storage Tank Operations - Condensate 0.0000 0.0000 0.0000 0.0000 0.0000 0.4281
Storage Tank Operations - Crude
Oil 0.0000 0.0000 0.0000 0.0000 0.0000 0.6208
Cold Vent 0.0000 0.0000 0.0000 0.0000 0.0000 7.2559
TOTAL 387.87 289.37 2.12 2.11 1.38 19.42

D-5
Table D-4. 2008 Process Criteria Ozone Season Daily Emissions
Ozone Season Daily Emissions (lbs)
Emission Process Description CO NOX PM10-PRI PM25-PRI SO2 VOC
Amine Unit 0.00 0.00 0.00 0.00 0.27 0.00
Boiler - Max MMBTU/hr 10-100-natural gas 3.15 3.75 0.07 0.07 0.02 0.21
Boiler - Max MMBTU/hr<10-natural
gas 5.50 6.55 0.12 0.12 0.04 0.36
Boiler - Max MMBTU/hr>100-natural gas 0.02 0.07 0.00 0.00 0.00 0.00
Diesel Engine - MaxHP<600-diesel 9.28 43.10 3.03 3.03 3.36 3.23
Diesel Engine - MaxHP>600-diesel 1.64 6.18 0.11 0.11 0.66 0.15
Diesel Engine - MaxHP>600-
gasoline 66.18 1.72 0.11 0.11 0.36 3.20
Drilling Rig - diesel 3.37 12.70 0.23 0.22 1.60 0.32
Combustion Flares - No Smoke - No Pilot Fuel - flaring 0.04 0.01 0.00 0.00 0.00 0.00
Combustion Flares - No Smoke -
Pilot Fuel - flaring 1.39 0.26 0.00 0.00 0.00 0.02
Combustion Flares - No Smoke - Pilot Fuel - pilot 0.09 0.11 0.00 0.00 0.00 0.01
All Fugitives 0.00 0.00 0.00 0.00 0.00 3.18
Glycol Dehydrator - triethylene
glycol 0.00 0.00 0.00 0.00 0.00 9.02
Mud Degassing - oil-based muds 0.00 0.00 0.00 0.00 0.00 0.38
Natural Gas Engine - 2-stroke, lean 21.27 116.91 2.31 2.31 0.04 7.23
Natural Gas Engine - 2-stroke, rich 12.72 8.22 0.03 0.03 0.00 0.11
Natural Gas Engine - 4-stroke, clean 54.82 36.75 0.00 0.00 0.04 7.47
Natural Gas Engine - 4-stroke, lean 33.39 50.69 0.00 0.00 0.04 7.16
D-6
Table D-4. 2008 Process Criteria Ozone Season Daily Emissions (Cont.)
Ozone Season Daily Emissions (lbs)
Emission Process Description CO NOX PM10-PRI PM25-PRI SO2 VOC
Natural Gas Engine - 4-stroke,
rich 1,893.47 1,224.55 5.12 5.12 0.32 16.18
Natural Gas Turbine 18.97 74.04 0.44 0.44 0.81 0.49
Pneumatic Pump 0.00 0.00 0.00 0.00 0.00 1.84
Pressure/Level Controller 0.00 0.00 0.00 0.00 0.00 0.33
Storage Tank Operations -
Condensate 0.00 0.00 0.00 0.00 0.00 2.35
Storage Tank Operations - Crude
Oil 0.00 0.00 0.00 0.00 0.00 3.40
Cold Vent 0.00 0.00 0.00 0.00 0.00 39.76
TOTAL 2,125.31 1,585.60 11.59 11.58 7.55 106.39
D-7
Table D-5. 2008 Annual Texas Offshore Platform HAP Emissions
HAP Annual Emissions (lbs)
48007 48039 48057 48071 48167 48245 48261 48273 48321 48355 State
Pollutant Name Aransas Brazoria Calhoun Chambers Galveston Jefferson Kenedy Kleberg Matagorda Nueces Total
1,1,2,2-Tetrachloroethane 0.3308 0.3174 0.7303 0.0845 1.2890 2.2772 0.0881 0.3278 0.6520 0.3303 6.4276
1,1,2-Trichloroethane 0.2068 0.2024 0.4556 0.0535 0.8185 1.4347 0.0559 0.2067 0.4103 0.2083 4.0527
1,2,4-Trimethylbenzene 0.0002 0.0000 0.0005 0.0000 0.0002 0.0008 0.0000 0.0001 0.0003 0.0001 0.0022
1,3-Butadiene 7.9800 7.2457 17.7056 1.9725 29.7894 53.7692 2.0408 7.7279 15.4523 7.7874 151.4707
1,3-Dichloropropene 0.1717 0.1680 0.3782 0.0444 0.6794 1.1910 0.0464 0.1716 0.3406 0.1729 3.3641
2,2,4-Trimethylpentane 177.1049 107.6987 404.6559 35.2205 492.7692 1043.9102 34.5244 148.3646 307.4455 149.5079 2901.2018
2-Methylnaphthalene 0.3097 0.2947 0.6841 0.0787 1.1987 2.1245 0.0819 0.3058 0.6087 0.3081 5.9949
3-Methylchloranthrene 0.0226 0.0211 0.0500 0.0057 0.0864 0.1541 0.0059 0.0222 0.0442 0.0223 0.4346
7,12-Dimethylbenz(a)anthracene 0.2010 0.1880 0.4448 0.0506 0.7678 1.3699 0.0525 0.1971 0.3929 0.1986 3.8631
Acenaphthene 0.0186 0.0179 0.0411 0.0048 0.0726 0.1282 0.0050 0.0185 0.0367 0.0186 0.3619
Acenaphthylene 0.0190 0.0185 0.0419 0.0049 0.0748 0.1315 0.0051 0.0189 0.0376 0.0191 0.3712
Acetaldehyde 40.0003 40.4707 87.8355 10.5557 162.4799 281.1997 11.0711 40.5454 80.2296 40.8578 795.2456
Acrolein 35.2851 34.3861 77.7712 9.0997 139.1616 244.3555 9.4996 35.1933 69.8941 35.4645 690.1108
Anthracene 0.0249 0.0239 0.0550 0.0064 0.0971 0.1715 0.0066 0.0247 0.0491 0.0249 0.4841
Antimony 0.0021 0.0033 0.0044 0.0007 0.0123 0.0182 0.0008 0.0027 0.0050 0.0027 0.0522
Arsenic 0.0003 0.0005 0.0006 0.0001 0.0017 0.0025 0.0001 0.0004 0.0007 0.0004 0.0072
Benz(a)anthracene 0.0187 0.0179 0.0412 0.0048 0.0728 0.1286 0.0050 0.0185 0.0368 0.0187 0.3631
Benzene 149.0020 135.5081 330.5498 36.8642 556.9099 1004.5821 38.1490 144.3885 288.6678 145.5012 2830.1225
Benzo(a)pyrene 0.0123 0.0118 0.0273 0.0031 0.0479 0.0848 0.0033 0.0122 0.0243 0.0123 0.2394
Benzo(b)fluoranthene 0.0185 0.0177 0.0409 0.0047 0.0720 0.1274 0.0049 0.0183 0.0365 0.0185 0.3595
Benzo(e)pyrene 0.0000 0.0001 0.0001 0.0000 0.0002 0.0003 0.0000 0.0000 0.0001 0.0000 0.0009
Benzo(g,h,i)perylene 0.0124 0.0119 0.0273 0.0032 0.0482 0.0852 0.0033 0.0123 0.0244 0.0124 0.2403
Benzo(k)fluoranthene 0.0187 0.0179 0.0412 0.0048 0.0728 0.1286 0.0050 0.0185 0.0368 0.0187 0.3631
Biphenyl 0.1877 0.2918 0.3896 0.0659 1.0853 1.6059 0.0726 0.2346 0.4445 0.2364 4.6142
Cadmium 0.0024 0.0037 0.0049 0.0008 0.0136 0.0202 0.0009 0.0029 0.0056 0.0030 0.0580
Carbon Tetrachloride 0.2392 0.2341 0.5269 0.0618 0.9464 1.6591 0.0646 0.2390 0.4744 0.2408 4.6865
Chlorine 0.0203 0.0315 0.0421 0.0071 0.1172 0.1735 0.0078 0.0253 0.0480 0.0255 0.4984
Chlorobenzene 0.1775 0.1756 0.3908 0.0462 0.7085 1.2369 0.0483 0.1782 0.3534 0.1796 3.4951
Chloroform 0.1852 0.1813 0.4080 0.0479 0.7330 1.2849 0.0500 0.1851 0.3674 0.1865 3.6294
Chrysene 0.0186 0.0178 0.0410 0.0047 0.0723 0.1278 0.0049 0.0184 0.0366 0.0185 0.3607

D-8
Table D-5. 2008 Annual Texas Offshore Platform HAP Emissions (Cont.)
HAP Annual Emissions (lbs)
48007 48039 48057 48071 48167 48245 48261 48273 48321 48355 State
Pollutant Name Aransas Brazoria Calhoun Chambers Galveston Jefferson Kenedy Kleberg Matagorda Nueces Total
Cobalt 0.0006 0.0010 0.0013 0.0002 0.0037 0.0055 0.0003 0.0008 0.0015 0.0008 0.0159
Cresols 0.0260 0.0158 0.0595 0.0052 0.0724 0.1534 0.0051 0.0218 0.0452 0.0220 0.4263
Cumene 1.5723 0.9543 3.5929 0.3124 4.3688 9.2624 0.3061 1.3163 2.7282 1.3265 25.7401
Dibenzo(a,h)anthracene 0.0125 0.0120 0.0275 0.0032 0.0486 0.0858 0.0033 0.0123 0.0246 0.0124 0.2421
Dichlorobenzene 2.9343 2.4058 6.5675 0.6837 10.1344 19.0443 0.6980 2.7290 5.5092 2.7500 53.4562
Ethylbenzene 16.5235 18.0458 35.9907 4.5743 71.3277 119.8952 4.8425 17.3274 34.0291 17.4609 340.0170
Ethylene Dibromide 0.2879 0.2819 0.6344 0.0745 1.1396 1.9976 0.0778 0.2877 0.5712 0.2900 5.6426
Fluoranthene 0.0310 0.0296 0.0684 0.0079 0.1204 0.2129 0.0082 0.0307 0.0610 0.0309 0.6010
Fluorene 0.0293 0.0283 0.0647 0.0075 0.1148 0.2023 0.0078 0.0291 0.0579 0.0293 0.5710
Formaldehyde 288.7817 289.3965 634.7409 75.7587 1164.2056 2022.2944 79.3638 291.5051 577.3584 293.7514 5717.1564
Hexane 446.5493 275.0445 1019.5225 89.3673 1253.5388 2641.9300 87.7577 375.6071 777.5237 378.5016 7345.3424
Indeno(1,2,3-cd)pyrene 0.0187 0.0179 0.0412 0.0048 0.0728 0.1286 0.0050 0.0185 0.0368 0.0187 0.3631
Lead 0.0025 0.0038 0.0051 0.0009 0.0143 0.0212 0.0010 0.0031 0.0059 0.0031 0.0609
Manganese 0.0024 0.0037 0.0049 0.0008 0.0136 0.0202 0.0009 0.0029 0.0056 0.0030 0.0580
Mercury 0.0018 0.0027 0.0037 0.0006 0.0102 0.0151 0.0007 0.0022 0.0042 0.0022 0.0435
Methanol 6.9821 5.3570 15.7081 1.5675 22.9490 44.2807 1.5863 6.3333 12.8632 6.3821 124.0094
Methylene Chloride 0.4988 0.4548 1.1063 0.1236 1.8681 3.3663 0.1279 0.4839 0.9672 0.4876 9.4846
Methyl-t-butyl ether 54.0478 32.8028 123.5045 10.7381 150.1773 318.3939 10.5230 45.2491 93.7815 45.5978 884.8157
m-Xylene 0.0499 0.0381 0.1124 0.0112 0.1635 0.3162 0.0113 0.0452 0.0919 0.0456 0.8852
Naphthalene 1.2642 1.1537 2.8036 0.3134 4.7376 8.5343 0.3245 1.2268 2.4518 1.2362 24.0459
Nickel 0.0011 0.0017 0.0023 0.0004 0.0065 0.0096 0.0004 0.0014 0.0027 0.0014 0.0275
o-Xylene 0.0606 0.0547 0.1345 0.0149 0.2251 0.4073 0.0154 0.0585 0.1171 0.0590 1.1471
Phenanthrene 0.1810 0.1734 0.3995 0.0462 0.7045 1.2451 0.0481 0.1792 0.3565 0.1806 3.5143
Phenol 0.0802 0.0688 0.1788 0.0192 0.2867 0.5291 0.0197 0.0759 0.1526 0.0765 1.4876
Phosphorous 0.0075 0.0116 0.0155 0.0026 0.0433 0.0640 0.0029 0.0094 0.0177 0.0094 0.1840
Propylene 37.4683 27.9904 84.4618 8.2898 120.7525 235.4953 8.3594 33.6566 68.5223 33.9159 658.9123
Propylene oxide 0.0996 0.1549 0.2068 0.0350 0.5760 0.8523 0.0385 0.1245 0.2359 0.1255 2.4491
Pyrene 0.0516 0.0493 0.1139 0.0132 0.2005 0.3545 0.0137 0.0510 0.1015 0.0514 1.0006
Selenium 0.0006 0.0009 0.0012 0.0002 0.0034 0.0050 0.0002 0.0007 0.0014 0.0007 0.0145

D-9
Table D-5. 2008 Annual Texas Offshore Platform HAP Emissions (Cont.)
HAP Annual Emissions (lbs)
48007 48039 48057 48071 48167 48245 48261 48273 48321 48355 State
Pollutant Name Aransas Brazoria Calhoun Chambers Galveston Jefferson Kenedy Kleberg Matagorda Nueces Total
Styrene 1.4373 0.9312 3.2715 0.2951 4.1805 8.6330 0.2918 1.2290 2.5334 1.2385 24.0412
Tetrachloroethane 0.0022 0.0034 0.0046 0.0008 0.0127 0.0188 0.0008 0.0027 0.0052 0.0028 0.0540
Toluene 137.3483 125.3601 304.5975 34.0536 514.7808 927.2790 35.2566 133.2919 266.3915 134.3190 2612.6784
Vinyl Chloride 0.0970 0.0950 0.2138 0.0251 0.3840 0.6731 0.0262 0.0970 0.1925 0.0977 1.9013
Xylenes (Mixed Isomers) 71.1066 84.8140 153.3042 20.8377 329.6354 536.0871 22.2901 77.6846 151.2226 78.2833 1525.2655
D-10
Table D-6. 2008 HAP Ozone Season Daily Emissions
HAP Ozone Season Daily Emissions (lbs)
48007 48039 48057 48071 48167 48245 48261 48273 48321 48355 State
Pollutant Name Aransas Brazoria Calhoun Chambers Galveston Jefferson Kenedy Kleberg Matagorda Nueces Total
1,1,2,2-Tetrachloroethane 0.000906 0.000870 0.002001 0.000232 0.003532 0.006239 0.000241 0.000898 0.001786 0.000905 0.0176
1,1,2-Trichloroethane 0.000567 0.000555 0.001248 0.000147 0.002242 0.003931 0.000153 0.000566 0.001124 0.000571 0.0111
1,2,4-Trimethylbenzene 0.000001 0.000000 0.000001 0.000000 0.000000 0.000002 0.000000 0.000000 0.000001 0.000000 0.0000
1,3-Butadiene 0.021863 0.019851 0.048508 0.005404 0.081615 0.147313 0.005591 0.021172 0.042335 0.021335 0.4150
1,3-Dichloropropene 0.000470 0.000460 0.001036 0.000122 0.001861 0.003263 0.000127 0.000470 0.000933 0.000474 0.0092
2,2,4-Trimethylpentane 0.485219 0.295065 1.108646 0.096494 1.350053 2.860028 0.094587 0.406478 0.842316 0.409611 7.9485
2-Methylnaphthalene 0.000848 0.000807 0.001874 0.000216 0.003284 0.005821 0.000224 0.000838 0.001668 0.000844 0.0164
3-Methylchloranthrene 0.000062 0.000058 0.000137 0.000016 0.000237 0.000422 0.000016 0.000061 0.000121 0.000061 0.0012
7,12-Dimethylbenz(a)anthracene 0.000551 0.000515 0.001219 0.000139 0.002103 0.003753 0.000144 0.000540 0.001076 0.000544 0.0106
Acenaphthene 0.000051 0.000049 0.000113 0.000013 0.000199 0.000351 0.000014 0.000051 0.000101 0.000051 0.0010
Acenaphthylene 0.000052 0.000051 0.000115 0.000013 0.000205 0.000360 0.000014 0.000052 0.000103 0.000052 0.0010
Acetaldehyde 0.109590 0.110879 0.240645 0.028920 0.445150 0.770410 0.030332 0.111083 0.219807 0.111939 2.1788
Acrolein 0.096671 0.094208 0.213072 0.024931 0.381265 0.669467 0.026026 0.096420 0.191491 0.097163 1.8907
Anthracene 0.000068 0.000066 0.000151 0.000017 0.000266 0.000470 0.000018 0.000068 0.000135 0.000068 0.0013
Antimony 0.000006 0.000009 0.000012 0.000002 0.000034 0.000050 0.000002 0.000007 0.000014 0.000007 0.0001
Arsenic 0.000001 0.000001 0.000002 0.000000 0.000005 0.000007 0.000000 0.000001 0.000002 0.000001 0.0000
Benz(a)anthracene 0.000051 0.000049 0.000113 0.000013 0.000200 0.000352 0.000014 0.000051 0.000101 0.000051 0.0010
Benzene 0.408225 0.371255 0.905616 0.100998 1.525780 2.752280 0.104518 0.395585 0.790871 0.398633 7.7538
Benzo(a)pyrene 0.000034 0.000032 0.000075 0.000009 0.000131 0.000232 0.000009 0.000033 0.000067 0.000034 0.0007
Benzo(b)fluoranthene 0.000051 0.000049 0.000112 0.000013 0.000197 0.000349 0.000013 0.000050 0.000100 0.000051 0.0010
Benzo(e)pyrene 0.000000 0.000000 0.000000 0.000000 0.000001 0.000001 0.000000 0.000000 0.000000 0.000000 0.0000
Benzo(g,h,i)perylene 0.000034 0.000032 0.000075 0.000009 0.000132 0.000233 0.000009 0.000034 0.000067 0.000034 0.0007
Benzo(k)fluoranthene 0.000051 0.000049 0.000113 0.000013 0.000200 0.000352 0.000014 0.000051 0.000101 0.000051 0.0010
Biphenyl 0.000514 0.000799 0.001067 0.000181 0.002973 0.004400 0.000199 0.000643 0.001218 0.000648 0.0126
Cadmium 0.000006 0.000010 0.000013 0.000002 0.000037 0.000055 0.000002 0.000008 0.000015 0.000008 0.0002
Carbon Tetrachloride 0.000655 0.000641 0.001444 0.000169 0.002593 0.004546 0.000177 0.000655 0.001300 0.000660 0.0128
Chlorine 0.000056 0.000086 0.000115 0.000020 0.000321 0.000475 0.000021 0.000069 0.000132 0.000070 0.0014
Chlorobenzene 0.000486 0.000481 0.001071 0.000127 0.001941 0.003389 0.000132 0.000488 0.000968 0.000492 0.0096
Chloroform 0.000507 0.000497 0.001118 0.000131 0.002008 0.003520 0.000137 0.000507 0.001007 0.000511 0.0099
Chrysene 0.000051 0.000049 0.000112 0.000013 0.000198 0.000350 0.000014 0.000050 0.000100 0.000051 0.0010

D-11
Table D-6. 2008 HAP Ozone Season Daily Emissions (Cont.)
HAP Ozone Season Daily Emissions (lbs)
48007 48039 48057 48071 48167 48245 48261 48273 48321 48355 State
Pollutant Name Aransas Brazoria Calhoun Chambers Galveston Jefferson Kenedy Kleberg Matagorda Nueces Total
Cobalt 0.000002 0.000003 0.000004 0.000001 0.000010 0.000015 0.000001 0.000002 0.000004 0.000002 0.0000
Cresols 0.000071 0.000043 0.000163 0.000014 0.000198 0.000420 0.000014 0.000060 0.000124 0.000060 0.0012
Cumene 0.004308 0.002614 0.009843 0.000856 0.011969 0.025376 0.000839 0.003606 0.007474 0.003634 0.0705
Dibenzo(a,h)anthracene 0.000034 0.000033 0.000075 0.000009 0.000133 0.000235 0.000009 0.000034 0.000067 0.000034 0.0007
Dichlorobenzene 0.008039 0.006591 0.017993 0.001873 0.027766 0.052176 0.001912 0.007477 0.015094 0.007534 0.1465
Ethylbenzene 0.045270 0.049441 0.098605 0.012532 0.195418 0.328480 0.013267 0.047472 0.093230 0.047838 0.9316
Ethylene Dibromide 0.000789 0.000772 0.001738 0.000204 0.003122 0.005473 0.000213 0.000788 0.001565 0.000794 0.0155
Fluoranthene 0.000085 0.000081 0.000187 0.000022 0.000330 0.000583 0.000023 0.000084 0.000167 0.000085 0.0016
Fluorene 0.000080 0.000078 0.000177 0.000021 0.000314 0.000554 0.000021 0.000080 0.000159 0.000080 0.0016
Formaldehyde 0.791183 0.792867 1.739016 0.207558 3.189604 5.540533 0.217435 0.798644 1.581804 0.804798 15.6634
Hexane 1.223423 0.753547 2.793212 0.244842 3.434353 7.238164 0.240432 1.029061 2.130202 1.036991 20.1242
Indeno(1,2,3-cd)pyrene 0.000051 0.000049 0.000113 0.000013 0.000200 0.000352 0.000014 0.000051 0.000101 0.000051 0.0010
Lead 0.000007 0.000011 0.000014 0.000002 0.000039 0.000058 0.000003 0.000008 0.000016 0.000009 0.0002
Manganese 0.000006 0.000010 0.000013 0.000002 0.000037 0.000055 0.000002 0.000008 0.000015 0.000008 0.0002
Mercury 0.000005 0.000008 0.000010 0.000002 0.000028 0.000041 0.000002 0.000006 0.000011 0.000006 0.0001
Methanol 0.019129 0.014677 0.043036 0.004295 0.062874 0.121317 0.004346 0.017351 0.035242 0.017485 0.3398
Methylene Chloride 0.001367 0.001246 0.003031 0.000339 0.005118 0.009223 0.000351 0.001326 0.002650 0.001336 0.0260
Methyl-t-butyl ether 0.148076 0.089871 0.338368 0.029419 0.411445 0.872312 0.028830 0.123970 0.256936 0.124925 2.4242
m-Xylene 0.000137 0.000104 0.000308 0.000031 0.000448 0.000866 0.000031 0.000124 0.000252 0.000125 0.0024
Naphthalene 0.003463 0.003161 0.007681 0.000859 0.012980 0.023382 0.000889 0.003361 0.006717 0.003387 0.0659
Nickel 0.000003 0.000005 0.000006 0.000001 0.000018 0.000026 0.000001 0.000004 0.000007 0.000004 0.0001
o-Xylene 0.000166 0.000150 0.000369 0.000041 0.000617 0.001116 0.000042 0.000160 0.000321 0.000162 0.0031
Phenanthrene 0.000496 0.000475 0.001095 0.000127 0.001930 0.003411 0.000132 0.000491 0.000977 0.000495 0.0096
Phenol 0.000220 0.000189 0.000490 0.000053 0.000785 0.001450 0.000054 0.000208 0.000418 0.000210 0.0041
Phosphorous 0.000021 0.000032 0.000043 0.000007 0.000119 0.000175 0.000008 0.000026 0.000049 0.000026 0.0005
Propylene 0.102653 0.076686 0.231402 0.022712 0.330829 0.645193 0.022902 0.092210 0.187732 0.092920 1.8052
Propylene oxide 0.000273 0.000424 0.000567 0.000096 0.001578 0.002335 0.000106 0.000341 0.000646 0.000344 0.0067
Pyrene 0.000141 0.000135 0.000312 0.000036 0.000549 0.000971 0.000038 0.000140 0.000278 0.000141 0.0027
Selenium 0.000002 0.000003 0.000003 0.000001 0.000009 0.000014 0.000001 0.000002 0.000004 0.000002 0.0000
Styrene 0.003938 0.002551 0.008963 0.000808 0.011453 0.023652 0.000799 0.003367 0.006941 0.003393 0.0659
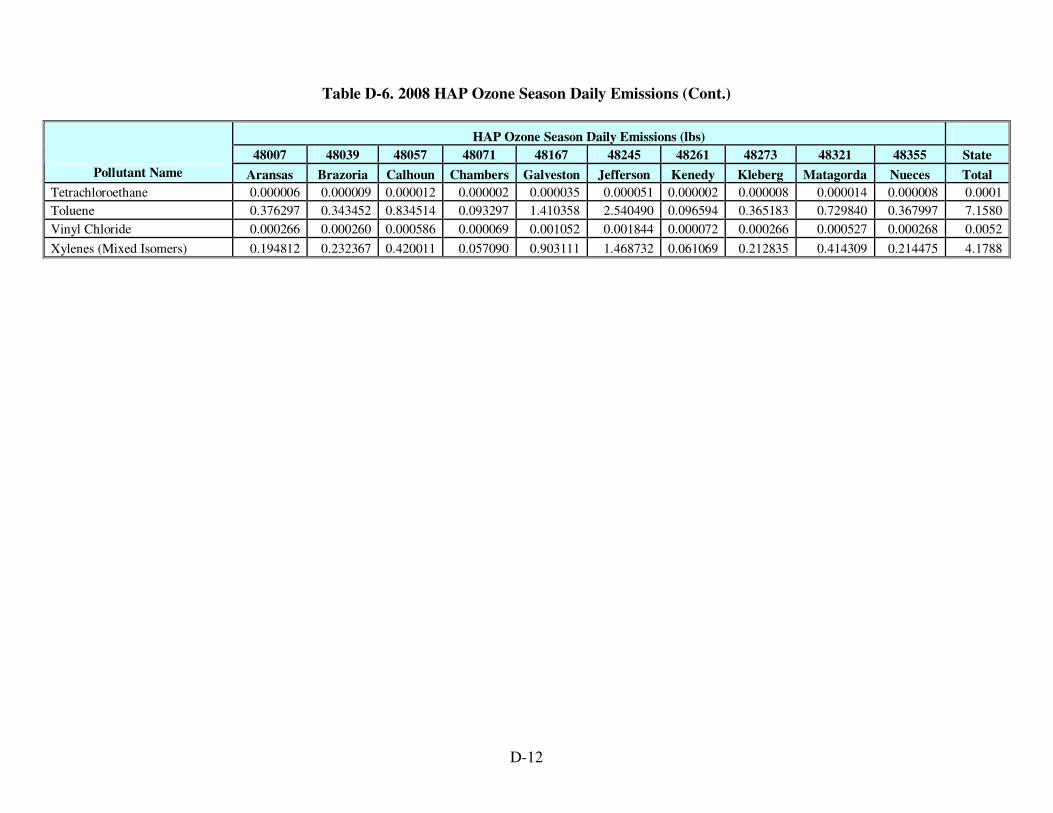
D-12
Table D-6. 2008 HAP Ozone Season Daily Emissions (Cont.)
HAP Ozone Season Daily Emissions (lbs)
48007 48039 48057 48071 48167 48245 48261 48273 48321 48355 State
Pollutant Name Aransas Brazoria Calhoun Chambers Galveston Jefferson Kenedy Kleberg Matagorda Nueces Total
Tetrachloroethane 0.000006 0.000009 0.000012 0.000002 0.000035 0.000051 0.000002 0.000008 0.000014 0.000008 0.0001
Toluene 0.376297 0.343452 0.834514 0.093297 1.410358 2.540490 0.096594 0.365183 0.729840 0.367997 7.1580
Vinyl Chloride 0.000266 0.000260 0.000586 0.000069 0.001052 0.001844 0.000072 0.000266 0.000527 0.000268 0.0052
Xylenes (Mixed Isomers) 0.194812 0.232367 0.420011 0.057090 0.903111 1.468732 0.061069 0.212835 0.414309 0.214475 4.1788