tax systems in european union countries - oecd · tax systems in european union countries 93 ©...
TRANSCRIPT

OECD Economic Studies No. 34, 2002/I
91
© OECD 2002
TAX SYSTEMS IN EUROPEAN UNION COUNTRIES
Isabelle Joumard
TABLE OF CONTENTS
Introduction ................................................................................................................................. 92Forces shaping tax policy in the EU area ................................................................................. 92
Growth in public spending and fiscal consolidation commitments have impliedrising tax burdens.................................................................................................................... 92A brighter economic outlook has recently allowed some tax reductions ........................ 95Upward pressures on public spending will likely increase… ........................................... 95… while forces working to erode tax bases are of concern................................................ 96
Common features of EU tax systems ........................................................................................ 98Overview................................................................................................................................... 98High tax wedges on labour..................................................................................................... 98Consumption taxes play an important role ......................................................................... 104Environment-related taxes raise substantial revenues ..................................................... 111Taxation of capital is relatively low but some distortions remain .................................... 113Corporate income tax bases remain narrow, and special regimes are widespread ....... 124An emphasis on income redistribution?.............................................................................. 126
Priorities for future tax reforms.................................................................................................. 126Improve labour market performance.................................................................................... 129Further reduce non-neutralities in product markets…...................................................... 131… and towards saving vehicles ............................................................................................. 131Increase reliance on the taxation of property...................................................................... 132Improve neutrality on the corporate financing side ........................................................... 132Streamline special corporate tax regimes and relief.......................................................... 132Pursue environmental objectives in a cost-effective way.................................................. 133
Appendix 1. Reforming VAT: Moving from the Destination to Origin Principle? .................. 143Appendix 2. The EU Code of Conduct on Business Taxation .................................................. 145Bibliography ................................................................................................................................ 147
This paper is a revised version of a document originally prepared for a meeting of the Working PartyNo. 1 of the OECD’s Economic Policy Committee on 15 and 16 March 2001. It has also received valuablecomments from Working Party No. 2 on Tax Policy Analysis and Tax Statistics of the Committee on FiscalAffairs. I am also indebted to Paul Atkinson, Sveinbjörn Blöndal, Chiara Bronchi, Steen Daugaard,Jørgen Elmeskov, Michael P. Feiner, Chris Heady, Peter Hoeller, Thomas Liebig, John Litwack,Paul van den Noord, Paul O’Brien, Deborah Roseveare, Ignazio Visco and Ann Vourc’h, for theircomments and drafting suggestions, but factual and judgmental errors remain mine. Special thanks alsoto Chantal Nicq for statistical assistance and to Anne Eggimann for secretarial assistance.
publi.sgml.compo.fm Page 91 Friday, August 2, 2002 8:31 AM
92
© OECD 2002
INTRODUCTION
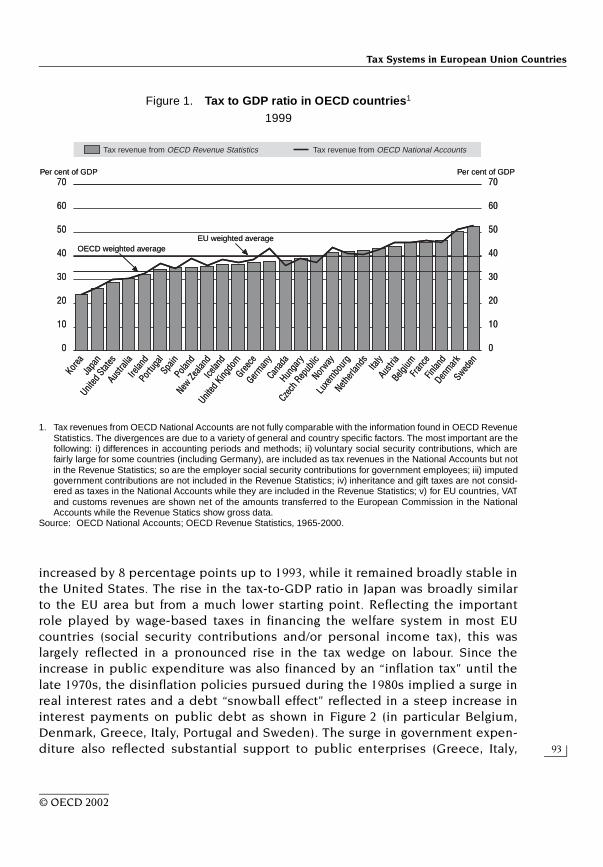
A review of tax policies of EU countries is useful for several reasons. First, thetax to GDP ratio in the EU area, having risen steadily up to the late 1990s, is veryhigh by international standards (Figure 1). Second, while some caution is neededin measuring the incidence of the tax burden, there is little doubt that averageeffective tax rates on labour and consumption are much higher in the EU area thanin most other OECD countries. Finally, the removal of obstacles to the free move-ment of goods, people and capital within the EU area, combined with the adventof the single currency, have brought to the fore a number of international taxationissues, related to cross-border investment, saving and shopping, as well ase-commerce. Thus, tax design is an important influence on EU countries’ perfor-mance and their experience may provide useful insights for other countries andregions where international integration is deepening.
This paper provides an overview of some of the more common broad featuresof tax systems in the EU and of the main policy issues they raise. The first sectionpresents the main forces shaping tax policy in the EU area, since the early 1970sand in the near future. The second section examines the main features of EUcountries’ tax systems and how they affect employment, consumption patterns,saving and investment, income redistribution, and tax compliance and collectioncosts. Finally, the last section proposes some recommendations for future taxreforms.
FORCES SHAPING TAX POLICY IN THE EU AREA
Growth in public spending and fiscal consolidation commitments have implied rising tax burdens
A sustained expansion of public sector commitments to welfare provision– which has gradually become more general and generous – and the rise inunemployment acted as persistent underlying pressures to increase taxes inmost EU countries between 1970 and the early 1990s.1 From a level broadly atpar with that of the United States in 1970, the tax-to-GDP ratio for the EU area
publi.sgml.compo.fm Page 92 Friday, August 2, 2002 8:31 AM
Tax Systems in European Union Countries
93
© OECD 2002
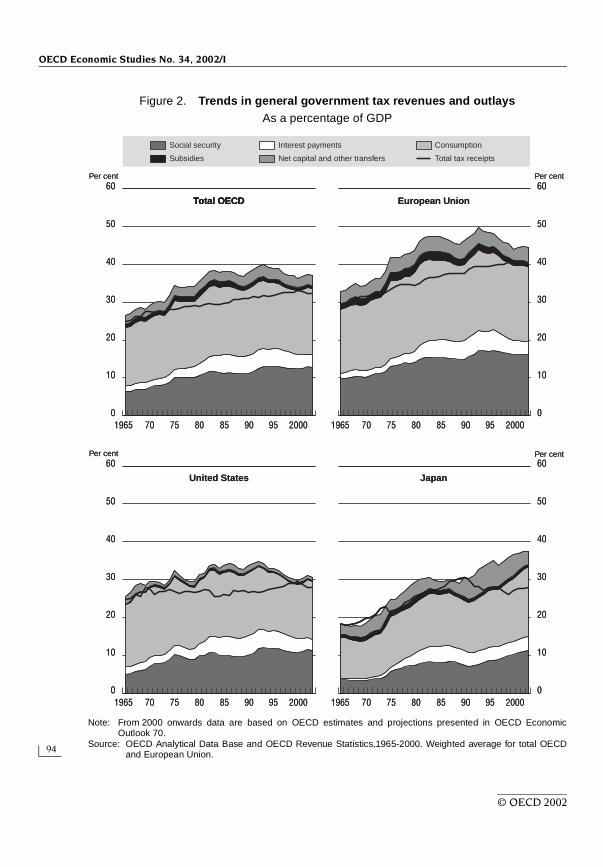
increased by 8 percentage points up to 1993, while it remained broadly stable inthe United States. The rise in the tax-to-GDP ratio in Japan was broadly similarto the EU area but from a much lower starting point. Reflecting the importantrole played by wage-based taxes in financing the welfare system in most EUcountries (social security contributions and/or personal income tax), this waslargely reflected in a pronounced rise in the tax wedge on labour. Since theincrease in public expenditure was also financed by an “inflation tax” until thelate 1970s, the disinflation policies pursued during the 1980s implied a surge inreal interest rates and a debt “snowball effect” reflected in a steep increase ininterest payments on public debt as shown in Figure 2 (in particular Belgium,Denmark, Greece, Italy, Portugal and Sweden). The surge in government expen-diture also reflected substantial support to public enterprises (Greece, Italy,
Figure 1. Tax to GDP ratio in OECD countries1
1999
1. Tax revenues from OECD National Accounts are not fully comparable with the information found in OECD RevenueStatistics. The divergences are due to a variety of general and country specific factors. The most important are thefollowing: i) differences in accounting periods and methods; ii) voluntary social security contributions, which arefairly large for some countries (including Germany), are included as tax revenues in the National Accounts but notin the Revenue Statistics; so are the employer social security contributions for government employees; iii) imputedgovernment contributions are not included in the Revenue Statistics; iv) inheritance and gift taxes are not consid-ered as taxes in the National Accounts while they are included in the Revenue Statistics; v) for EU countries, VATand customs revenues are shown net of the amounts transferred to the European Commission in the NationalAccounts while the Revenue Statics show gross data.
Source: OECD National Accounts; OECD Revenue Statistics, 1965-2000.
70
60
40
20
0
10
30
50
70
60
40
20
0
10
30
50
Tax revenue from OECD Revenue Statistics
Korea
Tax revenue from OECD National Accounts
Per cent of GDP Per cent of GDP
Icelan
d
Japa
n
Irelan
d
New Ze
aland
Spain
Portu
gal
Norway
Greece
Czec
h Rep
ublic
Austr
alia
Franc
e
United
King
dom
Cana
da
Belgi
um
Swed
en
Netherl
ands
Denmark
United
State
s
Austr
ia
Finlan
d
Italy
Polan
d
German
y
Hunga
ry
EU weighted averageOECD weighted average
Luxe
mbour
g
70
60
40
20
0
10
30
50
70
60
40
20
0
10
30
50
Tax revenue from OECD Revenue Statistics
Korea
Tax revenue from OECD National Accounts
Per cent of GDP Per cent of GDP
Icelan
d
Japa
n
Irelan
d
New Ze
aland
Spain
Portu
gal
Norway
Greece
Czec
h Rep
ublic
Austr
alia
Franc
e
United
King
dom
Cana
da
Belgi
um
Swed
en
Netherl
ands
Denmark
United
State
s
Austr
ia
Finlan
d
Italy
Polan
d
German
y
Hunga
ry
EU weighted averageOECD weighted average
Luxe
mbour
g
publi.sgml.compo.fm Page 93 Friday, August 2, 2002 8:31 AM
OECD Economic Studies No. 34, 2002/I
94
© OECD 2002
Figure 2. Trends in general government tax revenues and outlaysAs a percentage of GDP
Note: From 2000 onwards data are based on OECD estimates and projections presented in OECD EconomicOutlook 70.
Source: OECD Analytical Data Base and OECD Revenue Statistics,1965-2000. Weighted average for total OECDand European Union.
60
50
40
30
20
10
0
60
50
40
30
20
10
0
60
50
40
30
20
10
0
60
50
40
30
20
10
01965 70 75 80 85 90 200095 1965 70 75 80 85 90 200095
1965 70 75 80 85 90 200095 1965 70 75 80 85 90 200095
Subsidies Total tax receiptsNet capital and other transfers
Social security ConsumptionInterest payments
Total OECDTotal OECD European Union
United States Japan
Per centPer cent
Per cent Per cent60
50
40
30
20
10
0
60
50
40
30
20
10
0
60
50
40
30
20
10
0
60
50
40
30
20
10
01965 70 75 80 85 90 200095 1965 70 75 80 85 90 200095
1965 70 75 80 85 90 200095 1965 70 75 80 85 90 200095
Subsidies Total tax receiptsNet capital and other transfers
Social security ConsumptionInterest payments
Total OECDTotal OECD European Union
United States Japan
Per centPer cent
Per cent Per cent
publi.sgml.compo.fm Page 94 Friday, August 2, 2002 8:31 AM

Tax Systems in European Union Countries
95
© OECD 2002
Portugal, Spain and Sweden), and/or the implementation of large public infra-structure programmes (in particular for countries benefiting from EU structuralfunds – Greece, Ireland, Portugal and Spain – which cover only part of thespending on these programmes).
The 1992 Maastricht Treaty and later the Stability and Growth Pacts created aframework in which many EU countries have implemented fiscal consolidationefforts. In many EU countries, scaling back public spending was achieved bycurtailing public sector pay, adopting strict rules on the number of civil servants(replacing only a fraction of retiring employees), and cutting or postponing publicinvestment. Meanwhile, the tax-to-GDP ratio continued to rise in most EUcountries, with the main exceptions being Ireland and the Netherlands. The bulkof the rise in revenues no longer stemmed from personal income taxes and socialsecurity contributions but from corporate income and indirect taxes.
A brighter economic outlook has recently allowed some tax reductions
Since the late 1990s, most EU countries have taken advantage of buoyant reve-nues to reduce tax rates. Though some of these tax measures have involved cuttingindirect taxes with little overall impact on supply-side conditions, many have beendesigned to have a structural impact: increase employment incentives and opportu-nities, and boost productivity. Main candidates for cuts have been social securitycontributions and the personal income tax (e.g. in Germany, Finland, France, Ireland,Italy, the Netherlands, Spain, Sweden and the United Kingdom). Overall, this hasimplied a slight decline in tax wedges on labour, though sometimes with a morepronounced impact on low-wage earners. In addition, several EU countries have alsointroduced measures to achieve a general reduction in corporate income taxes andimprove the functioning of capital markets (e.g. Germany, Ireland, Italy).
Upward pressures on public spending will likely increase…
Population ageing will, in the absence of reforms, raise spending on pensionsand health care. Fiscal implications will likely be considerable for EU countries,with old-age pension spending projected to increase, as a share of GDP, by over4 percentage points by 2050 in Denmark, Finland, France, Germany, theNetherlands, and Spain (Table 1 and Dang et al., 2001). While estimates are moreuncertain for health care, they could add an additional 3 percentage points to theincrease in overall public spending on average across EU countries. This mainlyreflects rapidly rising elderly dependency ratios in conjunction with extensivepublic old-age pension and health and long-term care systems in place in manyEU countries. Prospects for enlargement of the EU by admitting 13 new membercountries may also imply additional spending,2 although this would be less signifi-cant. The European Commission budget would have to pay for “pre-accession”
publi.sgml.compo.fm Page 95 Friday, August 2, 2002 8:31 AM

OECD Economic Studies No. 34, 2002/I
96
© OECD 2002
preparations, devote resources to infrastructure developments and regionalsupport in these countries, and extend to them the EU Common AgriculturalPolicy (CAP).
… while forces working to erode tax bases are of concern
Free capital movements, the elimination of custom controls, the advent of thesingle currency and the development of information and communication technolo-gies all contribute to increase the mobility of tax bases. On the one hand,enhanced mobility within the EU area may create welfare gains by enablingindividuals and companies to choose, as a jurisdiction of residence, the country or
Table 1. Age-related spending in some OECD countriesPer cent of GDP, changes in percentage points
1. The peak values are in 2050 except for Denmark (2030), Sweden and the United Kingdom (2035), and Belgium andthe Netherlands (2040).
2. The peak values are in 2050 except for Japan (2015), the United Kingdom and Italy (2030), the United States, Finland,Sweden, Austria and France (2035), Denmark, the Netherlands, Norway, Portugal and Belgium (2040) andSpain (2045).
3. For France, the latest available year is 2040.4. Portugal provided an estimate for total age-related spending but did not provide expenditure for all of the spend-
ing components.5. The peak values are in 2050 except for Denmark (2035) and United Kingdom (2040).Source: Dang, Antolin and Oxley (2001).
Total age-related spending of which:
Level 2000
Change 2000-peak1
Change 2000-50
Old-age pensionHealth care and long-term
care
Level 2000
Change 2000-peak2
Change 2000-50
Level 2000
Change 2000-peak5
Change 2000-50
Austria 10.4 4.6 2.3 9.5 4.3 2.2 . . . . . .Belgium 22.1 5.4 5.2 8.8 3.7 3.3 6.2 3.0 3.0Denmark 29.3 7.3 5.7 6.1 3.6 2.7 6.6 2.7 2.7Finland 19.4 8.5 8.5 8.1 4.8 4.8 8.1 3.8 3.8France3 . . . . . . 12.1 4.0 3.9 . . . . . .Germany . . . . . . 11.8 5.0 5.0 . . . . . .Italy . . . . . . 14.2 1.7 –0.3 . . . . . .Netherlands 19.1 10.1 9.9 5.2 5.3 4.8 7.2 4.8 4.8Portugal4 15.6 6.6 4.3 8.0 4.5 4.5 . . . . . .Spain . . . . . . 9.4 8.0 8.0 . . . . . .Sweden 29.0 3.4 3.2 9.2 2.2 1.6 8.1 3.2 3.2United Kingdom 15.6 0.8 0.2 4.3 0.0 –0.7 5.6 1.8 1.7
Memorandum items:Australia 16.7 5.6 5.6 3.0 1.6 1.6 6.8 6.2 6.2Canada 17.9 8.7 8.7 5.1 5.8 5.8 6.3 4.2 4.2Japan 13.7 3.0 3.0 7.9 1.0 0.6 5.8 2.4 2.4United States 11.2 5.5 5.5 4.4 1.8 1.8 2.6 4.4 4.4
publi.sgml.compo.fm Page 96 Friday, August 2, 2002 8:31 AM
Tax Systems in European Union Countries
97
© OECD 2002
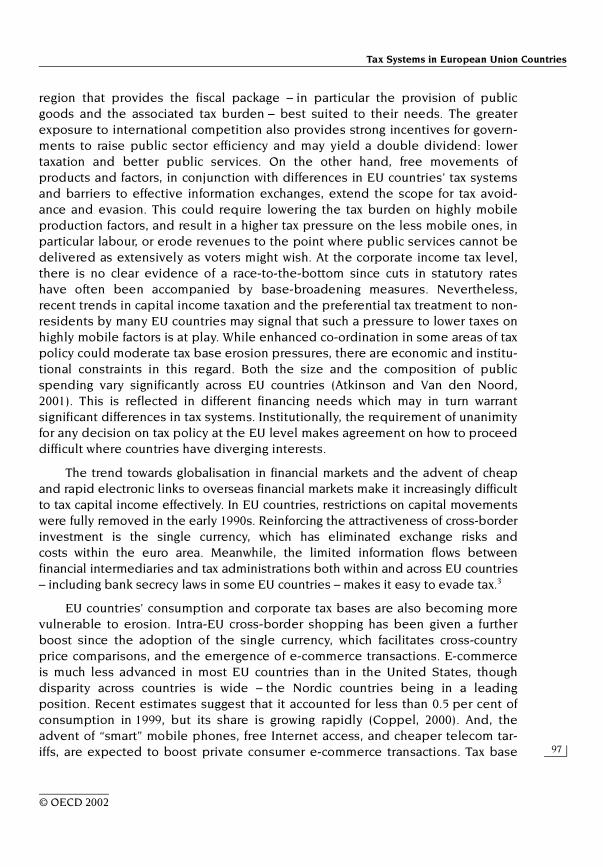
region that provides the fiscal package – in particular the provision of publicgoods and the associated tax burden – best suited to their needs. The greaterexposure to international competition also provides strong incentives for govern-ments to raise public sector efficiency and may yield a double dividend: lowertaxation and better public services. On the other hand, free movements ofproducts and factors, in conjunction with differences in EU countries’ tax systemsand barriers to effective information exchanges, extend the scope for tax avoid-ance and evasion. This could require lowering the tax burden on highly mobileproduction factors, and result in a higher tax pressure on the less mobile ones, inparticular labour, or erode revenues to the point where public services cannot bedelivered as extensively as voters might wish. At the corporate income tax level,there is no clear evidence of a race-to-the-bottom since cuts in statutory rateshave often been accompanied by base-broadening measures. Nevertheless,recent trends in capital income taxation and the preferential tax treatment to non-residents by many EU countries may signal that such a pressure to lower taxes onhighly mobile factors is at play. While enhanced co-ordination in some areas of taxpolicy could moderate tax base erosion pressures, there are economic and institu-tional constraints in this regard. Both the size and the composition of publicspending vary significantly across EU countries (Atkinson and Van den Noord,2001). This is reflected in different financing needs which may in turn warrantsignificant differences in tax systems. Institutionally, the requirement of unanimityfor any decision on tax policy at the EU level makes agreement on how to proceeddifficult where countries have diverging interests.
The trend towards globalisation in financial markets and the advent of cheapand rapid electronic links to overseas financial markets make it increasingly difficultto tax capital income effectively. In EU countries, restrictions on capital movementswere fully removed in the early 1990s. Reinforcing the attractiveness of cross-borderinvestment is the single currency, which has eliminated exchange risks andcosts within the euro area. Meanwhile, the limited information flows betweenfinancial intermediaries and tax administrations both within and across EU countries– including bank secrecy laws in some EU countries – makes it easy to evade tax.3
EU countries’ consumption and corporate tax bases are also becoming morevulnerable to erosion. Intra-EU cross-border shopping has been given a furtherboost since the adoption of the single currency, which facilitates cross-countryprice comparisons, and the emergence of e-commerce transactions. E-commerceis much less advanced in most EU countries than in the United States, thoughdisparity across countries is wide – the Nordic countries being in a leadingposition. Recent estimates suggest that it accounted for less than 0.5 per cent ofconsumption in 1999, but its share is growing rapidly (Coppel, 2000). And, theadvent of “smart” mobile phones, free Internet access, and cheaper telecom tar-iffs, are expected to boost private consumer e-commerce transactions. Tax base
publi.sgml.compo.fm Page 97 Friday, August 2, 2002 8:31 AM
OECD Economic Studies No. 34, 2002/I
98
© OECD 2002
erosion pressures may thus intensify in certain fields. In the context of Business-to-Consumer (B2C) transactions, EU countries which have maintained a highereffective tax rate on consumption (e.g. Denmark and Finland) will be the mostaffected since EU online providers of digital products currently apply their owncountry’s VAT rates to intra-EU sales and products delivered from a non-EU onlinesource are tax-free.4 New information and communication technologies also makea physical location of management and service activities much less important,thus increasing the mobility of corporate income tax bases.
COMMON FEATURES OF EU TAX SYSTEMS
Overview
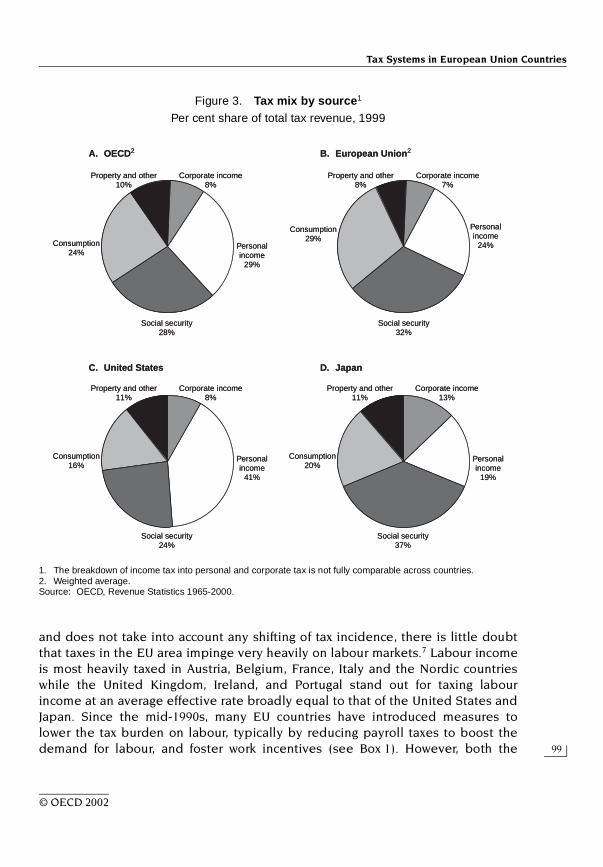
The tax burden in the EU area is much higher than in most other OECDcountries. Defined as the tax-to-GDP ratio, it stood at almost 41 per cent in 1999,some 11 and 13 percentage points higher than in the United States and Japan,respectively.5 The tax mix is also different. Most EU countries rely heavily on socialsecurity contributions, consumption and environmentally-related taxes. On theother hand, corporate income and property taxes account for a much lower share oftotal tax revenues than in Japan and the United States – the United Kingdom andFrance being the main exceptions to this EU model (Figure 3). This often reflects awide range of tax incentives for corporations and a lenient taxation of real estate. Asa result of some integration between personal and corporate taxes, the tax systemalso creates less distortion for corporate financing decisions among domesticresources than in other major OECD economies, though it introduces some discrimi-nation towards foreign investment. Another common distortion is that the personalincome tax often grants a favoured tax treatment to specific saving vehicles (housinginvestment, life insurance and pension schemes). Overall, while income redistribu-tion is often conceived as a key objective of EU countries’ tax systems, progressivityembodied in statutory tax rates on personal income is weakened by a large set oftax allowances and tax credits, which mostly benefit higher-income groups. Furtherlessening the redistributive nature of the tax system is the relatively low taxation ofproperty and capital income and the fact that social security contributions are basi-cally proportional and sometimes regressive (mainly due to ceilings).
High tax wedges on labour
High taxes on labour are partly shifted forward into labour costs…
The average effective tax rate on labour in the EU area appears to be about15 percentage points higher than in the United States and Japan.6 While thecalculation of average effective tax rates is fraught with methodological problems
publi.sgml.compo.fm Page 98 Friday, August 2, 2002 8:31 AM
Tax Systems in European Union Countries
99
© OECD 2002
and does not take into account any shifting of tax incidence, there is little doubtthat taxes in the EU area impinge very heavily on labour markets.7 Labour incomeis most heavily taxed in Austria, Belgium, France, Italy and the Nordic countrieswhile the United Kingdom, Ireland, and Portugal stand out for taxing labourincome at an average effective rate broadly equal to that of the United States andJapan. Since the mid-1990s, many EU countries have introduced measures tolower the tax burden on labour, typically by reducing payroll taxes to boost thedemand for labour, and foster work incentives (see Box 1). However, both the
Figure 3. Tax mix by source1
Per cent share of total tax revenue, 1999
1. The breakdown of income tax into personal and corporate tax is not fully comparable across countries.2. Weighted average.Source: OECD, Revenue Statistics 1965-2000.
A. OECD2
C. United States
B. European Union2
D. Japan
Personalincome
29%
Corporate income8%
Social security28%
Consumption24%
Property and other10%
Personalincome
24%
Corporate income7%
Social security32%
Consumption29%
Property and other8%
Personalincome
41%
Corporate income8%
Social security24%
Consumption16%
Property and other11%
Personalincome
19%
Corporate income13%
Social security37%
Consumption20%
Property and other11%
publi.sgml.compo.fm Page 99 Friday, August 2, 2002 8:31 AM
OECD Economic Studies No. 34, 2002/I
100
© OECD 2002
Box 1. Tax measures to improve labour market performance since the mid-1990s: individual countries’ experiences
Many countries have cut payroll taxes since the mid-1990s…
To stimulate the demand for labour, several EU countries have cut socialsecurity contributions since the mid-1990s. Some countries (Austria, Belgium,France, Greece, the Netherlands, Spain and the United Kingdom) have targetedthe low-paid and/or low-qualified workers, i.e. those who have usually suffered themost from high unemployment. Further supporting this approach is evidencesuggesting that low-skilled workers face greater wage elasticity of labour demand(OECD, 1994a; Dormond, 1997). In France, the reduction in non-wage labour costscovered about one fourth of wage earners and amounted to about 18 per cent forworkers at the minimum wage in 1998.1 In the Netherlands, the so-called SPAK,introduced in 1996, covers one in six of the workforce and consists of a reductionin social security contributions for wage levels up to 115 per cent of the minimumwage. In Spain, since May 1997 new permanent labour contracts for the young,long-term unemployed, female and older workers, and workers previously with atemporary contract contribute to the social security system at reduced rates (ofbetween 25 and 50 per cent, depending on the targeted group). More than 60 percent of the new permanent contracts signed over the 1998-2000 period weresubject to these reduced contribution rates. In Belgium, a labour cost reduction ofabout 2 per cent has been achieved and a further cut by 3.4 per cent over sixyears is programmed (from 1999 to 2004). In the United Kingdom, the NationalInsurance Contribution system was reformed to reduce the cost of hiring low-paidemployees. The starting point at which employers and employees pay theircomponents of National Insurance has been raised, with zero rates for wagesbelow these limits.2 Contrasting with these targeted approaches, several countrieshave cut social security contributions across the board or envisage doing so(Germany, Austria and Finland). In Greece, to promote job creation, a new taxallowance to corporate income tax was introduced in 1999, equal to half of theemployers’ social security contributions for every new job created.
… rebalanced the tax burden away from labour…
Several countries have recently shifted the tax burden away from labour-intensive activities in order to give a further boost to the demand for labour.
Shifting the tax burden from labour to capital or to a broader tax base. Some EU coun-tries have recently lowered the generous tax allowances granted through thecorporate income tax for the depreciation of equipment investment, thusre-balancing the relative cost of labour and capital (e.g. Germany and Denmark).Since 1999, the French government is gradually removing the wage componentfrom the base of the local business tax (taxe professionelle), a process which is sup-posed to be completed in 2003. Furthermore, the tax base to fund contributionsfor health insurance and family allowances has been progressively extended fromlabour to capital income (Contribution sociale généralisée). In Italy, the 1997-98 taxreform eliminated some employers’ compulsory health contributions, bringing theoverall employers’ contribution rate down to 34.1 from 46.4 per cent. At the sametime, a new tax, IRAP, based on expenditure was introduced.
publi.sgml.compo.fm Page 100 Friday, August 2, 2002 8:31 AM

Tax Systems in European Union Countries
101
© OECD 2002
Box 1. Tax measures to improve labour market performance since the mid-1990s: individual countries’ experiences (cont.)
… and to polluting activities (the “double dividend approach”). Several countrieshave introduced or raised energy and other “green” taxes to finance, at leastpartly, cuts in payroll taxation. In Germany, new taxes on energy consumptionimplemented in April 1999 have been used to lower pension contribution rates.Italy launched a green tax reform in 1999 which involves a stepwise implementa-tion of excise taxes which are both higher and more closely related to the carbondioxide emissions produced by each fuel by 2005. The increase in tax revenues isto be recycled through lower taxes on labour. In the United Kingdom, a newclimate change levy on companies for the use of gas, coal, and electricity cameinto effect in April 2001. Part of the receipts is recycled through a 0.3 percentagepoint cut in employers’ social security contributions. In the Netherlands, aboutone third of the cut in personal income taxes in 2001 was expected to be financedthrough a VAT hike and green taxes.
Lowering indirect taxes on labour intensive activities. The European Council adoptedin 1999 an EC directive granting an option to those EU countries who wish to doso to apply a reduced VAT rate to certain labour intensive services, for theperiod 2000-02. The objective is to stimulate demand for these services, and thusemployment, and to bring part of the informal economy back to the surface. Activ-ities targeted are: i) small repairs to bicycles, footwear, leather articles, clothingand household linens; ii) renovation and repairs to private housing; iii) windowwashing and cleaning of private homes; iv) home health care; and v) hairdressing.Nine countries have seized this opportunity: Belgium, France, Greece, Italy,Luxembourg, the Netherlands, Portugal, Spain and the United Kingdom (for theIsle of Man only).
… and enhanced tax incentives to work
EU countries have implemented a large array of tax measures to enhanceincentives to enter into employment or to increase work efforts.
Cuts in marginal rates on labour income have been a key device aimed at boostingthe supply of labour, across the board (Austria, Germany, Ireland, theNetherlands, Spain, Sweden and the United Kingdom) or targeted on the lowerincome groups (Denmark, France, Finland, Italy and Portugal).
Tax relief to make work more attractive for targeted groups of the population (spouses andlow-paid workers in most cases). An earned income tax credit (EITC) and/or a taxrelief for childcare expenses have been introduced or raised in Belgium, Finland,Germany, Italy, the Netherlands and the United Kingdom. To improve secondearners’ incentives to enter work, Ireland is switching gradually from a joint to anindividual assessment of married couple income. France, Germany, Greece, andSpain have also recently raised the general personal income tax allowance, thusexempting the income of most low-qualified workers from taxation. In addition, to
publi.sgml.compo.fm Page 101 Friday, August 2, 2002 8:31 AM
OECD Economic Studies No. 34, 2002/I
102
© OECD 2002
average and marginal tax wedges on labour remain high. At the wage level of anaverage production worker (APW), the average effective tax wedge on labour inthe EU area approached 40 per cent in year 2000, compared with about 30 and24 per cent in the United States and Japan respectively (Figure 4, Panel A). Formost EU countries, high tax wedges on labour largely reflect the important roleplayed by wage-based contributions in financing the transfer system, as well as itsbroad coverage and public nature. High tax wedges on labour help to explain thelow degree of labour resource utilisation in most EU countries since taxes onlabour are in turn partly shifted forward into labour costs (Daveri and Tabellini,2000).8 This largely reflects various rigidities on the labour and product markets,collective bargaining arrangements, and the weak relation between contributionspaid and transfers received, all of which reduce firms’ ability and/or incentives toresist wage claims.9
… and operate to lower work incentives
The marginal tax wedge on labour, which is an important indicator for workincentives, is also significantly higher than in other OECD countries (Figure 4,Panel C). This may result in a low participation rate and/or in lower working hours.
Box 1. Tax measures to improve labour market performance since the mid-1990s: individual countries’ experiences (cont.)
lessen the unemployment trap, a few countries have removed some of the taxprivileges granted to out-of-work benefits, or introduced a progressive phase-outscheme for means-tested benefits or tax breaks. Unemployment benefits becametaxed in Spain in 1994. In France from 1999, people who qualify for the basicincome support (Revenu Minimum d’Insertion), are granted a temporary exemptionfor the tax on rented flats (taxe d’habitation) once they find a job. In 2001, anemployment bonus (Prime pour l’emploi) delivered through the tax system is beingintroduced and is expected to benefit up to ten million people. As a key elementof the United Kingdom’s Welfare to Work programme, the qualifying ceiling forseveral in-work support schemes has been raised and the phase-out rate lowered.
1. In France, a system of graduated rebates of social charges on low wages (ristourne dégres-sive) was instituted in 1993 and later refined and extended in several stages. For moredetails, see OECD (1999a), Gubian (1999) and Pearson (2000).
2. In the previous system, firms paying wages above the lower limit were required to payNational Insurance on wages below it (as were employees), effectively providing anentrance fee for workers whose wages rose above the threshold.
publi.sgml.compo.fm Page 102 Friday, August 2, 2002 8:31 AM

Tax Systems in European Union Countries
103
© OECD 2002
Figure 4. Tax wedges on labour1
1. For a single individual at the income level of the average production worker. Tax wedges are calculated by express-ing the sum of personal income tax, employee plus employer social security contributions together with any payrolltaxes as a percentage of labour costs (gross wage plus employers’ contributions).
2. Data for 2000 are based on estimated wage levels of the average production worker.3. Weighted using 1995 GDP and purchasing power parities.4. The first year refers to 1991 or the earliest year available. To be consistent with the 1991 data, the 2000 data for
Austria excludes payroll taxes.Source: OECD, Taxing wages 1999-2000.
% %
A. Average tax wedge, 20002
% %
% %
15
10
5
0
-5
-10
-15
15
10
5
0
-5
-10
-15
70
60
50
40
30
20
10
70
60
50
40
30
20
10
EU average3
OECD average3
EU average3
OECD average3
60
50
40
30
20
10
0
60
50
40
30
20
10
0
BEL
HUN
GER
SWE
FRA
FIN ITA
AUT
NLD
DEN
CZE
POL
TUR
ESP
NOR
GRC
LUX
PRT
CAN
USA
GBR
CHE
IRL
ISL
JPN
AUS
NZL
KOR
MEX
BEL
HUN
GER
SWE
FRA
FIN ITA
AUT
NLD
DEN
CZE
POL
TUR
ESP
NOR
GRC
LUX
PRT
CAN
USA
GBR
CHE
IRL
ISL
JPN
AUS
NZL
KOR
MEX
BEL
HUN
GER
SWE
FRA
FIN ITA
AUT
NLD
DEN
CZE
POL
TUR
ESP
NOR
GRC
LUX
PRT
CAN
USA
GBR
CHE
IRL
ISL
JPN
AUS
NZL
KOR
MEX
Personal income taxEmployee’s social security contributionsEmployer’s social security contributions
B. Changes in the average tax wedge between 1991 and 20004
C. Marginal tax wedge, 2000
% %
A. Average tax wedge, 20002
% %
% %
15
10
5
0
-5
-10
-15
15
10
5
0
-5
-10
-15
70
60
50
40
30
20
10
70
60
50
40
30
20
10
EU average3
OECD average3
EU average3
OECD average3
60
50
40
30
20
10
0
60
50
40
30
20
10
0
BEL
HUN
GER
SWE
FRA
FIN ITA
AUT
NLD
DEN
CZE
POL
TUR
ESP
NOR
GRC
LUX
PRT
CAN
USA
GBR
CHE
IRL
ISL
JPN
AUS
NZL
KOR
MEX
BEL
HUN
GER
SWE
FRA
FIN ITA
AUT
NLD
DEN
CZE
POL
TUR
ESP
NOR
GRC
LUX
PRT
CAN
USA
GBR
CHE
IRL
ISL
JPN
AUS
NZL
KOR
MEX
BEL
HUN
GER
SWE
FRA
FIN ITA
AUT
NLD
DEN
CZE
POL
TUR
ESP
NOR
GRC
LUX
PRT
CAN
USA
GBR
CHE
IRL
ISL
JPN
AUS
NZL
KOR
MEX
Personal income taxEmployee’s social security contributionsEmployer’s social security contributions
B. Changes in the average tax wedge between 1991 and 20004
C. Marginal tax wedge, 2000
publi.sgml.compo.fm Page 103 Friday, August 2, 2002 8:31 AM

OECD Economic Studies No. 34, 2002/I
104
© OECD 2002
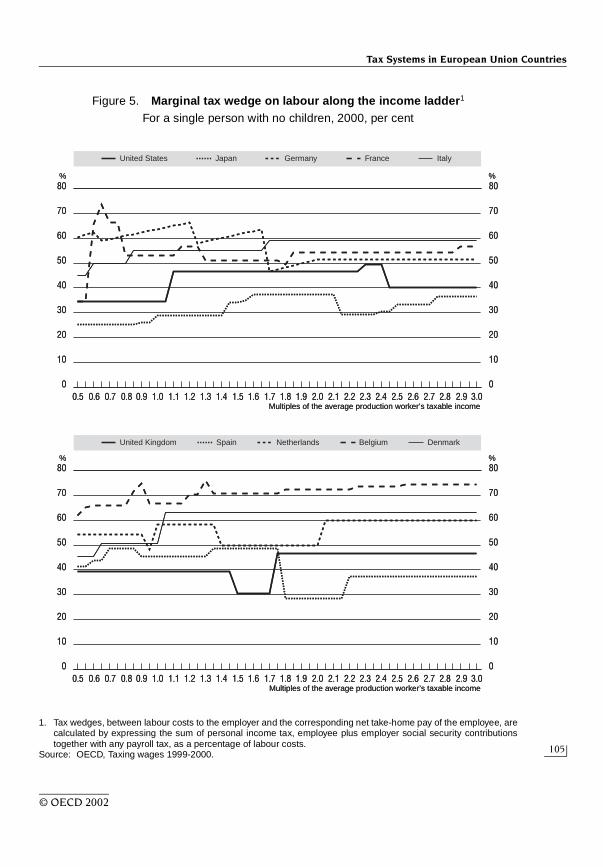
If the system contains some elements of family taxation (either because incometaxes are levied on households rather than individuals or because there arefamily-related tax allowances or credits), high marginal tax wedges on labour maydiscourage a potential second earner from taking on a job. In some countries, inparticular the Nordic countries, the distorting effects of the tax system seem towork through short working time amid high participation rates.10 In some countries,low-paid workers are the most severely affected by high taxes on labour, despitenominally progressive income tax schedules (Figure 5). This largely reflects socialsecurity contribution ceilings and/or floors (in place in Austria, Germany, Greece,the Netherlands and Spain) and the fact that high-income earners may benefitfrom tax relief on certain components of their income, such as compensationin-kind and/or stock options.11
The interaction of the tax and transfer systems further creates incentives toremain outside the labour market for some groups, in particular low-wage andolder workers, as well as spouses of low-income earners. First, some EU countrieshave applied favourable tax rules to pensions, which combined with a front-loaded accumulation pattern of pension rights, provide strong incentives for earlyretirement (Blöndal and Scarpetta, 1999).12 This may partly explain the relativelylow participation rates for older people. Second, at the family level, net replace-ment rates are close to, or exceed, 100 per cent in some cases and may thus createunemployment traps (Table 2). This partly reflects a preferential tax treatmentgranted to transfer payments or the granting of benefits conditional on the familyincome level. In fact, unemployment benefits are tax free or taxed at a reducedrate in Austria, Belgium, Germany, Greece, and Portugal and social security contri-butions are often payable by beneficiaries at a reduced rate (OECD, 1999b).13
High marginal effective tax rates at the low end of the wage scale could also reflectemployment conditional benefits or tax reductions, such as those currently inplace in Finland, the Netherlands and the United Kingdom. They are designed toincrease the incentive for people without work to take a low-paid job, but on theother hand may encourage those already in work to reduce their working hours orcreate adverse incentives for individuals in families with more than one potentialworker (Dilnot and McCrae, 2000 and Blundell, 2000).14
Consumption taxes play an important role
Consumption taxes account for a large share of total tax revenues
Effective tax rates on consumption in the EU area are, on average, higherthan in most other OECD countries. This not only reflects a higher tax-to-GDPratio but also a tax mix relying heavily on consumption taxes. In fact, consumption-based taxes accounted for 29 per cent of total tax revenues in the EU area in 1999– compared with 20 and 16 per cent in Japan and the United States, respectively –
publi.sgml.compo.fm Page 104 Friday, August 2, 2002 8:31 AM
Tax Systems in European Union Countries
105
© OECD 2002
Figure 5. Marginal tax wedge on labour along the income ladder1
For a single person with no children, 2000, per cent
1. Tax wedges, between labour costs to the employer and the corresponding net take-home pay of the employee, arecalculated by expressing the sum of personal income tax, employee plus employer social security contributionstogether with any payroll tax, as a percentage of labour costs.
Source: OECD, Taxing wages 1999-2000.
% %
% %
80
70
60
50
40
30
20
10
0
80
70
60
50
40
30
20
10
0
80
70
60
50
40
30
20
10
0
80
70
60
50
40
30
20
10
0
0.5 0.6 0.7 0.8 0.9 1.0 1.1 1.2 1.3 1.4 1.5 1.6 1.8 1.9 2.0 2.1 2.3 2.4 2.5 2.6 2.7 2.8 2.9 3.02.21.7
0.5 0.6 0.7 0.8 0.9 1.0 1.1 1.2 1.3 1.4 1.5 1.6 1.8 1.9 2.0 2.1 2.3 2.4 2.5 2.6 2.7 2.8 2.9 3.02.21.7
ItalyFranceGermanyJapanUnited States
Multiples of the average production worker’s taxable income
DenmarkBelgiumNetherlandsSpainUnited Kingdom
Multiples of the average production worker’s taxable income
% %
% %
80
70
60
50
40
30
20
10
0
80
70
60
50
40
30
20
10
0
80
70
60
50
40
30
20
10
0
80
70
60
50
40
30
20
10
0
0.5 0.6 0.7 0.8 0.9 1.0 1.1 1.2 1.3 1.4 1.5 1.6 1.8 1.9 2.0 2.1 2.3 2.4 2.5 2.6 2.7 2.8 2.9 3.02.21.7
0.5 0.6 0.7 0.8 0.9 1.0 1.1 1.2 1.3 1.4 1.5 1.6 1.8 1.9 2.0 2.1 2.3 2.4 2.5 2.6 2.7 2.8 2.9 3.02.21.7
ItalyFranceGermanyJapanUnited States
Multiples of the average production worker’s taxable income
DenmarkBelgiumNetherlandsSpainUnited Kingdom
Multiples of the average production worker’s taxable income
publi.sgml.compo.fm Page 105 Friday, August 2, 2002 8:31 AM

OECD Economic Studies No. 34, 2002/I
106
© OECD 2002
with VAT playing a dominant role, accounting for about 60 per cent of total taxrevenues on goods and services in the EU area. The heavy reliance on consump-tion taxes, notwithstanding some administrative issues they raise, has severaladvantages: i) consumption taxes are relatively neutral towards saving and invest-ment decisions; ii) they do not discriminate between imports and locally-produced goods and do not affect external competitiveness (as long as they arebased on the destination principle); and iii) they provide a symmetric treatment of
Table 2. Marginal effective tax rates on additional income for different family types1
1997
1. This table provides estimates on the incentives to increase working hours or to move out from non-employment forthe secondary earner of a family with two children, taking into account the labour market position of the principalearner. The marginal effective tax rate (METR) expresses the amount of earnings which are “taxed away”, either viaincome taxes or means-testing procedures and cancellation of benefits. METR = 1 – (net income in work – netincome out of work)/change in gross income. Part-time employment corresponds to 16 hours or two days each week,and total earnings are 40 per cent of the average production worker level of earnings. Earnings from full-timeemployment correspond to average production worker earnings.
Source: OECD (1999), Benefit system and work incentives.
Principal earner Full-time employed UnemployedPart-time employed
Secondary earnerFull-time employed
Part-time employed
Non-employed
Full-time employed
Part-time employed
withoutbenefit
entitlements
Non-employed
Austria 30 21 76 32 43 135Belgium 57 61 68 43 25 109Denmark 50 48 84 55 61 84Finland 36 23 88 48 23 117France 28 38 76 29 30 69Germany 51 50 80 31 19 115Greece 30 30 54 66 118 104Ireland 32 25 68 20 38 83Italy 33 25 63 37 19 84Luxembourg 30 14 87 26 12 198Netherlands 39 37 89 45 52 90Portugal 21 13 79 14 11 174Spain 23 19 78 23 19 77Sweden 37 42 88 43 42 79United Kingdom 28 20 72 60 55 93
Memorandum items:Canada 37 33 75 34 29 105Japan 12 10 60 10 7 133United States 19 11 68 20 0 102
OECD average 32 27 74 34 32 107EU average 35 31 77 38 38 107
publi.sgml.compo.fm Page 106 Friday, August 2, 2002 8:31 AM
Tax Systems in European Union Countries
107
© OECD 2002
labour, transfer and capital income, thus creating fewer disincentives to work andmeeting the criteria for horizontal equity better than income taxes.
But rate differentiation and exemptions contribute to lower efficiency and neutrality of consumption taxes…
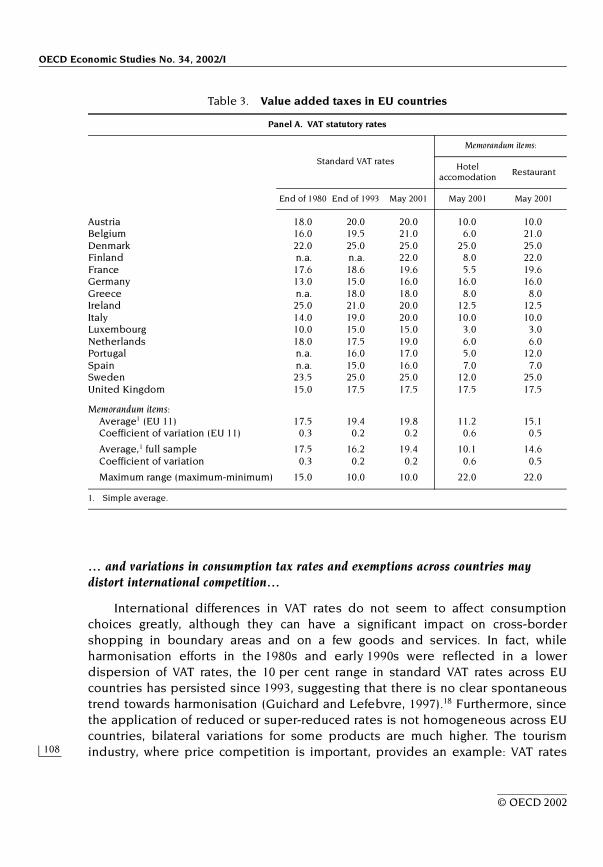
However, many EU countries have maintained reduced rates or exemptions forthe value added tax which induce revenue losses.15 In most cases, this tax reliefreflects distributional considerations.16 However, where such use of VAT rate differ-entiation is extensive, it gives rise to large dead-weight losses as reduced rates ben-efit also high income groups (e.g. those for restaurant and hotel services). Adding todirect revenue losses, rate differentiation also lowers VAT efficiency indirectly byincreasing the complexity of the system and making it more difficult to assess thedegree of tax compliance. Overall, as of 1998, effective rates were far below standardrates, in particular in Belgium, Italy, Spain, and Sweden (Table 3). To lower compli-ance costs for small enterprises, turnover thresholds below which firms are notrequired to register for VAT have been introduced; the tax liability must thus bedetermined by applying presumptive methods and/or through simplified regimes.This increases the difficulty of monitoring compliance and may induce tax avoidanceby splitting companies into smaller units and under-reporting sales. And the recentItalian experience has shown that requiring small (non-incorporated) companies toregister for VAT may also prompt better overall compliance with the tax code.
Differentiated rates and exemptions may also distort competition andconsumption patterns within EU countries. For example, one long-standing case ofdistortion has been the privileged tax treatment of catering (which is taxed at areduced VAT rate in most EU countries) against restaurant services. Other caseshave emerged more recently with the introduction of competition in those sectorswhich were traditionally controlled by the public sector – e.g. postal and telecom-munications services, radio and television broadcasting services, as well aselectricity, gas and water supply. Under current VAT rules, public sector bodies aresubject to a special (and rather complex) VAT treatment which potentially distortscompetition (Aujean et al., 1999). One key exemption case of public sector bodiesapplies to the supply of postal services, which have been traditionally operatedby monopolistic public agencies and are increasingly operating in competitivemarkets. In this context, the special VAT treatment granted to public bodies, inplace in some countries, may operate to distort competition, as evidenced by thecomplaints already received from private operators. It may also introduce a biasfor public authorities towards self-supply of goods and services versus contractingout to the private sector since they may not claim back the VAT paid ontheir inputs provided by the private sector. However, Denmark, Finland, theNetherlands, Sweden, and the United Kingdom have introduced special refundschemes to allow local authorities a refund of VAT outside the VAT system.17
publi.sgml.compo.fm Page 107 Friday, August 2, 2002 8:31 AM
OECD Economic Studies No. 34, 2002/I
108
© OECD 2002
… and variations in consumption tax rates and exemptions across countries may distort international competition…
International differences in VAT rates do not seem to affect consumptionchoices greatly, although they can have a significant impact on cross-bordershopping in boundary areas and on a few goods and services. In fact, whileharmonisation efforts in the 1980s and early 1990s were reflected in a lowerdispersion of VAT rates, the 10 per cent range in standard VAT rates across EUcountries has persisted since 1993, suggesting that there is no clear spontaneoustrend towards harmonisation (Guichard and Lefebvre, 1997).18 Furthermore, sincethe application of reduced or super-reduced rates is not homogeneous across EUcountries, bilateral variations for some products are much higher. The tourismindustry, where price competition is important, provides an example: VAT rates
Table 3. Value added taxes in EU countries
1. Simple average.
Panel A. VAT statutory rates
Standard VAT rates
Memorandum items:
Hotel accomodation
Restaurant
End of 1980 End of 1993 May 2001 May 2001 May 2001
Austria 18.0 20.0 20.0 10.0 10.0Belgium 16.0 19.5 21.0 6.0 21.0Denmark 22.0 25.0 25.0 25.0 25.0Finland n.a. n.a. 22.0 8.0 22.0France 17.6 18.6 19.6 5.5 19.6Germany 13.0 15.0 16.0 16.0 16.0Greece n.a. 18.0 18.0 8.0 8.0Ireland 25.0 21.0 20.0 12.5 12.5Italy 14.0 19.0 20.0 10.0 10.0Luxembourg 10.0 15.0 15.0 3.0 3.0Netherlands 18.0 17.5 19.0 6.0 6.0Portugal n.a. 16.0 17.0 5.0 12.0Spain n.a. 15.0 16.0 7.0 7.0Sweden 23.5 25.0 25.0 12.0 25.0United Kingdom 15.0 17.5 17.5 17.5 17.5
Memorandum items:Average1 (EU 11) 17.5 19.4 19.8 11.2 15.1Coefficient of variation (EU 11) 0.3 0.2 0.2 0.6 0.5
Average,1 full sample 17.5 16.2 19.4 10.1 14.6Coefficient of variation 0.3 0.2 0.2 0.6 0.5
Maximum range (maximum-minimum) 15.0 10.0 10.0 22.0 22.0
publi.sgml.compo.fm Page 108 Friday, August 2, 2002 8:31 AM

Tax Systems in European Union Countries
109
© OECD 2002
range between 3 and 25 per cent within the EU area. The dispersion of exciseduties is even larger and induces not only cross-border shopping but alsosmuggling.19 Overall, some EU countries can maintain lower indirect tax rates, thusattracting consumers from neighbouring countries. This serves to raise their taxrevenues at the expense of neighbouring countries and contributes to the erosionof aggregate EU tax revenues.20
The emergence and rapid development of e-commerce transactions hasgiven a new, and international, dimension to the potential non-neutralitiesembodied in the current VAT system. For services delivered on-line, internationalpractices for taxing e-commerce give rise to significant distortions, inducing adiscrimination against EU online sellers, and within the EU area against high VAT
Table 3. Value added taxes in EU countries (cont.)
1. Simple average.2. Effective VAT rates are calculated by dividing VAT revenue by its base (i.e. consumption exclusive of consumption
taxes).3. Position as at 1st January 1998.4. € 76 225 for delivery of goods, restaurants and accomodation; € 26 679 for other services.5. € 25 395 (excluding VAT) for suppliers of services.6. When net tax payable lies between € 1 345 and € 1 883 businesses receive a graduated relief.7. Individual retailers do not register for the VAT.Sources: OECD, Revenue Statistics, 1965-1999; OECD, Consumption Tax Trends. European Commission (2001), VAT rates
applied in the Member States of the European Community, Doc/2905/2001-EN.
Panel B. Effectiveness of value added taxes, 1998
Standard VAT rates,2 per cent
Effective VAT3 rates, per cent
Effective VAT rates in per cent of standard rates
Memorandum items:Turnover thresholds for VAT exemption
(position as of 1 January 2000)
A B B/A Euro
Austria 20.0 12.2 61.2 21 802Belgium 21.0 10.3 49.0 5 578Denmark 25.0 14.6 58.3 2 681Finland 22.0 12.9 58.5 8 409France 20.6 10.9 53.0 76 225/26 6794
Germany 16.0 9.4 59.0 16 617Greece 18.0 9.5 53.0 7 337Ireland 21.0 12.2 58.2 50 790/25 3955
Italy 20.0 8.5 42.7 2 582Luxembourg 15.0 8.9 59.2 9 916Netherlands 17.5 10.5 60.1 1 8836
Portugal 17.0 10.5 61.5 14 964Spain 16.0 8.0 49.7 . .7
Sweden 25.0 10.0 40.1 . .United Kingdom 17.5 8.8 50.1 82 426
EU average1 19.4 10.5 54.2
publi.sgml.compo.fm Page 109 Friday, August 2, 2002 8:31 AM
OECD Economic Studies No. 34, 2002/I
110
© OECD 2002
countries. This occurs because the VAT rate which applies for electronic deliveries(B2C transactions and to some extent B2B transactions) is the one where thesupplier is located (i.e. the origin principle). Thus, online sellers established in EUcountries with a low VAT rate have a competitive advantage over those in higherVAT countries. In addition, EU online sellers currently suffer a double competitivedisadvantage vis-à-vis non-EU countries. First, if an EU customer buys and down-loads software from an EU online retailer, then VAT is imposed. In contrast, if theretailer is based outside the EU, the transaction is tax-free. Second, services soldto a customer outside the EU area are subject to VAT.
To remove discriminatory factors on services delivered online, the Commis-sion proposed a directive in June 2000 requiring non-EU e-commerce providers toregister in at least one EU country when offering services to private consumersand charge the VAT according to the rules of that country on all online sales. Toensure that the compliance burden is eliminated where it would reduce the incen-tive to carry on business activity and to permit tax administrations to focusresources where the return is likely to be high, the proposed directive introducesthresholds of online sales.21 In addition, the Swedish authorities, during theirPresidency of the Council of the European Union in 2001, have proposed torequire vendors to charge VAT at the rate applicable to the customer’s country ofresidence. This would reduce the competitiveness bias against high VAT countriesand the non-neutralities between electronic and traditional commerce. However,despite broad support of most EU countries, there is currently no agreedapproach to levy VAT on e-commerce while any decision at the EU level requiresunanimity. In any case, in absence of an enhanced international co-operationamong tax administrations, fair and effective taxation of e-commerce transactionswould rely on voluntary compliance by companies based outside the EU area.Given the complexity of existing VAT rules and the lack of effective enforcement, itmay be faster and cheaper for traders to opt for non-compliance. However, privatepurchasers often prefer to deal with entities that have established a degree ofcredibility and trust, including compliance with tax rules.
… while “transitional” VAT arrangements are complex, not uniformly applied and prone to tax evasion
The lack of uniformity in the implementation of EC Directives on VAT acrossEU countries and procedural complications that the cross-country differences inthe VAT regime entail in a single market creates further distortions in trade flows.The “transitional” VAT regime for cross-border trade, implemented since theabolition of custom controls between EU countries in 1993 (Appendix 1) embodiesa wide variety of rules for determining the place where the transaction is taxedand, consequently, the place where the tax is deducted or refunded.22 TheEuropean Commission has argued that, in conjunction with the lack of uniformity
publi.sgml.compo.fm Page 110 Friday, August 2, 2002 8:31 AM

Tax Systems in European Union Countries
111
© OECD 2002
in which the present VAT system is applied, this creates confusion, additionalworkloads, administrative complication and legal uncertainty for traders(European Commission, 1999a and 1999b). This is reflected in the fact thatbusiness surveys consistently point to the complexities of VAT procedures as amajor disincentive to cross-border trade.23 As an illustration, a survey on Dutchfirms estimated that compliance costs of the transitional VAT system are equiva-lent to a 5 per cent border tax on intra-community transactions (Verwaal andCnossen, 2000).
This “transitional” system may be also prone to fraud, as goods travel tax-freeacross intra-EU frontiers, unless EU countries’ tax authorities fully co-operate witheach other. The European Commission (1998b) noted: “Given that, rather thanbeing collected at the moment of importation, VAT is recovered at a later stage,and on the basis of the taxpayers’ periodic declarations, the possibility of fraudhas been proportionately increased”.24 And VAT declarations are rarely subject toselective and co-ordinated controls.25 As a result, according to the EuropeanCommission (2000e) estimates, VAT fraud amounts to € 8 billion annually, and theEuropean Commission (2000d) noted, “there are indications that the level ofserious fraud in intra-Community trade is growing”.
One solution to cut compliance costs, which create distortions in the singlemarket, and to reduce scope for tax fraud would be to replace the destinationprinciple by the origin principle (see Appendix 1). The taxation of imports and thenon-taxation of exports would be abolished and the VAT system would be oper-ated within the EU area in the same way as it would within a single country. Eventhough the European Commission remains committed to adopting such a system,it could only be introduced with greater harmonisation in value added taxesacross EU countries, including tax rates. It would also require the introduction of arevenue-sharing scheme. Acknowledging the significant technical and politicalchallenges associated with such a radical change, the Commission proposed a newapproach in June 2000 to improve the current “transitional” system. The “Strategyto improve the operation of the VAT system within the context of the internalmarket” (European Commission, 2000c) is based on four objectives: simplificationof current rules and their modernisation (in particular to reflect recent develop-ments in e-commerce, and some network industries, such as postal services,broadcasting, water and electricity), more uniform application of current rules anda new approach to administrative co-operation.
Environment-related taxes raise substantial revenues
Environmentally-related taxes represent a much higher share of GDP in EUcountries than in most other OECD countries (Figure 6). Motor fuel and vehicletaxes account for the bulk of these revenues. However, over past decades, EU
publi.sgml.compo.fm Page 111 Friday, August 2, 2002 8:31 AM

OECD Economic Studies No. 34, 2002/I
112
© OECD 2002
countries have increased the use of economic instruments for pollution control.They have given preferences to taxes, while other countries – in particularthe United States – have made greater efforts to rely on pollution permits(OECD, 1999c).26 A number of countries have implemented comprehensive greentax reforms, e.g. Denmark, Finland, Germany, the Netherlands and Sweden(OECD, 2001).
However, the tax system does not always provide appropriate incentives toabate pollution. Fuel and vehicle taxes have usually been introduced for fiscalrather than environmental reasons. In addition, the objectives of avoidingcompetitiveness losses in particular sectors, as well as regional developmentconsiderations, have often taken precedence in the design of the tax system overthe provision of incentives to abate pollution. This has frequently resulted in apreferential tax treatment granted to heavy polluters, in particular agriculture andenergy-intensive manufacturing industries.27 Some countries (Denmark and theUnited Kingdom, for example) make exemptions for firms conditional on their
Figure 6. Revenues from environmentally-related taxes1
1998, in per cent of GDP and total tax revenue
1. These data do not reflect environment-related provisions in other taxes, including personal and corporate income-taxes, such as accelerated provisions or tax credits for energy-saving and pollution-reducing equipment.
2. 1997 instead of 1998.3. 1995 instead of 1998.4. Weighted average.Source: Environmentally-related tax database, OECD.
8
6
4
2
0
1
3
5
7
16
14
10
6
0
4
8
12
2
Share of GDP (left scale)
Denmark
Share of total tax revenues (right scale)
Per cent Per cent
Icelan
d3
Japa
n
Irelan
d
New Ze
aland
Spain
Portu
gal
Norway
Greece
2
Czec
h Rep
ublic
Austr
ia
Franc
e
United
King
dom
Cana
da
Belgi
um
Swed
en
Netherl
ands
Korea
Mexico
3
Finlan
dIta
ly2
Polan
d
German
y
Hunga
ry
Luxe
mbour
g
Turke
y
United
State
sEu
rope
an U
nion
4OEC
D4
Switz
erlan
d
8
6
4
2
0
1
3
5
7
16
14
10
6
0
4
8
12
2
Share of GDP (left scale)
Denmark
Share of total tax revenues (right scale)
Per cent Per cent
Icelan
d3
Japa
n
Irelan
d
New Ze
aland
Spain
Portu
gal
Norway
Greece
2
Czec
h Rep
ublic
Austr
ia
Franc
e
United
King
dom
Cana
da
Belgi
um
Swed
en
Netherl
ands
Korea
Mexico
3
Finlan
dIta
ly2
Polan
d
German
y
Hunga
ry
Luxe
mbour
g
Turke
y
United
State
sEu
rope
an U
nion
4OEC
D4
Switz
erlan
d
publi.sgml.compo.fm Page 112 Friday, August 2, 2002 8:31 AM

Tax Systems in European Union Countries
113
© OECD 2002
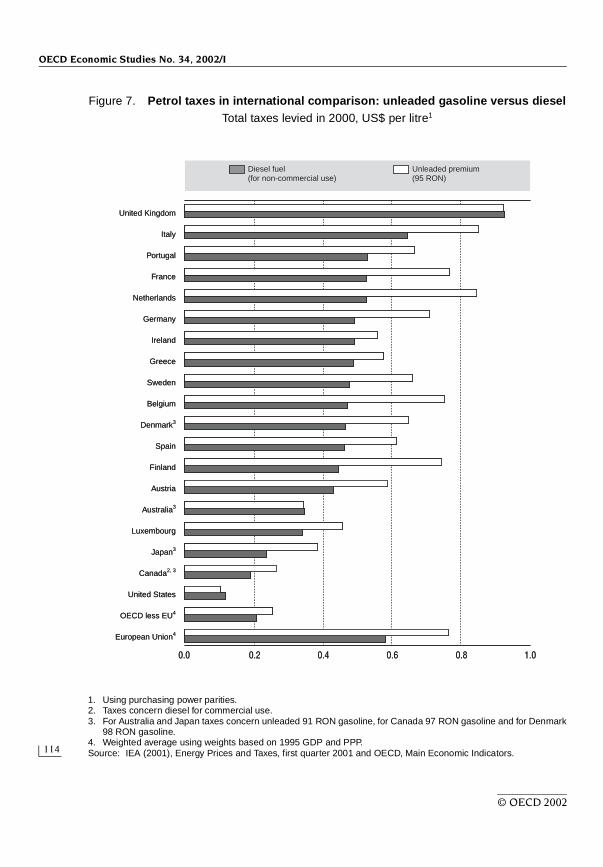
agreeing to reduce their emissions substantially. Such an approach is administra-tively burdensome and it is not clear that the reduction achieved will be muchgreater than would have occurred anyway (O’Brien and Vourc’h, 2001). Also, existingtaxes on electricity are not differentiated by the carbon content of the primaryenergy used in most EU countries, as efficient efforts to discourage greenhouse gasemissions would warrant. As a result, tax rates in terms of CO2 emissions vary consid-erably (estimates for Germany are provided in Kirkpatrick et al., 2001 and for Finlandin Vourc’h and Jimenez, 2000). The low taxation of diesel compared to gasoline inthe European Union (Figure 7) – diesel releases more CO2 per litre and other envi-ronmental costs associated with diesel are higher – is another illustration of thefailure of taxes to reflect the pollution content of products/activities.28
Taxation of capital is relatively low but some distortions remain
Tax rates on saving vehicles are relatively low and converging
Progress towards greater tax neutrality on capital income accruing from differ-ent types of assets has been a hallmark of recent reforms in most EU countries.Precursors are the Nordic countries (Denmark, Finland, Norway and Sweden)which adopted a dual income tax system in the late 1980s-early 1990s (for adescription of this model, see Cnossen, 1997). Under such a system, a unique flatrate tax applies to net capital income (interest income, dividends and capitalgains) while labour income is subject to an additional and progressive tax. Mostother EU countries have not adopted a “pure” dual income tax system but increas-ingly tax interest income and capital gains at flat rates, usually lower than marginalrates which apply to labour income; and these rates are tending to converge(e.g. Austria, France, Germany, Greece, Italy and Spain).29 The Netherlands hasalso introduced a system which resembles a dual income tax system in 2001 (theso-called “box approach”).30 The move towards a lower and flat tax on capitalincome has often reflected the need to remain competitive on the internationalcapital market, in particular in the context of free capital movements and theadvent of the single currency, and/or the difficulty of securing a proper tax assess-ment (in particular in countries which have maintained bank secrecy for taxpurposes). The potential drawback of the dual income tax model is that it mayhave adverse effects on income distribution. Also, moving to a dual income taxsystem may prompt tax planning, in particular for small enterprises and liberalprofessions for whom the distinction between labour and capital income is notalways easy to draw (Strand, 1999 and Van den Noord, 2000).
But the taxation of saving still favours housing investment and retirement schemes…
Most EU countries grant tax-favoured treatment to specific saving instru-ments. Typically, retirement schemes and housing investment benefit from the
publi.sgml.compo.fm Page 113 Friday, August 2, 2002 8:31 AM
OECD Economic Studies No. 34, 2002/I
114
© OECD 2002
Figure 7. Petrol taxes in international comparison: unleaded gasoline versus dieselTotal taxes levied in 2000, US$ per litre1
1. Using purchasing power parities.2. Taxes concern diesel for commercial use.3. For Australia and Japan taxes concern unleaded 91 RON gasoline, for Canada 97 RON gasoline and for Denmark
98 RON gasoline.4. Weighted average using weights based on 1995 GDP and PPP.Source: IEA (2001), Energy Prices and Taxes, first quarter 2001 and OECD, Main Economic Indicators.
0.0 0.2 0.4 0.6 0.8 1.0
Diesel fuel(for non-commercial use)
Unleaded premium(95 RON)
United Kingdom
Italy
Portugal
France
Netherlands
Germany
Ireland
Greece
Sweden
Belgium
Denmark3
Spain
Finland
Austria
Australia3
Luxembourg
Japan3
Canada2, 3
United States
OECD less EU4
European Union4
0.0 0.2 0.4 0.6 0.8 1.0
Diesel fuel(for non-commercial use)
Unleaded premium(95 RON)
United Kingdom
Italy
Portugal
France
Netherlands
Germany
Ireland
Greece
Sweden
Belgium
Denmark3
Spain
Finland
Austria
Australia3
Luxembourg
Japan3
Canada2, 3
United States
OECD less EU4
European Union4
publi.sgml.compo.fm Page 114 Friday, August 2, 2002 8:31 AM
Tax Systems in European Union Countries
115
© OECD 2002
most generous tax breaks. In both cases, these breaks are motivated in part bysocial or economic objectives: alleviating future pressures on public pensionschemes and facilitating population access to proper housing. It is unclear if thesemeasures succeed in achieving these aims. Several empirical studies (OECD,1994b) have shown that tax incentives are mainly reflected in the composition– and not the level – of saving. In addition, tax privileges to pension vehicles oftengive some institutions – pension funds and insurance companies in many cases –an undue competitive advantage over other financial intermediaries (Carey et al.,1999). As well, tax privileges for housing investment may largely be capitalised,reflected in higher land and house prices given the low responsiveness of housingsupply to demand, or in the financial conditions of mortgage loans if competitionin the banking sector is low.
Tax breaks for retirement saving typically include the provision of tax allow-ances for contributions paid to pension funds or life insurance schemes and theabsence of (or reduced) tax on income or capital gains earned by the funds. ManyEU countries (e.g. Germany, Italy and Spain) have recently increased tax incentivesto retirement saving, though from very different starting points. Adema (2002)estimates that tax breaks towards pensions savings amounted to more than 2 percent of GDP in Ireland and the United Kingdom, but to only 0.1 per cent inGermany in 1997. However, in the absence of co-ordination across the EU area,these tax privileges may act as a barrier to the single market. Specifically, taxincentives for retirement savings could inhibit the participation in another EUcountry pension scheme, since non-resident citizens and companies usually donot get the same tax privileges (both for contributions and benefits) as nationalswhen using the services of a pension provider in another member state.31
Tax breaks granted to owner-occupied housing are both widespread andextremely diverse. First, interest costs, and in some case principal repayments,are deductible from the tax base or give rights to a tax credit in 12 EU countries.32
To be symmetric with productive investments, tax deductibility of home owner-ship costs should only apply if housing is consistently treated as an investmentgood, with service (e.g. imputed rents) being taxed. However, the effective taxationof imputed rents, when it exists, is often low since imputed rents are well belowmarket values in many countries. Furthermore, high compliance and administra-tive costs have also led some countries to abolish the taxation of imputed rents(e.g. Spain in 1999). Second, money invested in housing saving accounts gives theright to a tax rebate in some countries. Third, realised capital gains on owner-occupied housing are tax-free in 13 EU countries.
The under-valuation of housing investment for tax purposes is also reflectedin the low revenues from property taxes as a share of GDP in the EU areacompared to most other OECD countries, the United Kingdom and France beingthe main exceptions (Figure 8). The general trend, however, has been to reduce
publi.sgml.compo.fm Page 115 Friday, August 2, 2002 8:31 AM

OECD Economic Studies No. 34, 2002/I
116
© OECD 2002
the generosity of some of owner-occupied housing tax privileges. The mostdecisive move has been made in the United Kingdom which is fully phasing outthe mortgage interest relief but Denmark, France, Ireland, the Netherlands andSpain have also reduced these tax privileges recently.
Other features of the taxation of capital income introduce significant non-neutralities. First, some EU countries have fairly large basic allowances againstcapital income taxation, in particular in Belgium, France, Germany, theNetherlands and the United Kingdom.33 In some cases, these basic allowancessubstantially reduce the compliance and administrative burden on taxpayers whomake small gains or losses on everyday items. However, these allowances alsolower tax revenues, create threshold effects, harm horizontal equity, and worsenincome redistribution. Second, some countries grant tax incentives for longholding periods (e.g. Austria, Germany, Portugal, Spain and the United Kingdom).They aim to encourage owners to take longer-term investment decisions. How-ever, they may also create a “lock-in effect”, by reducing the liquidity of capitalmarkets and limiting the financing available for newly created and dynamic firms.
Figure 8. Taxes on property1999
1. Weighted average using 1995 GDP and purchasing power parities.Source: OECD Revenue Statistics, 1965-2000.
4.5
3.5
2.5
2.0
0.0
1.5
3.0
4.0
1.0
0.5
4.5
3.5
2.5
2.0
0.0
1.5
3.0
4.0
1.0
0.5
Taxes on financial and capital transactions Other property taxes
Icelan
d
Japa
n
Irelan
d
New Ze
aland
Spain
Portu
gal
Norway
Greece
Czec
h Rep
ublic
Austr
alia
Franc
eUnit
ed Ki
ngdo
m
Cana
da
Belgi
um
Switz
erlan
d
Korea
Finlan
d
Denmark
Polan
d
German
y
Hunga
ry
Luxe
mbour
g
Turke
y
United
State
s
Swed
en Italy
Austr
ia
Tax revenues, per cent of GDPTax revenues, per cent of GDP
Recurrent taxes on immovable property Estate, inheritance and gift taxes
OECD1
European Union1
Netherl
ands
Slova
k Rep
ublic
4.5
3.5
2.5
2.0
0.0
1.5
3.0
4.0
1.0
0.5
4.5
3.5
2.5
2.0
0.0
1.5
3.0
4.0
1.0
0.5
Taxes on financial and capital transactions Other property taxes
Icelan
d
Japa
n
Irelan
d
New Ze
aland
Spain
Portu
gal
Norway
Greece
Czec
h Rep
ublic
Austr
alia
Franc
eUnit
ed Ki
ngdo
m
Cana
da
Belgi
um
Switz
erlan
d
Korea
Finlan
d
Denmark
Polan
d
German
y
Hunga
ry
Luxe
mbour
g
Turke
y
United
State
s
Swed
en Italy
Austr
ia
Tax revenues, per cent of GDPTax revenues, per cent of GDP
Recurrent taxes on immovable property Estate, inheritance and gift taxes
OECD1
European Union1
Netherl
ands
Slova
k Rep
ublic
publi.sgml.compo.fm Page 116 Friday, August 2, 2002 8:31 AM
Tax Systems in European Union Countries
117
© OECD 2002
… and often grants a favoured regime to non-residents
Some international issues also exist. EU countries still apply different taxprovisions on capital income, and often grant a preferential tax treatment to non-residents. While it must be noted that the tax treatment of income, for residentsand non-residents, varies substantially between different financial assets, theexample of the treatment accorded to interest from government bonds is shown inTable 4. Since some tax administrations do not exchange information on interestincome on an automatic basis, or apply a withholding tax on every non-resident’ssavings income, EU residents may be able unlawfully to escape the tax on thisincome imposed by their residence country, as well as lawfully earn the interestfree of tax in the source country. In 1998, the European Commission proposed adirective on the taxation of cross-border savings of individuals. It was intended toensure a minimum effective taxation on cross-border interest payments of EUindividuals within the EU area but has no direct impact on tax regimes applicableto residents. It envisaged the co-existence of two models: a withholding tax and anautomatic exchange of information.34
In 2000, a revised approach was agreed by EU finance ministers which identi-fied the automatic exchange of information system as the preferred regime in thelong term. Effective exchange of information is preferred by the EU to a with-holding tax system because it represents the only way in which income fromsavings invested overseas can be taxed on the same basis as domestic savings,thus avoiding distorting saving flows and horizontal equity.35 The agreementprovides a seven-year transition period during which Austria, Belgium andLuxembourg may operate a withholding tax system before implementing anexchange of information system. The revised approach also introduced a delaybefore the directive comes into force to allow negotiation with some non-EU finan-cial centres over adopting similar measures. Luxembourg and Austria haveindicated that their eventual approval of the directive – which is due before theend of 2002 and under the rule of unanimity – would be conditional on theCommission reaching an agreement with non-EU financial centres.36
Arrangements to undo double taxation exist but are still imperfect
Some EU countries grant resident individuals some relief for the taxation atthe corporate level, by granting them a tax credit corresponding to the tax alreadypaid on corporate profits.37 This contrasts with the system in place in Japan, theUnited States and some other OECD countries. For a resident investor, this reliefresults in a lower tax wedge on distributed profits (Figure 9). However, if the typi-cal investor is a resident household, the tax system still gives firms a strong incen-tive to use debt funding rather than new equity or retained earnings in most EU
publi.sgml.compo.fm Page 117 Friday, August 2, 2002 8:31 AM
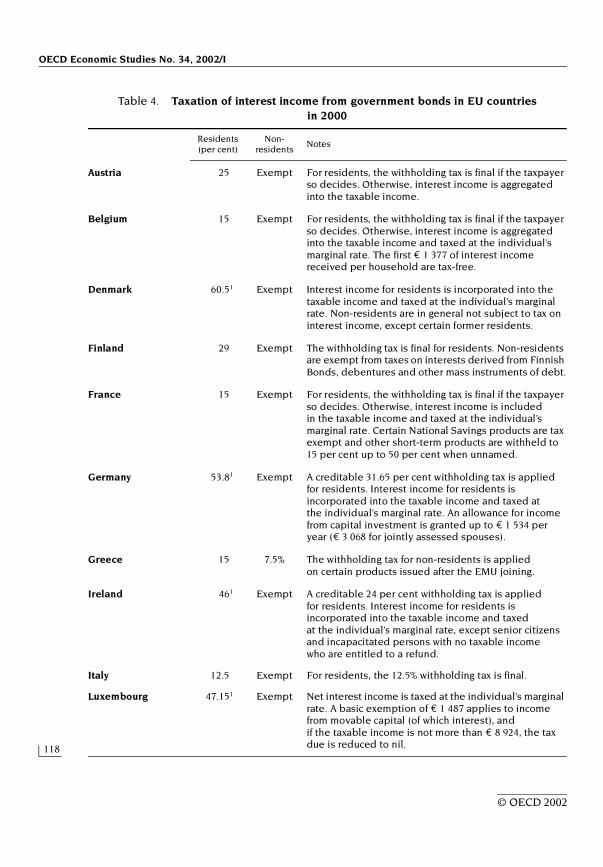
OECD Economic Studies No. 34, 2002/I
118
© OECD 2002
Table 4. Taxation of interest income from government bonds in EU countriesin 2000
Residents (per cent)
Non-residents
Notes
Austria 25 Exempt For residents, the withholding tax is final if the taxpayer so decides. Otherwise, interest income is aggregated into the taxable income.
Belgium 15 Exempt For residents, the withholding tax is final if the taxpayer so decides. Otherwise, interest income is aggregated into the taxable income and taxed at the individual’s marginal rate. The first € 1 377 of interest income received per household are tax-free.
Denmark 60.51 Exempt Interest income for residents is incorporated into the taxable income and taxed at the individual’s marginal rate. Non-residents are in general not subject to tax on interest income, except certain former residents.
Finland 29 Exempt The withholding tax is final for residents. Non-residents are exempt from taxes on interests derived from Finnish Bonds, debentures and other mass instruments of debt.
France 15 Exempt For residents, the withholding tax is final if the taxpayer so decides. Otherwise, interest income is included in the taxable income and taxed at the individual’s marginal rate. Certain National Savings products are tax exempt and other short-term products are withheld to 15 per cent up to 50 per cent when unnamed.
Germany 53.81 Exempt A creditable 31.65 per cent withholding tax is applied for residents. Interest income for residents is incorporated into the taxable income and taxed at the individual’s marginal rate. An allowance for income from capital investment is granted up to € 1 534 per year (€ 3 068 for jointly assessed spouses).
Greece 15 7.5% The withholding tax for non-residents is applied on certain products issued after the EMU joining.
Ireland 461 Exempt A creditable 24 per cent withholding tax is applied for residents. Interest income for residents is incorporated into the taxable income and taxed at the individual’s marginal rate, except senior citizens and incapacitated persons with no taxable income who are entitled to a refund.
Italy 12.5 Exempt For residents, the 12.5% withholding tax is final.
Luxembourg 47.151 Exempt Net interest income is taxed at the individual’s marginal rate. A basic exemption of € 1 487 applies to income from movable capital (of which interest), and if the taxable income is not more than € 8 924, the tax due is reduced to nil.
publi.sgml.compo.fm Page 118 Friday, August 2, 2002 8:31 AM

Tax Systems in European Union Countries
119
© OECD 2002
countries. This results from the fact that, as in most other OECD countries, corpo-rate interest payments – as opposed to distributed profits – are deductible fromthe corporate tax base while at the personal level interest income is often taxed ata rate lower than that which applies to dividends. This may contribute to under-capitalisation, which would make firms more prone to insolvency and, at a macro-level, could exacerbate business cycles. Several countries have recently adoptedmeasures to lower this non-neutrality with respect to the choice of finance, inparticular Denmark and Finland, which have applied a combination of imputationcredits and a dual income tax system since the early 1990s (see above). Contrast-ing with approaches to relieve the double taxation at the shareholder level, morerecently, two countries have introduced a two-tier system of corporate taxation(Italy in 1997-98 and Austria in 2000) to reduce the relative cost of financing new
Table 4. Taxation of interest income from government bonds in EU countries in 2000 (cont.)
1. The reported rate applies to individuals taxed at the highest marginal tax rate.Source: OECD Tax Database 2000.
Residents (per cent)
Non-residents
Notes
Netherlands 601 Exempt Net interest income is taxed at the individual’s marginal rate, with an exemption on the first € 454 (double for married couples).
Portugal 20 20% For residents, the 20 per cent withholding tax is final unless the recipient elects to treat it as a payment on account.
Spain 481 Exempt A creditable 18 per cent withholding tax is applied for residents. Interest income for residents is incorporated into the taxable income and taxed at the individual’s marginal rate. Interest received by European Community debt holders from Spain is exonerated.
Sweden 30 Exempt Taxed as capital income for residents. Interest derived by non-residents is not taxable in Sweden.
United Kingdom 20 Exempt Interest on certain British Government securities is paid net of tax at 20 per cent but may be received gross in certain circumstances. The latter interest income for residents is then incorporated into taxable income and taxed at the individual’s marginal rate. Interest on National Savings Certificates and individual savings accounts (ISA) is tax exempt.
publi.sgml.compo.fm Page 119 Friday, August 2, 2002 8:31 AM

OECD Economic Studies No. 34, 2002/I
120
© OECD 2002
investment via own-capital (Box 2). Overall, in a purely domestic perspective, thetaxation of capital income is both lower and more neutral towards corporatefinancing decisions in most EU countries than in Canada, Japan and theUnited States – largely owing to the relief for double taxation of dividends as wellas relatively low and converging tax rates on capital income. This is evidenced byinternational comparisons of the marginal effective tax wedge, and its standarddeviation, across financing instruments (Table 5).38
Moving from a purely domestic perspective to an open economy with freecapital movements gives a different view on the neutrality of tax relief schemes forcorporate taxation on distributed profits at the individual shareholder level, andon their influence on corporate financial structures. If companies are able tofinance their investment on international capital markets, the personal taxtreatment of investment income at home may not affect much their financingbehaviour, in particular for small and open economies. Thus, imputation reliefcannot be used to address effectively the under-capitalisation concern. Further-more, imputation credits, in place in some EU countries to relieve the double
Figure 9. Combined corporate and personal income tax wedge on distributed profits
1999, resident top earner individuals
1. 1998.Source: The OECD Tax database, 2000.
%%80
60
40
30
10
20
50
70
80
60
40
30
10
20
50
70
Personal income tax on domestic dividend income
Netherl
ands
Corporate income tax rate
Icelan
d
Japa
n
Irelan
d
New Ze
aland
Spain
Portu
gal
Norway
Greece
1
Czec
h Rep
ublic
Austr
ia
Franc
e
United
King
dom
Cana
da
Belgi
um
Switz
erlan
d
Korea
Mexico
Finlan
d
Denmark
Polan
dGerm
any
Hunga
ry
Luxe
mbour
g
Turke
y
United
State
s
Swed
en Italy
Austr
alia
publi.sgml.compo.fm Page 120 Friday, August 2, 2002 8:31 AM
Tax Systems in European Union Countries
121
© OECD 2002
Box 2. Alternative approaches to lessen the double taxation of equity capital: the Italian, Austrian and Finnish approaches
With a view to finding ways of relieving the double taxation on equity capitalother than by granting imputation credits to the shareholders, some EU countrieshave tried to reduce the relative cost of financing new investment via own capitalby introducing some tax breaks directly at the enterprise level, through the corpo-rate income tax.
The DIT and super DIT model in Italy
In Italy, the ordinary rate of corporate income tax is 37 per cent (to be cut to35 per cent in 2003). However, the 1997-98 tax reform introduced a two-tiercorporate taxation system with the intent of reducing the relative cost of financingnew investment via own capital – the dual income tax, or DIT model. SinceJanuary 1998 business income is subject to a reduced rate of 19 per cent whichapplies on the portion of income that is deemed to be derived from the increasein equity capital of the company (qualifying increases are contributions in cash orretained profits). The income taxable at the 19 per cent reduced rate is calculatedby applying a certain rate of remuneration (currently set at 7 per cent) to the qual-ifying increases. The super DIT was introduced in 2000 and allows the applicationof the reduced rate attributable to increases in equity capital to part of the oldstock of capital. A “blow-up” factor of 1.4 (raised from 1.2 in 2000) is applied to theincrease of the stock of capital in order to extend the tax advantage to part of theincome originating from old capital. Remaining profits are taxed at the ordinary37 per cent rate. However, the effective corporate income tax rate (resulting fromthe application of the ordinary plus the reduced rate) may not be lower than27 per cent.
The 2000 corporate income tax reform in Austria
As part of an income tax reform introduced in 2000, the corporate income taxhas been changed in Austria to stimulate companies’ capitalisation and reducethe relative advantage of debt finance. An opportunity cost on increases of owncapital of a company is deductible as an “operating expense” and taxed at a lowerrate. In fact, profits are divided in two parts: i) a notional interest on additions toown capital that is deductible as an operating expense from the corporate taxbase; ii) the residual taxable profits, i.e. taxable profits less the operatingexpenses. The first component is taxed at a 25 per cent rate (which is equal to thefinal withholding tax on interest payments and on “speculative” capital gains).Residual taxable profits are taxed at the normal 34 per cent tax rate. To computethe “operating expense”, the taxpayer has to multiply an imputed interest rate,set annually by the government, by the new equity capital invested in thecompany through capital subscriptions and retained earnings less capitalwithdrawals.
publi.sgml.compo.fm Page 121 Friday, August 2, 2002 8:31 AM
OECD Economic Studies No. 34, 2002/I
122
© OECD 2002
taxation of distributed profits, discriminate against outward and inward invest-ment. In fact, countries with imputation systems do not give any relief to theirresidents who are shareholders in companies established in other countries, inrespect of corporate income tax already paid in those countries, while they do forresident companies. Likewise, they usually do not extend the imputation credit tonon-resident individual shareholders (the United Kingdom and, to a lesser extent,France being notable exceptions owing to bilateral tax treaties with certaincountries – both countries grant refundable tax credits to non-residents). Thisconstitutes an inducement for savers to invest in shares at home rather thanabroad and for companies to generate profits domestically rather than on anEU-wide (or global) basis, thereby discouraging outward and inward investment.
The failure of the imputation system to redress the distortions in corporatefinance decisions, in particular for small and open economies, combined with itsbias against foreign investment have led some EU countries to reconsider thetaxation of dividends. To avoid discriminating against shareholders in foreignequity, Germany has abolished the imputation system in 2002. At the personallevel, shareholders are no longer entitled to an imputation credit but only half of
Box 2. Alternative approaches to lessen the double taxation of equity capital: the Italian, Austrian and Finnish approaches (cont.)
The Finnish deduction system up to 1990
Finland applied a dividend deduction system up to 1990 to eliminate thedouble taxation of dividends. Under this system, a company did not pay corpo-rate tax to the central government on dividends distributed to holders of newshares and the distributing company was entitled to a partial (60 or 40 per cent)deduction for dividends relating to old shares in calculating the corporate incometax. In practice, this system often led to a situation where dividends were taxexempt both at the corporate and at the investor level. In fact, dividends receivedby a domestic limited company from another domestic limited company were taxexempt. For households, a large part of the dividends they received alsoremained tax free reflecting the capital income tax allowance. Above the capitalincome allowance threshold, dividends received by individuals were added toother income components and taxed at the taxpayer’s marginal rate. Overall,about 65 per cent of all dividends in Finland were fully tax exempt or subject tolow taxation while others were subject to double taxation (Myhrman et al., 1995).To remedy these flaws, an imputation system was introduced to replace thedividend deduction system in 1990.
publi.sgml.compo.fm Page 122 Friday, August 2, 2002 8:31 AM

Tax Systems in European Union Countries
123
© OECD 2002
Table 5. Marginal effective tax wedges in manufacturing for a resident final investor1
Per cent, 1999
1. These indicators show the degree to which the personal and corporate tax systems scale up (or down) the realpre-tax rate of return that must be earned on an investment, given that the representative investor can earn a 4 percent real rate of return on a demand deposit. Wealth taxes are excluded. The representative investor is assumed tobe a resident person, taxed at the top marginal income tax rate (these calculations ignore the taxation of non-residents and residents investing in foreign assets). Many of the complexities of the tax system that do not affectthe marginal investor (e.g. regarding reserves and tax allowances) are left aside. See OECD (1991), Taxing Profits in aGlobal Economy: Domestic and International Issues, for discussion of this methodology. Calculations are based on a 2 percent inflation rate.
2. The standard deviation across financing instruments provides an indicator of the neutrality of the tax systemtowards corporate financing decisions. The tax system is neutral if a given pre-tax flow of corporate profits producesthe same after-tax flow of corporate income for final investors, whether the return takes the form of interestpayments, dividends, or capital gains (i.e. nil standard deviation).
3. Weighted average across available countries (weights based on 1995 GDP and PPPs).Source: OECD Secretariat.
Standarddeviation2
Sources of financing
Retainedearnings
New equity Debt
Australia 0.6 2.0 0.8 2.1Austria 1.1 0.7 2.7 0.1Belgium 1.3 1.4 2.5 –0.6Canada 1.5 4.5 5.6 2.0
Denmark 0.3 1.9 2.4 2.5Finland 0.6 2.2 0.9 0.9France 2.9 3.6 7.7 0.7Germany 0.7 0.9 2.5 1.3
Greece 0.7 0.9 0.9 –0.6Iceland 1.0 1.8 2.3 –0.1Ireland 1.5 1.5 4.1 0.7Italy 0.4 1.3 1.3 0.4
Japan 2.3 3.3 5.5 –0.1Korea 0.5 0.6 1.6 1.6Luxembourg 0.8 3.6 2.4 1.6Mexico 0.1 0.8 1.0 1.0
Netherlands 2.0 0.5 5.3 2.5New Zealand 0.0 1.5 1.5 1.5Norway 0.0 1.1 1.1 1.1Portugal 1.1 1.1 2.5 –0.3
Spain 0.6 3.2 2.2 1.6Sweden 0.8 2.1 2.8 0.8Switzerland 1.3 0.4 3.5 1.8United Kingdom 0.5 2.9 2.4 1.6United States 1.5 1.7 4.8 1.4
EU3 0.9 2.0 3.2 1.0OECD3 1.2 2.0 4.0 1.1
publi.sgml.compo.fm Page 123 Friday, August 2, 2002 8:31 AM

OECD Economic Studies No. 34, 2002/I
124
© OECD 2002
the dividends received from both home and foreign sources enters the share-holder’s personal income tax base, and is taxed at his marginal tax rate. To makeforeign investment more attractive, the corporate income tax rate has also beenlowered to 25 per cent in 2001. In 1997, Italy introduced the choice between impu-tation credits and a reduced flat tax on dividends. Sweden reintroduced thedouble taxation in 1995 but cut the corporate tax rate, de facto reducing the overalltax wedge on distributed profits, both for domestic and foreign shareholders.
Corporate income tax bases remain narrow, and special regimes are widespread
Corporate income tax revenues in most EU countries are low by internationalstandards, as a share of GDP, despite statutory rates on corporate profits broadlyin line with other OECD countries. This relatively low yield, and its large variationsacross EU countries with similar statutory rates, reflect several factors. Amongthese are large differences in accountancy rules that firms must comply with, andthe percentage of incorporated firms.39 However, the extensive use of tax reliefalso plays a role, as revealed by a recent business survey of EU firms whichprovides some estimates of effective tax rates in manufacturing based on firms’financial statements.40 The survey suggests that, over 1990-96, the effective corpo-rate tax rate was almost 10 percentage points lower than the statutory rate in theEU area in the manufacturing sector (Figure 10), with large variations acrosscountries in the conditions and generosity of the associated tax allowances.
These rebates often include: investment tax credits, accelerated depreciationallowances for investment in equipment and in intangible assets (such as R&D),tax breaks for employment creation, and tax incentives for deprived areas.41
Generous investment tax credits in some EU countries, combined with deprecia-tion rates higher than economic depreciation, produce a bias in favour of capital-intensive activities. In addition, many countries have recently introduced or raisedtax measures that favour small enterprises, newly created firms and/or informationtechnology companies (e.g. France, Netherlands, Portugal, Spain, and theUnited Kingdom).42 These measures are designed to offset the disadvantages ofnew, or small, enterprises in financing their investment projects and/or thedisproportionate costs stemming from administrative complexities, including taxcompliance. However, a progressive corporate income tax system may createthreshold effects and/or induce the splitting of companies in order to qualify forthe reduced taxation scheme. To address this risk, some countries (e.g. Spain andthe United Kingdom) have introduced legal provisions to guard against disaggre-gation of larger businesses to exploit the thresholds. Nevertheless, introducingtargeted tax relief may result in an inefficient allocation of resources, the creationof tax loopholes, and growing tax planning and lobbying activities.
publi.sgml.compo.fm Page 124 Friday, August 2, 2002 8:31 AM
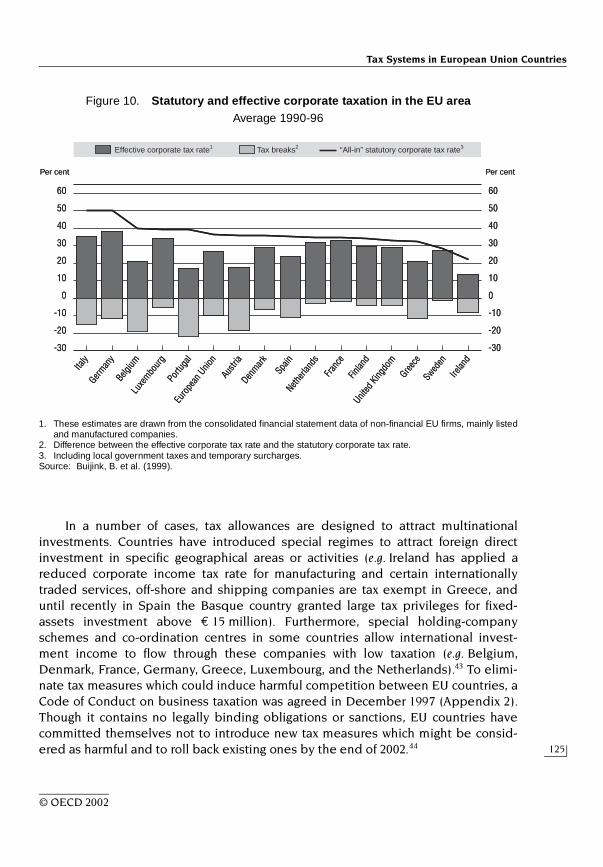
Tax Systems in European Union Countries
125
© OECD 2002
In a number of cases, tax allowances are designed to attract multinationalinvestments. Countries have introduced special regimes to attract foreign directinvestment in specific geographical areas or activities (e.g. Ireland has applied areduced corporate income tax rate for manufacturing and certain internationallytraded services, off-shore and shipping companies are tax exempt in Greece, anduntil recently in Spain the Basque country granted large tax privileges for fixed-assets investment above € 15 million). Furthermore, special holding-companyschemes and co-ordination centres in some countries allow international invest-ment income to flow through these companies with low taxation (e.g. Belgium,Denmark, France, Germany, Greece, Luxembourg, and the Netherlands).43 To elimi-nate tax measures which could induce harmful competition between EU countries, aCode of Conduct on business taxation was agreed in December 1997 (Appendix 2).Though it contains no legally binding obligations or sanctions, EU countries havecommitted themselves not to introduce new tax measures which might be consid-ered as harmful and to roll back existing ones by the end of 2002.44
Figure 10. Statutory and effective corporate taxation in the EU areaAverage 1990-96
1. These estimates are drawn from the consolidated financial statement data of non-financial EU firms, mainly listedand manufactured companies.
2. Difference between the effective corporate tax rate and the statutory corporate tax rate.3. Including local government taxes and temporary surcharges.Source: Buijink, B. et al. (1999).
60
40
30
-30
20
50
10
0
-10
-20
60
40
30
-30
20
50
10
0
-10
-20
Effective corporate tax rate1
Netherl
ands
Tax breaks2
Irelan
d
Spain
Portu
gal
Greece
Franc
e
United
King
dom
Belgi
um
Finlan
d
Denmark
German
y
Luxe
mbour
g
Swed
enItaly
Austr
ia
“All-in” statutory corporate tax rate3
Per cent Per centEu
rope
an U
nion
60
40
30
-30
20
50
10
0
-10
-20
60
40
30
-30
20
50
10
0
-10
-20
Effective corporate tax rate1
Netherl
ands
Tax breaks2
Irelan
d
Spain
Portu
gal
Greece
Franc
e
United
King
dom
Belgi
um
Finlan
d
Denmark
German
y
Luxe
mbour
g
Swed
enItaly
Austr
ia
“All-in” statutory corporate tax rate3
Per cent Per centEu
rope
an U
nion
publi.sgml.compo.fm Page 125 Friday, August 2, 2002 8:31 AM
OECD Economic Studies No. 34, 2002/I
126
© OECD 2002
An emphasis on income redistribution?
Income redistribution is often considered to be an important objective of EUcountries’ tax systems. It is mainly reflected in a highly progressive tax schedule ofthe personal income tax. However, for low-income working families with children,most EU tax systems are less favourable than the system in place in theUnited States (Figure 11), where the earned income tax credit conditional on thefamily situation results in a positive transfer for the most needy. Furthermore,several factors act to weaken the statutory progressivity of EU tax systems.45 First,the personal income tax base is very narrow in many countries, in particular inFrance (Bourguignon, 1998), Greece, and Portugal (Bronchi, 2001; Bronchi andGomes-Santos, 2001).46 Second, capital income is mainly taxed at a flat rate in EUcountries, contrasting with its incorporation into the personal income and thustaxed according to a progressive schedule in most other OECD countries. Thetaxation of property/wealth is also low in most EU countries compared with theOECD average. Third, the personal income tax in most countries embodies exten-sive tax advantages whose value tends to increase with income, such as tax breaksfor health, childcare and education expenses. Likewise, tax breaks for retirementsavings and investment in owner-occupied housing may have a regressive impacton the distribution of income since the wealthy tend to save more, in absoluteterms and as a share of their income. In addition, ceilings on social security contri-butions in place in some EU countries are reflected in a slight decline in net taxrates when the income rises (e.g. Germany and Spain).47 Furthermore, some of thegoods and services which are mostly consumed by higher income groups aresometimes taxed at reduced VAT rates (e.g. hotel and restaurant services in mostEU countries). Overall, the tax system contributes more to income redistributionin EU countries than in most other OECD countries but this largely reflects higheroverall tax shares while the relative efficiency of EU countries’ tax systems inredistributing income appears to be lower than that of many other OECD countries(Burniaux et al., 1998).48 On the other hand, higher tax shares in EU countries arepartly used to finance expenditure programmes which are targeted to the mostvulnerable groups.
PRIORITIES FOR FUTURE TAX REFORMS
Given the pressures on public spending which will likely emerge in themedium-term – mostly reflecting population ageing – significant cuts in taxescannot be considered as a sound fiscal option for EU countries. On the other hand,tax base erosion pressures associated with the growing integration within the EUarea and with the rest of the world need to be recognised. They could probably be
publi.sgml.compo.fm Page 126 Friday, August 2, 2002 8:31 AM
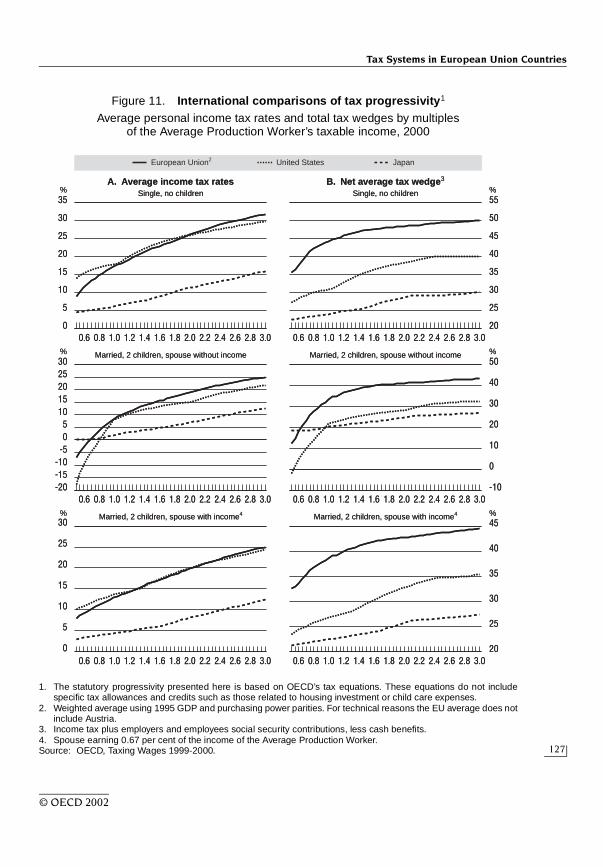
Tax Systems in European Union Countries
127
© OECD 2002
Figure 11. International comparisons of tax progressivity1
Average personal income tax rates and total tax wedges by multiples of the Average Production Worker’s taxable income, 2000
1. The statutory progressivity presented here is based on OECD’s tax equations. These equations do not includespecific tax allowances and credits such as those related to housing investment or child care expenses.
2. Weighted average using 1995 GDP and purchasing power parities. For technical reasons the EU average does notinclude Austria.
3. Income tax plus employers and employees social security contributions, less cash benefits.4. Spouse earning 0.67 per cent of the income of the Average Production Worker.Source: OECD, Taxing Wages 1999-2000.
% %
% %
% %
35
30
25
20
15
10
5
0
30
25
20
15
10
5
0
30
-5
252015105
-20
0
-10-15
55
50
45
40
35
30
25
20
50
40
30
0
-10
20
10
45
40
35
30
25
20
0.6 0.8 1.0 1.2 1.4 1.6 1.8 2.0 2.2 2.4 2.6 2.8 3.0 0.6 0.8 1.0 1.2 1.4 1.6 1.8 2.0 2.2 2.4 2.6 2.8 3.0
0.6 0.8 1.0 1.2 1.4 1.6 1.8 2.0 2.2 2.4 2.6 2.8 3.0 0.6 0.8 1.0 1.2 1.4 1.6 1.8 2.0 2.2 2.4 2.6 2.8 3.0
0.6 0.8 1.0 1.2 1.4 1.6 1.8 2.0 2.2 2.4 2.6 2.8 3.0 0.6 0.8 1.0 1.2 1.4 1.6 1.8 2.0 2.2 2.4 2.6 2.8 3.0
European Union2 United States Japan
A. Average income tax ratesSingle, no children
B. Net average tax wedge3
Single, no children
Married, 2 children, spouse without income Married, 2 children, spouse without income
Married, 2 children, spouse with income4 Married, 2 children, spouse with income4
% %
% %
% %
35
30
25
20
15
10
5
0
30
25
20
15
10
5
0
30
-5
252015105
-20
0
-10-15
55
50
45
40
35
30
25
20
50
40
30
0
-10
20
10
45
40
35
30
25
20
0.6 0.8 1.0 1.2 1.4 1.6 1.8 2.0 2.2 2.4 2.6 2.8 3.0 0.6 0.8 1.0 1.2 1.4 1.6 1.8 2.0 2.2 2.4 2.6 2.8 3.0
0.6 0.8 1.0 1.2 1.4 1.6 1.8 2.0 2.2 2.4 2.6 2.8 3.0 0.6 0.8 1.0 1.2 1.4 1.6 1.8 2.0 2.2 2.4 2.6 2.8 3.0
0.6 0.8 1.0 1.2 1.4 1.6 1.8 2.0 2.2 2.4 2.6 2.8 3.0 0.6 0.8 1.0 1.2 1.4 1.6 1.8 2.0 2.2 2.4 2.6 2.8 3.0
European Union2 United States Japan
A. Average income tax ratesSingle, no children
B. Net average tax wedge3
Single, no children
Married, 2 children, spouse without income Married, 2 children, spouse without income
Married, 2 children, spouse with income4 Married, 2 children, spouse with income4
publi.sgml.compo.fm Page 127 Friday, August 2, 2002 8:31 AM

OECD Economic Studies No. 34, 2002/I
128
© OECD 2002
Figure 11. International comparisons of tax progressivity1 (cont.)
Average personal income tax rates and total tax wedges by multiples of the Average Production Worker’s taxable income, 2000
1. The statutory progressivity presented here is based on OECD’s tax equations. These equations do not includespecific tax allowances and credits such as those related to housing investment or child care expenses.
2. Income tax plus employers and employees social security contributions, less cash benefits.3. Spouse earning 0.67 per cent of the income of the Average Production Worker.Source: OECD, Taxing Wages 1999-2000.
% %
% %
% %30
25
20
15
10
5
0
0.6 0.8 1.0 1.2 1.4 1.6 1.8 2.0 2.2 2.4 2.6 2.8 3.0 0.6 0.8 1.0 1.2 1.4 1.6 1.8 2.0 2.2 2.4 2.6 2.8 3.0
0.6 0.8 1.0 1.2 1.4 1.6 1.8 2.0 2.2 2.4 2.6 2.8 3.0 0.6 0.8 1.0 1.2 1.4 1.6 1.8 2.0 2.2 2.4 2.6 2.8 3.0
0.6 0.8 1.0 1.2 1.4 1.6 1.8 2.0 2.2 2.4 2.6 2.8 3.0 0.6 0.8 1.0 1.2 1.4 1.6 1.8 2.0 2.2 2.4 2.6 2.8 3.0
30
20
10
-40
0
-10
-20
-30
55
40
35
30
25
15
45
20
50
60
4030
0
-40
2010
50
-10-20-30
60
50
45
40
35
30
25
20
55
40
30
25
20
15
10
5
0
35
A. Average income tax ratesSingle, no children
B. Net average tax wedge2
Single, no children
Married, 2 children, spouse without income Married, 2 children, spouse without income
Married, 2 children, spouse with income3 Married, 2 children, spouse with income3
SpainUnited KingdomFranceGermany Italy
% %
% %
% %30
25
20
15
10
5
0
0.6 0.8 1.0 1.2 1.4 1.6 1.8 2.0 2.2 2.4 2.6 2.8 3.0 0.6 0.8 1.0 1.2 1.4 1.6 1.8 2.0 2.2 2.4 2.6 2.8 3.0
0.6 0.8 1.0 1.2 1.4 1.6 1.8 2.0 2.2 2.4 2.6 2.8 3.0 0.6 0.8 1.0 1.2 1.4 1.6 1.8 2.0 2.2 2.4 2.6 2.8 3.0
0.6 0.8 1.0 1.2 1.4 1.6 1.8 2.0 2.2 2.4 2.6 2.8 3.0 0.6 0.8 1.0 1.2 1.4 1.6 1.8 2.0 2.2 2.4 2.6 2.8 3.0
30
20
10
-40
0
-10
-20
-30
55
40
35
30
25
15
45
20
50
60
4030
0
-40
2010
50
-10-20-30
60
50
45
40
35
30
25
20
55
40
30
25
20
15
10
5
0
35
A. Average income tax ratesSingle, no children
B. Net average tax wedge2
Single, no children
Married, 2 children, spouse without income Married, 2 children, spouse without income
Married, 2 children, spouse with income3 Married, 2 children, spouse with income3
SpainUnited KingdomFranceGermany Italy
publi.sgml.compo.fm Page 128 Friday, August 2, 2002 8:31 AM
Tax Systems in European Union Countries
129
© OECD 2002
lessened by enhanced co-ordination of tax policies and exchanges of informationbetween national tax authorities. For highly mobile factors such as financialcapital, it would contribute to avoid that individual countries race to the bottom,into a negative-sum game, but would leave each country the opportunity todecide on tax rules for its residents and apply them consistently. However, taxharmonisation within the EU area is unlikely to be an appropriate option. In fact,both the level and the composition of public spending vary significantly across EUcountries, calling for a different level and mix of taxes and making it difficult todefine an “optimal” tax system for the EU area. In addition, some differences intaxes, and concomitantly on the level and mix of public services, is also beneficialinasmuch as it increases EU citizens’ menu of choice on where to locate andfosters pressures on governments to raise public sector efficiency. While leavingopen the question of what would be an optimal system of taxation for individualEU countries, the following section suggests how tax arrangements might beimproved at the margin, drawing on the most blatant inefficiency and equityconcerns described previously. In this context, two main revenue-neutralapproaches are considered: i) rebalancing the tax system away from labour to lessdistortive and mobile bases (e.g. consumption and real estate); and ii) broadeningtax bases, by eliminating exemptions and special regimes, combined with aflattening of the rate structure.
Improve labour market performance
Since the mid-1990s, many EU countries have introduced measures to lowerthe tax burden on labour, especially at the lower end of the income scale (asmentioned in Box 1). Many of these measures have had promising results, asevidenced by the strong response of employment to output growth and the rise inparticipation rates in some EU countries since the mid-1990s. However, the taxburden on labour remains high. Lowering further the tax burden on labour whilealso reducing labour market rigidities could lead to increases in both laboursupply and demand, boosting economic growth and increasing employment(OECD, 1994a). In most cases a reduction in the tax burden on labour shouldpreferably be paid for by cuts in primary expenditure (European Commission,2000e). If this proves to be difficult, an alternative would be to shift more of theburden onto other tax bases.49 There are several candidates, in particular taxes onconsumption and/or property. This would contribute to lowering the direct cost oflabour, and/or improving incentives for work and human capital accumulationespecially if transfer income recipients do not receive a full compensation for therise in effective taxation of consumption or property.50 Shifting from wage to aconsumption tax would have another advantage: it would broaden the tax baseinsofar as consumption out of other income would also be taxed, thus partlyredressing the low taxation on property and capital income which mitigates the
publi.sgml.compo.fm Page 129 Friday, August 2, 2002 8:31 AM
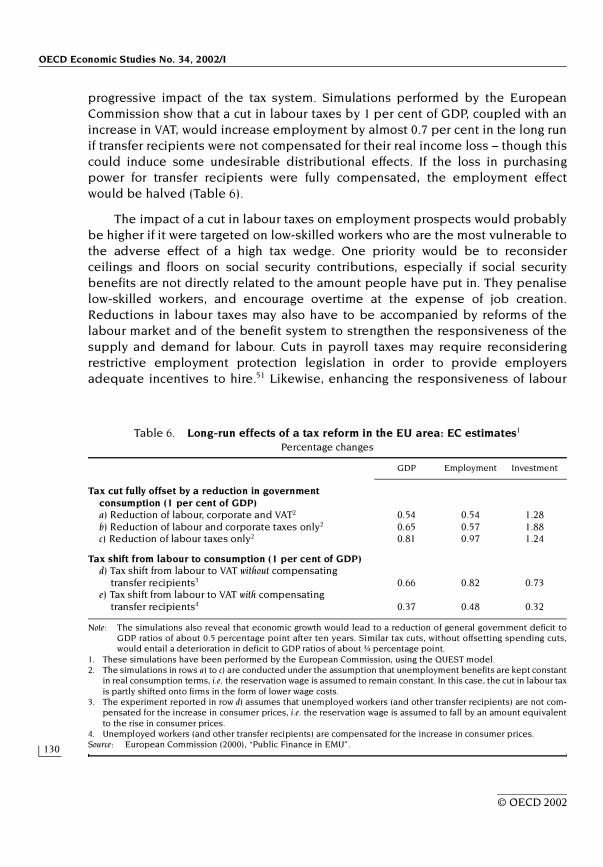
OECD Economic Studies No. 34, 2002/I
130
© OECD 2002
progressive impact of the tax system. Simulations performed by the EuropeanCommission show that a cut in labour taxes by 1 per cent of GDP, coupled with anincrease in VAT, would increase employment by almost 0.7 per cent in the long runif transfer recipients were not compensated for their real income loss – though thiscould induce some undesirable distributional effects. If the loss in purchasingpower for transfer recipients were fully compensated, the employment effectwould be halved (Table 6).
The impact of a cut in labour taxes on employment prospects would probablybe higher if it were targeted on low-skilled workers who are the most vulnerable tothe adverse effect of a high tax wedge. One priority would be to reconsiderceilings and floors on social security contributions, especially if social securitybenefits are not directly related to the amount people have put in. They penaliselow-skilled workers, and encourage overtime at the expense of job creation.Reductions in labour taxes may also have to be accompanied by reforms of thelabour market and of the benefit system to strengthen the responsiveness of thesupply and demand for labour. Cuts in payroll taxes may require reconsideringrestrictive employment protection legislation in order to provide employersadequate incentives to hire.51 Likewise, enhancing the responsiveness of labour
Table 6. Long-run effects of a tax reform in the EU area: EC estimates1
Percentage changes
Note: The simulations also reveal that economic growth would lead to a reduction of general government deficit toGDP ratios of about 0.5 percentage point after ten years. Similar tax cuts, without offsetting spending cuts,would entail a deterioration in deficit to GDP ratios of about ¾ percentage point.
1. These simulations have been performed by the European Commission, using the QUEST model.2. The simulations in rows a) to c) are conducted under the assumption that unemployment benefits are kept constant
in real consumption terms, i.e. the reservation wage is assumed to remain constant. In this case, the cut in labour taxis partly shifted onto firms in the form of lower wage costs.
3. The experiment reported in row d) assumes that unemployed workers (and other transfer recipients) are not com-pensated for the increase in consumer prices, i.e. the reservation wage is assumed to fall by an amount equivalentto the rise in consumer prices.
4. Unemployed workers (and other transfer recipients) are compensated for the increase in consumer prices.Source: European Commission (2000), “Public Finance in EMU”.
GDP Employment Investment
Tax cut fully offset by a reduction in government consumption (1 per cent of GDP)a) Reduction of labour, corporate and VAT2 0.54 0.54 1.28b) Reduction of labour and corporate taxes only2 0.65 0.57 1.88c) Reduction of labour taxes only2 0.81 0.97 1.24
Tax shift from labour to consumption (1 per cent of GDP)d) Tax shift from labour to VAT without compensating
transfer recipients3 0.66 0.82 0.73e) Tax shift from labour to VAT with compensating
transfer recipients4 0.37 0.48 0.32
publi.sgml.compo.fm Page 130 Friday, August 2, 2002 8:31 AM
Tax Systems in European Union Countries
131
© OECD 2002
supply to tax cuts may call for increased emphasis on in-work benefits whilestrengthening eligibility conditions for out-of-work transfers. Some tax privilegesgranted to transfer payments should also be reconsidered, in particular unem-ployment benefits, severance payments and pensions.
Further reduce non-neutralities in product markets…
Streamlining the VAT structure is a priority to reduce the distortions on theproduct market stemming from the tax system. This would entail in particularreconsidering reduced VAT rates and exemptions, and to envisage instead morecost-effective direct transfers to households when the effect on income distribu-tion is a concern. Reducing the complexity of the VAT system would in turn cutcompliance costs, and thus allow VAT thresholds for small businesses to be low-ered. The simplification and modernisation of the current VAT system, combinedwith a more uniform application across EU countries, should also work to lowercompliance costs, and hence encourage firms (especially SMEs) to export, as wellas facilitating the detection of fraud.
… and towards saving vehicles
Further progressing towards the dual income tax system in place in mostNordic countries could contribute to improve the neutrality of the tax system withrespect to different savings vehicles. This would improve economic efficiency,reduce administrative costs and close some tax loopholes. However, the likelyadverse impact on income distribution might require adjustments elsewhere inthe tax and/or benefit systems. A less radical change would involve reconsideringprivileges granted through the personal income tax to some saving instruments, inparticular owner-occupied housing and pension savings. In some cases, relaxingrestrictive land-use regulations may be more efficient than tax incentives in facili-tating the population’s access to better housing. Reducing tax privileges tohousing investment could also help to rebalance private investment towards busi-ness needs and, in some cases, improve the geographical mobility of workers.52
Reconsidering incentives for retirement saving and owner-occupied housingwould also lessen equity concerns which arise when relatively well-off taxpayersbenefit most from it and/or because the value of tax incentives usually increaseswith taxpayers’ marginal rates (Franco, 1996; Joumard and Varoudakis, 2000).
Another effective non-neutrality embedded in many EU countries’ taxsystems is the differentiated tax treatment according to the origin and destinationof savings. Non-residents are often granted a preferential tax treatment on theirinterest income. Given the high degree of mobility of the tax base, strengtheninginternational co-ordination for the taxation of income from financial investment isrequired. The agreement reached in June 2000 between EU governments on the
publi.sgml.compo.fm Page 131 Friday, August 2, 2002 8:31 AM

OECD Economic Studies No. 34, 2002/I
132
© OECD 2002
exchange of information for the taxation of non-residents’ saving income is a stepin this direction. However, any system, to be truly effective and avoid hurting thecompetitiveness of EU countries’ financial markets, would need to be adopted bya wider group of countries than the European Union.
Increase reliance on the taxation of property
Enhanced taxation of property would contribute to improving the neutrality ofthe tax system towards various forms of wealth (the main components of which arereal estate, financial assets and human capital) and thus serve to rebalance the taxburden away from labour. In a number of countries (including Austria, France,Greece, Portugal and Spain), improving the taxation of property implies updatingland registers with an accurate valuation of land and building. Incidentally,enhanced property taxation would also contribute to reducing income inequalitiesand, if accruing to sub-national governments, close the gap between their spend-ing and revenue-raising powers. This could also improve local governments’ fiscaldiscipline, since property taxes are in general well suited for use by local govern-ments to charge for the benefits of local services, but it obliges them to be moreresponsive to the concerns of local voters than is the case with other means offinancing, e.g. central government grants. To this end, greater flexibility in settingproperty taxes should be given to local governments.
Improve neutrality on the corporate financing side
Improving tax neutrality towards corporate financing by reducing the taxadvantage given to debt financing would work to promote sounder financial struc-tures in the business sector. In addition, lessening the tax discrimination againstfinancing through new equity would benefit business start-ups, and innovativeand fast-growing companies which may face difficulties in borrowing from banks.On the other hand, the arrangements that undo double taxation of dividends andretained earnings may not fully be effective in reducing the bias towards corpo-rate debt financing, in particular for small and open economies since representa-tive investors are likely to be non-resident. For these reasons, some countriesmay need to reconsider the relative merits of the imputation credit system and ofalternative methods to mitigate the double taxation of profits. In doing so, impor-tant variables to be considered include the openness of the economy, tax revenueconsideration, but also the administrative costs attached to each system and thetransition costs to switch from one system to another.
Streamline special corporate tax regimes and relief
The variety of tax regimes and extensive tax breaks for entrepreneurialactivities – according to the size of the company and its activity – should be
publi.sgml.compo.fm Page 132 Friday, August 2, 2002 8:31 AM
Tax Systems in European Union Countries
133
© OECD 2002
reconsidered in favour of the use of structural reforms addressing problems fromtheir roots. In particular, simplifying administrative requirements and tax files mayboost small enterprises’ growth more efficiently than the introduction of reducedtax rates for small enterprises. Reconsidering local taxes on business inputs(labour, productive equipment, land and/or premises), levied regardless of profit-ability, would also foster entrepreneurship since these taxes are often a particularburden on small firms and newly-created companies (among countries whichapply this type of local taxes are France, Germany, and Italy). Enhanced provisionsfor carrying forward and backward operational losses may further contribute toimproving incentives for risk taking in some countries. In general, granting trans-parent and universal tax breaks would be less distortive for resource allocationand less inducive to tax avoidance.
At the EU level, streamlined corporate taxation that eliminates specialregimes would work to produce a level playing field:
• By ending the practice of offering tax relief to attract new inward investmentto a country or a region when these inducements are not available to exist-ing firms in that area. In general the location decision probably owes moreto the desire for market proximity, search for agglomeration economies,adaptation to differences in cost levels and availability of infrastructurethan to pure tax factors. However, geographical distances within the EU areaare short while differences in costs and quality of inputs are narrowing.Since significant irreversibilities associated with productive investmentcannot be ruled out, the potential cost of these special incentives may besignificant.
• By ensuring that competition for mobile activities, particularly in the finan-cial sector, is fair, i.e. transparent, non-discriminatory (does not involvering-fencing) and accompanied by effective exchange of information.
This argues for the rapid implementation of the EU Code of Conduct and efforts tocomply with the OECD harmful tax practices initiative.
Pursue environmental objectives in a cost-effective way53
Despite some improvement in environmental performance in some EUcountries over the past decade, there is a need for further progress. Taxes and/ortradable permit schemes have a role to play to improve the cost-effectiveness ofenvironmental policy in EU countries. They will be needed to reduce greenhousegas emissions at least cost. Economic instruments would also allow the targets onreducing sulphur dioxide and nitrogen oxides emissions that all EU countries havecommitted to in the Göteborg Protocol to be met in a cost-effective way. Ingeneral, there is much room for taxes on different kinds of energy to reflect moreaccurately the respective environmental externalities associated with their use.
publi.sgml.compo.fm Page 133 Friday, August 2, 2002 8:31 AM
OECD Economic Studies No. 34, 2002/I
134
© OECD 2002
The gap between diesel and petrol taxes that exists in many EU countries is onecase in point. Exemption of all commercial aviation fuel is another. Exemptions forparticular sectors are frequently introduced to meet competitive concerns, but itis important to avoid them, as they put all the weight on non-exempt sectors andincrease the overall costs of meeting a given target. Efforts within the EU to intro-duce environmental taxes in a co-ordinated way may make it easier to avoid suchexemptions and improve their efficiency by limiting opportunities of tax avoid-ance. The case of aviation kerosene provides a good illustration of how environ-mental effects would be magnified, and competitiveness concerns would be lessacute, if co-ordination were enhanced and extended to non-EU countries (Box 3).However, those efforts have not been very successful in the past. Illustrative is thefailure to reach an agreement on a directive on energy taxation proposed in 1997by the Commission, largely because potential costs for individual countries would
Box 3. Taxing aviation kerosene: the need for international co-ordination
Aviation kerosene is currently exempted from excise duties in the EU area inspite of the EC recommendation to extend excise duties to this product. The ECrecently published a study on the impact of the taxation of aircraft fuel on green-house gas emissions, EC carriers’ international competitiveness and employment(European Commission, 2000f). The study examined five possible tax coveragelevels, ranging from taxation of national flights only to taxation of all flights for allcarriers to all destination world-wide. Three possible levels of tax were alsoenvisaged. The study showed that environmental effects would be small unlessall flights to all destinations were taxed. In a “high taxation scenario” (€ 245/1 000 litres) on all routes for EU carriers only, EU CO2 emissions would be cut by0.3 per cent if compared with the baseline scenario. However, the competitiveposition of EU carriers would suffer and tax avoidance opportunities wouldincrease if non-EU members do not apply a similar tax. In particular, tankering, inwhich more fuel is taken on board an aircraft than is necessary for a flight, wouldavoid refuelling in countries where the tax applies. It would also imply that morefuel needs to be burned in order to carry the extra fuel somewhere along theroute, thus having additional detrimental effects on the environment. Taxing onlyintra-EU area flights (at € 245/1 000 litres) would reduce competitive distortionsbut EU CO2 emissions would be cut by only 0.06 per cent. Thus, the EC concludedthat: “it would not be practicable or desirable for the Community as a whole tointroduce taxation of aircraft fuel targeting exclusively intra-Community flightsoperated by Community air carriers at the present time”. It then recommendedMember States to intensify their work within the International Civil AviationOrganisation (ICAO) framework for the introduction of taxation on aviation fuel.
publi.sgml.compo.fm Page 134 Friday, August 2, 2002 8:31 AM
Tax Systems in European Union Countries
135
© OECD 2002
likely differ significantly as differences in energy resources and industrial struc-tures among EU countries remain sizeable. As a result, most EU countries haveintroduced or raised green taxes on a unilateral basis since the early 1990s, but taxbreaks for heavily-polluting activities most exposed to international competitioncontinue to flourish.
Abating pollution in a cost-effective way may also require strengthening thedesign and use of tradable permits. In fact, the European Commission recentlylaunched a discussion on greenhouse gas emissions trading within the EuropeanUnion (European Commission, 2000g). Enhanced use of tradable permits may alsoneed to be considered for other pollutants since in some cases, tradable permitshave several advantages over green taxes. First, they would allow setting aquantity of pollution to be tolerated by issuing a fixed quantity of permits (e.g. amaximum amount of greenhouse gas emissions, in line with the EU target).Second, gaining experience with emission trading schemes within EU countriesmight be useful in the perspective of an introduction of such schemes at an inter-national level. Third, they may allow political hurdles inherent to the subsidiarityprinciple and the unanimity rule associated with tax decisions at the EU level tobe avoided.
publi.sgml.compo.fm Page 135 Friday, August 2, 2002 8:31 AM

OECD Economic Studies No. 34, 2002/I
136
© OECD 2002
NOTES
1. Martinez-Mongay and Fernandez (2000) provide evidence that causality runs fromspending to taxation for the EU area. Spending increases are matched by increases intax receipts one year later.
2. The 13 candidate countries are: Bulgaria, Cyprus, the Czech Republic, Estonia,Hungary, Latvia, Lithuania, Malta, Romania, Slovakia, Slovenia, Poland and Turkey.Among these, six countries started talks in March 1998 and are at the head of the linefor membership: Cyprus, the Czech Republic, Estonia, Hungary, Slovenia and Poland.
3. A potentially aggravating factor is the development of offshore capital investment viathe Internet. The so-called e-banking may expose capital-income tax revenues to anincreased risk of international evasion if it makes cross-border evasion easier and moreaccessible to a broader range of population than just the wealthy. Security problems anda relatively low penetration of the Internet in the EU area still limit the expansion ofthese financial transactions. The Nordic countries are a notable exception: more thanone fourth of the entire population of Finland and Sweden do banking online. However,such financial transactions are likely to expand rapidly in the medium run.
4. This anomalous situation is currently the subject of a Commission proposal to correctthe place of taxation rule in these circumstances. Those plans for applying VAT toInternet on-line sales from outside the EU area also raise the prospect of pressure forthese high tax countries since, if the seller has the option of registering in a single EUcountry, the tax rate may play an important role in the choice. Nevertheless, it is recog-nised that this B2C sector of e-commerce currently represents a relatively smallproportion of total e-commerce, and that business-to-business transactions willcontinue to predominate.
5. The tax-to-GDP ratio – showing the share of total tax revenues, including social secu-rity contributions, in gross domestic product – is the main aggregate indicator used tomeasure the overall tax burden. However, this indicator has certain limitations as acomparative measure across countries and over time. Among the factors which canaffect the level and trend of the tax-to-GDP ratios are: the extent to which countriesprovide social or economic assistance via tax expenditures, rather than direct govern-ment spending, and whether or not social transfers are subject to tax. Adema (2002)estimated that in 1997 taxes and social security contributions on transfers exceeded5 per cent of GDP in Denmark, Finland, the Netherlands, and Sweden. They did notexceed 2 per cent of GDP in Belgium, Canada and Germany, and were even lower inAustralia, Ireland, Japan, the United Kingdom and the United States.
6. Carey and Rabesona (2002) estimate that the average effective tax rate on labourreached some 37 per cent in 1999, compared with 25 and 23 per cent for the UnitedStates and Japan, respectively. Martinez-Mongay (2000) provides broadly similar esti-mates. The average effective tax rate is the ratio of labour taxes to labour income.
publi.sgml.compo.fm Page 136 Friday, August 2, 2002 8:31 AM
Tax Systems in European Union Countries
137
© OECD 2002
Labour taxes are the sum of the labour’s share of the personal income tax, social secu-rity charges and payroll taxes. Labour income consists of compensation from depen-dent employment, including employers’ social security contributions.
7. Methodological problems associated with the calculation of effective tax rates arespelled out extensively in Carey and Tchilinguirian (2000). The orders of magnitudeprovided in this paper should therefore be interpreted as purely indicative.
8. Daveri and Tabellini (2000) show that an increase in labour tax is shifted onto labourcosts in continental Europe, but not in the other OECD countries. They estimate thatfor each percentage point rise in labour taxes, labour costs go up by almost half apercentage point in Europe.
9. Based on panel data for 19 OECD countries, Elmeskov et al. (1998) show that differentcollective bargaining arrangements influence the way in which tax wedges affectunemployment. The impact is stronger in countries with an intermediate degree ofcentralisation/co-ordination, i.e. where sectoral wage bargaining predominates withlimited co-ordination (e.g. Belgium, Finland, France and Spain). This gives insidersstrong bargaining powers to resist employers’ attempts to reflect higher payroll taxesin lower wages.
10. Despite a tax wedge on labour which ranks amongst the highest within the OECD area,employment rates in the Nordic countries are high. This partly reflects a strong linkbetween employment history and benefit entitlements, excellent welfare facilities(e.g. day care) and flexible job contracts for youngsters.
11. Recently, however, some countries have broadened the personal income tax base toinclude some of these compensation components. In Germany for instance, reduced tax-ation on bonuses for employees was eliminated but travel expenses to the workingplace still give rise to tax relief. Some countries have also introduced a ceiling abovewhich stock options do not benefit from a preferential treatment (e.g. France, Spain andthe United Kingdom), though differences across countries remain sizeable in this area.
12. Some countries grant pensions a favoured treatment through the personal income tax.For instance, in Belgium, a € 1 510 tax credit was granted for a single taxpayer for pen-sion income and early retirement benefits in 1999. In Austria, pensioners are entitledto an annual tax credit of € 400. In Germany, pension benefits are granted a tax-freeallowance of 40 per cent (annual maximum of € 3 068). In Finland, pensions grantedthrough the national pension scheme are exempt up to around € 555 per month.
13. In addition, severance payments are largely tax-free in France, Ireland, Portugal, andSpain. Some information on the taxation of social benefits can be found on thewebsite: http://europa.eu.int/comm/employment_social/soc-prot/missoc99/.
14. In the United Kingdom, the concentration of hours worked by lone parents around the16 hours point – the cut-off for eligibility for the Family Credit in place up toOctober 1999 – indicates that the benefit systems impacted significantly on femalelabour supply.
15. EU countries agreed in 1977 to establish a harmonised VAT system, which had to beadjusted later on to comply with the objective of the single market. The currentsystem has a fair degree of harmonisation, with a harmonised tax base, with twocategories of rates, and minimal standard and reduced rates fixed at the EU level.However, exemptions, derogation and special schemes, ruled under the EuropeanCommunity law, allow a certain number of differences to exist across EU countries,depending on their specific economic situation.
publi.sgml.compo.fm Page 137 Friday, August 2, 2002 8:31 AM
OECD Economic Studies No. 34, 2002/I
138
© OECD 2002
16. The main consumption items which benefit from reduced VAT rates in most EUcountries are: food products, water supplies, pharmaceuticals products, books andnewspapers, transport of passengers, hotel accommodation and restaurant services.Other, less frequent, consumption items taxed at reduced rates include: pesticides(Greece, France, Italy, Luxembourg, Netherlands, Portugal and Spain), heating oil(Ireland, Luxembourg, Portugal, United Kingdom), clothing and footwear for children(Ireland, Luxembourg, United Kingdom).
17. In Finland, the special VAT refund scheme which applies to VAT paid on the inputs ofmunicipalities increases neutrality concerning contracting out of taxable services tothe private sector. However, for tax-exempt services, including medical and socialservices, the refund scheme stimulates own production by municipalities since theyare compensated for the VAT paid on inputs while private companies are not. In thedraft 2002 budget, the government has however proposed to mitigate this bias byintroducing a new compensation (OECD, 2002).
18. By 1993, the luxury VAT rates were abolished, the standard rate set to at least 15 per centand a maximum of two reduced rates were allowed, which must be equal to, or greaterthan, 5 per cent. In addition, countries were allowed to maintain super-reduced ratesand a zero rate on a limited number of products taxed at those rates before 1991. Formore details on VAT rates and exemptions, see European Commission (2000b). Forexcise duties, a system of minimum rates was implemented from 1993.
19. British excise duties on tobacco and alcohol are much higher than in Belgium andFrance. The British government estimated lost excise duty and VAT from tobaccosmuggling to be £1.7 billion in 1998 (Ussher, 2000).
20. As an illustration, gasoline prices are about 25 per cent lower in Luxembourg than inBelgium, Germany and France, largely reflecting lower VAT and excise taxes. It ismirrored in the fact that non-residents’ consumption of gasoline accounts for morethan 75 per cent of the gasoline sold in Luxembourg.
21. For digital goods delivered online (such as software and music), the Commissionproposed in June 2000 a threshold of annual sales of € 100 000 to consumers in the EUarea under which non-EU companies will not qualify to pay VAT.
22. For sales to foreign businesses that are registered for VAT, the goods are exported taxfree; the receiving business has to declare the import and pay VAT on it. Importingbusinesses that are not registered for VAT are treated as consumers. For sales toconsumers in another EU country, firms have to register for VAT in the destinationcountry and apply its VAT rates. However, for small scale sales (e.g. through mail orInternet order), the VAT rate in the supplying country is applied.
23. A recent business survey revealed that in year 2000 26 per cent of firms consideredthat difficulties related to the VAT system and VAT procedures are an obstacle to thefunctioning of the EU internal market (Single Market Scoreboard, No. 7, November 2000).Verwaal and Cnossen (2000) also argue that: “Due to the transitional VAT and Intrastatsystem, the legal and procedural requirements imposed in respect of intra-communitytransactions differ from those imposed on domestic transactions. These requirementbring additional (differential) compliance costs in their train”. Compliance costs forintra-community transactions are also shown to vary significantly across firms, largelyreflecting economies of scale and variables related to information technologies. Theevidence suggests also that the differential compliance costs reduce the intensity ofintra-community trade.
publi.sgml.compo.fm Page 138 Friday, August 2, 2002 8:31 AM
Tax Systems in European Union Countries
139
© OECD 2002
24. The European Commission considers that one of the main reasons for the increase infraud under the current VAT system is the fact that goods circulate without VAT beingpaid (European Commission, 2000c). It reports two main types of fraud: a) the declara-tion of fictitious intra-Community deliveries: the exempted goods are in fact sold onthe internal market and VAT due on final consumption is thus evaded; b) failure todeclare VAT due on intra-Community purchases, which may then result in VAT fraud onfinal consumption if the goods are resold through underground trade channels. Theright to deduct the tax upstream may also be misused in cases where buyers’ VATdeclarations request the refund of VAT on purchases for which no VAT was paid.
25. There are some 100 billion VAT declarations submitted per year in the EU area.However, mainly due to lack of resources, they are mostly used as a document statingthe tax said to be due while all the other information, which could form the base forcontrol decisions, is not actually used, but is nevertheless collected and stored(European Commission, 2000d).
26. For environmental-related matters, decisions at the EU level require, in general, aqualified majority. There is one main exception relating to decisions covering taxes,which can only be adopted unanimously. Thus, at the EU level, regulations andminimum standards often dominate because the competence of the Commission ismore easily exercised (though this does not impede individual countries fromintroducing taxes on an unilateral basis to comply with EU rules and standards).
27. In fact, tax relief is granted in most countries. In Germany, the energy tax is capped. InSweden, manufacturing industries are exempt from energy tax while the CO2 tax rate isone-third of the standard rate. Special, and even more favourable rules, apply to about60 energy-intensive enterprises. Energy-intensive industries are also largely exemptfrom the CO2 tax in Denmark and Finland, as well as from the SO2 tax in Sweden andDenmark (since 1999, though, Danish electricity utilities pay the SO2 tax). Agriculture isexempted from tax on wastewater in some EU countries (e.g. Denmark) though agricul-ture is one of the most important contributors to the poor quality of surface water. Like-wise in Denmark, the fertiliser tax applies only to non-agricultural uses.
28. However, in some countries, e.g. Austria and Finland, registration fees for cars discrimi-nate against diesel-driven passenger vehicles. In Austria, the tax rate also depends onthe fuel efficiency of the vehicle. For a petrol-driven and a diesel-driven vehicle usingthe same amount of fuel per 100 km, the tax rate is higher for the diesel-driven one.However, the tax bases used in annual taxes on vehicles are seldom close proxies tothe environmental impacts caused by the vehicles. Lévêque et al. (1999) estimate taxconcessions to diesel users in France to amount to € 1.2 billion.
29. In some countries, capital gains are taxed at a flat rate (which can be nil), conditionalon a minimum holding period (e.g. one year in Austria, Germany, Portugal and Spain).Capital gains are tax free in Belgium and the Netherlands. In Germany, dividends andinterest income are subject to a withholding tax but should de jure also be incorporatedinto the taxable income, and taxed at the taxpayer’s marginal rate. De facto however,they are largely unreported (Lang et al., 1997).
30. Since 2001, income in the Netherlands is classified into one of three boxes dependingon how it was generated: income from labour (including home ownership); incomefrom a substantial business interest; and imputed income from wealth. The firstcomponent is taxed according to a progressive rate schedule while the other two aretaxed at a flat, though different, rate (OECD, 2000a).
publi.sgml.compo.fm Page 139 Friday, August 2, 2002 8:31 AM

OECD Economic Studies No. 34, 2002/I
140
© OECD 2002
31. The European Commission as presented in April 2001 a Communication to eliminateobstacles to the cross-border provision of supplementary pensions caused by the taxsystem. After a detailed examination of EU countries’ rules in the field of pensiontaxation, it envisages a negotiation with individual countries which fail to fulfil anobligation imposed by EC law. Where issues cannot be resolved, the Commission willbring cases before the European Court of Justice.
32. Tax privileges on housing investment are easier to measure in countries which haveimplemented a dual income tax. For instance in Denmark and Sweden, so extensiveare the deductions of interest payments that the net revenues from the taxation ofhousehold capital income are actually negative. Acquisition costs are deductible (atleast partly) in Austria, Belgium, Portugal. In Spain, mortgage interest payments andacquisition costs give rise to a 15 per cent tax credit, with a maximum € 1 352 credit.
33. In Germany, an allowance for income from capital investment (e.g. dividends, interest) wasgranted up to € 1 534 – double for jointly assessed spouses – in 2000. In France, the first€ 1 202 – double for married couples – of dividends received from resident companieswere exempt in 2000 and capital gains were tax free below a € 7 625 threshold of sales. Theallowance for dividend income has recently been abolished for taxpayers with a net tax-able income exceeding € 45 634 – double for married couples. In the Netherlands, thepositive balance between interest received and paid (with the exception of mortgageinterest for self-occupied housing) is exempt up to € 454 – double for married couples. Inthe United Kingdom, individuals are entitled to a £6 800 basic annual exemption for capi-tal gains and some saving account instruments (PEPs and ISAs) are tax exempt.
34. In the withholding tax system envisaged by the EC proposed Directive on cross-border savings, the destination country would keep 25 per cent of the tax proceedsand give back the remaining 75 per cent to the country of residence of the investor.
35. The relative merits of information exchange and withholding tax are also influenced bythe strength of the incentives to adopt and effectively implement an informationexchange system given i) questions about its administrative costs; and ii) the fact thatits financial benefits derive from information received from other countries and anyresulting reduction in tax evasion.
36. The centres specifically targeted include the United States, Switzerland, Liechtenstein,Andorra, Monaco, San Marino as well as dependent territories of some Member statessuch as the United Kingdom’s Channel Islands and the Isle of Man.
37. Finland, France, Germany (before the 2000 reform), Ireland, Spain, and theUnited Kingdom apply an imputation system (dividends are taxed according to thepersonal income tax of the shareholder and corporate and withholding taxes paid ondividends are fully or partly creditable). Austria, Belgium, Denmark and Sweden donot grant relief for taxation at the corporate income level but apply relatively low taxrates at the personal level while Greece has removed double taxation by simplyexempting dividends for the personal income tax. Italy and Portugal offer taxpayersthe choice between the two systems (imputation credit or a reduced, flat and finalwithholding tax on dividends). The Netherlands do not provide a relief for the tax paidat the corporate level and apply a flat rate at the personal level, though the tax base isan imputed income and not the effective one.
38. The tax system is neutral towards corporate financing decisions if a given pre-tax flow ofcorporate profits produces the same after-tax income for final investors, whether thereturn takes the form of interest payments, dividends, or capital gains (i.e. he standarddeviation of the rates of return to different sources of finance is nil). This requires thatthe combined corporate and personal tax burden is equal across financing instruments.
publi.sgml.compo.fm Page 140 Friday, August 2, 2002 8:31 AM

Tax Systems in European Union Countries
141
© OECD 2002
39. In fact, EU countries have failed to agree on various EC proposals for a harmonisedaccountancy model. The latest initiative dates from June 2000, when the EC unveiled aplan to force companies to offer accounts that conform to a single regional standardby 2005.
40. These estimates are provided by Buijink et al. (1999). They are drawn from the consoli-dated financial statement data of a panel of 2 118 EU manufacturing companies, mainlylisted – therefore excluding important sectors such as insurance and financial services.
41. The Baker and McKenzie (1999) survey singled out some of these specific sectoral andgeographical tax regimes. They include: high unemployment regions in Belgium; theso-called development zones and shipping in Finland; tax relief granted by France fornewly created companies in Corsica, the overseas departments and the so-called“privileged investment zones” (which include Nord-Pas-de-Calais); Eastern Länder inGermany; the less-developed regions, and electric power plants and hotels in Greece;Dublin designated areas, Shannon Airport Industrial Zone, and for manufacturing andfinancial activities in Ireland; regions with a high unemployment rate in Italy and forcertain activities carried out by SMEs; shipping in Luxembourg and the Netherlands;tax breaks granted by Portugal for SMEs and to investment in certain regions, includ-ing the International Business Centre of Azores and Madeira for banks, financial andinsurance companies; tax breaks granted by Spain for investment in the Canary Islandsand for mining and export activities; and Northern Ireland for the United Kingdom.
42. For the United Kingdom, see Freedman and Ward (2000). To help small companies, a10 per cent starting rate was introduced in April 2000 for companies with taxable prof-its below £10 000. A 20 per cent rate is also applied for companies with taxable profitsbetween £50 000 and £300 000 (the “normal” corporate income tax rate, i.e. paid bycompanies with profits above £1.5 million, is 30 per cent). In addition, the Budget 2000introduced an enhanced relief for SMEs for R&D spending. From April 2000, SMEs areentitled to claim 150 per cent of their qualifying expenditure on R&D. In France, fulland partial exemptions are granted to companies created between 1995 and 2004 ifcertain conditions concerning the type and location of the activity are satisfied.
43. Under the holding-company regime, a company based in these countries pays low orno tax on dividends or capital gains from the stakes it holds in other companies. Underthe co-ordination centre regime, a company can benefit from substantial tax breaks ifit can prove to the government that the branch located in the country co-ordinates thefinances for all the company’s European offices.
44. The Report of the Code of Conduct group on business taxation, reported to the ECOFINcouncil in November 1999, considered 66 tax measures as harmful. It also noted thatsome of them were being phased out, in particular: Co-ordination Centres in Luxem-bourg; International Financial Services Centres of Dublin; Luxembourg Finance compa-nies; the Irish 10 per cent manufacturing rate and the Shannon Airport Zones.
45. The statutory progressivity presented in Figure 11 is based on OECD’s tax equations(OECD, Taxing Wages). There are several limitations to measuring the progressivenessof the tax system based on these equations. First, take-up rates for tax allowances andcredits not included in the tax equations tend to increase with income (e.g. thoseassociated to housing investment and childcare expenses). Second, these equationsapply to wage income mostly while large groups of taxpayers do not pay social securitycontributions, or less than wage earners, in many countries (e.g. the self-employed,retirees, pensioners, unemployed). In addition, the taxation of the capital incomecomponent is not reflected here.
publi.sgml.compo.fm Page 141 Friday, August 2, 2002 8:31 AM

OECD Economic Studies No. 34, 2002/I
142
© OECD 2002
46. In France, about half of the households do not pay personal income tax. In addition,two proportional allowances apply successively on wage income: 10 per cent (with amaximum of € 11 809 in 1999) and 20 per cent on the first remaining € 107 781.
47. Social contributions often finance insurance schemes and thus are not aimed atredistributing income from the rich to the poor. They should rather be considered asredistributing income over the life-cycle of the individual. Contributions for pensions,unemployment, or sickness, largely pertain to this category in many EU countries.However, even in these cases, the insurance component may not be fairly defined onan actuarial basis (e.g. for pensions) and/or benefits may increase with the level ofincome while contributions are subject to a ceiling (e.g. health care expenses tend toincrease with income). Overall, they may thus benefit more the rich. This has led somecountries, including France, to remove most social contribution ceilings.
48. Burniaux et al. (1998) present a breakdown of the sources of income inequality. Fourcomponents are singled out: labour, capital and self-employment, transfers, and taxes.Using a methodology proposed by Shorrocks, they show that taxes contribute more inEU countries than elsewhere to reduce income inequality. However, controlling fortheir size, the relative contribution of taxes in reducing inequality was in themid-1990s lower in all of the seven EU countries considered than in Australia andJapan, and broadly similar to the United States. In other words, for every dollar ofincome taxes and social security contributions, a larger proportion was taken from thewealthy in Japan and Australia compared with Belgium, Denmark, Finland, Germany,Italy, the Netherlands and Sweden.
49. Econometric simulations for EU countries suggest that cuts in social security contribu-tions offset by an increase in other levies produce a significant positive effect onemployment. The most favourable results are observed when the reduction inemployers’ social security contributions is targeted on categories of workers with a lowlevel of skills and if a tax on CO2/energy is introduced rather than VAT being increased.For more information on the models and simulations, see European Commission(1993) and Roeger et al. (1998). Likewise, using panel data on EU countries over theperiod 1965-95, Daveri and Tabellini (2000) hardly found any distorting effects of bothconsumption and capital taxes on employment and growth, in sharp contrast withlabour taxation. They thus recommend shifting the burden of taxation away fromlabour onto consumption or capital. On the other hand, Tyrväinen (1995) showed thatwhile payroll, income and consumption taxes have the same effect on wage-settingbehaviour in the long run for most countries, adjustment speeds differ considerably,with wages appearing to adjust more slowly to consumption taxes than to other taxes.
50. Grüner and Heer (2000) develop an endogenous growth model in which a shift fromlabour to capital and wealth taxation increases growth through higher education.
51. The complementarities between the two measures may largely explain the boom inemployment in Spain following the introduction of a new job contract in 1997 withreduced firing costs and social security contributions.
52. In Spain for instance, tax incentives were reduced in 1998 but remain generous. Theyhave been reflected in a very high rate of owner-occupied houses by international stan-dards while the housing rental market is poorly developed. On the labour market, 90 percent of new job contracts were of a short-term nature in 1999 and only about one fourthof the unemployed indicated that they would accept a job if they had to move.
53. For an in-depth discussion of these issues, see O’Brien and Vourc’h (2001) andOECD (2001).
publi.sgml.compo.fm Page 142 Friday, August 2, 2002 8:31 AM

Tax Systems in European Union Countries
143
© OECD 2002
Appendix 1
REFORMING VAT: MOVING FROM THE DESTINATION TO ORIGIN PRINCIPLE?
Since the common VAT system was introduced in the 1970s, its declared objective hasbeen to create the conditions necessary for the establishment of an internal market charac-terised by healthy competition, under which the taxation of imports and the non-taxation ofexports in intra-Community trade would be abolished. This commitment underpinned theobjective of designing a VAT system which was tailored to the internal market and operatedwithin the EU area in the same way as it would within a single country, i.e. to introduce asystem of taxation where goods and services would be taxed in the Member State of origin.However, in practice, such a radical change has not secured the necessary support fromMember States. Foremost amongst the reasons for this are reservations about the efficiencyof the necessary clearing mechanism for the distribution of VAT receipts, and the degree ofharmonisation of rates that such a regime would necessitate. Nevertheless, the eliminationof custom controls within the EU area in 1993 made it necessary to reform the VAT systemoperating up to then according to the destination principle. It was thus decided to adopt a“transitional” system which would enable controls at the Community’s internal borders to beabolished whilst allowing tax, in most instances, to continue to be collected in the MemberState of destination.
The destination principle. The destination principle implies that consumption taxes arelevied where the products are consumed for both final consumers and producers. Thissystem ensures production neutrality, since indirect taxes do not discriminate between for-eign and domestic producers, and exports are exempt from domestic taxation. However,this principle requires the monitoring of cross-border trade flows and administrativeco-operation since goods and services travel free of tax.
The origin principle. The origin principle implies the taxation of goods and services whereproduced, regardless of where they are consumed. It has advantages in that it can be appliedwithout border controls, and since exports would no longer travel tax free, the potential fortax fraud would be lower. However, the origin principle introduces the possibility for the taxsystem to discriminate between domestically-produced goods and imports. The full movefrom the destination to origin principle would also induce significant changes in the distribu-tion of VAT revenues across countries. EU countries with a trade surplus vis-à-vis the rest ofthe EU area would thus collect extra VAT revenues, compared with the existing regime ofexport zero-rating, while deficit countries would have to be granted a VAT credit on theirintra-community business purchases. To ensure that VAT receipts accrue to the countrywhere consumption takes place, a mechanism to redistribute VAT revenues across countrieswould thus be required. In 1987, the Commission proposed to set up a “clearing house”which would make the necessary adjustments based on detailed records of individualtransactions. This would have required numerous information exchanges and involved high
publi.sgml.compo.fm Page 143 Friday, August 2, 2002 8:31 AM

OECD Economic Studies No. 34, 2002/I
144
© OECD 2002
transaction costs. The Commission thus later proposed a mechanism to reallocate VATcollected, using as a basis aggregate consumption, to ensure that VAT receipts accrue to theEU country where consumption takes place, thus compensating countries for VAT paid ongoods that are exported. However, the choice of a method, and statistical sources, to mea-sure aggregate consumption could become a delicate issue, in particular as to the size of theunderground economy, each country preferring an estimate of taxable consumption whichwould maximise its share of the redistribution of overall VAT income (European Commission,1998b). In addition, such a system would have the drawback of disconnecting tax collectedin a particular country from its tax revenues, thus reducing national tax authorities’ incentivesto improve compliance.*
A “transitional” dual system. Instead, the European Union has kept a dual systemsince 1993: the destination principle has remained intact for the business sector, but the ori-gin principle now applies to cross-border purchases by individuals. Individuals can now pur-chase goods anywhere in the EU area, without any further tax liability being incurred whenthey move the goods from one EU country to another (with the exceptions of new vehiclesand mail order transactions). Such a dual system attempts to fulfil the requirements of aninternal market without frontiers whilst allowing room for manoeuvre at the national level asregards the establishment of VAT rates and the collection and auditing of the tax (EuropeanCommission, 1998b). The transitional regime replaced custom controls by the obligation, forall EU firms exporting to another EU country (B2B and B2C distance selling), to declare theirexports to the tax administration, identifying the buyer by a VAT identification number (orgiving their own identification number in the country of destination in case of distance sell-ing). A computerised system for automatic exchange of information on the value of intra-EUtrade was set up among the national authorities (VAT information exchange system, VIES).
* Keen and Smith (1996) recommend maintaining a close relation between taxes collected and taxrevenues for each country to keep the incentive of improving tax collection and compliance fornational authorities. They thus proposed to introduce a unique VAT rate on EU cross-bordertransactions while member states would retain the power to determine the VAT rate on sales bytraders to final consumers.
publi.sgml.compo.fm Page 144 Friday, August 2, 2002 8:31 AM

Tax Systems in European Union Countries
145
© OECD 2002
Appendix 2
THE EU CODE OF CONDUCT ON BUSINESS TAXATION
The EU Council adopted a Code of Conduct on business taxation in December 1997, aspart of the wider tax package. With the adoption of the EU Code of Conduct, EU countriescommitted themselves to refraining from introducing new harmful tax measures, and to roll backexisting ones, i.e. those special schemes which may affect in a significant way the location ofbusiness activity in the EU area. In March 1998, a group to manage the Code of Conduct onbusiness taxation was created (known as the Code of Conduct group). It produced a report inNovember 1999 which identified 66 harmful tax measures that unfairly encourage businessesto locate in one EU country at the expense of another. The Code of Conduct is not legallybinding, but some of the tax measures covered by the Code fall within the scope of theMaastricht Treaty on state aid, on which the European Commission has some legal powers ifit is considered to distort competition.*
According to the Code of Conduct, tax measures are to be regarded as potentiallyharmful if they provide for a significantly lower effective level of taxation, including zerotaxation, than those levels which generally apply in the Member State in question. The taxmeasures covered by the Code include both laws or regulations, and administrative prac-tices. When assessing whether tax measures are harmful, account should be taken of, inter alia:
• whether advantages are accorded only to non-residents or in respect of transactionscarried out with non-residents; or
• whether advantages are ring-fenced from the domestic market, so they do not affectthe national tax base; or
• whether advantages are granted even without any real economic activity and substan-tial economic presence within the Member State offering such tax advantages; or
• whether the rules for profit determination in respect of activities within a multinationalgroup of companies departs from internationally accepted principles, notably therules agreed upon within the OECD; or
• whether the tax measure lacks transparency, including where legal provisions arerelaxed at an administrative level in a non-transparent way.
* Tax breaks are recognised to have effects equivalent to cash subsidies. The European Commissiondraws a distinction between state aids and general measures. General measures are deemed not toconstitute aid and therefore are not controlled by Article 87(1) of the EC Treaty. Measures areconsidered general when there is no specificity in terms of sector, region or category; the eligibilityfor the aid is based on objective criteria, without any discretionary power of the authorities; and themeasure is in principle not limited in time or by a predetermined budget.
publi.sgml.compo.fm Page 145 Friday, August 2, 2002 8:31 AM

OECD Economic Studies No. 34, 2002/I
146
© OECD 2002
The EU Code of Conduct and the OECD harmful tax practices initiative
With broadly the same rationale as for the EU Code of conduct, the OECD (1998, 2000b)sets out an approach to dealing with harmful preferential regimes in OECD Member coun-tries and adopted a series of recommendations for combating harmful tax practices. Whilstthe EU Code of Conduct and the OECD Guidelines are broadly compatible, the scope of thetwo differs. The Code of Conduct looks at business activities in general, although with anemphasis on mobile activities. The OECD Guidelines, on the other hand, are clearly limitedto financial and other service activities, reflecting a particular concern for the abusive taxpractices that preferential regimes of this type can encourage. They are also intended tocover a wider geographical area.
publi.sgml.compo.fm Page 146 Friday, August 2, 2002 8:31 AM

Tax Systems in European Union Countries
147
© OECD 2002
BIBLIOGRAPHY
ADEMA, W. (2002),“Net social expenditure – 2nd edition”, OECD Labour market and social policy,Occasional Paper No. 52.
ATKINSON, P. and P. VAN DEN NOORD (2001),“Managing public expenditure: some emerging policy issues and a framework for analy-sis”, OECD Economic Department Working Papers, No. 485.
AUJEAN, M., P. JENKINS and S. PODDAR (1999),“A new approach to public sector bodies”, VAT Monitor, Vol. 10, No. 4, July/August.
BAKER and McKENZIE (1999),“Survey of the effective tax burden in the European Union”, Amsterdam, January.
BASSANINI, A., J.H. RASMUSSEN and S. SCARPETTA (1999),“The economic effects of employment conditional income support schemes for thelow-paid from a CGE model applied to four OECD countries”, OECD Economics Depart-ment Working Papers, No. 224.
BLÖNDAL, S. and S. SCARPETTA (1999),“The retirement decision in OECD countries”, OECD Economics Department Working Papers,No. 202.
BLUNDELL, R. (2000),“Work incentives and ‘in-work’ benefit reforms: a review”, Oxford Review of Economic Policy,Vol. 16, No. 1.
BOURGUIGNON, F. (1998),Fiscalité et redistribution, Conseil d’analyse économique, La documentation française,Paris.
BRONCHI, C. (2001),“Options for reforming the tax system in Greece” OECD Economics Department WorkingPapers, No. 291.
BRONCHI, C. and J.G. GOMES-SANTOS (2001),“Reforming the tax system in Portugal”, OECD Economics Department Working Papers,No. 302.
BUIJINK, W., B. JANSSEN and Y. SCHOLS (1999),“Corporate effective tax rates in the European Union”, Maastricht Accounting andAuditing Research and Education Center (www.minfin.nl).
BURNIAUX, J.M., T.T. DANG, D. FORE, M. FÖRSTER, M. MIRA D’ERCOLE and H. OXLEY (1998),“Income distribution and poverty in selected OECD countries”, OECD EconomicsDepartment Working Papers, No. 189.
publi.sgml.compo.fm Page 147 Friday, August 2, 2002 8:31 AM

OECD Economic Studies No. 34, 2002/I
148
© OECD 2002
CAREY, D., K. GORDON, and P. THALMANN (1999),“Tax reform in Swtizerland”, OECD Economics Department Working Papers, No. 222.
CAREY, D. and J. RABESONA (2002),“Average effective tax rates on capital, labour and consumption”, OECD Economic Studies(forthcoming).
CNOSSEN, S. (1997),“Dual income taxation: the Nordic experience”, Research Memorandum 9710, ResearchCentre for Economic Policy, Erasmus University Rotterdam.
COPPEL, J. (2000),“E-commerce: impacts and policy challenges”, OECD Economics Department WorkingPapers, No. 252.
DANG, T.T., P. ANTOLIN and H. OXLEY (2001),“Fiscal implications of ageing: projections of age-related spending”, OECD EconomicsDepartment Working Papers, No. 305.
DAVERI, F. and G. TABELLINI (2000),“Unemployment and taxes”, Economic Policy, April.
DILNOT, A. and J. McCRAE (2000),“The family credit system and the working families tax credit in the United Kingdom”,OECD Economic Studies, No. 31, 2000/2.
DORMONT, B. (1997),“L’influence du coût du travail sur la demande de travail”, Économie et Statistiques,No. 301-302.
ELMESKOV, J., J. MARTIN and S. SCARPETTA (1998),“Key lessons for labour market reforms: Evidence from OECD countries’ experience”,Swedish Economic Policy Review, No. 5.
EUROPEAN COMMISSION,“Mutual information system on social protection in the member states of the EuropeanUnion”, Internet data base (www.europa.eu.int/comm/dg05/soc-prot/missoc99/english/f_main.htm).
EUROPEAN COMMISSION (1993),“White paper on growth, competitiveness and employment: the challenges and waysforward into the 21st century”, COM(93)700 final.
EUROPEAN COMMISSION (1998a),“Conclusions of the ECOFIN Council meeting on 1 December 1997 concerning taxationpolicy”, 98/C 2/01, Official Journal of the European Communities, 6 January.
EUROPEAN COMMISSION (1998b),“Special report No. 9/98 concerning the protection of financial interests of theEuropean Union in the field of VAT on intra-community trade together with theCommission’s replies”, Official Journal of the European Communities, C 356, 20/11/1998.
EUROPEAN COMMISSION (1998c),“Proposal for a council directive to ensure a minimum of effective taxation of savingsincome in the form of interest payments within the community”, 98/C 212/09 COM(1998)295 final.
EUROPEAN COMMISSION (1999a),“The strategy for Europe’s internal market”, COM(99)624 final/2.
publi.sgml.compo.fm Page 148 Friday, August 2, 2002 8:31 AM
Tax Systems in European Union Countries
149
© OECD 2002
EUROPEAN COMMISSION (1999b),“Opinion of the Economic and Social Committee on the proposal for a Council directiveamending Directive 77/388/EEC as regards the rules governing the right to deduct valueadded tax, and the proposal for a Council regulation on verification measures relating tothe refund system and administrative co-operation measures necessary for the applica-tion directive 98/xxx/EC”, Official Journal of the European Communities, 12 April, C 101/73.
EUROPEAN COMMISSION (1999c),“Harmonisation of turnover taxes. Indirect taxes and e-commerce”, Working paper,Working Party No. 1, June.
EUROPEAN COMMISSION (2000a),“European Parliament Council Commission, Inter-institutional agreement of6 May 1999”, Official Journal of the European Communities, C 172/1, 16 June.
EUROPEAN COMMISSION (2000b),“VAT rates applied in the member states of the European Community”, situation at1 May 2000”, DOC/2206/2000-EN.
EUROPEAN COMMISSION (2000c),“A strategy to improve the operation of the VAT system within the context of theinternal market”, Communication from the Commission to the Council and theEuropean Parliament, COM(2000)348 final.
EUROPEAN COMMISSION (2000d),“Third Article 14 report on the application of Council regulation (EEC) No. 218/92 of27 January on Administrative co-operation in the field of indirect taxation”, Report fromthe Commission to the Council and the European Parliament, COM(2000)28 final.
EUROPEAN COMMISSION (2000e),“Growth dividend: tax cuts versus deficit reductions”, EcFin 125-00-EN.
EUROPEAN COMMISSION (2000f),“Taxation of aircraft fuel”, Communication from the Commission to the Council, theEuropean Parliament, the Economic and Social Committee, and the Committee of theregions, COM(2000)110 final.
EUROPEAN COMMISSION (2000g),“Green paper”, COM(2000)87.
FRANCO, D. (1996),“The taxation of funded pension schemes and budgetary policy”, European CommissionEconomic Papers, No. 117, September.
FREEDMAN, J. and J. WARD (2000),“United Kingdom: Taxation of small and medium-sized enterprises”, European Taxation,International bureau of fiscal documentation, May.
GRÜNER, H.P. and B. HEER (2000),“Optimal flat-rate taxes on capital – a re-examination of Lucas’ supply side model”,Oxford Economic Paper, No. 52.
GUBIAN, A. (1999),“Six ans d’allègement de cotisations employeurs sur les bas salaires”, Dossiers de laDARES, No. 3-4/1999.
GUICHARD, S. and C. LEFEBVRE (1997),“Pour ou contre le système commun de TVA”, Document de travail du CEPII, No. 97-13.
publi.sgml.compo.fm Page 149 Friday, August 2, 2002 8:31 AM

OECD Economic Studies No. 34, 2002/I
150
© OECD 2002
JOUMARD, I. and A. VAROUDAKIS (2000),“Options for reforming the Spanish tax system”, OECD Economics Department WorkingPapers, No. 249.
KEEN, M. and S. SMITH (1996),“The future value-added tax in the European Union”, Economic Policy, Vol. 23.
KIRPATRICK, G., G. KLEPPER and R. PRICE (2001),“Making growth more environmentally sustainable in Germany”, OECD EconomicDepartment Working Papers, No. 276.
LANG, O., K.H. NÖHRBASS and K. STAHL (1997),“On income tax avoidance: the case of Germany”, Journal of Public Economics, Vol. 66.
LÉVÊQUE, F., C. DAUDE and F. CAULRY (1999),“Subventions à la pollution”, La recherche, No. 325, November.
MARTINEZ-MONGAY, C. (2000),“ECFIN’s Effective tax rates. Properties and comparisons with other tax indicators”,European Commission Economic Paper, No. 146.
MARTINEZ-MONGAY, C. and R. FERNANDEZ (2000),“Effective taxation, spending and employment performance”, in M. Buti, P. Sestito andH. Wijkander (eds.), Taxation, Welfare and the Crisis of Unemployment in Europe, Edward Elgar.
MENDOZA, E.G., A. RAZIN and L.L. TESAR (1994),“Effective rates in macroeconomics: cross-country estimates on factor incomes andconsumption”, NBER Working Paper Series, No. 4864, September.
MYHRMAN, R., O. KRÖGER, T. RAUHANEN, T. JUNKA, S. KARI and H. KOSKENKYLA (1995),“Finnish corporate tax reforms”, Government Institute for Economic Research, VATTpublication, Helsinki.
NORREGAARD, J. and V. REPPELIN-HILL (2000),“Taxes and tradable permits as instruments for controlling pollution: theory andpractice”, IMF Working Paper, WP/00/13.
O’BRIEN, P. and VOURC’H, A.(2001),“Encouraging environmentally sustainable growth: experience in OECD countries”,OECD Economics Department Working Papers, No. 293.
OECD (1994a),The OECD Job study, Chapter 9 on Taxation, Paris.
OECD (1994b),Taxation and Household Saving, Paris.
OECD (1998),Harmful Tax Competition. An Emerging Global Issue, Paris.
OECD (1999a),Implementing the OECD Job Strategy: Assessing Performance and Policy, Paris.
OECD (1999b),Benefit Systems and Work Incentives, Paris.
OECD (1999c),“Economic instruments for pollution control and natural resources management in OECDcountries: a survey”, available on the OECD website: www.oecd.org/env/policies/online-eco.htm
OECD (2000a),OECD Economic Surveys, Netherlands, Paris.
publi.sgml.compo.fm Page 150 Friday, August 2, 2002 8:31 AM
Tax Systems in European Union Countries
151
© OECD 2002
OECD (2000b),“Towards global tax co-operation”, Report to the 2000 Ministerial Council Meeting andRecommendations by the Committee on Fiscal Affairs, Paris.
OECD (2001),Environmentally-related Taxes in OECD Countries: Issues and Strategies, Paris.
OECD (2002),OECD Economic Surveys, Finland, Paris.
PEARSON, M. (2000),“Making work pay”, Paper presented for the Conference on jobs organised by theFinnish government with the support from the EU and the OECD, Helsinski,27-28 January.
RADAELLI, G. (1999),“Harmful tax competition in the EU”, Journal of Common Market Studies, Vol. 37, No. 4.
ROEGER, W. and J. IN’T VELD (1998),“The macroeconomic effects of tax reforms in the quest model”, mimeo, EuropeanCommission, DG II.
STRAND, H. (1999),“Some issues related to the equity-efficiency trade-off in the Swedish tax and transfersystem”, OECD Economic Department Working Papers, No. 225.
TYRVAÏNEN, T. (1995),“Wage determination in the long run, real wage resistance and unemployment: multi-variate analysis of cointegrating relations in ten OECD economies”, Bank of FinlandDiscussion Papers, December.
USSHER, K. (2000),“The spectre of tax harmonisation”, Centre for European Reform, London.
VAN DEN NOORD, P. (2000),“The tax system in Norway: past reforms and future challenges”, OECD EconomicsDepartment Working Papers, No. 244.
VERWAAL, E. and S. CNOSSEN (2000), “Europe’s new border taxes”, OCFEB ResearchMemorandum No. 08.
VOURC’H, A. and M. JIMENEZ (2000), “Enhancing environmentally sustainable growth inFinland”, OECD Economics Department Working Papers, No. 229.
publi.sgml.compo.fm Page 151 Friday, August 2, 2002 8:31 AM