tata motors
TRANSCRIPT
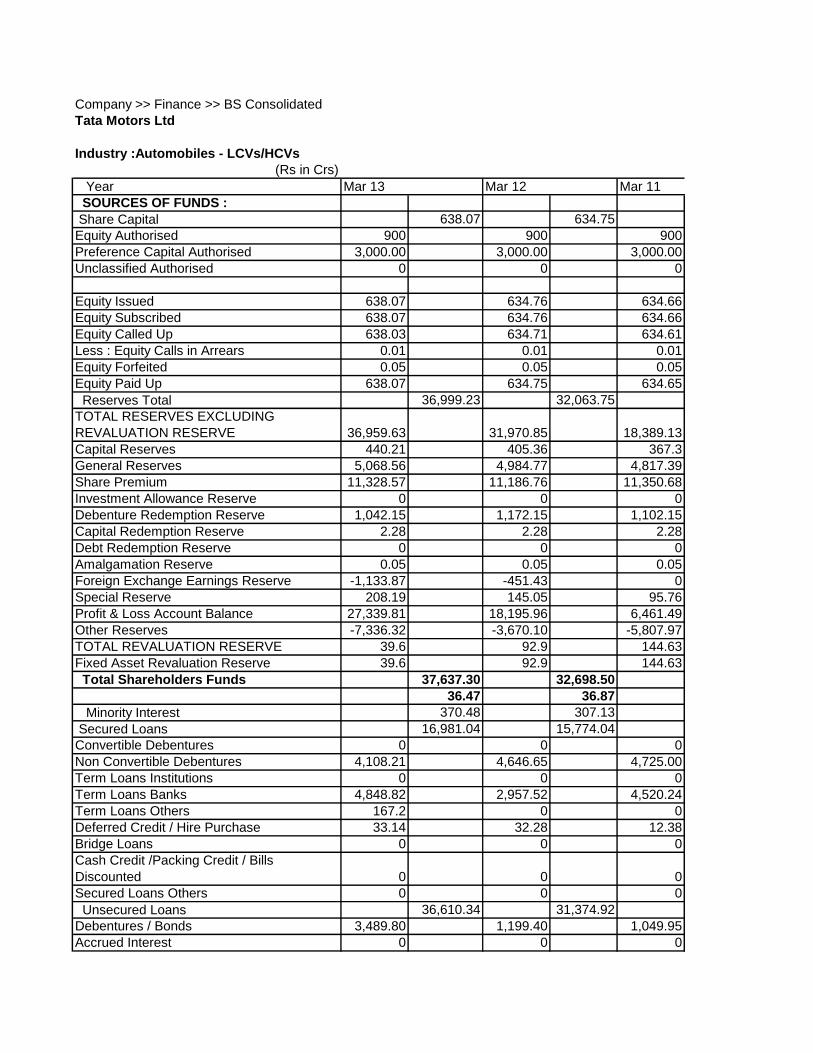
Company >> Finance >> BS Consolidated
Tata Motors Ltd
Industry :Automobiles - LCVs/HCVs
(Rs in Crs)
Year
SOURCES OF FUNDS :
Share Capital 638.07 634.75
Equity Authorised 900 900 900
Preference Capital Authorised 3,000.00 3,000.00 3,000.00
Unclassified Authorised 0 0 0
Equity Issued 638.07 634.76 634.66
Equity Subscribed 638.07 634.76 634.66
Equity Called Up 638.03 634.71 634.61
Less : Equity Calls in Arrears 0.01 0.01 0.01
Equity Forfeited 0.05 0.05 0.05
Equity Paid Up 638.07 634.75 634.65
Reserves Total 36,999.23 32,063.75
TOTAL RESERVES EXCLUDING
REVALUATION RESERVE 36,959.63 31,970.85 18,389.13
Capital Reserves 440.21 405.36 367.3
General Reserves 5,068.56 4,984.77 4,817.39
Share Premium 11,328.57 11,186.76 11,350.68
Investment Allowance Reserve 0 0 0
Debenture Redemption Reserve 1,042.15 1,172.15 1,102.15
Capital Redemption Reserve 2.28 2.28 2.28
Debt Redemption Reserve 0 0 0
Amalgamation Reserve 0.05 0.05 0.05
Foreign Exchange Earnings Reserve -1,133.87 -451.43 0
Special Reserve 208.19 145.05 95.76
Profit & Loss Account Balance 27,339.81 18,195.96 6,461.49
Other Reserves -7,336.32 -3,670.10 -5,807.97
TOTAL REVALUATION RESERVE 39.6 92.9 144.63
Fixed Asset Revaluation Reserve 39.6 92.9 144.63
Total Shareholders Funds 37,637.30 32,698.50
36.47 36.87
Minority Interest 370.48 307.13
Secured Loans 16,981.04 15,774.04
Convertible Debentures 0 0 0
Non Convertible Debentures 4,108.21 4,646.65 4,725.00
Term Loans Institutions 0 0 0
Term Loans Banks 4,848.82 2,957.52 4,520.24
Term Loans Others 167.2 0 0
Deferred Credit / Hire Purchase 33.14 32.28 12.38
Bridge Loans 0 0 0
Cash Credit /Packing Credit / Bills
Discounted 0 0 0
Secured Loans Others 0 0 0
Unsecured Loans 36,610.34 31,374.92
Debentures / Bonds 3,489.80 1,199.40 1,049.95
Accrued Interest 0 0 0
Mar 13 Mar 12 Mar 11
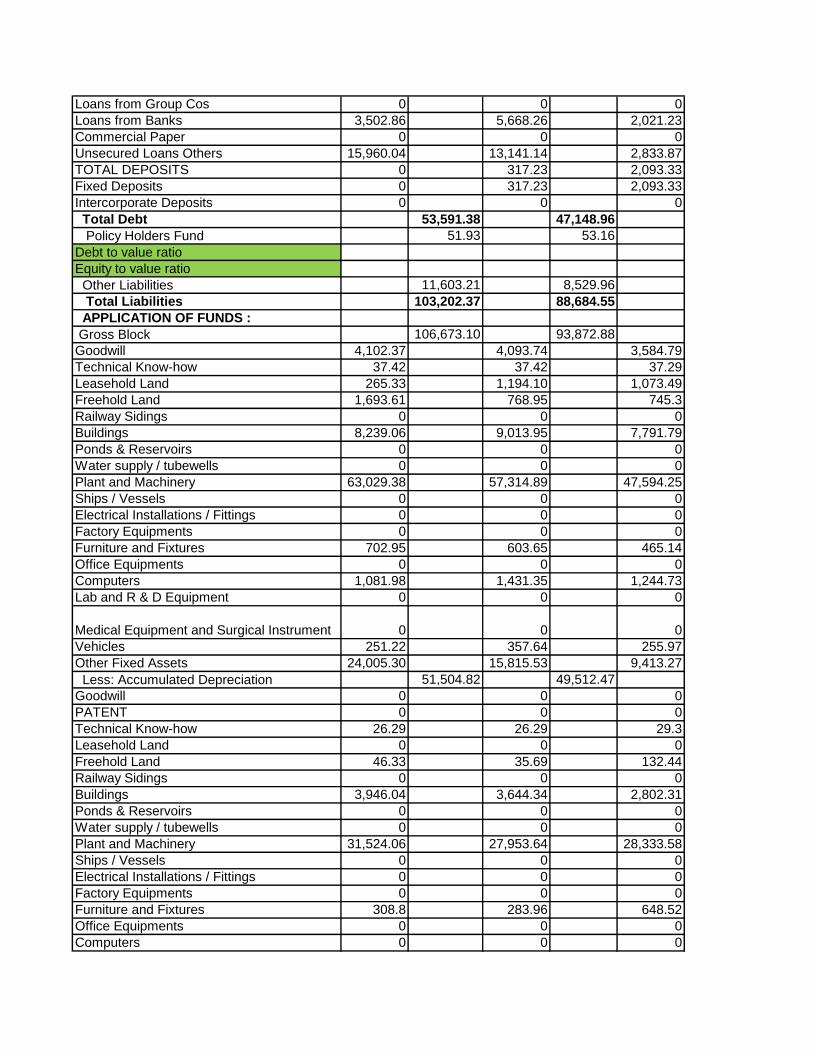
Loans from Group Cos 0 0 0
Loans from Banks 3,502.86 5,668.26 2,021.23
Commercial Paper 0 0 0
Unsecured Loans Others 15,960.04 13,141.14 2,833.87
TOTAL DEPOSITS 0 317.23 2,093.33
Fixed Deposits 0 317.23 2,093.33
Intercorporate Deposits 0 0 0
Total Debt 53,591.38 47,148.96
Policy Holders Fund 51.93 53.16
Debt to value ratio
Equity to value ratio
Other Liabilities 11,603.21 8,529.96
Total Liabilities 103,202.37 88,684.55
APPLICATION OF FUNDS :
Gross Block 106,673.10 93,872.88
Goodwill 4,102.37 4,093.74 3,584.79
Technical Know-how 37.42 37.42 37.29
Leasehold Land 265.33 1,194.10 1,073.49
Freehold Land 1,693.61 768.95 745.3
Railway Sidings 0 0 0
Buildings 8,239.06 9,013.95 7,791.79
Ponds & Reservoirs 0 0 0
Water supply / tubewells 0 0 0
Plant and Machinery 63,029.38 57,314.89 47,594.25
Ships / Vessels 0 0 0
Electrical Installations / Fittings 0 0 0
Factory Equipments 0 0 0
Furniture and Fixtures 702.95 603.65 465.14
Office Equipments 0 0 0
Computers 1,081.98 1,431.35 1,244.73
Lab and R & D Equipment 0 0 0
Medical Equipment and Surgical Instrument 0 0 0
Vehicles 251.22 357.64 255.97
Other Fixed Assets 24,005.30 15,815.53 9,413.27
Less: Accumulated Depreciation 51,504.82 49,512.47
Goodwill 0 0 0
PATENT 0 0 0
Technical Know-how 26.29 26.29 29.3
Leasehold Land 0 0 0
Freehold Land 46.33 35.69 132.44
Railway Sidings 0 0 0
Buildings 3,946.04 3,644.34 2,802.31
Ponds & Reservoirs 0 0 0
Water supply / tubewells 0 0 0
Plant and Machinery 31,524.06 27,953.64 28,333.58
Ships / Vessels 0 0 0
Electrical Installations / Fittings 0 0 0
Factory Equipments 0 0 0
Furniture and Fixtures 308.8 283.96 648.52
Office Equipments 0 0 0
Computers 0 0 0
Lab and R & D Equipment 0 0 0
Medical Equipment and Surgical Instrument 0 0 0
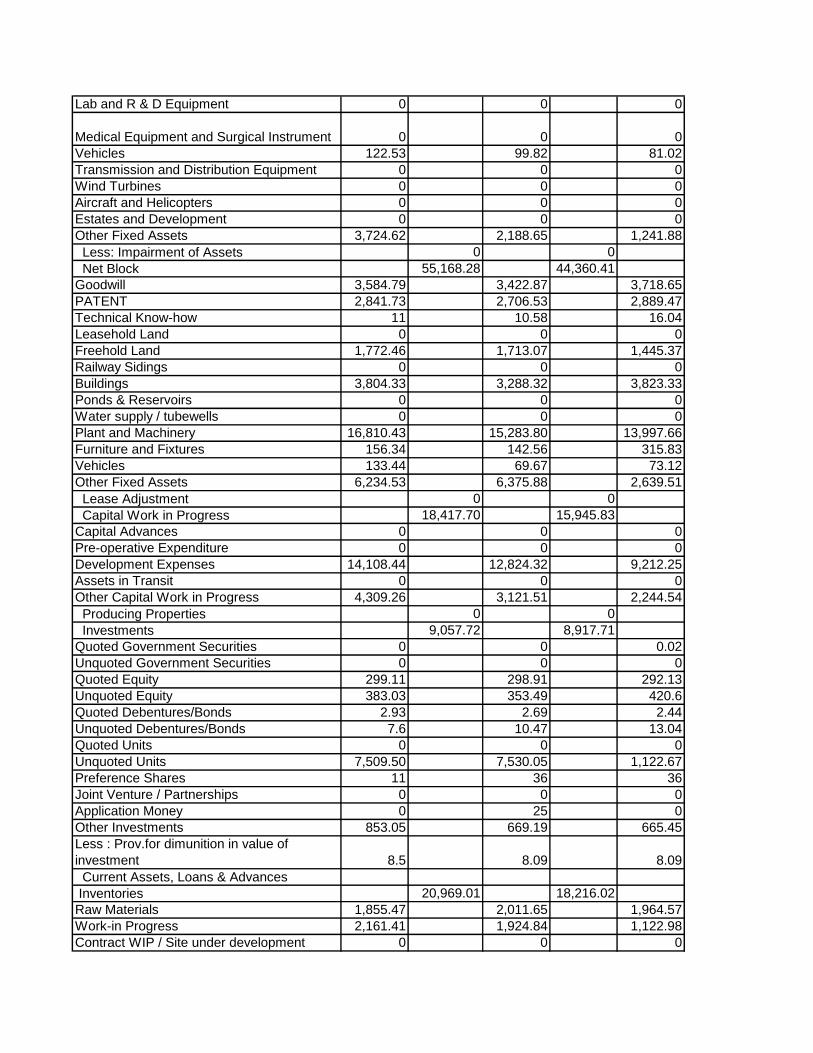
Vehicles 122.53 99.82 81.02
Transmission and Distribution Equipment 0 0 0
Wind Turbines 0 0 0
Aircraft and Helicopters 0 0 0
Estates and Development 0 0 0
Other Fixed Assets 3,724.62 2,188.65 1,241.88
Less: Impairment of Assets 0 0
Net Block 55,168.28 44,360.41
Goodwill 3,584.79 3,422.87 3,718.65
PATENT 2,841.73 2,706.53 2,889.47
Technical Know-how 11 10.58 16.04
Leasehold Land 0 0 0
Freehold Land 1,772.46 1,713.07 1,445.37
Railway Sidings 0 0 0
Buildings 3,804.33 3,288.32 3,823.33
Ponds & Reservoirs 0 0 0
Water supply / tubewells 0 0 0
Plant and Machinery 16,810.43 15,283.80 13,997.66
Furniture and Fixtures 156.34 142.56 315.83
Vehicles 133.44 69.67 73.12
Other Fixed Assets 6,234.53 6,375.88 2,639.51
Lease Adjustment 0 0
Capital Work in Progress 18,417.70 15,945.83
Capital Advances 0 0 0
Pre-operative Expenditure 0 0 0
Development Expenses 14,108.44 12,824.32 9,212.25
Assets in Transit 0 0 0
Other Capital Work in Progress 4,309.26 3,121.51 2,244.54
Producing Properties 0 0
Investments 9,057.72 8,917.71
Quoted Government Securities 0 0 0.02
Unquoted Government Securities 0 0 0
Quoted Equity 299.11 298.91 292.13
Unquoted Equity 383.03 353.49 420.6
Quoted Debentures/Bonds 2.93 2.69 2.44
Unquoted Debentures/Bonds 7.6 10.47 13.04
Quoted Units 0 0 0
Unquoted Units 7,509.50 7,530.05 1,122.67
Preference Shares 11 36 36
Joint Venture / Partnerships 0 0 0
Application Money 0 25 0
Other Investments 853.05 669.19 665.45
Less : Prov.for dimunition in value of
investment 8.5 8.09 8.09
Current Assets, Loans & Advances
Inventories 20,969.01 18,216.02
Raw Materials 1,855.47 2,011.65 1,964.57
Work-in Progress 2,161.41 1,924.84 1,122.98
Contract WIP / Site under development 0 0 0

Finished Goods 16,197.27 13,378.42 10,353.45
Stores and Spares 192.97 178.39 172.36
Goods-in transit 466.11 634.66 388.85
Other Inventory 95.78 88.06 68.3
Sundry Debtors 10,942.66 8,236.84
Debtors more than Six months 821.02 593.47 867.15
Debtors Others 10,443.32 7,969.58 5,895.27
Less : Provisions for Doubtful Debts 321.68 326.21 236.77
Cash and Bank 21,112.67 18,238.13
Balance with Bank 8,066.54 6,616.08 3,443.13
Term Deposit with Banks 12,882.74 11,520.65 7,710.31
Cash in hand / others 163.39 101.4 256.16
Loans and Advances 13,440.07 12,244.31
Loans to Group / Associate Companies 0 0 0
Loans to Others 6,400.85 5,407.74 3,304.27
Deposits with Government 4,957.64 4,902.10 3,667.60
Intercorporate Deposits 0.3 50.42 47.46
Deposits Others 0 0 0
Advance Tax 269.11 451.54 455.35
Pre-paid expenses 463.53 286.69 406
Advances recoverable in cash or kind 955.47 518.43 516.5
Less : Provision for Doubtful Advances 0 0 0
Interest Accrued on Investments 11.93 62.13 40.72
Application money pending allotment 0 0 0
Other Current Assets 381.24 565.26 437.51
Total Current Assets 66,464.41 56,935.30
Less : Current Liabilities and Provisions 34.50 33.72
Current Liabilities 57,052.00 47,311.21
Sundry Creditors 40,387.01 32,607.58 22,514.03
Creditors for Goods 40,387.01 32,607.58 22,514.03
Creditors for Capital Goods 0 0 0
Creditors for Finance 0 0 0
Creditors for Others 0 0 0
Acceptances 4,393.13 4,078.74 5,389.03
Application Money 0 0 0
Warrants Application Money 0 0 0
Bank Overdraft / Short term credit 0 0 0
Advances from Customers / Credit balances 2,084.58 2,368.83 1,967.20
Due to Subsidiary / Group Companies 0 0 0
Trade and Other deposits 183.23 187.19 59.32
Unclaimed Dividend 0 0 0
Interest Accrued But Not Due 738.73 762.56 354.55
Other Liabilities 9,265.32 7,306.31 4,155.45
Provisions 7,752.59 6,770.38
Provision for Tax 1,792.02 1,163.83 506.9
Provision for Corporate Dividend Tax 109.49 206.3 205.2
Provision for Gratuity 0 0 0
Provision for Dividend 645.2 1,280.70 1,274.23
Proposed Equity Dividend 645.2 1,280.70 1,274.23
Provision for Contingencies 0 0 0
Provision for depreciation in investment 0 0 0

Other Provisions 5,205.88 4,119.55 3,145.16
Total Current Liabilities 64,804.59 54,081.59
Net Current Assets/Working Capital 1,659.82 2,853.71
Working capital % of total income 0.86 1.69
Miscellaneous Expenses not written off 0 0
Deferred revenue expenses 0 0 0
Other Miscellaneous expenditure not written
off 0 0 0
Less: Misc.Expenditure written off during the
year 0 0 0
Deferred Tax Assets 11,032.56 9,745.83
Deferred Tax Liability 8,623.12 7,371.57
Net Deferred Tax 2,409.44 2,374.26
Other Assets 16,489.41 14,232.63
Total Assets 103,202.37 88,684.55
Growth of Total Assets 53.57 52.52
long term assets 101,542.55 85,830.84
98.39 96.78
Contingent Liabilities 3,902.82 3,947.23
Claims not acknowledged as debt 1,698.03 1,020.03 1,807.28
Guarantees undertaken 1,249.21 2,059.79 3,416.43
Letter of Credit 0 0 0
Bills Discounted 493.66 248.55 181.46
Disputed Sales Tax 0 0 0
Disputed Income Tax 121.49 183.14 452.05
Disputed Excise Duty 74.91 73.5 0
Other Disputed Claims 0 0 133.82
Uncalled Liability on Shares 0 0 0
Others 265.52 362.22 895.74
Estimated Capital Contracts Remaining 4,105.72 6,186.47 5,025.31
http://www.capitaline.com
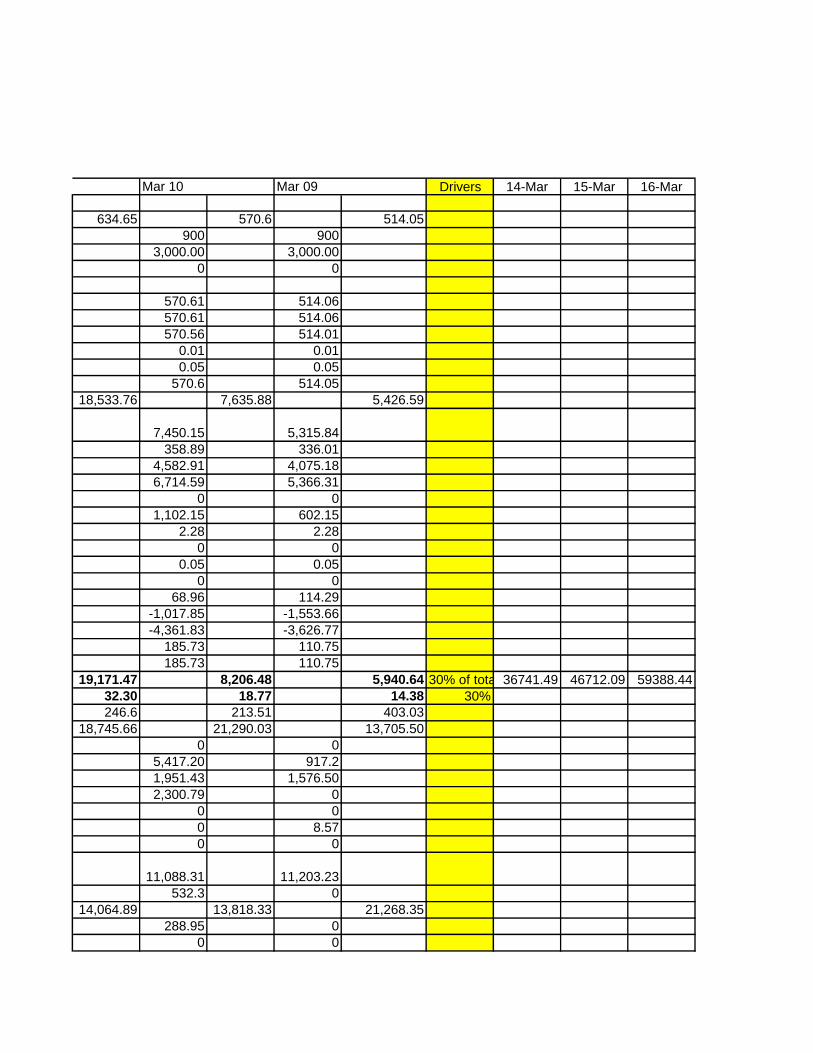
Drivers 14-Mar 15-Mar 16-Mar
634.65 570.6 514.05
900 900
3,000.00 3,000.00
0 0
570.61 514.06
570.61 514.06
570.56 514.01
0.01 0.01
0.05 0.05
570.6 514.05
18,533.76 7,635.88 5,426.59
7,450.15 5,315.84
358.89 336.01
4,582.91 4,075.18
6,714.59 5,366.31
0 0
1,102.15 602.15
2.28 2.28
0 0
0.05 0.05
0 0
68.96 114.29
-1,017.85 -1,553.66
-4,361.83 -3,626.77
185.73 110.75
185.73 110.75
19,171.47 8,206.48 5,940.64 30% of total asset36741.49 46712.09 59388.44
32.30 18.77 14.38 30%
246.6 213.51 403.03
18,745.66 21,290.03 13,705.50
0 0
5,417.20 917.2
1,951.43 1,576.50
2,300.79 0
0 0
0 8.57
0 0
11,088.31 11,203.23
532.3 0
14,064.89 13,818.33 21,268.35
288.95 0
0 0
Mar 09 Mar 11 Mar 10
0 0
3,007.39 13,755.94
2,841.00 1,548.55
4,413.54 4,522.39
3,267.45 1,441.47
3,173.45 1,232.47
94 209
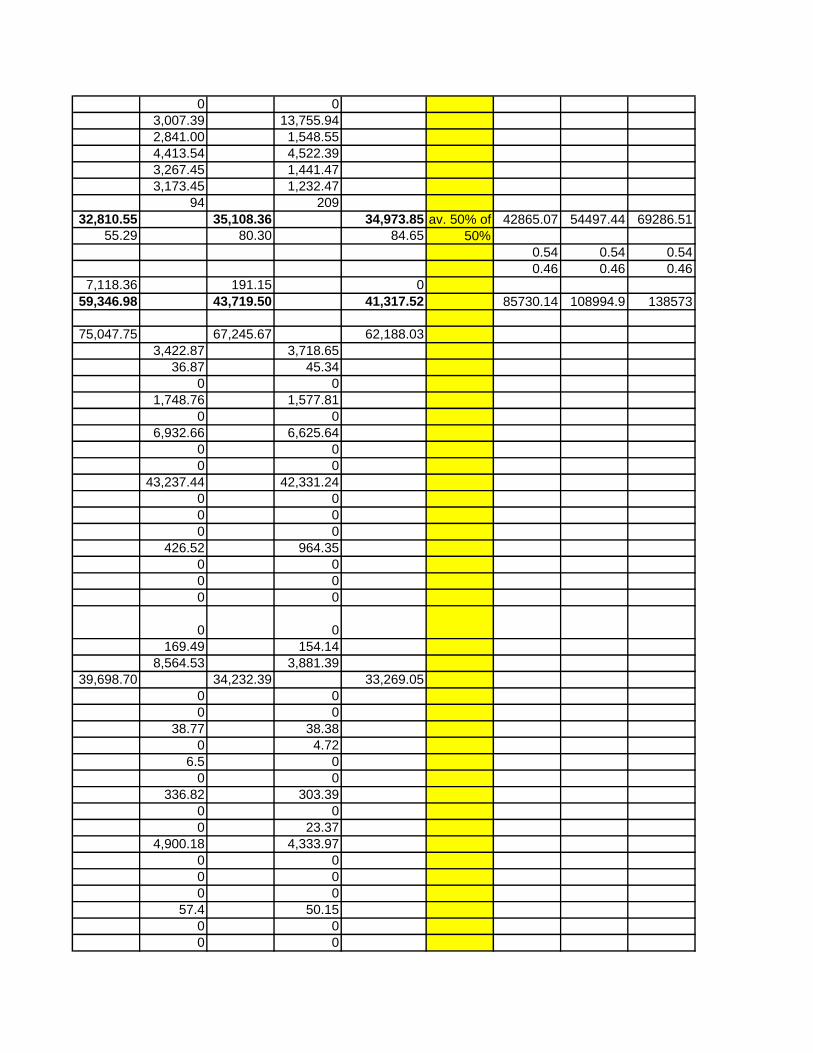
32,810.55 35,108.36 34,973.85 av. 50% of total liabilities42865.07 54497.44 69286.51
55.29 80.30 84.65 50%
0.54 0.54 0.54
0.46 0.46 0.46
7,118.36 191.15 0
59,346.98 43,719.50 41,317.52 85730.14 108994.9 138573
75,047.75 67,245.67 62,188.03
3,422.87 3,718.65
36.87 45.34
0 0
1,748.76 1,577.81
0 0
6,932.66 6,625.64
0 0
0 0
43,237.44 42,331.24
0 0
0 0
0 0
426.52 964.35
0 0
0 0
0 0
0 0
169.49 154.14
8,564.53 3,881.39
39,698.70 34,232.39 33,269.05
0 0
0 0
38.77 38.38
0 4.72
6.5 0
0 0
336.82 303.39
0 0
0 23.37
4,900.18 4,333.97
0 0
0 0
0 0
57.4 50.15
0 0
0 0
0 0
0 0
71.04 71.13
0 0
0 0
0 0
0 0
649.78 601.54
0 0 0
35,349.05 33,013.28 28,918.98
566.16 443.01
0 0
6.54 0.15
0 73.23
431.84 158.71
0 0
1,194.95 970.78
0 0
0 32.17
4,740.91 3,434.00
82.21 51.9
66.81 53.73
391.9 157.86
0 0 0
11,456.79 8,915.92 10,533.00
294.31 403.16
0 0
4,910.07 2,920.26
0 0
3,711.54 7,209.58
0 0 0
2,544.26 2,219.12 1,257.40
0.02 0.02
0 0
282.08 296.71
231.26 230.11
2.38 2.23
21.51 23.44
0 0
1,064.62 76.57
36 280.5
0 0
0 0
589.58 356.01
8.33 8.19
14,070.51 11,312.03 10,950.60
1,381.67 1,834.66
998.46 1,044.02
0 0

8,223.90 7,572.56
221.52 194.29
419.92 233.34
66.56 71.73
6,525.65 7,191.18 4,794.86
242.35 286.52
7,209.46 4,694.08
260.63 185.74
11,409.60 8,743.32 4,121.34
2,784.44 2,108.00
5,926.34 1,978.22
32.54 35.12
8,875.41 15,199.11 13,455.65
132.5 109.6
8,466.50 7,742.66
2,562.94 2,038.54
0 0
0 0
1,534.50 974.31
928.95 643.72
0 0
808.14 691.25
2.43 2.62
0 0
2,379.43 2,635.45
40,881.17 42,445.64 33,322.45 97977.3 124565.6 158369.2
32.80 44.32 46.85 40%
34,439.58 34,077.33 23,980.16
21,982.32 18,519.02
21,982.32 18,519.02
0 0
0 0
0 0
7,184.29 4,239.55
0 0
0 0
0 0
1,981.80 340.73
0 0
0 0
0 0
232.72 89.41
2,696.20 791.45
5,131.49 7,643.50 8,140.02
358.06 387.57
144.66 35.74
1,297.15 1,079.17
859.05 311.61
859.05 311.61
0 0
0 0
4,984.58 6,325.93
39,571.07 41,720.83 32,120.18
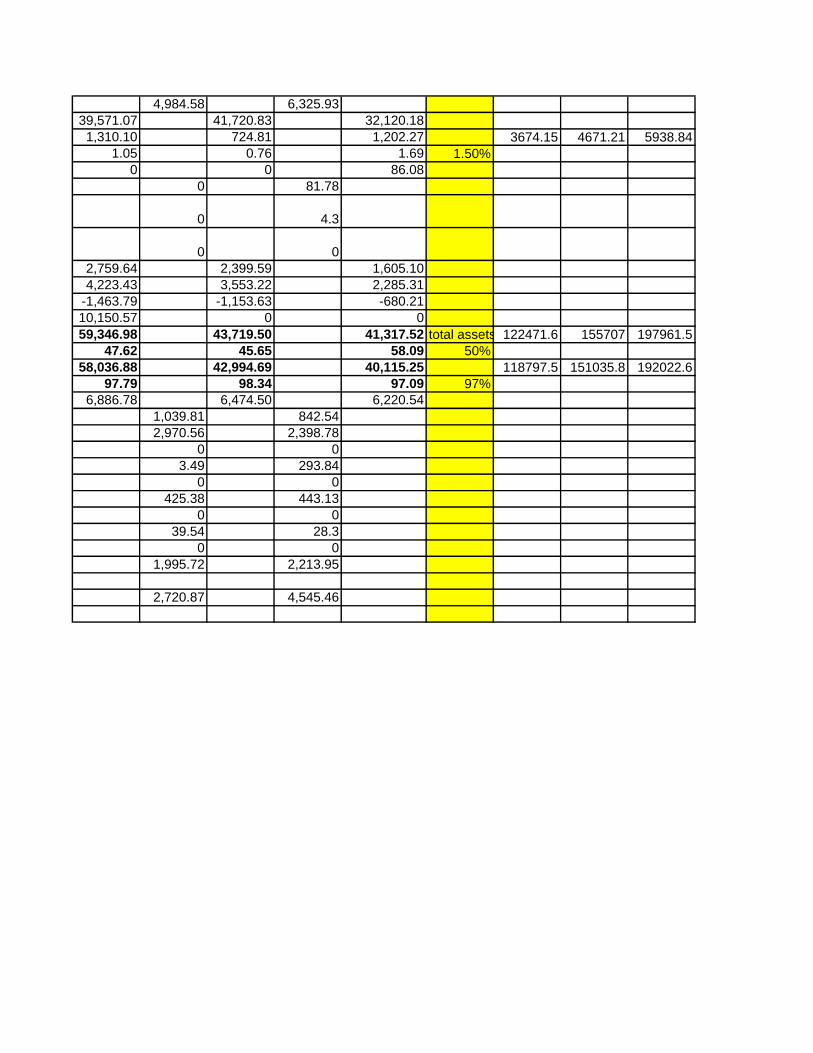
1,310.10 724.81 1,202.27 3674.15 4671.21 5938.84
1.05 0.76 1.69 1.50%
0 0 86.08
0 81.78
0 4.3
0 0
2,759.64 2,399.59 1,605.10
4,223.43 3,553.22 2,285.31
-1,463.79 -1,153.63 -680.21
10,150.57 0 0
59,346.98 43,719.50 41,317.52 total assets will grow at an average of 50% of the total income122471.6 155707 197961.5
47.62 45.65 58.09 50%
58,036.88 42,994.69 40,115.25 118797.5 151035.8 192022.6
97.79 98.34 97.09 97%
6,886.78 6,474.50 6,220.54
1,039.81 842.54
2,970.56 2,398.78
0 0
3.49 293.84
0 0
425.38 443.13
0 0
39.54 28.3
0 0
1,995.72 2,213.95
2,720.87 4,545.46
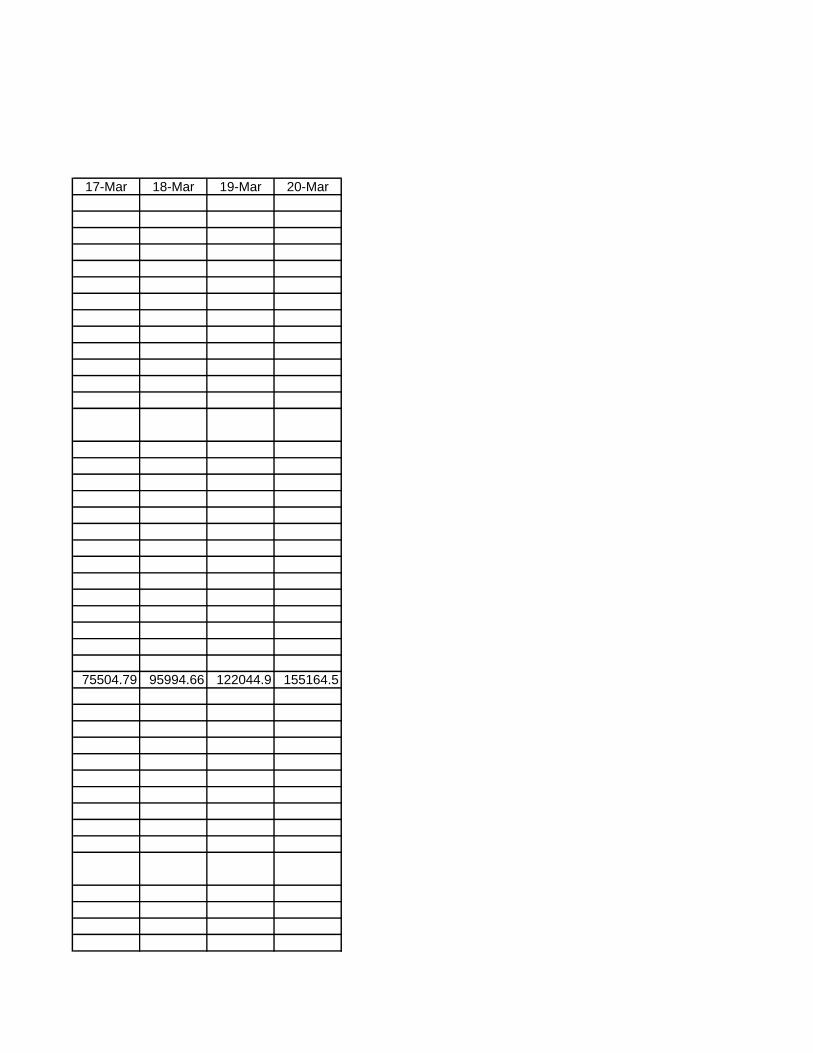
17-Mar 18-Mar 19-Mar 20-Mar
75504.79 95994.66 122044.9 155164.5

88088.92 111993.8 142385.7 181025.2
0.54 0.54 0.54 0.54
0.46 0.46 0.46 0.46
176177.8 223987.5 284771.5 362050.4
201346.1 255985.8 325453.1 413771.9
7550.48 9599.47 12204.49 15516.45
251682.6 319982.2 406816.4 517214.9
244132.1 310382.7 394611.9 501698.4

Company >> Finance >> Consolidated Cash Flow
Tata Motors Ltd
Industry :Automobiles - LCVs/HCVs
Cash and Cash Equivalents at Beginning of the year 14833.02 9345.41
Net Cash from Operating Activities 22062.23 18384.32
Cash Flow From Operating Activities
Net Profit before Tax & Extraordinary Items 9892.61 13516.5 9273.62
Adjustment For
Depreciation 7564.78 5620.86 4651
Interest (Net) 2822.17 2470.96 1978.14
Dividend Received 0 -14.56 0
P/L on Sales of Assets 23.47 76.72 22.54
P/L on Sales of Invest -79.85 -95.81 -17.35
Prov. & W/O (Net) 93.32 0 -8.02
P/L in Forex 434.17 854.86 -208.74
Fin. Lease & Rental Chrgs 0 0 0
Others 3602.58 2.81 988.56
Total Adjustments (PBT & Extraordinary
Items) 14460.64 8915.84 7406.13
Op. Profit before Working Capital Changes 24353.25 22432.34 16679.75
Adjustment For
Trade & 0th receivables -5206.75 -6658.93 -1422.22
Inventories -2693.24 -2718.98 -2410.68
Trade Payables 8136.94 5866.85 343.99
Loans & Advances 0 0 0
Investments 0 0 0
Net Stock on Hire 0 0 0
Leased Assets Net of Sale 0 0 0
Trade Bill(s) Purchased 0 0 0
Change in Borrowing 0 0 0
Change in Deposits 0 0 0
Others -304.9 1230.98 -559.49
Total (OP before Working Capital Changes) -67.95 -2280.08 -4048.4
Cash Generated from/(used in) Operations 24285.3 20152.26 12631.35
Interest Paid(Net) 0 0 0
Direct Taxes Paid -2223.07 -1767.94 -1391.2
Advance Tax Paid 0 0 0
Others 0 0 0
Total-others -2223.07 -1767.94 -1391.2
Cash Flow before Extraordinary Items 22062.23 18384.32 11240.15
Extraordinary Items
Excess Depreciation W/b 0 0 0
Premium on Lease of land 0 0 0
Payment Towards VRS 0 0 0
Cash Flow Summary
(Rs in Crs)
201303 201203 201103

Prior Year 's Taxation 0 0 0
Gain on Forex Exch. Tran 0 0 0
Others 0 0 0
Net Cash Used in Investing Activities -22890.64 -19463.89
Cash Flow from Investing Activities
Investment in Assets :
Purchased of Fixed Assets -18757.03 -13875.55 -8123.98
Sale of Fixed Assets 36.69 92.7 11.21
capital WIP 0 0 0
Capital Subsidy Recd 0 0 0
Financial/Capital Investment :
Purchase of Investments -107.69 -5857.42 -146.9
Sale of Investments 194.56 83.75 7.44
Investment Income 0 0 0
Interest Received 712.17 467.25 313.64
Dividend Received 94.03 70.33 97.82
Invest.In Subsidiaires 0 -304.33 -70.42
Loans to Subsidiaires 0 0 0
Investment in Group Cos 0 -8.76 -4.09
Issue of Sh. on Acqu. of Cos 0 0 0
Canc. of Invest. in Cos Acq. 0 0 0
Acquisition of Companies 0 0 2.47
Inter Corporate Deposits 44.83 -2.96 5.3
Others -5108.2 -128.9 884.1
Net Cash Used in Financing Activities -1655.79 6567.18
Cash Flow From Financing Activities
Proceeds:
Proceeds from Issue of shares (incl share
premium) 0.72 138.56 3258.07
Proceed from Issue of Debentures 0 0 0
Proceed from 0ther Long Term Borrowings 13091.77 19030.04 5413.62
Proceed from Bank Borrowings 0 0 0
Proceed from Short Tem Borrowings 14849.33 8432.07 10116.51
Proceed from Deposits 0 0 339.39
Share Application Money 0 0 0
Cash/Capital Investment Subsidy 0 0 0
Loans from a Corporate Body 0 0 0
Payments:
Share Application Money Refund 0 0 0
On Redemption of Debenture -93.25 0 0
Of the Long Tem Borrowings -7475.94 -4664.13 -2395.69
Of the short term Borrowings -13011.82 -10345.65 -14245.31
Of financial Liabilities 0 0 0
Dividend Paid -1508.73 -1503.11 -1019.53
Shelter Assistance Reserve 0 0 0
Interest Paid -4655.99 -3373.69 -2469.07
Others -2851.88 -1146.91 -399.28
Net Cash Used in Financing Activities -1655.79 6567.18 -1401.29
Net Inc/(Dec) in Cash and Cash Equivalent -2484.2 5487.61
Cash and Cash Equivalents at End of the year 12348.82 14833.02 Intranet Version of Capitaline Corporate
Databases
6529.96 2381.6 2231.06
11240.15 8997.13 739.29
2571.06 -2505.25
3882.62 2502.27
2305.54 1852.06
0 0
74.48 13.91
-1751.54 -718.16
77.43 -3
-448.9 1309.49
0 0
914.8 325.26
5054.43 5281.83
7625.49 2776.58
-4342.63 655.96
-1244.53 693.27
8709.11 -2987.73
0 0
0 0
0 0
0 0
0 0
0 0
0 0
-521.1 210.37
2600.85 -1428.13
10226.34 1348.45
0 0
-1229.21 -598.62
0 0
0 0
-1229.21 -598.62
8997.13 749.83
0 0
0 0
0 0
Cash Flow Summary
201103 201003 200903
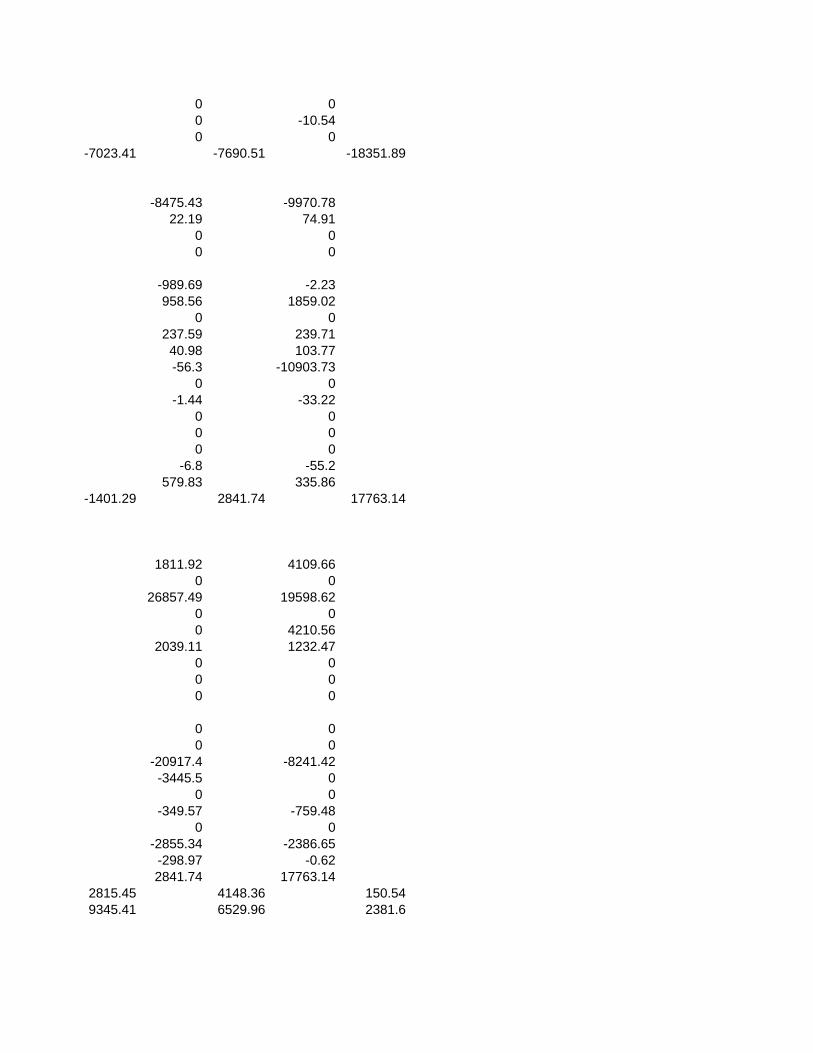
0 0
0 -10.54
0 0
-7023.41 -7690.51 -18351.89
-8475.43 -9970.78
22.19 74.91
0 0
0 0
-989.69 -2.23
958.56 1859.02
0 0
237.59 239.71
40.98 103.77
-56.3 -10903.73
0 0
-1.44 -33.22
0 0
0 0
0 0
-6.8 -55.2
579.83 335.86
-1401.29 2841.74 17763.14
1811.92 4109.66
0 0
26857.49 19598.62
0 0
0 4210.56
2039.11 1232.47
0 0
0 0
0 0
0 0
0 0
-20917.4 -8241.42
-3445.5 0
0 0
-349.57 -759.48
0 0
-2855.34 -2386.65
-298.97 -0.62
2841.74 17763.14
2815.45 4148.36 150.54
9345.41 6529.96 2381.6
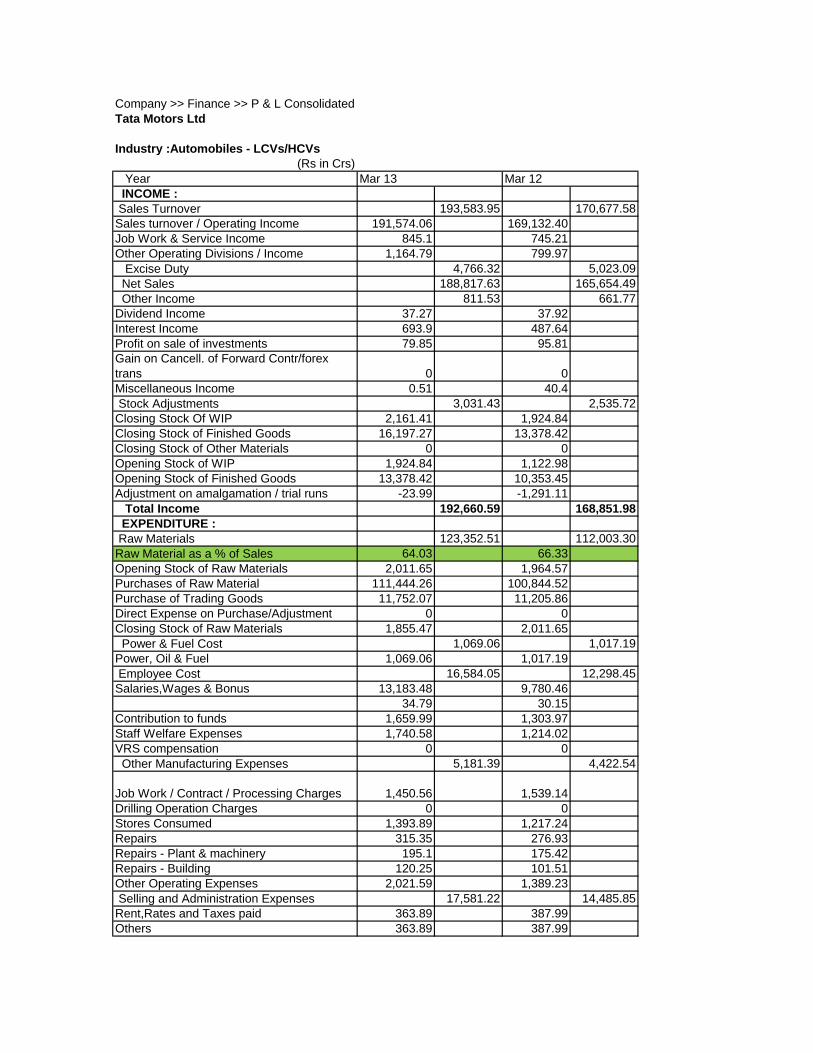
Company >> Finance >> P & L Consolidated
Tata Motors Ltd
Industry :Automobiles - LCVs/HCVs
(Rs in Crs)
Year
INCOME :
Sales Turnover 193,583.95 170,677.58
Sales turnover / Operating Income 191,574.06 169,132.40
Job Work & Service Income 845.1 745.21
Other Operating Divisions / Income 1,164.79 799.97
Excise Duty 4,766.32 5,023.09
Net Sales 188,817.63 165,654.49
Other Income 811.53 661.77
Dividend Income 37.27 37.92
Interest Income 693.9 487.64
Profit on sale of investments 79.85 95.81
Gain on Cancell. of Forward Contr/forex
trans 0 0
Miscellaneous Income 0.51 40.4
Stock Adjustments 3,031.43 2,535.72
Closing Stock Of WIP 2,161.41 1,924.84
Closing Stock of Finished Goods 16,197.27 13,378.42
Closing Stock of Other Materials 0 0
Opening Stock of WIP 1,924.84 1,122.98
Opening Stock of Finished Goods 13,378.42 10,353.45
Adjustment on amalgamation / trial runs -23.99 -1,291.11
Total Income 192,660.59 168,851.98
EXPENDITURE :
Raw Materials 123,352.51 112,003.30
Raw Material as a % of Sales 64.03 66.33
Opening Stock of Raw Materials 2,011.65 1,964.57
Purchases of Raw Material 111,444.26 100,844.52
Purchase of Trading Goods 11,752.07 11,205.86
Direct Expense on Purchase/Adjustment 0 0
Closing Stock of Raw Materials 1,855.47 2,011.65
Power & Fuel Cost 1,069.06 1,017.19
Power, Oil & Fuel 1,069.06 1,017.19
Employee Cost 16,584.05 12,298.45
Salaries,Wages & Bonus 13,183.48 9,780.46
34.79 30.15
Contribution to funds 1,659.99 1,303.97
Staff Welfare Expenses 1,740.58 1,214.02
VRS compensation 0 0
Other Manufacturing Expenses 5,181.39 4,422.54
Job Work / Contract / Processing Charges 1,450.56 1,539.14
Drilling Operation Charges 0 0
Stores Consumed 1,393.89 1,217.24
Repairs 315.35 276.93
Repairs - Plant & machinery 195.1 175.42
Repairs - Building 120.25 101.51
Other Operating Expenses 2,021.59 1,389.23
Selling and Administration Expenses 17,581.22 14,485.85
Rent,Rates and Taxes paid 363.89 387.99
Others 363.89 387.99
Mar 13 Mar 12

Lease Rent / Hire Charges paid 271.66 185.64
Insurance 225.3 227.18
Advertisement 6,607.14 5,398.40
Commssion expenses on sales 0 0
Distribution Expenses 4,798.01 3,734.55
Other Selling Expenses 4,188.74 3,427.45
Other Administrative Expenses 1,126.48 1,124.64
Miscellaneous Expenses 14,328.21 10,749.16
Loss on Sale of Assets 0 0
Loss on forex transactions 948.36 248.26
Expenses Ammortised 0 0
Provision for doubtful loan/ Deposit/
Advances 525.33 554.45
Other provisions and write offs 0 0
Provision/Impairment of Assets 87.62 177.43
Other Miscellaneous Expenses 12,766.90 9,769.02
Less: Pre-operative Expenses Capitalised 10,191.97 8,265.98
Others 10,191.97 8,265.98
Total Expenditure 167,904.47 146,710.51
Expenses as a % of Sales 86.73 85.96
Operating Profit 24,756.12 22,141.47
Operating Margin 12.79 12.97
Interest 3,553.34 2,982.22
Other Interest 4,125.47 3,182.42
Financial Charges 698.72 577.56
Premium on redemption of debentures 0 0
Less : Interest Capitalised 1,270.85 777.76
Gross Profit 21,202.78 21,202.78 19,159.25
Depreciation 7,569.30 5,625.38
Depreciation for the current year 7,569.30 5,625.38
Capital Expenditure 5779.82 2952.38
Profit Before Tax 13,633.48 13,533.87
Tax 2,716.74 2,231.45
Tax for the current year 2,778.63 2,524.74
Adjustment for Previous Year 0 0
Others -61.89 -293.29
Fringe Benefit Tax 0 0
Deferred Tax 1,054.25 -2,271.49
Deferred Tax as a % of previous yr. income 7.79 -21.76
Deferred Tax for Current Year 1,054.25 -2,271.49
Net Profit 9,862.49 13,573.91
Minority Interest (after tax) 83.67 82.33
Profit/Loss of Associate Company 113.79 24.92
Net Profit after Minority Interest & P/L Asso.Co. 9,892.61 13,516.50
Extraordinary Items -375.87 -598.48
Profit/(Loss) on Sale of Assets 0 0
Profit/(Loss) on Sale of Investment. 79.85 95.81
Income/(Expenses) of prior years 0 0
Gain / (loss) on foreign exchange
transactions -515.09 -654.11
VRS Adjustment 0 0
Miscellaneous Income/Expense -87.62 -177.43
Less : Tax on Extra Ordinary
Income/Expense 106.56 137.25
Less : Deferred Tax on Extra Ordinary
Income/Exp. 40.43 0
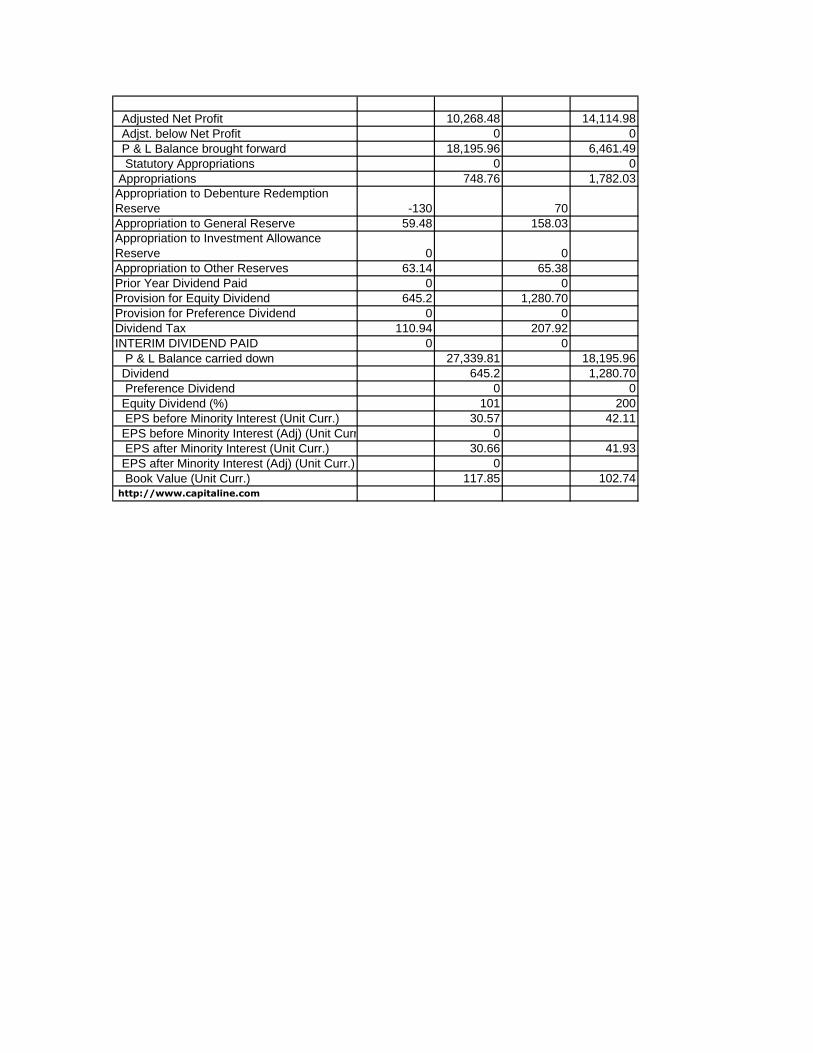
Adjusted Net Profit 10,268.48 14,114.98
Adjst. below Net Profit 0 0
P & L Balance brought forward 18,195.96 6,461.49
Statutory Appropriations 0 0
Appropriations 748.76 1,782.03
Appropriation to Debenture Redemption
Reserve -130 70
Appropriation to General Reserve 59.48 158.03
Appropriation to Investment Allowance
Reserve 0 0
Appropriation to Other Reserves 63.14 65.38
Prior Year Dividend Paid 0 0
Provision for Equity Dividend 645.2 1,280.70
Provision for Preference Dividend 0 0
Dividend Tax 110.94 207.92
INTERIM DIVIDEND PAID 0 0
P & L Balance carried down 27,339.81 18,195.96
Dividend 645.2 1,280.70
Preference Dividend 0 0
Equity Dividend (%) 101 200
EPS before Minority Interest (Unit Curr.) 30.57 42.11
EPS before Minority Interest (Adj) (Unit Curr.) 0
EPS after Minority Interest (Unit Curr.) 30.66 41.93
EPS after Minority Interest (Adj) (Unit Curr.) 0
Book Value (Unit Curr.) 117.85 102.74 http://www.capitaline.com
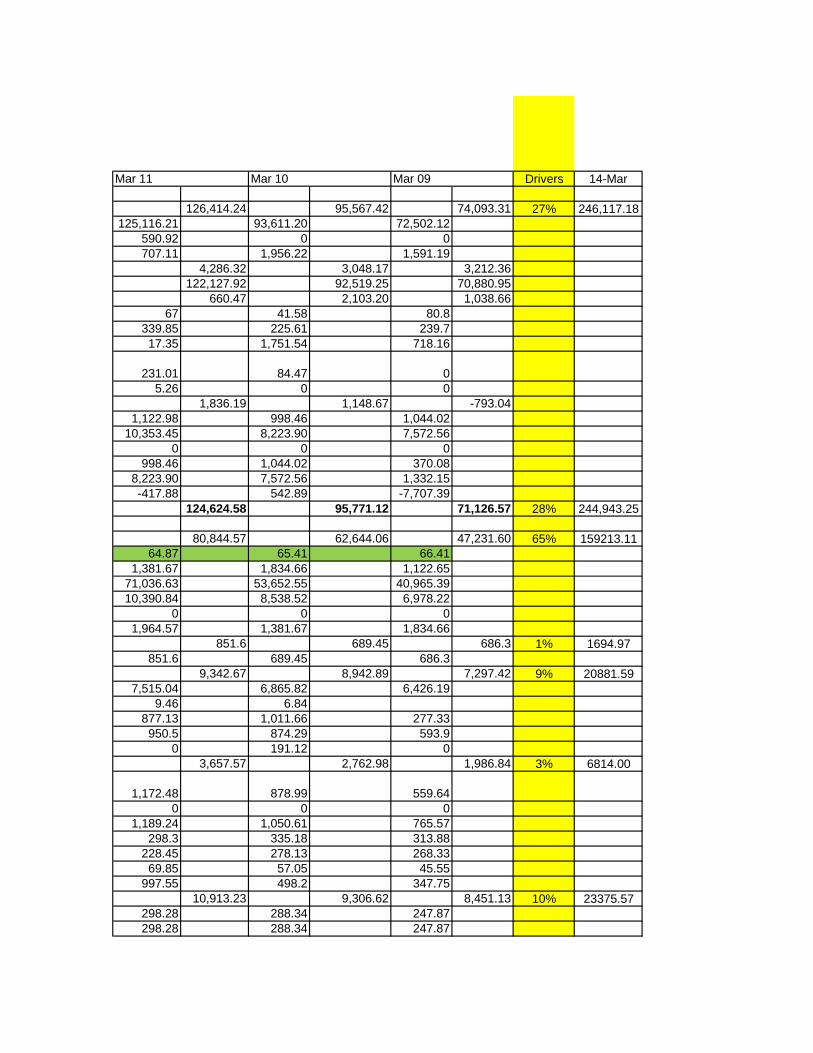
Drivers 14-Mar
126,414.24 95,567.42 74,093.31 27% 246,117.18
125,116.21 93,611.20 72,502.12
590.92 0 0
707.11 1,956.22 1,591.19
4,286.32 3,048.17 3,212.36
122,127.92 92,519.25 70,880.95
660.47 2,103.20 1,038.66
67 41.58 80.8
339.85 225.61 239.7
17.35 1,751.54 718.16
231.01 84.47 0
5.26 0 0
1,836.19 1,148.67 -793.04
1,122.98 998.46 1,044.02
10,353.45 8,223.90 7,572.56
0 0 0
998.46 1,044.02 370.08
8,223.90 7,572.56 1,332.15
-417.88 542.89 -7,707.39
124,624.58 95,771.12 71,126.57 28% 244,943.25
80,844.57 62,644.06 47,231.60 65% 159213.11
64.87 65.41 66.41
1,381.67 1,834.66 1,122.65
71,036.63 53,652.55 40,965.39
10,390.84 8,538.52 6,978.22
0 0 0
1,964.57 1,381.67 1,834.66
851.6 689.45 686.3 1% 1694.97
851.6 689.45 686.3
9,342.67 8,942.89 7,297.42 9% 20881.59
7,515.04 6,865.82 6,426.19
9.46 6.84
877.13 1,011.66 277.33
950.5 874.29 593.9
0 191.12 0
3,657.57 2,762.98 1,986.84 3% 6814.00
1,172.48 878.99 559.64
0 0 0
1,189.24 1,050.61 765.57
298.3 335.18 313.88
228.45 278.13 268.33
69.85 57.05 45.55
997.55 498.2 347.75
10,913.23 9,306.62 8,451.13 10% 23375.57
298.28 288.34 247.87
298.28 288.34 247.87
Mar 11 Mar 10 Mar 09
117.62 118.56 102.67
161.71 161.92 145.64
4,089.95 2,974.18 2,633.52
0 595.57 388.34
2,436.93 2,050.44 1,995.73
2,927.68 2,524.70 2,233.27
881.06 592.91 704.09
7,278.24 6,128.45 7,563.99 7% 17537.61
0 29.29 13.08
-78.06 -665.89 1,314.17
0 105.04 0
548.25 786.88 0
0 86.95 1,115.43
0 45.19 0.87
6,808.05 5,740.99 5,120.44
5,741.25 4,578.42 4,638.83 5% 12681.43
5,741.25 4,578.42 4,638.83
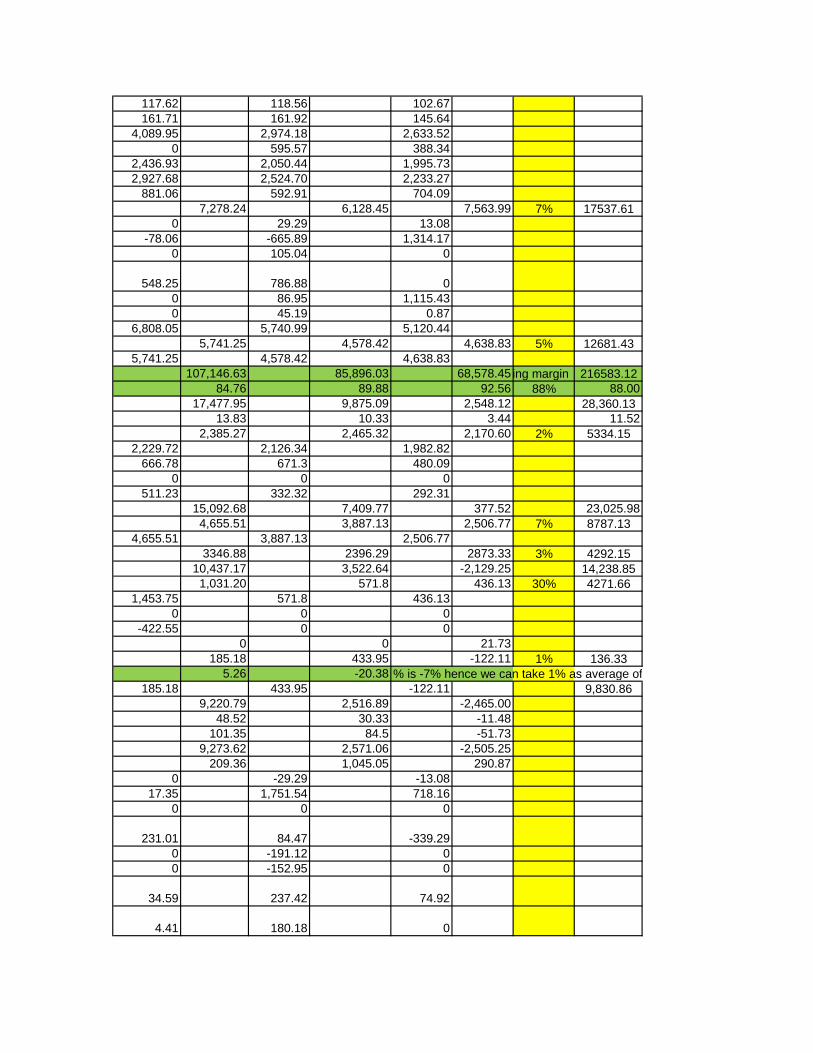
107,146.63 85,896.03 68,578.45when we take actual total expenditure by summing up all the expenses, the operating margin reduces to 1%, hence we have taken average of 88% of Expenses as a % of sales216583.12
84.76 89.88 92.56 88% 88.00
17,477.95 9,875.09 2,548.12 28,360.13
13.83 10.33 3.44 11.52
2,385.27 2,465.32 2,170.60 2% 5334.15
2,229.72 2,126.34 1,982.82
666.78 671.3 480.09
0 0 0
511.23 332.32 292.31
15,092.68 7,409.77 377.52 23,025.98
4,655.51 3,887.13 2,506.77 7% 8787.13
4,655.51 3,887.13 2,506.77
3346.88 2396.29 2873.33 3% 4292.15
10,437.17 3,522.64 -2,129.25 14,238.85
1,031.20 571.8 436.13 30% 4271.66
1,453.75 571.8 436.13
0 0 0
-422.55 0 0
0 0 21.73
185.18 433.95 -122.11 1% 136.33
5.26 -20.38since the average % is -7% hence we can take 1% as average of previous yr's profit befor tax
185.18 433.95 -122.11 9,830.86
9,220.79 2,516.89 -2,465.00
48.52 30.33 -11.48
101.35 84.5 -51.73
9,273.62 2,571.06 -2,505.25
209.36 1,045.05 290.87
0 -29.29 -13.08
17.35 1,751.54 718.16
0 0 0
231.01 84.47 -339.29
0 -191.12 0
0 -152.95 0
34.59 237.42 74.92
4.41 180.18 0

9,064.26 1,526.01 -2,796.12
0 0 0
-1,017.85 -1,553.66 1,764.12
0 0 0
1,794.28 2,035.25 812.53
0 500 267.8
228.78 520.32 138.2
0 0 0
84.2 13.08 41.95
0 0 0
1,274.23 859.05 311.61
0 0 0
207.07 142.8 52.97
0 0 0
6,461.49 -1,017.85 -1,553.66
1,274.23 859.05 311.61
0 0 0
200 150 60
142.03 41.61 0
142.86 42.56 0
299.75 140.57 113.41

15-Mar 16-Mar 17-Mar 18-Mar 19-Mar 20-Mar
312,906.46 397,820.46 505,777.72 643,031.56 817,532.21 1,039,387.43
311,413.95 395,922.92 503,365.26 639,964.41 813,632.73 1,034,429.74
202419.07 257349.90 327187.42 415976.87 528861.28 672379.33
2154.94 2739.73 3483.22 4428.47 5630.23 7158.11
26548.26 33752.71 42912.25 54557.42 69362.77 88185.87
8663.12 11014.05 14002.95 17802.96 22634.18 28776.46
29719.04 37783.96 48037.46 61073.47 77647.09 98718.32
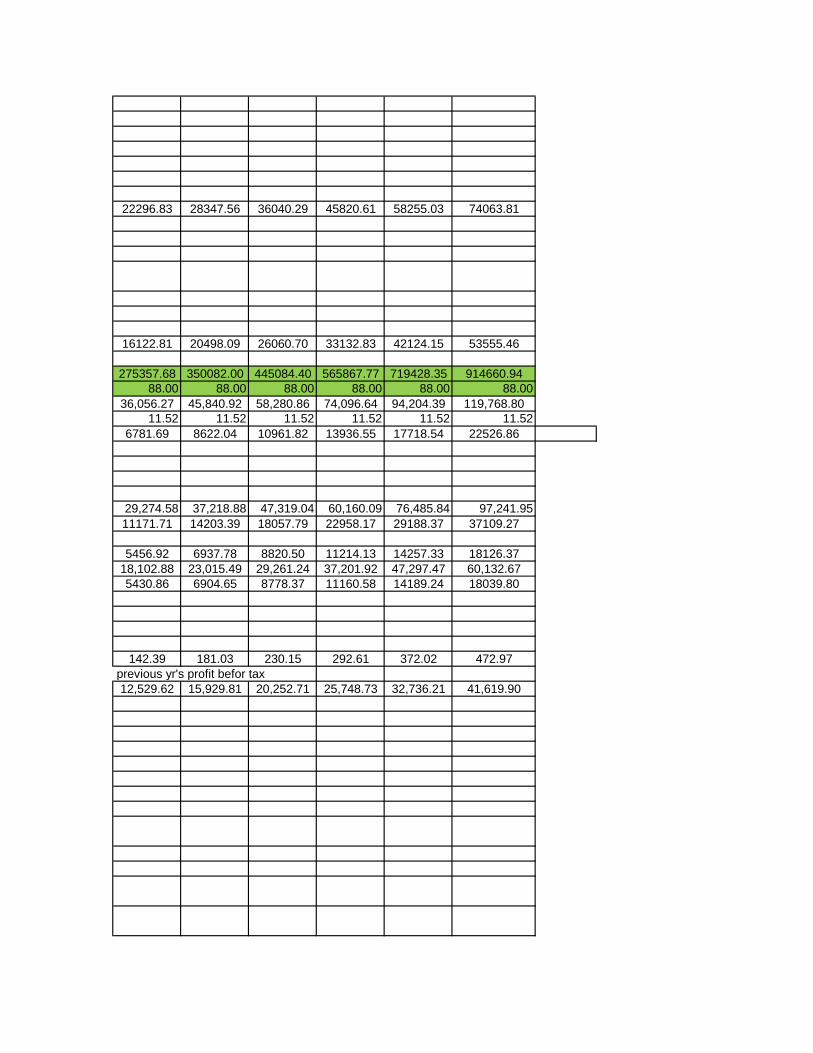
22296.83 28347.56 36040.29 45820.61 58255.03 74063.81
16122.81 20498.09 26060.70 33132.83 42124.15 53555.46
275357.68 350082.00 445084.40 565867.77 719428.35 914660.94
88.00 88.00 88.00 88.00 88.00 88.00
36,056.27 45,840.92 58,280.86 74,096.64 94,204.39 119,768.80
11.52 11.52 11.52 11.52 11.52 11.52
6781.69 8622.04 10961.82 13936.55 17718.54 22526.86
29,274.58 37,218.88 47,319.04 60,160.09 76,485.84 97,241.95
11171.71 14203.39 18057.79 22958.17 29188.37 37109.27
5456.92 6937.78 8820.50 11214.13 14257.33 18126.37
18,102.88 23,015.49 29,261.24 37,201.92 47,297.47 60,132.67
5430.86 6904.65 8778.37 11160.58 14189.24 18039.80
142.39 181.03 230.15 292.61 372.02 472.97
since the average % is -7% hence we can take 1% as average of previous yr's profit befor tax
12,529.62 15,929.81 20,252.71 25,748.73 32,736.21 41,619.90

Finance >> Ratios >> Key Financial Ratios
Tata Motors Ltd
Industry :Automobiles - LCVs/HCVs
13-Mar 12-Mar 11-Mar 10-Mar 9-Mar
Key Ratios
Debt-Equity Ratio 0.85 0.81 0.93 1.1 0.97
Long Term Debt-Equity Ratio 0.4 0.43 0.6 0.66 0.51
Current Ratio 0.44 0.5 0.51 0.52 0.63
Turnover Ratios
Fixed Assets 1.9 2.53 2.54 2.34 2.28
Inventory 10.91 13.97 14.99 14.63 12.08
Debtors 21.79 22.3 20.49 21.01 24.05
Interest Cover Ratio 1.4 2.56 2.59 2.56 1.67
PBIDTM (%) 7.63 7.97 9.65 11.17 7.95
PBITM (%) 3.94 5.26 6.99 8.43 4.83
PBDTM (%) 4.81 5.92 6.95 7.87 5.06
CPM (%) 5.07 5.48 6.2 6.8 5.02
APATM (%) 1.39 2.76 3.54 4.07 1.9
ROCE (%) 5.14 8.06 10.09 11.2 6.88
RONW (%) 3.56 8.32 10.37 11.32 5.34
http://www.capitaline.com
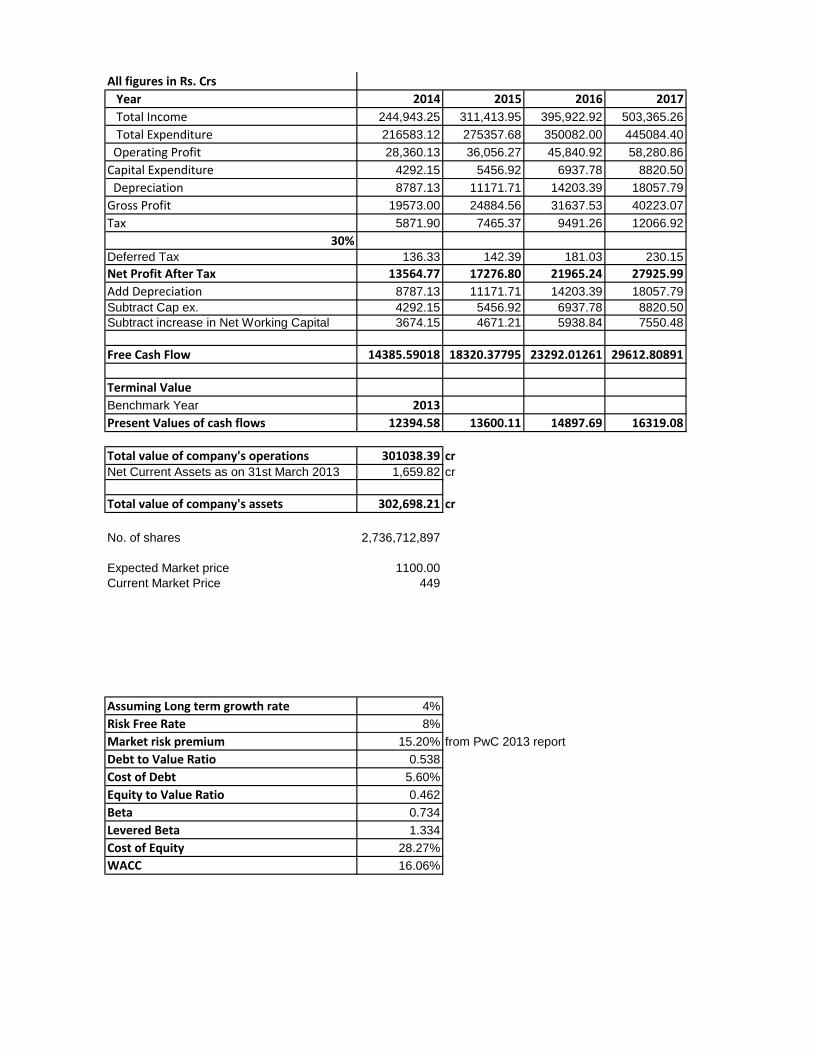
All figures in Rs. Crs
Year 2014 2015 2016 2017
Total Income 244,943.25 311,413.95 395,922.92 503,365.26
Total Expenditure 216583.12 275357.68 350082.00 445084.40
Operating Profit 28,360.13 36,056.27 45,840.92 58,280.86
Capital Expenditure 4292.15 5456.92 6937.78 8820.50
Depreciation 8787.13 11171.71 14203.39 18057.79
Gross Profit 19573.00 24884.56 31637.53 40223.07
Tax 5871.90 7465.37 9491.26 12066.92
30%Deferred Tax 136.33 142.39 181.03 230.15
Net Profit After Tax 13564.77 17276.80 21965.24 27925.99
Add Depreciation 8787.13 11171.71 14203.39 18057.79
Subtract Cap ex. 4292.15 5456.92 6937.78 8820.50
Subtract increase in Net Working Capital 3674.15 4671.21 5938.84 7550.48
Free Cash Flow 14385.59018 18320.37795 23292.01261 29612.80891
Terminal Value
Benchmark Year 2013
Present Values of cash flows 12394.58 13600.11 14897.69 16319.08
Total value of company's operations 301038.39 crNet Current Assets as on 31st March 2013 1,659.82 cr
Total value of company's assets 302,698.21 cr
No. of shares 2,736,712,897
Expected Market price 1100.00
Current Market Price 449
Assuming Long term growth rate 4%
Risk Free Rate 8%
Market risk premium 15.20% from PwC 2013 report
Debt to Value Ratio 0.538
Cost of Debt 5.60%
Equity to Value Ratio 0.462
Beta 0.734
Levered Beta 1.334
Cost of Equity 28.27%
WACC 16.06%

2018 2019 2020
639,964.41 813,632.73 1,034,429.74
565867.77 719428.35 914660.94
74,096.64 94,204.39 119,768.80
11214.13 14257.33 18126.37
22958.17 29188.37 37109.27
51138.47 65016.01 82659.53
15341.54 19504.80 24797.86
292.61 372.02 472.97
35504.32 45139.19 57388.70
22958.17 29188.37 37109.27
11214.13 14257.33 18126.37
9599.47 12204.49 15516.45
37648.89133 47865.74022 60855.15418
524631.3262
17876.08 19581.63 206369.22
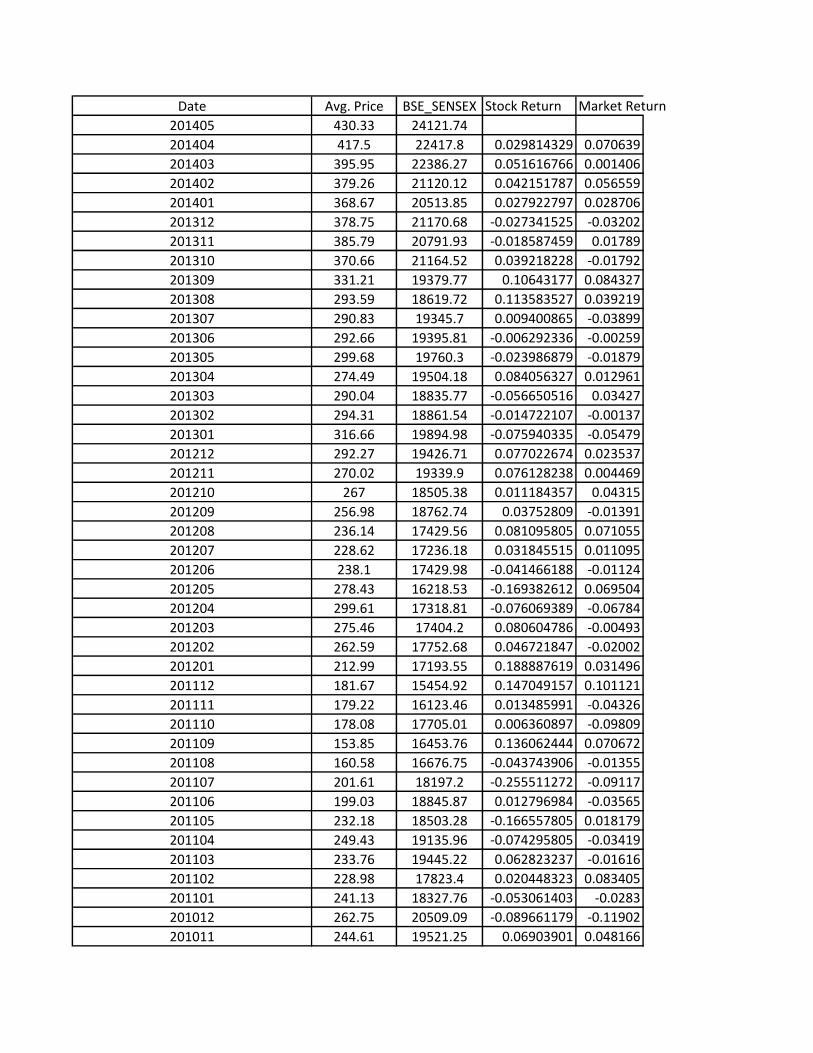
Date Avg. Price BSE_SENSEX Stock Return Market Return
201405 430.33 24121.74
201404 417.5 22417.8 0.029814329 0.070639
201403 395.95 22386.27 0.051616766 0.001406
201402 379.26 21120.12 0.042151787 0.056559
201401 368.67 20513.85 0.027922797 0.028706
201312 378.75 21170.68 -0.027341525 -0.03202
201311 385.79 20791.93 -0.018587459 0.01789
201310 370.66 21164.52 0.039218228 -0.01792
201309 331.21 19379.77 0.10643177 0.084327
201308 293.59 18619.72 0.113583527 0.039219
201307 290.83 19345.7 0.009400865 -0.03899
201306 292.66 19395.81 -0.006292336 -0.00259
201305 299.68 19760.3 -0.023986879 -0.01879
201304 274.49 19504.18 0.084056327 0.012961
201303 290.04 18835.77 -0.056650516 0.03427
201302 294.31 18861.54 -0.014722107 -0.00137
201301 316.66 19894.98 -0.075940335 -0.05479
201212 292.27 19426.71 0.077022674 0.023537
201211 270.02 19339.9 0.076128238 0.004469
201210 267 18505.38 0.011184357 0.04315
201209 256.98 18762.74 0.03752809 -0.01391
201208 236.14 17429.56 0.081095805 0.071055
201207 228.62 17236.18 0.031845515 0.011095
201206 238.1 17429.98 -0.041466188 -0.01124
201205 278.43 16218.53 -0.169382612 0.069504
201204 299.61 17318.81 -0.076069389 -0.06784
201203 275.46 17404.2 0.080604786 -0.00493
201202 262.59 17752.68 0.046721847 -0.02002
201201 212.99 17193.55 0.188887619 0.031496
201112 181.67 15454.92 0.147049157 0.101121
201111 179.22 16123.46 0.013485991 -0.04326
201110 178.08 17705.01 0.006360897 -0.09809
201109 153.85 16453.76 0.136062444 0.070672
201108 160.58 16676.75 -0.043743906 -0.01355
201107 201.61 18197.2 -0.255511272 -0.09117
201106 199.03 18845.87 0.012796984 -0.03565
201105 232.18 18503.28 -0.166557805 0.018179
201104 249.43 19135.96 -0.074295805 -0.03419
201103 233.76 19445.22 0.062823237 -0.01616
201102 228.98 17823.4 0.020448323 0.083405
201101 241.13 18327.76 -0.053061403 -0.0283
201012 262.75 20509.09 -0.089661179 -0.11902
201011 244.61 19521.25 0.06903901 0.048166

201010 231.68 20032.34 0.052859654 -0.02618
201009 210.09 20069.12 0.093188881 -0.00184
201008 193.91 17971.12 0.077014613 0.104539
201007 161.27 17868.29 0.168325512 0.005722
201006 153.89 17700.9 0.045761766 0.009368
201005 154.34 16944.63 -0.002924167 0.042725
201004 161.25 17558.71 -0.044771284 -0.03624
201003 154.54 17527.77 0.041612403 0.001762
201002 138.75 16429.55 0.102174194 0.062656
201001 156.24 16357.96 -0.126054054 0.004357
200912 145.93 17464.81 0.065988223 -0.06766
200911 123.57 16926.22 0.153224149 0.030839
200910 112.26 15896.28 0.09152707 0.060849
200909 114.04 17126.84 -0.015856048 -0.07741
200908 90.12 15666.64 0.209750965 0.085258
200907 64.44 15670.31 0.284953395 -0.00023
200906 69.41 14493.84 -0.077126009 0.075076
200905 60.11 14625.25 0.133986457 -0.00907 http://www.capitaline.com
SD Co-variance Beta0.05056937 0.0018773 0.73410575